Article

Detoxification of Aflatoxins in Fermented Cereal Gruel (Ogi) by Probiotic Lactic Acid Bacteria and Yeasts with Differences in Amino Acid Profiles

by
Kolawole Banwo
1,*,
Taiwo Adesina
1,
Olubunmi Aribisala
1 and
Titilayo D. O. Falade
2,*
1
Department of Microbiology, University of Ibadan, Ibadan 200132, Oyo State, Nigeria
2
International Institute of Tropical Agriculture, Ibadan 200001, Oyo State, Nigeria
*
Authors to whom correspondence should be addressed.
Toxins 2023, 15(3), 210; https://doi.org/10.3390/toxins15030210
Submission received: 31 January 2023 / Revised: 2 March 2023 / Accepted: 7 March 2023 / Published: 10 March 2023

Abstract

:
Toxigenic members of Aspergillus flavus contaminate cereal grains, resulting in contamination by aflatoxin, a food safety hazard that causes hepatocellular carcinoma. This study identified probiotic strains as aflatoxin detoxifiers and investigated the changes to the grain amino acid concentrations during fermentation with probiotics in the presence of either A. flavus La 3228 (an aflatoxigenic strain) or A. flavus La 3279 (an atoxigenic strain). Generally, higher concentrations (p < 0.05) of amino acids were detected in the presence of toxigenic A. flavus La 3228 compared to the atoxigenic A. flavus La 3279. Compared to the control, 13/17 amino acids had elevated (p < 0.05) concentrations in the presence of the toxigenic A. flavus compared to the control, whereas in systems with the atoxigenic A. flavus 13/17 amino acids had similar (p > 0.05) concentrations to the control. There were interspecies and intraspecies differences in specific amino acid elevations or reductions among selected LAB and yeasts, respectively. Aflatoxins B1 and B2 were detoxified by Limosilactobacillus fermentum W310 (86% and 75%, respectively), Lactiplantibacillus plantarum M26 (62% and 63%, respectively), Candida tropicalis MY115 (60% and 77%, respectively), and Candida tropicalis YY25, (60% and 31%, respectively). Probiotics were useful detoxifiers; however, the extent of decontamination was species- and strain-dependent. Higher deviations in amino acid concentrations in the presence of toxigenic La 3228 compared to atoxigenic La 3279 suggests that the detoxifiers did not act by decreasing the metabolic activity of the toxigenic strain.
Key Contribution: Findings from our study support the use of probiotics as detoxifier and provides information about the nutritional safety of utilizing grains treated with atoxigenic Aspergilli as part of biocontrol.

1. Introduction

Cereals such as maize, millet, and sorghum are nutritionally important foods in sub-Saharan Africa due to their rich nutrients in carbohydrate, proteins, lipids, and vitamins [1,2]. Ogi is a traditional fermented cereal gruel made from maize, sorghum, or millet, which is regularly taken in Nigeria and West Africa. It is as an important element of the diet for children and adults, where it is familiar as a weaning food for infants and is the preferred food for the convalescent and elderly. Ogi is given unique names depending on its consistency and form when it is consumed such as akamu, agidi (eko), and koko [3]. Fermentation of cereals by probiotic microorganisms has nutritional benefits including increased digestibility, improvement in the amino acid content, reduced energy requirement for cooking due to the metabolism of complex molecules by the fermenting organisms, and improved organoleptic properties [4,5]. Additionally, probiotic organisms are known to be beneficial for the digestive system as they positively affect the microbiota in the digestive tract. Consequently, cereals provide several nutritional benefits to consumers [6].
Cereals are however susceptible to mycotoxin contamination including aflatoxins. People and animals living in the developing countries are especially at high risk of di-etary exposure to mycotoxins due to environmental and systemic pre-disposing condi-tions. Aflatoxins are major toxicants that are associated with impediments to the normal growth and development of children, immunosuppression, gastrointestinal disorders, and they are a cause of hepatocellular carcinoma; in animals, they also increase mortality and reduce productivity [7,8]. As a result of these negative impacts, aflatoxin management is critical. Pre- and post-harvest management strategies have been reported. These include the use of less susceptible hybrids, good agricultural practices to reduce crop stress, the use of biological control to modulate the population of naturally occurring toxigenic species, the use of hermetic storage mechanisms to prevent aflatoxin biosynthesis, and the sorting of grains to remove contaminated grains from the lot and predictive modeling [9,10,11,12]. However, it is not always possible to completely exclude the aflatoxins; consequently, detoxification of aflatoxins is important [5,13,14].
Yeasts, such as Candida, Saccharomyces, and lactic acid bacteria, such as Lactobacillus, Lactococcus, Leuconostoc and Bifidobacterium, have been reported as probiotics in fermented food products [15,16,17] that are also useful for aflatoxin detoxification [5,18]. They are also reported to increase nutritive properties such as amino acids, vitamins, minerals, and proximate contents [17,19]. However, the understanding of how nutritive properties vary in systems containing toxigenic Aspergilli or biocontrol (atoxigenic) Aspergilli has not been investigated. In this study, fermented cereal gruel, referred to as ogi or akamu and made traditionally in Nigeria and other West African countries [20,21], was investigated. Gruels from maize (ogi) and sorghum (ogi baba) were studied for aflatoxin decontamination and amino acid profiles. The ability of naturally occurring probiotic yeasts and lactic acid bacteria to detoxify aflatoxins B1, B2, G1, and G2, and their nutritional impact in the presence of either toxigenic or atoxigenic strains of A. flavus in controlled fermentation was investigated.

2. Results

2.1. LAB and Yeast Populations

The LAB populations increased during the fermentation time in all four forms of ogi from 24 h to 96 h. The total LAB population after 24 h of fermentation was 1.07 × 10¹¹ cfu mL−1 in millet ogi, 1.04 × 10¹¹ cfu mL−1 in sorghum ogi, 4.8 × 10¹⁰ in white maize ogi, and 5.2 × 10¹⁰ in yellow maize ogi. At the end of the 96 h fermentation period, the LAB in millet, sorghum, white maize, and yellow maize ogi had reached 1.56 × 10¹¹, 1.46 × 10¹¹, 1.12 × 10¹¹, and 1.21 × 10¹¹ cfu mL−1, respectively. Although the LAB populations were higher in millet and sorghum ogi, the rate of the LAB population increase was higher in maize ogi. The exponential increase in the LAB populations after 96 h of fermentation resulted in an overall population increase of 152%, 133%, 46%, and 40% from the populations recorded at 24 h of fermentation in yellow maize, white maize, millet, and sorghum ogi, respectively. In millet, the LAB population increased every 24 h by 20%, 11%, and 10%, after 48 h, 72 h, and 96 h of fermentation time, respectively. In sorghum, the LAB populations increased every 24 h by 13%, 14%, and 8%, after 48 h, 72 h, and 96 h of fermentation time, respectively. In white maize ogi, the LAB populations increased every 24 h by 25%, 32%, and 42%, after 48 h, 72 h, and 96 h of fermentation time, respectively. In yellow maize ogi, the LAB populations increased every 24 h by 44%, 25%, and 41%, after 48 h, 72 h, and 96 h fermentation time, respectively.
The total yeast population in millet increased by 64%, 102%, and 20%, between 24 h and 48 h, 48 h and 72 h, and 72 h and 96 h of fermentation, respectively. In sorghum, the total yeast population increased by 68% from 24 h to 48 h, by 50% from 48 h to 72 h, and by 20% from 72 h to 96 h. At the end of the 96 h fermentation process, the yeast populations in millet had reached 1.12 × 10¹¹ cfu mL−1 and in sorghum they reached 1.15 × 10¹¹ cfu mL−1. In millet, after 96 h of fermentation, the populations tripled the populations measured after 24 h, and had doubled in sorghum.

2.2. LAB Isolates and Their Identification

Twenty-five isolates each identified as LAB were isolate from sorghum, millet, white maize, and yellow maize. Putative identification was based on their biochemical test being negative for KOH, catalase, and oxidase tests, and all were Gram positive. All LAB isolated were able to utilize glucose but they differed in their abilities to utilize other compounds. The percentage utilization was as follows: sucrose, 57%; galactose, 79%; fructose, 79%; D-sorbitol, 43%; mannitol, 20%; and lactose, 76%. The LAB isolates were classified into the genera Lactobacillus (Lb.), Lactiplantibacillus (Lp.), Leuconostoc (Leuc.), Limosilactibacillus (Lm.), and Lacticaseibacillus (Lc.). Lc. casei, Lb. delbruecki, Lm. fermentum, Lp. plantarum, and Leuc. mesenteroides were isolated from all four types of ogi. Lb. acidophilus and Lb. paraplantarum were isolated from maize (both yellow and white) only; Lb. leichmanii and Lb. pentosus were isolated from millet and sorghum only; while Lb. brevis was isolated from millet, sorghum, and yellow maize only. The most frequently isolated LAB (at 17%) were Lb. delbrueckii and Leuc. mesenteroides, while the least isolated was the Lb. leichmanii (at 3%). Sugar utilization patterns generally differed across the species except for Lb. acidophilus and Lb. brevis, which had similar patterns. Within the species, sugar and sugar alcohol utilization patterns were also similar, except for in Lc. casei, Lm. fermentum, Lb. paraplantarum, and Lp. plantarum, where there were rare differences (see Table 1).

2.3. Yeast Isolates and Their Identification

Twenty-five isolates each identified as yeasts were retrieved from market-sourced millet, sorghum, white maize, and yellow maize ogi. Based on the results from the observation of the cell shape, appearance, elevation, margin, occurrence, position of buds, and sugar utilization, which were used for putative identification. All yeast cells were able to utilize glucose; none of the isolated yeasts utilized d-sorbitol, mannitol, or lactose. The yeast isolates differed in their abilities to utilize the other sugars. The utilization of sucrose, galactose, and fructose was 35%, 35%, and 65%, respectively. Candida krusei utilized only glucose, but none of the other compounds. Saccharomyces cerevisiae and C. tropicalis utilized glucose, sucrose, galactose, and fructose.
The yeast species identified were Candida krusei, C. tropicalis, and Geotrichum candidum. Candida krusei was only able to utilize glucose, but not any of the other sugars or sugar alcohols. C. tropicalis was able to utilize glucose, sucrose, galactose, and fructose, but not lactose, D-sorbitol, or mannitol. Geotrichum candidum was able to utilize glucose and fructose, but not sucrose, lactose, galactose, D-sorbitol, or mannitol (Table 2).

2.4. Molecular Characterization

The sequence results were analyzed and compared to existing sequences using the BLAST tool. The percentage similarities were 100% with the strains deposited in the GenBank. Consequently, based on their sequence data in comparison with the data from the biochemistry and physiology, the isolates were identified into the genus level. Species classification was performed based solely on the sequence data from the molecular characterization. The following selected strains and their accession numbers are as follows: the strain W310 from white maize is Limosilactobacillus fermentum W310 with the accession no. MW811201; the strain M26 from millet is Lactiplantibacillus plantarum M26 with the accession no. MW811200; the strain MY115 from millet is Candida tropicalis MY115 with the accession no. MW811203; and the strain YY25 from the yellow maize is Candida tropicalis YY25 with the accession no. MW811204.

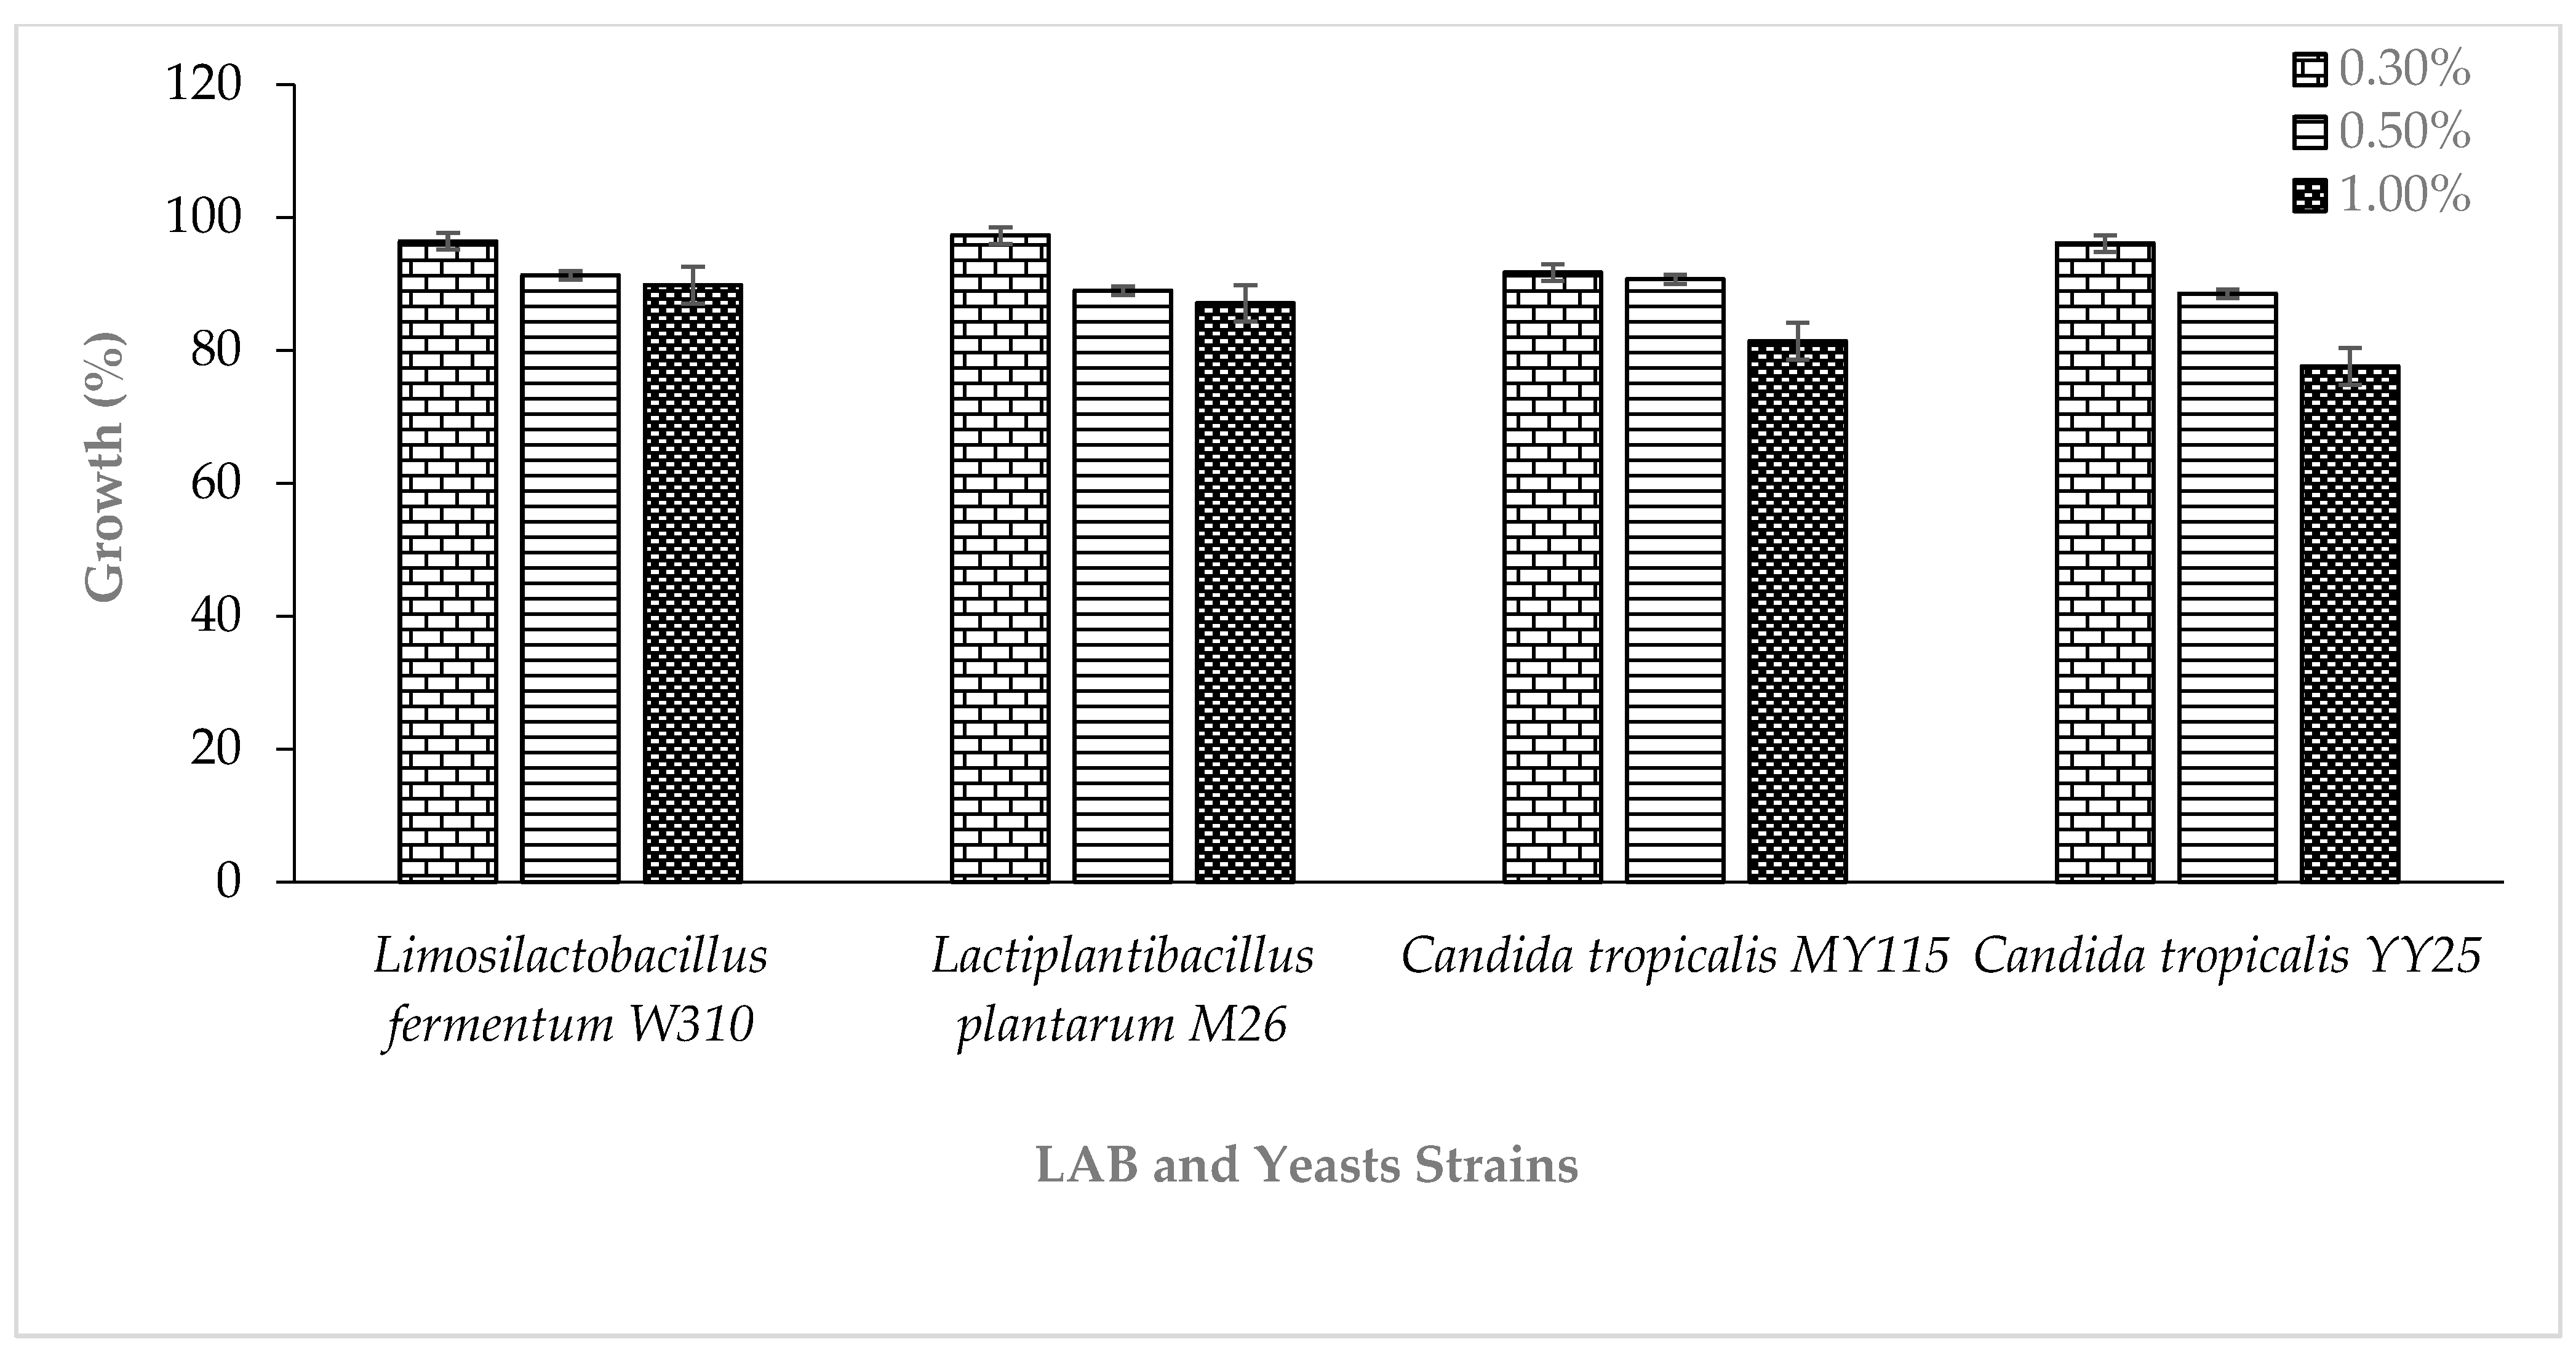
2.5. Probiotic Potentials and Safety Assessment of the LAB and Yeasts Strains

The tolerance of the LAB and yeast strains to different concentrations of bile salts varied, as shown in Figure 1. Lactiplantibacillus plantarum M26 and Limosilactobacillus fermentum W310 had the highest percentage tolerance of 97.3% and 89.8%, while Candida tropicalis YY25 and C. tropicalis MY115 displayed the highest tolerance of 96.1% and 81.4% to a 0.3% bile salt concentration, respectively.
The values are presented as the mean ± S.D values. The bars represent the mean and standard deviations of the independent experiments.
The ability of the LAB and yeast strains to effectively reduce the pH of their respective growth medium from a starting pH of 6.54 over a period of 48 h was assessed via an acidification test, and the results are presented in Table 3. Lactiplantibacillus plantarum M26 was observed to have reduced the pH of the growth medium to 3.65 while Candida tropicalis MY115 reduced it to 4.26 after 48 h, respectively. The safety assessment on the LAB and yeast employing DNase and gelatinase tests were negative while the hemolytic reaction exhibited gamma hemolysis, thus establishing that they are safe, as shown in Table 3.

2.6. Aflatoxin Concentration and Amino Acid Changes Due to LAB and Yeast Fermentation

2.6.1. Aflatoxin Concentration Changes

Selected strains of LAB and yeasts based on their superior characteristics of bile tolerance, safety, and antioxidant scavenging were taken further for assessment on their aflatoxin decontamination potential. Expectedly, LAB and yeast isolates that were co-inoculated with the atoxigenic A. flavus did not result in any changes in the aflatoxin concentration since the isolate is a non-aflatoxigenic A. flavus strain. However, there were changes in the amino acid profiles, which will be discussed hereafter. LAB and yeast isolates that were co-inoculated with toxigenic A. flavus La3228 resulted in an over 50% reduction in the aflatoxin B1 concentration. The aflatoxin reduction in isolates retrieved from maize performed better than that in those retrieved from millet. The isolate L. plantarum M26 of millet origin resulted in a 62% and 63% reduction in aflatoxin B1 and B2 concentrations. L. fermentum W310, from white maize, resulted in an 86% and 75% reduction in aflatoxins B1 and B2. Similarly, the aflatoxin concentrations were lowered by the yeast C. tropicalis MY115 of millet origin, which resulted in a 60% and 77% reduction in aflatoxins B1 and B2. Whereas C. tropicalis YY25, which was isolated from yellow maize, resulted in a 60% and 31% reduction in aflatoxins B1 and B2. Compared to the yeast isolates, the L. plantarum and L. fermentum performed better in terms of reducing the aflatoxin B1 concentrations than the aflatoxin B2 concentrations. The yeast C. tropicalis MY115 had a greater ability at reducing aflatoxin B2 compared to B1; however, this was not the case for C. tropicalis YY25 (Table 4).

2.6.2. Amino Acid Profiles without the Inclusion of Probiotics

In the absence of probiotics, there were differences in the amino acid concentrations among systems with no A. flavus (control), toxigenic A. flavus and atoxigenic A. flavus. Compared to the control, the majority of the amino acid concentrations (13/17) were significantly higher in the presence of the toxigenic A. flavus when compared to the control. This differed only with histidine, tyrosine, lysine, and isoleucine, where their concentrations were similar. On the contrary, the majority of the amino acid (13/17) concentrations were similar between ogi containing the atoxigenic A. flavus 3279 and the control, differing with glycine, proline, cystine, and leucine. The cystine concentrations were higher (p < 0.05) when the atoxigenic A. flavus 3279 was included, but the concentrations were lower for the other three amino acids.

2.6.3. Amino Acid Concentrations with the Inclusion of LAB and Aspergillus

There were differences in the amino acid profiles depending on whether the fermenting organism was Lm. fermentum or Lp. plantarum. In the systems containing toxigenic A. flavus, there were higher (p < 0.05) concentrations of threonine, tyrosine, and methionine, and lower concentration (p < 0.05) of lysine in the Lm. fermentum systems compared to the Lp. plantarum systems (p < 0.05). In the systems containing atoxigenic A. flavus, there were higher (p < 0.05) concentrations of serine and alanine, and lower (p < 0.05) concentrations of leucine in the Lm. fermentum systems compared to the Lp. plantarum systems.

2.6.4. Amino Acid Concentrations with the Inclusion of Yeasts and Aspergillus

The amino acid profiles differed depending on whether the C. tropicalis (MY115) strain (isolated from millet) or YY25 (isolated from maize) were used. In the systems containing toxigenic A. flavus, there were higher (p < 0.05) concentrations of cysteine, tyrosine, valine, methionine, and leucine, and lower (p < 0.05) concentrations of lysine in the C. tropicalis MY115 systems compared to the YY25 systems. In the systems containing atoxigenic A. flavus, there were lower (p < 0.05) concentrations of aspartic acid, serine, glutamine, arginine, alanine, proline, tyrosine, valine, leucine, and phenylalanine, and there were higher (p < 0.05) cysteine concentrations when C. tropicalis MY115 was used compared to when YY25 was used.

2.6.5. Amino Acid Concentrations with the Inclusion of Probiotics, Excluding Aspergillus

In systems lacking Aspergillus but containing probiotics, there were differences in 7/17, 3/17, 3/17, and 1/17 amino acids compared to the control (lacking probiotics or Aspergilli) in the Lm. fermentum, C. tropicalis MY115, C. tropicalis YY25, and Lp. plantarum systems, respectively. In the Lm. fermentum systems, amino acids with differing concentrations (glycine, threonine, arginine, alanine, proline, methionine, and phenylalanine) were elevated (p < 0.05), whereas in the Lp. plantarum systems, the glycine levels were reduced (p < 0.05). In the C. tropicalis MY115 systems, glycine had lower concentrations, whereas the methionine and phenylalanine concentrations were elevated. In the C. tropicalis YY25 systems, glycine and alanine had lower concentrations and leucine had elevated concentrations.

3. Discussion

Aflatoxins in cereals sometimes go undetected because of the loose testing systems in open markets, which are common in many developing countries. This has implications whereby aflatoxins enter the diets of several members of the population, which has been reported in the literature [5,22,23]. It is critical for policies and institutional frameworks to be in place to prevent the entry of aflatoxins into the diets of populations in regions where aflatoxin contamination is endemic. However, it is not always possible to completely exclude the entry of aflatoxins, and sometimes, the concentrations may occur in low levels. There are no tolerable limits of aflatoxins, and aflatoxins are to be as low as reasonably possible. So, whereas aflatoxins are regulated at concentrations as low as 4 ppb in the EU, achieving non-detectable limits is preferable. While efforts such as reducing aflatoxin levels through several methods including the use of bioprotectants continue to be encouraged [5,24], the use of fermentation as a biological method can further remove aflatoxins from the food matrices where they occur. Other methods for post-exposure alleviation include the use of animal function regulators, such as curcumin [25]. Fermentation offers this benefit in addition to providing other organoleptic benefits to the consumer and easing digestion for weaning children and convalescents [17].
From the current study, the identification of LAB and yeasts as probiotics with beneficial properties of reducing aflatoxin concentrations was identified. Ascertaining the safety of these organisms was critical as it is important to ensure that the decontamination of dietary exposure to aflatoxins is not compounded by the use of unsafe organisms to ensure continued food safety. The identified organisms are generally regarded as safe “(GRAS)”. The rate of multiplication of these probiotic microorganisms was about 10 times more in maize than in sorghum and millet, suggesting that the former was a preferable nutrient source for the microbes than the latter. This is probably due to the harder external testa of sorghum and millet compared to maize, which has a softer testa. Several LAB and yeasts were identified. Among the LAB, Lm. fermentum and Lp. plantarum were identified as more beneficial for the reduction in aflatoxins and had beneficial probiotic potentials in their abilities to survive the gastrointestinal environments based on in vitro observations and their safety. Among the yeasts, two isolates of C. tropicalis were the most beneficial based on similar attributes [5,17].
The acidification test indicates that the microorganisms were good acidifiers, while the bile salt tolerance was conducted on the LAB and yeast strains to determine their ability to possess good characteristics that are necessary for conferring health benefit to humans. Probiotics are viable, non-pathogenic microorganisms (bacteria and yeasts), which when ingested in sufficient numbers, can confer health benefits to the host. The viability of these microorganisms upon ingestion and their survival through the gastrointestinal tract is critical to confer health benefits to the host [26].
The capability of the LAB and yeasts to produce acid with a stronger reduction in the pH of the medium of growth qualifies them as good candidates for the starter culture fermentation procedure because they will outcompete other microorganisms and their ability to tolerate different concentrations of bile salts qualifies their probiotic candidacy [17,27,28,29]. The selected strains possessed the potentials to reduce the pH in vitro to pH 5.0 or less after 24 h and 48 h, respectively, indicating that they are good acidifiers. These qualities had been reported in some LAB and yeasts strains obtained from traditional fermented food products [23,28,29,30]. Bile salt tolerance is a precondition for the colonization and metabolic activities of the microorganisms in the small intestine of the host [23,28,30]. Their tolerance to bile salts was assessed because bile is a lipid emulsifying agent that is released into the duodenum after food intake and has a potential antimicrobial activity [24]. In the selection of probiotics, a bile salt concentration of 0.3% is critical in their determination as potential probiotics, but the bile salt concentration of the human intestine could increase to as high as 0.5% [27,29,31]. The LAB and yeast strains in this study showed tolerance up to a 1% bile salt concentration, with variations in their survival patterns. The survival ability of these strains in the presence of bile signified that they could endure the acidic gastric environment within the small intestine of the host’s digestive system, thereby imparting their benefits.
All the fermented samples contained no detectable sugars at the completion of the fermentation period (results not shown). Although there were differences in sugar utilization patterns among the probiotics, the sugar utilization patterns of Lm. fermentum and Lp. plantarum were similar (Table 1). There were, however, differences in the amino acid utilization content in the matrices that could have occurred due to specific probiotic or specific A. flavus utilization (or biosynthesis) patterns, as this varied depending on whether an aflatoxigenic or non-aflatoxigenic fungus was present.
Atoxigenic Aspergillus are utilized in aflatoxin biological control, and as such, the grains harvested from such treated fields would be associated with these fungi. This study demonstrated that this biocontrol treatment does not significantly influence the nutritional composition in fermentation systems as majority of the amino acid (13/17) concentrations were comparable to the control (p > 0.05) when the atoxigenic A. flavus 3279 was present. However, in the presence of aflatoxigenic A. flavus, the amino acid concentrations were largely dissimilar (13/17 amino acids) (p < 0.05). Others have suggested that amino acids are important for aflatoxin dose classification systems that are lacking probiotics [32]. The current study suggests that this could remain the case in probiotic fermentation systems.
The serine concentrations were higher (p < 0.05) than the concentrations in the control and atoxigenic systems, suggesting that these were more involved in the secondary metabolism associated with the toxigenic Aspergillus (Table 5) than the other amino acids. However, the proline and leucine concentrations were lower (p < 0.05) than the control when atoxigenic A. flavus was present, suggesting the importance of these amino acids in the primary metabolism.
In both the toxigenic and atoxigenic fermentation systems with LAB, Lm. fermentum resulted in higher amino acid concentrations compared to the Lp. plantarum systems. This suggests that Lm. fermentum would be more beneficial for nutritive purposes. However, C. tropicalis strains showed differences with MY115, resulting in higher amino acid concentrations in the presence of the toxigenic mold and YY25 fermentations resulting in higher concentrations in the presence of the atoxigenic mold.
There were observed differences in the extent of their abilities to detoxify ogi containing aflatoxins based on contamination by a highly aflatoxigenic A. flavus isolate. All four of the selected probiotics were able to reduce the aflatoxin concentrations by more than 50%. However, some were better at the detoxification of aflatoxin B1 compared to aflatoxin B2. Among the major aflatoxins B1, B2, G1, and G2, aflatoxin B1 is the most toxigenic and carcinogenic. Lm. fermentum reduced the aflatoxin B1 concentrations by 86%, whereas Lp. plantarum reduced the concentration of aflatoxin B1 by 61.6%, indicating that this Lm. fermentum isolate may be more beneficial for food safety purposes regarding the extent of decontamination and the greater ability at detoxifying B1 compared to the Lp. plantarum isolate used. This is indicative of inter-species differentiation in their abilities to detoxify aflatoxins [23]. For the yeast probiotics isolated, although both isolates were C. tropicalis isolates, the isolate of maize origin C. tropicalis YY25 performed better in terms of the percentage reduction in aflatoxin B1 and the greater ability to detoxify aflatoxin B1 compared to the C. tropicalis MY115 isolate of millet origin. This suggests that within species, there can be strain differentiation in their abilities to detoxify aflatoxins and the extent to which they are able to detoxify specific aflatoxins. However, it is not possible to deduce from the current study whether the origin of the isolate is a determinant of its detoxification ability.
Studies indicate that the decontamination of aflatoxins occurs by binding, with suggestions that biochemical processes may be involved [33]. Although this study did not aim to investigate the mode of decontamination, there are indications that the secondary metabolism continued with the toxigenic strain, as seen from larger deviations in amino acid baselines compared to the atoxigenic strain. It is plausible that decontamination occurs via binding. Additionally, the differences in aflatoxin detoxification are both intraspecies- and interspecies-specific. Consequently, to improve nutritive value and safety, a combination-fermentation system would provide value in both the detoxification and improvement in the digestibility and nutritive value. It would also be interesting to understand how the organoleptic properties may be affected by single- and combination-fermentation systems. This should be explored in future research.

4. Conclusions

The results from this study demonstrates the utilization of probiotics including lactic acid bacteria and yeasts in aflatoxin decontamination. High deviations in the amino acid profiles were observed in the presence of the lactic acid bacteria and yeasts, suggesting that the secondary metabolism of aflatoxins was not largely impeded during the fermentation process. The decontamination process must be investigated further to improve our understanding.

5. Materials and Methods

5.1. Samples Collection

Three kilograms each of maize, millet, and sorghum ogi were purchased from Wakajaye, Ibadan (GPS coordinates: 7.42118, 3.97637), from market vendors. Samples were collected in clean plastic containers and transported at ambient temperature to the Microbiology Laboratory of the University of Ibadan for isolation of yeasts and lactic acid bacteria. Thereafter, isolate selection was conducted based on their probiotic potentials, as determined by their acidification, their resistance to bile salts, and their safety assessments. These are described in more detail as follows.

5.2. Isolation and Characterization of Lactic Acid Bacteria

From each of the different samples (ogi from white maize, yellow maize, millet, and sorghum), 25 isolates of lactic acid bacteria were collected. Briefly, 5 mL of ogi and 45 mL of sterile distilled water were combined and homogenized to make a stock solution. From the stock solution, serial dilutions were prepared and inoculated on deMann Rogosa Sharpe (MRS) agar for differential isolations of LAB. Isolation was performed using pour plate method and was incubated for 48 h [34]. Isolates were thereafter sub-cultured by repeated streaking to obtain pure isolates, and pure isolates were kept in MRS broth and glycerol at 4 °C until required.
Gram staining, catalase, oxidase, potassium hydroxide (KOH), and sugar fermentation tests were performed. Pure cultures were macroscopically examined for their pigmentation, colony shape, and elevation. These were conducted for their morphological, physiological, and biochemical classifications, as described by Fawole and Oso [35]. Isolated LAB were later assessed for their probiotic potential, as described hereafter.

5.3. Isolation and Characterization of Yeasts

From each of the different samples (ogi from white maize, yellow maize, millet, and sorghum), 25 isolates of yeasts were collected. From the stock solution prepared, serial diluted samples were inoculated using pour plate method in malt extract agar (MEA) supplemented with chloramphenicol (100 mg L−1) to preclude bacterial growth. Inoculated plates were incubated for 72 h. Thereafter, isolates were streaked repeatedly to obtain pure isolates. Pure isolates were observed for color, appearance, elevation, and margin, and were then stored at 4 °C in MEA slants until required. Morphological, physiological, and biochemical tests were also conducted, including microscopic observations of colonies stained with lactophenol blue and observed at ×40 objective lens for cell shape and occurrence and position of buds, as described by Alakeji et al. [36]. Then, the yeast isolates were assessed for their probiotic potentials.

5.4. Determination of Probiotic Potentials of the LAB and Yeast Isolates

The probiotic potentials of the isolates were determined based on in vitro assessments, such as the acidification potential and resistance to bile salts. These are hereafter described.
Acidification: Yeasts and LAB were screened for their acidification potential as a signal to their fermentation ability, as described by Banwo et al. (2013). Briefly, isolates (1%) were inoculated in 10 mL of sterile MRS and ME broth with pH adjusted to 6.54 and incubated for 6, 24, and 48 h in covered test tubes at 30 °C. Isolates with superior acidification potentials, as assessed by the pH reduction in the broth, were pre-selected.
Resistance to bile salt: Tolerance to bile salts is critical due to the presence of bile salts in the digestive system. Therefore, the bile salt tolerance was determined as previously described [27,29]. Briefly, LAB and yeast strains (2% v/v) were inoculated in MRS broth and ME broth, respectively, containing 0.3, 0.5, and 1% (w/v) of bile salt. These were then incubated at 37 °C for 24 h. Optical density measurements were obtained using a spectrophotometer Jenway 6350 UV/Visible Spectrophotometer, (Jenway, Staffordshire, United Kingdom) at 560 nm. An isolate’s tolerance to bile salts was determined based on their optical density measurements in comparison to the control culture that did not contain bile salts. The growth was expressed in percentage.

5.5. Safety Assessment of the Pre-Selected LAB and Yeasts

Pre-selected strains were assessed for their safety for use as a starter culture in a controlled fermentation process. To determine these, the strains were subjected to hemolysis, DNAse, and gelatinase assessments.
Firstly, hemolysis by LAB and yeast cells was determined by incubating 24 h old LAB and yeast cells collected from MRS and ME broths, respectively, on blood agar plates supplemented with 5% defibrinated sheep blood (Thermos Fisher Scientific, United Kingdom) for 24 to 48 h. Cells without a clear zone (γ-hemolysis) were considered safe, while cells that produced α-hemolysis (partial hydrolysis) or β-hemolysis (a clear zone around the bacteria and yeast growth) were considered unsafe [37].
Secondly, DNase assessments involved spot inoculation of pre-selected isolates on DNase (CM0321B, Oxoid, Basingstoke, United Kingdom) agar plates, followed by a 48-h incubation. Plates were then flooded with concentrated HCl, and the presence of a clear zone indicated production of DNase by LAB and yeast cells and so they were considered unsafe, while safe cells did not produce a clear zone (which indicated that the cells could not breakdown DNA) [38].
Finally, ability to hydrolyze gelatin was determined by inoculating 24 h old cells in test tubes containing nutrient gelatin medium (6 g of gelatin and 0.65 g of nutrient broth in 50 mL of distilled water) and incubating them at 35 °C for 48 h and then chilling at 4 °C for 15 to 20 min to enable gelling. When the control sample gelled, the samples were left to stand for 20 min and then tilted to identify hydrolysis of gelatin in comparison to the control. Cells that hydrolyzed gelatin were considered unsafe and were not selected [39,40].

5.6. Molecular Characterization of the Selected LAB and Yeast Isolates

Following putative identifications of isolates based on their morphological, physiological, and biochemical characteristics, isolate characterization, and then the pre-selections based on their superior abilities as probiotics and safety, selected isolate identities that were further confirmed genotypically. Two LAB (M26 from millet and W310 from white maize) and two yeast isolates (MY115 from millet and YY25 from yellow maize) were sequenced. Briefly, cell genomic DNA was extracted using Zymo research quick DNA mini preparation kit as per manufacturer’s instructions, and target gene segments were amplified by polymerase chain reactions (PCR). The LAB and yeast strains were identified by amplification and sequencing of the partial 16S rDNA gene and ribosomal internal transcribed spacer (ITS) region, employing primers designated as 27 F (5′-GAGTTTGATCCTGGCTCAG-3′) and 1492R (5′-TACCTTGTTACGACTT-3′) for LAB and ITS 4 (5′-CCTCCGCTTATTGATATGC-3′) and ITS 5 (5′–GGA AGTAAA AGT CGTAAC AAG G–3′) for the yeast, respectively [41,42,43]. The strains were sequenced at the Department of Biosciences and Biotechnology, International Institute of Tropical Agriculture (IITA), Ibadan. The species designation was obtained by employing the Basic Logarithmic Alignment Search Tool (BLAST) algorithm in National Centre for Biotechnology Information (NCBI) database. Sequences with 100% similarity were regarded as belonging to the same taxonomy group. The sequences obtained were deposited to the GenBank database (https://www.ncbi.nlm.nih.gov/genbank/, accessed on 30 January 2023) and accession numbers were assigned for public accessibility.

5.7. Controlled Fermentation with LAB and Yeasts in the Presence of Toxigenic and Atoxigenic A. flavus Strains

Collection and preparation of A. flavus strains: Two A. flavus strains, La 3228 (toxin-producing) and La 3279 (non-toxin-producing), were sourced from the Pathology and Mycotoxin Laboratory of the International Institute of Tropical Agriculture collection. Isolates were grown on potato dextrose agar (PDA) in 90 mm Petri dishes by dropping silica granules to which the isolates had been adsorbed and incubating at 25 °C for 7 days. Thereafter, the isolates were sub-cultured and incubated similarly to enhance spore production. Post-incubation, spores were rinsed from the Petri dishes with sterile distilled water containing 0.1% (v/v) Tween 80 solution, and the spore suspension was adjusted to 1 × 10 6 spores mL−1.
Collection and preparation of probiotic strains: Two LAB strains, W310 (from white maize) and M26 (from millet), and two yeast strains, MY115 strain (from millet) and YY25 strain (from yellow maize), were retrieved from storage, as previously mentioned. The LAB strains were incubated in MRS broth for 24 h at 37 °C. Thereafter, the broth was diluted to 10−8 and inoculated on MRS agar in triplicates and incubated at 37 °C for 48 h. At the completion of the incubation period, cells were rinsed in sterile distilled water containing 0.1% Tween 80 solution. Yeast cells were prepared similarly to the LAB suspensions, except for the use of ME broth rather than MRS broth.
After probiotic LAB and yeasts were selected, they were assessed for their abilities to detoxify aflatoxins in a controlled fermentation process with maize grains. The controlled fermentation process was conducted using white maize grains (TZL COMP.4 DT C3 WHITE) with undetectable baseline aflatoxin levels, which was verified using the method described by Agbetiameh et al. [44].
Fermentation process: White maize was milled and sterilized by autoclaving at 121 °C for 30 min at 15 psi. Thereafter, five grams of milled maize was combined with 10 mL of sterile distilled water to make ogi slurry and was inoculated in different treatment combinations, indicated in Table 6. Yeasts and LAB suspensions (108 cfu mL−1) were used with 1 mL of Aspergillus in their respective treatment combinations. After inoculation, samples were mixed and left to ferment at ambient temperature for five days, and then, aflatoxin and amino acid concentrations were quantified. The CAMAG TLC Scanner 3 using winCATS 1.4.2 (CAMAG, AG, Muttenz, Switzerland) was used for aflatoxin measurements, and amino acid concentrations were quantified by HPLC. Aflatoxin quantification was as subsequently described.
Prior to analysis of amino acids, samples were lyophilized and then pulverized to obtain a stable and uniform matrix for amino acid profiling. Briefly, 0.05 g of each sample was hydrolyzed with boiling 6 M HCl in a 10 mL hydrolysis tube within CEM Microwave Discover Workstation. Thereafter, the samples were centrifuged at 1500 rpm for 15 min to obtain a clear hydrolysate.
HPLC quantification of amino acids was performed using Waters Alliance 2695 HPLC system with a 2475 Multi λ Fluorescence detector (Waters, Milford, MA, USA). Excitation was at 250 nm and emission at 395 nm and separation occurred in the AccQ•Tag amino acid column Nova-Pak C 18, 4 µm (150 × 3.9 mm). Column was conditioned at 37 °C, with injection volume of 10 μL and concentration of amino acids from 2.5 to 250 pmol. A gradient mobile phase was used for chromatography. The mobile phase consisted of Eluent A (prepared from Waters AccQ•Tag Eluent A concentrate, by adding 200 mL of concentrate to 2 L of Milli-Q water and mixing), Eluent B (acetonitrile, HPLC grade), and Eluent C (Milli-Q water) [45].

5.8. Aflatoxin Quantification

Aflatoxins B1, B2, G1, and G2 were analyzed as previously described by others [44,46]. Briefly, 20 g each per replicate was blended with 100 mL of 70% methanol using a Waring blender. Thereafter, the suspension was agitated for 30 min at 400 rpm and the suspension was filtered through Whatman No. 1 filter paper. The filtrate was collected into 250 mL separating funnels, to which 20 mL of distilled water and 25 mL of dichloromethane was added. This was mixed gently and left for 10–15 min to allow for separation of the matrix. The dichloromethane phase was filtered through a bed of 20 g anhydrous sodium sulfate, which was contained in fluted Whatman No. 4 filter paper. Subsequently, the filtrate left to evaporate in a fume hood and residues were dissolved in 1 mL dichloromethane. Homogenates were directly spotted 4 µL alongside aflatoxin standards on thin layer chromatography (TLC) aluminum (20 × 10 cm) silica gel 60 F plates and developed with diethyl ether–methanol–water (96:3:1) chamber. Plates were visualized under ultraviolet light (365 nm) for presence or absence of aflatoxins and later quantified with a scanning densitometer (CAMAG TLC Scanner 3) and quantification software (win CATS 1.4.2, Camag, AG, Muttenz, Switzerland).

5.9. Statistical Analysis

Percentage reduction in aflatoxin concentration (AF conc.) for aflatoxin B1 and aflatoxin B2 was determined using the following formula:
[(AF conc. of ogi and A. flavus 3228 − AF conc. of ogi and A. flavus 3228 and probiotic)]/(AF conc. of ogi and A. flavus 3228) × 100%
The mean concentrations of amino acids were analyzed for statistical differences using analysis of variance (ANOVA) and separated using Student–Newman–Keuls test (at α = 0.05). Analysis was conducted using SAS v9.1 (SAS Institute, Cary, NC, USA).

Author Contributions

Conceptualization, T.D.O.F. and K.B.; methodology, T.D.O.F. and K.B.; experimentations, T.A. and O.A.; resources, T.D.O.F. and K.B.; data curation, T.D.O.F. and K.B.; writing—original draft preparation, T.A. and O.A.; writing—review and editing, T.D.O.F. and K.B.; supervision, T.D.O.F. and K.B. All authors have read and agreed to the published version of the manuscript.

Funding

This research received no external funding.

Institutional Review Board Statement

Not applicable.

Informed Consent Statement

Not applicable.

Data Availability Statement

According to Institutional requirements, data will be archived within IITA’s open access platform.

Acknowledgments

The authors are grateful to the Pathology/Mycotoxin Laboratory and Maize breeding units of IITA, respectively, for the Aspergillus strains and maize grains used in this study.

Conflicts of Interest

The authors declare no conflict of interest.

References

  1. Ajani, J.; Pasha, K.V. Screening of Millets for the Natural Occurrence of Aflatoxin B1 and their Susceptibility in Samples Collected during Pre-harvesting, Harvesting and Post harvesting Conditions. Indian J. Adv. Chem. Sci. 2017, 5, 340–343. [Google Scholar]
  2. Xiong, Y.; Zhang, P.; Warner, R.D.; Fang, Z. Sorghum Grain: From Genotype, Nutrition and Phenolic Profile to its Health Benefits and Food Applications. Compr. Rev. Food Sci. Food Saf. 2019, 18, 2025–2046. [Google Scholar] [CrossRef] [PubMed] [Green Version]
  3. Kayitesi, E.; Onojakpor, O.; Moyo, S.M. Highlighting the Impact of Lactic-Acid-Bacteria-Derived Flavours or Aromas on Sensory Perception of African Fermented Cereals. Fermentation 2023, 9, 111. [Google Scholar] [CrossRef]
  4. Nyanzi, R.; Jooste, P.J. Cereal-Based Functional Foods, Probiotics; Rigobelo, E., Ed.; InTech: London, UK, 2012; ISBN 978-953-510776-7. Available online: https://www.intechopen.com/chapters/39605 (accessed on 30 January 2023).
  5. Chaves-Lopez, C.; Rossi, C.; Maggio, F.; Paparella, A.; Serio, A. Changes Occurring in Spontaneous Maize Fer-mentation: An Overview. Fermentation 2020, 6, 36. [Google Scholar] [CrossRef] [Green Version]
  6. Bolaji, O.T.; Adepoju, P.A.; Olalusi, A.P. Economic implication of industrialization of a popular weaning food ogi production in Nigeria: A review. Afr. J. Food Sci. 2015, 9, 495–503. [Google Scholar] [CrossRef] [Green Version]
  7. Jin, S.; Yang, H.; Jiao, Y.; Pang, Q.; Wang, Y.; Wang, M.; Shan, A.; Feng, X. Dietary Curcumin Alleviated Acute Ileum Damage of Ducks (Anas platyrhynchos) Induced by AFB1 through Regulating Nrf2-ARE and NF-κB Signaling Pathways. Foods 2021, 10, 1370. [Google Scholar] [CrossRef]
  8. Pickova, D.; Ostry, V.; Toman, J.; Malir, F. Aflatoxins: History, Significant Milestones, Recent Data on Their Toxicity and Ways to Mitigation. Toxins 2021, 13, 399. [Google Scholar] [CrossRef] [PubMed]
  9. Jalili, M.A. A Review on Aflatoxins Reduction in Food. Iran J. Health Saf. Environ. 2016, 3, 445–459. [Google Scholar]
  10. Alshannaq, A.; Yu, J.H. Occurrence, Toxicity, and Analysis of Major Mycotoxins in Food. Int. J. Environ. Res. Public Health 2017, 14, 632. [Google Scholar] [CrossRef] [Green Version]
  11. Chavez, R.A.; Cheng, X.; Herrman, T.J.; Stasiewicz, M.J. Single kernel aflatoxin and fumonisin contamination distribution and spectral classification in commercial corn. Food Control. 2021, 131, 108393. [Google Scholar] [CrossRef]
  12. Bandyopadhyay, R.; Ortega-Beltran, A.; Akande, A.; Mutegi, C.; Atehnkeng, J.; Kaptoge, L.; Senghor, A.; Adhikari, B.; Cotty, P. Biological control of aflatoxins in Africa: Current status and potential challenges in the face of climate change. World Mycotoxin J. 2016, 9, 771–789. [Google Scholar] [CrossRef] [Green Version]
  13. Santini, A.; Ritieni, A. Aflatoxins: Risk, Exposure and Remediation. In Aflatoxins Recent Advances and Future Prospects; Razzaghi-Abyaneh, M., Ed.; InTechOpen: London, UK, 2013; pp. 143–265. [Google Scholar]
  14. Ortega-Beltran, A.; Agbetiameh, D.; Atehnkeng, J.; Falade, T.D.O.; Bandyopadhyay, R. Does Use of Atoxigenic Biocontrol Products to Mitigate Aflatoxin in Maize Increase Fumonisin Content in Grains? Plant Dis. 2021, 105, 2196–2201. [Google Scholar] [CrossRef] [PubMed]
  15. Reid, G. Probiotics and prebiotics—Progress and challenges. Int. Dairy J. 2008, 18, 969–975. [Google Scholar] [CrossRef]
  16. Ukwuru, M.U.; Ohaegbu, C.G. Local cereal fermented foods with probiotic potentials. Res. J. Food Nutr. 2018, 2, 1–13. [Google Scholar]
  17. Banwo, K.; Asogwa, F.C.; Ogunremi, O.R.; Adesulu-Dahunsi, A.; Sanni, A. Nutritional profile and antioxidant capacities of fermented millet and sorghum gruels using lactic acid bacteria and yeasts. Food Biotechnol. 2021, 35, 199–220. [Google Scholar] [CrossRef]
  18. Byakika, S.; Mukisa, I.M.; Wacoo, A.P.; Kort, R.; Byaruhanga, Y.B.; Muyanja, C. Potential application of lactic acid starters in the reduction of aflatoxin contamination in fermented sorghum-millet beverages. Int. J. Food Contam. 2019, 6, 4. [Google Scholar] [CrossRef] [Green Version]
  19. Adebo, J.A.; Njobeh, P.B.; Gbashi, S.; Oyedeji, A.B.; Ogundele, O.M.; Oyeyinka, S.A.; Adebo, O.A. Fermentation of Cereals and Legumes: Impact on Nutritional Constituents and Nutrient Bioavailability. Fermentation 2022, 8, 63. [Google Scholar] [CrossRef]
  20. Okara, J.O.; Lokoyi, O.O. Developing an Efficient Method for Ogi Production: Towards Educating the Rural Women. Niger. J. Res. Prod. 2012, 20, 1–7. [Google Scholar]
  21. Steve, I.O.; David, O.T.; Oluwadunsin, O.A.; Bolawa, M.S. Comparative Study on Nutrient Composition, Functional Property and Glycaemic Index of “Ogi” in Healthy Rats Prepared from Selected Cereal Grains. J. Future Foods 2022, 2, 2022. [Google Scholar] [CrossRef]
  22. Martinez-Miranda, M.M.; Rosero-Moreano, M.; Taborda-Ocampo, G. Occurrence, Dietary Exposure and Risk As-sessment of Aflatoxins in Arepa, Bread and Rice. Food Control 2019, 98, 359–366. [Google Scholar] [CrossRef]
  23. Wacoo, A.P.; Mukisa, I.M.; Meeme, R.; Byakika, S.; Wendiro, D.; Sybesma, W.; Kort, R. Probiotic Enrichment and Reduction of Aflatoxins in a Traditional African Maize-Based Fermented Food. Nutrients 2019, 11, 265. [Google Scholar] [CrossRef] [Green Version]
  24. Kumar, P.; Mahato, D.K.; Kamle, M.; Mohanta, T.K.; Kang, S.G. Aflatoxins: A Global Concern for Food Safety, Human Health and Their Management. Front. Microbiol. 2017, 07, 2170. [Google Scholar] [CrossRef] [PubMed] [Green Version]
  25. Wang, Y.; Liu, F.; Zhou, X.; Liu, M.; Zang, H.; Liu, X.; Shan, A.; Feng, X. Alleviation of Oral Exposure to Aflatoxin B1-Induced Renal Dysfunction, Oxidative Stress, and Cell Apoptosis in Mice Kidney by Curcumin. Antioxidants 2022, 11, 1082. [Google Scholar] [CrossRef] [PubMed]
  26. FAO; WHO. Guidelines for the Evaluation of Probiotics in Food; Food and Agriculture Organization of the United Nations: Rome, Italy; World Health Organization: London, ON, Canada, 2002. Available online: https://www.fao.org/3/a0512e/a0512e.pdf (accessed on 30 January 2023).
  27. Vinderola, C.G.; Reinheimer, J.A. Lactic acid starter and probiotic bacteria, a comparative ‘in vitro’ study of probiotic characteristics and biological barrier resistance. Food Res. Int. 2003, 36, 895–904. [Google Scholar] [CrossRef]
  28. Kostinek, M.; Specht, I.; Edward, V.A.; Pinto, C.; Egounlety, M.; Sossa, C.; Mbugua, S.; Dorti, C.; Thonart, P.; Taljaard, L.; et al. Characterization and biochemical properties of predominant lactic acid bacteria from fermenting cassava for selection as starter cultures. Int. J. Food Microbiol. 2007, 114, 342–351. [Google Scholar] [CrossRef]
  29. Banwo, K.; Sanni, A.; Tan, H. Technological properties and probiotic potential of Enterococcus faecium strains isolated from cow milk. J. Appl. Microbiol. 2012, 114, 229–241. [Google Scholar] [CrossRef] [PubMed]
  30. Olatunde, O.O.; Obadina, A.O.; Omemu, A.M.; Oyewole, O.B.; Olugbile, A.; Olukomaiya, O.O. Screening and molecular identification of potential probiotic lactic acid bacteria in effluents generated during Ogi production. Ann. Microbiol. 2018, 68, 433–443. [Google Scholar] [CrossRef]
  31. Ogunremi, O.; Sanni, A.; Agrawal, R. Probiotic potentials of yeasts isolated from some cereal-based Nigerian traditional fermented food products. J. Appl. Microbiol. 2015, 119, 797–808. [Google Scholar] [CrossRef]
  32. Falade, T.D.O.; Chrysanthopoulos, P.K.; Hodson, M.P.; Sultanbawa, Y.; Fletcher, M.; Darnell, R.; Korie, S.; Fox, G. Metabolites Identified during Varied Doses of Aspergillus Species in Zea mays Grains, and Their Correlation with Aflatoxin Levels. Toxins 2018, 10, 187. [Google Scholar] [CrossRef] [Green Version]
  33. Petrova, P.; Arsov, A.; Tsvetanova, F.; Parvanova-Mancheva, T.; Vasileva, E.; Tsigoriyna, L.; Petrov, K. The Complex Role of Lactic Acid Bacteria in Food Detoxification. Nutrients 2022, 14, 2038. [Google Scholar] [CrossRef]
  34. Akin-Osanaiye, B.C.; Kamalu, I.O. Evaluation of ogi (corn caramel) from maize and sorghum for isolation and characterization of lactic acid bacteria (LAB). Biochem. Mol. Biol. 2019, 4, 28–34. [Google Scholar]
  35. Fawole, M.O.; Oso, B.A. Characterization of Bacteria: Laboratory Manual of Microbiology, 4th ed.; Spectrum Book Limited: Ibadan, Nigeria, 2004. [Google Scholar]
  36. Alakeji, T.P.; Banwo, K.; Ogunremi, O.R.; Sanni, A.I. Functional properties of yeasts isolated from some Nigerian tradi-tional fermented foods. J. Microbiol. Biotechnol. Food Sci. 2015, 4, 437–441. [Google Scholar] [CrossRef]
  37. Yoon, M.Y.; Kim, Y.J.; Hwang, H.-J. Properties and safety aspects of Enterococcus faecium strains isolated from Chungkukjang, a fermented soy product. LWT 2008, 41, 925–933. [Google Scholar] [CrossRef]
  38. Gupta, H.; Malik, R.K. Incidence of virulence in bacteriocin-producing enterococcal isolates. Le Lait 2007, 87, 587–601. [Google Scholar] [CrossRef]
  39. Omar, N.B.; Castro, A.; Lucas, R.; Abriouel, H.; Yousif, N.M.; Franz, C.M.; Holzapfel, W.H.; Rubén, P.P.; Martínez-Canãmero, M.; Gálvez, A. Functional and safety aspects of enterococci isolated from different Spanish foods. Syst. Appl. Microbiol. 2004, 27, 118–130. [Google Scholar] [CrossRef] [PubMed]
  40. Dela-Cruz, T.E. Gelatin Hydrolysis Test Protocol; American Society for Microbiology: Washington, DC, USA, 2012; Available online: https://asm.org/ASM/media/Protocol-Images/Gelatin-Hydrolysis-Test-Protocol.pdf?ext=.pdf (accessed on 30 January 2023).
  41. White, T.J.; Bruns, T.; Lee, S.; Taylor, J. Amplification and Direct Sequencing of Fungi Ribosomal RNA Genes for Phy-Logenetics. In PCR Protocols. A Guide to Methods and Applications; Innis, M.A., Gelfand, D.H., Sninsky, J.J., White, T.J., Eds.; Academic Press: San Diego, CA, USA, 1990; pp. 315–322. [Google Scholar]
  42. Kostinek, M.; Specht, I.; Edward, V.A.; Schillinger, U.; Hertel, C.; Holzapfel, W.H.; Franz, C.M. Diversity and technological properties of predominant lactic acid bacteria from fermented cassava used for the preparation of Gari, a traditional African food. Syst. Appl. Microbiol. 2005, 28, 527–540. [Google Scholar] [CrossRef] [PubMed]
  43. Banwo, K.; Sanni, A.; Tan, H.; Tian, Y. Phenotypic and Genotypic Characterization of Lactic Acid Bacteria Isolated from Some Nigerian Traditional Fermented Foods. Food Biotechnol. 2012, 26, 124–142. [Google Scholar] [CrossRef]
  44. Agbetiameh, D.; Awuah, R.T.; Atehnkeng, J.; Islam, M.; Callicott, K.A.; Cotty, P.J.; Bandyopadhyay, R. Potential of Atoxigenic Aspergillus flavus Vegetative Compatibility Groups Associated With Maize and Groundnut in Ghana as Biocontrol Agents for Aflatoxin Management. Front. Microbiol. 2019, 10, 2069. [Google Scholar] [CrossRef]
  45. Alamu, E.O.; Menkir, A.; Adesokan, M.; Fawole, S.; Maziya-Dixon, B. Near-Infrared Reflectance Spectrophotometry (NIRS) Application in the Amino Acid Profiling of Quality Protein Maize (QPM). Foods 2022, 11, 2779. [Google Scholar] [CrossRef]
  46. Atehnkeng, J.; Ojiambo, P.S.; Donner, M.; Ikotun, T.; Sikora, R.A.; Cotty, P.J.; Bandyopadhyay, R. Distribution and toxigenicity of Aspergillus species isolated from maize kernels from three agro-ecological zones in Nigeria. Int. J. Food Microbiol. 2008, 122, 74–84. [Google Scholar] [CrossRef] [PubMed]
Figure 1. Tolerance of the selected LAB and yeast strains to 0.30, 0.50, and 1.00% bile salt concentration.
Toxins 15 00210 g001
Table 1. Sugar and sugar alcohol utilization patterns of lactic acid bacteria.
LABCompounds Able to UtilizeCompounds Unable to UtilizeOccurrence (%) Types of Ogi Isolated from
Lb. acidophilusGlucose, galactose, fructose, d-sorbitol, and lactoseSucrose and mannitol5%Maize (yellow and white)
Lb. brevisGlucose, galactose, fructose, d-sorbitol, and lactoseSucrose and mannitol8%Millet, sorghum, and yellow maize
Lc. caseiGlucose, sucrose, galactose, fructose, mannitol, lactose, and d-sorbitol (Y16 only)d-sorbitol, sucrose (Y16 only) and mannitol (Y16 and Y42 only), d-sorbitol (Y42 only), and galactose (Y42 only)10%Maize (yellow and white), millet, and sorghum
Lb. delbrueckiiGlucose, fructose, d-sorbitol, and lactoseSucrose, galactose, and mannitol17%Maize (yellow and white), millet, and sorghum
Lm. FermentumGlucose, sucrose, galactose, fructose, lactose, and mannitol (Y310)d-sorbitol and mannitol15%Maize (yellow and white), millet, and sorghum
Lb. leichmaniiGlucose, sucrose, fructose, and lactoseGalactose, d-sorbitol, and mannitol3%Millet and sorghum
Lb. paraplantarumGlucose, galactose, d-sorbitol, Lactose (W44 only), and fructose (W44 only)Sucrose, fructose, mannitol, and lactose5%Maize (yellow and white)
Lb. pentosusGlucose, galactose, fructose, d-sorbitol, and lactoseSucrose and mannitol8%Millet and sorghum
Lp. plantarumGlucose, sucrose, galactose, fructose, and mannitold-sorbitol, lactose, and mannitol (W37)12%Maize (yellow and white), millet, and sorghum
Leuc. mesenteroidesGlucose, sucrose, galactose, and lactoseFructose, D-sorbitol, and mannitol17%Maize (yellow and white), millet, and sorghum
Table 2. Sugar and sugar alcohol utilization patterns of yeasts.
YeastsCompounds Able to UtilizeCompounds Unable to UtilizeOccurrence (%)
Candida kruseiGlucoseSucrose, galactose, fructose, d-sorbitol, mannitol, and lactose35%
C. tropicalisGlucose and sucrose, galactose and fructose,Mannitol and lactose35%
Geotrichum candidumGlucose and fructoseSucrose, galactose, d-sorbitol, mannitol, and lactose30%
Table 3. Acidification and safety assessments of the LAB and yeast strains.
LAB/Yeast Strains0 h6 h24 h48 hHemolysisGelatinaseDNAse
Limosilactobacillus fermentum W3106.545.923.783.70γ--
Lactiplantibacillus plantarum M266.545.484.263.65γ--
Candida tropicalis MY1156.545.854.274.26γ--
Candida tropicalis YY256.545.905.004.60γ--
- = negative, γ = gamma hemolytic reaction (no hemolysis), and h = hour.
Table 4. Percentage (%) reduction in aflatoxin in ogi after 5 days of controlled fermentation.
Aflatoxin Conc in ng/gPerc. Reduction
TreatmentsB1 B2 G1G2 B1B2
Ogi alone 0000NANA
Ogi and L. plantarum M260000NANA
Ogi and L. fermentum W3100000NANA
Ogi and C. tropicalis MY1150000NANA
Ogi and C. tropicalis YY250000NANA
Ogi and A. flavus 3279 (atoxigenic)0000NANA
Ogi and A. flavus 3228 (toxigenic)704830900NANA
Ogi, Lp. plantarum M26, and A. flavus 3279 0000NANA
Ogi, Lp. plantarum M26, and A. flavus 3228 2704113006263
Ogi, Lm. fermentum W310, and A. flavus 32790000NANA
Ogi, Lm. fermentum W310, and A. flavus 322896577008675
Ogi, C. tropicalis MY115, and A. flavus 3279 0000NANA
Ogi, C. tropicalis MY115 and A. flavus 3228 282770006077
Ogi, C. tropicalis YY25, and A. flavus 32790000NANA
Ogi, C. tropicalis YY25, and A. flavus 32282835212006031
Keys: AFB1 = aflatoxin B1, AFB2 = aflatoxin B2, AFG1 = aflatoxin G1, AFG2 = aflatoxin G2, A. flavus = Aspergillus flavus, Lp. plantarum = Lactiplantibacillus plantarum, Lm. fermentum = Limosilactobacillus fermentum, and C. tropicalis = Candida tropicalis. NA = not applicable.
Table 5. Amino acid concentration in maize under different fermentation treatments.
TreatmentsAspSerGlnGlyHisThrArgAlaProCysTyrValMetLysIleLeuPhe
Ogi alone0.65 C0.18 DE0.74 CD0.32 D0.32 BCD0.1 DE0.05 D0.3 CDE0.39 C0.06 D0.11 DEF0.15 BC0.01 DE0.49 C0.14 B0.14 D0.08 CD
Ogi + 3228 (toxigenic)1.99 B1.61 B8.15 B1.12 B0.77 AB1.4 A1.77 AB2.34 B2.68 A7.27 A0.15 DE1.65 A0.08 C0.49 C1.06 B3.63 A1.28 B
Ogi + 3279 (atoxigenic)0.69 C0.12 E0.72 CD0.12 EF0.13 CD0.36 CD0.02 D0.39 CD0.09 D0.15 C0.09 DEF0.11 BC0.01 DE0.46 C0.17 B0.02 E0.01 D
Ogi + Candida tropicalis (millet ogi)0.7 C0.18 DE0.75 CD0.15 E0.19 BCD0.22 DE0.08 D0.27 CDE0.22 CD0.08 D0.12 DEF0.08 BC0.09 C0.49 C0.15 B0.1 D0.15 B
Ogi + Candida tropicalis (millet ogi) + 32282.78 A2.00 A9.45 A1.51 A0.82 AB1.64 A2.05 A2.98 A3.09 A0.68 B1.73 A2.05 A0.35 B0.85 B4.4 A0.1 D1.4 B
Ogi + Candida tropicalis (millet ogi) + 32790.64 C0.05 FG0.54 D0.08 A1.23 A0.61 BC1.12 C0.24 DEF0.39 C0.17 C0.04 F0.04 C0.02 DE0.59 C0.24 B0.13 D0.14 CD
Ogi + Candida tropicalis (yellow maize ogi)0.55 C0.17 DE0.74 CD0.02 G0.02 D0.03 E0.03 D0.12 F0.2 CD0.06 D0.09 DEF0.08 BC0.01 DE0.51 C0.13 B0.14 D0.54 C
Ogi + Candida tropicalis (yellow maize ogi) + 32282.78 A1.94 A8.89 AB1.34 AB0.71 AB1.59 A1.97 A2.66 AB2.71 A0.07 D1.32 B0.14 BC0.14 C1.22 A4.48 A0.02 E1.56 B
Ogi + Candida tropicalis (yellow maize ogi) + 32791.92 B1.43 C7.96 B1.13 AB0.72 AB0.93 B1.59 B2.43 B2.61 A0.06 D1.22 B1.43 A0.03 D0.46 C1.79 B1.07 B1.2 B
Ogi + Limosilactobacillus fermentum0.54 C0.15 DE0.97 C0.7 C0.57 ABC2.03 A1.15 C2.68 AB0.93 B0.06 D0.06 EF0.41 B0.49 A0.46 C0.1 B0.26 C3.83 A
Ogi + Limosilactobacillus fermentum (yellow maize ogi) + 3228 0.68 C0.08 F0.65 CD0.01 G0.03 D0.68 BC0.02 D0.36 CDE0.08 D0.06 D0.3 C0.07 BC0.13 C0.07 D0.07 B0.09 D0.02 CD
Ogi + Limosilactobacillus fermentum (yellow maize ogi) + 32790.7 C0.18 DE0.75 CD0.03 G0.04 CD0.05 E0.05 D0.45 C0.29 CD0.06 D0.11 DEF0.16 BC0.0 E0.59 C0.14 B0.14 D0.12 CD
Ogi + Lactiplantibacillus plantarum 0.71 C0.23 D0.76 CD0.07 EFG0.13 CD0.03 E0.01 D0.2 EF0.27 CD0.06 D0.11 DEF0.14 BC0.01 DE0.45 C0.14 B0.12 D0.11 CD
Ogi + Lactiplantibacillus plantarum (millet ogi) + 32280.68 C0.02 F0.68 CD0.01 G0.03 D0.11 DE0.03 D0.43 C0.25 CD0.06 D0.19 D0.13 BC0.01 DE0.58 C0.1 B0.13 D0.1 CD
Ogi + Lactiplantibacillus plantarum (millet ogi) + 32790.6 C0.06 F0.47 CD0.05 FG0.14 CD0.15 ED0.09 D0.15 F0.36 CD0.06 D0.09 DEF0.1 BC0.01 DE0.57 C0.09 B1.09 B0.09 CD
Means with different letters along the column are statistically different from one another at p < 0.05. Square root-transformed means were analyzed by ANOVA and separated using Student–Newman–Keuls test using SAS version 9.4. Asp = aspartic acid, Ser = serine, Gln = glutamine, Gly = glycine, His = histidine, Thr = threonine, Arg = arginine, Ala = alanine, Pro = proline, Cys = cystine, Tyr = tyrosine, Val = valine, Met = methionine, Lys = lysine, Ile = isoleucine, Leu = leucine, and Phe = phenyleanaline.
Table 6. Treatments for investigating influence of lactic acid bacteria and yeast during controlled fermentation of ogi in the presence of Aspergillus.
Treatments
Ogi alone
Ogi + Lactiplantibacillus plantarum M26
Ogi + Limosilactobacillus fermentum W310
Ogi + Candida tropicalis MY115
Ogi + Candida tropicalis YY25
Ogi + La3279
Ogi + La3228
Ogi + Lactiplantibacillus plantarum M26 + La3279
Ogi + Limosilactobacillus fermentum W310 + La3279
Ogi + Candida tropicalis MY115 + La3279
Ogi + Candida tropicalis YY25 + La3279
Ogi + Lactiplantibacillus plantarum M26 + La3228
Ogi + Limosilactobacillus fermentum W310 + La3228
Ogi + Candida tropicalis MY115 + La3228
Ogi + Candida tropicalis YY25 + La3228
Disclaimer/Publisher’s Note: The statements, opinions and data contained in all publications are solely those of the individual author(s) and contributor(s) and not of MDPI and/or the editor(s). MDPI and/or the editor(s) disclaim responsibility for any injury to people or property resulting from any ideas, methods, instructions or products referred to in the content.

