
The Obesity Paradox and Mortality in Older Adults: A Systematic Review

Abstract
:1. Introduction
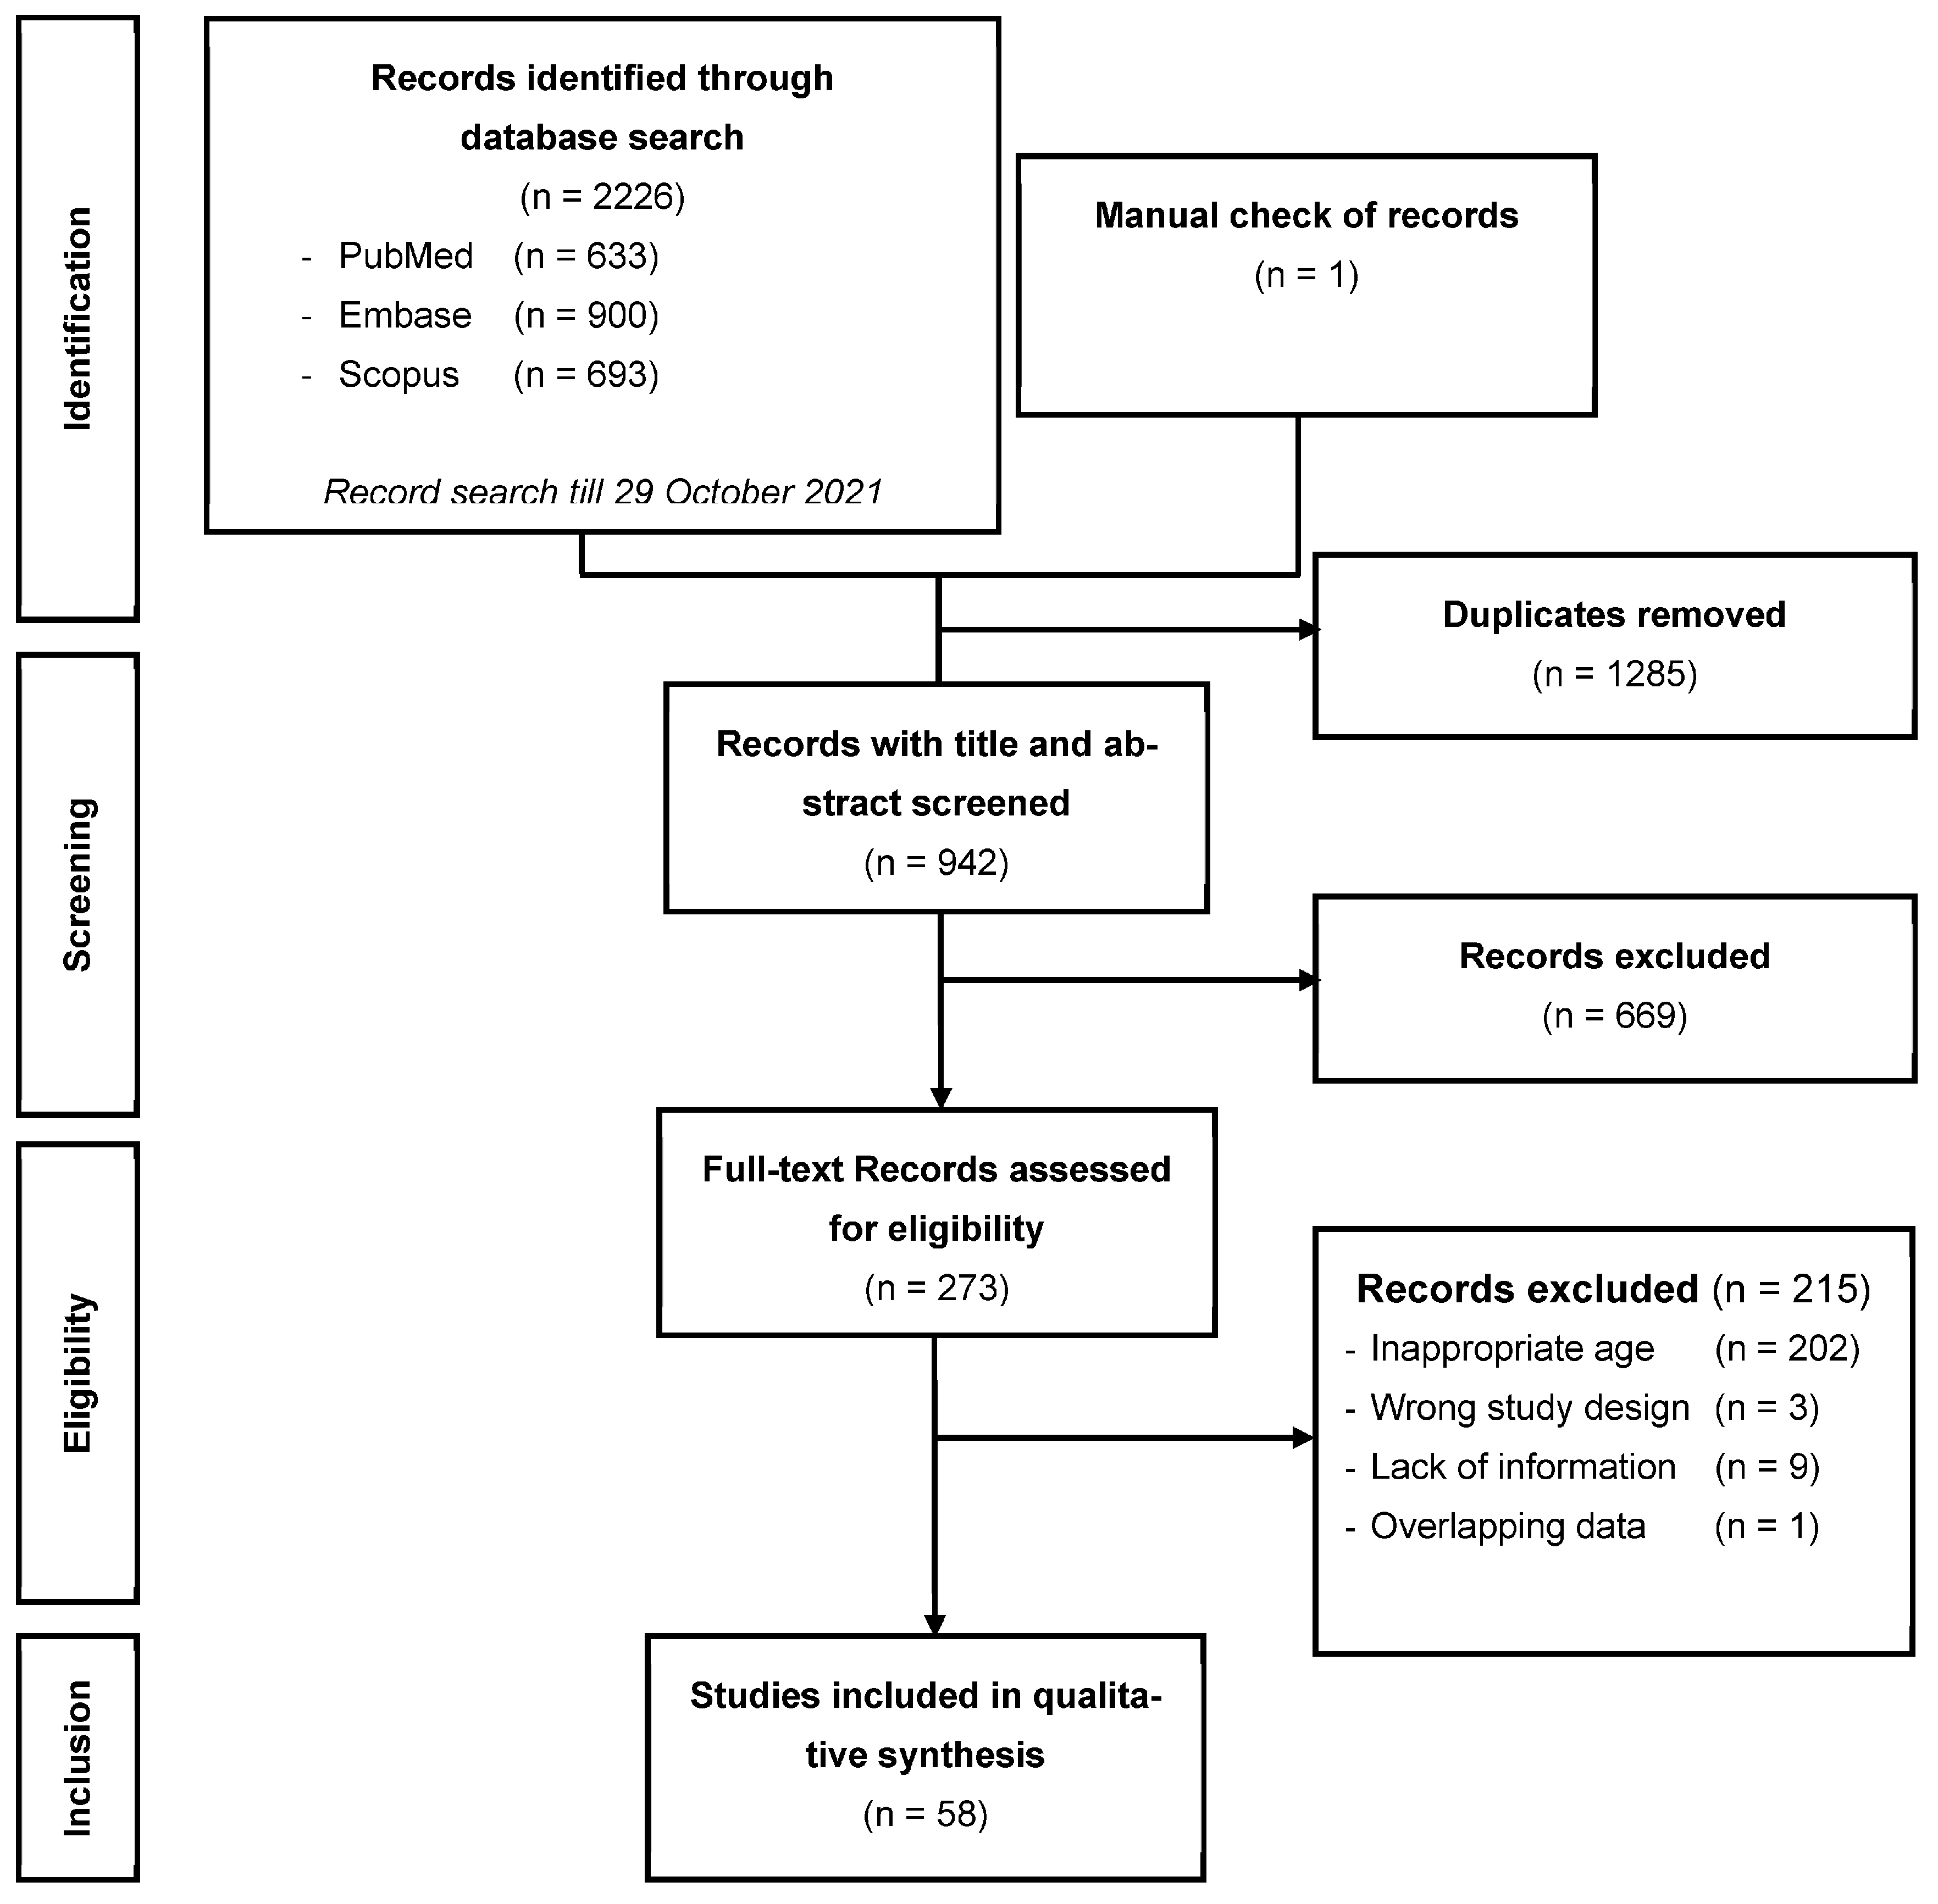
2. Methods
2.1. Literature Search
2.2. Study Selection
2.3. Data Extraction
2.4. Quality Assessment
3. Results
4. Discussion
5. Conclusions
Supplementary Materials
Author Contributions
Funding
Informed Consent Statement
Data Availability Statement
Acknowledgments
Conflicts of Interest
References
- Frydrych, L.M.; Bian, G.; O’Lone, D.E.; Ward, P.A.; Delano, M.J. Obesity and type 2 diabetes mellitus drive immune dysfunction, infection development, and sepsis mortality. J. Leukoc. Biol. 2018, 104, 525–534. [Google Scholar] [CrossRef] [PubMed]
- Liu, Z.; Sanossian, N.; Starkman, S.; Avila-Rinek, G.; Eckstein, M.; Sharma, L.K.; Liebeskind, D.; Conwit, R.; Hamilton, S. Adiposity and Outcome After Ischemic Stroke: Obesity Paradox for Mortality and Obesity Parabola for Favorable Functional Outcomes. Stroke 2021, 52, 144–151. [Google Scholar] [CrossRef] [PubMed]
- Powell-Wiley, T.M.; Poirier, P.; Burke, L.E.; Després, J.-P.; Gordon-Larsen, P.; Lavie, C.J.; Lear, S.A.; Ndumele, C.E.; Neeland, I.J.; Sanders, P.; et al. Obesity and Cardiovascular Disease: A Scientific Statement From the American Heart Association. Circulation 2021, 143, e984–e1010. [Google Scholar] [CrossRef] [PubMed]
- Hales, C.M.; Carroll, M.D.; Fryar, C.D.; Ogden, C.L. Prevalence of Obesity and Severe Obesity Among Adults: United States. 2017–2018. NCHS Data Brief 2020, 360, 1–8. [Google Scholar]
- Ward, Z.J.; Bleich, S.N.; Cradock, A.L.; Barrett, J.L.; Giles, C.M.; Flax, C.; Gortmaker, S.L. Projected, U.S. State-Level Prevalence of Adult Obesity and Severe Obesity. N. Engl. J. Med. 2019, 381, 2440–2450. [Google Scholar] [CrossRef]
- Kwon, Y.; Kim, H.J.; Park, S.; Park, Y.G.; Cho, K.H. Body mass index-related mortality in patients with type 2 diabetes and heterogeneity in obesity paradox studies: A dose-response meta-analysis. PLoS ONE 2017, 12, e0168247. [Google Scholar] [CrossRef] [Green Version]
- Skinner, J.S.; Abel, W.M.; McCoy, K.; Wilkins, C.H. Exploring the “Obesity Paradox” as a Correlate of Cognitive and Physical Function in Community-dwelling Black and White Older Adults. Ethn. Dis. 2017, 27, 387–394. [Google Scholar] [CrossRef] [Green Version]
- Yamazaki, K.; Suzuki, E.; Yorifuji, T.; Tsuda, T.; Ohta, T.; Ishikawa-Takata, K.; Doi, H. Is there an obesity paradox in the Japanese elderly population? A community-based cohort study of 13,280 men and women. Geriatr. Gerontol. Int. 2017, 17, 1257–1264. [Google Scholar] [CrossRef] [Green Version]
- Antonopoulos, A.S.; Tousoulis, D. The molecular mechanisms of obesity paradox. Cardiovasc. Res. 2017, 113, 1074–1086. [Google Scholar] [CrossRef]
- Wells, G.A.; Shea, B.; O’Connell, D.; Peterson, J.; Welch, V.; Losos, M.; Tugwell, P. The Newcastle-Ottawa Scale (NOS) for Assessing the Quality of Non-Randomised Studies in Meta-Analyses: The Ottawa Hospital. 2013. Available online: http://www.ohri.ca/programs/clinical_epidemiology/oxford.asp (accessed on 1 November 2022).
- Amin, R.M.; Raad, M.; Rao, S.S.; Musharbash, F.; Best, M.J.; Amanatullah, D.F. Survival bias may explain the appearance of the obesity paradox in hip fracture patients. Osteoporos. Int. 2021, 32, 2555–2562. [Google Scholar] [CrossRef]
- El Moheb, M.; Jia, Z.; Qin, H.; El Hechi, M.W.; Nordestgaard, A.T.; Lee, J.M.; Kaafarani, H.M. The Obesity Paradox in Elderly Patients Undergoing Emergency Surgery: A Nationwide Analysis. J. Surg. Res. 2021, 265, 195–203. [Google Scholar] [CrossRef] [PubMed]
- Lin, Y.-K.; Wang, C.-C.; Yen, Y.-F.; Chen, L.-J.; Ku, P.-W.; Chen, C.-C.; Lai, Y.-J. Association of body mass index with all-cause mortality in the elderly population of Taiwan: A prospective cohort study. Nutr. Metab. Cardiovasc. Dis. NMCD 2021, 31, 110–118. [Google Scholar] [CrossRef] [PubMed]
- Martinez-Tapia, C.; Diot, T.; Oubaya, N.; Paillaud, E.; Poisson, J.; Gisselbrecht, M.; Morisset, L.; Caillet, P.; Baudin, A.; Pamoukdjian, F.; et al. The obesity paradox for mid- and long-term mortality in older cancer patients: A prospective multicenter cohort study. Am. J. Clin. Nutr. 2020, 113, 129–141. [Google Scholar] [CrossRef] [PubMed]
- Lai, K.-Y.; Wu, T.-H.; Liu, C.-S.; Lin, C.-H.; Lin, C.-C.; Lai, M.-M.; Lin, W.-Y. Body mass index and albumin levels are prognostic factors for long-term survival in elders with limited performance status. Aging 2020, 12, 1104–1113. [Google Scholar] [CrossRef]
- Schneider, M.; Potthoff, A.-L.; Scharnböck, E.; Heimann, M.; Schäfer, N.; Weller, J.; Schaub, C.; Jacobs, A.H.; Güresir, E.; Herrlinger, U.; et al. Newly diagnosed glioblastoma in geriatric (65+) patients: Impact of patients frailty, comorbidity burden and obesity on overall survival. J. Neurooncol. 2020, 149, 421–427. [Google Scholar] [CrossRef]
- Nishida, M.M.; Okura, M.; Ogita, M.; Aoyama, T.; Tsuboyama, T.; Arai, H. Two-Year Weight Loss but Not Body Mass Index Predicts Mortality and Disability in an Older Japanese Community-Dwelling Population. J. Am. Med. Dir. Assoc. 2019, 20, 1654.e11–1654.e18. [Google Scholar] [CrossRef]
- Om, S.Y.; Ko, E.; Ahn, J.-M.; Kang, D.-Y.; Lee, K.; Kwon, O.; Lee, P.H.; Lee, S.-W.; Kim, H.J.; Kim, J.B.; et al. Relation of Body Mass Index to Risk of Death or Stroke in Patients Who Underwent Transcatheter Aortic Valve Implantation. Am. J. Cardiol. 2019, 123, 638–643. [Google Scholar] [CrossRef]
- Yoshihisa, A.; Sato, T.; Kajimoto, K.; Sato, N.; Takeishi, Y. Acute Decompensated Heart Failure Syndromes i. Heterogeneous impact of body mass index on in-hospital mortality in acute heart failure syndromes: An analysis from the ATTEND Registry. Eur. Heart J. Acute Cardiovasc. Care 2019, 8, 589–598. [Google Scholar] [CrossRef]
- Crotti, G.; Gianfagna, F.; Bonaccio, M.; Di Castelnuovo, A.; Costanzo, S.; Persichillo, M.; Iacoviello, L. Body Mass Index and Mortality in Elderly Subjects from the Moli-Sani Study: A Possible Mediation by Low-Grade Inflammation? Immunol. Investig. 2018, 47, 774–789. [Google Scholar] [CrossRef]
- De Palma, R.; Ivarsson, J.; Feldt, K.; Saleh, N.; Ruck, A.; Linder, R.; Settergren, M. The obesity paradox: An analysis of pre-procedure weight trajectory on survival outcomes in patients undergoing transcatheter aortic valve implantation. Obes. Res. Clin. Pract. 2018, 12, 51–60. [Google Scholar] [CrossRef]
- Kim, H.; Yoon, J.L.; Lee, A.; Jung, Y.; Kim, M.Y.; Cho, J.J.; Ju, Y.S. Prognostic effect of body mass index to mortality in Korean older persons. Geriatr. Gerontol. Int. 2018, 18, 538–546. [Google Scholar] [CrossRef] [PubMed]
- Lv, Y.-B.; Liu, S.; Yin, Z.-X.; Gao, X.; Kraus, V.B.; Mao, C.; Yuan, J.-Q.; Zhang, J.; Luo, J.-S.; Chen, H.-S.; et al. Associations of Body Mass Index and Waist Circumference with 3-Year All-Cause Mortality Among the Oldest Old: Evidence from a Chinese Community-Based Prospective Cohort Study. J. Am. Med. Dir. Assoc. 2018, 19, 672–678.e4. [Google Scholar] [CrossRef]
- de Souto Barreto, P.; Cadroy, Y.; Kelaiditi, E.; Vellas, B.; Rolland, Y. The prognostic value of body-mass index on mortality in older adults with dementia living in nursing homes. Clin. Nutr. 2017, 36, 423–428. [Google Scholar] [CrossRef] [PubMed]
- Wu, S.; Yang, Y.-M.; Zhu, J.; Wan, H.-B.; Wang, J.; Zhang, H.; Shao, X.-H. Impact of Age on the Association Between Body Mass Index and All-Cause Mortality in Patients with Atrial Fibrillation. J. Nutr. Heal. Aging 2017, 21, 1125–1132. [Google Scholar] [CrossRef]
- Flodin, L.; Laurin, A.; Lokk, J.; Cederholm, T.; Hedstrom, M. Increased 1-year survival and discharge to independent living in overweight hip fracture patients: A prospective study of 843 patients. Acta Orthop. 2016, 87, 146–151. [Google Scholar] [CrossRef] [Green Version]
- Kuo, J.F.; Hsieh, Y.T.; Mao, I.C.; Lin, S.D.; Tu, S.T.; Hsieh, M.C. The Association Between Body Mass Index and All-Cause Mortality in Patients With Type 2 Diabetes Mellitus: A 5.5-Year Prospective Analysis. Medicine 2015, 94, e1398. [Google Scholar] [CrossRef] [PubMed]
- Buys, D.R.; Roth, D.L.; Ritchie, C.S.; Sawyer, P.; Allman, R.M.; Funkhouser, E.M.; Locher, J.L. Nutritional risk and body mass index predict hospitalization, nursing home admissions, and mortality in community-dwelling older adults: Results from the UAB Study of Aging with 8.5 years of follow-up. J. Gerontol. Biol. Sci. Med. Sci. 2014, 69, 1146–1153. [Google Scholar] [CrossRef] [Green Version]
- Ford, D.W.; Hartman, T.J.; Do, C.S.; Wood, C.; Mitchell, D.C.; Erickson, P.; Bailey, R.; Smiciklas-Wright, H.; Coffman, D.L.; Jensen, G.L. Body mass index, poor diet quality, and health-related quality of life are associated with mortality in rural older adults. J. Nutr. Gerontol. Geriatr. 2014, 33, 23–34. [Google Scholar] [CrossRef]
- Lang, P.O.; Mahmoudi, R.; Novella, J.-L.; Tardieu, E.; Bertholon, L.-A.; Nazeyrollas, P.; Blanchard, F.; Jolly, D.; Dramé, M. Is obesity a marker of robustness in vulnerable hospitalized aged populations? Prospective, multicenter cohort study of 1306 acutely ill patients. J. Nutr. Health Aging 2014, 18, 66–74. [Google Scholar] [CrossRef]
- Lee, Y.; Kim, J.; Han, E.S.; Ryu, M.; Cho, Y.; Chae, S. Frailty and body mass index as predictors of 3-year mortality in older adults living in the community. Gerontology 2014, 60, 475–482. [Google Scholar] [CrossRef]
- Wu, C.Y.; Chou, Y.C.; Huang, N.; Chou, Y.J.; Hu, H.Y.; Li, C.P. Association of body mass index with all-cause and cardiovascular disease mortality in the elderly. PLoS ONE 2014, 9, e102589. [Google Scholar] [CrossRef] [Green Version]
- Chen, L.; Peng, L.; Liu, L.; Lin, M.; Lan, C.; Chang, P. Body mass index, health status, and mortality of older Taiwanese men: Overweight good, underweight bad, obesity neutral. J. Am. Geriatr. Soc. 2013, 61, 2233–2234. [Google Scholar] [CrossRef] [PubMed]
- Dahl, A.K.; Fauth, E.B.; Ernsth-Bravell, M.; Hassing, L.B.; Ram, N.; Gerstof, D. Body mass index, change in body mass index, and survival in old and very old persons. J. Am. Geriatr. Soc. 2013, 61, 512–518. [Google Scholar] [CrossRef] [PubMed] [Green Version]
- Nakazawa, A.; Nakamura, K.; Kitamura, K.; Yoshizawa, Y. Association between body mass index and mortality among institutionalized elderly adults in Japan. Environ. Health Prev. Med. 2013, 18, 502–506. [Google Scholar] [CrossRef] [Green Version]
- Takata, Y.; Ansai, T.; Soh, I.; Awano, S.; Nakamichi, I.; Akifusa, S.; Goto, K.; Yoshida, A.; Fujii, H.; Fujisawa, R.; et al. Body mass index and disease-specific mortality in an 80-year-old population at the 12-year follow-up. Arch. Gerontol. Geriatr. 2013, 57, 46–53. [Google Scholar] [CrossRef]
- Tseng, C.H. Obesity paradox: Differential effects on cancer and noncancer mortality in patients with type 2 diabetes mellitus. Atherosclerosis 2013, 226, 186–192. [Google Scholar] [CrossRef] [PubMed]
- Veronese, N.; De Rui, M.; Toffanello, E.D.; De Ronch, I.; Perissinotto, E.; Bolzetta, F.; D’Avanzo, B.; Cardin, F.; Coin, A.; Manzato, E.; et al. Body mass index as a predictor of all-cause mortality in nursing home residents during a 5-year follow-up. J. Am. Med. Dir. Assoc. 2013, 14, 53–57. [Google Scholar] [CrossRef] [PubMed]
- Woo, J.; Yu, R.; Yau, F. Fitness, fatness and survival in elderly populations. Age 2013, 35, 973–984. [Google Scholar] [CrossRef] [PubMed] [Green Version]
- Yamamoto, M.; Mouillet, G.; Oguri, A.; Gilard, M.; Laskar, M.; Eltchaninoff, H.; Fajadet, J.; Iung, B.; Donzeau-Gouge, P.; Leprince, P.; et al. Effect of body mass index on 30- and 365-day complication and survival rates of transcatheter aortic valve implantation (from the FRench Aortic National CoreValve and Edwards 2 [FRANCE 2] registry). Am. J. Cardiol. 2013, 112, 1932–1937. [Google Scholar] [CrossRef]
- Zekry, D.; Herrmann, F.R.; Vischer, U.M. The association between the body mass index and 4-year all-cause mortality in older hospitalized patients. J. Gerontol. Biol. Sci. Med. Sci. 2013, 68, 705–711. [Google Scholar] [CrossRef] [Green Version]
- de Hollander, E.L.; Van Zutphen, M.; Bogers, R.P.; Bemelmans, W.J.; De Groot, L.C. The impact of body mass index in old age on cause-specific mortality. J. Nutr. Health Aging 2012, 16, 100–106. [Google Scholar] [CrossRef]
- Kvamme, J.M.; Holmen, J.; Wilsgaard, T.; Florholmen, J.; Midthjell, K.; Jacobsen, B.K. Body mass index and mortality in elderly men and women: The Tromso and HUNT studies. J. Epidemiol. Community Health 2012, 66, 611–617. [Google Scholar] [CrossRef] [PubMed] [Green Version]
- Mihel, S.; Milanovic, S.M. Association of elevated body mass index and hypertension with mortality: The CroHort study. Coll. Antropol. 2012, 36, 183–188. [Google Scholar] [CrossRef] [PubMed] [Green Version]
- Cereda, E.; Pedrolli, C.; Zagami, A.; Vanotti, A.; Piffer, S.; Opizzi, A.; Rondanelli, M.; Caccialanza, R. Body mass index and mortality in institutionalized elderly. J. Am. Med. Dir Assoc. 2011, 12, 174–178. [Google Scholar] [CrossRef] [PubMed]
- Berraho, M.; Nejjari, C.; Raherison, C.; El Achhab, Y.; Tachfouti, N.; Serhier, Z.; Dartigues, J.F.; Barberger-Gateau, P. Body mass index, disability, and 13-year mortality in older French adults. J. Aging Health 2010, 22, 68–83. [Google Scholar] [CrossRef]
- Han, S.S.; Kim, K.W.; Na, K.Y.; Chae, D.-W.; Kim, S.; Chin, H.J. Lean mass index: A better predictor of mortality than body mass index in elderly Asians. J. Am. Geriatr. Soc. 2010, 58, 312–317. [Google Scholar] [CrossRef]
- Kitamura, K.; Nakamura, K.; Nishiwaki, T.; Ueno, K.; Hasegawa, M. Low body mass index and low serum albumin are predictive factors for short-term mortality in elderly Japanese requiring home care. Tohoku J. Exp. Med. 2010, 221, 29–34. [Google Scholar] [CrossRef] [Green Version]
- Luchsinger, J.A.; Patel, B.; Tang, M.X.; Schupf, N.; Mayeux, R. Body mass index, dementia, and mortality in the elderly. J. Nutr. Health Aging. 2008, 12, 127–131. [Google Scholar] [CrossRef] [Green Version]
- Locher, J.L.; Roth, D.L.; Ritchie, C.S.; Cox, K.; Sawyer, P.; Bodner, E.V.; Allman, R.M. Body mass index, weight loss, and mortality in community-dwelling older adults. J. Gerontol. Biol. Sci. Med. Sci. 2007, 62, 1389–1392. [Google Scholar] [CrossRef] [Green Version]
- Takata, Y.; Ansai, T.; Soh, I.; Akifusa, S.; Sonoki, K.; Fujisawa, K.; Awano, S.; Kagiyama, S.; Hamasaki, T.; Nakamichi, I.; et al. Association between body mass index and mortality in an 80-year-old population. J. Am. Geriatr. Soc. 2007, 55, 913–917. [Google Scholar] [CrossRef]
- Danninger, T.; Rezar, R.; Mamandipoor, B.; Dankl, D.; Koköfer, A.; Jung, C.; Wernly, B.; Osmani, V. Underweight but not overweight is associated with excess mortality in septic ICU patients. Wien. Klin. Wochenschr. 2021, 134, 139–147. [Google Scholar] [CrossRef] [PubMed]
- Seino, S.; Kitamura, A.; Abe, T.; Taniguchi, Y.; Yokoyama, Y.; Amano, H.; Nishi, M.; Nofuji, Y.; Narita, M.; Ikeuchi, T.; et al. Dose-Response Relationships Between Body Composition Indices and All-Cause Mortality in Older Japanese Adults. J. Am. Med. Dir. Assoc. 2020, 21, 726–733.e4. [Google Scholar] [CrossRef]
- Tokarek, T.A.; Dziewierz, A.; Sorysz, D.; Bagienski, M.; Rzeszutko, Ł.; Krawczyk-Ożóg, A.; Kleczyński, P. The obesity paradox in patients undergoing transcatheter aortic valve implantation: Is there any effect of body mass index on survival? Kardiol. Pol. 2019, 77, 190–197. [Google Scholar] [CrossRef] [PubMed] [Green Version]
- Keller, K.; Munzel, T.; Ostad, M.A. Sex-specific differences in mortality and the obesity paradox of patients with myocardial infarction ages > 70 y. Nutrition 2018, 46, 124–130. [Google Scholar] [CrossRef]
- Lee, S.H.; Kim, D.H.; Park, J.H.; Kim, S.; Choi, M.; Kim, H.; Park, Y.G. Association between body mass index and mortality in the Korean elderly: A nationwide cohort study. PLoS ONE 2018, 13, e0207508. [Google Scholar] [CrossRef] [Green Version]
- Cheng, F.W.; Gao, X.; Mitchell, D.C.; Wood, C.; Still, C.D.; Rolston, D.; Jensen, G.L. Body mass index and all-cause mortality among older adults. Obesity 2016, 24, 2232–2239. [Google Scholar] [CrossRef] [PubMed]
- Calabia, J.; Arcos, E.; Carrero, J.J.; Comas, J.; Valles, M. Does the obesity survival paradox of dialysis patients differ with age? Blood Purif. 2015, 39, 193–199. [Google Scholar] [CrossRef] [PubMed]
- Kim, N.H.; Lee, J.; Kim, T.J.; Kim, N.H.; Choi, K.M.; Baik, S.H.; Choi, D.S.; Pop-Busui, R.; Park, Y.; Kim, S.G. Body Mass Index and Mortality in the General Population and in Subjects with Chronic Disease in Korea: A Nationwide Cohort Study (2002–2010). PLoS ONE 2015, 10, e0139924. [Google Scholar] [CrossRef]
- Kubota, Y.; Iso, H.; Tamakoshi, A.; Group, J.S. Association of Body Mass Index and Mortality in Japanese Diabetic Men and Women Based on Self-Reports: The Japan Collaborative Cohort (JACC) Study. J. Epidemiol. 2015, 25, 553–558. [Google Scholar] [CrossRef] [Green Version]
- Shil Hong, E.; Khang, A.R.; Roh, E.; Jeong Ku, E.U.; An Kim, Y.E.; Min Kim, K.; Lim, S. Counterintuitive relationship between visceral fat and all-cause mortality in an elderly Asian population. Obesity 2015, 23, 220–227. [Google Scholar] [CrossRef]
- Clark, D.O.; Gao, S.; Lane, K.A.; Callahan, C.M.; Baiyewu, O.; Ogunniyi, A.; Hendrie, H.C. Obesity and 10-year mortality in very old African Americans and Yoruba-Nigerians: Exploring the obesity paradox. J. Gerontol. Biol. Sci. Med. Sci. 2014, 69, 1162–1169. [Google Scholar] [CrossRef] [PubMed] [Green Version]
- Murphy, R.A.; Reinders, I.; Garcia, M.E.; Eiriksdottir, G.; Launer, L.J.; Benediktsson, R.; Gudnason, V.; Jonsson, P.V.; Harris, T.B. Adipose tissue, muscle, and function: Potential mediators of associations between body weight and mortality in older adults with type 2 diabetes. Diabetes Care 2014, 37, 3213–3219. [Google Scholar] [CrossRef] [Green Version]
- Yamauchi, Y.; Hasegawa, W.; Yasunaga, H.; Sunohara, M.; Jo, T.; Matsui, H.; Fushimi, K.; Takami, K.; Nagase, T. Paradoxical association between body mass index and in-hospital mortality in elderly patients with chronic obstructive pulmonary disease in Japan. Int. J. Chronic Obstr. Pulm. Dis. 2014, 9, 1337–1346. [Google Scholar] [CrossRef] [PubMed] [Green Version]
- Tsai, A.C.; Hsiao, M.L. The association of body mass index (BMI) with all-cause mortality in older Taiwanese: Results of a national cohort study. Arch Gerontol. Geriatr. 2012, 55, 217–220. [Google Scholar] [CrossRef] [PubMed]
- Lea, J.P.; Crenshaw, D.O.; Onufrak, S.J.; Newsome, B.B.; McClellan, W.M. Obesity, end-stage renal disease, and survival in an elderly cohort with cardiovascular disease. Obesity 2009, 17, 2216–2222. [Google Scholar] [CrossRef]
- Grabowski, D.C.; Ellis, J.E. High body mass index does not predict mortality in older people: Analysis of the Longitudinal Study of Aging. J. Am. Geriatr. Soc. 2001, 49, 968–979. [Google Scholar] [CrossRef]
- Kananen, L.; Eriksdotter, M.; Boström, A.; Kivipelto, M.; Annetorp, M.; Metzner, C.; Jerlardtz, V.B.; Engström, M.; Johnson, P.; Lundberg, L.; et al. Body mass index and Mini Nutritional Assessment-Short Form as predictors of in-geriatric hospital mortality in older adults with COVID-19. Clin. Nutr. 2022, 41, 2973–2979. [Google Scholar] [CrossRef]
- Lai, C.C.; Wang, C.Y.; Wang, Y.H.; Hsueh, S.C.; Ko, W.C.; Hsueh, P.R. Global epidemiology of coronavirus disease 2019: Disease incidence, daily cumulative index, mortality, and their association with country healthcare resources and economic status. Int. J. Antimicrob. Agents 2020, 55, 105946. [Google Scholar] [CrossRef]
- Yaffe, K.; Fox, P.; Newcomer, R.; Sands, L.; Lindquist, K.; Dane, K.; Covinsky, K.E. Patient and caregiver characteristics and nursing home placement in patients with dementia. JAMA 2002, 287, 2090–2097. [Google Scholar] [CrossRef]
- Heymsfield, S.B.; Peterson, C.M.; Thomas, D.M.; Heo, M.; Schuna, J.M., Jr. Why are there race/ethnic differences in adult body mass index-adiposity relationships? A quantitative critical review. Obes. Rev. 2016, 17, 262–275. [Google Scholar] [CrossRef] [Green Version]
- Jeong, S.M.; Lee, D.H.; Rezende, L.F.M.; Giovannucci, E.L. Different correlation of body mass index with body fatness and obesity-related biomarker according to age, sex and race-ethnicity. Sci Rep. 2023, 13, 3472. [Google Scholar] [CrossRef] [PubMed]
- Coutinho, T.; Goel, K.; de Sá, D.C.; Kragelund, C.; Kanaya, A.M.; Zeller, M.; Park, J.-S.; Kober, L.; Torp-Pedersen, C.; Cottin, Y.; et al. Central obesity and survival in subjects with coronary artery disease: A systematic review of the literature and collaborative analysis with individual subject data. J. Am. Coll. Cardiol. 2011, 57, 1877–1886. [Google Scholar] [CrossRef] [PubMed] [Green Version]
- de Koning, L.; Merchant, A.T.; Pogue, J.; Anand, S.S. Waist circumference and waist-to-hip ratio as predictors of cardiovascular events: Meta-regression analysis of prospective studies. Eur. Heart J. 2007, 28, 850–856. [Google Scholar] [CrossRef] [PubMed]
- Okorodudu, D.O.; Jumean, M.F.; Montori, V.M.; Romero-Corral, A.; Somers, V.K.; Erwin, P.J.; Lopez-Jimenez, F. Diagnostic performance of body mass index to identify obesity as defined by body adiposity: A systematic review and meta-analysis. Int. J. Obes. 2010, 34, 791–799. [Google Scholar] [CrossRef] [Green Version]
- Flegal, K.M.; Kit, B.K.; Orpana, H.; Graubard, B.I. Association of all-cause mortality with overweight and obesity using standard body mass index categories: A systematic review and meta-analysis. JAMA 2013, 309, 71–82. [Google Scholar] [CrossRef] [Green Version]
- Gao, F.; Wang, Z.J.; Shen, H.; Yang, S.W.; Nie, B.; Zhou, Y.J. Impact of obesity on mortality in patients with diabetes: Meta-analysis of 20 studies including 250,016 patients. J. Diabetes Investig. 2018, 9, 44–54. [Google Scholar] [CrossRef]
- Zhao, X.; Gang, X.; He, G.; Li, Z.; Lv, Y.; Han, Q.; Wang, G. Obesity Increases the Severity and Mortality of Influenza and COVID-19: A Systematic Review and Meta-Analysis. Front. Endocrinol. 2020, 11, 595109. [Google Scholar] [CrossRef]
- Golabek, T.; Bukowczan, J.; Szopinski, T.; Chlosta, P.; Lipczynski, W.; Dobruch, J.; Borowka, A. Obesity and renal cancer incidence and mortality--a systematic review of prospective cohort studies. Ann. Agric. Environ. Med. 2016, 23, 37–43. [Google Scholar] [CrossRef] [Green Version]
- Liu, X.; Ju, W.; Huo, C.; Zhang, S.; Wang, X.; Huang, K. Overweight and Obesity as Independent Factors for Increased Risk of Hepatocellular Cancer-Related Mortality: A Meta-Analysis. J. Am. Coll. Nutr. 2021, 40, 287–293. [Google Scholar] [CrossRef]
- Tian, S.; Xu, Y. Association of sarcopenic obesity with the risk of all-cause mortality: A meta-analysis of prospective cohort studies. Geriatr. Gerontol. Int. 2016, 16, 155–166. [Google Scholar] [CrossRef]
- Sousa-Santos, A.R.; Afonso, C.; Borges, N.; Santos, A.; Padrão, P.; Moreira, P.; Amaral, T.F. Sarcopenia and Undernutrition Among Portuguese Older Adults: Results from Nutrition UP 65 Study. Food Nutr. Bull. 2018, 39, 487–492. [Google Scholar] [CrossRef] [PubMed]
- Cereda, E.; Pedrolli, C.; Klersy, C.; Bonardi, C.; Quarleri, L.; Cappello, S.; Caccialanza, R. Nutritional status in older persons according to healthcare setting: A systematic review and meta-analysis of prevalence data using MNA((R)). Clin. Nutr. 2016, 35, 1282–1290. [Google Scholar] [CrossRef] [PubMed]
- Sousa-Santos, A.R.; Afonso, C.; Borges, N.; Santos, A.; Padrão, P.; Moreira, P.; Amaral, T.F. Sarcopenia, physical frailty, undernutrition and obesity cooccurrence among Portuguese community-dwelling older adults: Results from Nutrition UP 65 cross-sectional study. BMJ Open 2020, 10, e033661. [Google Scholar] [CrossRef] [PubMed]
- Akinnusi, M.E.; Pineda, L.A.; El Solh, A.A. Effect of obesity on intensive care morbidity and mortality: A meta-analysis. Crit. Care Med. 2008, 36, 151–158. [Google Scholar] [CrossRef] [Green Version]
- Donini, L.M.; Pinto, A.; Giusti, A.M.; Lenzi, A.; Poggiogalle, E. Obesity or BMI Paradox? Beneath the Tip of the Iceberg. Front. Nutr. 2020, 7, 53. [Google Scholar] [CrossRef]
- Casas-Vara, A.; Santolaria, F.; Fernandez-Bereciartua, A.; Gonzalez-Reimers, E.; Garcia-Ochoa, A.; Martinez-Riera, A. The obesity paradox in elderly patients with heart failure: Analysis of nutritional status. Nutrition 2012, 28, 616–622. [Google Scholar] [CrossRef]


| Author, Year | Country | Study Design | Study Setting | Medical Condition | Sample Size | Age (Years) Mean ± SD |
|---|---|---|---|---|---|---|
| Kananen, 2022 [68] | Sweden | Retrospective cohort | Hospital, Geriatrics | COVID-19 | 1409 | 77 [65–104] ♣ |
| Amin, 2021 [11] | USA | Prospective cohort | Hospital, Surgery | Hip fracture | 52,729 | x ± x |
| Danninger, 2021 [52] | USA | Retrospective cohort | Hospital, ICU | Sepsis | 8707 | x ± x |
| El Moheb, 2021 [12] | USA | Prospective cohort | Hospital, Surgery | Emergent surgery | 78,704 | 75 ± x |
| Lin, 2021 [13] | Taiwan | Prospective cohort | Community | None specific | 81,221 | 74 ± 6 |
| Martinez-Tapia, 2021 [14] | France | Prospective cohort | Hospital, Geriatrics | Cancer | 2071 | 81 ± 6 |
| Lai, 2020 [15] | Taiwan | Prospective cohort | LTCF | None specific | 182 | 79 ± 8 |
| Schneider, 2020 [16] | Germany | Prospective cohort | Hospital, Neurosurgery | Glioblastoma | 110 | 72 [65–86] ♣ |
| Seino, 2020 [53] | Japan | Retrospective cohort | Community | None specific | 1977 | 72 ± 6 * |
| Nishida, 2019 [17] | Japan | Prospective cohort | Community | None specific | 1229 | 74 ± 5 |
| Om, 2019 [18] | Korea | Prospective cohort | Hospital, Cardiology | Aortic stenosis | 379 | 79 ± x * |
| Tokarek, 2019 [54] | Poland | Retrospective cohort | Hospital, Cardiology | TAVI patients | 147 | 82 [x–x] ♣ |
| Yoshihisa, 2019 [19] | Japan | Prospective cohort | Hospital, Cardiology | Acute heart failure | 2410 | x ± x |
| Crotti, 2018 [20] | Italy | Prospective cohort | Community | None specific | 4970 | 72 ± 5 |
| De Palma, 2018 [21] | Sweden | Prospective cohort | Hospital, Cardiology | TAVI patients | 492 | 83 ± 6 |
| Keller, 2018 [55] | Germany | Retrospective cohort | Hospital, Cardiology | AMI | 122,607 | 80 ± x |
| Kim, 2018 [22] | Korea | Prospective cohort | Community | None specific | 170,639 | 72 ± 5 |
| Lee, 2018 [56] | Korea | Retrospective cohort | Community | None specific | 11,844 | 72 ± 5 |
| Lv, 2018 [23] | China | Prospective cohort | Community | None specific | 4361 | 92 ± 8 |
| de Souto Barreto, 2017 [24] | France | Prospective cohort | Nursing home | Dementia | 3741 | 86 ± 8 |
| Wu, 2017 [25] | China | Prospective cohort | Hospital, ED | Atrial fibrillation | 1321 | x ± x |
| Cheng, 2016 [57] | USA | Retrospective cohort | Community | None specific | 4565 | 74 ± 5 |
| Flodin, 2016 [26] | Sweden | Prospective cohort | Hospital | Hip fracture | 843 | 82 ± 7 |
| Calabia, 2015 [58] | Spain | Retrospective cohort | Hospital, Nephrology | Haemodialysis | 3978 | 75 ± 6 |
| Kim, 2015 [59] | Korea | Retrospective cohort | Community | Chronic diseases | x | x ± x |
| Kubota, 2015 [60] | Japan | Retrospective cohort | Community | T2DM | 16,304 # | x ± x |
| Kuo, 2015 [27] | Taiwan | Prospective cohort | Outpatients | T2DM | x | x ± x |
| Shil Hong, 2015 [61] | Korea | Retrospective cohort | Community | None specific | 1000 | 76 ± 9 |
| Buys, 2014 [28] | USA | Prospective cohort | Community | None specific | 1257 | 75 ± 7 |
| Clark, 2014 [62] | USA/Nigeria | Retrospective cohort | Community | None specific | 2466 | 77 ± 5 * |
| Ford, 2014 [29] | USA | Prospective Cohort | Community | None specific | 2995 | 81 ± 4 |
| Lang, 2014 [30] | France | Prospective cohort | Hospital, ED | None specific | 1306 | 85 ± 6 |
| Lee, 2014 [31] | Korea | Prospective cohort | Community | None specific | 11,844 | 73 ± 7 |
| Murphy, 2014 [63] | Iceland | Retrospective cohort | Community | T2DM | 637 | 77 [66–96] ♠ |
| Wu, 2014 [32] | Taiwan | Prospective cohort | Community | None specific | 77,541 | 73 ± 7 |
| Yamauchi, 2014 [64] | Japan | Retrospective cohort | Hospital, Pulmonology | COPD | 263,940 | 78 ± 7 |
| Chen, 2013 [33] | Taiwan | Prospective cohort | Veterans | None specific | 1257 | 83 ± 5 |
| Dahl, 2013 [34] | Sweden | Prospective cohort | Community | None specific | 882 | 80 ± 6 |
| Nakazawa, 2013 [35] | Japan | Prospective cohort | Nursing home | None specific | 8510 | 84 ± 8 |
| Takata, 2013 [36] | Japan | Prospective cohort | Community | None specific | 675 | 80 ± 0 |
| Tseng, 2013 [37] | Taiwan | Prospective cohort | Community | T2DM | 34,825 | x ± x |
| Veronese, 2013 [38] | Italy | Prospective cohort | Nursing home | None specific | 181 | 81 ± 8 |
| Woo, 2013 [39] | China | Prospective cohort | Community | None specific | 4000 | 73 ± 5 |
| Yamamoto, 2013 [40] | France | Prospective cohort | Hospital, Cardiology | TAVI patients | 3072 | 83 ± 7 |
| Zekry, 2013 [41] | Switzerland | Prospective cohort | Hospital, Geriatric | None specific | 444 | 85 ± 7 |
| de Hollander, 2012 [42] | Netherlands | Prospective cohort | Community | None specific | 1980 | 73 ± 2 |
| Kvamme, 2012 [43] | Norway | Prospective cohort | Community | None specific | 16,711 | 73 ± 5 |
| Mihel, 2012 [44] | Croatia | Prospective cohort | Community | Hypertension | 2507 | x ± x |
| Tsai, 2012 [65] | Taiwan | Retrospective cohort | Community | None specific | 2892 | x ± x |
| Cereda, 2011 [45] | Italy | Prospective cohort | LTCF | None specific | 533 | 84 ± 8 |
| Berraho, 2010 [46] | France | Prospective cohort | Community | None specific | 3646 | 75 ± 7 |
| Han, 2010 [47] | Korea | Prospective cohort | Community | None specific | 877 | 75 ± 8 |
| Kitamura, 2010 [48] | Japan | Prospective cohort | Home care | None specific | 205 | 84 ± 8 |
| Lea, 2009 [66] | USA | Retrospective cohort | Hospital, Cardiology | AMI | 74,167 | 77 ± x * |
| Luchsinger, 2008 [49] | USA | Prospective cohort | Community | None specific | 1372 | 78 ± 6 |
| Locher, 2007 [50] | USA | Prospective cohort | Community | None specific | 983 | 75 ± 7 |
| Takata, 2007 [51] | Japan | Prospective cohort | Community | None specific | 697 | 80 ± 0 |
| Grabowski, 2001 [67] | USA | Retrospective cohort | Community | None specific | 7527 | 77 ± 6 |
| Author(s), Year | Age (Mean ± SD) | Medical Condition | Outcome | Obesity Paradox | BMI Thresholds # (kg/m2) |
|---|---|---|---|---|---|
| Kananen, 2022 [68] | x ± x | COVID-19 | In-hospital mortality | No | 18.5 < BMI < 25.0 |
| Amin, 2021 [11] | x ± x | Hip fracture | 30-day mortality | Yes | BMI ≥ 25.0 (No, if BMI > 40.0) |
| Danninger, 2021 [52] | x ± x | Sepsis | ICU mortality | Yes | BMI ≥ 30.0 |
| El Moheb, 2021 [12] | 75 ± x | Emergent Surgery | 30-day mortality | Yes | BMI ≥ 25.0 |
| Lin, 2021 [13] | 74 ± 6 | None specific | 84-month mortality | Yes | BMI ≥ 24.0 |
| Martinez-Tapia, 2021 [14] | 81 ± 6 | Cancer | 12-month mortality (men) | Yes | BMI ≥ 30.0 |
| 12-month mortality (women) | No | ||||
| 60-month mortality (men) | Yes | BMI ≥ 30.0 | |||
| 60-month mortality (women) | Yes | BMI ≥ 30.0 | |||
| Lai, 2020 [15] | 79 ± 8 | None specific | 72-month mortality | No | |
| Schneider, 2020 [16] | 72 ± x | Glioblastoma | 12-month mortality | Yes | BMI ≥ 30.0 |
| Seino, 2020 [53] | 72 ± 6 | None specific | All-cause mortality (men) | No | |
| All-cause mortality (women) | No | ||||
| Nishida, 2019 [17] | 74 ± 5 | None specific | 36-month mortality | No | |
| Om, 2019 [18] | 79 ± x | Aortic stenosis | 12-month mortality | Yes | BMI ≥ 24.9 |
| Tokarek, 2019 [54] | 82 ± x | TAVI patients | 12-month survival | Yes | BMI ≥ 30.0 |
| Yoshihisa, 2019 [19] | x ± x | AHF | In-hospital mortality | Yes | BMI ≥ 25.0 |
| Crotti, 2018 [20] | 72 ± 5 | None specific | 68-month mortality | Yes | BMI ≥ 25.0 (No, if BMI > 30.0) |
| 68-month CVD mortality | No | ||||
| 68-month cancer mortality | No | ||||
| De Palma, 2018 [21] | 83 ± 6 | TAVI patients | 12-month mortality | Yes | BMI ≥ 25.0 |
| 50-month mortality | Yes | BMI ≥ 25.0 | |||
| Keller, 2018 [55] | 80 ± x | AMI | In-hospital mortality | Yes | BMI ≥ 30.0 |
| Kim, 2018 [22] | 72 ± 5 | None specific | 60-month mortality | Yes | BMI ≥ 25.0 (No, if BMI > 27.5) |
| Lee, 2018 [56] | 72 ± 5 | None specific | 60-month mortality | No | |
| Lv, 2018 [23] | 92 ± 8 | None specific | 36-month mortality | Yes | BMI ≥ 18.5 |
| De Souto Barreto, 2017 [24] | 86 ± 8 | Dementia | 18-month mortality (dementia) | Yes | BMI ≥ 25.0 |
| 18-month mortality (without dementia) | Yes | BMI ≥ 25.0 | |||
| Wu, 2017 [25] | x ± x | Atrial fibrillation | 12-month mortality (65–74 years) | No | |
| 12-month mortality (≥75 years) | Yes | BMI ≥ 24.0 | |||
| Cheng, 2016 [57] | 74 ± 5 | None specific | 132-month mortality | Yes | BMI ≥ 25.0 (No, if BMI ≥ 35.0) |
| Diabetes | Yes | BMI ≥ 25.0 (No, if BMI ≥ 35.0) | |||
| Hypertension | Yes | BMI ≥ 25.0 (No, if BMI ≥ 35.0) | |||
| Dyslipidaemia | Yes | BMI ≥ 25.0 (No, if BMI ≥ 35.0) | |||
| Flodin, 2016 [26] | 82 ± 7 | Hip fracture | 12-month survival | Yes | BMI > 26.0 |
| Calabia, 2015 [58] | 75 ± 6 | Haemodialysis | 120-month mortality | Yes | BMI = 30.0–34.9 (No, if BMI = 27.5–29.9 or BMI ≥ 35.0) |
| Kim, 2015 [59] | x ± x | Chronic diseases | 108-month mortality | No | |
| Kubota, 2015 [60] | x ± x | T2DM | 132-month ID mortality | Yes | BMI ≥ 25.0 |
| Kuo, 2015 [27] | x ± x | T2DM | 66-month mortality | No | |
| Shil hong, 2015 [61] | 76 ± 9 | None specific | 72-month mortality | Yes | BMI ≥ 23.8 |
| Buys, 2014 [28] | 75 ± 7 | None specific | 102-month mortality | No | |
| Clark, 2014 [62] | 77 ± 5 | None specific | 120-month mortality (Africans) | No | |
| 120-month mortality (African Americans) | No | ||||
| Ford, 2014 [29] | 81 ± 4 | None specific | 40-month mortality | No | |
| Lang, 2014 [30] | 85 ± 6 | None specific | 6-week mortality | Yes | BMI ≥ 30.0 |
| 12-month mortality | Yes | BMI ≥ 25.0 | |||
| 24-month mortality | Yes | BMI ≥ 25.0 | |||
| Lee, 2014 [31] | 73 ± 7 | None specific | 36-month mortality | Yes | BMI ≥ 25.0 (No, if BMI ≥ 30.0) |
| Murphy, 2014 [63] | 77 ± x | T2DM | 84-month mortality | No | |
| Wu, 2014 [32] | 73 ± 7 | None specific | 60-month mortality | Yes | BMI ≥ 25.0 (No, if BMI ≥ 35.0) |
| 60-month CVD mortality | BMI ≥ 25.0 (No, if BMI ≥ 30.0) | ||||
| Yamauchi, 2014 [64] | 78 ± 7 | COPD | In-hospital mortality | Yes | BMI ≥ 23.0 |
| Chen, 2013 [33] | 83 ± 5 | None specific | 18-month mortality | Yes | BMI ≥ 23.0 |
| Dahl, 2013 [34] | 80 ± 6 | None specific | 216-month mortality | Yes | BMI ≥ 25.0 (No, if BMI ≥ 30.0) |
| Nakazawa, 2013 [35] | 84 ± 8 | None specific | 12-month mortality | Yes | BMI ≥ 23.6 |
| Takata, 2013 [36] | 80 ± 0 | None specific | 144-month mortality | No | |
| 144-month CVD mortality | No | ||||
| 144-month cancer mortality | No | ||||
| Tseng, 2013 [37] | x ± x | T2DM | 144-month mortality | Yes | BMI ≥ 23.0 |
| Veronese, 2013 [38] | 81 ± 8 | None specific | 60-month | Yes | BMI ≥ 30.0 |
| Woo, 2013 [39] | 73 ± 5 | None specific | 84-month mortality | No | |
| Yamamoto, 2013 [40] | 83 ± 7 | TAVI patients | 30-day mortality | No | |
| 12-month mortality | Yes | BMI ≥ 25.0 | |||
| Zekry, 2013 [41] | 85 ± 7 | None specific | 48-month mortality | Yes | BMI ≥ 30.0 |
| de Hollander, 2012 [42] | 73 ± 2 | None specific | 120-month mortality | No | |
| Kvamme, 2012 [43] | 73 ± 5 | None specific | 12-month mortality (men) | No | |
| 12-month mortality (women) | No | ||||
| Respiratory diseases | 12-month mortality (men) | No | |||
| 12-month mortality (women) | No | ||||
| CVD | 12-month mortality (men) | No | |||
| 12-month mortality (women) | No | ||||
| Cancer | 12-month mortality (men) | No | |||
| 12-month mortality (women) | No | ||||
| Mihel, 2012 [44] | x ± x | Hypertension | 60-month mortality (men) | Yes | BMI ≥ 30.0 |
| 60-month mortality (women) | No | ||||
| Tsai, 2012 [65] | x ± x | None specific | 48-month mortality (65–74 y; men) | No | |
| 48-month mortality (≥75 y; men) | No | ||||
| 48-month mortality (65–74 y; women) | No | ||||
| 48-month mortality (≥75 y; women) | No | ||||
| Cereda, 2011 [45] | 84 ± 8 | None specific | 72-month mortality | Yes | BMI ≥ 25.0 |
| Berraho, 2010 [46] | 75 ± 7 | None specific | 156-month mortality | No | |
| Han, 2010 [47] | 75 ± 8 | None specific | 42-month mortality | No | |
| Kitamura, 2010 [48] | 84 ± 8 | None specific | 24-month mortality | Yes | BMI ≥ 17.1 |
| Lea, 2009 [66] | 77 ± x | AMI | 125-month mortality | Yes | BMI ≥ 25.0 (No, if BMI > 40.0) |
| Luchsinger, 2008 [49] | 78 ± 6 | None specific | 144-month mortality | No | |
| Locher, 2007 [50] | 75 ± 7 | None specific | 36-month mortality | No | |
| Takata, 2007 [51] | 80 ± 0 | None specific | 48-month mortality | Yes | BMI ≥ 25.0 |
| 48-month CVD mortality | No | ||||
| 48-month cancer mortality | No | ||||
| Grabowski, 2001 [67] | 77 ± 6 | None specific | 96-month mortality | Yes | BMI ≥ 28.5 |
| Author, Year | Study Design | Selection | Comparability | Outcome | Total Score | Quality Rating |
|---|---|---|---|---|---|---|
| Kananen, 2022 [68] | Retrospective cohort | **** | ** | *** | 9 | High |
| Amin, 2021 [11] | Prospective cohort | **** | ** | *** | 9 | High |
| Danninger, 2021 [52] | Retrospective cohort | **** | ** | *** | 9 | High |
| El Moheb, 2021 [12] | Prospective cohort | **** | ** | *** | 9 | High |
| Lin, 2021 [13] | Prospective cohort | *** | ** | *** | 8 | High |
| Martinez-Tapia, 2021 [14] | Prospective cohort | **** | ** | *** | 9 | High |
| Lai, 2020 [15] | Prospective cohort | **** | ** | *** | 9 | High |
| Schneider, 2020 [16] | Prospective cohort | **** | ** | *** | 9 | High |
| Seino, 2020 [53] | Retrospective cohort | **** | ** | *** | 9 | High |
| Nishida, 2019 [17] | Prospective cohort | **** | ** | *** | 9 | High |
| Om, 2019 [18] | Prospective cohort | **** | * | *** | 8 | High |
| Tokarek, 2019 [54] | Retrospective cohort | **** | * | *** | 8 | High |
| Yoshihisa, 2019 [19] | Prospective cohort | **** | * | *** | 8 | High |
| Crotti, 2018 [20] | Prospective cohort | **** | ** | *** | 9 | High |
| De Palma, 2018 [21] | Prospective cohort | **** | * | *** | 8 | High |
| Keller, 2018 [55] | Retrospective cohort | **** | * | *** | 8 | High |
| Kim, 2018 [22] | Prospective cohort | **** | ** | *** | 9 | High |
| Lee, 2018 [56] | Retrospective cohort | **** | ** | *** | 9 | High |
| Lv, 2018 [23] | Prospective cohort | **** | ** | *** | 9 | High |
| de Souto Barreto, 2017 [24] | Prospective cohort | **** | ** | *** | 9 | High |
| Wu, 2017 [25] | Prospective cohort | **** | ** | *** | 9 | High |
| Cheng, 2016 [57] | Retrospective cohort | **** | ** | *** | 9 | High |
| Flodin, 2016 [26] | Prospective cohort | **** | ** | *** | 9 | High |
| Calabia, 2015 [58] | Retrospective cohort | **** | ** | *** | 9 | High |
| Kim, 2015 [59] | Retrospective cohort | **** | ** | *** | 9 | High |
| Kubota, 2015 [60] | Retrospective study | **** | ** | *** | 9 | High |
| Kuo, 2015 [27] | Prospective cohort | **** | * | *** | 8 | High |
| Shil Hong, 2015 [61] | Retrospective cohort | **** | ** | *** | 9 | High |
| Buys, 2014 [28] | Prospective cohort | *** | ** | *** | 8 | High |
| Clark, 2014 [62] | Retrospective cohort | **** | ** | *** | 9 | High |
| Ford, 2014 [29] | Prospective cohort | *** | ** | *** | 8 | High |
| Lang, 2014 [30] | Prospective cohort | **** | ** | *** | 9 | High |
| Lee, 2014 [31] | Prospective cohort | **** | ** | *** | 9 | High |
| Murphy, 2014 [63] | Retrospective cohort | **** | ** | *** | 9 | High |
| Wu, 2014 [32] | Prospective cohort | **** | ** | *** | 9 | High |
| Yamauchi, 2014 [64] | Retrospective cohort | **** | ** | *** | 9 | High |
| Chen, 2013 [33] | Prospective cohort | *** | ** | *** | 8 | High |
| Dahl, 2013 [34] | Prospective cohort | *** | ** | *** | 8 | High |
| Nakazawa, 2013 [35] | Prospective cohort | **** | ** | *** | 9 | High |
| Takata, 2013 [36] | Prospective cohort | *** | ** | *** | 8 | High |
| Tseng, 2013 [37] | Prospective cohort | **** | ** | *** | 9 | High |
| Veronese, 2013 [38] | Prospective cohort | *** | ** | *** | 8 | High |
| Woo, 2013 [39] | Prospective cohort | **** | ** | *** | 9 | High |
| Yamamoto, 2013 [40] | Prospective cohort | **** | ** | *** | 9 | High |
| Zekry, 2013 [41] | Prospective cohort | **** | ** | *** | 9 | High |
| de Hollander, 2012 [42] | Prospective cohort | *** | ** | *** | 8 | High |
| Kvamme, 2012 [43] | Prospective cohort | **** | ** | *** | 9 | High |
| Mihel, 2012 [44] | Prospective cohort | *** | * | *** | 7 | High |
| Tsai, 2012 [65] | Retrospective cohort | **** | ** | *** | 9 | High |
| Cereda, 2011 [45] | Prospective cohort | *** | ** | *** | 8 | High |
| Berraho, 2010 [46] | Prospective cohort | **** | ** | *** | 9 | High |
| Han, 2010 [47] | Prospective cohort | **** | ** | *** | 9 | High |
| Kitamura, 2010 [48] | Prospective cohort | **** | ** | *** | 9 | High |
| Lea, 2009 [66] | Retrospective cohort | **** | ** | *** | 9 | High |
| Luchsinger, 2008 [49] | Prospective cohort | **** | ** | *** | 9 | High |
| Locher, 2007 [50] | Prospective cohort | **** | ** | *** | 9 | High |
| Takata, 2007 [51] | Prospective cohort | **** | ** | *** | 9 | High |
| Grabowski, 2001 [67] | Retrospective cohort | **** | ** | *** | 9 | High |
Disclaimer/Publisher’s Note: The statements, opinions and data contained in all publications are solely those of the individual author(s) and contributor(s) and not of MDPI and/or the editor(s). MDPI and/or the editor(s) disclaim responsibility for any injury to people or property resulting from any ideas, methods, instructions or products referred to in the content. |
© 2023 by the authors. Licensee MDPI, Basel, Switzerland. This article is an open access article distributed under the terms and conditions of the Creative Commons Attribution (CC BY) license (https://creativecommons.org/licenses/by/4.0/).
Share and Cite
Dramé, M.; Godaert, L. The Obesity Paradox and Mortality in Older Adults: A Systematic Review. Nutrients 2023, 15, 1780. https://doi.org/10.3390/nu15071780
Dramé M, Godaert L. The Obesity Paradox and Mortality in Older Adults: A Systematic Review. Nutrients. 2023; 15(7):1780. https://doi.org/10.3390/nu15071780
Chicago/Turabian StyleDramé, Moustapha, and Lidvine Godaert. 2023. "The Obesity Paradox and Mortality in Older Adults: A Systematic Review" Nutrients 15, no. 7: 1780. https://doi.org/10.3390/nu15071780