Article

The Association between Caffeine Intake and the Colonic Mucosa-Associated Gut Microbiota in Humans—A Preliminary Investigation

1
Department of Dermatology, Baylor College of Medicine, Houston, TX 77030, USA
2
The Alkek Center for Metagenomics and Microbiome Research, Department of Molecular Virology and Microbiology, Baylor College of Medicine, Houston, TX 77030, USA
3
Department of Medicine, Baylor College of Medicine, Houston, TX 77030, USA
4
Texas Medical Center Digestive Disease Center, Houston, TX 77030, USA
5
Dan L Duncan Comprehensive Cancer Center, Baylor College of Medicine, Houston, TX 77030, USA
6
Center for Innovations in Quality, Effectiveness and Safety, Michael E. DeBakey VA Medical Center, Houston, TX 77021, USA
7
Section of Gastroenterology, Michael E. DeBakey VA Medical Center, Houston, TX 77030, USA
8
Deming Department of Medicine, Tulane University School of Medicine, New Orleans, LA 70112, USA
*
Author to whom correspondence should be addressed.
Current address: Harris County Public Health, Houston, TX 77002, USA.
Nutrients 2023, 15(7), 1747; https://doi.org/10.3390/nu15071747
Submission received: 1 March 2023 / Revised: 29 March 2023 / Accepted: 29 March 2023 / Published: 3 April 2023
(This article belongs to the Section Nutrition and Metabolism)

Abstract

:
We examined the association between caffeine and coffee intake and the community composition and structure of colonic microbiota. A total of 34 polyp-free adults donated 97 colonic biopsies. Microbial DNA was sequenced for the 16S rRNA gene V4 region. The amplicon sequence variant was assigned using DADA2 and SILVA. Food consumption was ascertained using a food frequency questionnaire. We compared the relative abundance of taxonomies by low (<82.9 mg) vs. high (≥82.9 mg) caffeine intake and by never or <2 cups vs. 2 cups vs. ≥3 cups coffee intake. False discovery rate-adjusted p values (q values) <0.05 indicated statistical significance. Multivariable negative binomial regression models were used to estimate the incidence rate ratio and its 95% confidence interval of having a non-zero count of certain bacteria by intake level. Higher caffeine and coffee intake was related to higher alpha diversity (Shannon index p < 0.001), higher relative abundance of Faecalibacterium and Alistipes, and lower relative abundance of Erysipelatoclostridium (q values < 0.05). After adjustment of vitamin B2 in multivariate analysis, the significant inverse association between Erysipelatoclostridium count and caffeine intake remained statistically significant. Our preliminary study could not evaluate other prebiotics in coffee.

1. Introduction

Caffeine has been widely consumed in food and drink for centuries. Caffeine is well known for stimulating wakefulness, alertness, and energy. Caffeine has been associated with decreased risk of cardiovascular disease, Parkinson’s disease, and type 2 diabetes mellitus [1,2]. Some gastrointestinal health benefits from caffeine include decreased odds of ulcerative colitis and acute colitis development with in vitro and in vivo studies [3,4], reduced hepatic fibrosis in patients with mild to advanced hepatic fibrosis [5,6], and lower risk of developing colorectal cancer [7].
Caffeine is known to antagonize the adenosine A1 and A2a receptors, mobilize intracellular calcium in muscle tissue, and inhibit phosphodiesterases and gamma-aminobutyric acid receptors, leading to increased catecholamine synthesis and turnover in the body and enhanced secretion of dopamine, serotonin, and acetylcholine in the central nervous system [8]. While these effects could explain caffeine’s neuropsychiatric effects, they do not readily explain caffeine’s effects on cancer, cardiovascular disease, liver disease, and diabetes.
Previous studies have suggested that coffee modulates gut microbiota. One study showed that coffee intake decreased the relative abundance of Prevotella in fecal samples in a mouse model [9]. In contrast, another study in humans showed that heavy coffee consumers (45–500 mL/daily) had higher fecal Prevotella abundance [10]. Prevotella has a complex association with inflammation and obesity. Another study showed that 16 adults who consumed three cups of coffee daily for three weeks had an increased abundance of anti-inflammatory Bifidobacterium in their feces [11]. However, the association between the intake of phytochemicals in coffee, such as caffeine, and gut microbiota has not been well established in either experimental models or humans.
In this cross-sectional study, we compared the community composition and structure of the colonic adherent microbiota based on caffeine intake using 16S rRNA gene sequencing among 34 individuals with endoscopically normal colons. We hypothesized that individuals with higher caffeine intake could have different microbial community composition and structure compared to those with lower caffeine intake. Because coffee is the major source of caffeine [12], we also evaluated the association between coffee consumption and gut microbiota in the present study. Better knowledge of the association between caffeine and coffee intake and the gut microbiota may help refine dietary guidance.

2. Materials and Methods

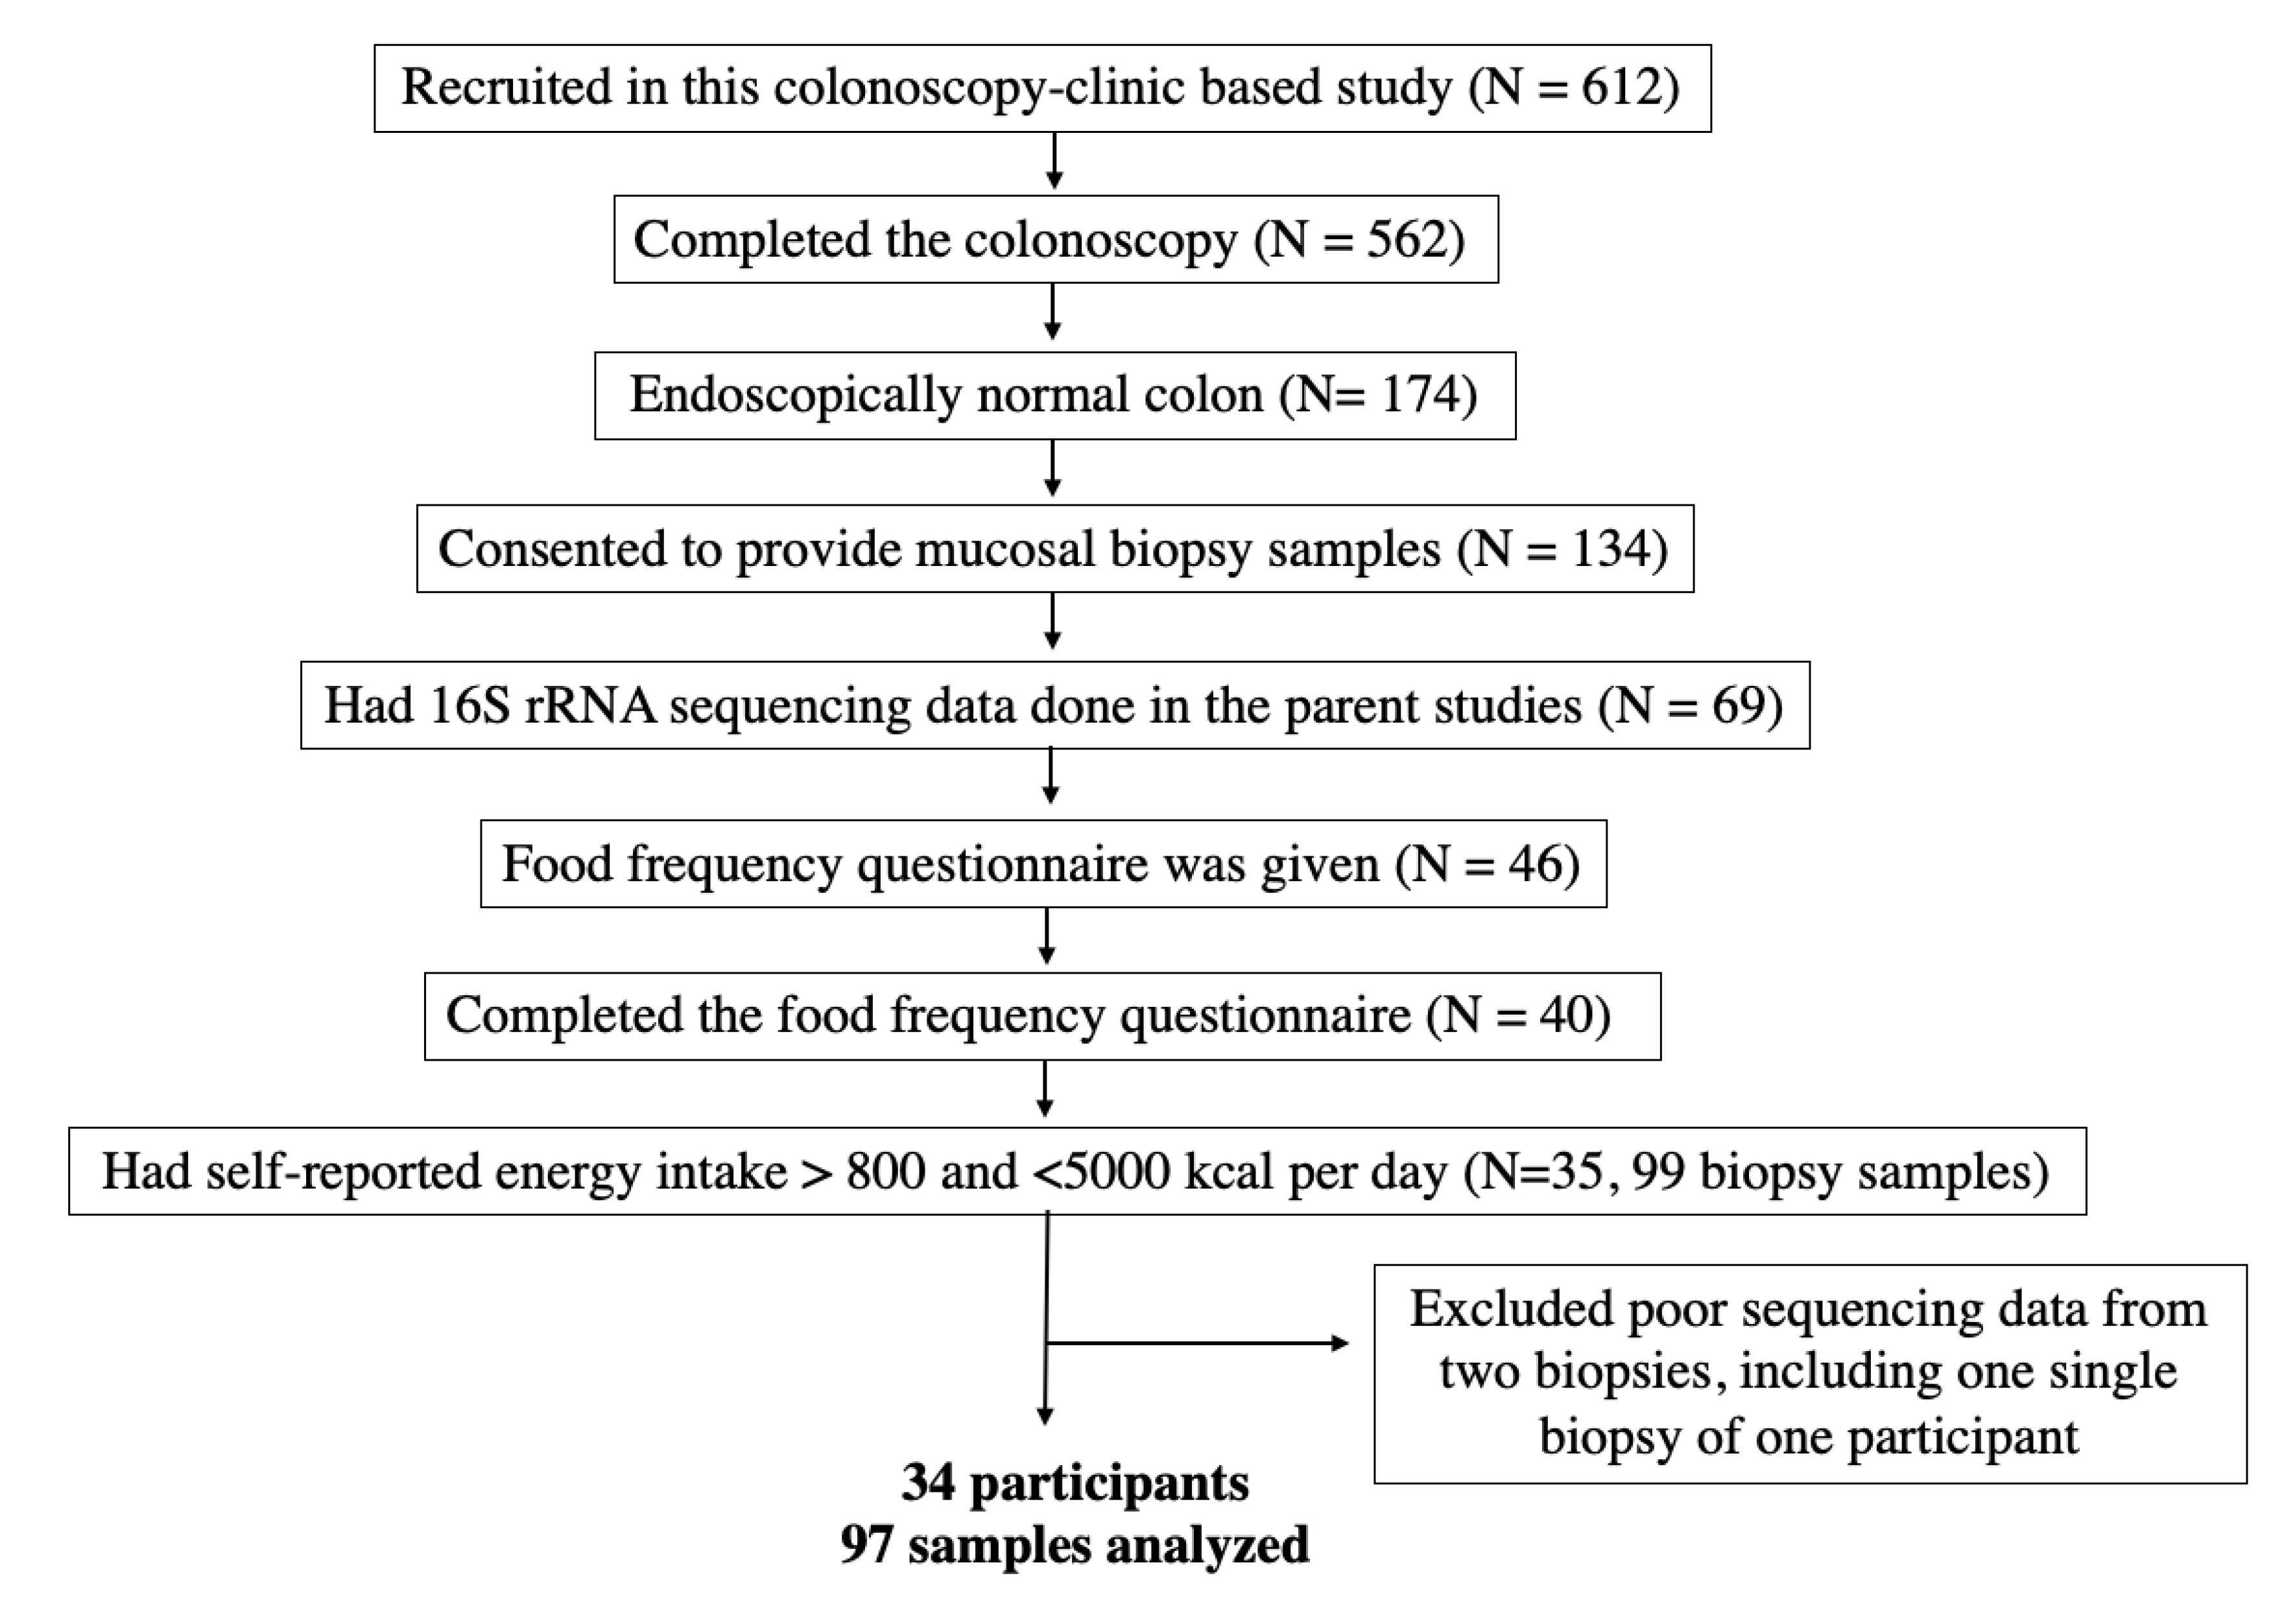
2.1. Study Participants

Participants were recruited at the endoscopy suite of the Michael E. DeBakey VA Medical Center (MEDVAMC) in Houston, Texas, between July 2013 and April 2017. The study cohort, study design, and exclusion criteria were described in detail previously [13]. Individuals were eligible to be enrolled in the study if they were between 50 and 75 years of age. Individuals were ineligible if they had the following: (1) hereditary polyposis syndromes such as familial adenomatous polyposis and hereditary non-polyposis colon cancer; (2) inflammatory bowel disease; (3) invasive cancer except for non-melanoma skin cancer; (4) colorectal polyps in the past three years; (5) end-stage renal disease requiring dialysis; (6) severe mental disabilities; (7) hospitalization within the past year; (8) oral or systemic use of antibiotics in the past three months; (9) hepatitis B or C infections; (10) HIV or methicillin-resistant Staphylococcus aureus-positive infection; or (11) contraindications to obtaining mucosal biopsies.
The study protocol was approved by the Institutional Review Board of Baylor College of Medicine (BCM) and MEDVAMC. All procedures performed in studies involving human participants were in accordance with the ethical standards of the institutional and/or national research committee and with the 1964 Helsinki Declaration and its later amendments or comparable ethical standards. The research coordinator obtained informed consent from participants during their attendance at an educational session 1–2 weeks before the colonoscopy.

2.2. Data Collection

After obtaining informed consent, the research coordinator administered a questionnaire collecting information on lifestyle, social history, and medical history. We assessed caffeine intake and the number of cups of coffee consumed in the past 12 months using the validated self-administered Block Food Frequency Questionnaire (FFQ) 2005 [14]. Participants answered questions on daily liquid intake, including “how often did you drink coffee, regular or decaf in the past year” and “how many cups did you drink per day in the past year?”. All categories were combined to arrive at aggregate caffeine intake by Nutritionquest. Caffeine intake (mg/day) was derived from coffee, hot tea, iced tea, and 40 other food items. All diet and nutrient variables were energy-adjusted using the density method. The healthy eating index (HEI) 2015 was used to score dietary quality [15].

2.3. Colonoscopy and Biopsy Requirement

Participants were advised to stop taking aspirin, anti-inflammatory drugs, blood thinners, iron, or vitamins with iron seven days before the procedure and to stop diabetic medication one day before the procedure [13]. Participants took 3.78 L of polyethylene glycol (Golytely) the night before the colonoscopy. During the procedure, endoscopists obtained biopsies from each colonic segment (cecum, ascending, transverse, descending, sigmoid colon, or rectum) when possible.
We enrolled 612 eligible participants in the study. Of 174 participants who were confirmed polyp-free, 134 consented to provide colonic mucosal biopsies. Samples from 69 polyp-free participants were sent for microbiota profiling. Among those, 40 returned the Block FFQ. Five study participants who had self-reported energy intake <800 or >5000 kcal per day were excluded from the analysis. As a result, the sequencing data of 99 mucosal samples from 35 participants were available for analysis. A flow chart of participant selection and final sample size is shown in Figure 1.

2.4. Microbial DNA Extraction and 16S rRNA Gene Sequencing

The library preparation and sequence analysis were performed at the Alkek Center for Metagenomics and Microbiome Research at BCM. Microbial genomic DNA was extracted from biopsies using the MO BIO PowerLyzer UltraClean Tissue & Cell DNA Isolation Kits (MO BIO Laboratories, Claridad, CA, USA). All DNA samples were stored at −80 °C until further analysis.
The 16S rRNA hypervariable region 4 (V4) was amplified using PCR with the barcoded Illumina adaptor-containing primers 515F and 806R and sequenced on the MiSeq platform (Illumina, San Diego, CA, USA). The 2 × 250 bp paired-end protocol yielded pair-end reads that overlapped almost completely [16,17,18].

2.5. Bioinformatics and Taxonomic Assignment

We used the in-house bioinformatics pipeline for data analysis. Reads were merged using USEARCH v7.0.1090 [19]. A quality filter was applied to the merged reads, and those containing more than 0.5% expected errors were discarded. We used the Divisive Amplicon Denoising Algorithm 2 (DADA2) v1.10.1 package in R v3.3.3 to classify the bacteria using the amplicon sequence variants (ASVs). The ASVs were mapped to the SILVA v128 to determine taxonomies [20,21]. A rarefaction curve, using a factor of 4356, was constructed using the sequence data for each sample to ensure that we sampled most of its microbial diversity. Following rarefaction, two mucosal samples with poor sequence reads were lost, including one sample from a participant who contributed one piece of biopsy. Therefore, we included 97 mucosal samples of 34 participants in the final analysis (Figure 1).

2.6. Statistical Analysis
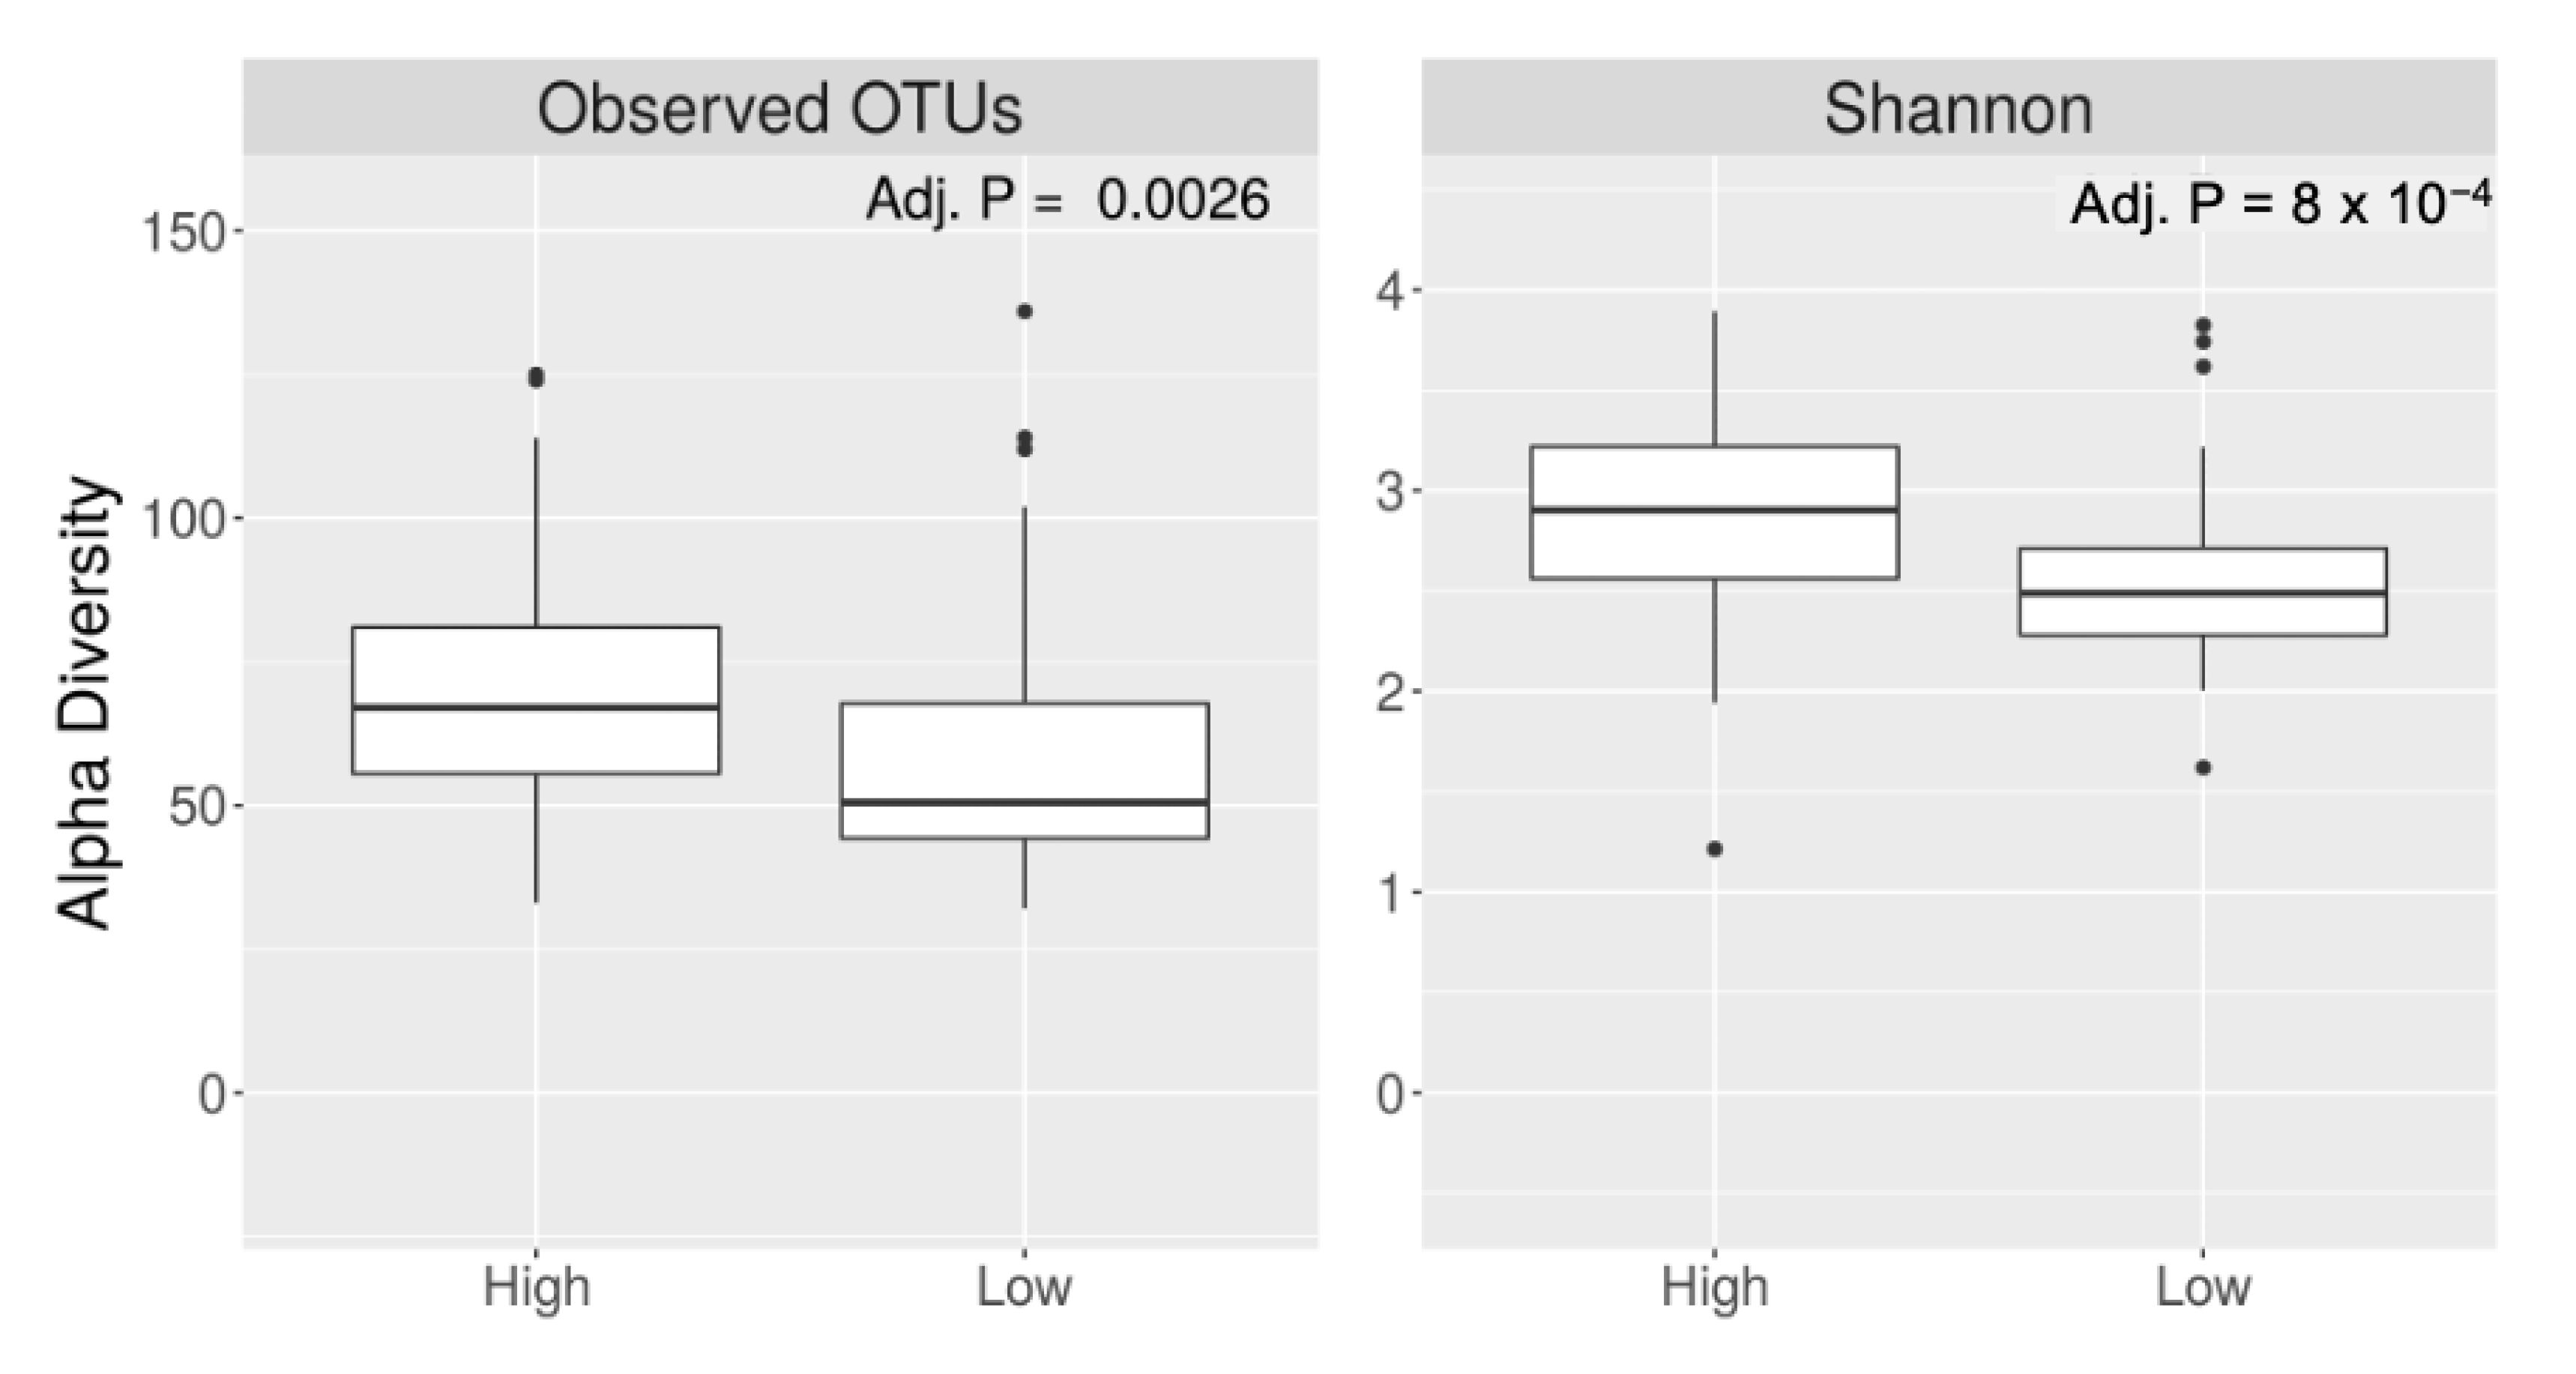
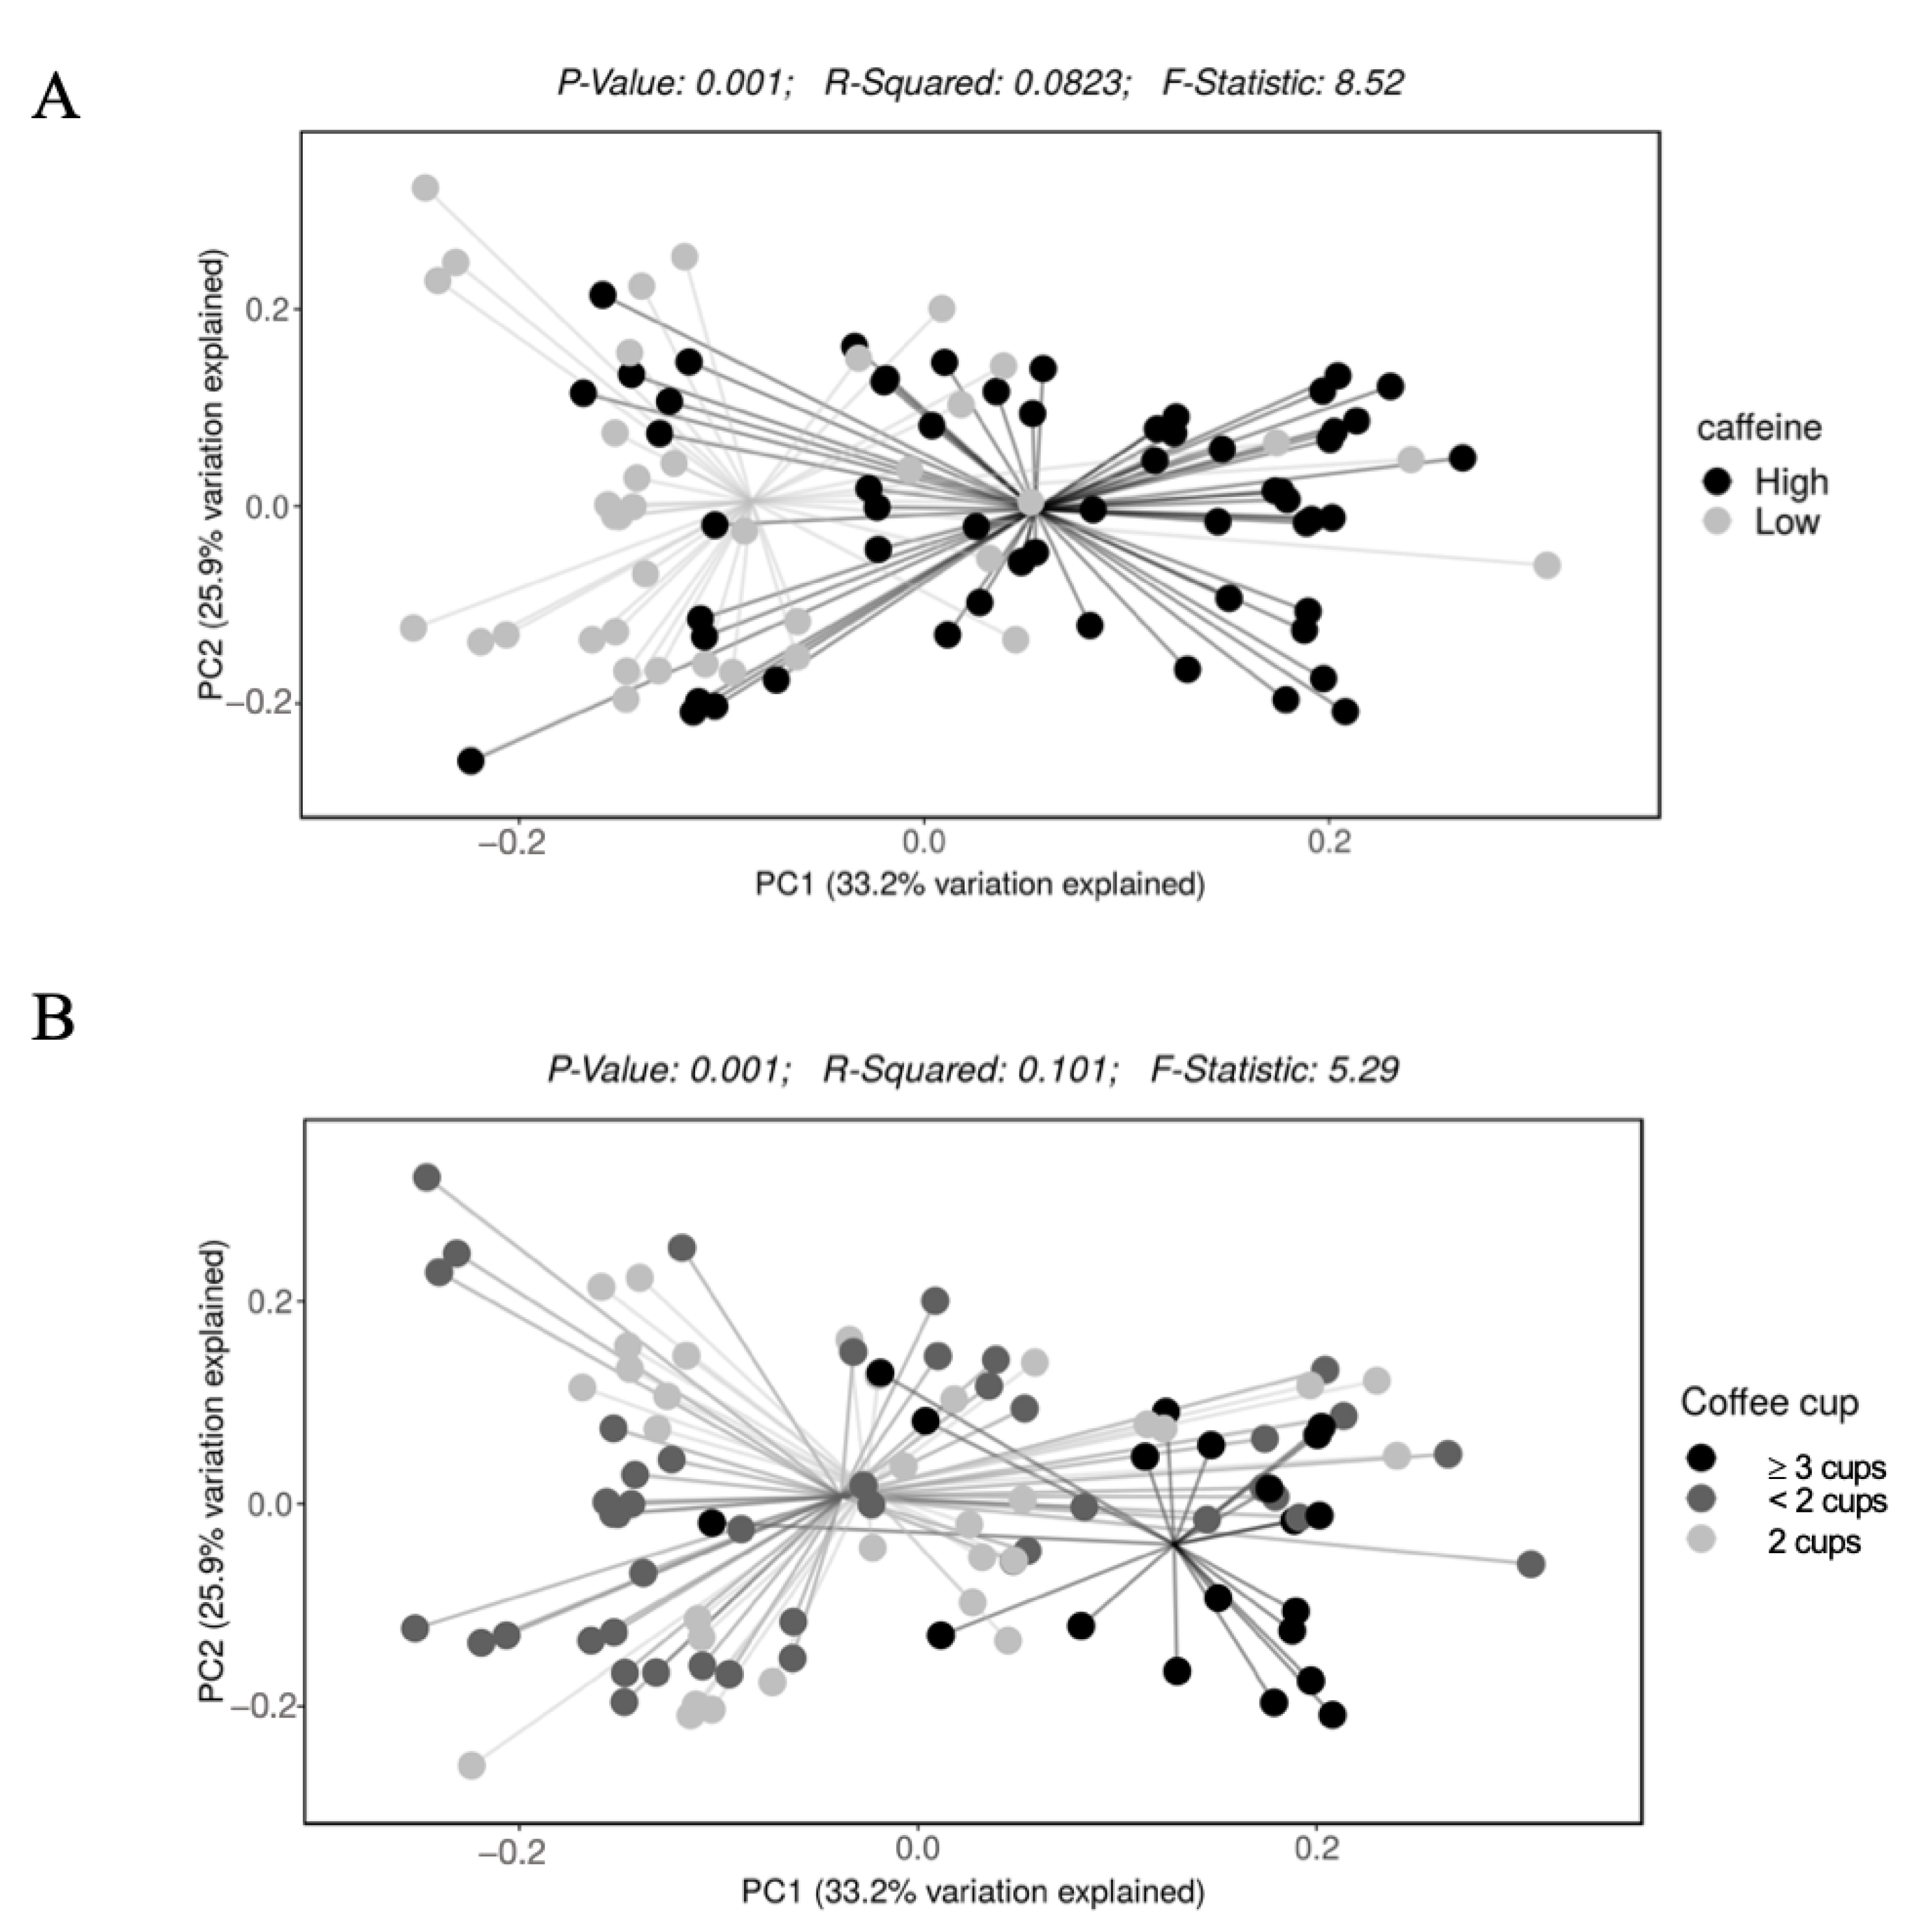
Caffeine intake was categorized into higher vs. lower based on the median consumption of the 34 participants, 82.9 mg per day. The standard amount of caffeine in 5 ounces of coffee is 85 mg [22]. Coffee intake was categorized into “<2 cups (16 oz)”, “2 cups”, and “≥3 cups (24 oz)”.
The study participants’ sociodemographic and clinical characteristics and nutrient intake were compared based on caffeine and coffee intake using Fisher’s exact test, Student’s t test, or ANOVA. The bacterial alpha diversity (the number of observed OTUs and Shannon Index) and the relative abundance of taxa were compared based on the intake of caffeine and coffee using a Wilcoxon test or Kruskal–Wallis test when appropriate. PERMANOVA with weighted UniFrac dissimilarity and principal-coordinate analysis were carried out for microbial beta diversity analyses [23]. The Monte Carlo permutation test was performed to estimate p values. For bacteria with a relative abundance >1% that differed significantly (q < 0.05) by both caffeine and coffee intake, we used multivariable negative binomial regression models for panel data to examine the incidence rate ratio (IRR) and its 95% confidence interval (CI) of having non-zero bacterial count in those with higher intake of caffeine or coffee compared with those with a lower intake, adjusting for age (continuous), ethnicity (non-Hispanic white, non-Hispanic African American, and Hispanic), body mass index (BMI) (continuous), smoking (never, former, and current), alcohol use (never, former, and current), HEI score (continuous), and colon segments. Intakes of other nutrients, including total fat, total carbohydrate, total protein, and vitamin B family (vitamin B2, B6, and B12), were also evaluated as potential confounding factors. Vitamin B2 intake was adjusted in the multivariate model in addition to HEI because it differed significantly by caffeine intake and was associated with the relative abundance and count of gut bacteria [24]. Coffee intake was modeled as a continuous variable in the multivariable model. We treated each participant as a panel because some participants contributed multiple biopsies to the analysis.
We used STATA 16.0 (Stata Corp LLC, College Station, TX, USA) and R program for data analysis. All tests were two-sided. A p value < 0.05 indicated statistical significance. In the microbiota analysis, all p values were adjusted for multiple comparisons using the false discovery rate (FDR) algorithm [25]. FDR p values (q values) < 0.05 indicated statistical significance.

3. Results

The average caffeine intake was 39.2 mg in those who had a “lower intake” and 138.9 mg in those who had a “higher intake”. The differences in the distribution of patients’ characteristics, lifestyle factors, HEI score, and intake of macronutrients by caffeine intake (Table 1) and coffee intake (Supplemental Table S1) were largely not statistically significant. Participants who had a higher caffeine intake had a statistically insignificant higher BMI than those who had a lower intake (35.2 vs. 32.6 kg/m2, p value = 0.25). However, daily vitamin B2 (riboflavin) and vitamin B6 intake was significantly higher among participants with higher caffeine intake (Table 1). Daily vitamin B2 intake was significantly higher in participants with more coffee consumption (Supplemental Table S1).
Participants with higher caffeine intake had a higher alpha diversity (Shannon index, q value < 0.001) (Figure 2). Alpha diversity did not differ by coffee intake (q = 0.19 for Shannon index). Bacterial beta diversity, i.e., bacterial community composition, also differed significantly based on the intake of caffeine (panel A) and coffee (panel B) (Figure 3).
We did not observe a significant difference in the relative abundance of bacterial phyla based on caffeine intake. At the family level, compared to lower caffeine intake, higher caffeine intake was related to a higher relative abundance of Ruminococcaceae (9.32% vs. 16.7%) and a lower relative abundance of Erysipelotrichaceae (4.25% vs. 1.56%) (q values < 0.05). At the genus level, higher caffeine intake was related to a higher relative abundance of Faecalibacterium, Alistipes, Subdoligranulum, and Prevotella but a lower relative abundance of Erysipelatoclostridium and Lachnospiraceae (ASV0006) (q values < 0.05) (Table 2). Higher coffee intake (more than 2 cups) was related to a higher relative abundance of Faecalibacterium and Alistipes (q values < 0.05) and a lower relative abundance of Erysipelatoclostridium (Table 2). Supplemental Figure S1 shows that many members of Lachnospiraceae family differed by caffeine intake.
In the multivariable negative binomial regression models, the incidence rate of having a non-zero count of Alistipes (IRR: 3.05, 95% CI: 1.10–8.48) and Faecalibacterium (IRR: 5.28; 95% CI: 2.68–10.4) was higher and the incidence rate of having a non-zero count of Erysipelatoclostridium (IRR: 0.07; 95% CI: 0.02–0.25) was lower in those who had higher caffeine intake compared to those who had lower caffeine intake. Higher coffee intake was associated with higher Alistipes (IRR: 2.84; 95% CI: 1.38–5.84) and Faecalibacterium (IRR: 2.35; 95% CI: 1.50–3.68) and lower Erysipelatoclostridium (IRR: 0.24; 95% CI: 0.07–0.84). Adjusting for total energy intake, BMI, and macronutrients in the analyses did not change the rate ratio estimate. However, the associations between Faecalibacterium, Alistipes, and caffeine and coffee intake were attenuated after adjustment of vitamin B2. There were also no significant associations between bacterial count and coffee intake. There was a statistically significant inverse association between Erysipelatoclostridium count and caffeine intake (IRR: 0.02; 95% CI: 0.003–0.17, q value < 0.05) (Table 3). In addition, adjusting for vitamin B6 in the model slightly attenuated the association between Alistipes count and caffeine intake, and adjusting for vitamin B12 in the model slightly attenuated the association between Faecalibacterium count and caffeine intake.

4. Discussion

This cross-sectional study showed that the colonic mucosa-associated bacteria differed significantly in the community composition and structure based on daily caffeine and coffee intake in adults. Higher caffeine and coffee intake was associated with higher richness and evenness of gut microbiota, a higher relative abundance of Faecalibacterium and Alistipes, and a lower relative abundance of Erysipelatoclostridium independent of multiple covariates. However, further multivariate analysis showed that vitamin B2 intake partially explained such observations. The association between Erysipelatoclostridium count and caffeine intake remained statistically significant after vitamin B2 intake was adjusted in the analysis. There was no significant association between bacterial count and coffee intake in multivariate models.
Our study showed that higher caffeine intake, but not coffee consumption, was associated with higher alpha diversity, i.e., richness and evenness of the gut bacteria in the colonic mucosa. In a Dutch population-based cohort study, coffee was shown to be associated with higher microbial alpha diversity. However, this study did not evaluate the association between phytochemicals in coffee and gut microbiota [26]. The beta diversity analysis showed a significant dissimilarity of bacterial community composition based on both caffeine intake and coffee consumption. Studies have associated lower alpha diversity with adverse health outcomes, such as a higher risk of colorectal cancer [27] and inflammatory bowel disease [28]. Whether caffeine could affect health outcomes through modulating gut microbiota biodiversity should be evaluated further.
We observed that higher caffeine intake and higher coffee consumption were related to a higher relative abundance of Faecalibacterium. A previous study showed increased Faecalibacterium species after mice fed a high-fat diet were treated with a caffeine-rich Chinese tea [29]. Faecalibacterium is a butyrate-producing bacterium [30] that has been shown to have positive impacts on human energy metabolism [31], and its anti-inflammatory properties have been shown [32]. Higher caffeine intake was also associated with a higher relative abundance of Alistipes, which belongs to Bacteroidetes phylum. Alistipes has been shown to be more abundant in populations with animal-based diets than in those with plant-based diets. It is more bile-tolerant and capable of protein breakdown [33]. Alistipes has been associated with both favorable and adverse health outcomes. Previous studies showed an inverse correlation between Alistipes and obesity [34], ulcerative colitis [35], and Clostridium difficile infection [36]. Conversely, an increased abundance of Alistipes has been associated with a higher frequency of abdominal pain in pediatric patients with irritable bowel syndrome [37]. It is noted that the adjustment of dietary vitamin B2 intake attenuated the association between caffeine and coffee intake and Faecalibacterium and Alistipes. Whether Faecalibacterium and Alistipes are independently modulated by caffeine in the colonic mucosa and the interaction between vitamin B2 and the colonic microenvironment should be further investigated.
Participants with lower caffeine intake had higher relative abundances of the Gram-positive obligate-anaerobe Erysipelotrichaceae family and Erysipelatoclostridium genus than those with higher caffeine intake. This observation remained statistically significant in multivariate analysis controlling vitamin B2 intake. Erysipelatoclostridium belongs to Firmicutes phylum. Higher Erysipelatoclostridium levels have been linked to diet-induced obesity in mouse models [38] and obesity in humans [39,40]. A previous study showed that patients with type 2 diabetes had higher Erysipelotrichaceae levels than patients with normal glucose tolerance [41]. There is growing evidence showing the adverse roles of Erysipelotrichaceae and Erysipelatoclostridium play in host lipid metabolism [42], immune response [43], inflammation [44], depression [45], metabolic-associated fatty liver disease [46], cancer [47], and response to cancer immune therapy [48,49]. However, in a human-based study, increased physical activity was associated with a higher relative abundance of Erysipelotrichaceae [50]. Nevertheless, given most studies have shown the detrimental effect of Erysipelatoclostridium on health, identifying pre- and probiotics that deplete this bacterium would be beneficial. It remains to be determined whether caffeine influences insulin resistance or metabolic diseases by modulating Erysipelatoclostridium.
As alluded to above, coffee has been shown to beneficially modulate human metabolic health by lowering the risks of obesity, type 2 diabetes, and metabolic syndrome [51,52,53]. The bioactive components in coffee include phenolic compounds (chlorogenic acids (CGAs)), alkaloids (caffeine and trigonelline), and diterpenes (cafestol and kahweol) [54]. One fecal microbial study of 147 patients found that polyphenol intake was similar between lower and higher coffee consumers. The author hypothesized that low coffee consumers could obtain polyphenols through other sources [10]. Several studies investigated the influence of caffeine, polyphenols, and CGAs on the gut microbiota. One in vitro colonic metabolism study found that coffee with the highest CGA levels induced a significant 0.5 logarithmic increase in the growth of Bifidobacterium spp. [55]. CGAs significantly increased the growth of Bifidobacterium spp. and Clostridium coccoides/Eubacterium rectale in a colonic microbiota culture model [55] and a human interventional study [56]. However, our study could not confirm the previous observation on Bifidobacterium and coffee intake [11]. The relative abundance of Bifidobacterium in the colonic mucosa was less than 0.50% in our study samples. Nevertheless, our study showed that the relative abundance of Prevotella was higher with a higher intake of caffeine and coffee. This observation was consistent with a human-based study that showed higher coffee consumers (45–500 mL/daily) had higher fecal Prevotella abundance [10]. However, it was not in line with an animal-based study that shows the opposite [9]. In summary, our preliminary study could not exclude the possibility that other nutrients in coffee, such as CGAs, polyphenols, and vitamin B family may have explained the association between coffee intake and gut microbiota composition and structure. Adjusting for dietary intake of vitamin B2 in the multivariate analysis did attenuate the association between gut bacteria and caffeine and coffee intake. It is noted that coffee has abundant vitamin B2.
Our study has uniqueness because we studied the mucosal-associated adherent microbiota using the colonic biopsies taken after bowel preparation. Compared to the luminal gut microbiota, the mucosa-associated adherent microbiota is more likely to interact directly with the immune cells in the mucosa and therefore impact host physiology [57]. Multivariate analysis was used to control for potential confounding effects of lifestyle and dietary factors. The study had some limitations. First, participants were mainly obese elderly or middle-aged white veterans, possibly affecting the generalizability of the findings to the non-veteran general population, women, lean individuals, or younger individuals. Second, study participants were retrospectively asked about their food consumption, which could introduce information bias. The caffeine intake was quantified by using 43 food items in the questionnaire. However, we could not exclude the possibility of measurement error in quantitating caffeine intake. Third, selection bias was likely as not all participants responded to the FFQ. Fourth, the relative abundance of multiple members in Lachnospiraceae family differed by caffeine intake. Metagenomic shotgun sequencing and metabolomics study should be conducted to define the bacterial species and their functions in association with coffee and caffeine intake. Lastly, the present analysis was based on a small sample size and was cross-sectional by nature. By virtue of these study limitations, the findings should be considered preliminary.
In summary, our study sheds light on the associations between caffeine intake and coffee consumption and the gut microbiota of individuals with endoscopically normal colons. The association between caffeine, gut microbiota, and health outcomes and the role of Erysipelatoclostridium in metabolic diseases deserves further investigation. In addition, the health effect of coffee may be partially explained by prebiotic vitamin B2. Future nutrigenomic and metabolomic studies are needed to identify who will benefit from coffee consumption. If we can understand how phytochemicals and nutrients maintain gut symbiosis and how they impact human physiology, we could uncover a novel mechanism for disease prevention.

Supplementary Materials

The following supporting information can be downloaded at: https://www.mdpi.com/article/10.3390/nu15071747/s1, Table S1: Basic characteristics of study participants based on coffee consumption. Figure S1: The relative abundance (%) of bacterial genera (relative abundance > 0.5%) that significantly differed (q values < 0.05) based on caffeine intake.

Author Contributions

Conceptualization, L.J. and J.F.P.; methodology, K.H., J.F.P. and L.J.; software, K.H. and J.F.P.; validation, K.H. and J.F.P.; formal analysis, L.J. and K.H.; investigation, L.J., D.L.W., F.K., H.B.E.-S. and J.F.P.; resources, F.K. and H.B.E.-S.; data curation, L.J.; writing—original draft preparation, A.D., A.A.X., S.G., A.J. and L.J.; writing—review and editing, A.D., A.A.X., S.G., F.K., A.J., H.B.E.-S., J.F.P., L.J. and D.L.W.; visualization, L.J.; supervision, L.J. and H.B.E.-S.; project administration, L.J.; funding acquisition, L.J. and J.F.P. All authors have read and agreed to the published version of the manuscript.

Funding

This study was supported by the Cancer Prevention and Research Institute of Texas (RP#140767, PI: Jiao, L; Petrosino, J), Gillson Longenbaugh Foundation, Golfers against Cancer organization (PI: Jiao, L), the Houston Veterans Affairs Health Services Research Center of Innovations (CIN13-413), and the National Institute of Diabetes and Digestive and Kidney Diseases (P30 DK56338, PI: El-Serag, HB). White receives research salary support from the U.S. Department of Veterans Affairs (CX001430. PI: White DL). The opinions expressed reflect those of the authors and not necessarily those of the Department of Veterans Affairs, the US government, or Baylor College of Medicine. The funding sources had no role in the study design, collection, analysis, data interpretation, and writing.

Institutional Review Board Statement

The study was conducted in accordance with the Declaration of Helsinki and approved by the Institutional Review Board (or Ethics Committee) of Baylor College of Medicine (BCM) and Michael E. DeBakey VA Medical Center (MEDVAMC) (protocol code H30941, originally approved on 3 May 2013, and then 1 April 2021).

Informed Consent Statement

Informed consent was obtained from all subjects involved in the study.

Data Availability Statement

Data available on request due to local policy on privacy.

Acknowledgments

We thank David Ramsey at Baylor College of Medicine for data management. We thank Jocelyn Uriostegui, Sarah Plew, Ashley Johnson, Ava Smith, Preksha Shah, Kathryn Royse, and Mahmoud Al-Saadi for collecting and processing samples.

Conflicts of Interest

The authors declare no conflict of interest.

References

  1. Grosso, G.; Godos, J.; Galvano, F.; Giovannucci, E.L. Coffee, Caffeine, and Health Outcomes: An Umbrella Review. Annu. Rev. Nutr. 2017, 37, 131–156. [Google Scholar] [CrossRef] [PubMed] [Green Version]
  2. Jiang, X.; Zhang, D.; Jiang, W. Coffee and caffeine intake and incidence of type 2 diabetes mellitus: A meta-analysis of prospective studies. Eur. J. Nutr. 2014, 53, 25–38. [Google Scholar] [CrossRef]
  3. Almofarreh, A.; Sheerah, H.A.; Arafa, A.; Ahamed, S.S.; Alzeer, O.; Al-Hunaishi, W.; Mhimed, M.M.; Al-Hazmi, A.; Lim, S.H. Beverage Consumption and Ulcerative Colitis: A Case-Control Study from Saudi Arabia. Int. J. Environ. Res. Public Health 2022, 19, 2287. [Google Scholar] [CrossRef] [PubMed]
  4. Lee, I.A.; Low, D.; Kamba, A.; Llado, V.; Mizoguchi, E. Oral caffeine administration ameliorates acute colitis by suppressing chitinase 3-like 1 expression in intestinal epithelial cells. J. Gastroenterol. 2014, 49, 1206–1216. [Google Scholar] [CrossRef] [PubMed] [Green Version]
  5. Barre, T.; Fontaine, H.; Ramier, C.; Di Beo, V.; Pol, S.; Carrieri, P.; Marcellin, F.; Cagnot, C.; Dorival, C.; Zucman-Rossi, J.; et al. Elevated coffee consumption is associated with a lower risk of elevated liver fibrosis biomarkers in patients treated for chronic hepatitis B (ANRS CO22 Hepather cohort). Clin. Nutr. 2022, 41, 610–619. [Google Scholar] [CrossRef] [PubMed]
  6. Shan, L.; Wang, F.; Zhai, D.; Meng, X.; Liu, J.; Lv, X. Caffeine in liver diseases: Pharmacology and toxicology. Front. Pharmacol. 2022, 13, 1030173. [Google Scholar] [CrossRef]
  7. Schmit, S.L.; Rennert, H.S.; Rennert, G.; Gruber, S.B. Coffee Consumption and the Risk of Colorectal Cancer. Cancer Epidemiol. Biomark. Prev. Publ. Am. Assoc. Cancer Res. Cosponsored Am. Soc. Prev. Oncol. 2016, 25, 634–639. [Google Scholar] [CrossRef] [Green Version]
  8. Fiani, B.; Zhu, L.; Musch, B.L.; Briceno, S.; Andel, R.; Sadeq, N.; Ansari, A.Z. The Neurophysiology of Caffeine as a Central Nervous System Stimulant and the Resultant Effects on Cognitive Function. Cureus 2021, 13, e15032. [Google Scholar] [CrossRef]
  9. Nishitsuji, K.; Watanabe, S.; Xiao, J.; Nagatomo, R.; Ogawa, H.; Tsunematsu, T.; Umemoto, H.; Morimoto, Y.; Akatsu, H.; Inoue, K.; et al. Effect of coffee or coffee components on gut microbiome and short-chain fatty acids in a mouse model of metabolic syndrome. Sci. Rep. 2018, 8, 16173. [Google Scholar] [CrossRef] [Green Version]
  10. Gonzalez, S.; Salazar, N.; Ruiz-Saavedra, S.; Gomez-Martin, M.; de Los Reyes-Gavilan, C.G.; Gueimonde, M. Long-Term Coffee Consumption is Associated with Fecal Microbial Composition in Humans. Nutrients 2020, 12, 1287. [Google Scholar] [CrossRef]
  11. Jaquet, M.; Rochat, I.; Moulin, J.; Cavin, C.; Bibiloni, R. Impact of coffee consumption on the gut microbiota: A human volunteer study. Int. J. Food Microbiol. 2009, 130, 117–121. [Google Scholar] [CrossRef] [PubMed]
  12. Heckman, M.A.; Weil, J.; Gonzalez de Mejia, E. Caffeine (1, 3, 7-trimethylxanthine) in foods: A comprehensive review on consumption, functionality, safety, and regulatory matters. J. Food Sci. 2010, 75, R77–R87. [Google Scholar] [CrossRef] [PubMed]
  13. Xu, A.A.; Kennedy, L.K.; Hoffman, K.; White, D.L.; Kanwal, F.; El-Serag, H.B.; Petrosino, J.F.; Jiao, L. Dietary Fatty Acid Intake and the Colonic Gut Microbiota in Humans. Nutrients 2022, 14, 2722. [Google Scholar] [CrossRef] [PubMed]
  14. Subar, A.F.; Thompson, F.E.; Kipnis, V.; Midthune, D.; Hurwitz, P.; McNutt, S.; McIntosh, A.; Rosenfeld, S. Comparative validation of the Block, Willett, and National Cancer Institute food frequency questionnaires: The Eating at America’s Table Study. Am. J. Epidemiol. 2001, 154, 1089–1099. [Google Scholar] [CrossRef] [Green Version]
  15. Reedy, J.; Lerman, J.L.; Krebs-Smith, S.M.; Kirkpatrick, S.I.; Pannucci, T.E.; Wilson, M.M.; Subar, A.F.; Kahle, L.L.; Tooze, J.A. Evaluation of the Healthy Eating Index-2015. J. Acad. Nutr. Diet. 2018, 118, 1622–1633. [Google Scholar] [CrossRef]
  16. The Human Microbiome Project Consortium. A framework for human microbiome research. Nature 2012, 486, 215–221. [Google Scholar] [CrossRef] [Green Version]
  17. The Human Microbiome Project Consortium. Structure, function and diversity of the healthy human microbiome. Nature 2012, 486, 207–214. [Google Scholar] [CrossRef] [Green Version]
  18. Caporaso, J.G.; Lauber, C.L.; Walters, W.A.; Berg-Lyons, D.; Huntley, J.; Fierer, N.; Owens, S.M.; Betley, J.; Fraser, L.; Bauer, M.; et al. Ultra-high-throughput microbial community analysis on the Illumina HiSeq and MiSeq platforms. ISME J. 2012, 6, 1621–1624. [Google Scholar] [CrossRef] [Green Version]
  19. Edgar, R.C. Search and clustering orders of magnitude faster than BLAST. Bioinformatics 2010, 26, 2460–2461. [Google Scholar] [CrossRef] [Green Version]
  20. Quast, C.; Pruesse, E.; Yilmaz, P.; Gerken, J.; Schweer, T.; Yarza, P.; Peplies, J.; Glockner, F.O. The SILVA ribosomal RNA gene database project: Improved data processing and web-based tools. Nucleic Acids Res. 2013, 41, D590–D596. [Google Scholar] [CrossRef]
  21. Edgar, R.C. UPARSE: Highly accurate OTU sequences from microbial amplicon reads. Nat. Methods 2013, 10, 996–998. [Google Scholar] [CrossRef] [PubMed]
  22. Barone, J.J.; Roberts, H.R. Caffeine consumption. Food Chem. Toxicol. Int. J. Publ. Br. Ind. Biol. Res. Assoc. 1996, 34, 119–129. [Google Scholar] [CrossRef]
  23. Lozupone, C.; Lladser, M.E.; Knights, D.; Stombaugh, J.; Knight, R. UniFrac: An effective distance metric for microbial community comparison. ISME J. 2011, 5, 169–172. [Google Scholar] [CrossRef] [PubMed] [Green Version]
  24. Gurwara, S.; Ajami, N.J.; Jang, A.; Hessel, F.C.; Chen, L.; Plew, S.; Wang, Z.; Graham, D.Y.; Hair, C.; White, D.L.; et al. Dietary Nutrients Involved in One-Carbon Metabolism and Colonic Mucosa-Associated Gut Microbiome in Individuals with an Endoscopically Normal Colon. Nutrients 2019, 11, 613. [Google Scholar] [CrossRef] [PubMed] [Green Version]
  25. Benjamini, Y.; Yekutieli, D. Quantitative trait Loci analysis using the false discovery rate. Genetics 2005, 171, 783–790. [Google Scholar] [CrossRef] [Green Version]
  26. Zhernakova, A.; Kurilshikov, A.; Bonder, M.J.; Tigchelaar, E.F.; Schirmer, M.; Vatanen, T.; Mujagic, Z.; Vila, A.V.; Falony, G.; Vieira-Silva, S.; et al. Population-based metagenomics analysis reveals markers for gut microbiome composition and diversity. Science 2016, 352, 565–569. [Google Scholar] [CrossRef] [PubMed] [Green Version]
  27. Ahn, J.; Sinha, R.; Pei, Z.; Dominianni, C.; Wu, J.; Shi, J.; Goedert, J.J.; Hayes, R.B.; Yang, L. Human gut microbiome and risk for colorectal cancer. J. Natl. Cancer Inst. 2013, 105, 1907–1911. [Google Scholar] [CrossRef] [Green Version]
  28. Kostic, A.D.; Xavier, R.J.; Gevers, D. The microbiome in inflammatory bowel disease: Current status and the future ahead. Gastroenterology 2014, 146, 1489–1499. [Google Scholar] [CrossRef] [Green Version]
  29. Gao, X.; Xie, Q.; Kong, P.; Liu, L.; Sun, S.; Xiong, B.; Huang, B.; Yan, L.; Sheng, J.; Xiang, H. Polyphenol- and Caffeine-Rich Postfermented Pu-erh Tea Improves Diet-Induced Metabolic Syndrome by Remodeling Intestinal Homeostasis in Mice. Infect. Immun. 2018, 86, e00601-17. [Google Scholar] [CrossRef] [Green Version]
  30. Rios-Covian, D.; Gueimonde, M.; Duncan, S.H.; Flint, H.J.; de los Reyes-Gavilan, C.G. Enhanced butyrate formation by cross-feeding between Faecalibacterium prausnitzii and Bifidobacterium adolescentis. FEMS Microbiol. Lett. 2015, 362, fnv176. [Google Scholar] [CrossRef] [Green Version]
  31. Koh, A.; De Vadder, F.; Kovatcheva-Datchary, P.; Backhed, F. From Dietary Fiber to Host Physiology: Short-Chain Fatty Acids as Key Bacterial Metabolites. Cell 2016, 165, 1332–1345. [Google Scholar] [CrossRef] [PubMed] [Green Version]
  32. Sokol, H.; Pigneur, B.; Watterlot, L.; Lakhdari, O.; Bermudez-Humaran, L.G.; Gratadoux, J.J.; Blugeon, S.; Bridonneau, C.; Furet, J.P.; Corthier, G.; et al. Faecalibacterium prausnitzii is an anti-inflammatory commensal bacterium identified by gut microbiota analysis of Crohn disease patients. Proc. Natl. Acad. Sci. USA 2008, 105, 16731–16736. [Google Scholar] [CrossRef] [PubMed] [Green Version]
  33. David, L.A.; Maurice, C.F.; Carmody, R.N.; Gootenberg, D.B.; Button, J.E.; Wolfe, B.E.; Ling, A.V.; Devlin, A.S.; Varma, Y.; Fischbach, M.A.; et al. Diet rapidly and reproducibly alters the human gut microbiome. Nature 2014, 505, 559–563. [Google Scholar] [CrossRef] [PubMed] [Green Version]
  34. Palleja, A.; Kashani, A.; Allin, K.H.; Nielsen, T.; Zhang, C.; Li, Y.; Brach, T.; Liang, S.; Feng, Q.; Jorgensen, N.B.; et al. Roux-en-Y gastric bypass surgery of morbidly obese patients induces swift and persistent changes of the individual gut microbiota. Genome Med. 2016, 8, 67. [Google Scholar] [CrossRef] [PubMed] [Green Version]
  35. Alipour, M.; Zaidi, D.; Valcheva, R.; Jovel, J.; Martinez, I.; Sergi, C.; Walter, J.; Mason, A.L.; Wong, G.K.; Dieleman, L.A.; et al. Mucosal Barrier Depletion and Loss of Bacterial Diversity are Primary Abnormalities in Paediatric Ulcerative Colitis. J. Crohn’s Colitis 2016, 10, 462–471. [Google Scholar] [CrossRef]
  36. Milani, C.; Ticinesi, A.; Gerritsen, J.; Nouvenne, A.; Lugli, G.A.; Mancabelli, L.; Turroni, F.; Duranti, S.; Mangifesta, M.; Viappiani, A.; et al. Gut microbiota composition and Clostridium difficile infection in hospitalized elderly individuals: A metagenomic study. Sci. Rep. 2016, 6, 25945. [Google Scholar] [CrossRef] [Green Version]
  37. Saulnier, D.M.; Riehle, K.; Mistretta, T.A.; Diaz, M.A.; Mandal, D.; Raza, S.; Weidler, E.M.; Qin, X.; Coarfa, C.; Milosavljevic, A.; et al. Gastrointestinal microbiome signatures of pediatric patients with irritable bowel syndrome. Gastroenterology 2011, 141, 1782–1791. [Google Scholar] [CrossRef] [Green Version]
  38. Woting, A.; Pfeiffer, N.; Loh, G.; Klaus, S.; Blaut, M. Clostridium ramosum promotes high-fat diet-induced obesity in gnotobiotic mouse models. mBio 2014, 5, e01530-14. [Google Scholar] [CrossRef] [Green Version]
  39. Smith-Brown, P.; Morrison, M.; Krause, L.; Davies, P.S. Dairy and plant based food intakes are associated with altered faecal microbiota in 2 to 3 year old Australian children. Sci. Rep. 2016, 6, 32385. [Google Scholar] [CrossRef] [Green Version]
  40. Zhang, H.; DiBaise, J.K.; Zuccolo, A.; Kudrna, D.; Braidotti, M.; Yu, Y.; Parameswaran, P.; Crowell, M.D.; Wing, R.; Rittmann, B.E.; et al. Human gut microbiota in obesity and after gastric bypass. Proc. Natl. Acad. Sci. USA 2009, 106, 2365–2370. [Google Scholar] [CrossRef] [Green Version]
  41. Wang, Y.; Luo, X.; Mao, X.; Tao, Y.; Ran, X.; Zhao, H.; Xiong, J.; Li, L. Gut microbiome analysis of type 2 diabetic patients from the Chinese minority ethnic groups the Uygurs and Kazaks. PLoS ONE 2017, 12, e0172774. [Google Scholar] [CrossRef] [PubMed] [Green Version]
  42. Liu, J.; Wang, J.; Zhou, Y.; Han, H.; Liu, W.; Li, D.; Li, F.; Cao, D.; Lei, Q. Integrated omics analysis reveals differences in gut microbiota and gut-host metabolite profiles between obese and lean chickens. Poult. Sci. 2022, 101, 102165. [Google Scholar] [CrossRef] [PubMed]
  43. Zhao, X.; Liu, H.; Wu, Y.; Hu, N.; Lei, M.; Zhang, Y.; Wang, S. Intervention with the crude polysaccharides of Physalis pubescens L. mitigates colitis by preventing oxidative damage, aberrant immune responses, and dysbacteriosis. J. Food Sci. 2020, 85, 2596–2607. [Google Scholar] [CrossRef] [PubMed]
  44. Dinh, D.M.; Volpe, G.E.; Duffalo, C.; Bhalchandra, S.; Tai, A.K.; Kane, A.V.; Wanke, C.A.; Ward, H.D. Intestinal microbiota, microbial translocation, and systemic inflammation in chronic HIV infection. J. Infect. Dis. 2015, 211, 19–27. [Google Scholar] [CrossRef] [PubMed] [Green Version]
  45. Zorkina, Y.A.; Syunyakov, T.S.; Abramova, O.V.; Yunes, R.A.; Averina, O.V.; Kovtun, A.S.; Angelova, I.Y.; Khobta, E.B.; Susloparova, D.A.; Pavlichenko, A.V.; et al. Effects of diet on the gut microbiome in patients with depression. Zhurnal Nevrol. I Psikhiatrii Im. S.S. Korsakova 2022, 122, 59–64. [Google Scholar] [CrossRef] [PubMed]
  46. Kang, K.; Sun, Y.; Pan, D.; Sang, L.X.; Sun, M.J.; Li, Y.L.; Chang, B. Distinctive gut microbial dysbiosis between chronic alcoholic fatty liver disease and metabolic-associated fatty liver disease in mice. Exp. Ther. Med. 2021, 21, 418. [Google Scholar] [CrossRef]
  47. Chen, W.; Liu, F.; Ling, Z.; Tong, X.; Xiang, C. Human intestinal lumen and mucosa-associated microbiota in patients with colorectal cancer. PLoS ONE 2012, 7, e39743. [Google Scholar] [CrossRef]
  48. Kaakoush, N.O. Insights into the Role of Erysipelotrichaceae in the Human Host. Front. Cell. Infect. Microbiol. 2015, 5, 84. [Google Scholar] [CrossRef] [Green Version]
  49. Xu, L.; Ma, Y.; Fang, C.; Peng, Z.; Gao, F.; Moll, J.M.; Qin, S.; Yu, Q.; Hou, Y.; Kristiansen, K.; et al. Genomic and microbial factors affect the prognosis of anti-pd-1 immunotherapy in nasopharyngeal carcinoma. Front. Oncol. 2022, 12, 953884. [Google Scholar] [CrossRef]
  50. Holzhausen, E.A.; Malecki, K.C.; Sethi, A.K.; Gangnon, R.; Cadmus-Bertram, L.; Deblois, C.L.; Suen, G.; Safdar, N.; Peppard, P.E. Assessing the relationship between physical activity and the gut microbiome in a large, population-based sample of Wisconsin adults. PLoS ONE 2022, 17, e0276684. [Google Scholar] [CrossRef]
  51. Kim, Y.; Je, Y. Moderate coffee consumption is inversely associated with the metabolic syndrome in the Korean adult population. Br. J. Nutr. 2018, 120, 1279–1287. [Google Scholar] [CrossRef] [PubMed] [Green Version]
  52. Nordestgaard, A.T.; Thomsen, M.; Nordestgaard, B.G. Coffee intake and risk of obesity, metabolic syndrome and type 2 diabetes: A Mendelian randomization study. Int. J. Epidemiol. 2015, 44, 551–565. [Google Scholar] [CrossRef] [PubMed]
  53. Shang, F.; Li, X.; Jiang, X. Coffee consumption and risk of the metabolic syndrome: A meta-analysis. Diabetes Metab. 2016, 42, 80–87. [Google Scholar] [CrossRef]
  54. de Melo Pereira, G.V.; de Carvalho Neto, D.P.; Magalhaes Junior, A.I.; do Prado, F.G.; Pagnoncelli, M.G.B.; Karp, S.G.; Soccol, C.R. Chemical composition and health properties of coffee and coffee by-products. Adv. Food Nutr. Res. 2020, 91, 65–96. [Google Scholar] [CrossRef] [PubMed]
  55. Mills, C.E.; Tzounis, X.; Oruna-Concha, M.J.; Mottram, D.S.; Gibson, G.R.; Spencer, J.P. In vitro colonic metabolism of coffee and chlorogenic acid results in selective changes in human faecal microbiota growth. Br. J. Nutr. 2015, 113, 1220–1227. [Google Scholar] [CrossRef] [PubMed] [Green Version]
  56. Mansour, A.; Mohajeri-Tehrani, M.R.; Karimi, S.; Sanginabadi, M.; Poustchi, H.; Enayati, S.; Asgarbeik, S.; Nasrollahzadeh, J.; Hekmatdoost, A. Short term effects of coffee components consumption on gut microbiota in patients with non-alcoholic fatty liver and diabetes: A pilot randomized placebo-controlled, clinical trial. EXCLI J. 2020, 19, 241–250. [Google Scholar] [CrossRef]
  57. Dong, L.N.; Wang, J.P.; Liu, P.; Yang, Y.F.; Feng, J.; Han, Y. Faecal and mucosal microbiota in patients with functional gastrointestinal disorders: Correlation with toll-like receptor 2/toll-like receptor 4 expression. World J. Gastroenterol. 2017, 23, 6665–6673. [Google Scholar] [CrossRef] [PubMed]
Figure 1. Flow chart of participant eligibility.
Nutrients 15 01747 g001
Figure 2. Alpha diversity of gut microbiota based on higher vs. lower caffeine intake.
Nutrients 15 01747 g002
Figure 3. Beta diversity of gut microbiota based on daily intake of (A) caffeine and (B) coffee.
Nutrients 15 01747 g003
Table 1. Basic characteristics of study participants based on caffeine intake.
Characteristics
Mean ± Standard Deviation or n (%)
Low Caffeine
< Median
(n = 17)
High Caffeine
≥ Median
(n = 17)
p Value
Caffeine (mg)39.2 ± 6.4138.9 ± 13.9<0.0001
Age (years)61.7 ± 1.362.2 ± 1.50.78
Men, n (%)17 (100%)16 (94%)1.00
Racial Group
Non-Hispanic white, n (%)14 (82.4%)14 (82.4%)1.00
Body mass index (kg/m2)32.6 ± 1.535.2 ± 1.60.25
Smoking status, n (%) 0.55
Never smokers7 (41.2%)6 (35.3%)
Former smokers8 (47.1%)6 (35.3%)
Current smokers2 (11.8%)5 (29.4%)
Alcohol Status, n (%) 0.68
Never drinkers4 (23.5%)5 (29.4%)
Former drinkers4 (23.5%)6 (35.3%)
Current drinker9 (53%)6 (35.3%)
Hypertension, yes, n (%)12 (70.6%)13 (76.5%)1.00
Diabetes, yes, n (%)8 (47.1%)9 (52.9%)1.00
Daily total calorie intake (kcal)2039 (±557)1748 (±813)0.23
Total carbohydrate (grams/1000 kcal/day)116 (±23.5)111 (±17.5)0.53
Total protein (grams/1000 kcal/day)36.4 (±5.78)40.0 (±8.37)0.16
Total fat (grams/1000 kcal/day)41.0 (±8.78)43.4 (±4.96)0.33
Vitamin B2 (mg/1000 kcal/day)0.89 (±0.20)1.28 (± 0.30)0.0001
Vitamin B6 (mg/1000 kcal/day)0.82 (±0.16)1.02 (± 0.34)0.02
Vitamin B12 (mcg/1000 kcal/day)2.20 (±0.23)2.76 (± 0.98)0.06
HEI score 160.5 (±2.0)61.4 (±2.4)0.77
1 HEI, healthy eating index.
Table 2. Relative abundance of bacterial genera by intake of caffeine and coffee.
Lower
Caffeine
Higher
Caffeine
<2 Cups
Coffee
2 Cups
Coffee
≥3 Cups
Coffee
Bacterial GenusRelative Abundance (%)q ValueRelative Abundance (%)q Value
Erysipelatoclostridium3.140.10<0.00011.421.790.190.22
Faecalibacterium4.299.540.00035.665.2615.16<0.0001
Lachnospiraceae (ASV0006)4.881.580.00073.462.562.030.33
Alistipes0.571.320.010.461.311.84<0.0001
Subdoligranulum0.100.76<0.00010.151.130.29<0.0001
Sutterella1.961.590.891.542.211.410.02
Prevotella1.393.410.032.403.641.500.16
Table 3. Multivariable negative binomial regression analysis of the association between caffeine and coffee intake and a non-zero bacterial count.
GeneraIRR (95% CI) 1IRR (95% CI) 2IRR (95% CI) 3
Caffeine
Alistipes3.17 (1.16–8.66)3.05 (1.10–8.48)1.40 (0.32–6.19)
Faecalibacterium5.56 (2.84–10.9)5.28 (2.68–10.4)2.10 (0.85–5.20)
Erysipelatoclostridium0.07 (0.02–0.25)0.07 (0.02–0.25)0.02 (0.003–0.17)
Subdoligranulum0.85(0.49–1.48)0.86 (0.52–1.42)1.17 (0.57–2.42)
Coffee
Alistipes2.86 (1.37–5.97)2.84 (1.38–5.84)2.20 (1.00–4.89)
Faecalibacterium2.39 (1.53–3.73)2.35 (1.50–3.68)1.49 (0.87–2.56)
Erysipelatoclostridium0.26 (0.08–0.84)0.24 (0.07–0.84)0.31(0.07–1.36)
Subdoligranulum1.08 (0.74–1.57)0.97 (0.66–1.42)1.10 (0.73–1.66)
CI: confidence interval. IRR: incidence rate ratio. 1 Negative binomial regression model for panel data used the rarefied bacterial count as the dependent variable. The reference group was lower intake of caffeine or coffee. Coffee intake was modeled as a continuous variable. The model was adjusted for age, race (non-Hispanic white, African American, and Hispanic), body mass index, smoking status (never, former, and current), alcohol use (never, former, and current), diabetes, hypertension, and colon segment. The incidence rate of having non-zero Faecalibacterium count was 4.56 times higher among those who had a higher intake of caffeine than those who had a lower intake. 2 Based on the first model, the model was further adjusted for HEI score. The incidence rate of having a non-zero Faecalibacterium count was 4.28 times higher among those who had a higher intake of caffeine than those who had a lower intake. 3 Based on the second model, the model was further adjusted for vitamin B2 intake. The incidence rate of having a non-zero Faecalibacterium count was 1.10 times higher among those who had a higher intake of caffeine than those who had a lower intake.
Disclaimer/Publisher’s Note: The statements, opinions and data contained in all publications are solely those of the individual author(s) and contributor(s) and not of MDPI and/or the editor(s). MDPI and/or the editor(s) disclaim responsibility for any injury to people or property resulting from any ideas, methods, instructions or products referred to in the content.

