Validation of a Phosphorus Food Frequency Questionnaire in Patients with Kidney Failure Undertaking Dialysis

 , ,
, ,
Abstract
:1. Introduction
2. Materials and Methods
2.1. Participants
2.2. Materials
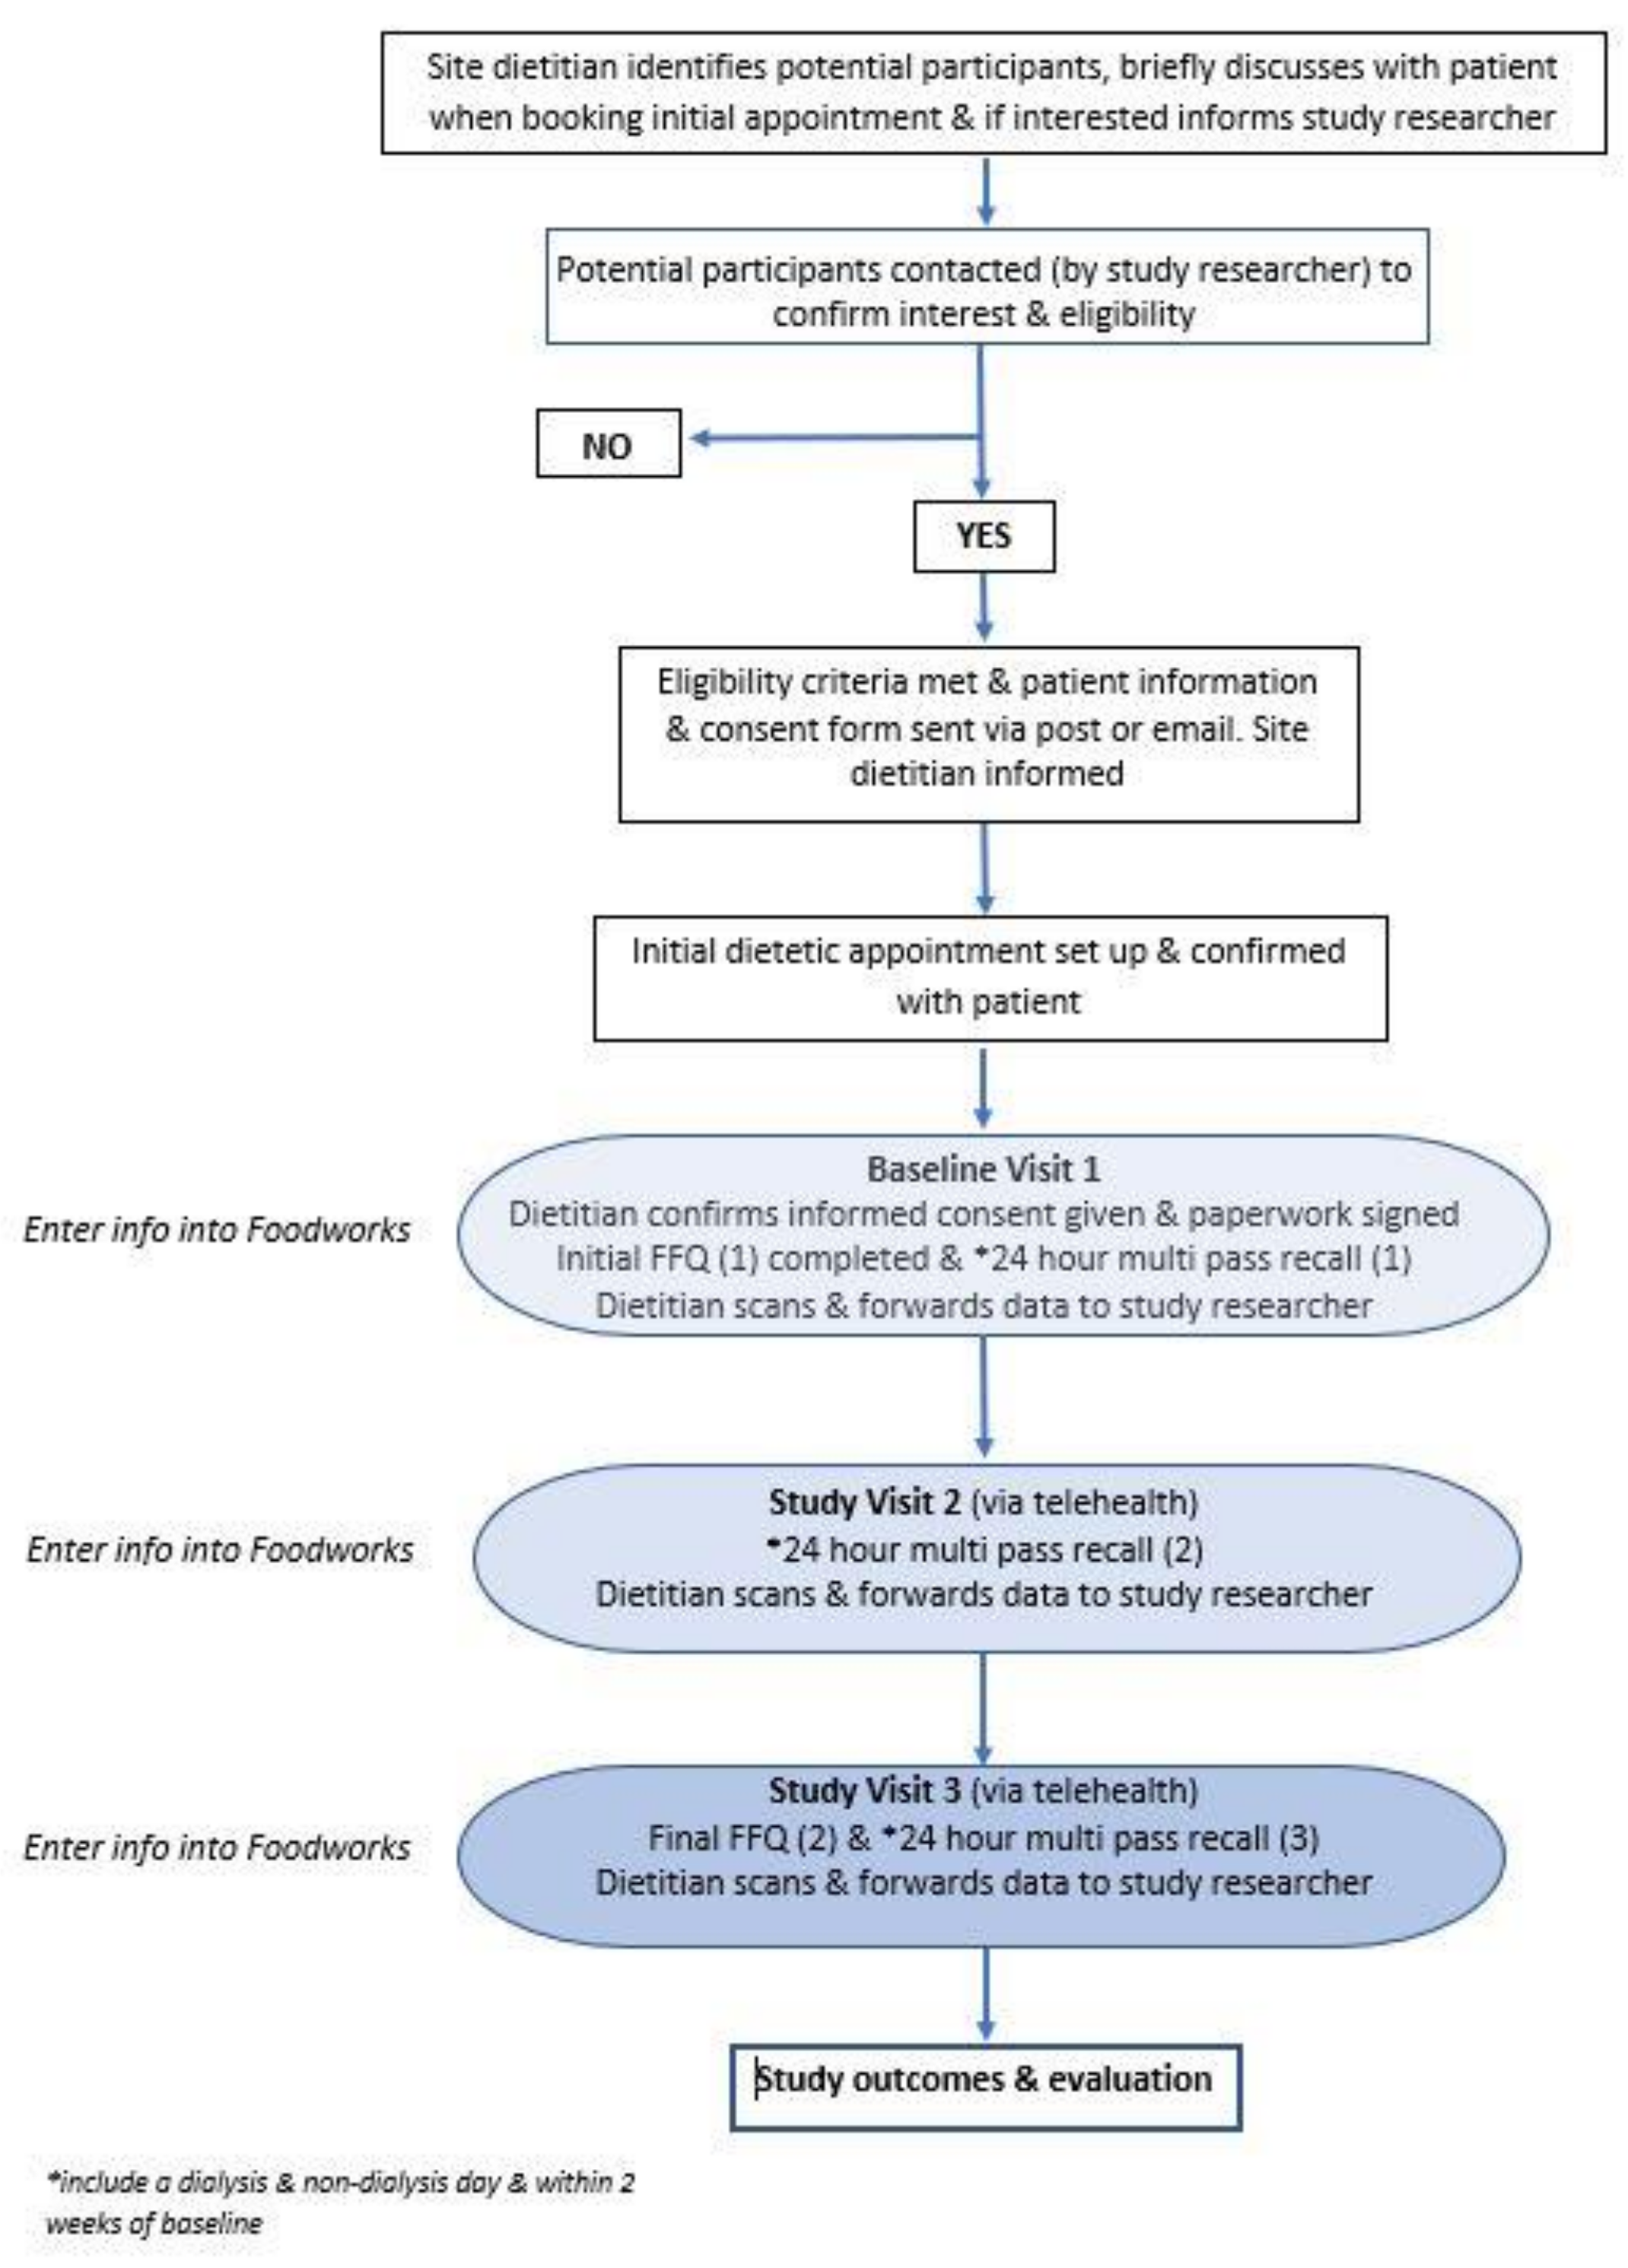
2.3. Data Collection
2.4. Statistical Analysis
3. Results
4. Discussion
5. Conclusions
Supplementary Materials
Author Contributions
Funding
Institutional Review Board Statement
Informed Consent Statement
Data Availability Statement
Acknowledgments
Conflicts of Interest
References
- Kestenbaum, B.; Sampson, J.N.; Rudser, K.D.; Patterson, D.J.; Seliger, S.L.; Young, B.; Sherrard, D.J.; Andress, D.L. Serum phosphate levels and mortality risk among people with chronic kidney disease. J. Am. Soc. Nephrol. 2005, 16, 520–528. [Google Scholar] [CrossRef] [Green Version]
- Toussaint, N.D.; Pedagogos, E.; Tan, S.-J.; Badve, S.V.; Hawley, C.M.; Perkovic, V.; Elder, G.J. Phosphate in early chronic kidney disease: Associations with clinical outcomes and a target to reduce cardiovascular risk: Phosphate and cardiovascular risk. Nephrology 2012, 17, 433–444. [Google Scholar] [CrossRef]
- Seifert, M.E.; Hruska, K.A. The Kidney-Vascular-Bone Axis in the Chronic Kidney Disease-Mineral Bone Disorder. Transplantation 2016, 100, 497–505. [Google Scholar] [CrossRef] [Green Version]
- Moe, S.; Drueke, T.; Cunningham, J.; Goodman, W.; Martin, K.; Olgaard, K.; Ott, S.; Sprague, S.; Lameire, N.; Eknoyan, G.; et al. Definition, evaluation, and classification of renal osteodystrophy: A position statement from Kidney Disease: Improving Global Outcomes (KDIGO). Kidney Int. 2006, 69, 1945–1953. [Google Scholar] [CrossRef] [PubMed] [Green Version]
- Eckardt, K.-U.; Kasiske, B.L.; Zeier, M.G. Kidney Disease: Improving Global Outcomes Transplant Work, G. KDIGO clinical practice guideline for the care of kidney transplant recipients. Am. J. Transplant. 2009, 9 (Suppl. 3), S1–S155. [Google Scholar] [CrossRef] [PubMed]
- Beto, J.; Bhatt, N.; Gerbeling, T.; Patel, C.; Drayer, D. Overview of the 2017 KDIGO CKD-MBD Update: Practice Implications for Adult Hemodialysis Patients. J. Ren. Nutr. 2019, 29, 2–15. [Google Scholar] [CrossRef] [PubMed] [Green Version]
- Ketteler, M.; Block, G.A.; Evenepoel, P.; Fukagawa, M.; Herzog, C.A.; McCann, L.; Moe, S.M.; Shroff, R.; Tonelli, M.A.; Toussaint, N.D.; et al. Executive summary of the 2017 KDIGO Chronic Kidney Disease-Mineral and Bone Disorder (CKD-MBD) Guideline Update: What’s changed and why it matters. Kidney Int. 2017, 92, 1558. [Google Scholar] [CrossRef] [Green Version]
- Lopes, A.A.; Tong, L.; Thumma, J.; Li, Y.; Fuller, D.S.; Morgenstern, H.; Bommer, J.; Kerr, P.G.; Tentori, F.; Akiba, T.; et al. Phosphate Binder Use and Mortality Among Hemodialysis Patients in the Dialysis Outcomes and Practice Patterns Study (DOPPS): Evaluation of Possible Confounding by Nutritional Status. Am. J. Kidney Dis. 2012, 60, 90–101. [Google Scholar] [CrossRef] [Green Version]
- Ikizler, T.A.; Burrowes, J.D.; Byham-Gray, L.D.; Campbell, K.L.; Carrero, J.-J.; Chan, W.; Fouque, D.; Friedman, A.N.; Ghaddar, S.; Goldstein-Fuchs, D.J.; et al. KDOQI Clinical Practice Guideline for Nutrition in CKD: 2020 Update. Am. J. Kidney Dis. 2020, 76, S1–S107. [Google Scholar] [CrossRef] [PubMed]
- St-Jules, D.E.; Woolf, K.; Pompeii, M.L.; Kalantar-Zadeh, K.; Sevick, M.A. Reexamining the Phosphorus–Protein Dilemma: Does Phosphorus Restriction Compromise Protein Status? J. Ren. Nutr. 2016, 26, 136–140. [Google Scholar] [CrossRef] [Green Version]
- Leon, J.B.; Sullivan, C.M.; Sehgal, A.R. The prevalence of phosphorus-containing food additives in top-selling foods in grocery stores. J. Ren. Nutr. 2013, 23, 265–270.e2. [Google Scholar] [CrossRef] [Green Version]
- McCutcheon, J.; Campbell, K.; Ferguson, M.; Day, S.; Rossi, M. Prevalence of Phosphorus-Based Additives in the Australian Food Supply: A Challenge for Dietary Education? J. Ren. Nutr. 2015, 25, 440–444. [Google Scholar] [CrossRef] [PubMed]
- de Fornasari, M.L.L.; dos Santos Sens, Y.A. Replacing Phosphorus-Containing Food Additives with Foods without Additives Reduces Phosphatemia in End-Stage Renal Disease Patients: A Randomized Clinical Trial. J. Ren. Nutr. 2016, 27, 97–105. [Google Scholar] [CrossRef] [PubMed]
- Hand, R.; Steiber, A.; Burrowes, J. Renal Dietitians Lack Time and Resources To Collect And Analyze Dietary Intake Data. Kidney Res. Clin. Pract. 2012, 31, A34. [Google Scholar] [CrossRef] [Green Version]
- Brouwer-Brolsma, E.M.; Lucassen, D.; de Rijk, M.G.; Slotegraaf, A.; Perenboom, C.; Borgonjen, K.; Siebelink, E.; Feskens, E.J.M.; de Vries, J.H.M. Dietary Intake Assessment: From Traditional Paper-Pencil Questionnaires to Technology-Based Tools; Springer International Publishing: Cham, Switzerland, 2020; pp. 7–23. [Google Scholar]
- Cade, J.; Thompson, R.; Burley, V.; Warm, D. Development, validation and utilisation of food-frequency questionnaires—A review. Public Health Nutr. 2002, 5, 567–587. [Google Scholar] [CrossRef] [Green Version]
- McLennan, W.; Podger, A.S. National Nutrition Survey: Nutrient Intakes and Physical Measurements, Australia 1995; Australian Bureau Statistics: Canberra, Australia, 1998. [Google Scholar]
- Benini, O.; D’Alessandro, C.; Gianfaldoni, D.; Cupisti, A. Extra-phosphate load from food additives in commonly eaten foods: A real and insidious danger for renal patients. J. Ren. Nutr. 2011, 21, 303–308. [Google Scholar] [CrossRef] [PubMed]
- Winger, R.J.; Uribarri, J.; Lloyd, L. Phosphorus-containing food additives: An insidious danger for people with chronic kidney disease. Trends Food Sci. Technol. 2012, 24, 92–102. [Google Scholar] [CrossRef]
- Raper, N.; Perloff, B.; Ingwersen, L.; Steinfeldt, L.; Anand, J. An overview of USDA’s Dietary Intake Data System. J. Food Compos. Anal. 2004, 17, 545–555. [Google Scholar] [CrossRef]
- Australian Food, Supplement and Nutrient Database AUSNUT 2011–2013. Available online: https://www.foodstandards.gov.au/science/monitoringnutrients/ausnut/Pages/default.aspx (accessed on 20 March 2023).
- NHMRC. Australian Dietary Guidelines; NHMRC: Canberra, Australia, 2013. Available online: https://www.eatforhealth.gov.au/sites/default/files/files/the_guidelines/n55_australian_dietary_guidelines.pdf (accessed on 20 March 2023).
- Rhee, J.J.; Sampson, L.; Cho, E.; Hughes, M.D.; Hu, F.B.; Willett, W.C. Comparison of methods to account for implausible reporting of energy intake in epidemiologic studies. Am. J. Epidemiol. 2015, 181, 225–233. [Google Scholar] [CrossRef]
- Bland, J.M.; Altman, D.G. Statistical methods for assessing agreement between two methods of clinical measurement. Int. J. Nurs. Stud. 2010, 47, 931–936. [Google Scholar] [CrossRef]
- Odor, P.M.; Bampoe, S.; Cecconi, M. Cardiac Output Monitoring: Validation Studies–how Results Should be Presented. Curr. Anesthesiol. Rep. 2017, 7, 410–415. [Google Scholar] [CrossRef] [Green Version]
- NHANES. About the National Health and Nutrition Examination Survey. Available online: https://www.cdc.gov/nchs/nhanes/about_nhanes.htm (accessed on 20 March 2023).
- Affret, A.; Wagner, S.; El Fatouhi, D.; Dow, C.; Correia, E.; Niravong, M.; Clavel-Chapelon, F.; De Chefdebien, J.; Fouque, D.; Stengel, B.; et al. Validity and reproducibility of a short food frequency questionnaire among patients with chronic kidney disease. BMC Nephrol. 2017, 18, 297. [Google Scholar] [CrossRef] [PubMed]
- Rao, S.N.; Chandra, A.; Tiwari, P.; Mishra, P. Development and Validation of a Novel Food-frequency Questionnaire for Hemodialysis Patients in Lucknow, India. Indian J. Nephrol. 2021, 31, 276–282. [Google Scholar] [CrossRef] [PubMed]
- Mumu, S.J.; Merom, D.; Ali, L.; Fahey, P.P.; Hossain, I.; Rahman, A.; Allman-Farinelli, M. Validation of a food frequency questionnaire as a tool for assessing dietary intake in cardiovascular disease research and surveillance in Bangladesh. Nutr. J. 2020, 19, 42. [Google Scholar] [CrossRef]
- Roach, L.A.; Russell, K.G.; Lambert, K.; Holt, J.L.; Meyer, B.J. Polyunsaturated fatty acid food frequency questionnaire validation in people with end stage renal disease on dialysis. Nutr. Diet. 2020, 77, 131–138. [Google Scholar] [CrossRef] [PubMed] [Green Version]
- Joshi, S.; Moore, L.W.; Kalantar-Zadeh, K. The Future of Nutrition in Kidney Disease: Plant-Based Diets, Gut Microbiome, and Beyond. J. Ren. Nutr. 2021, 31, 97–99. [Google Scholar] [CrossRef]
- Byrne, F.N.; Gillman, B.; Kiely, M.; Bowles, M.; Connolly, P.; Earlie, J.; Murphy, J.; Rennick, T.; Reilly, E.O.; Shiely, F.; et al. Revising Dietary Phosphorus Advice in Chronic Kidney Disease G3-5D. J. Ren. Nutr. 2021, 31, 132–143. [Google Scholar] [CrossRef]


| Demographic | n = 50 |
|---|---|
| Mean Age in years (standard deviation) | 70 (±13.27) |
| Gender (n, %) | |
| Male | 33 (66) |
| Female | 17 (44) |
| Declared Ethnic Origin (n, %) | |
| Australian | 35 (70) |
| New Zealand | 2 (4) |
| European | 6 (12) |
| Aboriginal or Torres Strait Islander | 0 |
| Asian | 5 (10) |
| Other | 2 (4) |
| Smoking Status (n, %) | |
| Never | 35 (70) |
| Former | 13 (26) |
| Current | 2 (4) |
| ESKF Cause (n, %) | |
| Diabetic Nephropathy | 14 (28) |
| Hypertension/Vascular | 8 (16) |
| Polycystic Kidney Disease | 5 (10) |
| Other * | 19(38) |
| Unknown | 4 (8) |
| Dialysis Type (n, %) | |
| Home Haemodialysis | 2 (4) |
| Satellite Haemodialysis | 44 (88) |
| Peritoneal Dialysis | 4 (8) |
| Vintage (n, %) | |
| <12 months | 20 (40) |
| 12–24 months | 10 (20) |
| >24 months | 20 (40) |
| Address (n, %) | |
| Metro | 42 (84) |
| Regional | 8 (16) |
| Comorbidities (n, %) | |
| Diabetes | 22 (44) |
| Peripheral Vascular Disease | 8 (16) |
| Cardiovascular Disease | 9 (18) |
| Coronary Artery disease | 15 (30) |
| Cancer (NOS) | 7 (14) |
| 24 hr Multi-Pass Mean ± SD | P-FFQ Mean ± SD | Paired T Test p-Value | Pearson’s | ||
|---|---|---|---|---|---|
| r-Value | p-Value | ||||
| Energy (kJ) | 7403 ± 2344 | 5506 ± 1775 | 0.001 | 0.531 | 0.001 |
| Protein (g) | 82 ± 26 | 76 ± 22 | 0.047 | 0.554 | 0.001 |
| Fibre (g) | 20 ± 8 | 11 ± 5 | 0.001 | 0.408 | 0.003 |
| Sodium (mg) | 2169 ± 911 | 1962 ± 765 | 0.176 | 0.205 | 0.152 |
| Potassium (mg) | 2339 ± 684 | 1505 ± 489 | 0.001 | 0.563 | 0.001 |
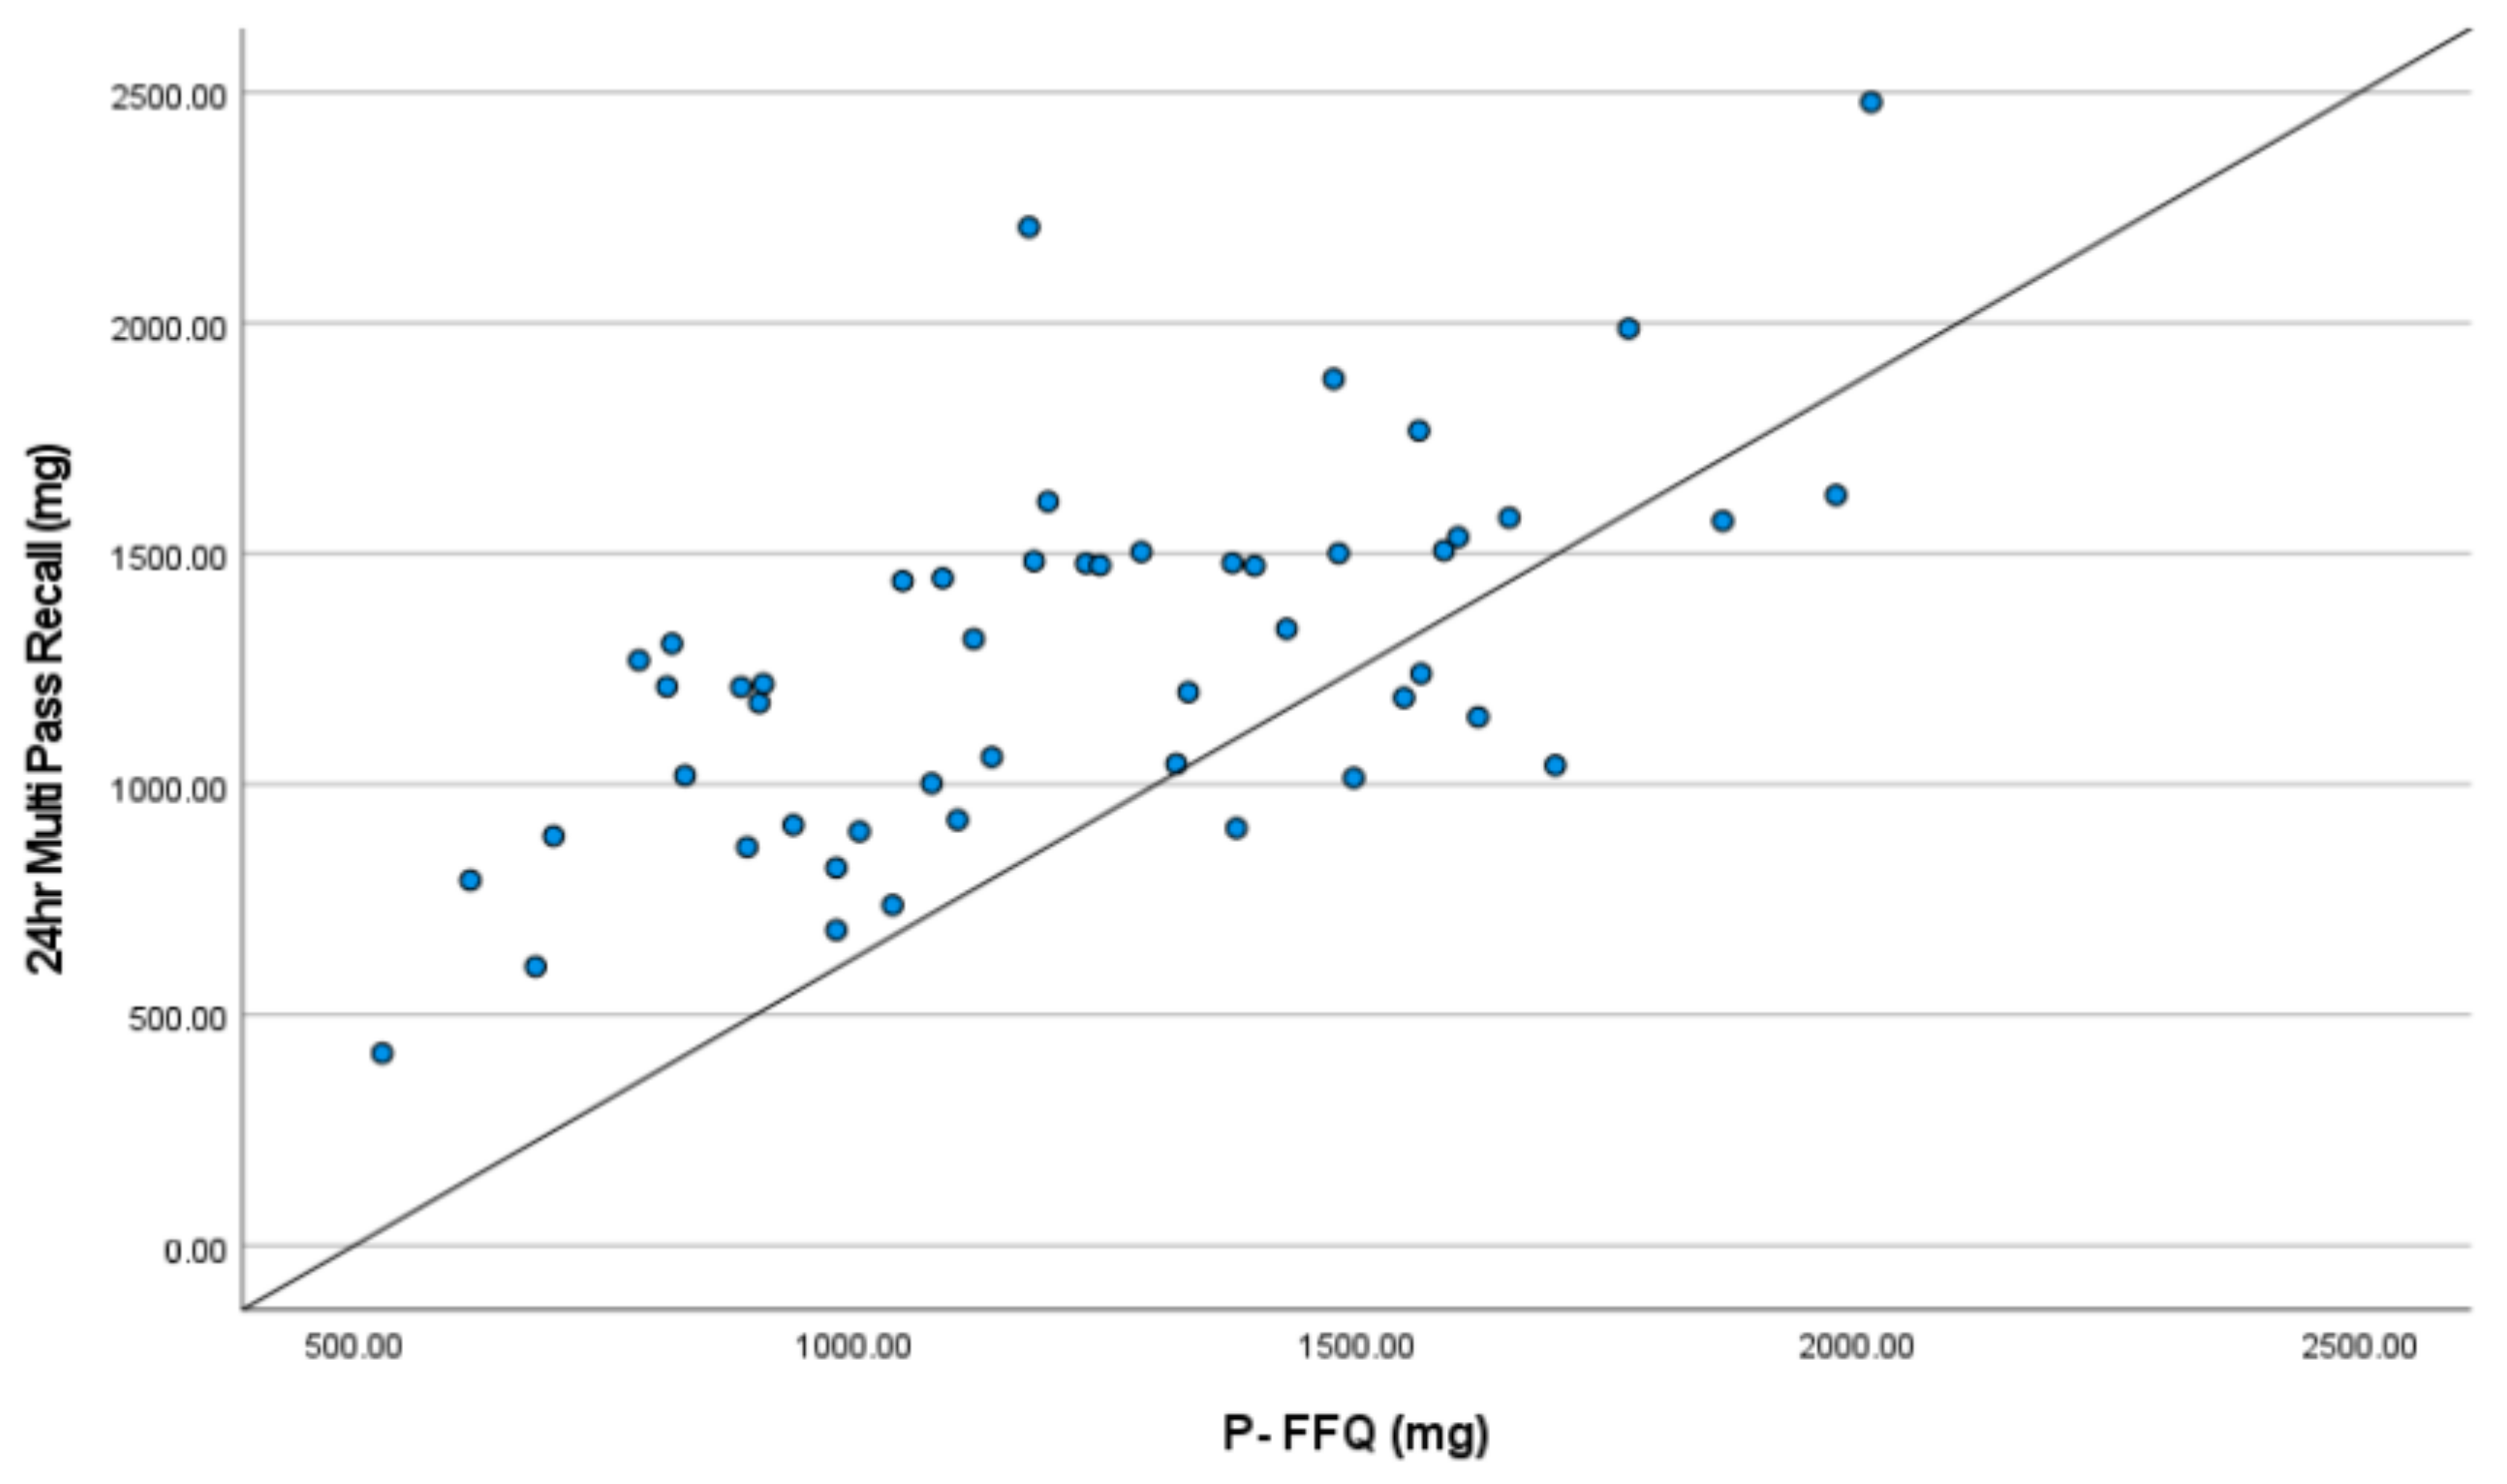
| Phosphorus (mg) | 1262 ± 400 | 1220 ± 348 | 0.373 | 0.623 | 0.001 |
| Mean Difference | 95% LoA Lower Limit; Upper Limit | Within 95% LoA | |
|---|---|---|---|
| Energy (kJ) | 1897 | −2135; 5926 | 48/50 (96%) |
| Protein (g) | 6.78 | −38.7; 52.25 | 49/50 (98%) |
| Fibre (g) | 9.16 | −5.58; 23.9 | 49/50 (98%) |
| Sodium (mg) | 206.5 | −1876; 2289 | 48/50 (98%) |
| Potassium (mg) | 834 | −292; 1960 | 47/50 (94%) |
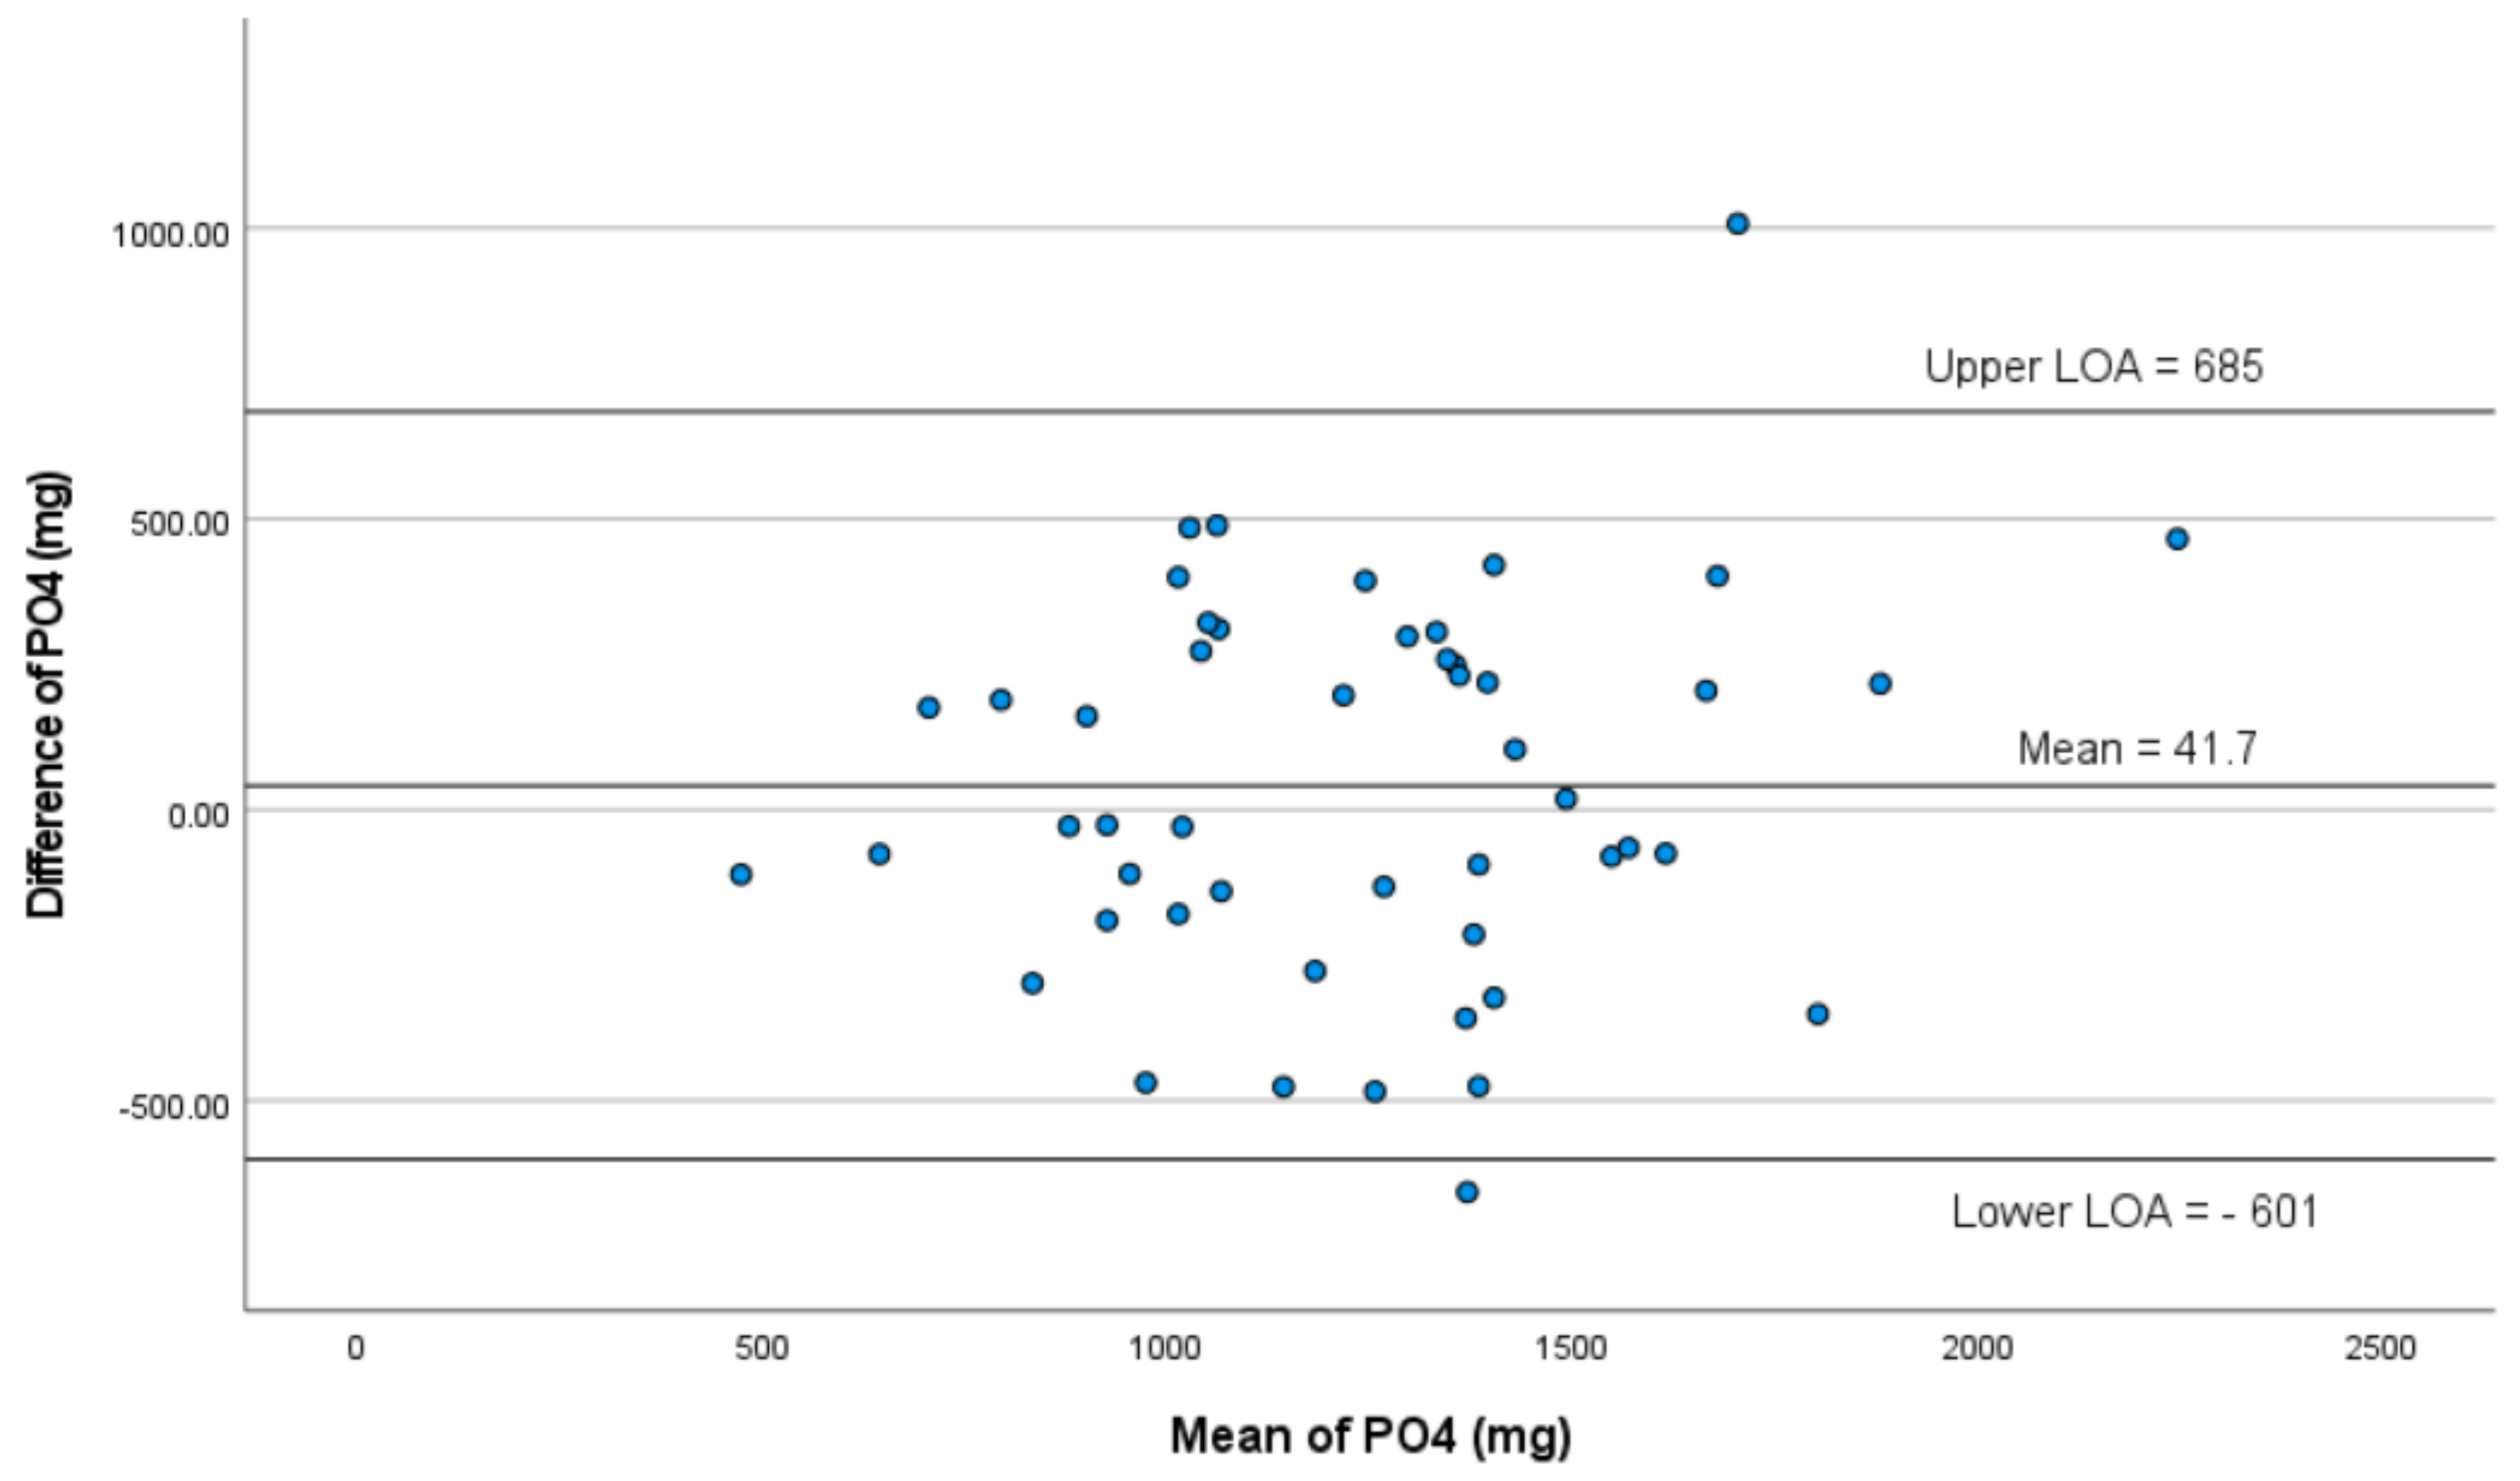
| Phosphorus (mg) | 42 | −601; 685 | 48/50 (96%) |
| Intraclass Correlation * | 95% Confidence Interval | p-Value | Kendall’s tau-b Correlation | |
|---|---|---|---|---|
| Energy (kJ) | 0.863 | 0.753–0.924 | 0.001 | 0.559 |
| Protein (g) | 0.696 | 0.451–0.832 | 0.001 | 0.359 |
| Fibre (g) | 0.864 | 0.755–0.924 | 0.001 | 0.634 |
| Sodium (mg) | 0.650 | 0.364–0.807 | 0.001 | 0.325 |
| Potassium (mg) | 0.509 | 0.135–0.724 | 0.007 | 0.264 |
| Phosphorus (mg) | 0.763 | 0.574–0.868 | 0.001 | 0.387 |
| Dialysis Day Mean ± SD | Non-Dialysis Day Mean ± SD | p-Value | r-Value | p-Value | |
|---|---|---|---|---|---|
| Energy (kJ) | 7387 ± 2358 | 7689 ± 2380 | 0.217 | 0.761 | 0.001 |
| Protein (g) | 83 ± 31 | 86 ± 27 | 0.475 | 0.535 | 0.001 |
| Fibre (g) | 19 ± 9 | 20 ± 8 | 0.208 | 0.764 | 0.001 |
| Sodium (mg) | 2171 ± 838 | 2231 ± 1036 | 0.673 | 0.448 | 0.001 |
| Potassium (mg) | 2191 ± 813 | 2478 ± 779 | 0.036 | 0.359 | 0.140 |
| Phosphorus (mg) | 1255 ± 446 | 1324 ± 406 | 0.217 | 0.622 | 0.001 |
Disclaimer/Publisher’s Note: The statements, opinions and data contained in all publications are solely those of the individual author(s) and contributor(s) and not of MDPI and/or the editor(s). MDPI and/or the editor(s) disclaim responsibility for any injury to people or property resulting from any ideas, methods, instructions or products referred to in the content. |
© 2023 by the authors. Licensee MDPI, Basel, Switzerland. This article is an open access article distributed under the terms and conditions of the Creative Commons Attribution (CC BY) license (https://creativecommons.org/licenses/by/4.0/).
Share and Cite
Beer, J.; Lambert, K.; Lim, W.; Bettridge, E.; Woodward, F.; Boudville, N. Validation of a Phosphorus Food Frequency Questionnaire in Patients with Kidney Failure Undertaking Dialysis. Nutrients 2023, 15, 1711. https://doi.org/10.3390/nu15071711
Beer J, Lambert K, Lim W, Bettridge E, Woodward F, Boudville N. Validation of a Phosphorus Food Frequency Questionnaire in Patients with Kidney Failure Undertaking Dialysis. Nutrients. 2023; 15(7):1711. https://doi.org/10.3390/nu15071711
Chicago/Turabian StyleBeer, Joanne, Kelly Lambert, Wai Lim, Ellen Bettridge, Fiona Woodward, and Neil Boudville. 2023. "Validation of a Phosphorus Food Frequency Questionnaire in Patients with Kidney Failure Undertaking Dialysis" Nutrients 15, no. 7: 1711. https://doi.org/10.3390/nu15071711