
Sesamin Metabolites Suppress the Induction of Cellular Senescence
 , ,
, ,
Abstract
: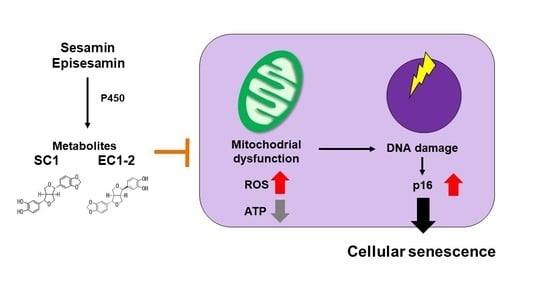
1. Introduction
2. Materials and Methods
2.1. Cell Culture
2.2. Test Compounds
2.3. γH2AX Immunostaining
2.4. Western Blotting
2.5. qRT-PCR
2.6. Mitochondrial Superoxide Production
2.7. Mitochondrial DNA Contents
2.8. Oxygen Consumption Rate (OCR) Measurements
2.9. Statistical Analysis
3. Results
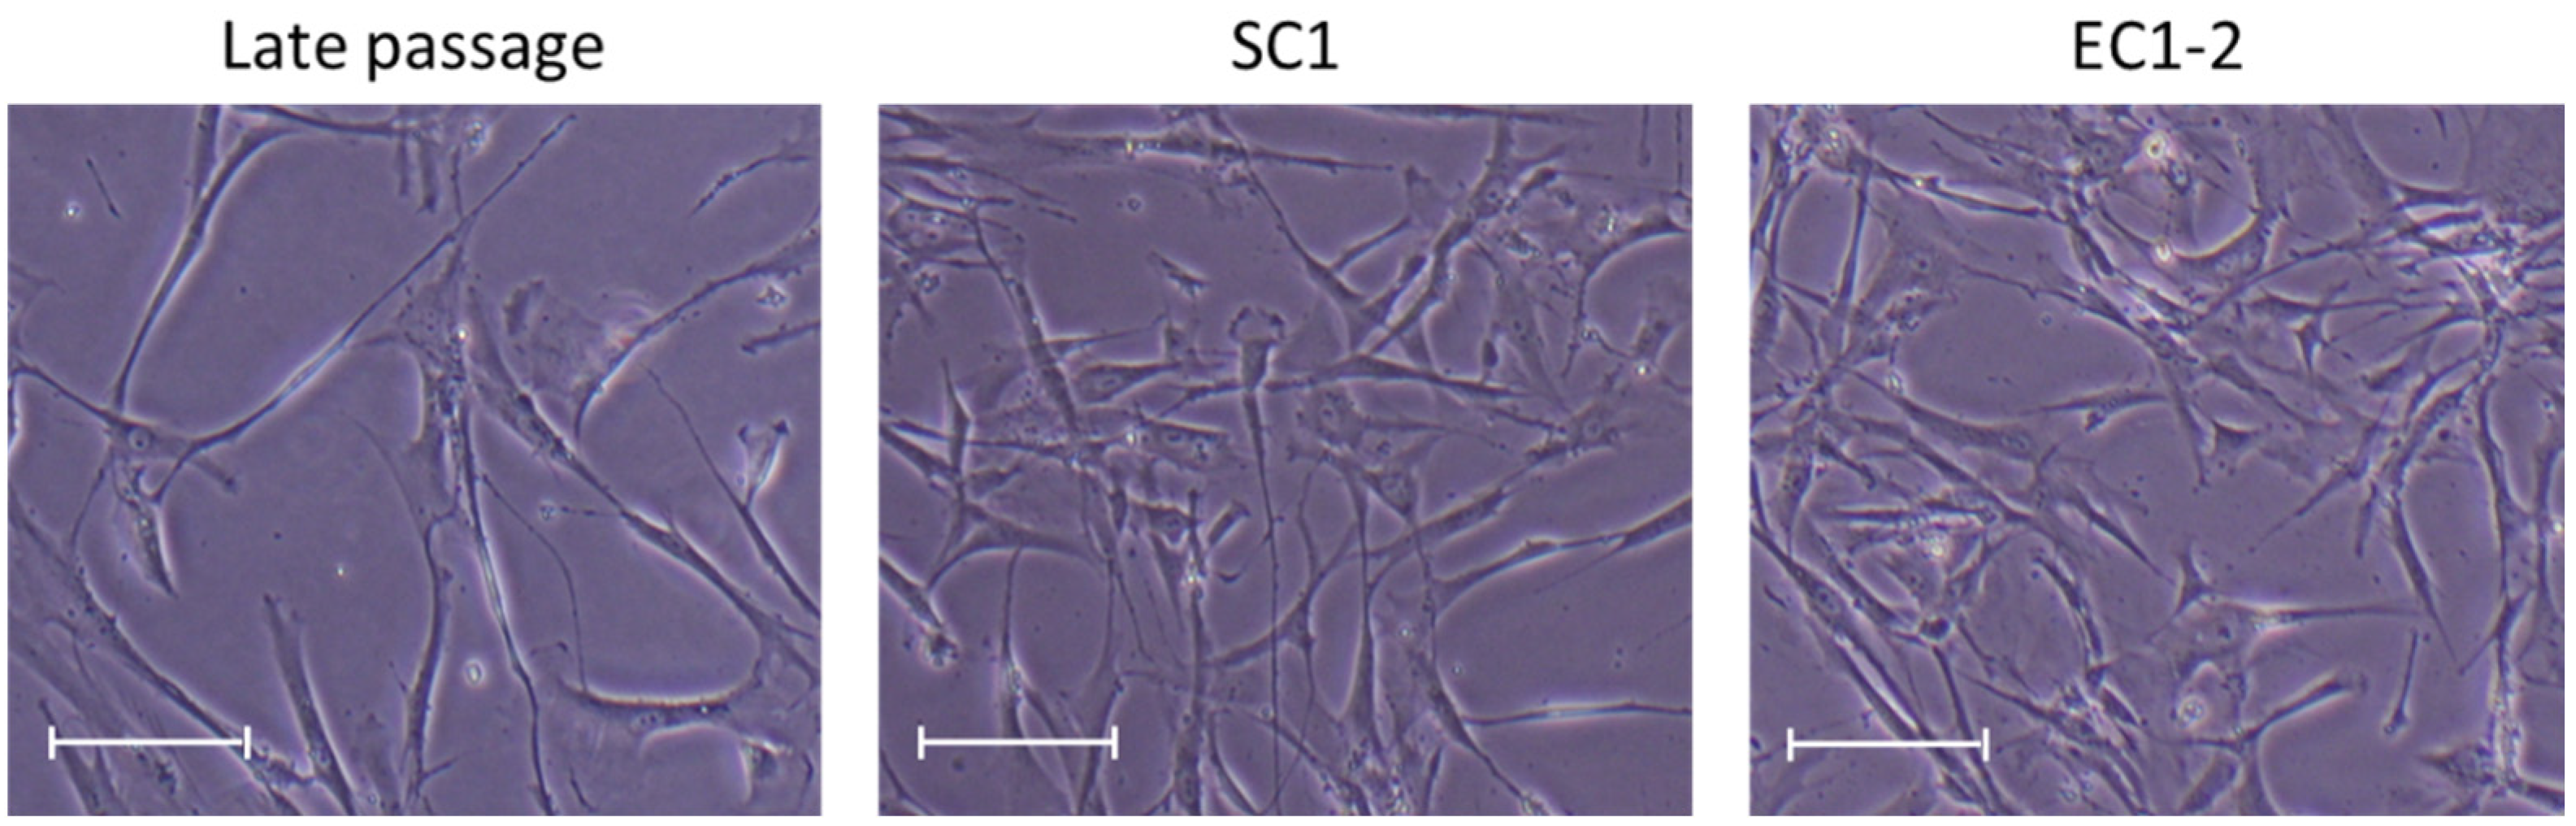
3.1. Maintenance of Proliferative Capacity of TIG-3 Cell with SC1 and EC1-2
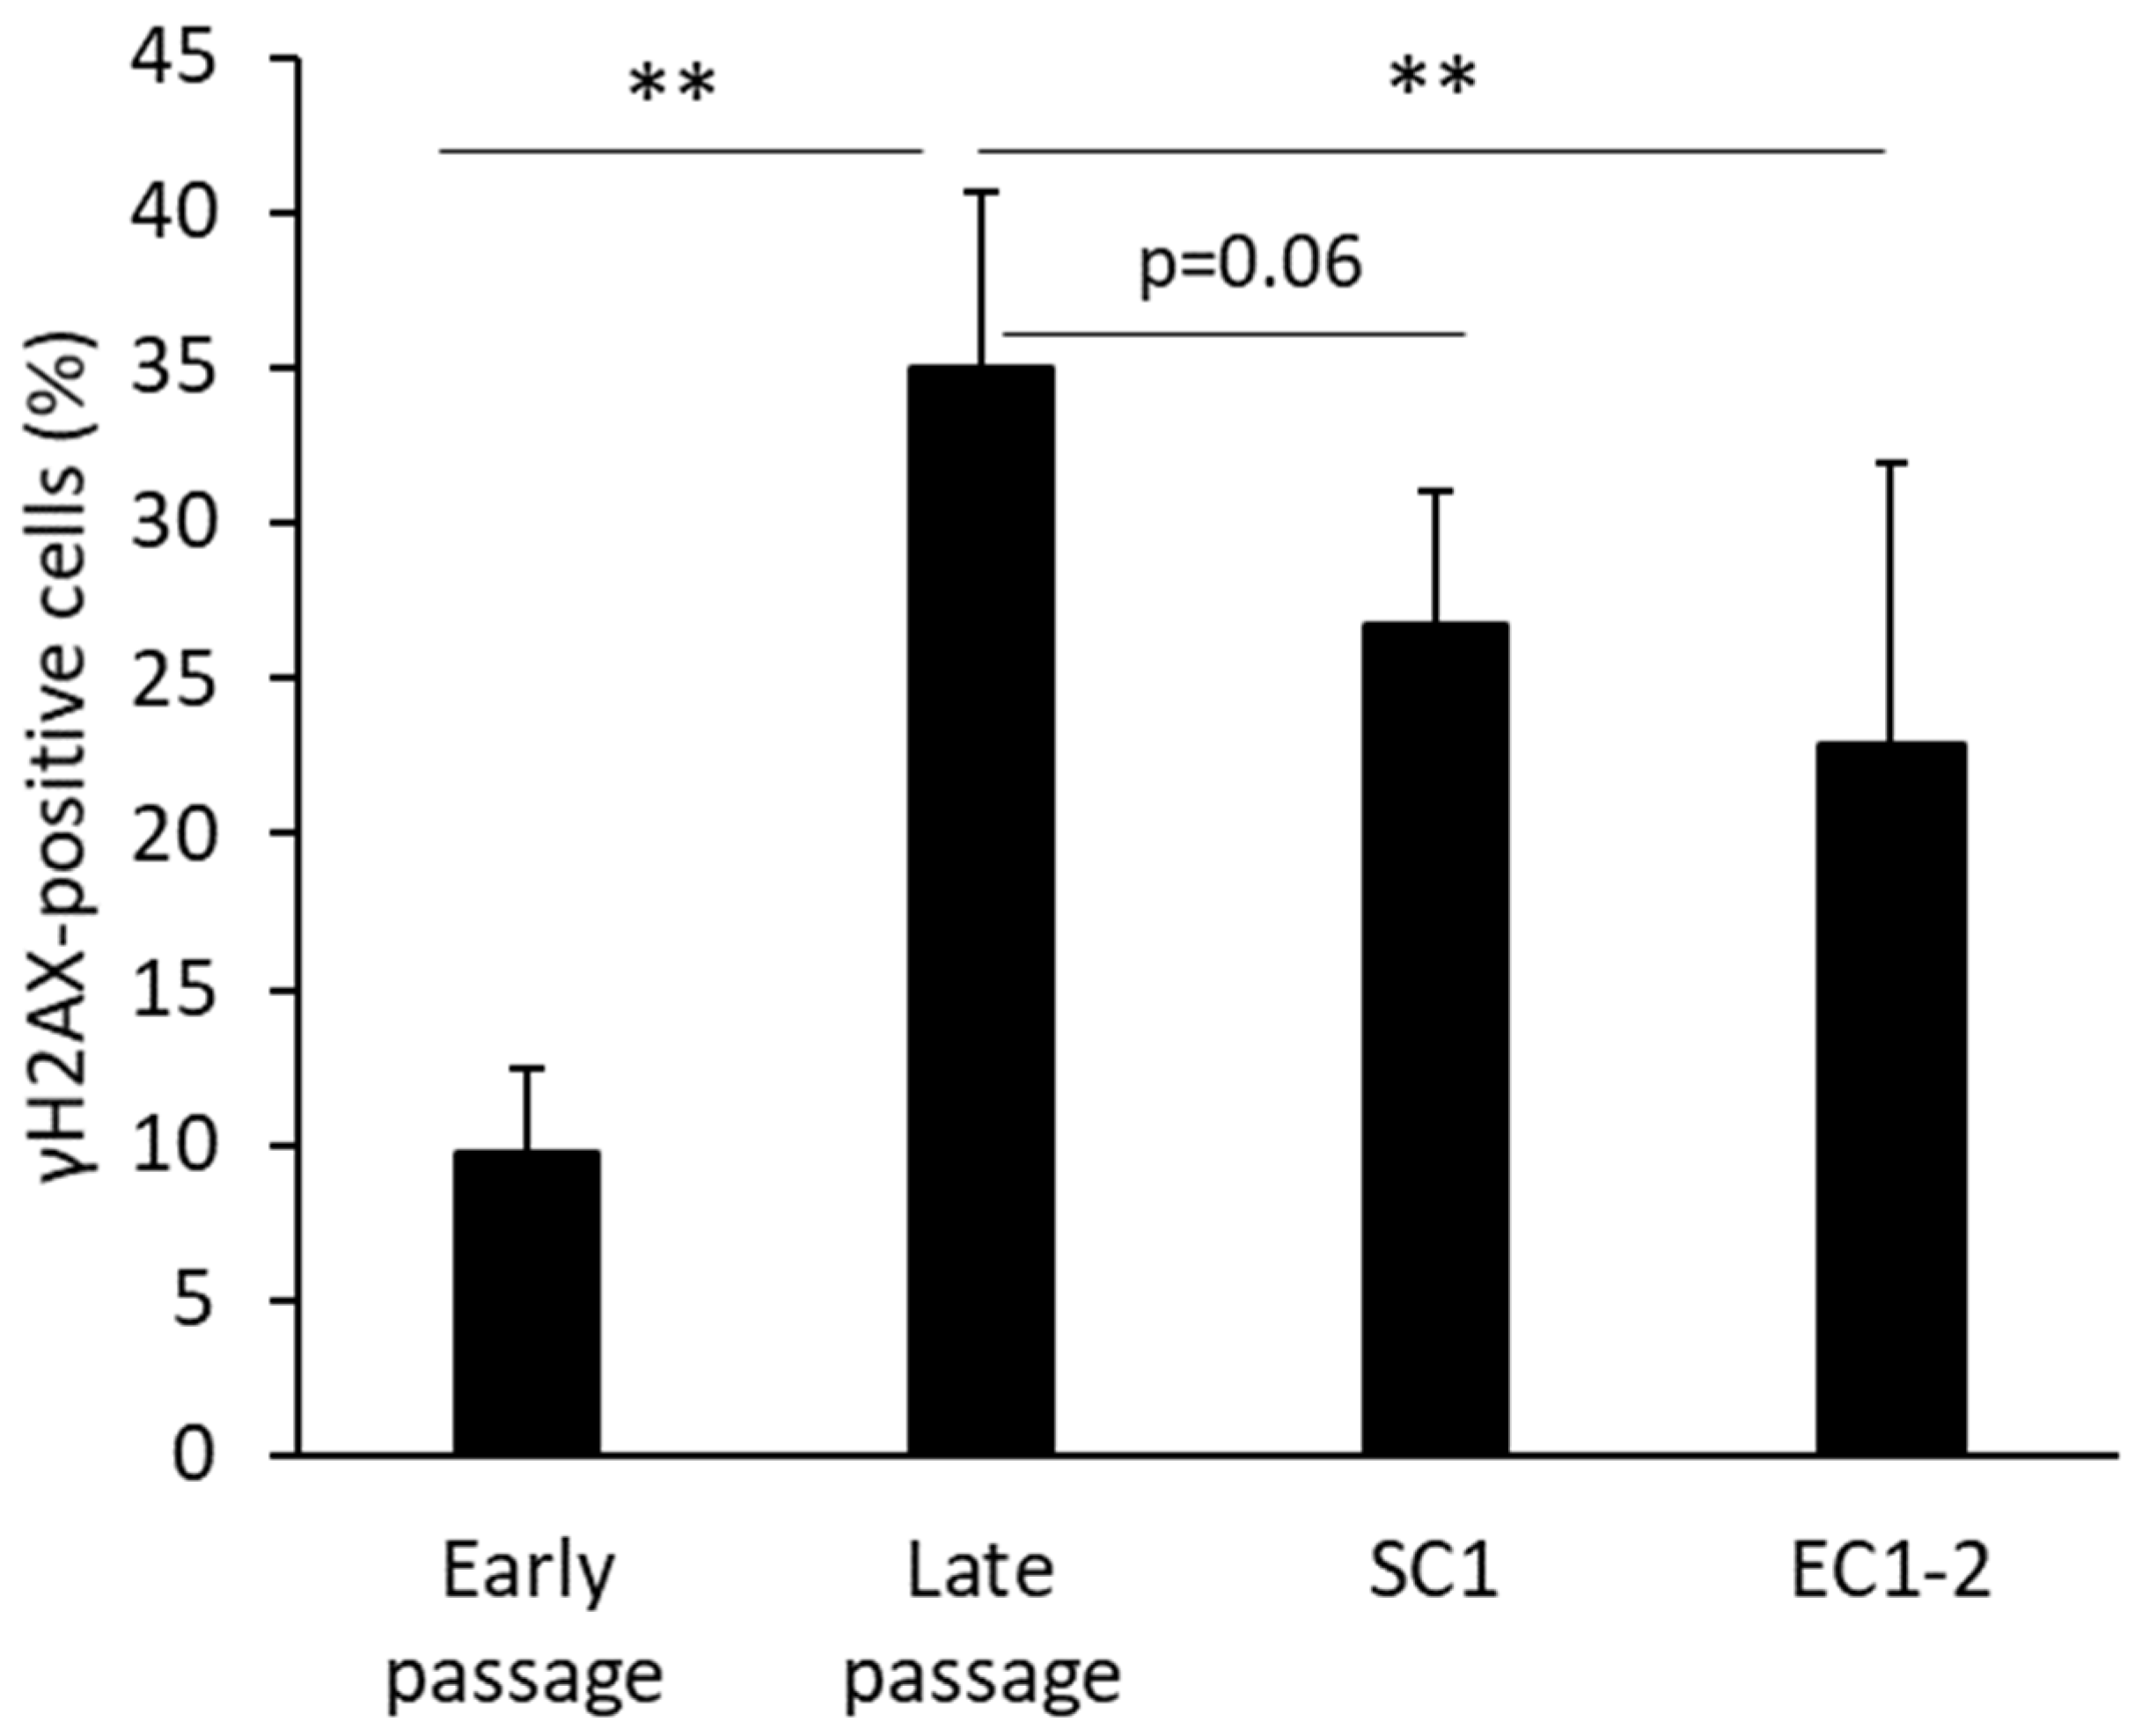
3.2. Inhibition of DNA Damage with SC1 and EC1-2
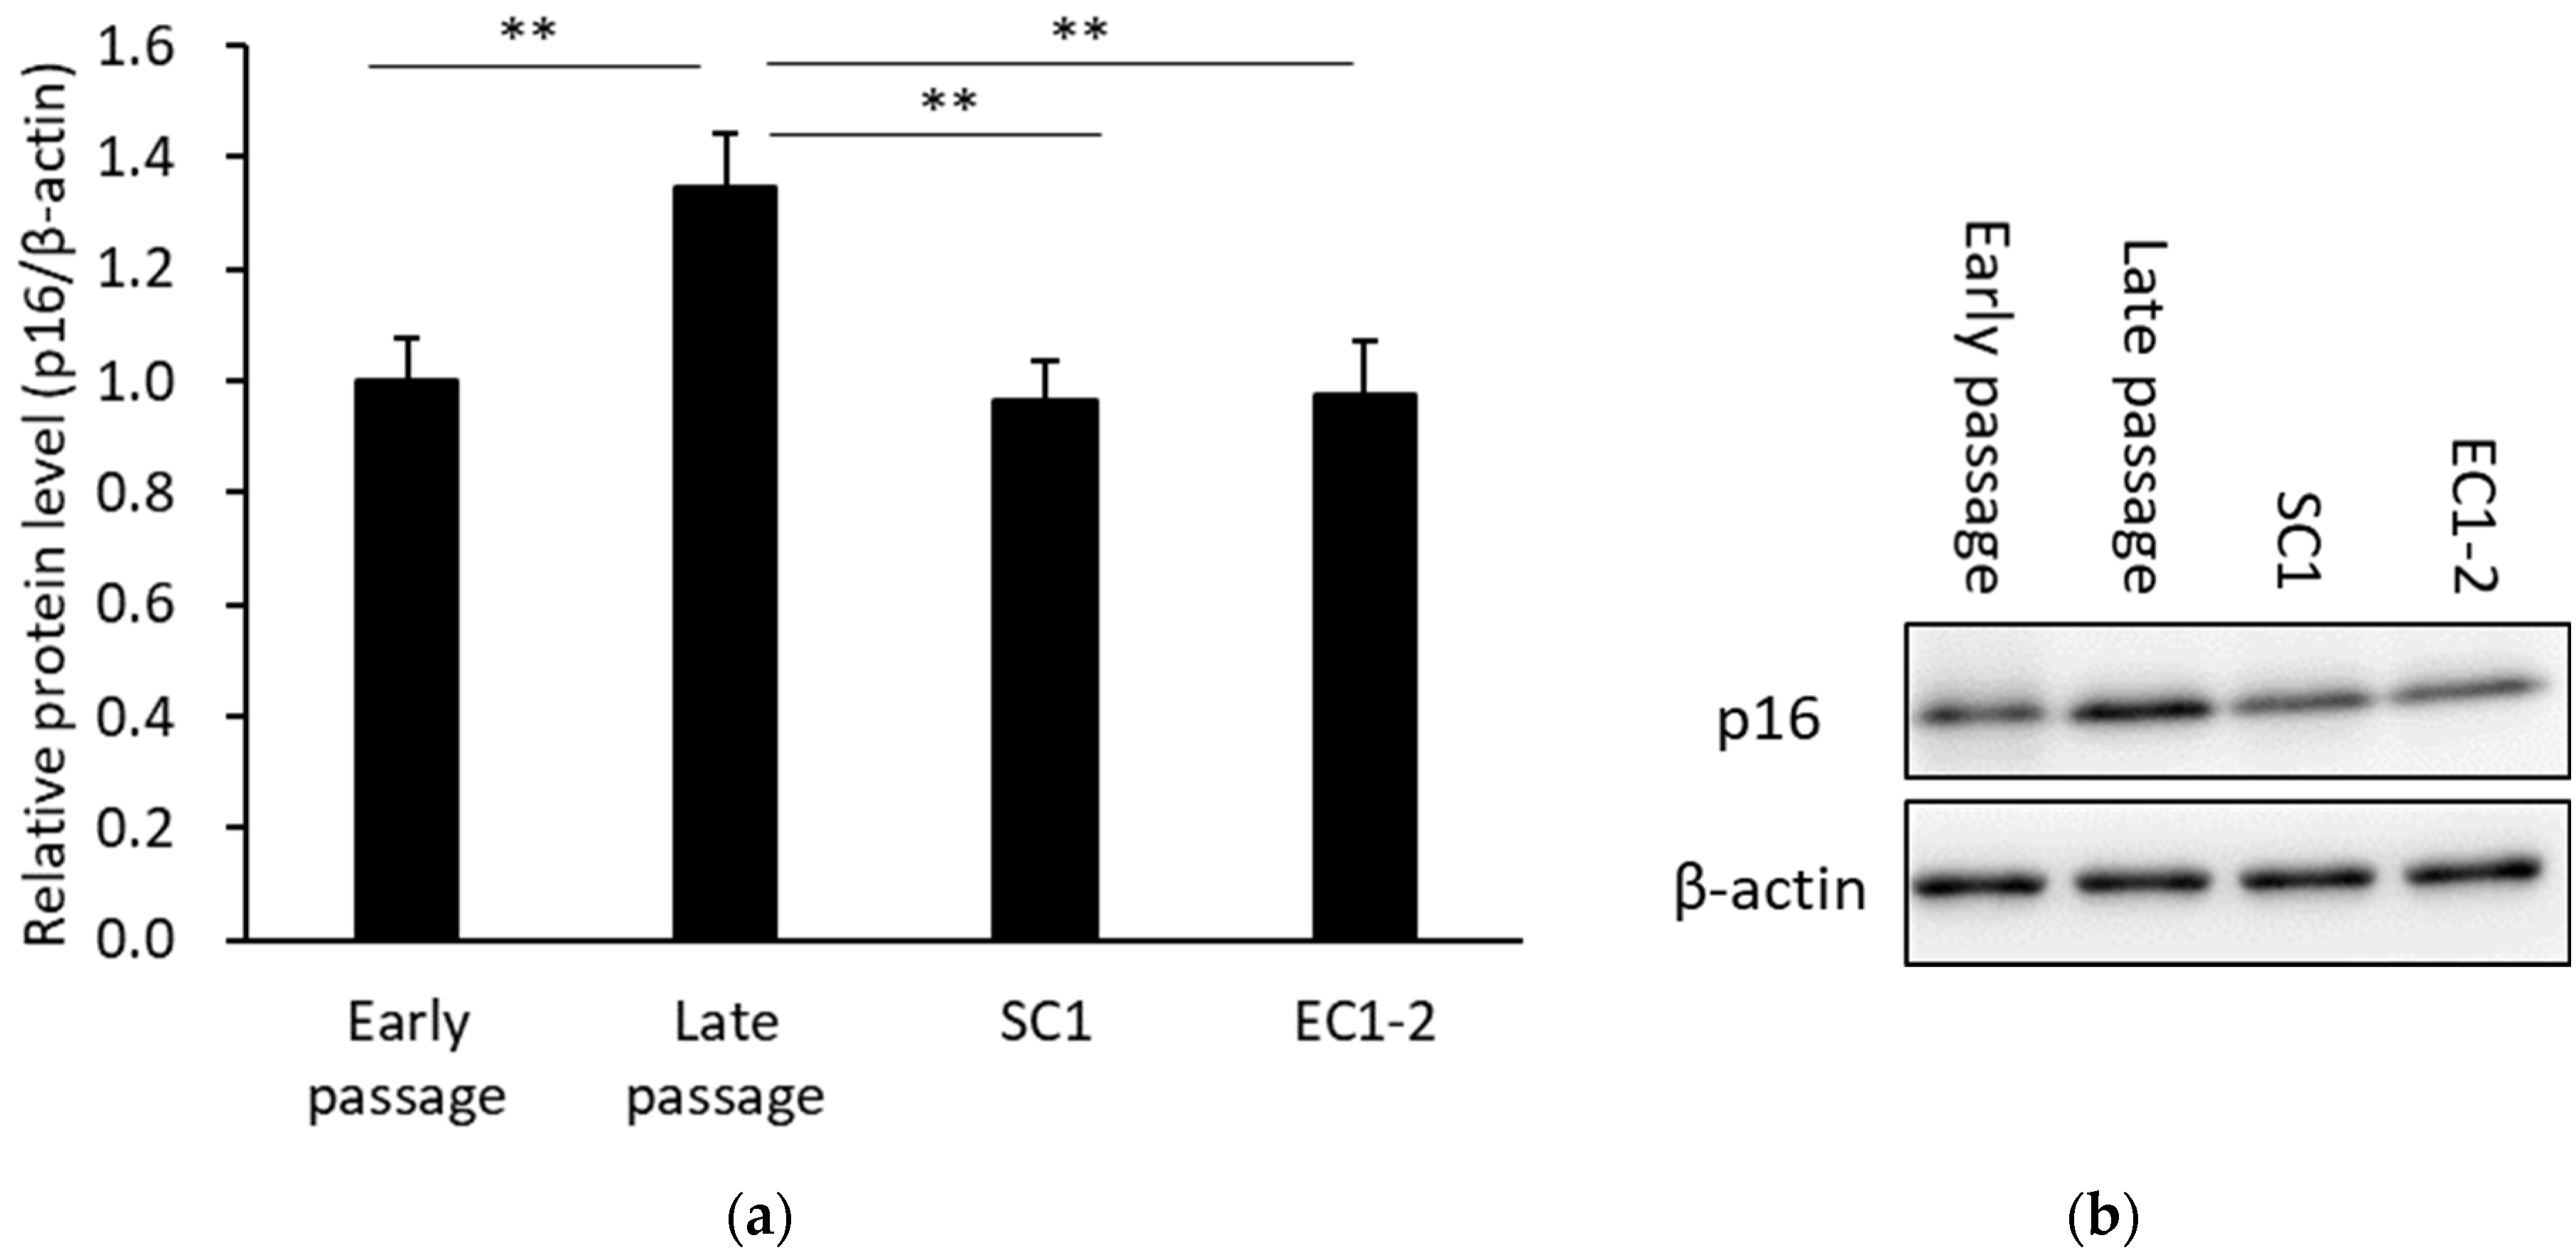
3.3. Inhibition of a Cellular Senescence Marker with SC1 and EC1-2
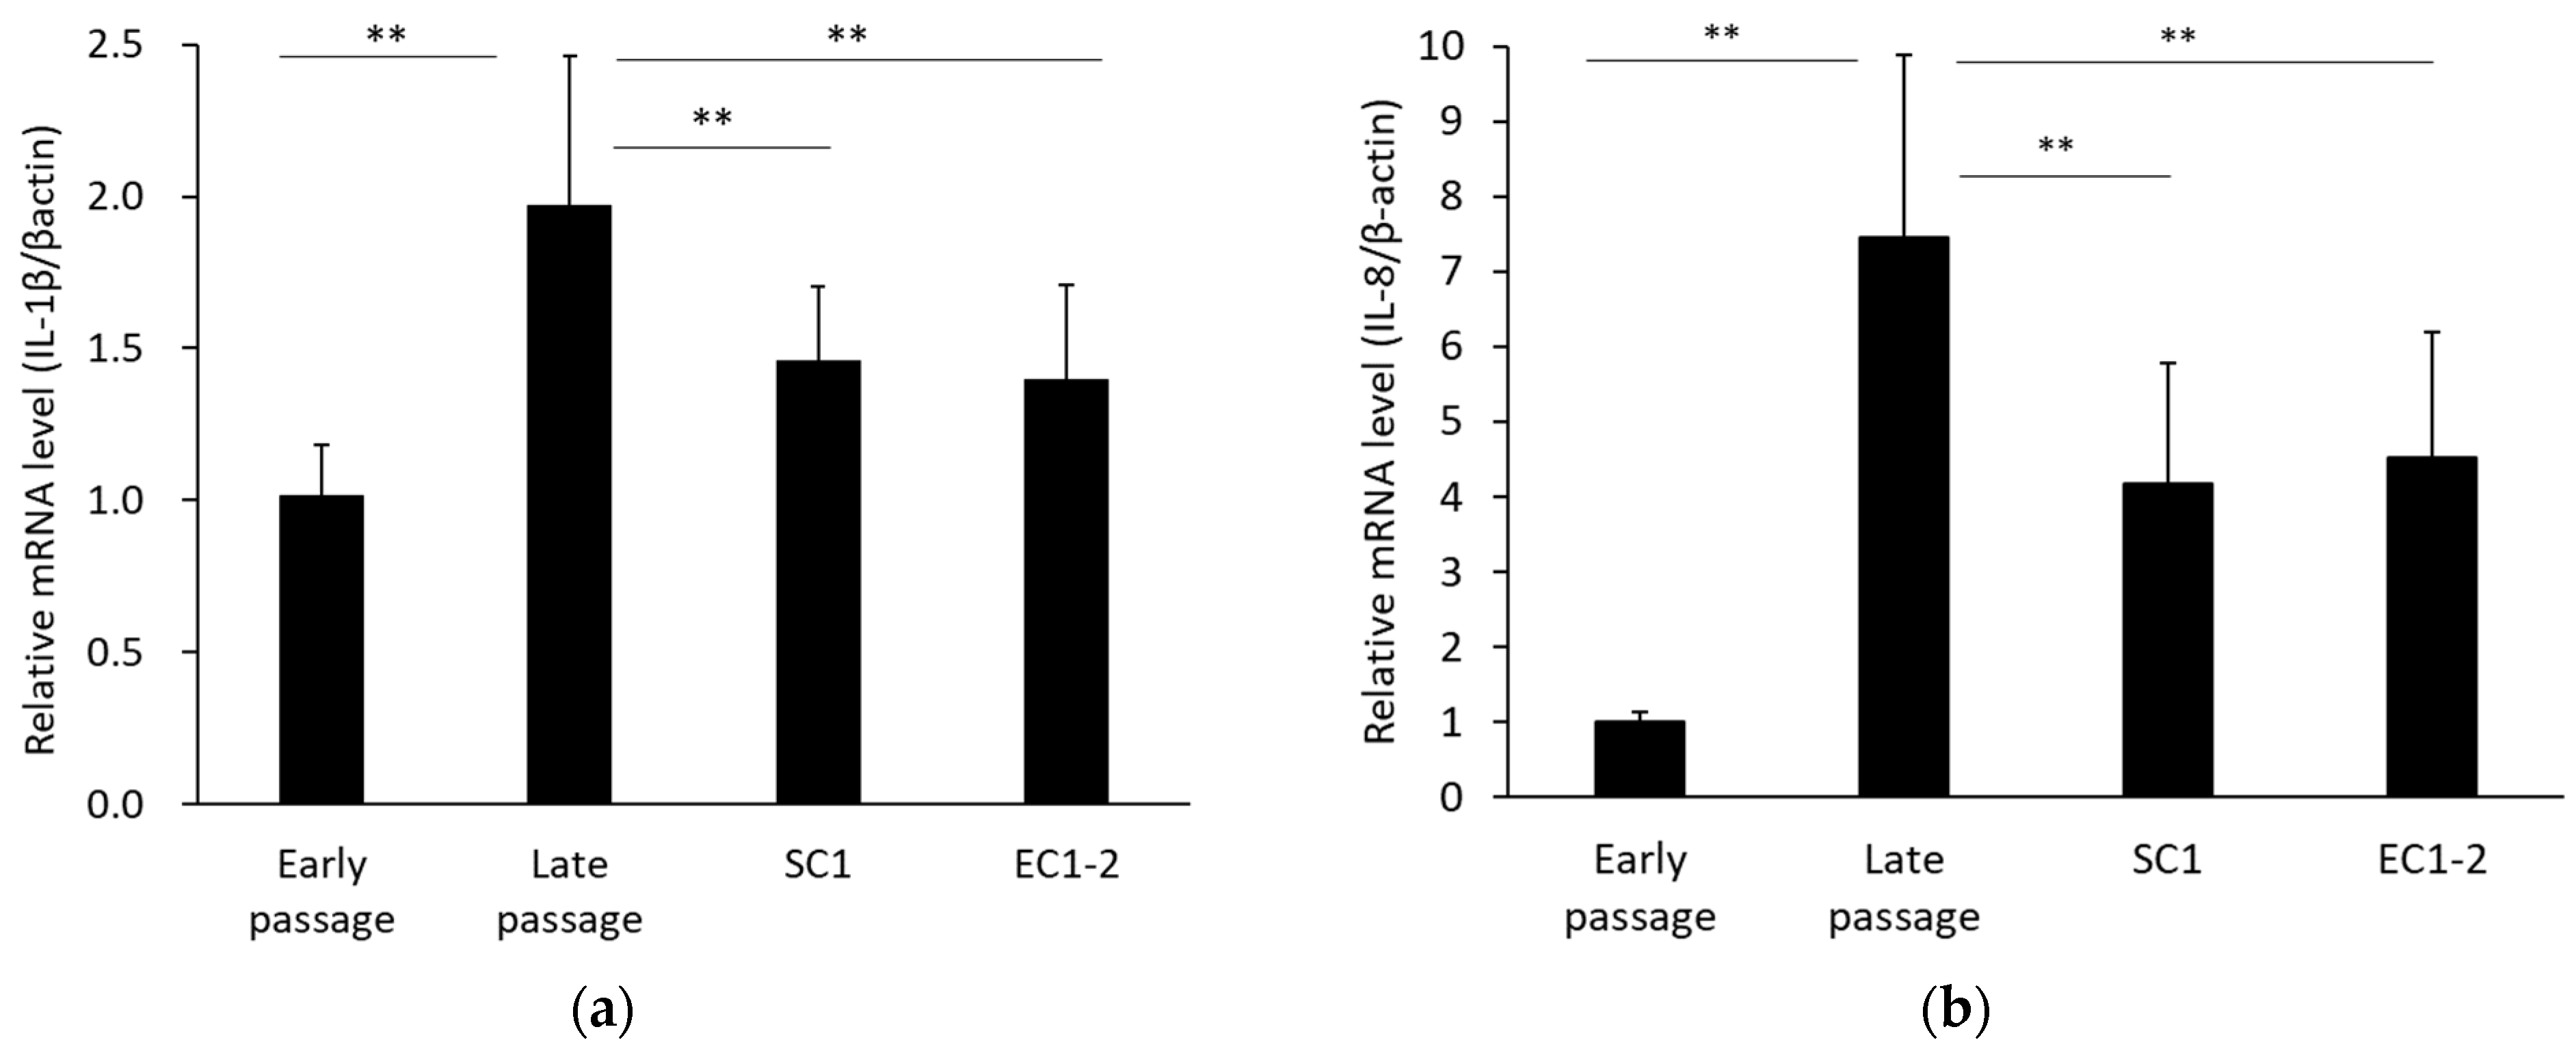
3.4. Inhibition of SASP with SC1 and EC1-2
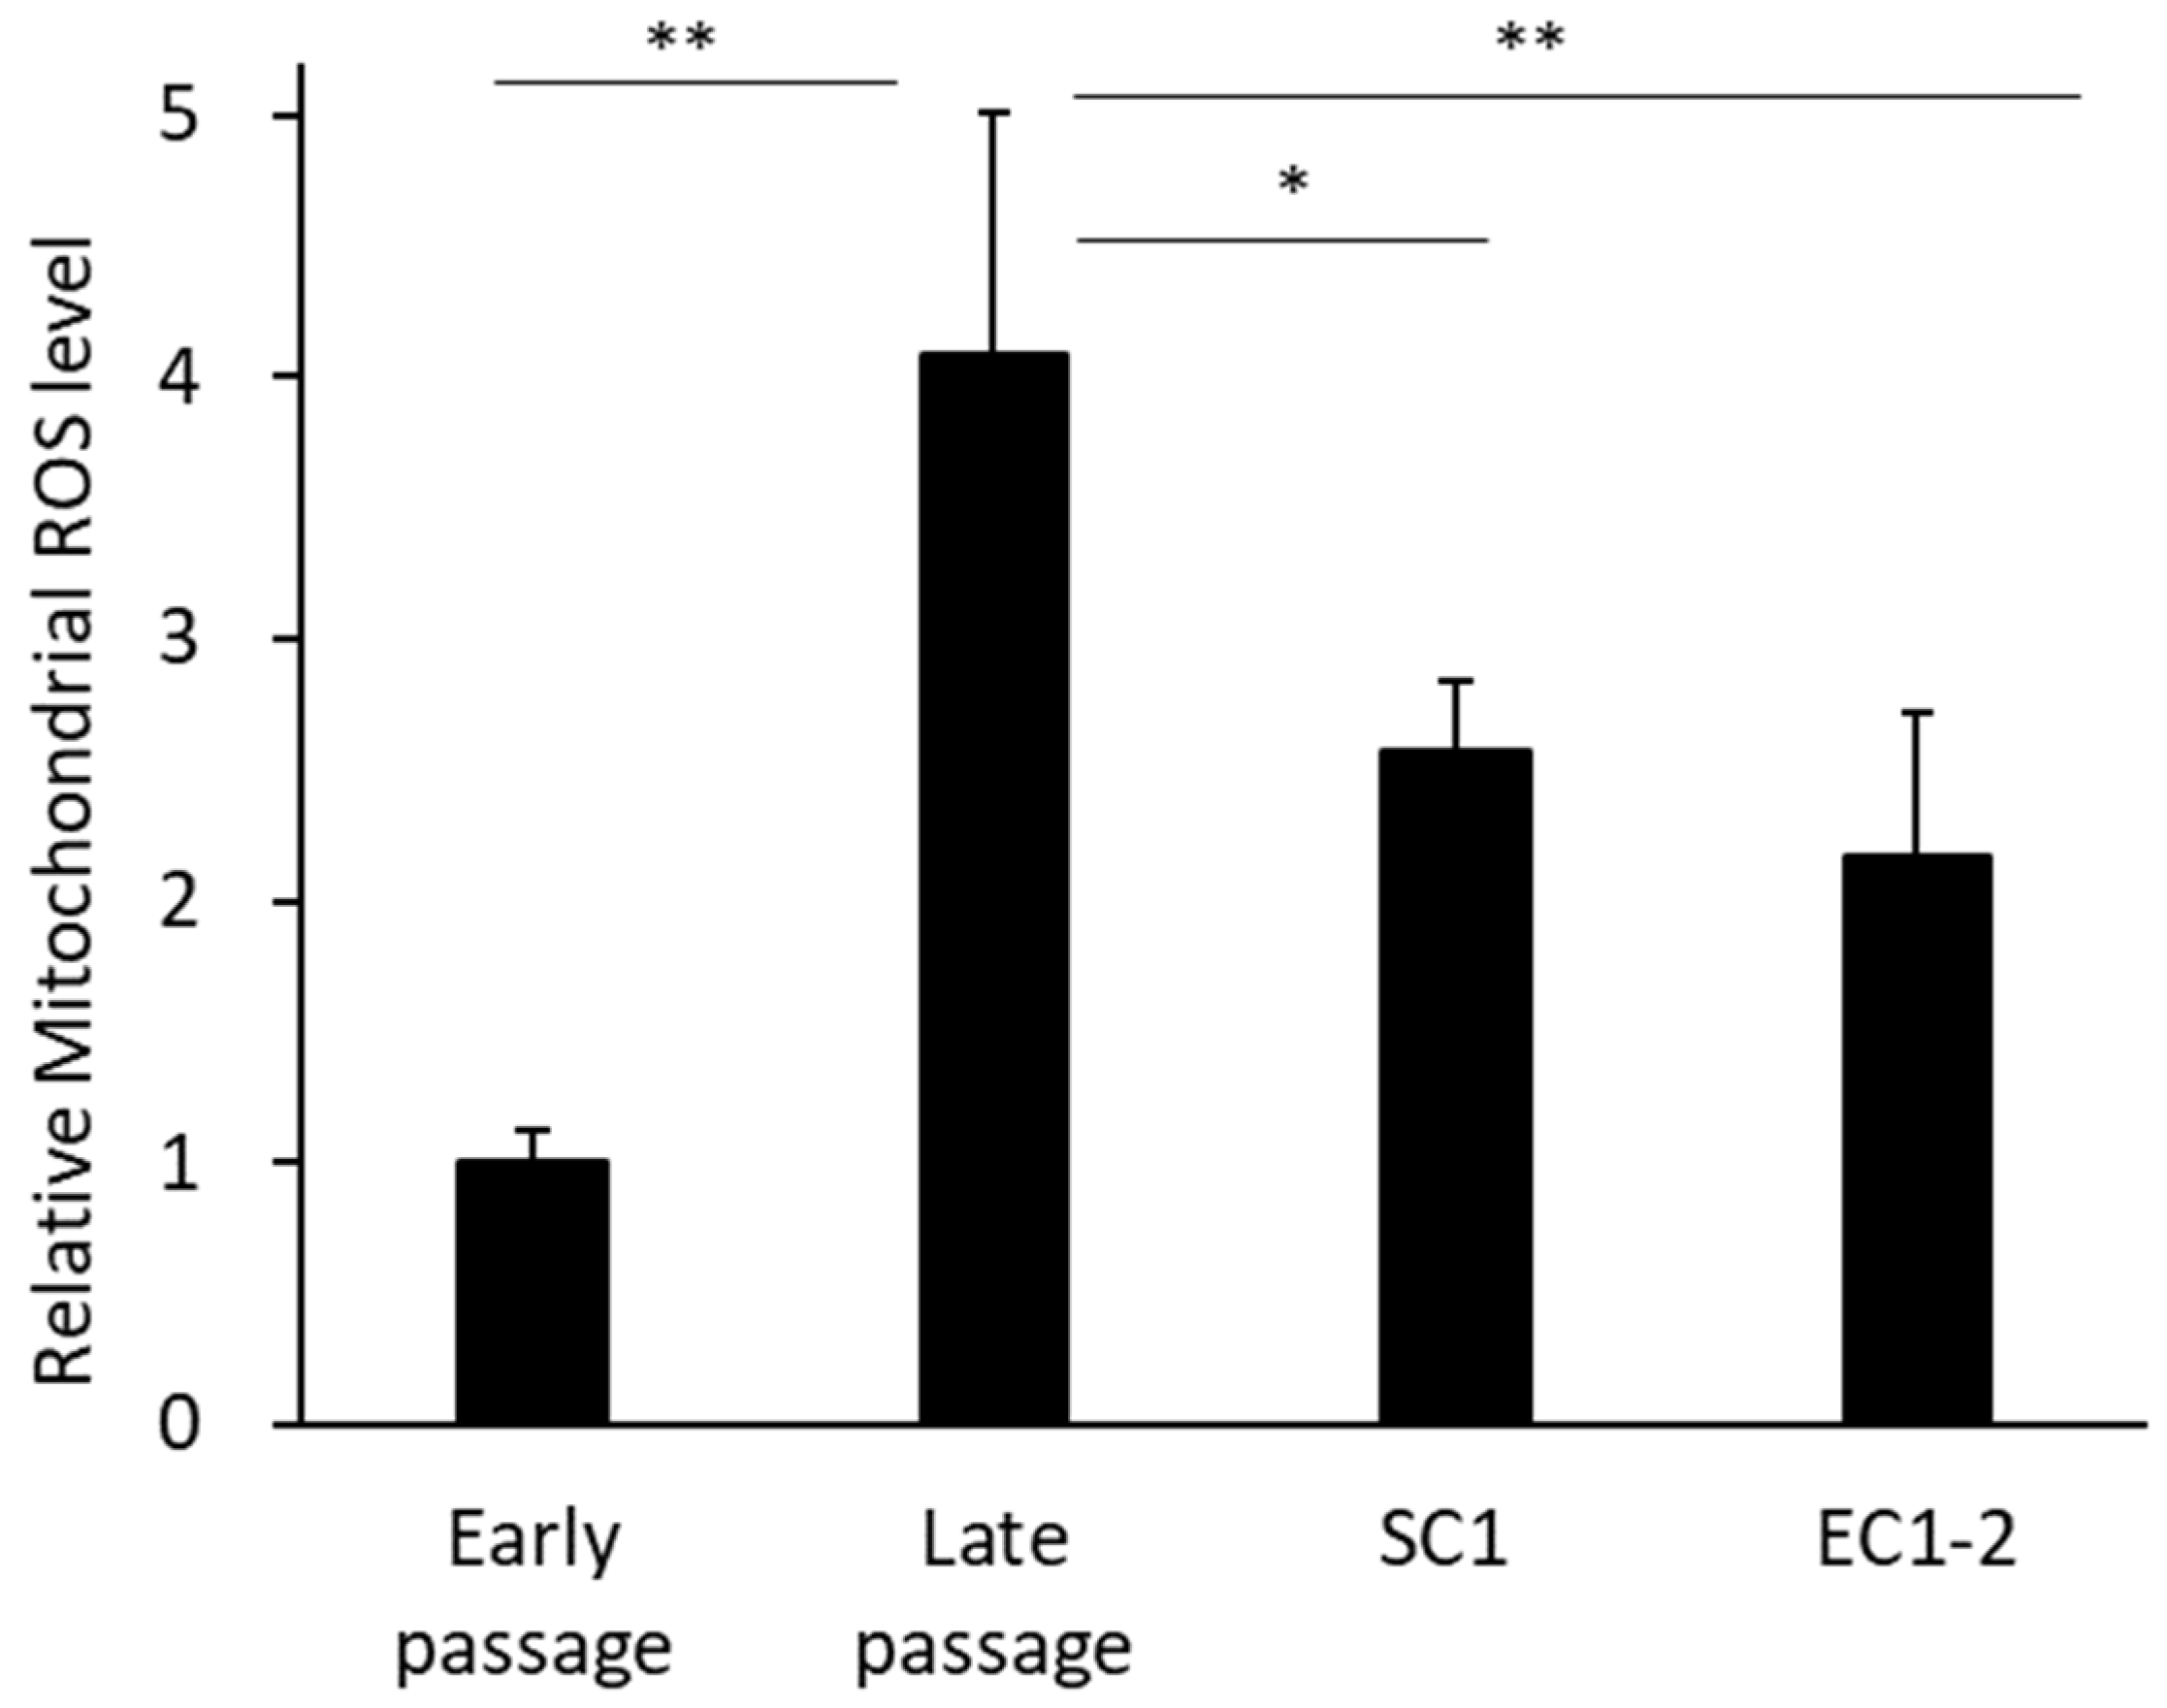
3.5. Inhibition of Superoxides in Mitochondria with SC1 and EC1-2
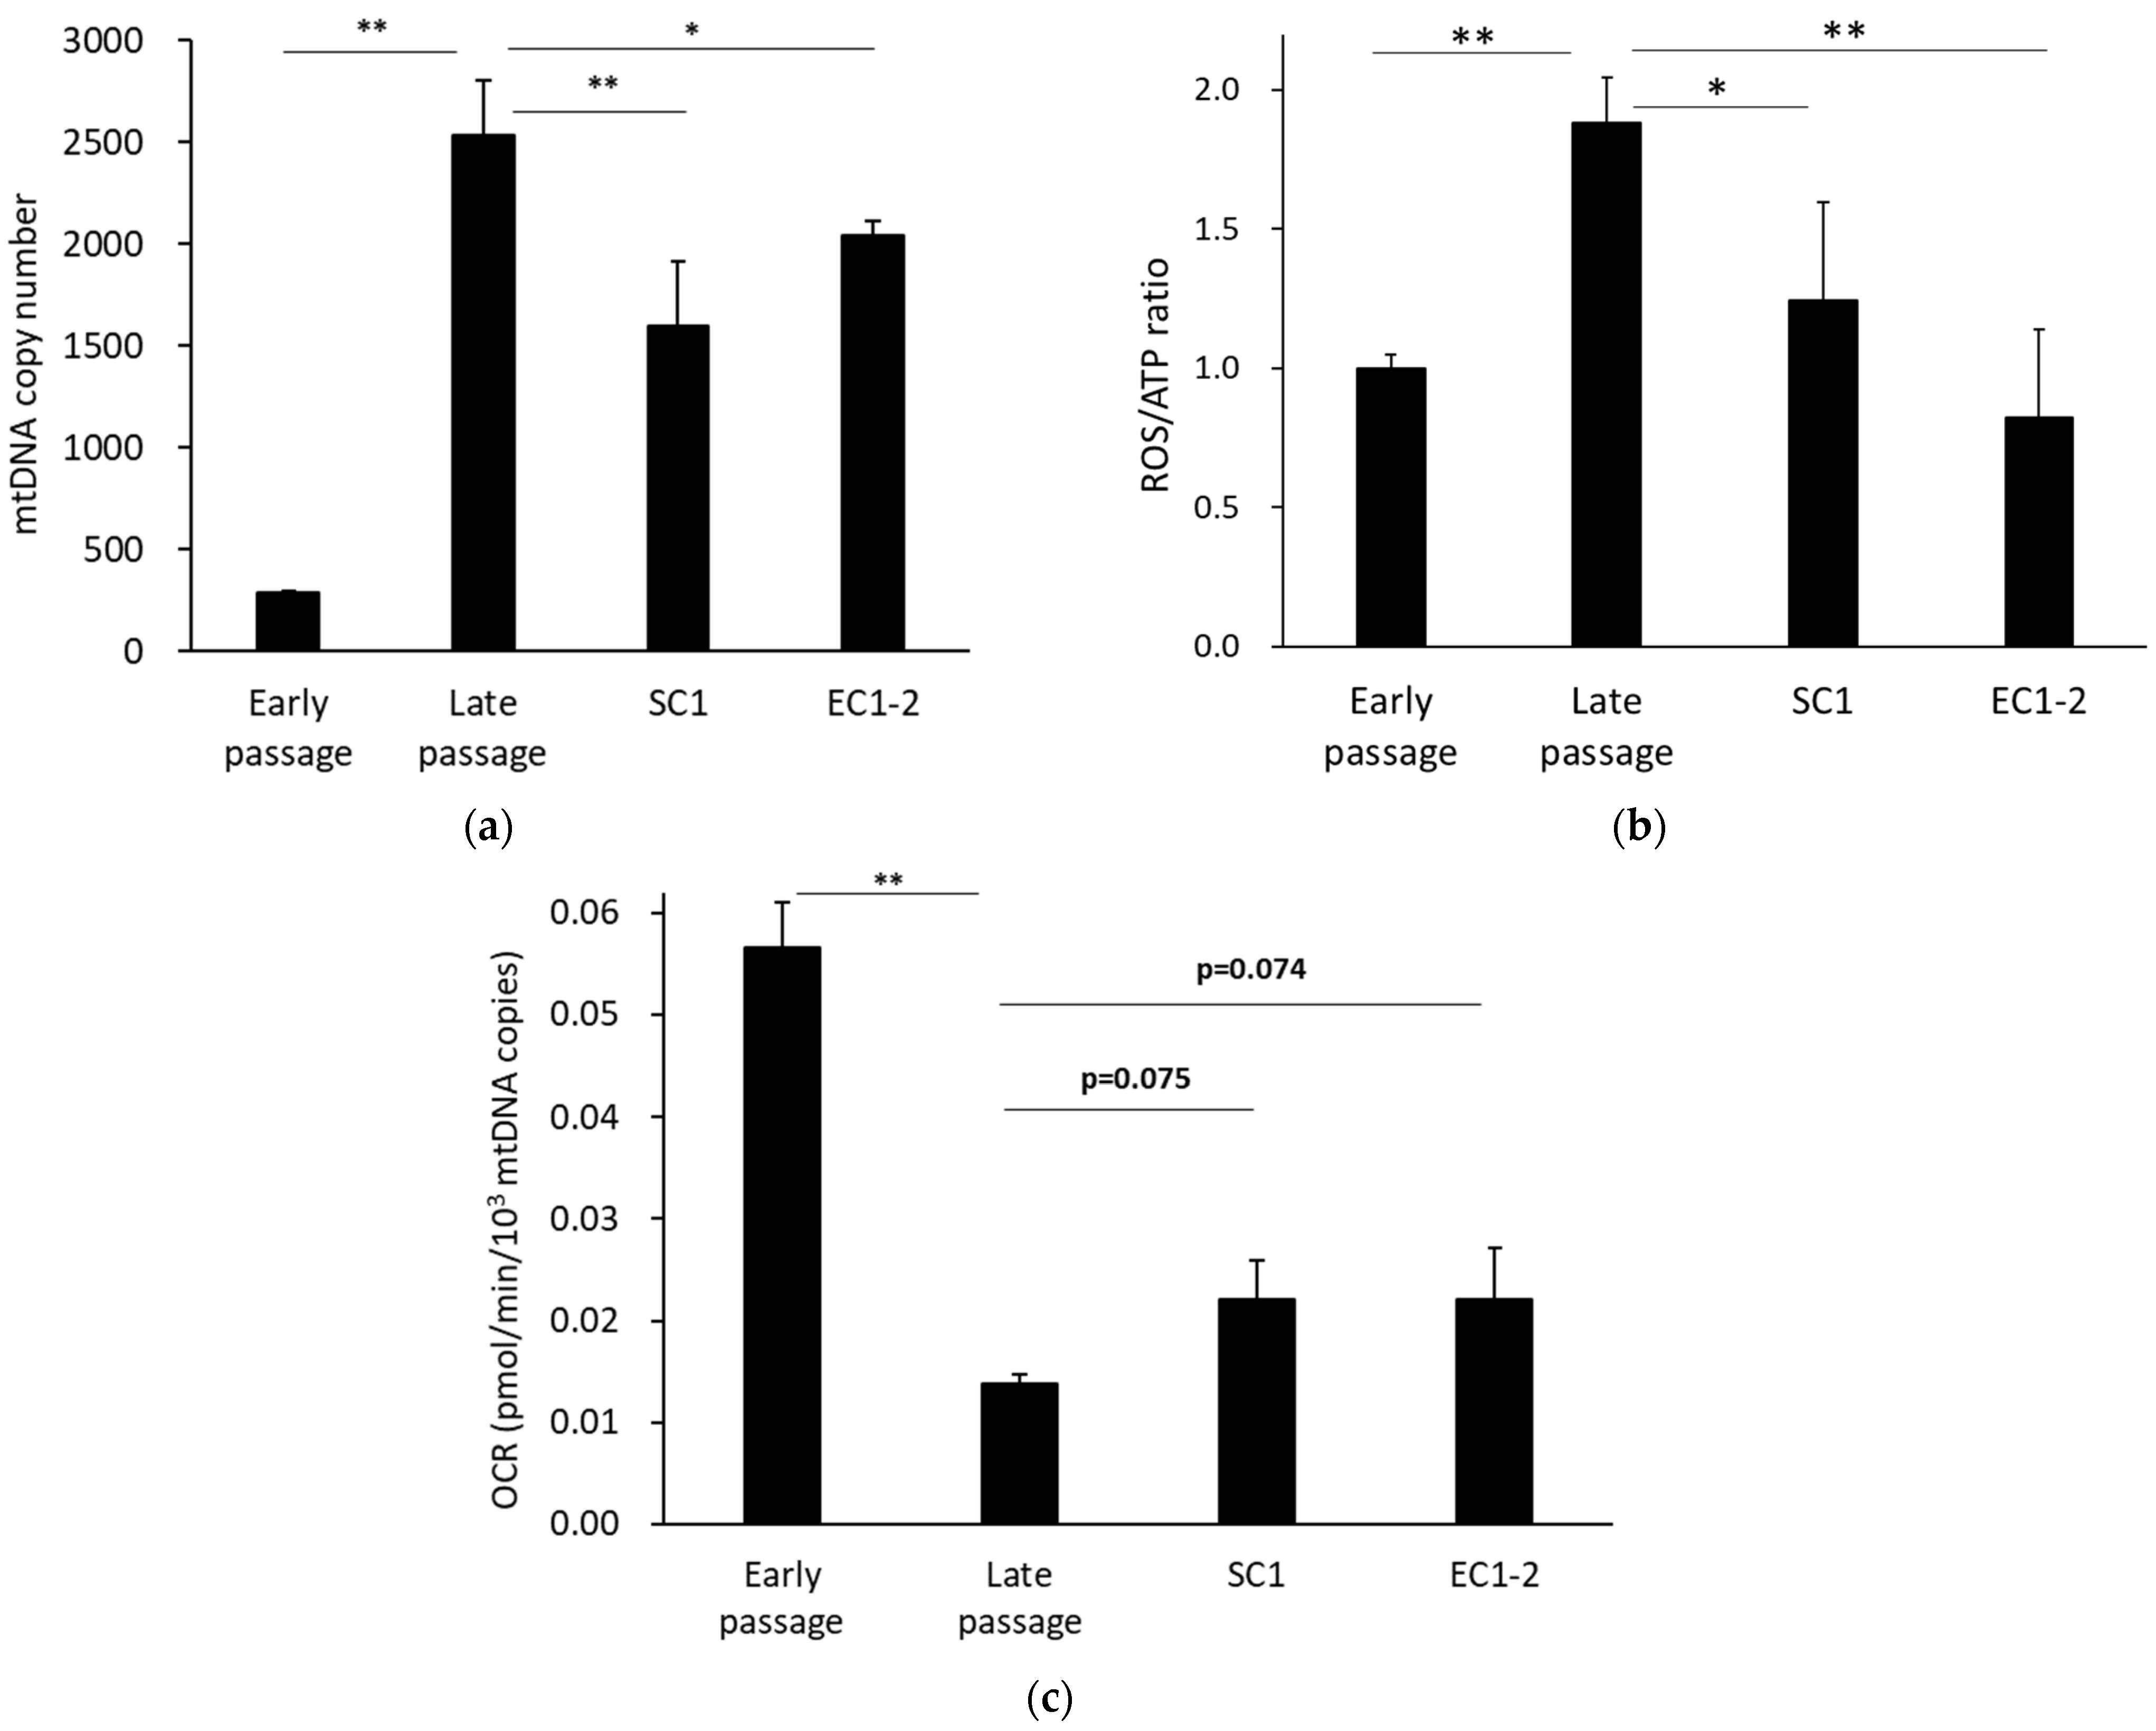
3.6. Improvement of Mitochondrial Function with SC1 and EC1-2
4. Discussion
5. Conclusions
Supplementary Materials
Author Contributions
Funding
Institutional Review Board Statement
Data Availability Statement
Acknowledgments
Conflicts of Interest
References
- Watanabe, S.; Kawamoto, S.; Ohtani, N.; Hara, E. Impact of senescence-associated secretory phenotype and its potential as a therapeutic target for senescence-associated diseases. Cancer Sci. 2017, 108, 563–569. [Google Scholar] [CrossRef] [PubMed] [Green Version]
- Campisi, J. Senescent cells, tumor suppression, and organismal aging: Good citizens, bad neighbors. Cell 2005, 120, 513–522. [Google Scholar] [CrossRef] [PubMed]
- Kuilman, T.; Michaloglou, C.; Mooi, J.W.; Peeper, S.D. The essence of senescence. Genes Dev. 2010, 24, 2463–2479. [Google Scholar] [CrossRef] [Green Version]
- Hernandez-Segura, A.; Nehme, J.; Demaria, M. Hallmarks of cellular senescence. Trends Cell Biol. 2018, 28, 436–453. [Google Scholar] [CrossRef] [PubMed]
- Sharpless, E.N.; Sherr, J.C. Forging a signature of in vivo senescence. Nat. Rev. Cancer 2015, 15, 397–408. [Google Scholar] [CrossRef] [PubMed]
- Hara, E.; Smist, R.; Parry, D.; Tahara, H.; Stone, S.; Peters, G. Regulation of p16CDKN2 expression and its implications for cell immortalization and senescence. Mol. Cell. Biol. 1996, 16, 859–867. [Google Scholar] [CrossRef] [Green Version]
- McConnell, B.B.; Gregory, J.F.; Stott, J.F.; Hara, E.; Peters, G. Induced expression of p16(INK4a) inhibits both CDK4- and CDK2-associated kinase activity by reassortment of cyclin-CDK-inhibitor complexes. Mol. Cell. Biol. 1999, 19, 1981–1989. [Google Scholar] [CrossRef] [Green Version]
- Rodier, F.; Coppé, J.-P.; Patil, K.C.; Hoeijmakers, A.M.W.; Muñoz, P.D.; Raza, R.S.; Freund, A.; Campeau, E.; Davalos, R.A.; Campisi, J. Persistent DNA damage signaling triggers senescence associated inflammatory cytokine secretion. Nat. Cell Biol. 2009, 11, 973–979. [Google Scholar] [CrossRef]
- Coppé, J.-P.; Patil, K.C.; Rodier, F.; Sun, Y.; Muñoz, P.D.; Goldstein, J.; Nelson, S.P.; Desprez, P.-Y.; Campisi, J. Senescence-associated secretory phenotypes reveal cell-nonautonomous functions of oncogenic RAS and the p53 tumor suppressor. PLoS Biol. 2008, 6, 2853–2868. [Google Scholar] [CrossRef]
- Gil, L.; Siems, W.; Mazurek, B.; Gross, J.; Schroeder, P.; Voss, P.; Grune, T. Age-associated analysis of oxidative stress parameters in human plasma and erythrocytes. Free Radic. Res. 2006, 40, 495–505. [Google Scholar] [CrossRef]
- Ichiba, M.; Yamada, S.; Ishii, K.; Gonda, K.; Murai, R.; Shimomura, T.; Saeki, T.; Kanbe, T.; Tanabe, Y.; Yoshida, Y.; et al. Significance of urinary excretion of 8-hydroxy-2’-deoxyguanosine in healthy subjects and liver disease patients. Hepatogastroenterology 2007, 54, 1736–1740. [Google Scholar]
- Liu, Y.; Sanoff, K.H.; Cho, H.; Burd, E.C.; Torrice, C.; Ibrahim, G.J.; Thomas, E.N.; Sharpless, E.N. Expression of p16INK4a in peripheral blood T-cells is a biomarker of human aging. Aging Cell 2009, 8, 439–448. [Google Scholar] [CrossRef] [PubMed] [Green Version]
- Baker, J.D.; Wijshake, T.; Tchkonia, T.; LeBrasseur, K.N.; Childs, G.B.; van de Sluis, B.; Kirkland, L.J.K.; van Deursen, M.J. Clearance of p16Ink4a-positive senescent cells delays ageing-associated disorders. Nature 2011, 479, 232–236. [Google Scholar] [CrossRef] [PubMed] [Green Version]
- Baker, J.D.; Childs, G.B.; Durik, M.; Wijers, E.M.; Sieben, J.C.; Zhong, J.; Saltness, A.R.; Jeganathan, B.K.; Verosa, C.G.; Pezeshki, A.; et al. Naturally occurring p16Ink4a-positive cells shorten healthy lifespan. Nature 2016, 530, 184–189. [Google Scholar] [CrossRef] [PubMed] [Green Version]
- Johmura, Y.; Yamanaka, T.; Omori, S.; Wang, T.-W.; Sugiura, Y.; Matsumoto, M.; Suzuki, N.; Kumamoto, S.; Yamaguchi, K.; Hatakeyama, S.; et al. Senolysis by glutaminolysis inhibition ameliorates various age-associated disorders. Science 2021, 371, 265–270. [Google Scholar] [CrossRef]
- Stöckl, P.; Hütter, E.; Zwerschke, W.; Jansen-Dürr, P. Sustained inhibition of oxidative phosphorylation impairs cell proliferation and induces premature senescence in human fibroblasts. Exp. Gerontol. 2006, 41, 674–682. [Google Scholar] [CrossRef]
- Kim, S.-J.; Mehta, H.H.; Wan, J.; Kuehnemann, C.; Chen, J.; Hu, J.-F.; Hoffman, R.A.; Cohen, P. Mitochondrial peptides modulate mitochondrial function during cellular senescence. Aging (Albany NY) 2018, 10, 1239–1256. [Google Scholar] [CrossRef]
- Correia-Melo, C.; Marques, D.M.F.; Anderson, R.; Hewitt, G.; Hewitt, R.; Cole, J.; Carroll, M.B.; Miwa, S.; Birch, J.; Merz, A.; et al. Mitochondria are required for pro-ageing features of the senescent phenotype. EMBO J. 2016, 35, 724–742. [Google Scholar] [CrossRef]
- Hara, H.; Araya, J.; Ito, S.; Kobayashi, K.; Takasaka, N.; Yoshii, Y.; Wakui, H.; Kojima, J.; Shimizu, K.; Numata, T.; et al. Mitochondrial fragmentation in cigarette smoke-induced bronchial epithelial cell senescence. Am. J. Physiol. Lung Cell. Mol. Physiol. 2013, 305, L737–L746. [Google Scholar] [CrossRef] [Green Version]
- Salazar, G.; Huang, J.; Feresin, G.R.; Zhao, Y.; Griendling, K.K. Zinc regulates Nox1 expression through a NF-κB and mitochondrial ROS dependent mechanism to induce senescence of vascular smooth muscle cells. Free Radic. Biol. Med. 2017, 108, 225–235. [Google Scholar] [CrossRef]
- Mistry, Y.; Poolman, T.; Williams, B.; Herbert, E.K. A role for mitochondrial oxidants in stress-induced premature senescence of human vascular smooth muscle cells. Redox Biol. 2013, 1, 411–417. [Google Scholar] [CrossRef] [PubMed] [Green Version]
- Ren, X.; Chen, L.; Xie, J.; Zhang, Z.; Dong, G.; Liang, J.; Liu, L.; Zhou, H.; Luo, P. Resveratrol ameliorates mitochondrial elongation via Drp1/Parkin/PINK1 signaling in senescent-like cardiomyocytes. Oxid. Med. Cell. Longev. 2017, 2017, 4175353. [Google Scholar] [CrossRef] [PubMed] [Green Version]
- Ito, S.; Araya, J.; Kurita, Y.; Kobayashi, K.; Takasaka, N.; Yoshida, M.; Hara, H.; Minagawa, S.; Wakui, H.; Fujii, S.; et al. PARK2-mediated mitophagy is involved in regulation of HBEC senescence in COPD pathogenesis. Autophagy 2015, 11, 547–559. [Google Scholar] [CrossRef]
- Lin, H.; Xiong, H.; Su, Z.; Pang, J.; Lai, L.; Zhang, H.; Jian, B.; Zhang, W.; Zheng, Y. Inhibition of DRP-1-dependent mitophagy promotes cochlea hair cell senescence and exacerbates age-related hearing loss. Front. Cell. Neurosci. 2019, 13, 550. [Google Scholar] [CrossRef] [PubMed] [Green Version]
- Dang, Y.; An, Y.; He, J.; Huang, B.; Zhu, J.; Gao, M.; Zhang, S.; Wang, X.; Yang, B.; Xie, Z. Berberine ameliorates cellular senescence and extends the lifespan of mice via regulating p16 and cyclin protein expression. Aging Cell 2020, 19, e13060. [Google Scholar] [CrossRef] [Green Version]
- Davalli, P.; Mitic, T.; Caporali, A.; Lauriola, A.; D’Arca, D. ROS, cell senescence, and novel molecular mechanisms in aging and age-related diseases. Oxid. Med. Cell. Longev. 2016, 2016, 3565127. [Google Scholar] [CrossRef] [PubMed] [Green Version]
- Nollet, E.; Hoymans, Y.V.; Rodorigus, R.I.; De Bock, D.; Dom, M.; Van Hoof, O.M.V.; Vrints, J.C.; Van Craenenbroeck, M.E. Accelerated cellular senescence as underlying mechanism for functionally impaired bone marrow-derived progenitor cells in ischemic heart disease. Atherosclerosis 2017, 260, 138–146. [Google Scholar] [CrossRef]
- Nakai, M.; Harada, M.; Nakahara, K.; Akimoto, K.; Shibata, H.; Miki, W.; Kiso, Y. Novel antioxidative metabolites in rat liver with ingested sesamin. J. Agric. Food Chem. 2003, 51, 1666–1670. [Google Scholar] [CrossRef]
- Nakai, M.; Kageyama, N.; Nakahara, K.; Miki, W. Decomposition reaction of sesamin in supercritical water. Biosci. Biotechnol. Biochem. 2006, 70, 1273–1276. [Google Scholar] [CrossRef]
- Yasuda, K.; Ikushiro, S.; Wakayama, S.; Itoh, T.; Yamamoto, K.; Kamakura, M.; Munetsuna, E.; Ohta, M.; Sakaki, T. Comparison of metabolism of sesamin and episesamin by drug-metabolizing enzymes in human liver. Drug Metab. Dispos. 2012, 40, 1917–1926. [Google Scholar] [CrossRef] [Green Version]
- Maharjan, S.; Oku, M.; Tsuda, M.; Hoseki, J.; Sakai, Y. Mitochondrial impairment triggers cytosolic oxidative stress and cell death following proteasome inhibition. Sci. Rep. 2014, 4, 5896. [Google Scholar] [CrossRef] [PubMed] [Green Version]
- Takada, S.; Kinugawa, S.; Matsushima, S.; Takemoto, D.; Furihata, T.; Mizushima, W.; Fukushima, A.; Yokota, T.; Ono, Y.; Shibata, H.; et al. Sesamin prevents decline in exercise capacity and impairment of skeletal muscle mitochondrial function in mice with high-fat diet-induced diabetes. Exp. Physiol. 2015, 100, 1319–1330. [Google Scholar] [CrossRef] [PubMed] [Green Version]
- Le, D.T.; Nakahara, Y.; Ueda, M.; Okumura, K.; Hirai, J.; Sato, Y.; Takemoto, D.; Tomimori, N.; Ono, Y.; Nakai, M.; et al. Sesamin suppresses aging phenotypes in adult muscular and nervous systems and intestines in a Drosophila senescence-accelerated model. Eur. Rev. Med. Pharmacol. Sci. 2019, 23, 1826–1839. [Google Scholar]
- Yuan, H.; Kaneko, T.; Matsuo, M. Increased susceptibility of late passage human diploid fibroblasts to oxidative stress. Exp. Gerontol. 1996, 31, 465–474. [Google Scholar] [CrossRef]
- Urata, H.; Nishioka, Y.; Tobashi, T.; Matsumura, Y.; Tomimori, N.; Ono, Y.; Kiso, Y.; Wada, S. First chemical synthesis of antioxidative metabolites of sesamin. Chem. Pharm. Bull. 2008, 56, 1611–1612. [Google Scholar] [CrossRef] [Green Version]
- Tomimori, N.; Nakai, M.; Ono, Y.; Kitagawa, Y.; Kiso, Y.; Shibata, H. Identification of the metabolites of episesamin in rat bile and human liver microsomes. Biol. Pharm. Bull. 2012, 35, 709–716. [Google Scholar] [CrossRef] [PubMed] [Green Version]
- Omori, S.; Wang, T.-W.; Johmura, Y.; Kanai, T.; Nakano, Y.; Kido, T.; Susaki, A.E.; Nakajima, T.; Shichino, S.; Ueha, S.; et al. Generation of a p16 reporter mouse and its use to characterize and target p16high cells In vivo. Cell Metab. 2020, 32, 814–828.e6. [Google Scholar] [CrossRef]
- Takahashi, A.; Loo, M.T.; Okada, R.; Kamachi, F.; Watanabe, Y.; Wakita, M.; Watanabe, S.; Kawamoto, S.; Miyata, K.; Barber, N.G.; et al. Downregulation of cytoplasmic DNases is implicated in cytoplasmic DNA accumulation and SASP in senescent cells. Nat. Commun. 2018, 9, 1249. [Google Scholar] [CrossRef]
- Liu, X.; Ye, F.; Xiong, H.; Hu, D.; Limb, A.G.; Xie, T.; Peng, L.; Yang, W.; Sun, Y.; Zhou, M.; et al. IL-1β upregulates IL-8 production in human Müller cells through activation of the p38 MAPK and ERK1/2 signaling pathways. Inflammation 2014, 37, 1486–1495. [Google Scholar] [CrossRef]
- Roussel, D.; Boël, M.; Mortz, M.; Romestaing, C.; Duchamp, C.; Voituron, Y. Threshold effect in the H2O2 production of skeletal muscle mitochondria during fasting and refeeding. J. Exp. Biol. 2019, 222, jeb196188. [Google Scholar] [CrossRef] [Green Version]
- Abdul-Ghani, A.M.; Jani, R.; Chavez, A.; Molina-Carrion, M.; Tripathy, D.; Defronzo, A.R. Mitochondrial reactive oxygen species generation in obese non-diabetic and type 2 diabetic participants. Diabetologia 2009, 52, 574–582. [Google Scholar] [CrossRef] [PubMed] [Green Version]
- D’Erchia, M.A.; Atlante, A.; Gadaleta, G.; Pavesi, G.; Chiara, M.; De Virgilio, C.; Manzari, C.; Mastropasqua, F.; Prazzoli, M.G.; Picardi, E.; et al. Tissue-specific mtDNA abundance from exome data and its correlation with mitochondrial transcription, mass and respiratory activity. Mitochondrion 2015, 20, 13–21. [Google Scholar] [CrossRef] [PubMed]
- Fujita, Y.; Iketani, M.; Ito, M.; Ohsawa, I. Temporal changes in mitochondrial function and reactive oxygen species generation during the development of replicative senescence in human fibroblasts. Exp. Gerontol. 2022, 165, 111866. [Google Scholar] [CrossRef] [PubMed]
- König, J.; Ott, C.; Hugo, M.; Jung, T.; Bulteau, A.-L.; Grune, T.; Höhn, A. Mitochondrial contribution to lipofuscin formation. Redox Biol. 2017, 11, 673–681. [Google Scholar] [CrossRef]
- Deesrisak, K.; Chatupheeraphat, C.; Roytrakul, S.; Anurathapan, U.; Tanyong, D. Autophagy and apoptosis induction by sesamin in MOLT-4 and NB4 leukemia cells. Oncol. Lett. 2021, 21, 32. [Google Scholar] [CrossRef]
- Ikeda, T.; Nishijima, Y.; Shibata, H.; Kiso, Y.; Ohnuki, K.; Fushiki, T.; Morita, T. Protective effect of sesamin administration on exercise-induced lipid peroxidation. Int. J. Sports Med. 2003, 24, 530–534. [Google Scholar]
- Hong, L.; Yi, W.; Liangliang, C.; Juncheng, H.; Qin, W.; Xiaoxiang, Z. Hypoglycaemic and hypolipidaemic activities of sesamin from sesame meal and its ability to ameliorate insulin resistance in KK-Ay mice. J. Sci. Food Agric. 2013, 93, 1833–1838. [Google Scholar] [CrossRef]
- Le, D.T.; Inoue, H.Y. Sesamin Activates Nrf2/Cnc-Dependent Transcription in the Absence of Oxidative Stress in Drosophila Adult Brains. Antioxidants 2021, 10, 924. [Google Scholar] [CrossRef]


| Treatment Group | PDL | |
|---|---|---|
| Late passage | - | 73.2 ± 0.44 |
| Sesamin | 1 μM | 73.6 ± 0.47 |
| Epiesamin | 1 μM | 73.6 ± 0.45 |
| SC1 | 100 nM | 73.4 ± 0.37 |
| 1 μM | 74.5 ± 0.57 * | |
| EC1-2 | 100 nM | 72.3 ± 0.76 |
| 1 μM | 74.5 ± 0.32 * | |
Disclaimer/Publisher’s Note: The statements, opinions and data contained in all publications are solely those of the individual author(s) and contributor(s) and not of MDPI and/or the editor(s). MDPI and/or the editor(s) disclaim responsibility for any injury to people or property resulting from any ideas, methods, instructions or products referred to in the content. |
© 2023 by the authors. Licensee MDPI, Basel, Switzerland. This article is an open access article distributed under the terms and conditions of the Creative Commons Attribution (CC BY) license (https://creativecommons.org/licenses/by/4.0/).
Share and Cite
Araki, C.; Takemoto, D.; Kitagawa, Y.; Tateishi, N.; Rogi, T.; Izumo, T.; Kawamoto, S.; Shibata, H.; Hara, E.; Nakai, M. Sesamin Metabolites Suppress the Induction of Cellular Senescence. Nutrients 2023, 15, 1627. https://doi.org/10.3390/nu15071627
Araki C, Takemoto D, Kitagawa Y, Tateishi N, Rogi T, Izumo T, Kawamoto S, Shibata H, Hara E, Nakai M. Sesamin Metabolites Suppress the Induction of Cellular Senescence. Nutrients. 2023; 15(7):1627. https://doi.org/10.3390/nu15071627
Chicago/Turabian StyleAraki, Chie, Daisuke Takemoto, Yoshinori Kitagawa, Norifumi Tateishi, Tomohiro Rogi, Takayuki Izumo, Shimpei Kawamoto, Hiroshi Shibata, Eiji Hara, and Masaaki Nakai. 2023. "Sesamin Metabolites Suppress the Induction of Cellular Senescence" Nutrients 15, no. 7: 1627. https://doi.org/10.3390/nu15071627