
Alcohol Consumption and a Decline in Glomerular Filtration Rate: The Japan Specific Health Checkups Study

 , , , , , , ,
Abstract
:1. Introduction
2. Materials and Methods
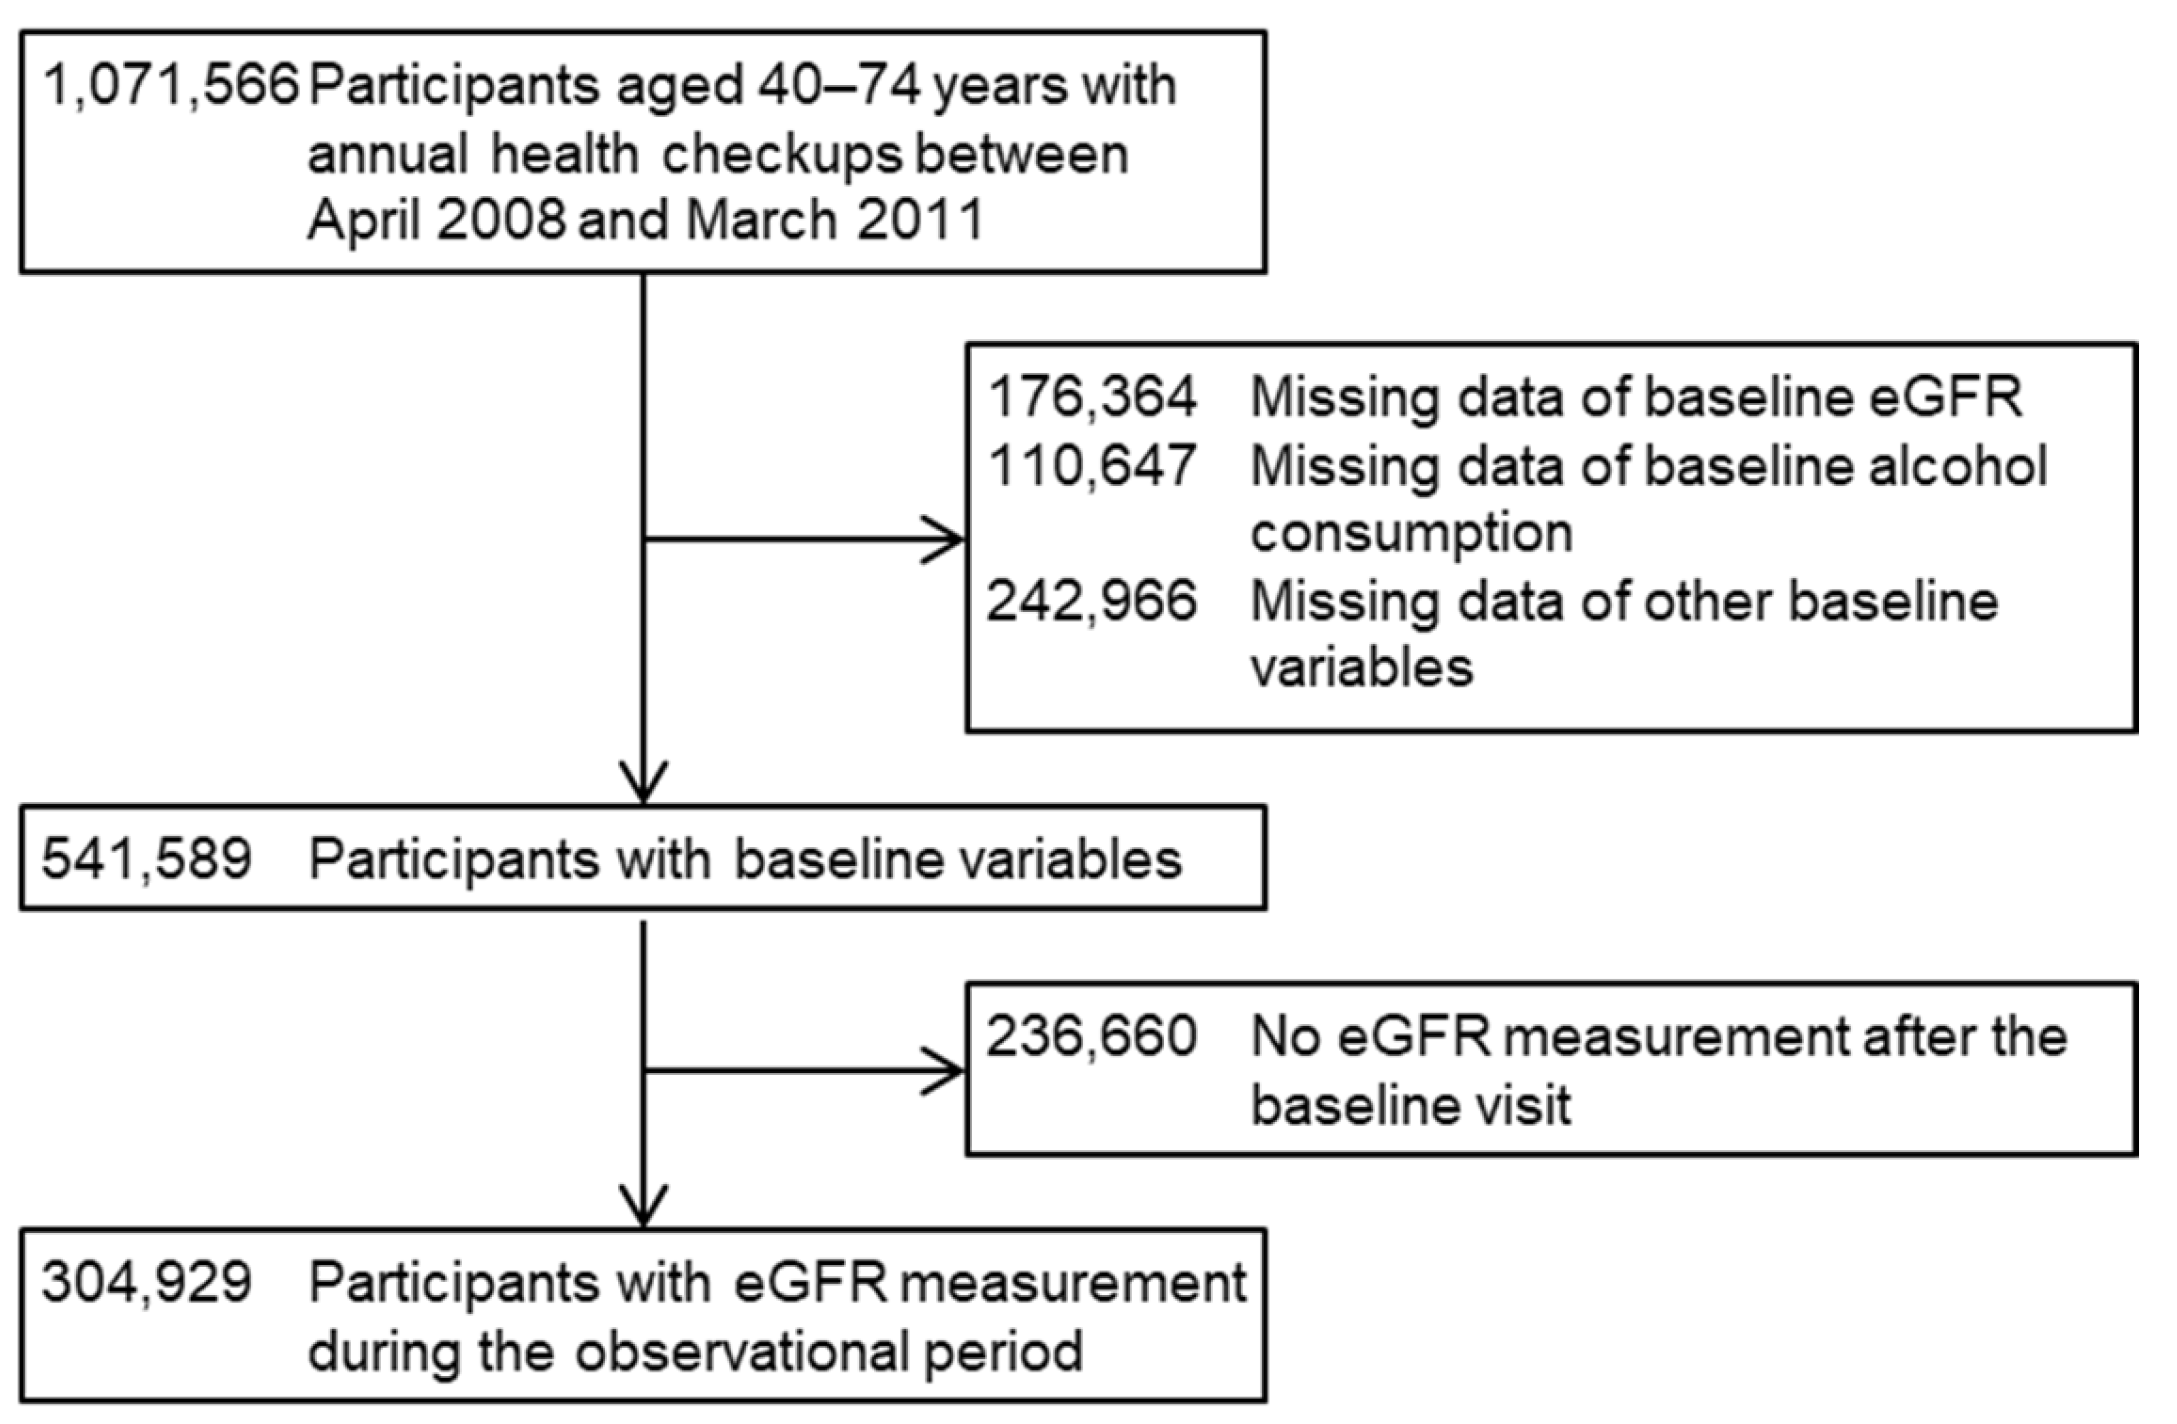
2.1. Participants
2.2. Measurements
2.3. Outcomes
2.4. Statistics
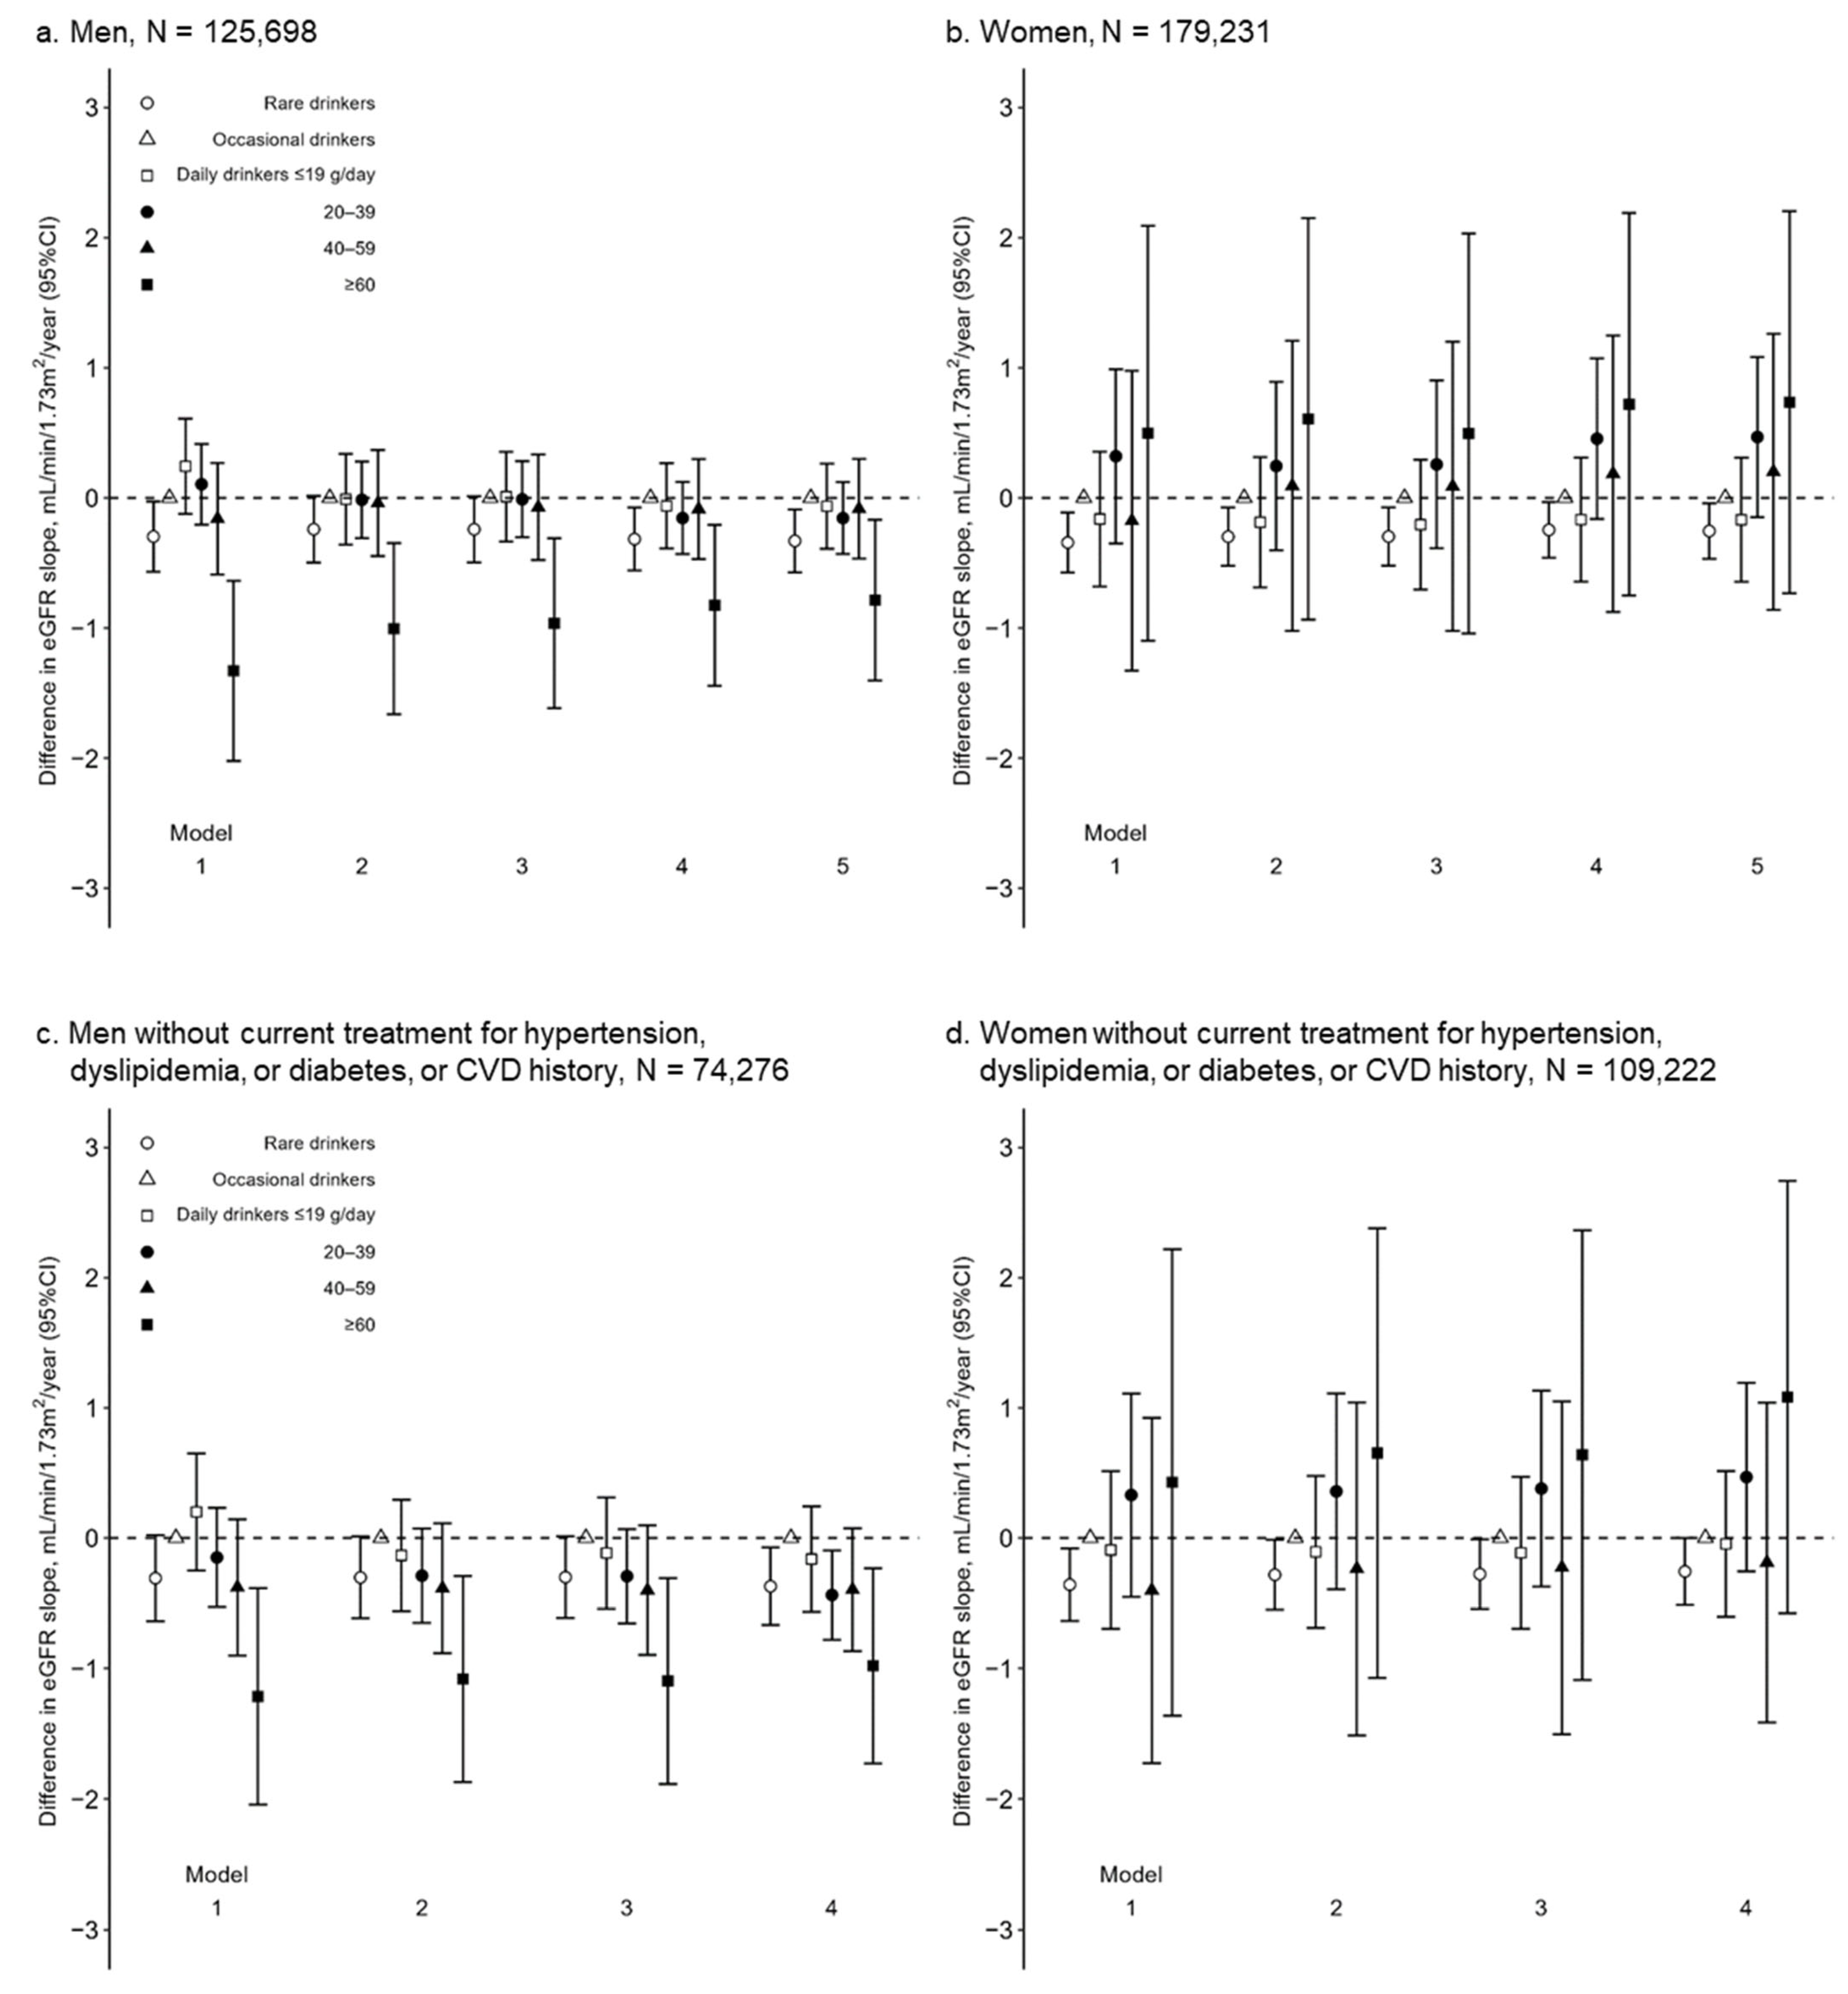
3. Results
4. Discussion
5. Conclusions
Supplementary Materials
Author Contributions
Funding
Institutional Review Board Statement
Informed Consent Statement
Data Availability Statement
Conflicts of Interest
References
- GBD. 2017 Risk Factor Collaborators Global, Regional, and National Comparative Risk Assessment of 84 Behavioural, Environmental and Occupational, and Metabolic Risks or Clusters of Risks for 195 Countries and Territories, 1990–2017: A Systematic Analysis for the Global Burden of Disease Study 2017. Lancet 2018, 392, 1923–1994. [Google Scholar] [CrossRef] [Green Version]
- Gmel, G.; Gutjahr, E.; Rehm, J. How Stable Is the Risk Curve between Alcohol and All-Cause Mortality and What Factors Influence the Shape? A Precision-Weighted Hierarchical Meta-Analysis. Eur. J. Epidemiol. 2003, 18, 631–642. [Google Scholar] [CrossRef]
- Di Castelnuovo, A. Alcohol Dosing and Total Mortality in Men and Women. Arch. Intern. Med. 2006, 166, 2437–2445. [Google Scholar] [CrossRef] [Green Version]
- Wang, C.; Xue, H.; Wang, Q.; Hao, Y.; Li, D.; Gu, D.; Huang, J. Effect of Drinking on All-Cause Mortality in Women Compared with Men: A Meta-Analysis. J. Women’s Health 2014, 23, 373–381. [Google Scholar] [CrossRef] [Green Version]
- Stockwell, T.; Zhao, J.; Panwar, S.; Roemer, A.; Naimi, T.; Chikritzhs, T. Do “Moderate” Drinkers Have Reduced Mortality Risk? A Systematic Review and Meta-Analysis of Alcohol Consumption and All-Cause Mortality. J. Stud. Alcohol Drugs 2016, 77, 185–198. [Google Scholar] [CrossRef] [PubMed] [Green Version]
- Rehm, J.; Baliunas, D.; Borges, G.L.G.; Graham, K.; Irving, H.; Kehoe, T.; Parry, C.D.; Patra, J.; Popova, S.; Poznyak, V.; et al. The Relation between Different Dimensions of Alcohol Consumption and Burden of Disease: An Overview. Addiction 2010, 105, 817–843. [Google Scholar] [CrossRef] [PubMed] [Green Version]
- Wood, A.M.; Kaptoge, S.; Butterworth, A.S.; Willeit, P.; Warnakula, S.; Bolton, T.; Paige, E.; Paul, D.S.; Sweeting, M.; Burgess, S.; et al. Risk Thresholds for Alcohol Consumption: Combined Analysis of Individual-Participant Data for 599,912 Current Drinkers in 83 Prospective Studies. Lancet 2018, 391, 1513–1523. [Google Scholar] [CrossRef] [Green Version]
- Ronksley, P.E.; Brien, S.E.; Turner, B.J.; Mukamal, K.J.; Ghali, W.A. Association of Alcohol Consumption with Selected Cardiovascular Disease Outcomes: A Systematic Review and Meta-Analysis. BMJ 2011, 342, d671. [Google Scholar] [CrossRef] [PubMed] [Green Version]
- Reynolds, K.; Lewis, B.; Nolen, J.D.L.; Kinney, G.L.; Sathya, B.; He, J.; Lewis, B.L. Alcohol Consumption and Risk of Stroke: A Meta-Analysis. JAMA 2003, 289, 579–588. [Google Scholar] [CrossRef]
- Patra, J.; Taylor, B.; Irving, H.; Roerecke, M.; Baliunas, D.; Mohapatra, S.; Rehm, J. Alcohol Consumption and the Risk of Morbidity and Mortality for Different Stroke Types—A Systematic Review and Meta-Analysis. BMC Public Health 2010, 10, 258. [Google Scholar] [CrossRef] [Green Version]
- Koppes, L.L.J.; Dekker, J.M.; Hendriks, H.F.J.; Bouter, L.M.; Heine, R.J. Moderate Alcohol Consumption Lowers the Risk of Type 2 Diabetes: A Meta-Analysis of Prospective Observational Studies. Diabetes Care 2005, 28, 719–725. [Google Scholar] [CrossRef] [PubMed] [Green Version]
- Baliunas, D.O.; Taylor, B.J.; Irving, H.; Roerecke, M.; Patra, J.; Mohapatra, S.; Rehm, J. Alcohol as a Risk Factor for Type 2 Diabetes: A Systematic Review and Meta-Analysis. Diabetes Care 2009, 32, 2123–2132. [Google Scholar] [CrossRef] [Green Version]
- Li, X.-H.; Yu, F.-F.; Zhou, Y.-H.; He, J. Association between Alcohol Consumption and the Risk of Incident Type 2 Diabetes: A Systematic Review and Dose-Response Meta-Analysis. Am. J. Clin. Nutr. 2016, 103, 818–829. [Google Scholar] [CrossRef] [Green Version]
- Huang, J.; Wang, X.; Zhang, Y. Specific Types of Alcoholic Beverage Consumption and Risk of Type 2 Diabetes: A Systematic Review and Meta-Analysis. J. Diabetes Investig. 2017, 8, 56–68. [Google Scholar] [CrossRef] [PubMed] [Green Version]
- Samokhvalov, A.V.; Irving, H.M.; Rehm, J. Alcohol Consumption as a Risk Factor for Atrial Fibrillation: A Systematic Review and Meta-Analysis. Eur. J. Cardiovasc. Prev. Rehabil. 2010, 17, 706–712. [Google Scholar] [CrossRef] [PubMed] [Green Version]
- Kodama, S.; Saito, K.; Tanaka, S.; Horikawa, C.; Saito, A.; Heianza, Y.; Anasako, Y.; Nishigaki, Y.; Yachi, Y.; Iida, K.T.; et al. Alcohol Consumption and Risk of Atrial Fibrillation. J. Am. Coll. Cardiol. 2011, 57, 427–436. [Google Scholar] [CrossRef] [PubMed] [Green Version]
- Hamajima, N.; Hirose, K.; Tajima, K.; Rohan, T.; Calle, E.E.; Heath, C.W.; Coates, R.J.; Liff, J.M.; Talamini, R.; Chantarakul, N.; et al. Alcohol, Tobacco and Breast Cancer—Collaborative Reanalysis of Individual Data from 53 Epidemiological Studies, Including 58,515 Women with Breast Cancer and 95,067 Women without the Disease. Br. J. Cancer 2002, 87, 1234–1245. [Google Scholar] [CrossRef]
- Bagnardi, V.; Rota, M.; Botteri, E.; Tramacere, I.; Islami, F.; Fedirko, V.; Scotti, L.; Jenab, M.; Turati, F.; Pasquali, E.; et al. Alcohol Consumption and Site-Specific Cancer Risk: A Comprehensive Dose–Response Meta-Analysis. Br. J. Cancer 2015, 112, 580–593. [Google Scholar] [CrossRef] [PubMed] [Green Version]
- Fedirko, V.; Tramacere, I.; Bagnardi, V.; Rota, M.; Scotti, L.; Islami, F.; Negri, E.; Straif, K.; Romieu, I.; La Vecchia, C.; et al. Alcohol Drinking and Colorectal Cancer Risk: An Overall and Dose-Response Meta-Analysis of Published Studies. Ann. Oncol. 2011, 22, 1958–1972. [Google Scholar] [CrossRef]
- Roerecke, M.; Rehm, J. The Cardioprotective Association of Average Alcohol Consumption and Ischaemic Heart Disease: A Systematic Review and Meta-Analysis. Addiction 2012, 107, 1246–1260. [Google Scholar] [CrossRef]
- Perneger, T.V.; Whelton, P.K.; Puddey, I.B.; Klag, M.J. Risk of End-Stage Renal Disease Associated with Alcohol Consumption. Am. J. Epidemiol. 1999, 150, 1275–1281. [Google Scholar] [CrossRef] [PubMed] [Green Version]
- Reynolds, K.; Gu, D.; Chen, J.; Tang, X.; Yau, C.L.; Yu, L.; Chen, C.-S.; Wu, X.; Hamm, L.L.; He, J. Alcohol Consumption and the Risk of End-Stage Renal Disease among Chinese Men. Kidney Int. 2008, 73, 870–876. [Google Scholar] [CrossRef] [Green Version]
- Stengel, B.; Tarver-Carr, M.E.; Powe, N.R.; Eberhardt, M.S.; Brancati, F.L. Lifestyle Factors, Obesity and the Risk of Chronic Kidney Disease. Epidemiology 2003, 14, 479–487. [Google Scholar] [CrossRef]
- Koning, S.H.; Gansevoort, R.T.; Mukamal, K.J.; Rimm, E.B.; Bakker, S.J.L.; Joosten, M.M. Alcohol Consumption Is Inversely Associated with the Risk of Developing Chronic Kidney Disease. Kidney Int. 2015, 87, 1009–1016. [Google Scholar] [CrossRef] [PubMed] [Green Version]
- Schaeffner, E.S.; Kurth, T.; de Jong, P.E.; Glynn, R.J.; Buring, J.E.; Gaziano, J.M. Alcohol Consumption and the Risk of Renal Dysfunction in Apparently Healthy Men. Arch. Intern. Med. 2005, 165, 1048–1053. [Google Scholar] [CrossRef] [PubMed] [Green Version]
- Yamagata, K.; Ishida, K.; Sairenchi, T.; Takahashi, H.; Ohba, S.; Shiigai, T.; Narita, M.; Koyama, A. Risk Factors for Chronic Kidney Disease in a Community-Based Population: A 10-Year Follow-up Study. Kidney Int. 2007, 71, 159–166. [Google Scholar] [CrossRef] [Green Version]
- White, S.L.; Polkinghorne, K.R.; Cass, A.; Shaw, J.E.; Atkins, R.C.; Chadban, S.J. Alcohol Consumption and 5-Year Onset of Chronic Kidney Disease: The AusDiab Study. Nephrol. Dial. Transplant. 2009, 24, 2464–2472. [Google Scholar] [CrossRef] [Green Version]
- Sato, K.K.; Hayashi, T.; Uehara, S.; Kinuhata, S.; Oue, K.; Endo, G.; Kambe, H.; Fukuda, K. Drinking Pattern and Risk of Chronic Kidney Disease: The Kansai Healthcare Study. Am. J. Nephrol. 2014, 40, 516–522. [Google Scholar] [CrossRef]
- Hu, E.A.; Lazo, M.; Rosenberg, S.D.; Grams, M.E.; Steffen, L.M.; Coresh, J.; Rebholz, C.M. Alcohol Consumption and Incident Kidney Disease: Results from the Atherosclerosis Risk in Communities Study. J. Ren. Nutr. 2020, 30, 22–30. [Google Scholar] [CrossRef]
- Tanaka, A.; Yamaguchi, M.; Ishimoto, T.; Katsuno, T.; Nobata, H.; Iwagaitsu, S.; Sugiyama, H.; Kinashi, H.; Banno, S.; Imaizumi, T.; et al. Association of Alcohol Consumption with the Incidence of Proteinuria and Chronic Kidney Disease: A Retrospective Cohort Study in Japan. Nutr. J. 2022, 21, 31. [Google Scholar] [CrossRef]
- Buja, A.; Scafato, E.; Baggio, B.; Sergi, G.; Maggi, S.; Rausa, G.; Basile, A.; Manzato, E.; Ghirini, S.; Perissinotto, E. Renal Impairment and Moderate Alcohol Consumption in the Elderly. Results from the Italian Longitudinal Study on Aging (ILSA). Public Health Nutr. 2011, 14, 1907–1918. [Google Scholar] [CrossRef] [Green Version]
- Kimura, Y.; Yamamoto, R.; Shinzawa, M.; Isaka, Y.; Iseki, K.; Yamagata, K.; Tsuruya, K.; Yoshida, H.; Fujimoto, S.; Asahi, K.; et al. Alcohol Consumption and Incidence of Proteinuria: A Retrospective Cohort Study. Clin. Exp. Nephrol. 2018, 22, 1133–1142. [Google Scholar] [CrossRef]
- Tsuruya, K.; Yoshida, H.; Nagata, M.; Kitazono, T.; Iseki, K.; Iseki, C.; Fujimoto, S.; Konta, T.; Moriyama, T.; Yamagata, K.; et al. Impact of the Triglycerides to High-Density Lipoprotein Cholesterol Ratio on the Incidence and Progression of CKD: A Longitudinal Study in a Large Japanese Population. Am. J. Kidney Dis. 2015, 66, 972–983. [Google Scholar] [CrossRef]
- Matsuo, S.; Imai, E.; Horio, M.; Yasuda, Y.; Tomita, K.; Nitta, K.; Yamagata, K.; Tomino, Y.; Yokoyama, H.; Hishida, A. Revised Equations for Estimated GFR From Serum Creatinine in Japan. Am. J. Kidney Dis. 2009, 53, 982–992. [Google Scholar] [CrossRef] [PubMed]
- Guo, R.; Ren, J. Alcohol and Acetaldehyde in Public Health: From Marvel to Menace. Int. J. Environ. Res. Public Health 2010, 7, 1285–1301. [Google Scholar] [CrossRef] [Green Version]
- Shou, H.; Hsu, J.Y.; Xie, D.; Yang, W.; Roy, J.; Anderson, A.H.; Richard Landis, J.; Feldman, H.I.; Parsa, A.; Jepson, C. Analytic Considerations for Repeated Measures of EGFR in Cohort Studies of CKD. Clin. J. Am. Soc. Nephrol. 2017, 12, 1357–1365. [Google Scholar] [CrossRef] [Green Version]
- Olaniran, K.O.; Allegretti, A.S.; Zhao, S.H.; Achebe, M.M.; Eneanya, N.D.; Thadhani, R.I.; Nigwekar, S.U.; Kalim, S. Kidney Function Decline among Black Patients with Sickle Cell Trait and Sickle Cell Disease: An Observational Cohort Study. J. Am. Soc. Nephrol. 2020, 31, 393–404. [Google Scholar] [CrossRef] [PubMed]
- Kerr, W.C.; Ye, Y.; Greenfield, T.K.; Williams, E.; Lui, C.K.; Li, L.; Lown, E.A. Changes in Heavy Drinking Following Onset of Health Problems in a U.S. General Population Sample. Prev. Med. 2017, 95, 47–51. [Google Scholar] [CrossRef] [PubMed] [Green Version]
- Shinzawa, M.; Yamamoto, R.; Nagasawa, Y.; Oseto, S.; Mori, D.; Tomida, K.; Hayashi, T.; Izumi, M.; Fukunaga, M.; Yamauchi, A.; et al. Comparison of Methylprednisolone plus Prednisolone with Prednisolone Alone as Initial Treatment in Adult-Onset Minimal Change Disease: A Retrospective Cohort Study. Clin. J. Am. Soc. Nephrol. 2014, 9, 1040–1048. [Google Scholar] [CrossRef] [PubMed] [Green Version]
- Sarich, P.; Canfell, K.; Banks, E.; Paige, E.; Egger, S.; Joshy, G.; Korda, R.; Weber, M. A Prospective Study of Health Conditions Related to Alcohol Consumption Cessation Among 97,852 Drinkers Aged 45 and Over in Australia. Alcohol. Clin. Exp. Res. 2019, 43, 710–721. [Google Scholar] [CrossRef]
- Sukkar, L.; Kang, A.; Hockham, C.; Young, T.; Jun, M.; Foote, C.; Pecoits-Filho, R.; Neuen, B.; Rogers, K.; Pollock, C.; et al. Incidence and Associations of Chronic Kidney Disease in Community Participants with Diabetes: A 5-Year Prospective Analysis of the EXTEND45 Study. Diabetes Care 2020, 43, 982–990. [Google Scholar] [CrossRef]
- Albert, M.A.; Glynn, R.J.; Ridker, P.M. Alcohol Consumption and Plasma Concentration of C-Reactive Protein. Circulation 2003, 107, 443–447. [Google Scholar] [CrossRef] [Green Version]
- Schei, J.; Stefansson, V.T.N.; Mathisen, U.D.; Eriksen, B.O.; Solbu, M.D.; Jenssen, T.G.; Melsom, T. Residual Associations of Inflammatory Markers with EGFR after Accounting for Measured GFR in a Community-Based Cohort without CKD. Clin. J. Am. Soc. Nephrol. 2016, 11, 280–286. [Google Scholar] [CrossRef] [Green Version]
- Kugler, E.; Cohen, E.; Goldberg, E.; Nardi, Y.; Levi, A.; Krause, I.; Garty, M.; Krause, I. C Reactive Protein and Long-Term Risk for Chronic Kidney Disease: A Historical Prospective Study. J. Nephrol. 2015, 28, 321–327. [Google Scholar] [CrossRef]
- van de Luitgaarden, I.A.T.; Beulens, J.W.J.; Schrieks, I.C.; Kieneker, L.M.; Touw, D.J.; van Ballegooijen, A.J.; van Oort, S.; Grobbee, D.E.; Bakker, S.J.L. Urinary Ethyl Glucuronide Can Be Used as a Biomarker of Habitual Alcohol Consumption in the General Population. J. Nutr. 2019, 149, 2199–2205. [Google Scholar] [CrossRef] [PubMed] [Green Version]
- Toda, A.; Ishizaka, Y.; Tani, M.; Yamakado, M. Current Dietary Salt Intake of Japanese Individuals Assessed during Health Check-Up. Hypertens. Res. 2015, 38, 163–168. [Google Scholar] [CrossRef] [PubMed]
- Sugiura, T.; Takase, H.; Ohte, N.; Dohi, Y. Dietary Salt Intake Is a Significant Determinant of Impaired Kidney Function in the General Population. Kidney Blood Press. Res. 2018, 43, 1245–1254. [Google Scholar] [CrossRef] [PubMed]


| Rare | Occasional | Daily | ||||
|---|---|---|---|---|---|---|
| ≤19 g/day | 20–39 | 40–59 | ≥60 | |||
| N | 38,726 | 32,774 | 15,236 | 25,819 | 10,220 | 2923 |
| Age, year | 66 (59–70) | 65 (58–69) | 67 (62–70) | 66 (60–69) | 64 (57–68) | 60 (52–65) |
| Smokers, N (%) | 9166 (23.7) | 7275 (22.2) | 3558 (23.4) | 7722 (29.9) | 4007 (39.2) | 1290 (44.1) |
| BMI, kg/m2 | 23.9 ± 3.2 | 24.1 ± 3.1 | 23.5 ± 2.8 | 23.6 ± 2.8 | 23.7 ± 3.0 | 23.9 ± 3.1 |
| SBP, mmHg | 128 ± 17 | 130 ± 17 | 131 ± 17 | 134 ± 17 | 135 ± 17 | 135 ± 18 |
| DBP, mmHg | 77 ± 11 | 78 ± 11 | 78 ± 10 | 80 ± 11 | 81 ± 11 | 82 ± 11 |
| MAP, mmHg | 94 ± 12 | 96 ± 12 | 96 ± 11 | 98 ± 12 | 99 ± 12 | 100 ± 12 |
| HDL cholesterol, mg/dL | 52 ± 13 | 56 ± 14 | 59 ± 15 | 61 ± 16 | 63 ± 17 | 64 ± 18 |
| Hemoglobin A1c, % | 5.5 ± 0.8 | 5.4 ± 0.8 | 5.4 ± 0.7 | 5.3 ± 0.7 | 5.3 ± 0.7 | 5.3 ± 0.8 |
| Uric acid, mg/dL | 5.8 ± 1.3 | 6.0 ± 1.3 | 6.0 ± 1.3 | 6.1 ± 1.3 | 6.3 ± 1.4 | 6.5 ± 1.4 |
| eGFR, mL/min/1.73 m2 | 72 (63–82) | 73 (64–84) | 73 (64–84) | 74 (65–85) | 76 (66–87) | 78 (69–89) |
| ≥90, N (%) | 3841 (9.9) | 3847 (11.7) | 1533 (10.1) | 3377 (13.1) | 1923 (18.8) | 695 (23.8) |
| 60–89 | 26,328 (68.0) | 23,037 (70.3) | 10,688 (70.1) | 18,553 (71.9) | 7100 (69.5) | 1957 (67.0) |
| 45–59 | 7495 (19.4) | 5302 (16.2) | 2723 (17.9) | 3522 (13.6) | 1104 (10.8) | 247 (8.5) |
| <45 | 1062 (2.7) | 588 (1.8) | 292 (1.9) | 367 (1.4) | 93 (0.9) | 24 (0.8) |
| Dipstick UP, −, N (%) | 31,949 (82.5) | 26,978 (82.3) | 12,919 (84.8) | 21,553 (83.5) | 8287 (81.1) | 2309 (79.0) |
| ± | 3756 (9.7) | 3353 (10.2) | 1337 (8.8) | 2474 (9.6) | 1111 (10.9) | 343 (11.7) |
| 1+ | 1955 (5.0) | 1617 (4.9) | 650 (4.3) | 1232 (4.8) | 571 (5.6) | 178 (6.1) |
| 2+ | 815 (2.1) | 619 (1.9) | 253 (1.7) | 424 (1.6) | 204 (2.0) | 75 (2.6) |
| ≥3+ | 251 (0.6) | 207 (0.6) | 77 (0.5) | 136 (0.5) | 47 (0.5) | 18 (0.6) |
| Hypertension, N (%) | 10,872 (28.1) | 10,030 (30.6) | 4959 (32.5) | 9115 (35.3) | 3540 (34.6) | 873 (29.9) |
| Dyslipidemia, N (%) | 4486 (11.6) | 3503 (10.7) | 1555 (10.2) | 2376 (9.2) | 810 (7.9) | 199 (6.8) |
| Diabetes, N (%) | 3099 (8.0) | 2397 (7.3) | 919 (6.0) | 1432 (5.5) | 524 (5.1) | 177 (6.1) |
| CVD history, N (%) | 5019 (13.0) | 3475 (10.6) | 1726 (11.3) | 2580 (10.0) | 858 (8.4) | 167 (5.7) |
| Rare | Occasional | Daily | ||||
|---|---|---|---|---|---|---|
| ≤19 g/day | 20–39 | 40–59 | ≥60 | |||
| N | 131,484 | 34,874 | 7372 | 3821 | 1152 | 528 |
| Age, year | 65 (60–69) | 64 (58–68) | 64 (58–68) | 60 (53–65) | 56 (49–62) | 55 (46–61) |
| Smokers, N (%) | 5650 (4.3) | 2528 (7.2) | 694 (9.4) | 886 (23.2) | 423 (36.7) | 222 (42.0) |
| BMI, kg/m2 | 23.0 ± 3.5 | 22.7 ± 3.2 | 22.0 ± 2.9 | 22.2 ± 3.2 | 22.1 ± 3.3 | 22.8 ± 3.4 |
| SBP, mmHg | 128 ± 18 | 127 ± 18 | 127 ± 18 | 128 ± 18 | 127 ± 18 | 128 ± 18 |
| DBP, mmHg | 75 ± 10 | 75 ± 11 | 75 ± 11 | 76 ± 11 | 77 ± 11 | 77 ± 11 |
| MAP, mmHg | 93 ± 12 | 92 ± 12 | 92 ± 12 | 94 ± 12 | 93 ± 12 | 94 ± 13 |
| HDL cholesterol, mg/dL | 64 ± 15 | 67 ± 16 | 72 ± 17 | 75 ± 18 | 77 ± 19 | 76 ± 20 |
| Hemoglobin A1c, % | 5.3 ± 0.6 | 5.3 ± 0.5 | 5.2 ± 0.5 | 5.1 ± 0.5 | 5.1 ± 0.6 | 5.1 ± 0.6 |
| Uric acid, mg/dL | 4.6 ± 1.1 | 4.7 ± 1.0 | 4.7 ± 1.0 | 5.0 ± 1.2 | 5.2 ± 1.2 | 5.4 ± 1.3 |
| eGFR, mL/min/1.73 m2 | 74 (64–83) | 75 (64–86) | 75 (64–85) | 77 (67–91) | 80 (72–94) | 82 (72–96) |
| ≥90, N (%) | 26,443 (20.1) | 7678 (22.0) | 1563 (21.2) | 997 (26.1) | 382 (33.2) | 189 (35.8) |
| 60–89 | 87,823 (66.8) | 23,534 (67.5) | 5068 (68.7) | 2541 (66.5) | 719 (62.4) | 308 (58.3) |
| 45–59 | 15,497 (11.8) | 3402 (9.8) | 693 (9.4) | 264 (6.9) | 49 (4.3) | 29 (5.5) |
| <45 | 1721 (1.3) | 260 (0.7) | 48 (0.7) | 19 (0.5) | 2 (0.2) | 2 (0.4) |
| Dipstick UP, −, N (%) | 117,136 (89.1) | 31,244 (89.6) | 6723 (91.2) | 3424 (89.6) | 999 (86.7) | 431 (81.6) |
| ± | 9246 (7.0) | 2465 (7.1) | 443 (6.0) | 253 (6.6) | 108 (9.4) | 61 (11.6) |
| 1+ | 3705 (2.8) | 877 (2.5) | 161 (2.2) | 109 (2.9) | 38 (3.3) | 22 (4.2) |
| 2+ | 1112 (0.8) | 229 (0.7) | 35 (0.5) | 29 (0.8) | 5 (0.4) | 13 (2.5) |
| ≥3+ | 285 (0.2) | 59 (0.2) | 10 (0.1) | 6 (0.2) | 2 (0.2) | 1 (0.2) |
| Hypertension, N (%) | 36,581 (27.8) | 8206 (23.5) | 1642 (22.3) | 969 (25.4) | 259 (22.5) | 126 (23.9) |
| Dyslipidemia, N (%) | 25,628 (19.5) | 5578 (16.0) | 977 (13.3) | 371 (9.7) | 91 (7.9) | 33 (6.3) |
| Diabetes, N (%) | 5677 (4.3) | 848 (2.4) | 137 (1.9) | 65 (1.7) | 16 (1.4) | 11 (2.1) |
| CVD history, N (%) | 9316 (7.1) | 2085 (6.0) | 439 (6.0) | 227 (5.9) | 55 (4.8) | 32 (6.1) |
Disclaimer/Publisher’s Note: The statements, opinions and data contained in all publications are solely those of the individual author(s) and contributor(s) and not of MDPI and/or the editor(s). MDPI and/or the editor(s) disclaim responsibility for any injury to people or property resulting from any ideas, methods, instructions or products referred to in the content. |
© 2023 by the authors. Licensee MDPI, Basel, Switzerland. This article is an open access article distributed under the terms and conditions of the Creative Commons Attribution (CC BY) license (https://creativecommons.org/licenses/by/4.0/).
Share and Cite
Kimura, Y.; Yamamoto, R.; Shinzawa, M.; Aoki, K.; Tomi, R.; Ozaki, S.; Yoshimura, R.; Shimomura, A.; Iwatani, H.; Isaka, Y.; et al. Alcohol Consumption and a Decline in Glomerular Filtration Rate: The Japan Specific Health Checkups Study. Nutrients 2023, 15, 1540. https://doi.org/10.3390/nu15061540
Kimura Y, Yamamoto R, Shinzawa M, Aoki K, Tomi R, Ozaki S, Yoshimura R, Shimomura A, Iwatani H, Isaka Y, et al. Alcohol Consumption and a Decline in Glomerular Filtration Rate: The Japan Specific Health Checkups Study. Nutrients. 2023; 15(6):1540. https://doi.org/10.3390/nu15061540
Chicago/Turabian StyleKimura, Yoshiki, Ryohei Yamamoto, Maki Shinzawa, Katsunori Aoki, Ryohei Tomi, Shingo Ozaki, Ryuichi Yoshimura, Akihiro Shimomura, Hirotsugu Iwatani, Yoshitaka Isaka, and et al. 2023. "Alcohol Consumption and a Decline in Glomerular Filtration Rate: The Japan Specific Health Checkups Study" Nutrients 15, no. 6: 1540. https://doi.org/10.3390/nu15061540