
Identification and Characterization of Genomic Predictors of Sarcopenia and Sarcopenic Obesity Using UK Biobank Data
 , ,
, ,
Abstract
:1. Introduction
2. Materials and Methods
2.1. UK Biobank Study
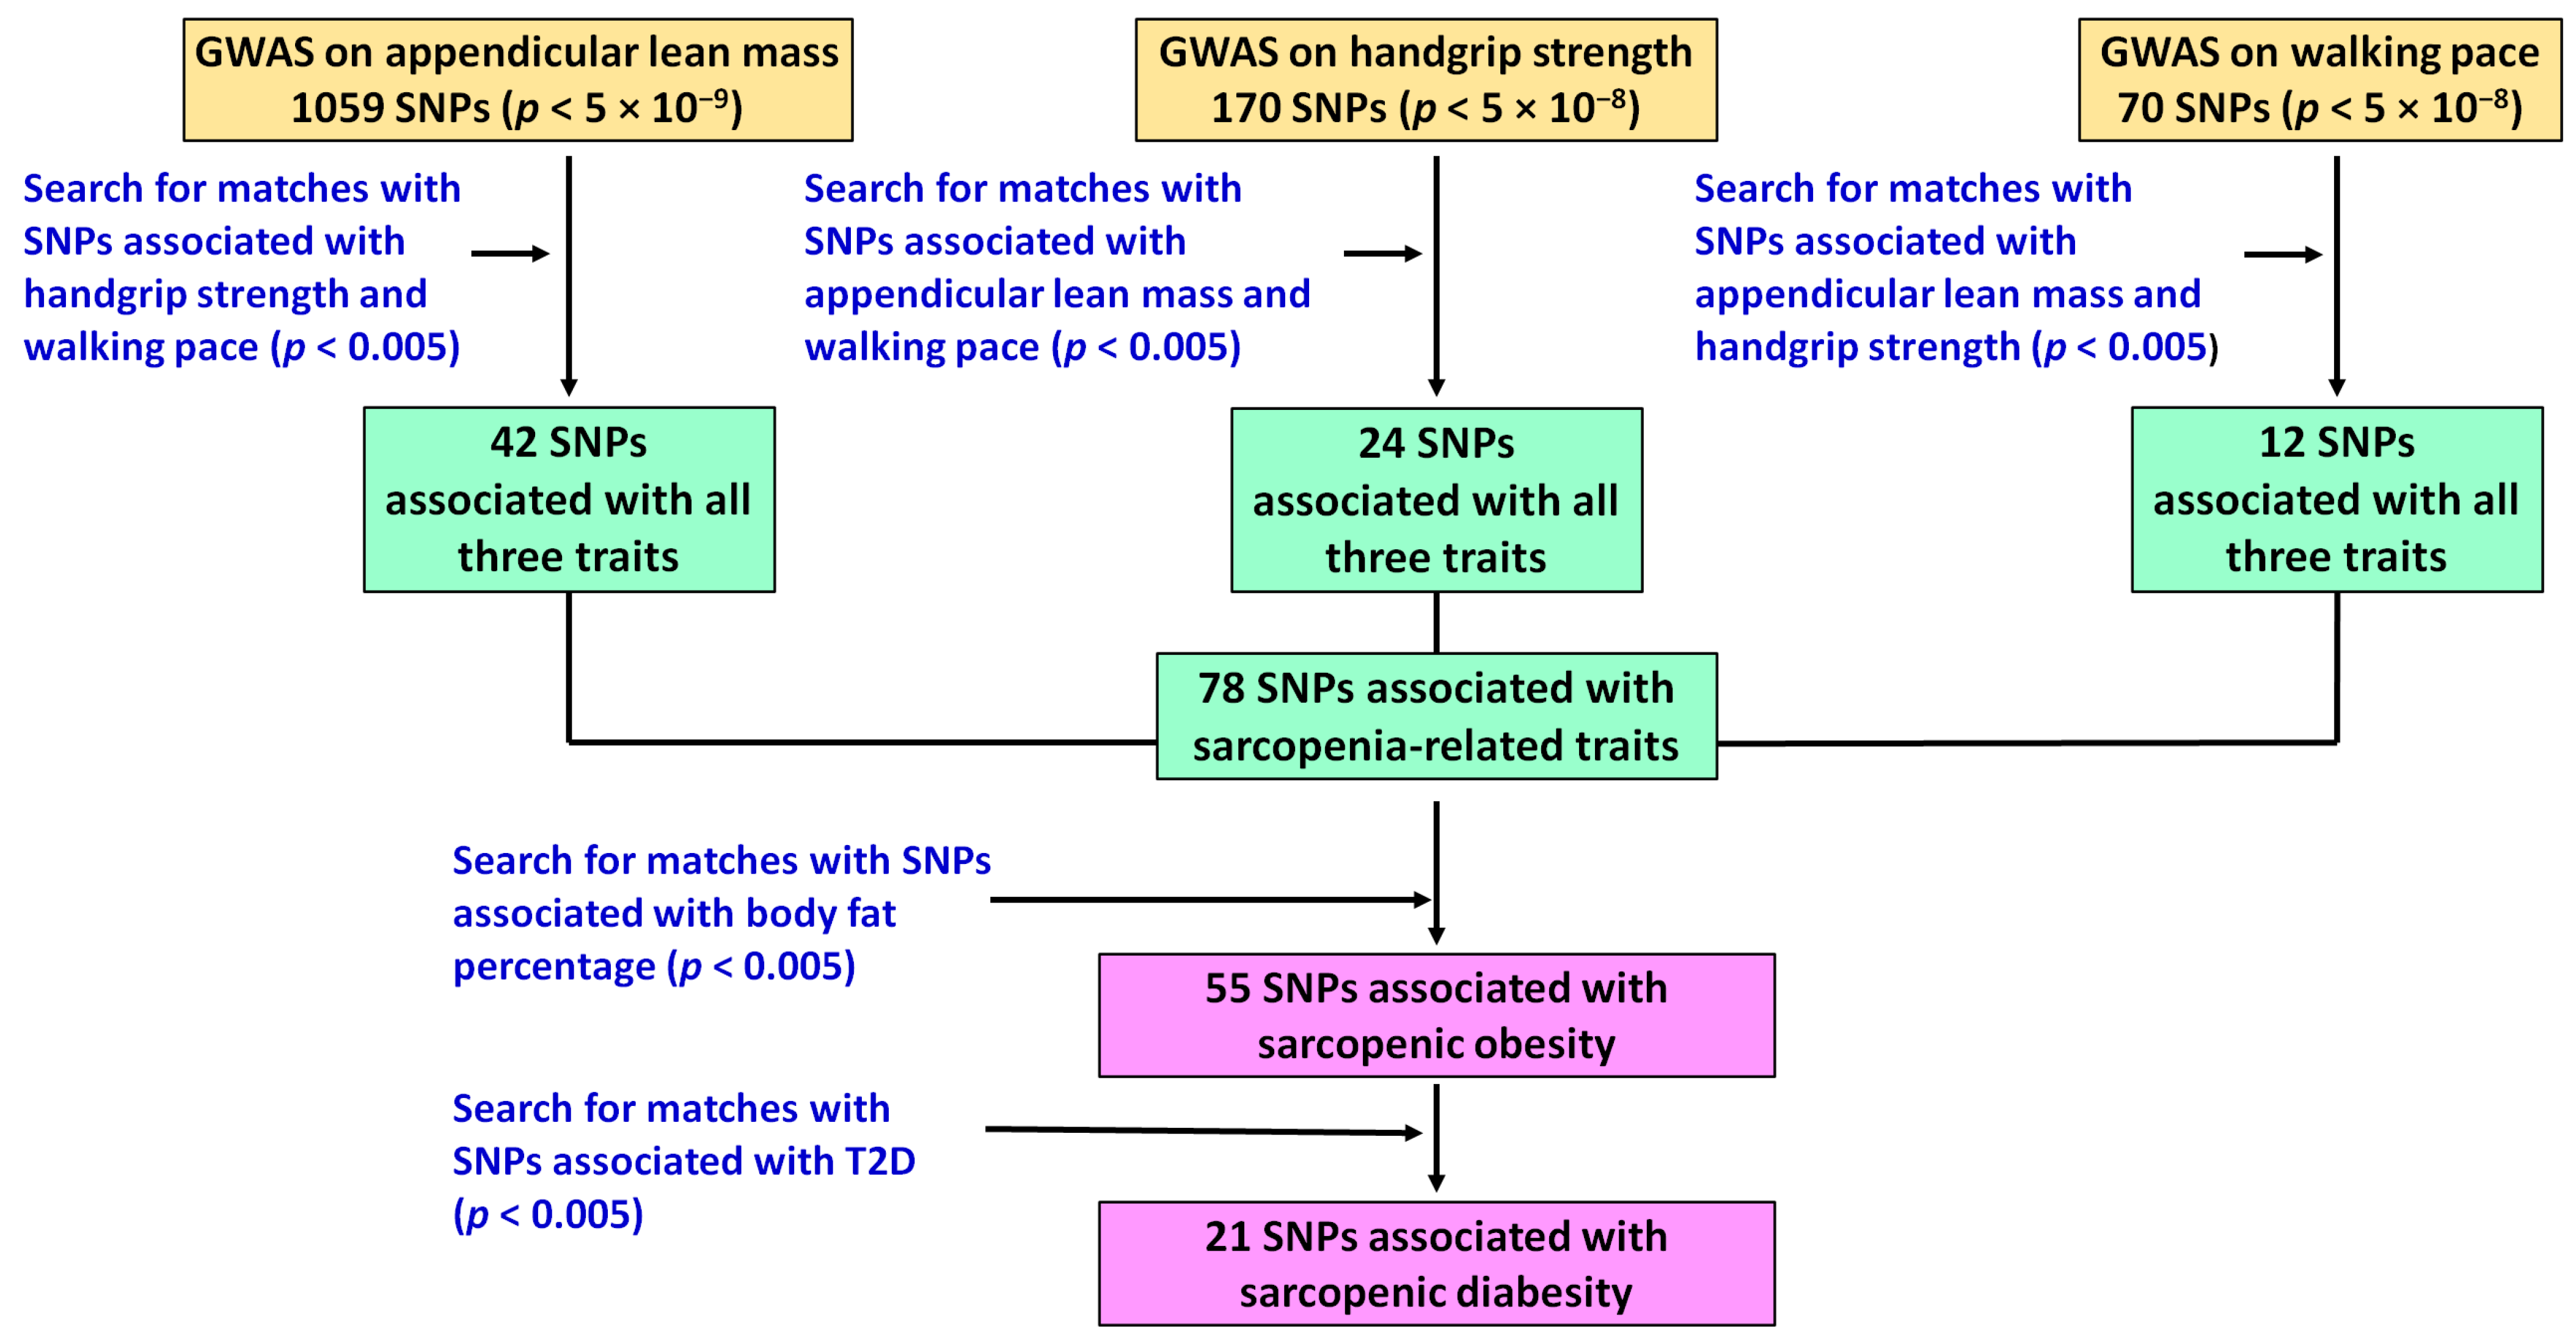
2.2. Identification of Genomic Predictors of Sarcopenia and Sarcopenic Obesity Using UK Biobank Data
2.3. Analysis of Sarcopenia-Related Polygenic Profiles in European Populations
2.4. Analysis of Association of Sarcopenia-Related SNPs with Gene Expression
2.5. Analysis of Effects of Knockouts of Implicated Genes on Sarcopenia-Related Traits in Mice
2.6. Analysis of Effects of Strength Training on the Expression of Sarcopenia-Related Genes
3. Results
3.1. Potential Genomic Predictors of Sarcopenia and Sarcopenic Obesity
3.2. Polygenic Analysis of Sarcopenia, Sarcopenic Obesity and Sarcopenic Diabesity
3.3. Association of Sarcopenia-Related SNPs with Expression of Genes
3.4. Effects of Gene Knockouts of Implicated Genes on Sarcopenia-Related Traits in Mice
3.5. Effects of Strength Training on the Expression of Sarcopenia-Related Genes
4. Discussion
5. Conclusions
Supplementary Materials
Author Contributions
Funding
Institutional Review Board Statement
Informed Consent Statement
Data Availability Statement
Conflicts of Interest
References
- Cruz-Jentoft, A.J.; Bahat, G.; Bauer, J.; Boirie, Y.; Bruyère, O.; Cederholm, T.; Cooper, C.; Landi, F.; Rolland, Y.; Sayer, A.A.; et al. Sarcopenia: Revised European consensus on definition and diagnosis. Age Ageing 2019, 48, 16–31. [Google Scholar] [CrossRef] [PubMed]
- Batsis, J.A.; Mackenzie, T.A.; Emeny, R.T.; Lopez-Jimenez, F.; Bartels, S.J. Low lean mass with and without obesity, and mortality: Results from the 1999–2004 national health and nutrition examination survey. J. Gerontol. A Biol. Sci. Med. Sci. 2017, 72, 1445–1451. [Google Scholar] [CrossRef] [PubMed]
- Han, T.; Yuan, T.; Liang, X.; Chen, N.; Song, J.; Zhao, X.; Weng, Y.; Hu, Y. Sarcopenic obesity with normal body size may have higher insulin resistance in elderly patients with type 2 diabetes mellitus. Diabetes Metab. Syndr. Obes. 2022, 15, 1197–1206. [Google Scholar] [CrossRef] [PubMed]
- Scott, D.; Sanders, K.M.; Aitken, D.; Hayes, A.; Ebeling, P.R.; Jones, G. Sarcopenic obesity and dynapenic obesity: 5-year associations with falls risk in middle-aged and older adults. Obesity 2014, 22, 1568–1574. [Google Scholar] [CrossRef]
- Nezameddin, R.; Itani, L.; Kreidieh, D.; El Masri, D.; Tannir, H.; El Ghoch, M. Understanding sarcopenic obesity in terms of definition and health consequences: A clinical review. Curr. Diabetes Rev. 2020, 16, 957–961. [Google Scholar] [CrossRef]
- Petermann-Rocha, F.; Balntzi, V.; Gray, S.R.; Lara, J.; Ho, F.K.; Pell, J.P.; Celis-Morales, C. Global prevalence of sarcopenia and severe sarcopenia: A systematic review and meta-analysis. J. Cachexia Sarcopenia Muscle 2022, 13, 86–99. [Google Scholar] [CrossRef]
- Donini, L.M.; Busetto, L.; Bischoff, S.C.; Cederholm, T.; Ballesteros-Pomar, M.D.; Batsis, J.A.; Bauer, J.M.; Boirie, Y.; Cruz-Jentoft, A.J.; Dicker, D.; et al. Definition and diagnostic criteria for sarcopenic obesity: ESPEN and EASO consensus statement. Obes. Facts 2022, 15, 321–335. [Google Scholar] [CrossRef]
- Gao, Q.; Mei, F.; Shang, Y.; Hu, K.; Chen, F.; Zhao, L.; Ma, B. Global prevalence of sarcopenic obesity in older adults: A systematic review and meta-analysis. Clin. Nutr. 2021, 40, 4633–4641. [Google Scholar] [CrossRef]
- Yu, F.; Hedström, M.; Cristea, A.; Dalén, N.; Larsson, L. Effects of ageing and gender on contractile properties in human skeletal muscle and single fibres. Acta Physiol. 2007, 190, 229–241. [Google Scholar] [CrossRef]
- Hirani, V.; Naganathan, V.; Blyth, F.; Le Couteur, D.G.; Seibel, M.J.; Waite, L.M.; Handelsman, D.J.; Cumming, R.G. Longitudinal associations between body composition, sarcopenic obesity and outcomes of frailty, disability, institutionalisation and mortality in community-dwelling older men: The Concord Health and Ageing in Men Project. Age Ageing 2017, 46, 413–420. [Google Scholar] [CrossRef] [Green Version]
- Khadra, D.; Itani, L.; Tannir, H.; Kreidieh, D.; El Masri, D.; El Ghoch, M. Association between sarcopenic obesity and higher risk of type 2 diabetes in adults: A systematic review and meta-analysis. World J. Diabetes 2019, 10, 311–323. [Google Scholar] [CrossRef] [PubMed]
- Rasmussen, L.J.H.; Caspi, A.; Ambler, A.; Broadbent, J.M.; Cohen, H.J.; d’Arbeloff, T.; Elliott, M.; Hancox, R.J.; Harrington, H.; Hogan, S.; et al. Association of neurocognitive and physical function with gait speed in midlife. JAMA Netw. Open 2019, 2, e1913123. [Google Scholar] [CrossRef] [PubMed]
- Veronese, N.; Demurtas, J.; Soysal, P.; Smith, L.; Torbahn, G.; Schoene, D.; Schwingshackl, L.; Sieber, C.; Bauer, J.; Cesari, M.; et al. Sarcopenia and health-related outcomes: An umbrella review of observational studies. Eur. Geriatr. Med. 2019, 10, 853–862. [Google Scholar] [CrossRef] [PubMed]
- Liu, C.; Liu, N.; Xia, Y.; Zhao, Z.; Xiao, T.; Li, H. Osteoporosis and sarcopenia-related traits: A bi-directional Mendelian randomization study. Front. Endocrinol. 2022, 13, 975647. [Google Scholar] [CrossRef]
- Zempo, H.; Miyamoto-Mikami, E.; Kikuchi, N.; Fuku, N.; Miyachi, M.; Murakami, H. Heritability estimates of muscle strength-related phenotypes: A systematic review and meta-analysis. Scand. J. Med. Sci. Sports 2017, 27, 1537–1546. [Google Scholar] [CrossRef]
- Abney, M.; McPeek, M.S.; Ober, C. Broad and narrow heritabilities of quantitative traits in a founder population. Am. J. Hum. Genet. 2001, 68, 1302–1307. [Google Scholar] [CrossRef]
- Willems, S.M.; Wright, D.J.; Day, F.R.; Trajanoska, K.; Joshi, P.K.; Morris, J.A.; Matteini, A.M.; Garton, F.C.; Grarup, N.; Oskolkov, N.; et al. Large-scale GWAS identifies multiple loci for hand grip strength providing biological insights into muscular fitness. Nat. Commun. 2017, 8, 16015. [Google Scholar] [CrossRef]
- Tikkanen, E.; Gustafsson, S.; Amar, D.; Shcherbina, A.; Waggott, D.; Ashley, E.A.; Ingelsson, E. Biological insights into muscular strength: Genetic findings in the UK Biobank. Sci. Rep. 2018, 8, 6451. [Google Scholar] [CrossRef]
- Jones, G.; Trajanoska, K.; Santanasto, A.J.; Stringa, N.; Kuo, C.L.; Atkins, J.L.; Lewis, J.R.; Duong, T.; Hong, S.; Biggs, M.L.; et al. Genome-wide meta-analysis of muscle weakness identifies 15 susceptibility loci in older men and women. Nat. Commun. 2021, 12, 654. [Google Scholar] [CrossRef]
- Pei, Y.F.; Liu, Y.Z.; Yang, X.L.; Zhang, H.; Feng, G.J.; Wei, X.T.; Zhang, L. The genetic architecture of appendicular lean mass characterized by association analysis in the UK Biobank study. Commun. Biol. 2020, 3, 608. [Google Scholar] [CrossRef]
- Timmins, I.R.; Zaccardi, F.; Nelson, C.P.; Franks, P.W.; Yates, T.; Dudbridge, F. Genome-wide association study of self-reported walking pace suggests beneficial effects of brisk walking on health and survival. Commun. Biol. 2020, 3, 634. [Google Scholar] [CrossRef] [PubMed]
- Hayashida, I.; Tanimoto, Y.; Takahashi, Y.; Kusabiraki, T.; Tamaki, J. Correlation between muscle strength and muscle mass, and their association with walking speed, in community-dwelling elderly Japanese individuals. PLoS ONE 2014, 9, e111810. [Google Scholar] [CrossRef] [PubMed]
- Lin, Y.H.; Chen, H.C.; Hsu, N.W.; Chou, P. Using hand grip strength to detect slow walking speed in older adults: The Yilan study. BMC Geriatr. 2021, 21, 428. [Google Scholar] [CrossRef]
- Sudlow, C.; Gallacher, J.; Allen, N.; Beral, V.; Burton, P.; Danesh, J.; Downey, P.; Elliott, P.; Green, J.; Landray, M.; et al. UK biobank: An open access resource for identifying the causes of a wide range of complex diseases of middle and old age. PLoS Med. 2015, 12, e1001779. [Google Scholar] [CrossRef]
- Hernandez Cordero, A.I.; Gonzales, N.M.; Parker, C.C.; Sokolof, G.; Vandenbergh, D.J.; Cheng, R.; Abney, M.; Sko, A.; Douglas, A.; Palmer, A.A.; et al. Genome-wide associations reveal human-mouse genetic convergence and modifiers of myogenesis, CPNE1 and STC2. Am. J. Hum. Genet. 2019, 105, 1222–1236. [Google Scholar] [CrossRef]
- Open Targets Genetics. Available online: https://genetics.opentargets.org (accessed on 27 December 2022).
- Morris, J.A.; Kemp, J.P.; Youlten, S.E.; Laurent, L.; Logan, J.G.; Chai, R.C.; Vulpescu, N.A.; Forgetta, V.; Kleinman, A.; Mohanty, S.T.; et al. An atlas of genetic influences on osteoporosis in humans and mice. Nat. Genet. 2019, 51, 258–266. [Google Scholar] [CrossRef]
- Ruth, K.S.; Day, F.R.; Tyrrell, J.; Thompson, D.J.; Wood, A.R.; Mahajan, A.; Beaumont, R.N.; Wittemans, L.; Martin, S.; Busch, A.S.; et al. Using human genetics to understand the disease impacts of testosterone in men and women. Nat. Med. 2020, 26, 252–258. [Google Scholar] [CrossRef] [PubMed]
- Barton, A.R.; Sherman, M.A.; Mukamel, R.E.; Loh, P.R. Whole-exome imputation within UK Biobank powers rare coding variant association and fine-mapping analyses. Nat. Genet. 2021, 53, 1260–1269. [Google Scholar] [CrossRef]
- Revez, J.A.; Lin, T.; Qiao, Z.; Xue, A.; Holtz, Y.; Zhu, Z.; Zeng, J.; Wang, H.; Sidorenko, J.; Kemper, K.E.; et al. Genome-wide association study identifies 143 loci associated with 25 hydroxyvitamin D concentration. Nat. Commun. 2020, 11, 1647. [Google Scholar] [CrossRef]
- Klimentidis, Y.C.; Raichlen, D.A.; Bea, J.; Garcia, D.O.; Wineinger, N.E.; Mandarino, L.J.; Alexander, G.E.; Chen, Z.; Going, S.B. Genome-wide association study of habitual physical activity in over 377,000 UK Biobank participants identifies multiple variants including CADM2 and APOE. Int. J. Obes. 2018, 42, 1161–1176. [Google Scholar] [CrossRef] [Green Version]
- Lee, J.J.; Wedow, R.; Okbay, A.; Kong, E.; Maghzian, O.; Zacher, M.; Nguyen-Viet, T.A.; Bowers, P.; Sidorenko, J.; Linnér, R.K.; et al. Gene discovery and polygenic prediction from a genome-wide association study of educational attainment in 1.1 million individuals. Nat. Genet. 2018, 50, 1112–1121. [Google Scholar] [CrossRef] [PubMed]
- Savage, J.E.; Jansen, P.R.; Stringer, S.; Watanabe, K.; Bryois, J.; de Leeuw, C.A.; Nagel, M.; Awasthi, S.; Barr, P.B.; Coleman, J.R.I.; et al. Genome-wide association meta-analysis in 269,867 individuals identifies new genetic and functional links to intelligence. Nat. Genet. 2018, 50, 912–919. [Google Scholar] [CrossRef] [PubMed]
- Nagel, M.; Watanabe, K.; Stringer, S.; Posthuma, D.; van der Sluis, S. Item-level analyses reveal genetic heterogeneity in neuroticism. Nat. Commun. 2018, 9, 905. [Google Scholar] [CrossRef] [PubMed]
- The Ensembl Project Portal. Available online: http://www.ensembl.org/Homo_sapiens/Info/Index (accessed on 27 December 2022).
- GTEx Portal. Available online: https://gtexportal.org/home/index.html (accessed on 27 December 2022).
- GTEx Consortium. The GTEx Consortium atlas of genetic regulatory effects across human tissues. Science 2020, 369, 1318–1330. [Google Scholar] [CrossRef]
- The International Mouse Phenotyping Consortium (IMPC) Database. Available online: https://www.mousephenotype.org/data/search (accessed on 27 December 2022).
- Groza, T.; Gomez, F.L.; Mashhadi, H.H.; Muñoz-Fuentes, V.; Gunes, O.; Wilson, R.; Cacheiro, P.; Frost, A.; Keskivali-Bond, P.; Vardal, B.; et al. The International Mouse Phenotyping Consortium: Comprehensive knockout phenotyping underpinning the study of human disease. Nucleic Acids Res. 2023, 51, D1038–D1045. [Google Scholar] [CrossRef]
- Vissing, K.; Schjerling, P. Simplified data access on human skeletal muscle transcriptome responses to differentiated exercise. Sci. Data 2014, 1, 140041. [Google Scholar] [CrossRef]
- Swan, L.; Warters, A.; O’Sullivan, M. Socioeconomic disadvantage is associated with probable sarcopenia in community-dwelling older adults: Findings from the English Longitudinal Study of Ageing. J. Frailty Aging 2022, 11, 398–406. [Google Scholar] [CrossRef]
- Tolea, M.I.; Terracciano, A.; Simonsick, E.M.; Metter, E.J.; Costa, P.T., Jr.; Ferrucci, L. Associations between personality traits, physical activity level, and muscle strength. J. Res. Pers. 2012, 46, 264–270. [Google Scholar] [CrossRef]
- Moctezuma-Velázquez, C.; Low, G.; Mourtzakis, M.; Ma, M.; Burak, K.W.; Tandon, P.; Montano-Loza, A.J. Association between low testosterone levels and sarcopenia in cirrhosis: A cross-sectional study. Ann. Hepatol. 2018, 17, 615–623. [Google Scholar] [CrossRef]
- Rossini-Venturini, A.C.; Abdalla, P.P.; Fassini, P.G.; Dos Santos, A.P.; Tasinafo Junior, M.F.; Alves, T.C.; Gomide, E.B.G.; de Pontes, T.L.; Pfrimer, K.; Ferriolli, E.; et al. Association between classic and specific bioimpedance vector analysis and sarcopenia in older adults: A cross-sectional study. BMC Sports Sci. Med. Rehabil. 2022, 14, 170. [Google Scholar] [CrossRef]
- Hong, S.H.; Bae, Y.J. Association between alcohol consumption and the risk of sarcopenia: A systematic review and meta-analysis. Nutrients 2022, 14, 3266. [Google Scholar] [CrossRef] [PubMed]
- Gedmantaite, A.; Celis-Morales, C.A.; Ho, F.; Pell, J.P.; Ratkevicius, A.; Gray, S.R. Associations between diet and handgrip strength: A cross-sectional study from UK Biobank. Mech. Ageing Dev. 2020, 189, 111269. [Google Scholar] [CrossRef]
- Yoshida, Y.; Kosaki, K.; Sugasawa, T.; Matsui, M.; Yoshioka, M.; Aoki, K.; Kuji, T.; Mizuno, R.; Kuro-O, M.; Yamagata, K.; et al. High salt diet impacts the risk of sarcopenia associated with reduction of skeletal muscle performance in the Japanese population. Nutrients 2020, 12, 3474. [Google Scholar] [CrossRef]
- de Souza, L.F.; Danielewicz, A.L.; Rech, C.R.; d’Orsi, E.; Mendonça, V.A.; Lacerda, A.C.R.; de Avelar, N.C.P. How much time in sedentary behavior is associated with probable sarcopenia in older adults? Geriatr. Nurs. 2022, 48, 127–131. [Google Scholar] [CrossRef] [PubMed]
- Gao, Q.; Hu, K.; Yan, C.; Zhao, B.; Mei, F.; Chen, F.; Zhao, L.; Shang, Y.; Ma, Y.; Ma, B. Associated factors of sarcopenia in community-dwelling older adults: A systematic review and meta-analysis. Nutrients 2021, 13, 4291. [Google Scholar] [CrossRef]
- Dirks-Naylor, A.J. The benefits of coffee on skeletal muscle. Life Sci. 2015, 143, 182–186. [Google Scholar] [CrossRef] [PubMed]
- Welch, A.A.; Skinner, J.; Hickson, M. Dietary magnesium may be protective for aging of bone and skeletal muscle in middle and younger older age men and women: Cross-sectional findings from the UK biobank cohort. Nutrients 2017, 9, 1189. [Google Scholar] [CrossRef]
- Remelli, F.; Vitali, A.; Zurlo, A.; Volpato, S. Vitamin D deficiency and sarcopenia in older persons. Nutrients 2019, 11, 2861. [Google Scholar] [CrossRef]
- Petermann-Rocha, F.; Chen, M.; Gray, S.R.; Ho, F.K.; Pell, J.P.; Celis-Morales, C. Factors associated with sarcopenia: A cross-sectional analysis using UK Biobank. Maturitas 2020, 133, 60–67. [Google Scholar] [CrossRef] [PubMed]
- Kuo, Y.W.; Chen, C.W.; Zhang, J.Y.; Lee, J.D. Association of eating behavior, nutritional risk, and frailty with sarcopenia in taiwanese rural community-dwelling elders: A cross-sectional study. Nutrients 2022, 14, 3254. [Google Scholar] [CrossRef]
- Zhao, H.; Cheng, R.; Song, G.; Teng, J.; Shen, S.; Fu, X.; Yan, Y.; Liu, C. The effect of resistance training on the rehabilitation of elderly patients with sarcopenia: A meta-analysis. Int. J. Environ. Res. Public Health 2022, 19, 15491. [Google Scholar] [CrossRef] [PubMed]
- Guilherme, J.P.L.F.; Semenova, E.A.; Larin, A.K.; Yusupov, R.A.; Generozov, E.V.; Ahmetov, I.I. Genomic predictors of brisk walking are associated with elite sprinter status. Genes 2022, 13, 1710. [Google Scholar] [CrossRef] [PubMed]
- Moreland, E.; Borisov, O.V.; Semenova, E.A.; Larin, A.K.; Andryushchenko, O.N.; Andryushchenko, L.B.; Generozov, E.V.; Williams, A.G.; Ahmetov, I.I. Polygenic profile of elite strength athletes. J. Strength Cond. Res. 2022, 36, 2509–2514. [Google Scholar] [CrossRef]
- Grishina, E.E.; Zmijewski, P.; Semenova, E.A.; Cięszczyk, P.; Humińska-Lisowska, K.; Michałowska-Sawczyn, M.; Maculewicz, E.; Crewther, B.; Orysiak, J.; Kostryukova, E.S.; et al. Three DNA polymorphisms previously identified as markers for handgrip strength are associated with strength in weightlifters and muscle fiber hypertrophy. J. Strength Cond. Res. 2019, 33, 2602–2607. [Google Scholar] [CrossRef]
- Kikuchi, N.; Moreland, E.; Homma, H.; Semenova, E.A.; Saito, M.; Larin, A.K.; Kobatake, N.; Yusupov, R.A.; Okamoto, T.; Nakazato, K.; et al. Genes and weightlifting performance. Genes 2022, 13, 25. [Google Scholar] [CrossRef] [PubMed]
- Akhmetov, I.I.; Astranenkova, I.V.; Rogozkin, V.A. Association of PPARD gene polymorphism with human physical performance. Mol. Biol. 2007, 41, 852–857. [Google Scholar]
- Liu, X.G.; Tan, L.J.; Lei, S.F.; Liu, Y.J.; Shen, H.; Wang, L.; Yan, H.; Guo, Y.F.; Xiong, D.H.; Chen, X.D.; et al. Genome-wide association and replication studies identified TRHR as an important gene for lean body mass. Am. J. Hum. Genet. 2009, 84, 418–423. [Google Scholar] [CrossRef]
- Guo, Y.F.; Zhang, L.S.; Liu, Y.J.; Hu, H.G.; Li, J.; Tian, Q.; Yu, P.; Zhang, F.; Yang, T.L.; Guo, Y.; et al. Suggestion of GLYAT gene underlying variation of bone size and body lean mass as revealed by a bivariate genome-wide association study. Hum. Genet. 2013, 132, 189–199. [Google Scholar] [CrossRef]
- Pei, Y.F.; Hu, W.Z.; Yang, X.L.; Wei, X.T.; Feng, G.J.; Zhang, H.; Shen, H.; Tian, Q.; Deng, H.W.; Zhang, L. Two functional variants at 6p21.1 were associated with lean mass. Skelet. Muscle 2019, 9, 28. [Google Scholar] [CrossRef]
- Ran, S.; Zhang, Y.X.; Liu, L.; Jiang, Z.X.; He, X.; Liu, Y.; Shen, H.; Tian, Q.; Pei, Y.F.; Deng, H.W.; et al. Association of 3p27.1 variants with whole body lean mass identified by a genome-wide association study. Sci. Rep. 2020, 10, 4293. [Google Scholar] [CrossRef]
- Ran, S.; He, X.; Jiang, Z.X.; Liu, Y.; Zhang, Y.X.; Zhang, L.; Gu, G.S.; Pei, Y.; Liu, B.L.; Tian, Q.; et al. Whole-exome sequencing and genome-wide association studies identify novel sarcopenia risk genes in Han Chinese. Mol. Genet. Genom. Med. 2020, 8, e1267. [Google Scholar] [CrossRef]
- Wu, S.E.; Chen, W.L. A Genome-wide association study identifies novel risk loci for sarcopenia in a taiwanese population. J. Inflamm. Res. 2021, 14, 5969–5980. [Google Scholar] [CrossRef]
- Yoon, K.J.; Yi, Y.; Do, J.G.; Kim, H.L.; Lee, Y.T.; Kim, H.N. Variants in NEB and RIF1 genes on chr2q23 are associated with skeletal muscle index in Koreans: Genome-wide association study. Sci. Rep. 2021, 11, 2333. [Google Scholar] [CrossRef] [PubMed]
- Luo, J.; Zhang, T.; Wang, W.; Zhang, D. Genome-wide association study of handgrip strength in the Northern Chinese adult twins. Connect. Tissue Res. 2022, 1–9. [Google Scholar] [CrossRef] [PubMed]
- Jin, H.; Yoo, H.J.; Kim, Y.A.; Lee, J.H.; Lee, Y.; Kwon, S.H.; Seo, Y.J.; Lee, S.H.; Koh, J.M.; Ji, Y.; et al. Unveiling genetic variants for age-related sarcopenia by conducting a genome-wide association study on Korean cohorts. Sci. Rep. 2022, 12, 3501. [Google Scholar] [CrossRef]
- Gim, J.A.; Lee, S.; Kim, S.C.; Baek, K.W.; Yoo, J.I. Demographic and genome wide association analyses according to muscle mass using data of the korean genome and epidemiology study. J. Korean Med. Sci. 2022, 37, e346. [Google Scholar] [CrossRef] [PubMed]
- Roth, S.M.; Zmuda, J.M.; Cauley, J.A.; Shea, P.R.; Ferrell, R.E. Vitamin D receptor genotype is associated with fat-free mass and sarcopenia in elderly men. J. Gerontol. A Biol. Sci. Med. Sci. 2004, 59, 10–15. [Google Scholar] [CrossRef]
- Fuku, N.; Mori, S.; Murakami, H.; Gando, Y.; Zhou, H.; Ito, H.; Tanaka, M.; Miyachi, M. Association of 29C>T polymorphism in the transforming growth factor-β1 gene with lean body mass in community-dwelling Japanese population. Geriatr. Gerontol. Int. 2012, 12, 292–297. [Google Scholar] [CrossRef]
- Walsh, S.; Ludlow, A.T.; Metter, E.J.; Ferrucci, L.; Roth, S.M. Replication study of the vitamin D receptor (VDR) genotype association with skeletal muscle traits and sarcopenia. Aging Clin. Exp. Res. 2016, 28, 435–442. [Google Scholar] [CrossRef]
- Johns, N.; Stretch, C.; Tan, B.H.; Solheim, T.S.; Sørhaug, S.; Stephens, N.A.; Gioulbasanis, I.; Skipworth, R.J.; Deans, D.A.; Vigano, A.; et al. New genetic signatures associated with cancer cachexia as defined by low skeletal muscle index and weight loss. J. Cachexia Sarcopenia Muscle 2017, 8, 122–130. [Google Scholar] [CrossRef]
- Pratt, J.; Boreham, C.; Ennis, S.; Ryan, A.W.; De Vito, G. Genetic associations with aging muscle: A systematic review. Cells 2019, 9, 12. [Google Scholar] [CrossRef] [PubMed] [Green Version]
- Yao, X.; Yang, L.; Li, M.; Xiao, H. Relationship of vitamin D receptor gene polymorphism with sarcopenia and muscle traits based on propensity score matching. J. Clin. Lab. Anal. 2020, 34, e23485. [Google Scholar] [CrossRef] [PubMed]
- Khanal, P.; He, L.; Herbert, A.J.; Stebbings, G.K.; Onambele-Pearson, G.L.; Degens, H.; Morse, C.I.; Thomis, M.; Williams, A.G. The Association of multiple gene variants with ageing skeletal muscle phenotypes in elderly women. Genes 2020, 11, 1459. [Google Scholar] [CrossRef] [PubMed]
- He, L.; Khanal, P.; Morse, C.I.; Williams, A.; Thomis, M. Associations of combined genetic and epigenetic scores with muscle size and muscle strength: A pilot study in older women. J. Cachexia Sarcopenia Muscle 2020, 11, 1548–1561. [Google Scholar] [CrossRef] [PubMed]
- Guilherme, J.P.L.; Shikhova, Y.V.; Dondukovskaya, R.R.; Topanova, A.A.; Semenova, E.A.; Astratenkova, I.V.; Ahmetov, I.I. Androgen receptor gene microsatellite polymorphism is associated with muscle mass and strength in bodybuilders and power athlete status. Ann. Hum. Biol. 2021, 48, 142–149. [Google Scholar] [CrossRef]
- Guilherme, J.P.L.F.; Semenova, E.A.; Borisov, O.V.; Kostryukova, E.S.; Vepkhvadze, T.F.; Lysenko, E.A.; Andryushchenko, O.N.; Andryushchenko, L.B.; Lednev, E.M.; Larin, A.K.; et al. The BDNF-increasing allele is associated with increased proportion of fast-twitch muscle fibers, handgrip strength, and power athlete status. J. Strength Cond. Res. 2022, 36, 1884–1889. [Google Scholar] [CrossRef]
- Khanal, P.; Morse, C.I.; He, L.; Herbert, A.J.; Onambélé-Pearson, G.L.; Degens, H.; Thomis, M.; Williams, A.G.; Stebbings, G.K. Polygenic models partially predict muscle size and strength but not low muscle mass in older women. Genes 2022, 13, 982. [Google Scholar] [CrossRef]
- Ahmetov, I.I.; Mozhayskaya, I.A.; Lyubaeva, E.V.; Vinogradova, O.L.; Rogozkin, V.A. PPARG Gene polymorphism and locomotor activity in humans. Bull. Exp. Biol. Med. 2008, 146, 630–632. [Google Scholar] [CrossRef]
- Seaborne, R.A.; Hughes, D.C.; Turner, D.C.; Owens, D.J.; Baehr, L.M.; Gorski, P.; Semenova, E.A.; Borisov, O.V.; Larin, A.K.; Popov, D.V.; et al. UBR5 is a novel E3 ubiquitin ligase involved in skeletal muscle hypertrophy and recovery from atrophy. J. Physiol. 2019, 597, 3727–3749. [Google Scholar] [CrossRef]
- Guilherme, J.P.L.; Semenova, E.A.; Borisov, O.V.; Larin, A.K.; Moreland, E.; Generozov, E.V.; Ahmetov, I.I. Genomic predictors of testosterone levels are associated with muscle fiber size and strength. Eur. J. Appl. Physiol. 2022, 122, 415–423. [Google Scholar] [CrossRef]
- Hall, E.C.R.; Semenova, E.A.; Bondareva, E.A.; Andryushchenko, L.B.; Larin, A.K.; Cięszczyk, P.; Generozov, E.V.; Ahmetov, I.I. Association of genetically predicted bcaa levels with muscle fiber size in athletes consuming protein. Genes 2022, 13, 397. [Google Scholar] [CrossRef] [PubMed]


| Phenotype | p Value | Number of Participants | Reference |
|---|---|---|---|
| Formation of initial list of SNPs associated with sarcopenia-related traits | |||
| Appendicular lean mass (1059 SNPs) | <5 × 10⁻⁹ | 450,243 | [20] |
| Maximal handgrip strength (16 SNPs) | <5 × 10⁻⁸ | 195,180 | [17] |
| Relative handgrip strength (139 SNPs) | <5 × 10⁻⁸ | 334,925 | [18] |
| Handgrip strength in older adults (15 SNPs) | <5 × 10⁻⁸ | 256,523 | [19] |
| Self-reported walking pace (70 SNPs) | <5 × 10⁻⁸ | 450,967 | [21] |
| Matching phenotypes to identify SNPs with pleiotropic effects | |||
| Appendicular lean mass | <0.005 | 450,243 | [20] |
| Appendicular lean mass in older adults | <5 × 10⁻⁸ | 181,862 | [25] |
| Handgrip strength (left) | <0.005 | 359,704 | [26] |
| Handgrip strength (right) | <0.005 | 359,729 | [26] |
| Handgrip strength in older adults | <0.005 | 256,523 | [19] |
| Usual walking pace | <0.005 | 358,974 | [26] |
| Traits analysed for associations with the selected SNPs | |||
| Body fat percentage | <0.005 | 354,628 | [26] |
| Type 2 diabetes | <0.005 | 408,959 | [26] |
| Heel bone mineral density | <0.005 | 426,824 | [27] |
| Frequency of tiredness | <0.005 | 350,580 | [26] |
| Self-reported tiredness | <0.005 | 108,976 | [26] |
| Recent feelings of tiredness or low energy | <0.005 | 117,828 | [26] |
| Falls in the last year | <0.005 | 360,344 | [26] |
| Testosterone levels | <0.005 | 425,097 | [28] |
| Insulin-like growth factor 1 (IGF1) levels | <0.005 | 435,516 | [29] |
| 25-hydroxyvitamin D levels | <0.005 | 417,580 | [30] |
| Time spent watching television | <0.005 | 341,859 | [26] |
| Vigorous physical activity | <0.005 | 261,055 | [31] |
| Participation in strenuous sports | <0.005 | 359,263 | [26] |
| Participation in other exercises | <0.005 | 359,263 | [26] |
| Duration of moderate activity | <0.005 | 268,826 | [26] |
| Duration of other exercises | <0.005 | 172,650 | [26] |
| Moderate to vigorous physical activity levels | <0.005 | 377,234 | [31] |
| Number of days/week of vigorous PA 10+ min | <0.005 | 344,084 | [26] |
| Number of days/week of moderate PA 10+ min | <0.005 | 343,943 | [26] |
| Alcohol intake frequency | <0.005 | 360,726 | [26] |
| Current smoking/ever smoked | <0.005 | 360,797 | [26] |
| Cheese intake | <0.005 | 352,458 | [26] |
| Processed meat intake | <0.005 | 360,468 | [26] |
| Oily fish intake | <0.005 | 359,340 | [26] |
| Water intake | <0.005 | 333,363 | [26] |
| Fruit (fresh or dried) intake | <0.005 | 329,134 | [26] |
| Vegetable (cooked/salad/raw) intake | <0.005 | 350,404 | [26] |
| Muesli intake | <0.005 | 299,898 | [26] |
| Cereal intake | <0.005 | 345,019 | [26] |
| Wholemeal or wholegrain bread intake | <0.005 | 348,424 | [26] |
| White bread intake | <0.005 | 348,424 | [26] |
| Ground (espresso, filter etc.) coffee intake | <0.005 | 283,449 | [26] |
| Salt added to food | <0.005 | 360,954 | [26] |
| Protein intake | <0.005 | 51,453 | [26] |
| Potassium intake | <0.005 | 51,453 | [26] |
| Magnesium intake | <0.005 | 51,453 | [26] |
| Height | <0.005 | 458,235 | [29] |
| Cognitive performance | <0.005 | 257,841 | [32] |
| Intelligence | <0.005 | 269,867 | [33] |
| Educational attainment | <0.005 | 357,549 | [26] |
| Average total household income before tax | <0.005 | 311,028 | [26] |
| Neuroticism | <0.005 | 380,506 | [34] |
| Gene/Near Gene | SNP | Protective Allele | Risk Allele | p Value | ||||
|---|---|---|---|---|---|---|---|---|
| Handgrip Strength | Appendicular Lean Mass | Usual Walking Pace | Body Fat Percentage | Type 2 Diabetes | ||||
| GDF5 | rs143384 | G | A | 5.5 × 10−46 | 7.0 × 10−319 | 4.0 × 10⁻⁸ | NS | NS |
| POLD3 | rs72977282 | T | A | 7.4 × 10⁻²⁸ | 9.3 × 10⁻⁸ | 3.6 × 10⁻³ | NS | NS |
| LCORL | rs1472852 | C | A | 4.0 × 10⁻²⁴ | 8.2 × 10−135 | 3.7 × 10⁻⁴ | 3.0 × 10⁻⁵ | NS |
| ADCY3 | rs10203386 | T | A | 1.6 × 10⁻²³ | 1.7 × 10−36 | 3.3 × 10⁻³ | 2.4 × 10−38 | NS |
| DLEU1 | rs3116602 | T | G | 1.4 × 10⁻²¹ | 9.5 × 10−155 | 8.7 × 10⁻⁴ | NS | NS |
| AOC1 | rs6977416 | A | G | 6.7 × 10⁻¹⁹ | 1.4 × 10−113 | 7.7 × 10⁻⁴ | 5.6 × 10⁻¹⁰ | NS |
| SLC39A8 | rs13107325 | C | T | 2.0 × 10⁻¹⁷ | 3.9 × 10⁻³ | 1.8 × 10⁻²¹ | 5.0 × 10⁻²³ | 1.1 × 10⁻⁴ |
| HLA-DRB1 | rs34415150 | A | G | 3.4 × 10⁻¹⁷ | 2.5 × 10⁻¹⁷ | 2.3 × 10⁻⁵ | 6.6 × 10⁻⁴ | 6.0 × 10⁻¹⁷ |
| HLA-DRB1 | rs2760975 | G | A | 4.6 × 10⁻¹⁷ | 1.7 × 10⁻¹⁷ | 1.6 × 10⁻⁵ | 8.4 × 10⁻⁶ | 6.9 × 10⁻¹⁰ |
| MLLT10 | rs1243182 | C | T | 3.5 × 10⁻¹⁶ | 2.6 × 10⁻³ | 3.9 × 10⁻⁷ | 6.5 × 10⁻¹⁴ | NS |
| PRRC2A | rs2260051 | A | T | 1.0 × 10⁻¹⁵ | 5.2 × 10⁻⁶ | 2.6 × 10⁻⁵ | 3.3 × 10⁻¹⁷ | 1.7 × 10⁻¹³ |
| BTNL2 | rs2213581 | T | C | 1.1 × 10⁻¹⁵ | 4.3 × 10⁻²⁰ | 6.3 × 10⁻⁴ | 3.3 × 10⁻⁶ | 3.2 × 10⁻¹¹ |
| FKBPL | rs41268905 | G | A | 2.4 × 10⁻¹⁵ | 8.9 × 10⁻¹⁷ | 4.0 × 10⁻⁴ | 1.3 × 10⁻⁵ | NS |
| ZBTB38 | rs2871960 | C | A | 4.0 × 10⁻¹⁵ | 2.2 × 10−135 | 1.0 × 10⁻³ | NS | 9.5 × 10⁻⁵ |
| ADCY3 | rs1056074 | T | C | 7.6 × 10⁻¹⁵ | 1.2 × 10⁻¹¹ | 1.3 × 10⁻³ | 1.8 × 10⁻¹⁷ | NS |
| PML | rs5742915 | C | T | 1.8 × 10⁻¹⁴ | 9.3 × 10−39 | 4.0 × 10⁻⁵ | 4.1 × 10⁻⁸ | 1.6 × 10⁻³ |
| POU6F2 | rs4549685 | T | C | 4.5 × 10⁻¹⁴ | 4.0 × 10⁻⁷ | 7.3 × 10⁻⁵ | 2.1 × 10⁻¹² | 1.5 × 10⁻⁴ |
| HMGA2 | rs4338565 | C | T | 8.0 × 10⁻¹⁴ | 4.9 × 10−151 | 2.3 × 10⁻⁴ | NS | 1.4 × 10⁻³ |
| HLA-DRB1 | rs113315602 | A | C | 1.4 × 10⁻¹² | 1.0 × 10⁻⁵ | 5.4 × 10⁻⁴ | 3.5 × 10⁻⁶ | NS |
| WWP2 | rs4985445 | A | G | 1.4 × 10⁻¹² | 3.3 × 10⁻²⁰ | 1.2 × 10⁻⁵ | 4.6 × 10⁻¹⁸ | 1.7 × 10⁻⁵ |
| MTCH2 | rs11039324 | G | A | 3.5 × 10⁻¹² | 7.3 × 10⁻²⁶ | 3.9 × 10⁻¹⁵ | 9.0 × 10−38 | 3.2 × 10⁻⁶ |
| HLA-DRB5 | rs117108573 | C | T | 3.6 × 10⁻¹¹ | 1.1 × 10⁻⁴ | 7.4 × 10⁻⁴ | 3.4 × 10⁻⁴ | NS |
| GBF1 | rs2273555 | G | A | 4.1 × 10⁻¹¹ | 8.1 × 10⁻⁵ | 8.2 × 10⁻⁵ | NS | NS |
| SFMBT1 | rs62253653 | G | A | 9.5 × 10⁻¹¹ | 3.0 × 10⁻³ | 1.0 × 10⁻⁷ | 4.0 × 10⁻³ | 1.2 × 10⁻³ |
| JARID2 | rs2237149 | A | C | 7.5 × 10⁻¹⁰ | 4.5 × 10⁻⁵ | 1.8 × 10⁻⁴ | 6.4 × 10⁻⁶ | NS |
| ADPGK | rs4776614 | C | G | 1.9 × 10⁻⁹ | 8.4 × 10⁻⁶ | 1.4 × 10⁻⁴ | 5.6 × 10⁻¹³ | NS |
| JUND | rs7249 | T | C | 2.0 × 10⁻⁹ | 1.2 × 10⁻⁶ | 2.6 × 10⁻⁴ | 5.8 × 10⁻¹³ | NS |
| KIF1B | rs3903151 | G | A | 2.6 × 10⁻⁹ | 1.3 × 10⁻¹⁶ | 3.0 × 10⁻⁴ | 1.2 × 10⁻⁴ | 2.9 × 10⁻³ |
| SWT1 | rs10797999 | T | C | 3.0 × 10⁻⁹ | 1.4 × 10⁻⁵ | 1.4 × 10⁻⁸ | 2.5 × 10⁻⁴ | NS |
| FOXP1 | rs4677611 | T | C | 3.2 × 10⁻⁹ | 2.4 × 10⁻⁴ | 2.2 × 10⁻³ | 2.3 × 10⁻⁵ | NS |
| SOX5 | rs11047225 | C | T | 8.5 × 10⁻⁹ | 4.3 × 10⁻¹⁰ | 2.2 × 10⁻³ | NS | NS |
| NCOA1 | rs77012907 | A | G | 1.2 × 10⁻⁸ | 1.2 × 10⁻¹³ | 5.8 × 10⁻⁴ | 2.9 × 10⁻¹⁵ | NS |
| MMS22L | rs9320823 | T | C | 1.4 × 10⁻⁸ | 7.9 × 10⁻¹⁰ | 1.1 × 10⁻⁶ | 3.9 × 10⁻²² | 1.5 × 10⁻⁴ |
| ZKSCAN5 | rs3843540 | C | T | 2.3 × 10⁻⁸ | 5.8 × 10⁻⁶ | 1.1 × 10⁻⁴ | 4.0 × 10⁻⁹ | NS |
| MLN | rs12055409 | G | A | 3.5 × 10⁻⁸ | 3.6 × 10⁻³ | 1.8 × 10⁻³ | 3.2 × 10⁻⁷ | 4.4 × 10⁻⁴ |
| FOXP1 | rs830643 | A | G | 4.0 × 10⁻⁸ | 9.7 × 10⁻⁷ | 2.9 × 10⁻⁷ | 5.7 × 10⁻⁸ | 9.3 × 10⁻⁶ |
| GADD45G | rs1329733 | A | G | 4.3 × 10⁻⁸ | 2.2 × 10⁻⁴ | 6.4 × 10⁻⁵ | 9.0 × 10⁻¹³ | NS |
| IL11 | rs4252548 | C | T | 6.2 × 10⁻⁸ | 4.8 × 10⁻³⁵ | 2.6 × 10⁻³ | NS | NS |
| COMMD4 | rs11636600 | G | A | 6.8 × 10⁻⁸ | 5.0 × 10⁻¹³ | 9.7 × 10⁻¹¹ | NS | NS |
| HABP4 | rs6477489 | C | A | 7.2 × 10⁻⁸ | 5.2 × 10−59 | 3.7 × 10⁻³ | 1.1 × 10⁻³ | NS |
| GLCCI1 | rs12702693 | T | C | 1.8 × 10⁻⁷ | 6.6 × 10⁻²⁰ | 1.4 × 10⁻³ | NS | NS |
| H1FX | rs4073154 | G | A | 2.5 × 10⁻⁷ | 1.9 × 10⁻³³ | 3.3 × 10⁻⁸ | NS | NS |
| CEP192 | rs1786263 | G | T | 3.1 × 10⁻⁷ | 1.0 × 10⁻²² | 2.3 × 10⁻³ | 5.5 × 10⁻⁷ | NS |
| PPARD | rs3734254 | T | C | 5.2 × 10⁻⁷ | 2.3 × 10⁻³³ | 5.6 × 10⁻⁶ | NS | NS |
| ZNF568 | rs1667369 | A | C | 1.3 × 10⁻⁶ | 1.5 × 10⁻¹⁰ | 2.7 × 10⁻⁸ | 1.7 × 10⁻³ | NS |
| SERPINA1 | rs28929474 | T | C | 3.5 × 10⁻⁶ | 1.1 × 10⁻¹⁴ | 3.4 × 10⁻⁴ | NS | 2.6 × 10⁻³ |
| NMT1 | rs2301597 | C | T | 4.6 × 10⁻⁶ | 4.8 × 10⁻³³ | 2.7 × 10⁻⁹ | 1.3 × 10⁻⁸ | NS |
| PIEZO1 | rs2968478 | T | G | 5.1 × 10⁻⁶ | 5.6 × 10⁻¹⁴ | 2.8 × 10⁻³ | NS | NS |
| CELF4 | rs12962050 | A | G | 6.8 × 10⁻⁶ | 1.5 × 10⁻¹⁴ | 4.8 × 10⁻⁴ | 2.1 × 10⁻³ | NS |
| BCKDHB | rs9350850 | C | T | 7.5 × 10⁻⁶ | 2.9 × 10⁻²⁴ | 1.3 × 10⁻³ | NS | NS |
| E2F3 | rs4134943 | T | C | 9.9 × 10⁻⁶ | 2.0 × 10⁻⁸ | 4.9 × 10⁻⁹ | 6.7 × 10⁻⁵ | 1.2 × 10⁻⁵ |
| BTRC | rs10883618 | A | G | 2.6 × 10⁻⁵ | 1.8 × 10⁻⁴ | 4.1 × 10⁻⁹ | 1.5 × 10⁻⁶ | 4.6 × 10⁻³ |
| LIN28A | rs4274112 | A | G | 2.8 × 10⁻⁵ | 2.5 × 10⁻²⁸ | 8.5 × 10⁻⁴ | 6.8 × 10⁻⁴ | 3.3 × 10⁻⁴ |
| ZNF420 | rs62108897 | C | A | 6.3 × 10⁻⁵ | 7.7 × 10⁻¹⁹ | 4.7 × 10⁻³ | 7.1 × 10⁻⁴ | NS |
| JUND | rs10686842 | TAAA | T | 6.4 × 10⁻⁵ | 7.4 × 10⁻²⁴ | 3.7 × 10⁻⁴ | 1.6 × 10⁻¹⁹ | NS |
| DIPK1A | rs12733767 | C | T | 6.8 × 10⁻⁵ | 9.4 × 10⁻¹⁴ | 9.0 × 10⁻⁵ | 3.2 × 10⁻³ | NS |
| IGF2BP3 | rs34776209 | C | T | 6.9 × 10⁻⁵ | 1.8 × 10−47 | 8.4 × 10⁻⁴ | NS | NS |
| XPO4 | rs7321635 | A | C | 9.0 × 10⁻⁵ | 2.6 × 10⁻¹¹ | 4.5 × 10⁻⁴ | NS | NS |
| FHL2 | rs55680124 | C | T | 1.1 × 10⁻⁴ | 4.2 × 10⁻⁴ | 2.6 × 10⁻⁹ | 6.0 × 10⁻⁸ | 2.3 × 10⁻⁷ |
| VCAN | rs115912456 | G | A | 1.8 × 10⁻⁴ | 3.7 × 10⁻³⁴ | 1.8 × 10⁻³ | 3.5 × 10⁻¹⁴ | NS |
| RBL2 | rs72801843 | A | T | 1.9 × 10⁻⁴ | 8.8 × 10−52 | 8.9 × 10⁻⁶ | NS | 4.5 × 10⁻⁵ |
| NPPC | rs73000823 | C | T | 2.3 × 10⁻⁴ | 1.7 × 10⁻¹⁵ | 3.7 × 10⁻⁴ | 1.4 × 10⁻⁵ | NS |
| MYO1C | rs9905106 | T | C | 3.5 × 10⁻⁴ | 7.5 × 10⁻¹⁴ | 3.9 × 10⁻³ | 4.4 × 10⁻⁵ | NS |
| CDKAL1 | rs745771286 | G | GA | 3.9 × 10⁻⁴ | 2.7 × 10⁻¹¹ | 4.8 × 10⁻⁵ | 4.7 × 10⁻⁵ | NS |
| GIP | rs4794005 | A | G | 4.3 × 10⁻⁴ | 8.8 × 10⁻¹⁵ | 1.1 × 10⁻³ | 4.9 × 10⁻⁴ | 3.6 × 10⁻⁴ |
| NCL | rs10202701 | T | C | 4.3 × 10⁻⁴ | 3.1 × 10⁻³³ | 2.0 × 10⁻³ | 2.3 × 10⁻⁵ | NS |
| SOCS5 | rs62136933 | A | G | 5.7 × 10⁻⁴ | 9.0 × 10⁻³² | 2.1 × 10⁻⁴ | 3.8 × 10⁻¹¹ | NS |
| CAMKMT | rs11893991 | A | G | 6.0 × 10⁻⁴ | 2.3 × 10⁻⁹ | 2.4 × 10⁻³ | NS | NS |
| RIN3 | rs117068593 | T | C | 6.0 × 10⁻⁴ | 8.8 × 10−62 | 3.9 × 10⁻³ | 3.8 × 10⁻¹⁰ | NS |
| JMJD1C | rs7924036 | T | G | 8.9 × 10⁻⁴ | 1.2 × 10⁻⁵ | 1.2 × 10⁻¹³ | NS | NS |
| TRIB1 | rs4870941 | G | C | 1.3 × 10⁻³ | 1.1 × 10−39 | 2.1 × 10⁻³ | NS | NS |
| SDCCAG8 | rs2994330 | T | G | 2.4 × 10⁻³ | 6.6 × 10⁻¹² | 9.6 × 10⁻⁵ | 3.0 × 10⁻⁴ | NS |
| NYAP2 | rs2054079 | T | C | 3.0 × 10⁻³ | 3.9 × 10⁻⁴ | 4.3 × 10⁻⁹ | NS | NS |
| MAML3 | rs57800857 | C | A | 3.5 × 10⁻³ | 4.0 × 10⁻⁷ | 6.4 × 10⁻¹¹ | 1.4 × 10⁻¹³ | 2.7 × 10⁻⁴ |
| PITX1 | rs4976261 | G | C | 3.6 × 10⁻³ | 8.7 × 10−43 | 1.7 × 10⁻³ | NS | NS |
| PKDCC | rs3035165 | T | TTA | 3.7 × 10⁻³ | 6.9 × 10⁻¹⁴ | 1.0 × 10⁻³ | 3.0 × 10⁻⁸ | NS |
| HTT | rs362307 | C | T | 3.9 × 10⁻³ | 2.5 × 10⁻⁷ | 1.1 × 10⁻⁹ | 2.8 × 10⁻⁹ | 1.3 × 10⁻⁶ |
| ZNF462 | rs902144 | C | G | 4.0 × 10⁻³ | 7.2 × 10⁻¹³ | 4.0 × 10⁻⁴ | 1.7 × 10⁻³ | NS |
| Trait | Disease Risk and Number of Risk Alleles | ||||
|---|---|---|---|---|---|
| Low | Below Average | Average | Above Average | High | |
| Sarcopenia (78 SNPs) | 58–68 | 69–72 | 73–76 | 77–80 | 81–95 |
| Sarcopenic obesity (55 SNPs) | 37–47 | 48–50 | 51–53 | 54–57 | 58–70 |
| Sarcopenic diabesity (21 SNPs) | 10–16 | 17–18 | 19–20 | 21–22 | 23–30 |
Disclaimer/Publisher’s Note: The statements, opinions and data contained in all publications are solely those of the individual author(s) and contributor(s) and not of MDPI and/or the editor(s). MDPI and/or the editor(s) disclaim responsibility for any injury to people or property resulting from any ideas, methods, instructions or products referred to in the content. |
© 2023 by the authors. Licensee MDPI, Basel, Switzerland. This article is an open access article distributed under the terms and conditions of the Creative Commons Attribution (CC BY) license (https://creativecommons.org/licenses/by/4.0/).
Share and Cite
Semenova, E.A.; Pranckevičienė, E.; Bondareva, E.A.; Gabdrakhmanova, L.J.; Ahmetov, I.I. Identification and Characterization of Genomic Predictors of Sarcopenia and Sarcopenic Obesity Using UK Biobank Data. Nutrients 2023, 15, 758. https://doi.org/10.3390/nu15030758
Semenova EA, Pranckevičienė E, Bondareva EA, Gabdrakhmanova LJ, Ahmetov II. Identification and Characterization of Genomic Predictors of Sarcopenia and Sarcopenic Obesity Using UK Biobank Data. Nutrients. 2023; 15(3):758. https://doi.org/10.3390/nu15030758
Chicago/Turabian StyleSemenova, Ekaterina A., Erinija Pranckevičienė, Elvira A. Bondareva, Leysan J. Gabdrakhmanova, and Ildus I. Ahmetov. 2023. "Identification and Characterization of Genomic Predictors of Sarcopenia and Sarcopenic Obesity Using UK Biobank Data" Nutrients 15, no. 3: 758. https://doi.org/10.3390/nu15030758