Article

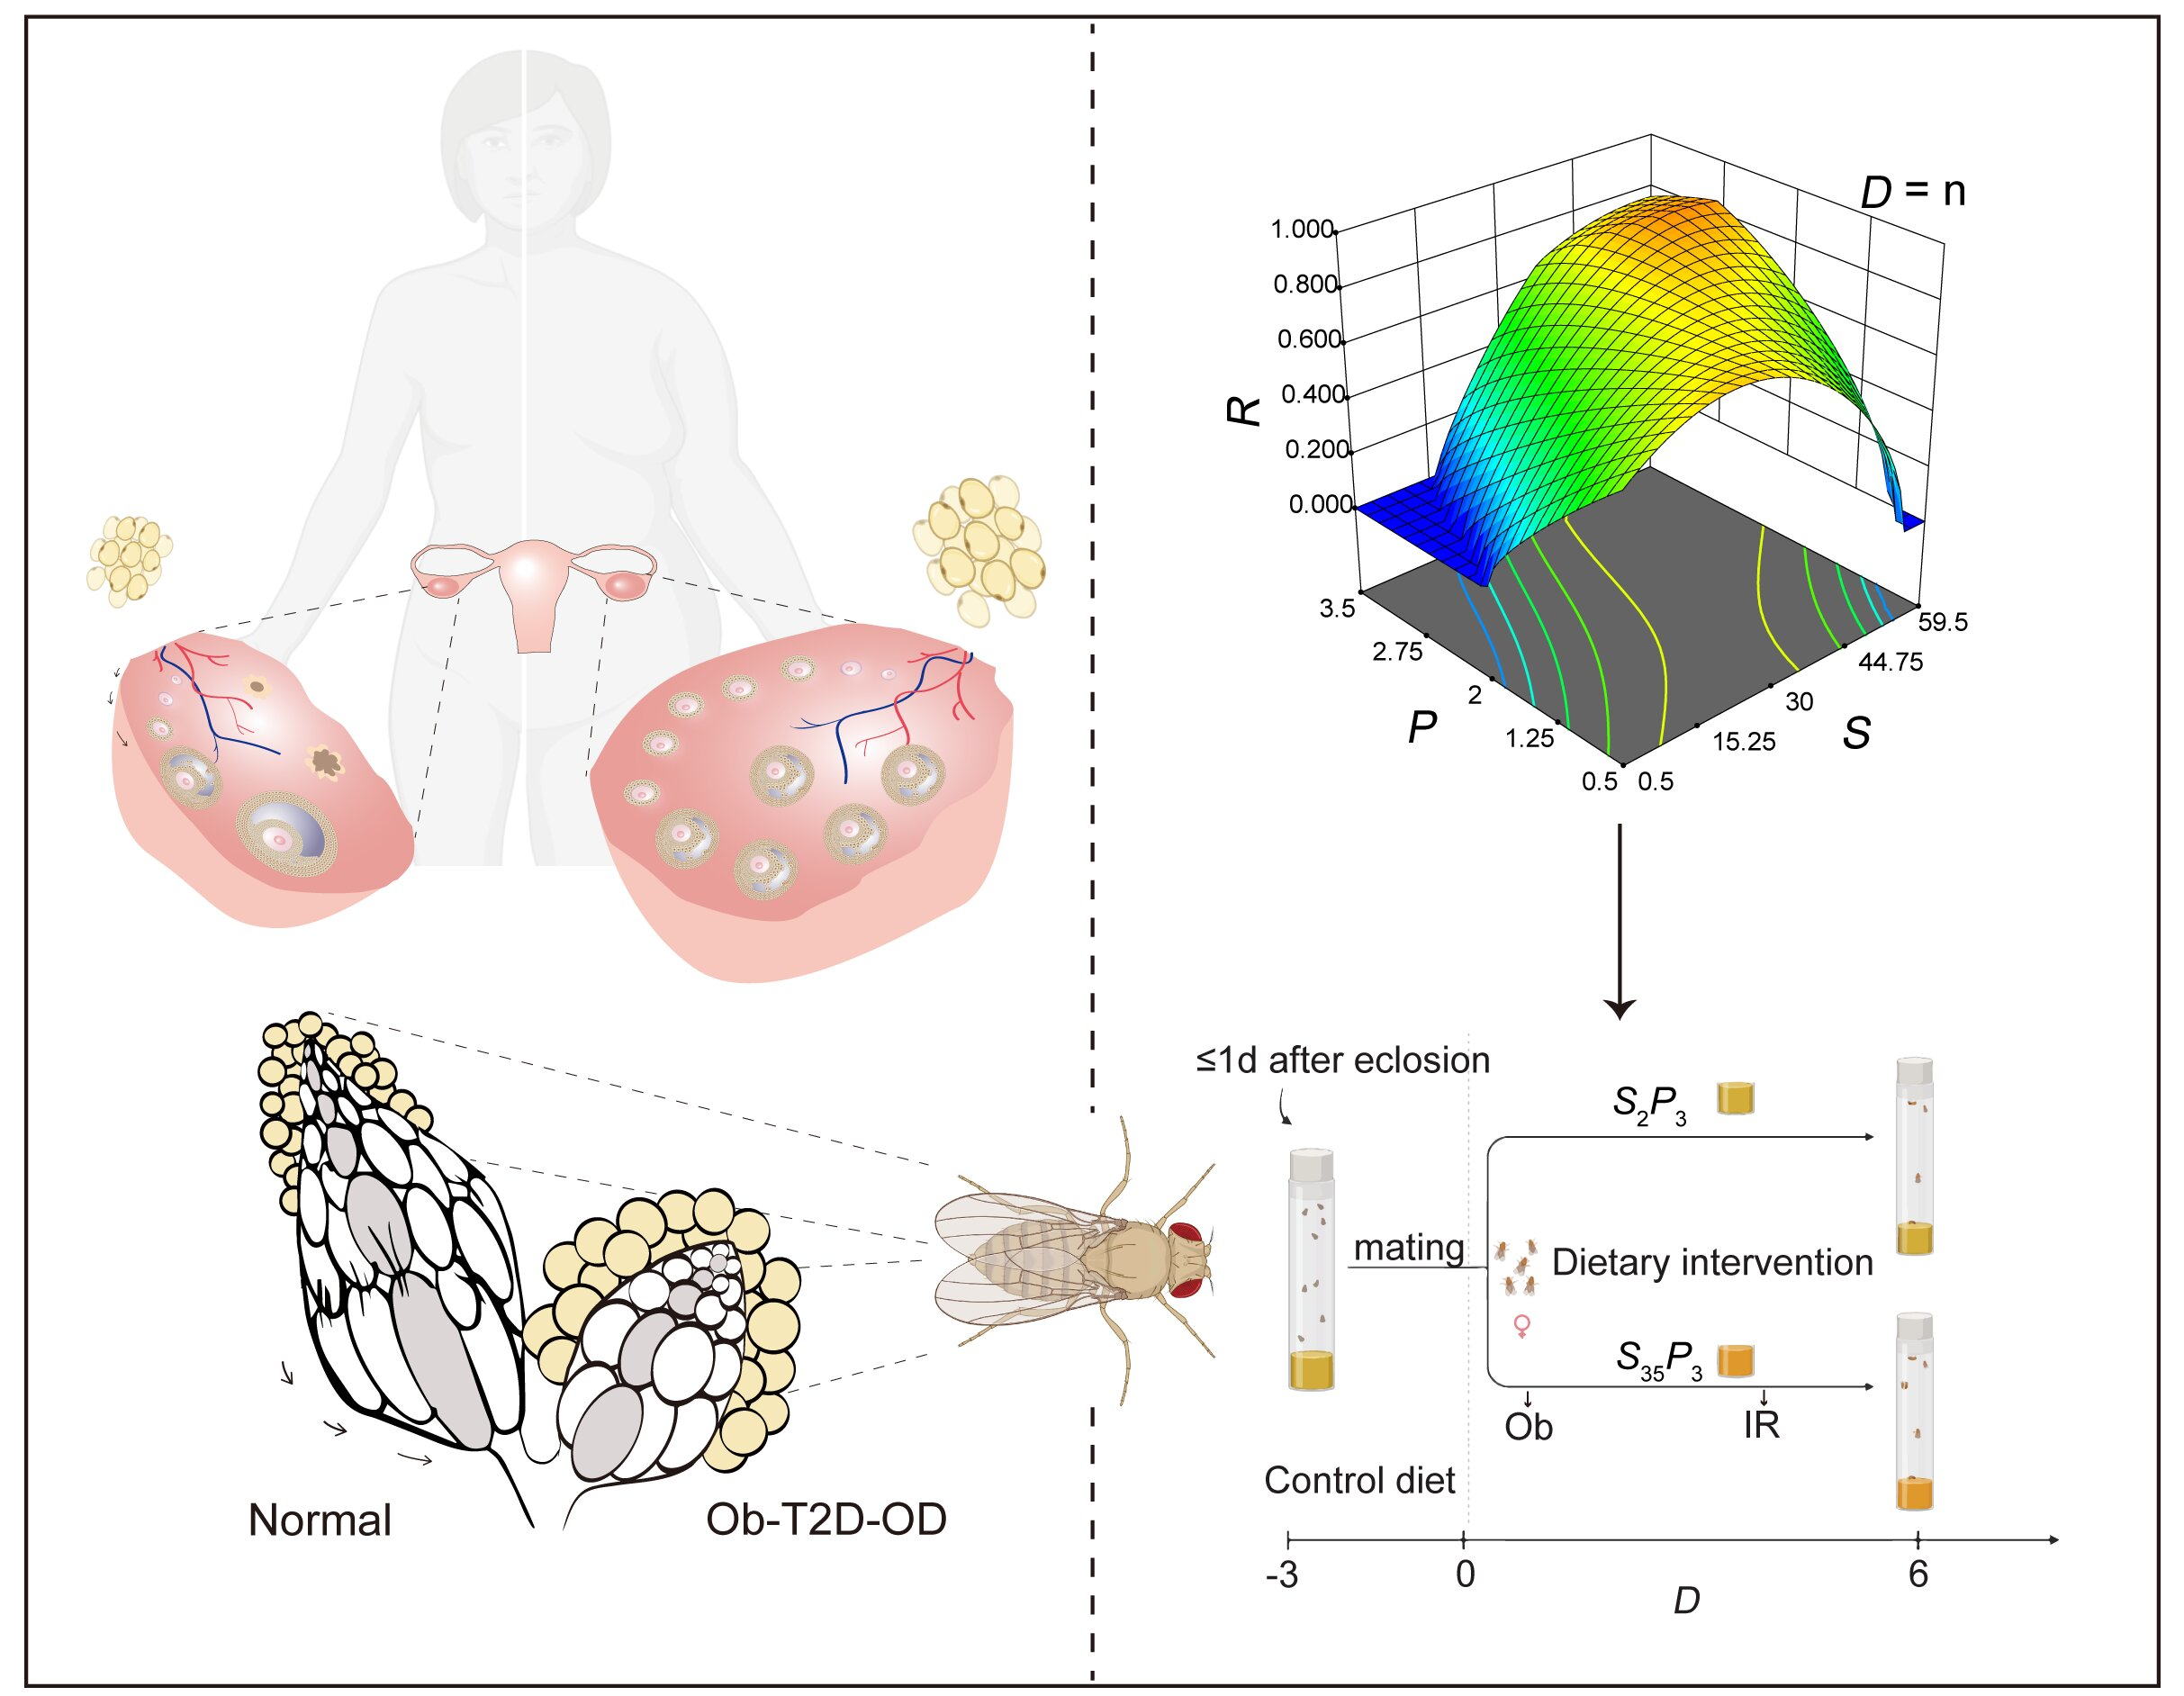
Modeling Obesity-Associated Ovarian Dysfunction in Drosophila

1
Women’s Hospital and Institute of Genetics, Zhejiang University School of Medicine, Hangzhou 310058, China
2
Zhejiang Provincial Key Laboratory of Genetic and Developmental Disorder, Hangzhou 310058, China
3
ZJU-UOE Institute, Zhejiang University School of Medicine, Haining 314400, China
4
Women’s Reproductive Health Research Laboratory of Zhejiang Province, Hangzhou 310006, China
5
Zhejiang University-University of Toronto Joint Institute of Genetics and Genome Medicine, Hangzhou 310058, China
*
Authors to whom correspondence should be addressed.
Current address: School of Life Sciences, Westlake University, Hangzhou 310030, China.
Nutrients 2022, 14(24), 5365; https://doi.org/10.3390/nu14245365
Submission received: 21 November 2022 / Revised: 13 December 2022 / Accepted: 14 December 2022 / Published: 16 December 2022
(This article belongs to the Topic Metabolism and Health)

Abstract

:
We perform quantitative studies to investigate the effect of high-calorie diet on Drosophila oogenesis. We use the central composite design (CCD) method to obtain quadratic regression models of body fat and fertility as a function of the concentrations of protein and sucrose, two major macronutrients in Drosophila diet, and treatment duration. Our results reveal complex interactions between sucrose and protein in impacting body fat and fertility when they are considered as an integrated physiological response. We verify the utility of our quantitative modeling approach by experimentally confirming the physiological responses—including increased body fat, reduced fertility, and ovarian insulin insensitivity—expected of a treatment condition identified by our modeling method. Under this treatment condition, we uncover a Drosophila oogenesis phenotype that exhibits an accumulation of immature oocytes and a halt in the production of mature oocytes, a phenotype that bears resemblance to key aspects of the human condition of polycystic ovary syndrome (PCOS). Our analysis of the dynamic progression of different aspects of diet-induced pathophysiology also suggests an order of the onset timing for obesity, ovarian dysfunction, and insulin resistance. Thus, our study documents the utility of quantitative modeling approaches toward understanding the biology of Drosophila female reproduction, in relation to diet-induced obesity and type II diabetes, serving as a potential disease model for human ovarian dysfunction.

Graphical Abstract

1. Introduction

Oogenesis is a long and energy-consuming process essential to the propagation of an animal species [1,2,3]. Being a major commitment to the allocation of a significant quantity of bio-resources and a first step toward safeguarding orderly embryonic development for the offspring, oogenesis is a highly regulated, complex process involving the interactions among different tissues [4,5,6]. It is highly sensitive to the availability of nutrients. Either malnutrition or obesity can adversely impact this process and, consequently, female fertility. For example, it has been shown that, in Drosophila, starvation or high-sugar diets can each reduce the number of eggs a female produces over her lifespan [7,8]. Female fertility in humans is also known to be sensitive to nutrients and metabolic homeostasis, and metabolic disorders induced by either genetic or life-style factors have been associated with several types of ovarian dysfunction [9,10].
Drosophila and humans share similar organs or tissues participating in the regulation of metabolic homeostasis and female reproduction [11,12]. They include the ovary, adipose tissues (fat body in Drosophila), β-pancreatic islet cells (insulin-producing cells in Drosophila), gut, and blood (hemolymph in Drosophila). Drosophila has been successfully used to model metabolic disorders, and a high-sugar diet can cause insulin resistance [8,13,14,15]. In addition, it is well-documented that oogenesis is dependent on the insulin signaling pathway in Drosophila [13,16,17,18,19]. Thus, the relationship between high-sugar diet and egg production defects may be viewed conveniently, though likely incompletely, through insulin resistance (IR) and type II diabetes (T2D). In several human female reproductive conditions, there exists a triangular relationship involving obesity (Ob), T2D, and ovarian dysfunction (OD). These three aspects tend to be intricately associated with one another in a complex, interactive way that compounds the heterogeneous nature of OD syndromes [20,21,22]. One common OD is polycystic ovary syndrome (PCOS), which is characterized by oligo-ovulation/anovulation, a polycystic ovary, and androgen excess [10,23]. Due to the heterogenous nature of this disorder, a clinical diagnosis of PCOS needs to satisfy at least two of these three features, according to the Rotterdam criteria [23]. Meanwhile, around 50–75% of patients with PCOS are obese or have impaired insulin sensitivity [24,25], and obese females are at higher risk for fertility issues [26] and T2D [27]. Women with T2D also tend to have an increased likelihood of anovulation [28], and those with subfertility have an increased risk for T2D [29].
Here, we aim to model the triangular relationship among Ob, T2D, and OD in Drosophila through systematic diet manipulations and quantitative modeling of their pathophysiological responses. While the connection between a high-sugar diet and T2D is well-established in Drosophila [15,30,31], the contribution of protein—another high-energy component in Drosophila diet—to this triangular relationship remains to be fully resolved, particularly with Ob being an indispensable player in this relationship. We design experiments to integrate the use of protein and sugar toward establishing a Drosophila model to capture this triangular relationship, referred to as the Ob-T2D-OD model. Through quantitative measurements and data fitting guided by the central composite design (CCD) method, we identify a treatment condition based on the quantitative modeling approach and experimentally verify the three aspects of pathophysiology. We describe an oogenesis phenotype observed under this treatment condition, with an accumulation of immature oocytes and a halt in the production of mature oocytes, a phenotype that resembles the key aspects of PCOS in human patients. Our quantitative measurements also reveal new insights into how the two high-energy food sources—protein and sucrose—interact in impacting the different aspects of the pathophysiology when they are considered as an integrated response. In addition, we provide evidence suggesting a temporal order of onset timing of the three aspects of diet-induced pathophysiology, likely reflective of complex interactions within the triangular relationship. We will discuss the implications of our findings in relation to the understanding of PCOS.

2. Materials and Methods

2.1. Fly Stocks and Husbandry

The Drosophila strain w1118 (BL3605) was used throughout this study. Flies were raised at 25 °C and 60% relative humidity with a 12–12 light/dark cycle. The diet for normal husbandry (ND) contained 5 g/dL corn flour, 1 g/dL agar, 2.45 g/dL dry yeast, 0.725 g/dL white sugar, and 3 g/dL brown sugar. The manipulated diets for CCD experiments contained 8.6 g/dL corn flour, 1.2 g/dL agar, and designed concentrations (see below) of dry yeast and pure sucrose (Sangon Biotech-A502792, Shanghai, China).

2.2. Central Composite Design

A CCD design with k factors requires a total of C + 2k + 2k experiments, where C is the number of replicates at the center point of the cubic design space recommended for 5–6; 2k is the number of factorial points representing the experimental domain; 2k is the number of “star” points allowing estimation of curvature, which are axial points outward-extended from the face centers of the cube [32]. The distance from a star point to the center point is 2k/4-fold of the center-to-face distance for each factor. In our design (k = 3), the 20 runs included eight factorial points, six start points, and six replicate center points, with two responses (Bf and F) measured for each run.
In the current study, we evaluated three variables, S, P, and D (see Results and Discussion for details), and our parameter space was chosen based on the following considerations: (1) the range of S was set to be as large as possible; (2) excessive P was avoided to prevent uncontrolled effects associated with food texture; and (3) a range of D was chosen to allow the coverage of the dynamic changes in pathophysiological responses. Accordingly, S = 30 ± 17.5 g/dL (center ± center-to-face distance), P = 2 ± 1 g/dL, and D = 5 ± 2 d were chosen. After this parameter space was augmented by six star points each, with a 1.682-fold dilation, a total of 20 experimental runs were designed (Tables S1 and S2). Design-Expert v12.0.3 was used to randomize the actual layout of experimental runs.

2.3. Measurements of Fertility and Body Fat in CCD Experiments

Adults within 1 day of eclosion were collected and free to mate on ND for 3 days. Females were then isolated and distributed into vials (25 × 95 mm), each with ~6 flies on the manipulated diet. Vials were replaced with fresh food of the same formula each day until the time of measurements. Prior to F measurement, each vial was replaced with ND food, from which the number of flies alive and the number of eggs produced within a 24-h period were counted. For each experimental run, 4~7 vials were measured as independent replicates.
For Bf measurement, flies from each experimental vial were weighed and stored at −80 °C. On the day of measurement, the collected samples were homogenized in iced PBS and then centrifuged at 4 °C. From each sample, three aliquots of 5 μL supernatants were subjected to triglycerides assay, according to the manufacturer’s instructions (XinFan-XFC121, Shanghai, China). Bf was calculated by C TG   n m o l · μ L 1 ×   V   μ L body   weight   mg , where CTG is the TG concentration and V is the added PBS volume.

2.4. Statistical Modeling of CCD Data

Design-Expert was used to perform statistical analyses. Externally studentized residuals (ESR) were used to detect unexpected trends or outlying observations. A series of diagnostics plots, including ESR plot (Figure S1A,B) and normal probability plot (Figure S1C,D), were generated. According to the instructions of Design-Expert, runs #2 and #13 for Bf and runs #17 and #19 for F were excluded from modeling; no further transformation was made.
For each response, Bf or F, a quadratic model was suggested over linear, two-factor-interaction or cubic model by Design-Expert. ANOVA, adjusted R2 (indicating amount of variation explained by the model), predicted R2 (indicating amount of variation in predicted data explained by the model), and adequate precision (requiring a value greater than 4 to indicate a high signal-to-noise ratio) all demonstrated good fitting of each model (Table S3). Independent ANOVA was also performed against each term of the model. The results suggested that all terms were significant in one or both of the models. Therefore, no term reduction or further optimization was considered.
The resulting models were expressed using either coefficients with actual units or coefficients with one single unit that was coded for all three variables as coded = actual   setting     average   actual   setting range   between   low   and   high   actual   settings / 2 . The actual models (Equations (1) and (2)) were used to identify optimal conditions from the integration of the two responses.
y B f = 47.0318 + 0.4507 x 1 12.1659 x 2 3.2591 x 3 + 0.5661 x 1 x 2 0.06036 x 1 x 3 1.0766 x 2 x 3 0.0162 x 1 2 + 0.4255 x 2 2 + 0.7499 x 3 2
y F = 7.01887 0.315118 x 1 + 3.50601 x 2 0.342871 x 3 0.088894 x 1 x 2 + 0.015099 x 1 x 3 0.454678 x 2 x 3 + 0.004912 x 1 2 + 0.985154 x 2 2 0.033222 x 3 2
In the coded models (Equations (3) and (4)), the coded coefficients represent the relative contributions of the corresponding terms. The interaction between S and P (x1x2) contributed the most to Bf among all variable terms, but contributed less and in an opposite direction to F.
y B f = 39.97 + 5.44 x 1 + 1.14 x 2 + 0.5505 x 3 + 9.91 x 1 x 2 2.11 x 1 x 3 2.15 x 2 x 3 4.9   5 x 1 2 + 0.4255 x 2 2 + 3.00 x 3 2
y F = 2.78 2.15 x 1 + 2.51 x 2 2.26 x 3 1.56 x 1 x 2 + 0.5285 x 1 x 3 0.9094 x 2 x 3 + 1.50 x 1 2 + 0.9852 x 2 2 0.1329 x 3 2
Four desirability functions were used to integrate the two responses of Bf and F: d B f h i g h = B f m i n B f max B f m i n B f , d B f l o w = m a x B f B f max B f m i n B f , d F h i g h = F m i n F max F m i n F , and d F l o w = m a x F F max F m i n F .

2.5. Measurement of Continued Egg Production

Under S2P3 and S35P3, we measured continued egg production from the same females on a daily basis for a 6-day period. The procedure was identical to that used in CCD experiments, except that egg laying was carried out on the manipulated diet, instead of ND. Thus, in this continued measurement, D = n refers to the number of eggs during the 1-day period of (n − 1 to n) on the specified diet, whereas in F measurement it refers to the number of eggs during the 1-day period of (n to n + 1) on ND.

2.6. Staining and Quantification of Lipid Droplets in the Fat Body

Fat body tissues were freshly dissected from females in the four selected experimental runs: S2P3D1, S2P3D6, S35P3D1, and S35P3D6. Dissected tissues were immediately fixed in PBS with 4% formaldehyde for 20 min at room temperature (RT) and washed in PBST for 10 min × 3. Then, the samples were stained with 1 μg/mL Nile red (Sigma-72485, St. Louis, MO, USA) for 30 min. After another three washes, the samples were incubated with phalloidin (BIORIGIN-BN1053, Beijing, China, 1:200 in PBT) for 1 h. After 3 washes with PBST, the samples were mounted in DAPI-containing medium (Beyotime-PO131, Shanghai, China). Images were acquired with a magnification of 400 under the confocal microscope (Olympus-FV1000, Tokyo, Japan). The sizes of LDs were quantified by ImageJ v1.53.

2.7. Measurement of Food and Energy Intake

We measured feeding under four conditions S2P3D1, S35P3D1, S2P3D6, and S35P3D6, as follows. Females completed their specified treatment with the last 24 h on the food containing 0.5 g/dL Brilliant Blue (Solarbo-E8500, Beijing, China). The collected 5–6 flies in each vial were homogenized in PBS on ice and then centrifuged at 4 °C. From the supernatants, optical density at 630 nm (OD630) was measured. Averaged food intake per fly per day was determined from the linear ranges of pre-established standard curves (food concentration in PBS vs. OD630) for S2P3 and S35P3, respectively. Caloric intake was calculated using the Drosophila dietary composition calculator [33].

2.8. Hemolymph Glucose Measurement

Liquid nitrogen freezing, followed by vortex, was used separate the head from body of 5–6 weighted females in an Eppendorf tube. PBS solution (10 μL/female) was added, followed by centrifugation at 3000× g for 6min (4 °C). The supernatant was heated at 80 °C for 7 min and centrifuged at 13,000× g for 15 min. Glucose detection of the supernatant was based on GOD-POD methods (LEAGENE TC0711, Beijing, China), and sample absorbance under 510 nm was measured with the microplate reader (UMR-9600, Hangzhou, China). Hemolymph glucose content was calculated through the reference standard and normalized to body weight (BW).

2.9. Ovary Morphology Imaging and Ovarian Stage Identification

Ovaries were dissected within PBS under stereomicroscope (Nikon C-PSN, Tokyo, Japan) and imaged under 40× microscope (Nikon SMZ18, Tokyo, Japan) with the camera (Nikon DS-Ri2, Tokyo, Japan). Ovarioles were separated from whole ovaries within DAPI-containing medium on slides. Egg chambers of whole ovaries were imaged with microscopes (ZESS Axio-Observer, Olympus-FV1000) to obtain both DAPI and bright field. Egg chamber size was measured by Image J, and it was used as a feature in stage identification [34]. Stages 1–7 were identified by their overall size, in combination with manual verification; stages 8 and 9 were identified according to the presence or absence of the nuclei surrounding the anterior nurse cells and stages 10–14 were identified based on morphology.

2.10. Insulin Sensitivity Assay of Dissected Ovaries

Ovaries from females cultured on S2P3 and S35P3 diets from D = 0 to D = 6 were freshly dissected in Schneider’s Drosophila medium (Gibco, USA) with serum supplement (GEMINI−900–108), and then incubated with or without 0.5 μM recombinant human insulin (NJDULY-P0029, Nanjing, China) for 15 min at RT. After three washes in PBS, the tissue samples were lysed in RIPA buffer (FDBIO-FD009, Hangzhou, China) with phenylmethanesulfonyl fluoride (FDBIO-FD0100), protease inhibitor mix (FDBIO-FD1001), and protein phosphatase inhibitor mix (FDBIO-FD1002) on ice. After centrifugation at 13,000× g at 4 °C for 10 min, the supernatants were mixed with loading buffer (FDBIO-FD006) at 98 °C for 5 min. Proteins were separated on 10% SDS-PAGE (FDBIO-FD346) and then transferred to the PVDF membrane (Millipore-IPVH00010, USA). Following blocking in TBST with 5% non-fat milk at RT for 1.5 h, the membrane was added with the primary antibody and incubated overnight with rocking at 4 °C. After three washes in TBST, the membrane was incubated with anti-mouse or anti-rabbit HRP-conjugated secondary antibodies (GenScript-A00160 and A00098, respectively) at RT for 1 h. The membrane was then washed three times in TBST and visualized using ECL Western Blotting Substrate (Vazyme-E411, Nanjing, China). Blots were scanned using a gel imaging system (QinXiang-ChemiScope6000, Shanghai, China). Primary antibodies used in this study were: phospho-AKT (Ser473) (Cell Signaling Technology-#9271, MA, USA), total Akt (Cell Signaling Technology-#4691), and α-tubulin (Beyotime-AT819).

2.11. mRNA-seq Library Preparation, Sequencing and Analysis

Each total RNA sample was extracted from freshly dissected ovaries of ~20 females under the selected condition with RNAiso Plus (Takara, Tokyo, Japan). mRNA-seq libraries were prepared with VAHTS V3 Library Prep Kit (Vazyme, Nanjing, China). Sequencing was performed with PE150 chemistry by NovaSeq6000 (Illumina, San Diego, CA, USA). The clean reads were trimmed for adaptors and filtered with fastp v0.20.1 [35] and then aligned to the dmel_r6.34 reference genome with HISAT2 v2.2.1 with default parameters [36]. The counts of reads mapped to protein-coding genes were summarized with featureCounts v2.0.1 [37]. Differential gene expression (DEG) analysis was performed with DESeq2 v1.32.0 [38]. Gene Ontology and KEGG enrichment analyses of differentially expressed genes (|log2FoldChange| > 0.5 and p-value < 0.05) were performed with the R package clusterProfiler v4.2.2 [39]. Top GO or KEGG terms with the smallest Benjamini-Hochberg-adjusted p-values were graphically displayed. Complete information of DEG, GO, and KEGG analyses are presented in Supplementary Table S1.

2.12. Other Statistical Information and Visualization Tools

Quantified results were reported as mean ± standard error of the mean (SEM), unless specified otherwise. Two-tailed t-test and two-way ANOVA were used in the analysis. Bar plots were generated with GraphPad 9. Stacked bar charts and line plots with confidence interval were generated with Origin Lab Pro. Diagrams were generated with Adobe Illustrator and, when necessary, aided by BioRender “https://app.biorender.com/biorender-templates (accessed on 8 March 2022)” for illustrative artwork.

3. Results and Discussion

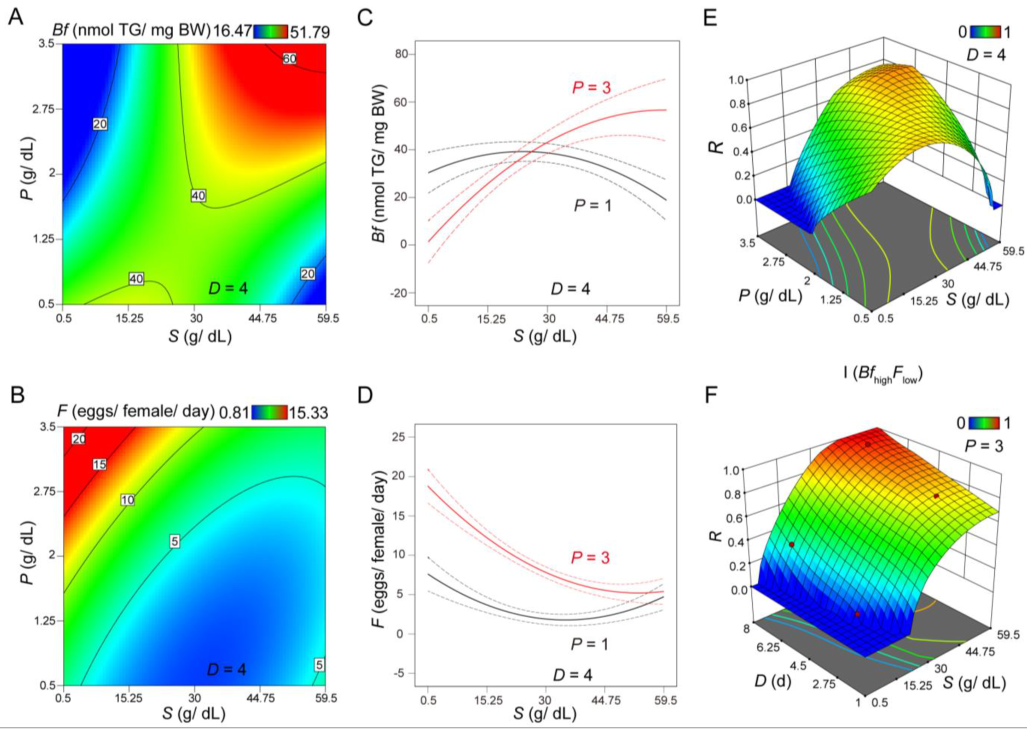
3.1. CCD Analysis Evaluating the Role of Sucrose and Protein on Body Fat and Fertility

We utilized the CCD method to quantitatively evaluate the effect of sucrose and protein (yeast) on body fat and female fertility. CCD is a response surface methodology frequently used to evaluate multiple variables impacting an outcome to facilitate optimizations [40]. Here, we used three independent variables: sucrose concentration in the food (denoted as S), yeast concentration representing protein content (denoted as P), and treatment duration on a given diet (denoted as D). At each treatment condition with a set of predetermined values for S, P, and D, we measured the body fat (denoted as Bf), which is the amount of triglyceride per unit of total body weight, and fertility (denoted as F), which is the average number of eggs produced per female per day. Since the effect of a high-sucrose diet on T2D is well-documented in Drosophila [31,41], we did not perform direct measurements of this aspect during CCD analysis (see below for experimental verification).
With three independent variables, we employed 20 treatment conditions (runs), specified under the CCD methodological framework (Table S1). Each run performed no fewer than three replicates or independent measurements, the mean of which is referred to as a datapoint, as shown in Table S2. As detailed in Materials and Methods, flies within one-day emergence were transferred to bottles containing normal diet (ND). Three days later, 5~7 females were selected and placed in individual vials, each constituting a run, as designed by CCD. Upon the completion of a treatment, the females were then placed back on ND for one day to obtain the average number of eggs per female during this one-day period as the F measurement or taken immediately for Bf measurements upon freezing. The experimental design and the corresponding results, which were derived from a total of 158 separate measurements, are summarized in Table S2.
After verification of our experimental measurements (Figure S1A–D; see Materials and Methods for further details), the associations between the three independent variables and the two responses were modeled with a quadratic function in Equation (5),
y = i = 1 k β i x i + i = 1 k β i i x i 2 + i < j k β i j x i x j + β 0
where y is Bf or F; xi is S, P, or D; β i   , β i i , and β i j are the coefficients for x i (linear), x i 2 (quadratic), and x i x j (first-order interaction), respectively; β 0 is a model constant. The values of these coefficients (Equations (1)–(4)) and the detailed modeling strategy are summarized in Materials and Methods. The resulting models, as well as each term individually, were tested for statistical fitness with ANOVA (Table S3). F-tests revealed a p-value of < 0.001 in each response, suggesting that the quadratic fitting was statistically significant in each case. Scatter plots of the predicted values against experimental measurements exhibited an excellent linearity (R2 = 0.94 and 0.99 for Bf and F, respectively; Figure S1E,F).

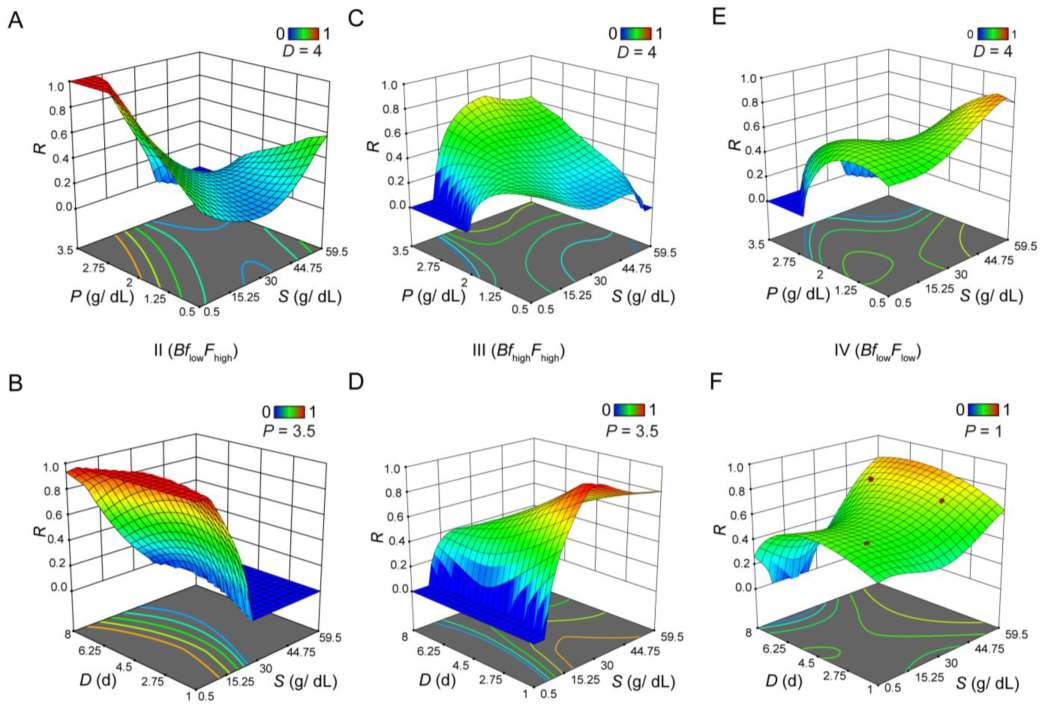
3.2. Evaluating Body Fat and Fertility as Distinct Responses or As an Integrated Response under Different Scenarios

Graphic presentations of the two responses for 4-day treatment (D = 4) are shown in Figure 1A,B). These results revealed that, contrary to what would have been expected in a simplistic manner [8,13,42,43], an increase in S did not necessarily cause a significant increase in Bf (Figure 1A) or reduction in F (Figure 1B). Interaction plots for Bf (Figure 1C) and F (Figure 1D) further supported the suggestion that the effects of S on these two physiological responses depended on P. The interaction between P and S in impacting Bf or F, documented here (also see below) and elsewhere [44], supported a need for a systems approach, as described in the current study.
To evaluate how the three variables (S, P, and D) interact in driving Bf and F as an integrated response toward an optimal outcome, we performed an integration of the multiple responses, as in Equation (6),
R = i n d i y i n
where yi denotes each response and di is the corresponding desirability function that transforms yi to a scaled value between 0 and 1. Here, di(yi) = 1 always represents the most desirable, but the exact function for each given response is also specific to a given desire. For two responses, Bf and F, there are four possible scenarios, each with a distinct desired outcome: I (BfhighFlow), II (BflowFhigh), III (BfhighFhigh), and IV (BflowFlow) (see Materials and Methods for their desirability functions). Among the four possible scenarios, Scenario I had two of the features in our desired Ob-T2D-OD model (see below for T2D verification).
Given the two responses that we determined as functions of S, P, and D (Equations (5) and (6)), a response surface methodology was used to visualize and identify optimized values of S, P, and D under different scenarios (when the respective R approaches or equals 1). Figure 1E,F display R on the S-P and S-D planes, respectively. The S-P plot (Figure 1E) shows that P = 3 approaches an optimized condition for obtaining a desired effect of high S toward simultaneously achieving Bfhigh and Flow. The S-D plot (Figure 1F) shows that, at P = 3, the higher S and longer D, the higher the desirability value R. Importantly, our results showed that R no longer responded significantly to S when S > 35. Together, these results led to the selection of the treatment condition S35P3D6 (denoting S = 35, P = 3 and D = 6) to represent our Ob-T2D-OD model, and the experimental validations were performed for individual aspects of the pathophysiology, as described further below.
The other three scenarios provided additional opportunities for us to evaluate the complex interaction between S and P in their physiological impact (Figure 2). In both Scenarios II and III, a high P (P = 3.5) was necessary for their respective desirable outcomes (Figure 2A,C). In Scenario II, R was higher at low S (S = 1) and did not respond significantly to D (Figure 2B). However, in Scenario III, R approached its maximal level at approximately S = 30 with a small D (D = 1) (Figure 2D). In this case, an increase in D led to a reduction in R. To achieve a high value of R in Scenario IV (Figure 2E,F), a low P (P = 1), a high S (S = 60), and a long D (D = 6) were needed. These results showed that, within our measurement ranges, S, P, and D were interdependent parameters when driving toward specific outcomes, such as integrated physiological responses. They provided a system view on diet manipulation, impacting multiple aspects of the induced pathophysiology in a quantifiable manner in Drosophila.

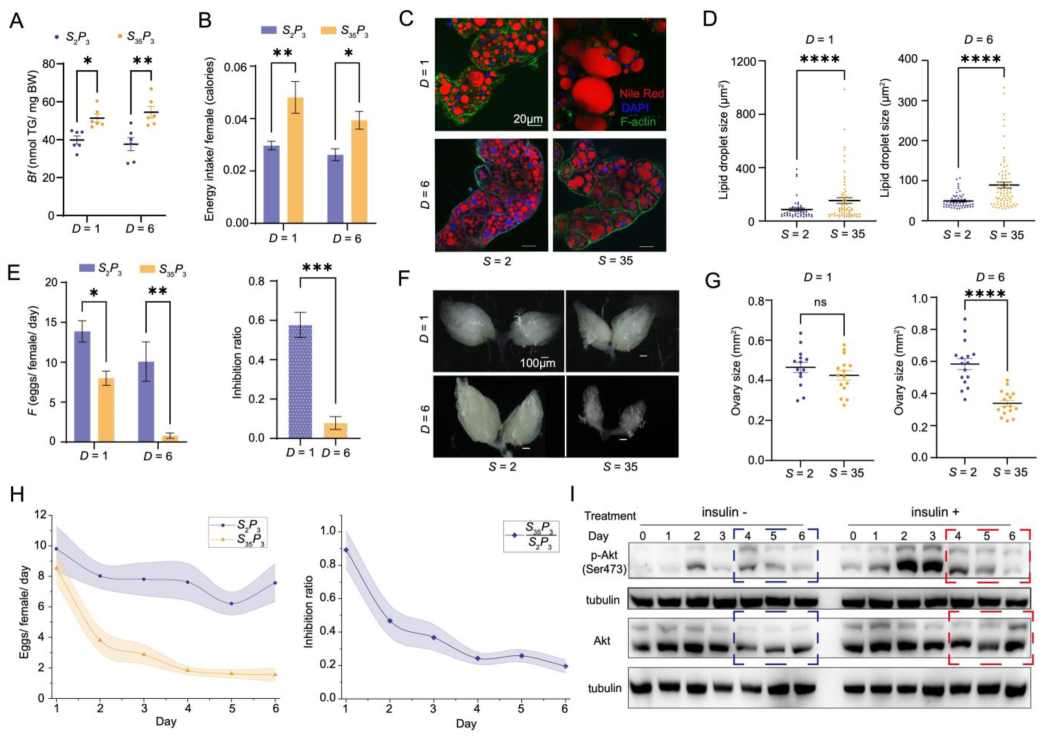
3.3. Experimental Verification of the Ob Aspect of Pathophysiology in the Ob-T2D-OD Model

To evaluate the utility of our quantitative modeling-based approach, we performed experimental verification under our modeling-identified treatment condition S35P3D6, along with its normal-sugar control S2P3D6. We also included their D = 1 counterparts as additional tests to facilitate an evaluation of the dynamic progression of the pathophysiological responses. Under our quantitative modeling framework, S35P3D6 was expected to exhibit both obesity and ovarian dysfunction (see below for T2D). To test this directly, we measured properties indicative of pathophysiological responses under each of the four conditions, S2P3D1, S2P3D6, S35P3D1, and S35P3D6.
Our measurements of whole-body triglyceride (TG) revealed a significant increase under the condition of S35P3D6, relative to S2P3D6 (37.61 ± 3.45 and 54.45 ± 3.04, respectively, adjusted p-value = 0.0017; Figure 3A), confirming our model prediction of the obesity phenotype. Our results also revealed that such an increase became detectable, even at D = 1 (39.80 ± 2.12 and 51.31 ± 2.13, respectively; adjusted p-value = 0.0355; Figure 3A), suggesting an early onset of this phenotype. In Drosophila, TG is synthesized from dietary carbohydrates, fatty acids, and proteins, and is stored as intracellular lipid droplets (LDs) in the fat body [45]. To further evaluate our model prediction, we used Nile Red and phalloidin staining to detect LDs in the fat body (Figure 3C). Our results showed an increase in the overall size of LDs at S35P3, relative to their S2P3 counterparts at both D = 1 and D = 6 (measured LD sizes were 86.53 ± 11.33 μm2 and 153.9 ± 21.72 μm2 for S2P3D1 and S35P3D1, respectively; p-value < 10−4; 49.41 ± 2.446 μm2 and 89.18 ± 7.528 μm2 for S2P3D6 and S35P3D6, respectively; p-value < 10−4; Figure 3D). These results further supported our model prediction of the obesity phenotype and an early onset of this aspect of pathophysiology.
We evaluated the feeding property (see details in Materials and Methods) and found that, while Drosophila had a reduced food intake at S35P3, relative to S2P3 (0.075 ± 0.004 mg and 0.041 ± 0.005 mg per female for S2P3D1 and S35P3D1, respectively; adjusted p-value = 0.0055; 0.066 ± 0.006 mg and 0.034 ± 0.003 mg per female for S2P3D6 and S35P3D6, respectively; adjusted p-value = 0.0302), the total caloric intake per female at S35P3 was significantly higher than at S2P3, irrespective of D (0.030 ± 0.002 Cal and 0.048 ± 0.006 Cal for S2P3D1 and S35P3D1, respectively; adjusted p-value = 5.5 × 10⁻³; 0.026 ± 0.002 Cal and 0.039 ± 0.003 Cal for S2P3D6 and S35P3D6, respectively; adjusted p-value = 0.0302; Figure 3B). The increased caloric intake was in full agreement with the observed diet-induced obesity.

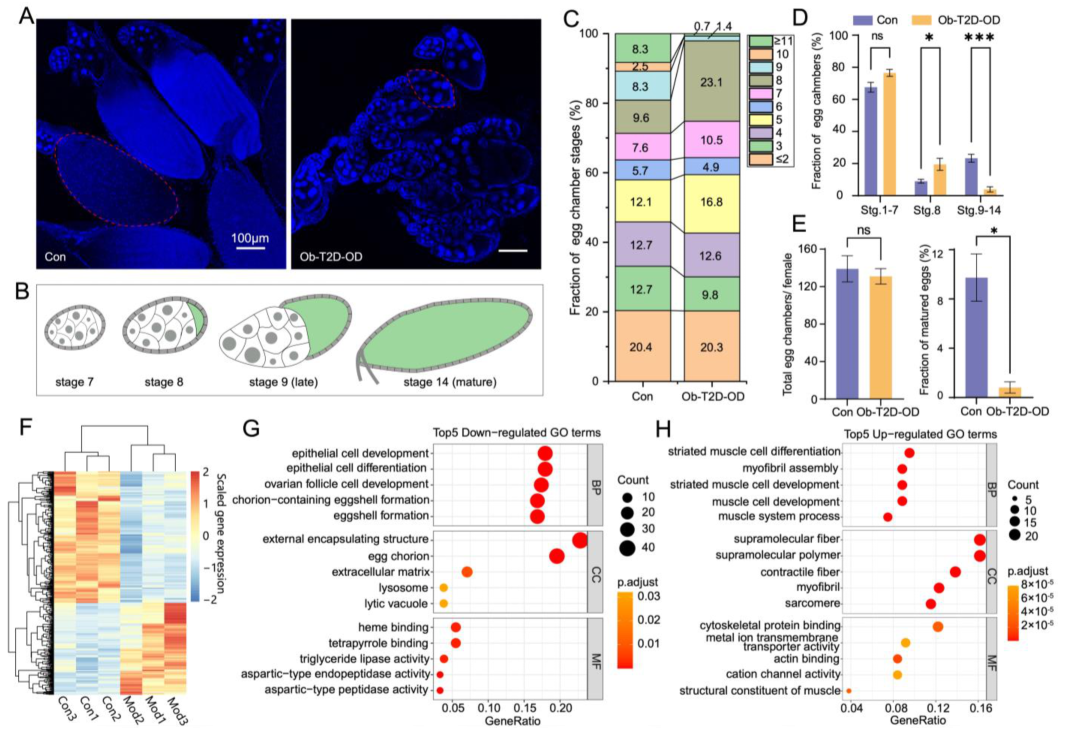
3.4. Evaluation of the OD Aspect of Pathophysiology in the Ob-T2D-OD Model

To evaluate the OD aspect of our model prediction, we measured egg production and ovarian size under the conditions of S2P3D6 and S35P3D6. Again, we included the D = 1 counterparts in our experiments. Despite the obesity phenotype at D = 1, as shown in Figure 3A,C, we observed only a modest reduction in the number of eggs produced by females at D = 1 (F = 13.90 ± 1.39 and 8.09 ± 0.88 for S2P3D1 and S35P3D1, respectively; adjusted p-value = 0.0314; Figure 3E). In addition, the overall ovarian size was not significantly different between S35P3D1 and S2P3D1 (0.425 ± 0.024 mm2 and 0.465 ± 0.025 mm2, respectively; p-value = 0.2644; Figure 3F,G). These results indicated that the onset of obesity was an early event, and at early treatment times, it was not yet sufficient to fully impact female fertility. By comparison, S35P3 led to a dramatic reduction in ovary size at D = 6 (0.584 ± 0.034 mm2 and 0.339 ± 0.019 mm2 for S2P3D6 and S35P3D6, respectively; p-value < 10−4; Figure 3F,G). At D = 6, which corresponded to our modeling-selected condition of S35P3D6, the average number of eggs produced per female per day dropped precipitously to no more than one, representing a nearly complete halt (10.08 ± 2.47 and 0.79 ± 0.33 for S2P3D6 and S35P3D6, respectively; adjusted p-value = 0.0016; Figure 3E). These results directly supported the suitability of our modeling-selected treatment condition in capturing the desired phenotypes; moreover, the severity of the defects in egg production was among the strongest in the available studies [8,13].

3.5. Verification of the T2D Aspect of Pathophysiology in the Ob-T2D-OD Model

To verify that S35P3D6 also captured the T2D aspect of the Ob-T2D-OD triangular relationship, we directly measured insulin sensitivity. We dissected ovaries from females, both prior to feeding on S35P3 (Day 0) and after being placed on this food for 1 through 6 days. These ovaries were then analyzed for their response to exogenously added insulin through Western blotting analysis, which determined the levels of Akt and its active form p-Akt. The changes in the p-Akt/Akt ratio induced by insulin provided a readout of insulin sensitivity (Figure 3I), as previously described [13]. In our experiments, S35P3D6 resulted in an inability of the ovary to respond to insulin or insulin resistance (IR, indicative of T2D), but this effect did not take place until D = 4 (Figure 3I). Importantly, our temporal analysis of insulin sensitivity in the ovary (Figure 3I) suggested that D = 4 represented the onset of the T2D aspect of pathophysiology. We further verified T2D in our Ob-T2D-OD model by documenting an increased hemolymph glucose level (2.65 ± 0.22 μg/mg and 3.51 ± 0.08 μg/mg in control (Con, S2P3D6) and Ob-T2D-OD (S35P3D6) females, respectively; p-value = 0.0021).

3.6. Dynamic Progression of Diet-Induced Pathophysiology in Ob-T2D-OD Model

To obtain a better understanding of the triangular relationship, with respect to the dynamic progression of diet-induced pathophysiology, we measured egg production under S2P3 and S35P3 conditions in a continuous manner (Table S4 and see Materials and Methods for details). In this analysis, females were kept on the specified food for egg laying without the step of switching to normal food, as performed in the CCD analysis. Our results showed that egg production became significantly affected at D = 2 with its maximal effect at D = 6, as judged by the inhibition ratio in egg production (S35P3/S2P3) (Figure 3H). These findings, together with those shown in Figure 3D,I, suggested a temporal order for the onset of the three aspects of pathophysiology in our Drosophila disease model, as follows: Ob, initial OD, T2D (IR), and severe OD. Such a temporal order further suggested that IR of the ovary was unlikely the primary or sole cause for ovarian dysfunction in our system, but it may contribute to its further deterioration. Instead, Ob had the earliest onset, which accompanied or slightly preceded a significant reduction in the ovary size and number of eggs produced by the female.

3.7. Oogenesis Defect in Ob-T2D-OD Model Resembles That of the Human Condition PCOS

The Drosophila ovary consists of ~16 ovarioles, each containing a string of developing egg chambers at distinct stages with morphologically recognizable features [34,46] (see Materials and Methods for details). Drosophila oogenesis can be divided into 14 stages (Figure 4B), and these developing egg chambers resemble the growth of human follicles [47]. To gain insights into the defect in egg production under the treatment of S35P3D6 from a developmental perspective, we quantified the distribution of oogenesis stages in the dissected ovaries (Figure 4A). We measured individual egg chamber’s overall size and characterized their nuclear morphology for stage identification, as before [34]. Figure 4C shows the stage distributions of egg chambers from Con and Ob-T2D-OD females.
Our results revealed a significant increase in the fraction of egg chambers at stage 8, from 9.04 ± 1.15% in the control group to 19.54 ± 3.78% (adjusted p-value = 0.036; Figure 4D). As a consequence, the fraction of egg chambers at stages 9–14 was severely reduced, from 23.36 ± 2.47% to 3.94 ± 1.64% (adjusted p-value = 4 × 10⁻⁴; Figure 4D). Mature oocytes became virtually undetectable in the Ob-T2D-OD group, exhibiting a drop from 9.74 ± 1.92% in the control group to less than 1% (p-value = 0.011; Figure 4E). Despite a reduction in the number of matured egg chambers in the Ob-T2D-OD group, the total number of egg chambers remained unchanged (139 ± 14 and 131 ± 8 for Con and Ob-T2D-OD, respectively; p-value = 0.649; Figure 4E). These results documented a special phenotype of the Ob-T2D-OD females, as characterized by both a stalled oogenesis at stage 8 and an accumulation of immature oocytes at this stage (Figure 4C,D).
Stage 8 of oogenesis marks the onset of significant oocyte growth in its overall size (Figure 4B) [48]. It has been reported that stage 8/9 acts as a nutrient checkpoint, at which an egg chamber can proceed further development or undergo apoptosis upon starvation [49]. While both starvation and our Ob-T2D-OD disease model involve stage 8 in leading to a defect in mature egg production [50], our observations pointed to important differences. In our disease model, there was a significant accumulation of egg chambers at stage 8, with a minimal effect on egg chambers at stages 1–7 (Figure 4D). By contrast, it is well-documented that, under starvation conditions, egg chambers at stages 8 and 9 undergo apoptosis, accompanied by a heightened level of autophagy [49,51]. To gain a better understanding of the molecular defects in our disease model, we performed an RNA-seq analysis in the ovaries of control and disease model females. Figure 4F shows a heatmap exhibiting clusters of differentially expressed genes, with the results of the GO enrichment analysis shown in Figure 4G,H (see Table S5 for a complete list of these genes and their GO and KEGG analyses). These results showed a significant transcriptional dysregulation in our Ob-T2D-OD model. Importantly, unlike what would be expected of starvation, genes associated with apoptosis, autophagy, or lysosome were not on the up-regulated list. In fact, autophagy- (e.g., Atg18b) and lysosome-related (e.g., Tsp42Ea) were down-regulated in our data (Table S5). These results further supported the notion that the oogenesis phenotype in our disease model was distinct from that caused by starvation, suggesting that, in molecular terms, the nutrient checkpoint of stage 8 was impacted distinctly by starvation and high-caloric diet, leading to a failure to produce mature eggs.

3.8. Implications of the Ob-T2D-OD Disease Model in Relation to PCOS and Previous Studies

In both humans and Drosophila, somatic cells derived from stem cells proliferate to form an epithelial monolayer that supports oocyte development and maturation [52,53]. During ovulation, the mature oocyte is released from the egg chamber or ovarian follicle, and the remaining cells become corpus luteum. There is a delicate interaction between the developing oocyte and these surrounding somatic cells in responding to nutritional and metabolic inputs [54,55,56]. These somatic cells in Drosophila are called follicle cells, while those in humans include granulosa and theca cells [57,58]. The oogenesis phenotype in our Ob-T2D-OD model included both an accumulation of immature oocytes and a lack of mature oocytes. These two aspects bear resemblance to the human condition PCOS, particularly with regard to the clinical criteria of oligo-anovulatory infertility and polycystic ovarian morphology [59]. Unlike human PCOS, where the overall ovary size is enlarged, resulting from the accumulated, immature oocytes, the Drosophila ovaries are actually smaller in our case. This difference is purely reflective of a nearly complete lack of mature (or late stage) oocytes that, under normal conditions, would take up the bulk of the volume of the ovary in Drosophila [60,61,62]. In this context, we suggest that a mere failure in mature egg production under starvation conditions [50] is related to anovulation more than to PCOS.
The triangular relationship captured in our Ob-T2D-OD model is of relevance to human PCOS. It is estimated that over 50% of women with PCOS are overweight or obese, and approximately 75% have impaired insulin sensitivity [24,25]. PCOS is a complex disorder involving both genetic factors and lifestyle factors, such as a high-caloric diet. Nutritional and metabolic state has a strong impact on reproduction and, in women with anovulatory PCOS, the defects in oocyte maturation and ovulation are significantly associated with T2D and IR. Our established Ob-T2D-OD model captures the pathophysiological responses to high caloric diet, thus resembling the metabolic subtype of PCOS. Metformin is regarded as a positive control of drug treatment in PCOS animal models [63,64], and it can partially rescue the egg-laying defect in our Ob-T2D-OD model (our unpublished results). This further supports a conservation between the mechanisms leading to the pathophysiology in our model and those in other animal models or humans.
Our Ob-T2D-OD model has enabled us to observe the temporal order of the three aspects of pathophysiology in a well-defined, quantitative manner. Our results suggest an early onset of Ob and that, while T2D may not be the primary cause for an oogenesis defect, it may promote its progression and further deterioration. These results point toward a complex nature of the interactions within the diet-induced triangular relationship. They further support the possibility of using a disease model in a genetically defined model organism to complement and guide human studies, particularly with respect to the heterogeneous nature of PCOS. For patients with the metabolic subtype of PCOS, lifestyle changes are considered the first-line therapy, including a reduction in calorie intake and exercise to reduce body fat [65]. It remains to be determined whether our Ob-T2D-OD model may also be of use in evaluating the “recovery” dynamics. In addition, genetic manipulations in Drosophila may be combined with the use or high-throughput screening [66] of chemicals toward disentangling the complex gene-environment interactions relevant to PCOS.
Recent studies support the utility of Drosophila models in investigating diet-induced pathophysiology ([8,15,43,44,67]; see also [68,69]). While previous studies have largely focused on the individual aspects of diet-induced pathophysiology, and our work takes a quantitative systems approach, focusing on all three aspects that constitute a clinically relevant triangular relationship, aiming specifically at OD and PCOS. Importantly, we have evaluated these aspects as integrated responses, as in the four distinct scenarios in our CCD modeling, and have systematically analyzed the onset timing of individual aspects in relation to each other. These led us to document not only the complex interactions between the two macronutrients—as well as the treatment duration—on impacting pathophysiology (see also [15,44]), but also a temporal order of the onset timing suggestive of an intercalating relationship in pathophysiological progression of OD. Our study, thus, further documents the power of quantitative systems approaches toward uncovering important new insights in biology.

4. Conclusions

The design of our current study has three underpinning features: (1) a quantitative modeling approach, which led to the identification of a diet treatment condition suitable for a specifically targeted disease model; (2) a sharp focus on a triangular relationship in Drosophila, which was aimed at understanding the biology of oogenesis in a well-controlled genetic system of relevance to human conditions, such as PCOS; and (3) a dynamic framework, which guided our investigation of the onset timing of three distinct—but interrelated—aspects of diet-induced pathophysiology. These features represent the core of a platform—into which other features, such as well-established genetic approaches in Drosophila may be incorporated—for mechanistic investigations in a model organism of clinical or pharmaceutical relevance.

Supplementary Materials

The following supporting information can be downloaded at: https://www.mdpi.com/article/10.3390/nu14245365/s1. Figure S1: Statistical parameters for evaluating Bf and F; Table S1: Factors and levels of central composite design; Table S2: Central composite design with experimental values; Table S3. Analysis of variance in the model for Bf and F; Table S4: Continuous measurement of the average egg production; Table S5: Complete information of DEG, GO, and KEGG analyses.

Author Contributions

H.L., F.H., and J.M. conceived the study and designed the experiments; H.L., J.L., and X.C. performed experiments and generated data; H.L. and X.C. analyzed the data and generated all figures; F.H. and J.M. acquired funding; H.L., F.H. and J.M. wrote the paper. All authors have read and agreed to the published version of the manuscript.

Funding

This study was supported in part by the National Key R&D Program of China (2021YFC2700403 to J.M. and to F.H.; 2018YFC1003203 to J.M.; 2018YFA0800102 to F.H.) and the National Natural Science Foundation of China (31871452 to J.M.; 31871249 to F.H.).

Institutional Review Board Statement

Not applicable.

Informed Consent Statement

Not applicable.

Data Availability Statement

RNA sequencing data were deposited at SRA, under PRJNA866605.

Acknowledgments

We thank Dan Zhang and Mixue Tu of the Zhejiang University School of Medicine, affiliated with Women’s Hospital, for their advice and suggestions on issues related to the clinical aspects of PCOS. We thank Wei Yin at the Core Facilities of Zhejiang University School of Medicine for the technical support. We acknowledge the support of Zhejiang University and Zhejiang University School of Medicine, affiliated Women’s Hospital.

Conflicts of Interest

The authors declare no competing interests.

References

  1. Ma, J.; He, F.; Xie, G.; Deng, W. Maternal AP determinants in the Drosophila oocyte and embryo. Wiley Interdiscip. Rev. Dev. Biol. 2016, 5, 562–581. [Google Scholar] [CrossRef] [PubMed]
  2. Sieber, M.H.; Spradling, A.C. The role of metabolic states in development and disease. Curr. Opin. Genet. Dev. 2017, 45, 58–68. [Google Scholar] [CrossRef] [PubMed]
  3. Arhin, S.K.; Lu, J.; Xi, H.; Jin, X. Energy requirements in mammalian oogenesis. Cell. Mol. Biol. 2018, 64, 12–19. [Google Scholar] [CrossRef] [PubMed]
  4. Celik, E.; Olson, E.; Titi, E.S. Spectral Filtering of Interpolant Observables for a Discrete-in-Time Downscaling Data Assimilation Algorithm. SIAM J. Appl. Dyn. Syst. 2019, 18, 1118–1142. [Google Scholar] [CrossRef] [Green Version]
  5. Roth, S. Drosophila oogenesis: Coordinating germ line and soma. Curr. Biol. 2001, 11, R779–R781. [Google Scholar] [CrossRef] [Green Version]
  6. Klusza, S.; Deng, W.-M. At the crossroads of differentiation and proliferation: Precise control of cell-cycle changes by multiple signaling pathways in Drosophila follicle cells. BioEssays 2010, 33, 124–134. [Google Scholar] [CrossRef] [Green Version]
  7. Mirth, C.K.; Alves, A.N.; Piper, M.D.W. Turning food into eggs: Insights from nutritional biology and developmental physiology of Drosophila. Curr. Opin. Insect Sci. 2019, 31, 49–57. [Google Scholar] [CrossRef]
  8. van Dam, E.; van Leeuwen, L.A.G.; dos Santos, E.; James, J.; Best, L.; Lennicke, C.; Vincent, A.J.; Marinos, G.; Foley, A.; Buricova, M.; et al. Sugar-Induced Obesity and Insulin Resistance Are Uncoupled from Shortened Survival in Drosophila. Cell Metab. 2020, 31, 710–725.e7. [Google Scholar] [CrossRef]
  9. Machtinger, R.; Combelles, C.M.H.; Missmer, S.A.; Correia, K.; Fox, J.H.; Racowsky, C. The association between severe obesity and characteristics of failed fertilized oocytes. Hum. Reprod. 2012, 27, 3198–3207. [Google Scholar] [CrossRef]
  10. Stener-Victorin, E.; Padmanabhan, V.; Walters, K.A.; Campbell, R.E.; Benrick, A.; Giacobini, P.; Dumesic, D.A.; Abbott, D.H. Animal Models to Understand the Etiology and Pathophysiology of Polycystic Ovary Syndrome. Endocr. Rev. 2020, 41, bnaa010. [Google Scholar] [CrossRef]
  11. Musselman, L.P.; Kühnlein, R.P. Drosophilaas a model to study obesity and metabolic disease. J. Exp. Biol. 2018, 221, jeb163881. [Google Scholar] [CrossRef] [Green Version]
  12. Bestetti, I.; Barbieri, C.; Sironi, A.; Specchia, V.; Yatsenko, S.A.; De Donno, M.D.; Caslini, C.; Gentilini, D.; Crippa, M.; Larizza, L.; et al. Targeted whole exome sequencing and Drosophila modelling to unveil the molecular basis of primary ovarian insufficiency. Hum. Reprod. 2021, 36, 2975–2991. [Google Scholar] [CrossRef]
  13. Brookheart, R.T.; Swearingen, A.R.; Collins, C.A.; Cline, L.M.; Duncan, J.G. High-sucrose-induced maternal obesity disrupts ovarian function and decreases fertility in Drosophila melanogaster. Biochim. Biophys. Acta (BBA)-Mol. Basis Dis. 2017, 1863, 1255–1263. [Google Scholar] [CrossRef]
  14. Baker, K.D.; Thummel, C.S. Diabetic Larvae and Obese Flies—Emerging Studies of Metabolism in Drosophila. Cell Metab. 2007, 6, 257–266. [Google Scholar] [CrossRef] [Green Version]
  15. Morris, S.N.; Coogan, C.; Chamseddin, K.; Fernandez-Kim, S.O.; Kolli, S.; Keller, J.N.; Bauer, J.H. Development of diet-induced insulin resistance in adult Drosophila melanogaster. Biochim. Biophys. Act. 2012, 1822, 1230–1237. [Google Scholar] [CrossRef] [Green Version]
  16. Lenaerts, C.; Monjon, E.; Van Lommel, J.; Verbakel, L.; Broeck, J.V. Peptides in insect oogenesis. Curr. Opin. Insect Sci. 2018, 31, 58–64. [Google Scholar] [CrossRef]
  17. Lin, K.-Y.; Hsu, H.-J. Regulation of adult female germline stem cells by nutrient-responsive signaling. Curr. Opin. Insect Sci. 2020, 37, 16–22. [Google Scholar] [CrossRef]
  18. Grönke, S.; Clarke, D.-F.; Broughton, S.; Andrews, T.D.; Partridge, L. Molecular Evolution and Functional Characterization of Drosophila Insulin-Like Peptides. PLoS Genet. 2010, 6, e1000857. [Google Scholar] [CrossRef] [Green Version]
  19. Dong, Y.; Chen, W.; Kang, K.; Pang, R.; Dong, Y.; Liu, K.; Zhang, W. FoxO directly regulates the expression of TOR/S6K and vitellogenin to modulate the fecundity of the brown planthopper. Sci. China Life Sci. 2020, 64, 133–143. [Google Scholar] [CrossRef]
  20. Silvestris, E.; De Pergola, G.; Rosania, R.; Loverro, G. Obesity as disruptor of the female fertility. Reprod. Biol. Endocrinol. 2018, 16, 1–13. [Google Scholar] [CrossRef]
  21. Joham, A.E.; Norman, R.J.; Stener-Victorin, E.; Legro, R.S.; Franks, S.; Moran, L.J.; Boyle, J.; Teede, H.J. Polycystic ovary syndrome. Lancet Diabetes Endocrinol. 2022, 10, 668–680. [Google Scholar] [CrossRef] [PubMed]
  22. Li, M.; Chi, X.; Wang, Y.; Setrerrahmane, S.; Xie, W.; Xu, H. Trends in insulin resistance: Insights into mechanisms and therapeutic strategy. Signal Transduct. Target. Ther. 2022, 7, 1–25. [Google Scholar] [CrossRef] [PubMed]
  23. The Rotterdam ESHRE/ASRM-Sponsored PCOS Consensus Workshop Group. Revised 2003 consensus on diagnostic criteria and long-term health risks related to polycystic ovary syndrome. Fertil. Steril. 2004, 81, 19–25. [Google Scholar] [CrossRef] [PubMed]
  24. Hoeger, K.M. Obesity and Lifestyle Management in Polycystic Ovary Syndrome. Clin. Obstet. Gynecol. 2007, 50, 277–294. [Google Scholar] [CrossRef] [PubMed]
  25. Tosi, F.; Bonora, E.; Moghetti, P. Insulin resistance in a large cohort of women with polycystic ovary syndrome: A comparison between euglycaemic-hyperinsulinaemic clamp and surrogate indexes. Hum. Reprod. 2017, 32, 2515–2521. [Google Scholar] [CrossRef] [Green Version]
  26. Dag, Z.O.; Dilbaz, B. Impact of obesity on infertility in women. J. Turk. Gynecol. Assoc. 2015, 16, 111–117. [Google Scholar] [CrossRef]
  27. Leitner, D.R.; Frühbeck, G.; Yumuk, V.; Schindler, K.; Micic, D.; Woodward, E.; Toplak, H. Obesity and Type 2 Diabetes: Two Diseases with a Need for Combined Treatment Strategies—EASO Can Lead the Way. Obes. Facts 2017, 10, 483–492. [Google Scholar] [CrossRef]
  28. Wellons, M.F.; Matthews, J.J.; Kim, C. Ovarian aging in women with diabetes: An overview. Maturitas 2016, 96, 109–113. [Google Scholar] [CrossRef] [Green Version]
  29. Gambineri, A.; Patton, L.; Altieri, P.; Pagotto, U.; Pizzi, C.; Manzoli, L.; Pasquali, R. Polycystic Ovary Syndrome Is a Risk Factor for Type 2 Diabetes. Diabetes 2012, 61, 2369–2374. [Google Scholar] [CrossRef] [Green Version]
  30. Chen, D.; Yang, J.; Xiao, Z.; Zhou, S.; Wang, L. A diet-induced type 2 diabetes model in Drosophila. Sci. China Life Sci. 2020, 64, 326–329. [Google Scholar] [CrossRef]
  31. Alfa, R.W.; Kim, S.K. Using Drosophila to discover mechanisms underlying type 2 diabetes. Dis. Model. Mech. 2016, 9, 365–376. [Google Scholar] [CrossRef] [Green Version]
  32. Ait-Amir, B.; Pougnet, P.; El Hami, A. Meta-Model Development. In Embedded Mechatronic Systems 2; El Hami, A., Pougnet, P., Eds.; Elsevier: Amsterdam, The Netherlands, 2015; pp. 151–179. [Google Scholar] [CrossRef]
  33. Lesperance, D.N.A.; Broderick, N.A. Meta-analysis of Diets Used in Drosophila Microbiome Research and Introduction of theDrosophila Dietary Composition Calculator (DDCC). G3 Genes Genomes Genetics 2020, 10, 2207–2211. [Google Scholar] [CrossRef]
  34. Jia, D.; Xu, Q.; Xie, Q.; Mio, W.; Deng, W.-M. Automatic stage identification of Drosophila egg chamber based on DAPI images. Sci. Rep. 2016, 6, srep18850. [Google Scholar] [CrossRef] [Green Version]
  35. Chen, S.; Zhou, Y.; Chen, Y.; Gu, J. fastp: An ultra-fast all-in-one FASTQ preprocessor. Bioinformatics 2018, 34, i884–i890. [Google Scholar] [CrossRef]
  36. Kim, D.; Paggi, J.M.; Park, C.; Bennett, C.; Salzberg, S.L. Graph-based genome alignment and genotyping with HISAT2 and HISAT-genotype. Nat. Biotechnol. 2019, 37, 907–915. [Google Scholar] [CrossRef]
  37. Liao, Y.; Smyth, G.K.; Shi, W. feature Counts: An efficient general purpose program for assigning sequence reads to genomic features. Bioinformatics 2014, 30, 923–930. [Google Scholar] [CrossRef] [Green Version]
  38. Love, M.I.; Huber, W.; Anders, S. Moderated estimation of fold change and dispersion for RNA-seq data with DESeq2. Genome Biol. 2014, 15, 550. [Google Scholar] [CrossRef] [Green Version]
  39. Yu, G.; Wang, L.-G.; Han, Y.; He, Q.-Y. clusterProfiler: An R Package for Comparing Biological Themes Among Gene Clusters. OMICS J. Integr. Biol. 2012, 16, 284–287. [Google Scholar] [CrossRef]
  40. Luiz, M.T.; Viegas, J.S.R.; Abriata, J.P.; Viegas, F.; Vicentini, F.T.M.D.C.; Bentley, M.V.L.B.; Chorilli, M.; Marchetti, J.M.; Tapia-Blácido, D.R. Design of experiments (DoE) to develop and to optimize nanoparticles as drug delivery systems. Eur. J. Pharm. Biopharm. 2021, 165, 127–148. [Google Scholar] [CrossRef]
  41. Rani, L.; Saini, S.; Shukla, N.; Chowdhuri, D.K.; Gautam, N.K. High sucrose diet induces morphological, structural and functional impairments in the renal tubules of Drosophila melanogaster: A model for studying type-2 diabetes mediated renal tubular dysfunction. Insect Biochem. Mol. Biol. 2020, 125, 103441. [Google Scholar] [CrossRef]
  42. Colinet, H.; Larvor, V.; Bical, R.; Renault, D. Dietary sugars affect cold tolerance of Drosophila melanogaster. Metabolomics 2012, 9, 608–622. [Google Scholar] [CrossRef]
  43. Villanueva, J.E.; Livelo, C.; Trujillo, A.S.; Chandran, S.; Woodworth, B.; Andrade, L.; Le, H.D.; Manor, U.; Panda, S.; Melkani, G.C. Time-restricted feeding restores muscle function in Drosophila models of obesity and circadian-rhythm disruption. Nat. Commun. 2019, 10, 2700. [Google Scholar] [CrossRef] [PubMed] [Green Version]
  44. Skorupa, D.A.; Dervisefendic, A.; Zwiener, J.; Pletcher, S.D. Dietary composition specifies consumption, obesity, and lifespan in Drosophila melanogaster. Aging Cell 2008, 7, 478–490. [Google Scholar] [CrossRef] [PubMed] [Green Version]
  45. Parra-Peralbo, E.; Talamillo, A.; Barrio, R. Origin and Development of the Adipose Tissue, a Key Organ in Physiology and Disease. Front. Cell Dev. Biol. 2021, 9, 786129. [Google Scholar] [CrossRef] [PubMed]
  46. McLaughlin, J.M.; Bratu, D.P. Drosophila melanogaster Oogenesis: An Overview. In Drosophila Oogenesis. Methods in Molecular Biology; Bratu, D., McNeil, G., Eds.; Humana Press: New York, NY, USA, 2015; Volume 1328, pp. 1–20. [Google Scholar] [CrossRef]
  47. Baerwald, A.R.; Adams, G.P.; Pierson, R.A. Ovarian antral folliculogenesis during the human menstrual cycle: A review. Hum. Reprod. Updat. 2011, 18, 73–91. [Google Scholar] [CrossRef] [Green Version]
  48. He, F.; Wei, C.; Wu, H.; Cheung, D.; Jiao, R.; Ma, J. Fundamental origins and limits for scaling a maternal morphogen gradient. Nat. Commun. 2015, 6, 6679. [Google Scholar] [CrossRef] [Green Version]
  49. Terashima, J.; Bownes, M. A microarray analysis of genes involved in relating egg production to nutritional intake in Drosophila melanogaster. Cell Death Differ. 2005, 12, 429–440. [Google Scholar] [CrossRef] [Green Version]
  50. Kilpatrick, K.A. Starvation Induces Polycystic Ovarian Syndrome (PCOS) Like Symptoms in Drosophila Melanogaster; Mississippi College: Clinton, MI, USA, 2016. [Google Scholar]
  51. Barth, J.M.I.; Szabad, J.; Hafen, E.; Köhler, K. Autophagy in Drosophila ovaries is induced by starvation and is required for oogenesis. Cell Death Differ. 2010, 18, 915–924. [Google Scholar] [CrossRef]
  52. Jevitt, A.; Chatterjee, D.; Xie, G.; Wang, X.-F.; Otwell, T.; Huang, Y.-C.; Deng, W.-M. A single-cell atlas of adult Drosophila ovary identifies transcriptional programs and somatic cell lineage regulating oogenesis. PLoS Biol. 2020, 18, e3000538. [Google Scholar] [CrossRef]
  53. Dompe, C.; Kulus, M.; Stefańska, K.; Kranc, W.; Chermuła, B.; Bryl, R.; Pieńkowski, W.; Nawrocki, M.; Petitte, J.; Stelmach, B.; et al. Human Granulosa Cells—Stemness Properties, Molecular Cross-Talk and Follicular Angiogenesis. Cells 2021, 10, 1396. [Google Scholar] [CrossRef]
  54. Burks, D.J.; De Mora, J.F.; Schubert, M.; Withers, D.J.; Myers, M.G.; Towery, H.H.; Altamuro, S.L.; Flint, C.L.; White, M.F. IRS-2 pathways integrate female reproduction and energy homeostasis. Nature 2000, 407, 377–382. [Google Scholar] [CrossRef]
  55. Sánchez, F.; Smitz, J. Molecular control of oogenesis. Biochim. Biophys. Acta (BBA)-Mol. Basis Dis. 2012, 1822, 1896–1912. [Google Scholar] [CrossRef] [Green Version]
  56. Gu, L.; Liu, H.; Gu, X.; Boots, C.; Moley, K.H.; Wang, Q. Metabolic control of oocyte development: Linking maternal nutrition and reproductive outcomes. Cell. Mol. Life Sci. 2015, 72, 251–271. [Google Scholar] [CrossRef]
  57. Armstrong, A.R. Drosophila melanogaster as a model for nutrient regulation of ovarian function. Reproduction 2020, 159, R69–R82. [Google Scholar] [CrossRef]
  58. de Medeiros, S.F.; Rodgers, R.J.; Norman, R.J. Adipocyte and steroidogenic cell cross-talk in polycystic ovary syndrome. Hum. Reprod. Updat. 2021, 27, 771–796. [Google Scholar] [CrossRef]
  59. The Rotterdam ESHRE/ASRM-sponsored PCOS consensus workshop group. Revised 2003 consensus on diagnostic criteria and long-term health risks related to polycystic ovary syndrome (PCOS). Hum. Reprod. 2004, 19, 41–47. [Google Scholar] [CrossRef] [Green Version]
  60. Wilson, J.L.; Chen, W.; Dissen, G.A.; Ojeda, S.R.; Cowley, M.; Garcia-Rudaz, C.; Enriori, P.J. Excess of Nerve Growth Factor in the Ovary Causes a Polycystic Ovary-Like Syndrome in Mice, which Closely Resembles Both Reproductive and Metabolic Aspects of the Human Syndrome. Endocrinology 2014, 155, 4494–4506. [Google Scholar] [CrossRef]
  61. Dissen, G.A.; Garcia-Rudaz, C.; Paredes, A.; Mayer, C.; Mayerhofer, A.; Ojeda, S.R. Excessive Ovarian Production of Nerve Growth Factor Facilitates Development of Cystic Ovarian Morphology in Mice and Is a Feature of Polycystic Ovarian Syndrome in Humans. Endocrinology 2009, 150, 2906–2914. [Google Scholar] [CrossRef]
  62. Garcia-Rudaz, C.; Dorfman, M.; Nagalla, S.; Svechnikov, K.; Söder, O.; Ojeda, S.R.; Dissen, G.A. Excessive ovarian production of nerve growth factor elicits granulosa cell apoptosis by setting in motion a tumor necrosis factor α/stathmin-mediated death signaling pathway. Reproduction 2011, 142, 319–331. [Google Scholar] [CrossRef] [Green Version]
  63. Ibrahim, Y.F.; Alorabi, M.; Abdelzaher, W.Y.; Toni, N.D.; Thabet, K.; Hegazy, A.; Bahaa, H.A.; Batiha, G.E.-S.; Welson, N.N.; Morsy, M.A.; et al. Diacerein ameliorates letrozole-induced polycystic ovarian syndrome in rats. Biomed. Pharmacother. 2022, 149, 112870. [Google Scholar] [CrossRef]
  64. Wang, Z.; Nie, K.; Su, H.; Tang, Y.; Wang, H.; Xu, X.; Dong, H. Berberine improves ovulation and endometrial receptivity in polycystic ovary syndrome. Phytomedicine 2021, 91, 153654. [Google Scholar] [CrossRef] [PubMed]
  65. Kim, C.-H.; Lee, S.-H. Effectiveness of Lifestyle Modification in Polycystic Ovary Syndrome Patients with Obesity: A Systematic Review and Meta-Analysis. Life 2022, 12, 308. [Google Scholar] [CrossRef] [PubMed]
  66. Pandey, U.B.; Nichols, C.D. Human Disease Models in Drosophila melanogaster and the Role of the Fly in Therapeutic Drug Discovery. Pharmacol. Rev. 2011, 63, 411–436. [Google Scholar] [CrossRef] [PubMed] [Green Version]
  67. Lee, K.P.; Simpson, S.J.; Clissold, F.J.; Brooks, R.; Ballard, J.W.O.; Taylor, P.W.; Soran, N.; Raubenheimer, D. Lifespan and reproduction in Drosophila: New insights from nutritional geometry. Proc. Natl. Acad. Sci. USA 2008, 105, 2498–2503. [Google Scholar] [CrossRef] [PubMed] [Green Version]
  68. Paris, V.R.; Solon-Biet, S.M.; Senior, A.M.; Edwards, M.C.; Desai, R.; Tedla, N.; Cox, M.J.; Ledger, W.L.; Gilchrist, R.B.; Simpson, S.J.; et al. Defining the impact of dietary macronutrient balance on PCOS traits. Nat. Commun. 2020, 11, 5262. [Google Scholar] [CrossRef]
  69. Roberts, J.S.; Perets, R.A.; Sarfert, K.S.; Bowman, J.J.; Ozark, P.A.; Whitworth, G.B.; Blythe, S.N.; Toporikova, N. High-fat high-sugar diet induces polycystic ovary syndrome in a rodent model. Biol. Reprod. 2017, 96, 551–562. [Google Scholar] [CrossRef]
Figure 1. Characterization of Bf and F under various feeding treatment. (A,B) Contour plots of Bf (A) or F (B) at D = 4. The X-axis represents S, Y-axis represents P, and the color represents levels of Bf (A) or F (B). (C,D) Interaction plots of S and P on Bf (C) or F (D) at D = 4. The X-axis represents S; Y-axis represents Bf (C) or F (D). The two lines show the response of Bf (C) or F (D) to S at different levels of P. Dashed lines represent 95% confidence intervals. (E,F) Integrated 3D surface plots under Scenario I, showing R as a function of S-P (E) or S-D (F), respectively. Here, a high value of R represents a high desirability for achieving BfhighFlow. D = 4 in panel E and P = 3 in panel F.
Nutrients 14 05365 g001
Figure 2. Integration analysis of Bf and F with different phenotype preference. Shown are integrated 3D surface plots showing R as a function of S-P (A,C,E) or S-D (B,D,F) under three different scenarios (AB for Scenario II, CD for Scenario III, and DF for Scenario IV). A high R value indicates a high desirability for the given scenario. For each panel, values for D or P are indicated.
Nutrients 14 05365 g002
Figure 3. Phenotype verification under the selected treatment conditions. (A) Bf measurement under the four indicated conditions (ANOVA), * p < 0.05, ** p < 0.01. (B) Calorie intake calculation from feeding quantification with the dye assay under four indicated conditions (ANOVA), * p < 0.05, ** p < 0.01. (C) Nile red staining of lipid droplets in the fat body under S2P3D1, S35P3D1, S2P3D6, S35P3D6. F-actin stained with phalloidin was in green, nucleus stained with DAPI was in blue. Scale bars: 20 μm. (D) Measurements and statistical analysis of lipid droplet size under the four indicated conditions (t-test), **** p < 10−4. (E) F measurement under four conditions (ANOVA). The inhibition ratio of high sucrose on F was calculated by the number of eggs produced under S35P3 divided by that under S2P3 (t-test), * p < 0.05, ** p < 0.01, *** p < 10−3. (F) Comparison of whole ovarian morphology under four conditions. Scale bars: 100 μm. (G) Measurement and statistical analysis of ovarian size under four conditions (t-test), **** p < 10−4. (H) Continued egg production from day 1 to day 6 on the indicated diet. The inhibition ratio as a function of treatment time under high sucrose diet. See Materials and Methods for further details. (I) Shown are Western blotting results detecting p-Akt, Akt, and tubulin of the ovary (D = 0 to D = 6), with or without the addition of human insulin to the dissected ovaries. Insulin sensitivity was calculated as the ratio of detected protein levels, p-Akt/Akt. Protein levels were normalized to that of tubulin.
Nutrients 14 05365 g003
Figure 4. Halted oogenesis and molecular defects in the Ob-T2D-OD Drosophila model. (A) Confocal microscopy imaging visualizing egg chambers from control (Con) and Ob-T2D-OD females. Imaging under 405 nm and 100× with scale bars: 100 μm. The circled areas provide examples of egg chambers at stage 14 (Con) or stage 8 (Ob-T2D-OD). (B) Schematic illustration of egg chambers at the stages shown. Morphological difference is readily recognizable based on egg chamber size and the presence of follicle cell nuclei surrounding the anterior nurse cells. (C) Percentages of egg chambers at different stages from the ovaries of a representative control or Ob-T2D-OD female with a stacked bar chart. (D) Statistical analysis of stage comparations in the Con and Ob-T2D-OD (ANOVA), * p < 0.05, *** p < 10−3. (E) Statistical analysis of total egg chamber numbers and fractions of stage 14 in the Con and Ob-T2D-OD females (t-test), * p < 0.05. (F) Hierarchical clustering of genes that were significantly differentially expressed (|log2FoldChange| > 0.5 and p-value < 0.05) in ovaries between the control group (S2P3D6) and the Ob-T2D-OD model group (S35P3D6). Each group consists of three independent replicates. (G,H) GO enrichment analysis of genes that were significantly down-regulated (n = 253) and up-regulated (n = 177) under S35P3D6. Shown are the top 5 terms with the smallest Benjamini-Hochberg adjusted p-values under each category of Biological Process (BP), Cellular Component (CC), and Molecular Function (MF).
Nutrients 14 05365 g004
Publisher’s Note: MDPI stays neutral with regard to jurisdictional claims in published maps and institutional affiliations.

