

Effect of Different Nutritional Education Based on Healthy Eating Index for HemoDialysis Patients on Dietary Quality and Muscle Mass


 ,
,  , ,
, ,
Abstract
:
1. Introduction
2. Materials and Methods
2.1. Study Design and Participants
2.2. Nutrition Education Booklet and Education Program
2.3. Data Collection and Measurements
2.3.1. Demographic Data
2.3.2. Anthropometry and Body Composition
2.3.3. Dietary Intake
2.3.4. Dietary Knowledge
2.3.5. Physical Activity
2.4. Statistical Analysis
3. Results
3.1. Characteristics of Participants
3.2. Comparison of Changes in Dietary Knowledge among the Groups
3.3. Comparison of Changes in HEI-HD among the Groups
3.4. Comparison of Changes in Skeletal Muscle Mass among the Groups
4. Discussion
5. Conclusions
Author Contributions
Funding
Institutional Review Board Statement
Informed Consent Statement
Data Availability Statement
Acknowledgments
Conflicts of Interest
References
- Htay, H.; Bello, A.K.; Levin, A.; Lunney, M.; Osman, M.A.; Ye, F.; Ashuntantang, G.E.; Bellorin-Font, E.; Gharbi, M.B.; Davison, S.N.; et al. Hemodialysis Use and Practice Patterns: An International Survey Study. Am. J. Kidney Dis. 2021, 77, 326–335.e321. [Google Scholar] [CrossRef] [PubMed]
- Qureshi, A.R.; Alvestrand, A.; Divino-Filho, J.C.; Gutierrez, A.; Heimbürger, O.; Lindholm, B.; Bergström, J. Inflammation, malnutrition, and cardiac disease as predictors of mortality in hemodialysis patients. J. Am. Soc. Nephrol. 2002, 13 (Suppl. S1), S28–S36. [Google Scholar] [CrossRef] [PubMed]
- Fouque, D.; Kalantar-Zadeh, K.; Kopple, J.; Cano, N.; Chauveau, P.; Cuppari, L.; Franch, H.; Guarnieri, G.; Ikizler, T.A.; Kaysen, G.; et al. A proposed nomenclature and diagnostic criteria for protein-energy wasting in acute and chronic kidney disease. Kidney Int. 2008, 73, 391–398. [Google Scholar] [CrossRef] [PubMed] [Green Version]
- Frontera, W.R.; Ochala, J. Skeletal muscle: A brief review of structure and function. Calcif. Tissue Int. 2015, 96, 183–195. [Google Scholar] [CrossRef] [PubMed]
- Chen, C.T.; Lin, S.H.; Chen, J.S.; Hsu, Y.J. Muscle wasting in hemodialysis patients: New therapeutic strategies for resolving an old problem. Sci. World J. 2013, 2013, 643954. [Google Scholar] [CrossRef] [Green Version]
- Keane, D.; Gardiner, C.; Lindley, E.; Lines, S.; Woodrow, G.; Wright, M. Changes in Body Composition in the Two Years after Initiation of Haemodialysis: A Retrospective Cohort Study. Nutrients 2016, 8, 702. [Google Scholar] [CrossRef] [Green Version]
- Chuang, S.Y.; Chang, H.Y.; Lee, M.S.; Chia-Yu Chen, R.; Pan, W.H. Skeletal muscle mass and risk of death in an elderly population. Nutr. Metab. Cardiovasc. Dis. 2014, 24, 784–791. [Google Scholar] [CrossRef]
- Ohkawa, S.; Odamaki, M.; Ikegaya, N.; Hibi, I.; Miyaji, K.; Kumagai, H. Association of age with muscle mass, fat mass and fat distribution in non-diabetic haemodialysis patients. Nephrol. Dial. Transpl. 2005, 20, 945–951. [Google Scholar] [CrossRef] [Green Version]
- Waijers, P.M.; Feskens, E.J.; Ocké, M.C. A critical review of predefined diet quality scores. Br. J. Nutr. 2007, 97, 219–231. [Google Scholar] [CrossRef] [Green Version]
- Fransen, H.P.; Ocké, M.C. Indices of diet quality. Curr. Opin. Clin. Nutr. Metab. Care 2008, 11, 559–565. [Google Scholar] [CrossRef]
- Chiu, Y.F.; Chen, Y.C.; Wu, P.Y.; Shih, C.K.; Chen, H.H.; Chen, T.H.; Yang, S.H. Association between the Hemodialysis Eating Index and risk factors of cardiovascular disease in hemodialysis patients. J. Renal. Nutr. 2014, 24, 163–171. [Google Scholar] [CrossRef] [PubMed]
- Wong, T.C.; Chen, Y.T.; Wu, P.Y.; Chen, T.W.; Chen, H.H.; Chen, T.H.; Yang, S.H. Ratio of dietary n-6/n-3 polyunsaturated fatty acids independently related to muscle mass decline in hemodialysis patients. PLoS ONE 2015, 10, e0140402. [Google Scholar] [CrossRef] [PubMed]
- Wu, P.Y.; Yang, S.H.; Wong, T.C.; Chen, T.W.; Chen, H.H.; Chen, T.H. Association of processed meat intake with hypertension risk in hemodialysis patients: A cross-sectional study. PLoS ONE. 2015, 10, e0141917. [Google Scholar] [CrossRef] [PubMed] [Green Version]
- Wong, T.C.; Chen, Y.T.; Wu, P.Y.; Chen, T.W.; Chen, H.H.; Chen, T.H.; Hsu, Y.H.; Yang, S.H. Ratio of dietary n-3 and n-6 fatty acids—Independent determinants of muscle mass in hemodialysis patients with diabetes. Nutrition 2016, 32, 989–994. [Google Scholar] [CrossRef] [PubMed]
- Yu-Ju, L.Y.U.; Chen, T.W.; Chen, T.H.; Sz-Hang, Y.S.H.; Lin, W.C.; Wu, P.Y.; Yang, S.H. Simplified adequate energy requirements for patients on maintenance hemodialysis in Taiwan: A cross-Sectional observation study. Austin J. Nutr. Food Sci. 2016, 4, 1074–1082. [Google Scholar]
- Duong, T.V.; Wong, T.C.; Su, C.T.; Chen, H.H.; Chen, T.W.; Chen, T.H.; Hsu, Y.H.; Peng, S.J.; Kuo, K.L.; Liu, H.C.; et al. Associations of dietary macronutrients and micronutrients with the traditional and nontraditional risk factors for cardiovascular disease among hemodialysis patients: A clinical cross-Sectional study. Medicine 2018, 97, e11306. [Google Scholar] [CrossRef]
- Duong, T.V.; Wong, T.C.; Chen, H.H.; Chen, T.W.; Chen, T.H.; Hsu, Y.H.; Peng, S.J.; Kuo, K.L.; Liu, H.C.; Lin, E.T.; et al. Inadequate dietary energy intake associates with higher prevalence of metabolic syndrome in different groups of hemodialysis patients: A clinical observational study in multiple dialysis centers. BMC Nephrol. 2018, 19, 236–249. [Google Scholar] [CrossRef] [Green Version]
- Duong, T.V.; Wong, T.C.; Chen, H.H.; Chen, T.W.; Chen, T.H.; Hsu, Y.H.; Peng, S.J.; Kuo, K.L.; Liu, H.C.; Lin, E.T.; et al. The cut-off values of dietary energy intake for determining metabolic syndrome in hemodialysis patients: A clinical cross-Sectional study. PLoS ONE 2018, 13, e0193742. [Google Scholar] [CrossRef] [Green Version]
- Duong, T.V.; Tseng, I.H.; Wong, T.C.; Chen, H.H.; Chen, T.W.; Chen, T.H.; Hsu, Y.H.; Peng, S.J.; Kuo, K.L.; Liu, H.C.; et al. Adaptation and validation of alternative healthy eating index in hemodialysis patients (AHEI-HD) and its association with all-cause mortality: A multi-Center follow-Up study. Nutrients 2019, 11, 1407. [Google Scholar] [CrossRef] [Green Version]
- Wu, P.Y.; Chen, Y.T.; Wong, T.C.; Chen, H.H.; Chen, T.W.; Chen, T.H.; Hsu, Y.H.; Peng, S.J.; Kuo, K.L.; Hung, S.C.; et al. Energy requirement of patients undergoing hemodialysis: A cross-Sectional study in multiple centers. Biochem. Res. Int. 2020, 2020, 2054265. [Google Scholar] [CrossRef] [Green Version]
- Wang, C.S.; Wong, T.C.; Duong, T.V.; Su, C.T.; Chen, H.H.; Chen, T.H.; Hsu, Y.H.; Peng, S.J.; Kuo, K.L.; Liu, H.C.; et al. Hyperhomocysteinemia associated with low muscle mass, muscle function in elderly hemodialysis patients: An analysis of multiple dialysis centers. BioMed. Res. Int. 2019, 2019, 9276097. [Google Scholar] [CrossRef] [PubMed]
- Anderson, C.A.M.; Nguyen, H.A. Nutrition education in the care of patients with chronic kidney disease and end-stage renal disease. Semin. Dial. 2018, 31, 115–121. [Google Scholar] [CrossRef] [PubMed]
- Parvan, K.; Hasankhani, H.; Seyyedrasooli, A.; Riahi, S.M.; Ghorbani, M. The effect of two educational methods on knowledge and adherence to treatment in hemodialysis patients: Clinical trial. J. Caring Sci. 2015, 4, 83–93. [Google Scholar] [CrossRef] [PubMed]
- Ford, J.C.; Pope, J.F.; Hunt, A.E.; Gerald, B. The effect of diet education on the laboratory values and knowledge of hemodialysis patients with hyperphosphatemia. J. Ren. Nutr. 2004, 14, 36–44. [Google Scholar] [CrossRef]
- Diddana, T.Z.; Kelkay, G.N.; Dola, A.N.; Sadore, A.A. Effect of Nutrition Education Based on Health Belief Model on Nutritional Knowledge and Dietary Practice of Pregnant Women in Dessie Town, Northeast Ethiopia: A Cluster Randomized Control Trial. J. Nutr. Metab. 2018, 2018, 6731815. [Google Scholar] [CrossRef] [Green Version]
- Shariatjafari, S.; Omidvar, N.; Shakibazadeh, E.; Majdzadeh, R.; Minaei, M.; Gholamzade, M. Effectiveness of Community-based Intervention to Promote Iran’s Food-based Dietary Guidelines. Int. J. Prev. Med. 2012, 3, 249–261. [Google Scholar]
- Shahdadi, H.; Rahnama, M. Experience of Nurses in Hemodialysis Care: A Phenomenological Study. J. Clin. Med. 2018, 7, 30. [Google Scholar] [CrossRef] [Green Version]
- Tsai, W.C.; Yang, J.Y.; Luan, C.C.; Wang, Y.J.; Lai, Y.C.; Liu, L.C.; Peng, Y.S. Additional benefit of dietitian involvement in dialysis staffs-led diet education on uncontrolled hyperphosphatemia in hemodialysis patients. Clin. Exp. Nephrol. 2016, 20, 815–821. [Google Scholar] [CrossRef]
- Ryu, H.J.; Jeon, H.J.; Sun, H.-K.; Han, K.H.; Whang, C.G.; Han, S.Y. Repeated education improves diet compliance in maintenance Hemodialysis Patients. Int. J. Urol. Nephrol. 2014, 2, 63–68. [Google Scholar]
- Liou, Y.M.; Jwo, C.J.; Yao, K.G.; Chiang, L.C.; Huang, L.H. Selection of appropriate Chinese terms to represent intensity and types of physical activity terms for use in the Taiwan version of IPAQ. J. Nurs. Res. 2008, 16, 252–263. [Google Scholar] [CrossRef] [Green Version]
- Abd Allah, E.S.; Oraby, E.E.E.; Ibrahim, R.G.; Tork, H.M.M.; Moustafa, D.G.; Abd-Allah, E.S.; Taha, N.M. Effect of Diet Therapy Program on Dietary Knowledge and Practice of Elderly Patients on Regular Hemodialysis. Am. J. Nurs. Sci. 2015, 4, 131–137. [Google Scholar] [CrossRef] [Green Version]
- Wu, F.; Wills, K.; Laslett, L.L.; Oldenburg, B.; Jones, G.; Winzenberg, T. Associations of dietary patterns with bone mass, muscle strength and balance in a cohort of Australian Middle-Aged women. Br. J. Nutr. 2017, 118, 598–606. [Google Scholar] [CrossRef] [PubMed] [Green Version]
- Saglimbene, V.M.; Wong, G.; Ruospo, M.; Palmer, S.C.; Garcia-Larsen, V.; Natale, P.; Teixeira-Pinto, A.; Campbell, K.L.; Carrero, J.J.; Stenvinkel, P.; et al. Fruit and Vegetable Intake and Mortality in Adults undergoing Maintenance Hemodialysis. Clin. J. Am. Soc. Nephrol. 2019, 14, 250–260. [Google Scholar] [CrossRef]
- Wagner, M.G.; Rhee, Y.; Honrath, K.; Blodgett Salafia, E.H.; Terbizan, D. Nutrition education effective in increasing fruit and vegetable consumption among overweight and obese adults. Appetite 2016, 100, 94–101. [Google Scholar] [CrossRef]
- Lou, L.M.; Campos, B.; Gimeno, J.A.; Caverní, A.; Boned, B. Nutrient intake and eating habits in hemodialysis patients: Comparison with a model based on mediterranean diet. Nefrologia 2007, 27, 38–45. [Google Scholar] [PubMed]
- McCullough, M.L.; Feskanich, D.; Stampfer, M.J.; Giovannucci, E.L.; Rimm, E.B.; Hu, F.B.; Spiegelman, D.; Hunter, D.J.; Colditz, G.A.; Willett, W.C. Diet quality and major chronic disease risk in men and women: Moving toward improved dietary guidance. Am. J. Clin. Nutr. 2002, 76, 1261–1271. [Google Scholar] [CrossRef] [PubMed] [Green Version]
- Maindal, H.T.; Toft, U.; Lauritzen, T.; Sandbæk, A. Three-year effects on dietary quality of health education: A randomized controlled trial of people with screen-detected dysglycaemia (The ADDITION study, Denmark). Eur. J. Public Health 2012, 23, 393–398. [Google Scholar] [CrossRef] [Green Version]
- Yolcuoğlu, İ.Z.; Kızıltan, G. Effect of Nutrition Education on Diet Quality, Sustainable Nutrition and Eating Behaviors among University Students. J. Am. Coll. Nutr. 2021, 41, 713–719. [Google Scholar] [CrossRef]
- Bloom, I.; Shand, C.; Cooper, C.; Robinson, S.; Baird, J. Diet Quality and Sarcopenia in Older Adults: A Systematic Review. Nutrients 2018, 10, 308. [Google Scholar] [CrossRef] [Green Version]
- Granic, A.; Sayer, A.A.; Robinson, S.M. Dietary Patterns, Skeletal Muscle Health, and Sarcopenia in Older Adults. Nutrients 2019, 11, 745. [Google Scholar] [CrossRef] [Green Version]
- Rondanelli, M.; Perna, S.; Faliva, M.A.; Peroni, G.; Infantino, V.; Pozzi, R. Novel insights on intake of meat and prevention of sarcopenia: All reasons for an adequate consumptio. Nutr. Hosp. 2015, 32, 2136–2143. [Google Scholar] [CrossRef] [PubMed]
- Shaw, B.A.; Spokane, L.S. Examining the association between education level and physical activity changes during early old age. J. Aging Health 2008, 20, 767–787. [Google Scholar] [CrossRef] [PubMed] [Green Version]
- Puciato, D.; Rozpara, M. Physical activity and socio-economic status of single and married urban adults: A cross-Sectional study. PeerJ 2021, 9, e12466. [Google Scholar] [CrossRef] [PubMed]
- Liu, W.L.; Chen, Y.H.; Duong, T.V.; Wong, T.C.; Chen, H.H.; Chen, T.H.; Hsu, Y.H.; Peng, S.J.; Yang, S.H. The Effect of different nutritional education models on reducing cardiovascular disease risk factors by improving dietary fat quality in hemodialysis patients. Nutrients 2022, 14, 3840. [Google Scholar] [CrossRef] [PubMed]


| Chapter | Content |
|---|---|
| Chapter 1 | Recommendations for Dietary Requirements |
| Chapter 2 | Definition of serving |
| Chapter 3 | Healthy diet for dialysis patients
|
| Chapter 4 | Tips for food intake |
| Chapter 5 | Food label information |
| Chapter 6 | Instructions for phosphorus-binding drugs |
| Chapter 7 | Exercise rules |
| Chapter 8 | Body weight record form |
| Chapter 9 | Diet record sheet and HEI-HD calculated table |
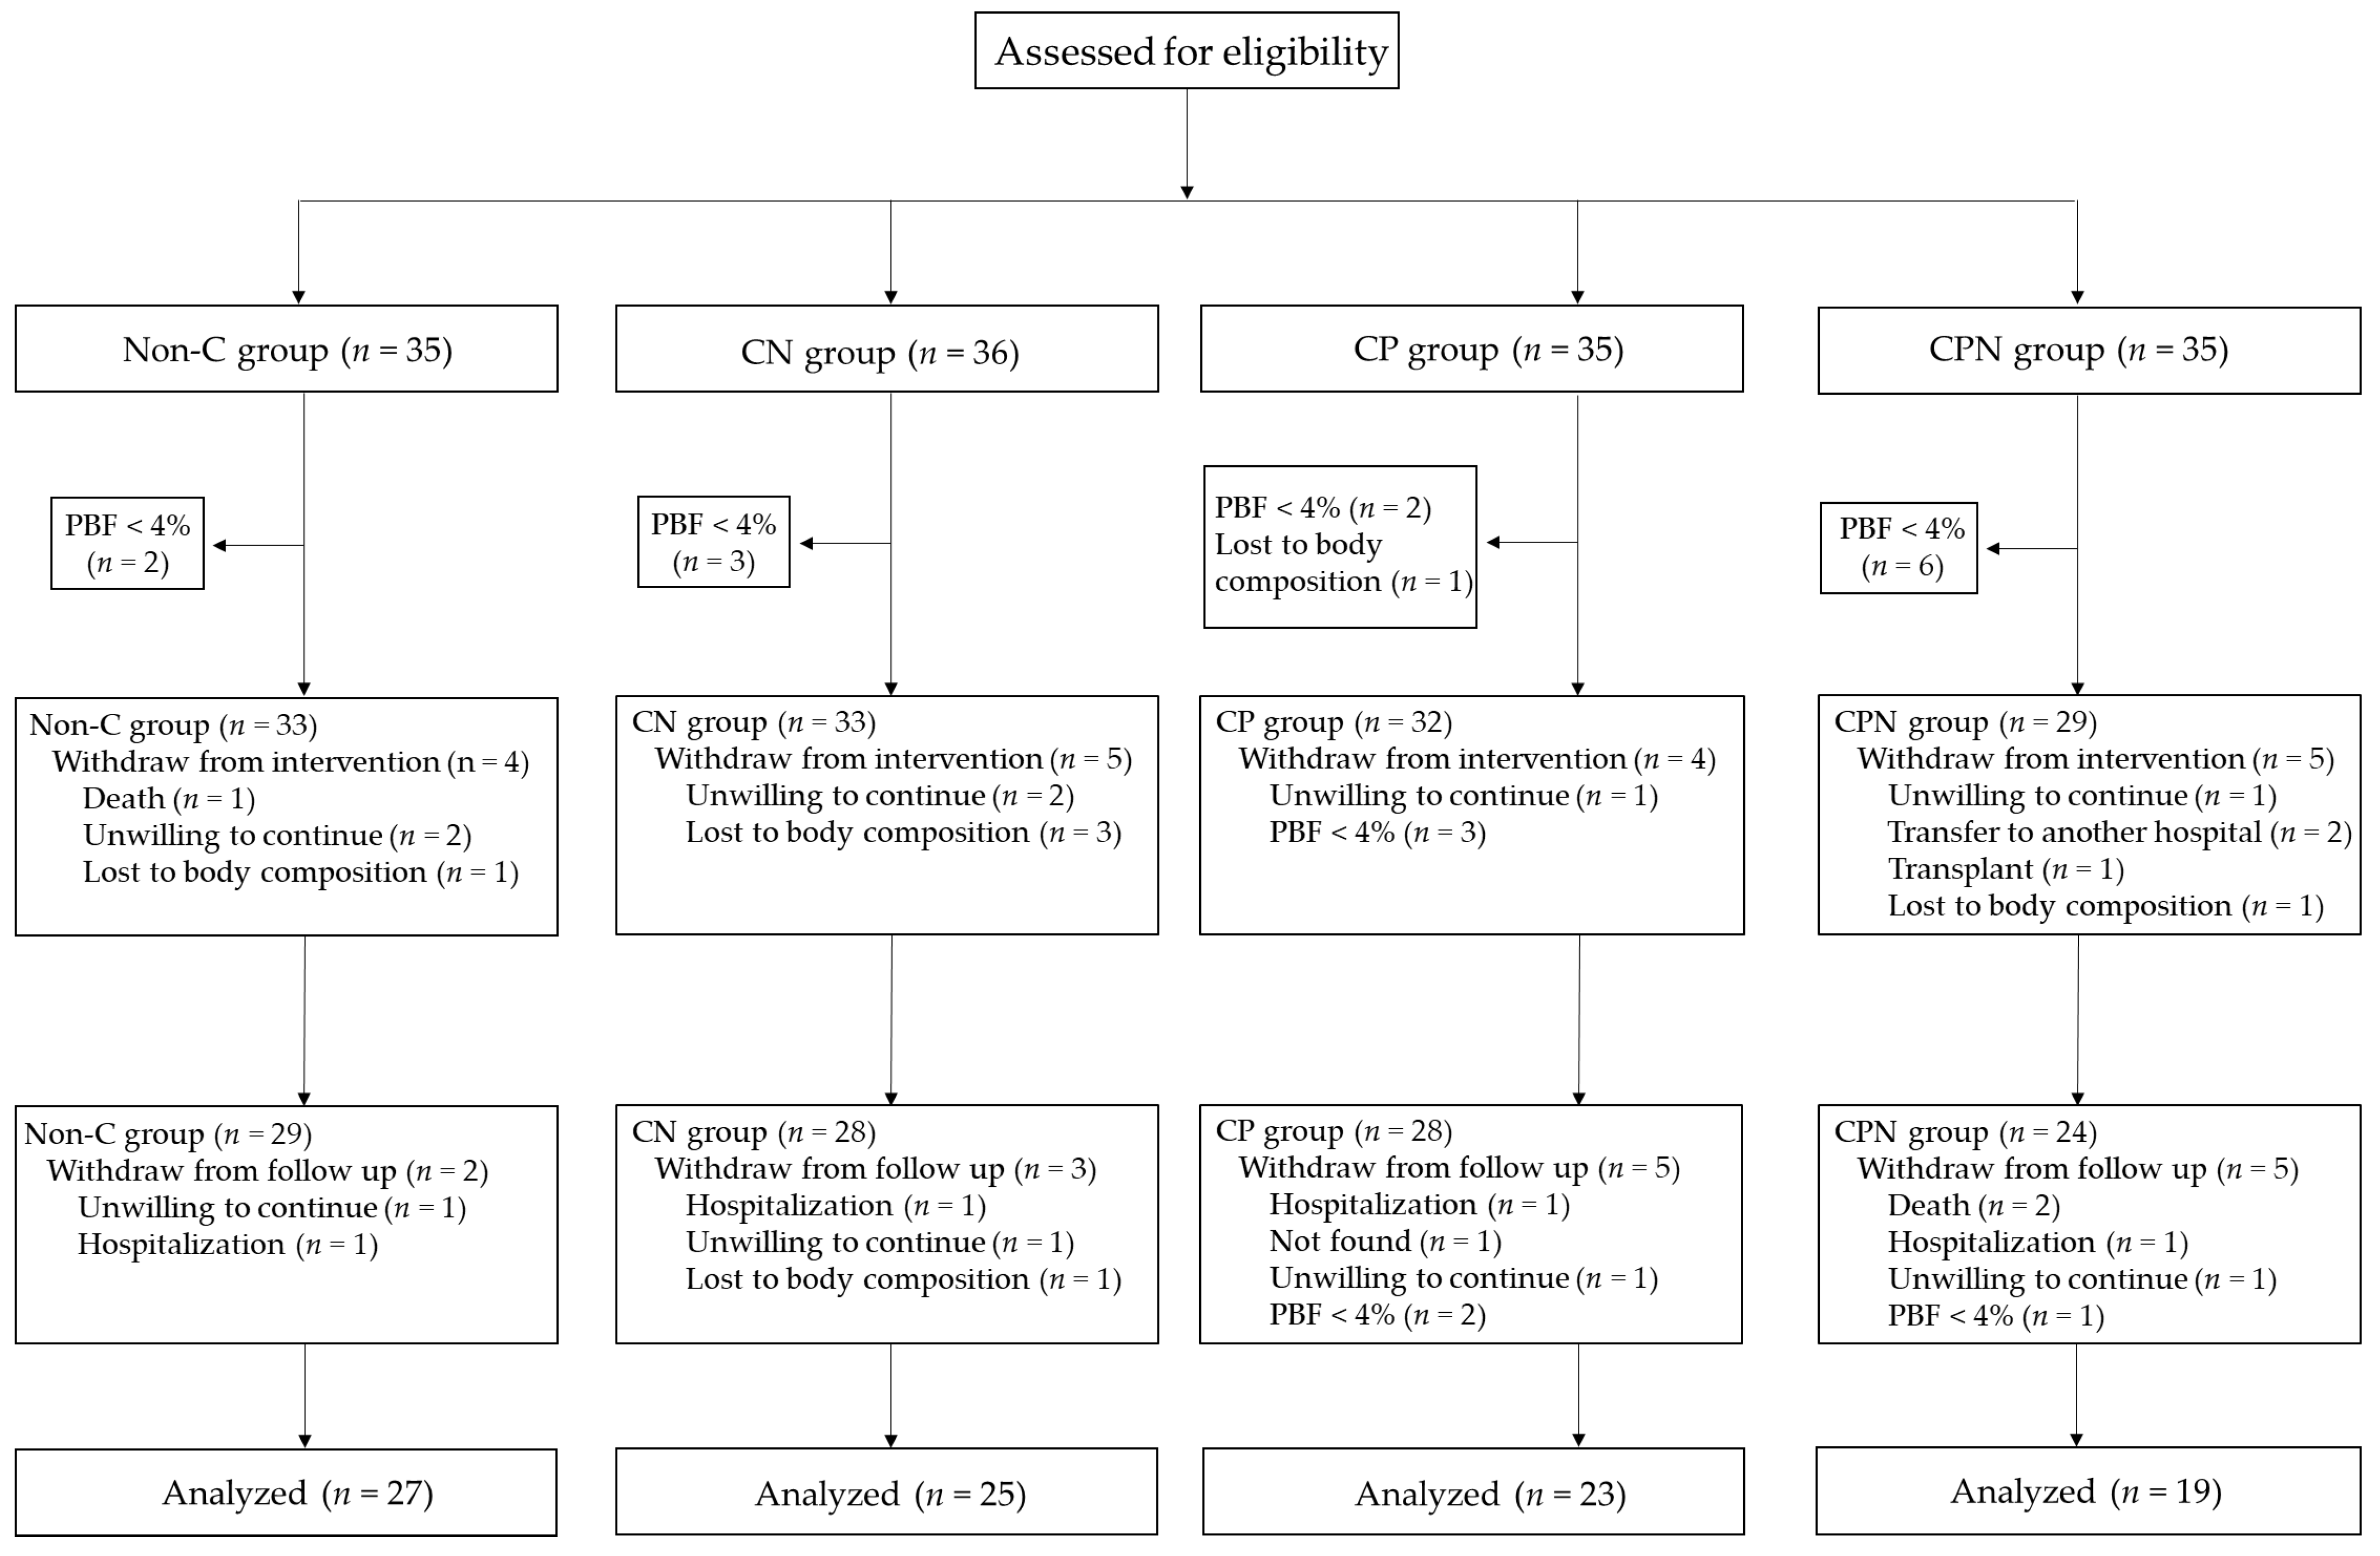
| All (n = 94) | Non-C (n = 27) | CN (n = 25) | CP (n = 23) | CPN (n = 19) | p Value | |
|---|---|---|---|---|---|---|
| Age, years | 58.3 ± 10.1 | 60.1 ± 11.1 | 54.5 ± 10.7 | 60.3 ± 7.1 | 58.5 ± 10.2 | 0.14 |
| Male, n (%) | 61 (64.9) | 17 (48.6) | 16 (64.0) | 18 (78.3) | 10 (52.6) | 0.37 |
| post-HD weight, kg | 64.5 ± 14.3 | 64.5 ± 17.6 | 63.6 ± 10.1 | 69.6 ± 13.8 | 59.3 ± 13.2 | 0.13 |
| Height, cm | 164.4 ± 8.5 | 164.7 ± 10.3 | 163.6 ± 6.5 | 167.3 ± 7.9 | 162.5 ± 8.3 | 0.28 |
| BMI, kg/m2 | 23.6 ± 4.0 | 23.5 ± 4.4 | 23.8 ± 3.4 | 24.8 ± 4.6 | 22.2 ± 3.3 | 0.23 |
| HD vintage, y | 5.8 ± 5.4 | 7.5 ± 6.8 | 5.1 ± 3.9 | 5.9 ± 6.2 | 4.3 ± 3.4 | 0.22 |
| MET, kcal/day, median (tertile1, tertile3) | 594 (271.4, 1386) | 808.5 (411.8, 2772) | 426 (122.2, 1319.5) | 426 (279.7, 1109.3) | 547.5 (267.3, 1475.5) | 0.51 |
| CCI | 2.8 ± 0.8 | 3.0 ± 0.9 | 2.7 ± 0.8 | 2.8 ± 0.7 | 2.5 ± 0.8 | 0.25 |
| SMM, kg | 26.3 ± 5.7 | 25.2 ± 7.1 | 27.0 ± 4.0 | 28.2 ± 4.6 | 24.7 ± 6.3 | 0.15 |
| Total HEI-HD score | 65.6 ± 8.3 | 67.3 ± 9.1 | 63.3 ± 7.5 | 67.0 ± 9.4 | 64.6 ± 6.5 | 0.25 |
| Dietary knowledge scores | 7.1 ± 1.8 | 7.2 ± 1.7 | 7.5 ± 1.6 | 6.8 ± 1.9 | 6.7 ± 1.9 | 0.39 |
| Education level | 0.33 | |||||
| Junior, n (%) | 19 (20.9) | 2 (8.0) | 3 (12.5) | 9 (39.1) | 5 (26.3) | |
| Senior, n (%) | 38 (41.8) | 12 (48.0) | 11 (45.8) | 8 (34.8) | 7 (36.8) | |
| Colleges, n (%) | 29 (31.9) | 10 (40.0) | 9 (37.5) | 5 (21.7) | 5 (26.3) | |
| ≥Master, n (%) | 5 (5.5) | 1 (4) | 1 (4.2) | 1 (4.4) | 2 (10.5) | |
| Occupation | 0.53 | |||||
| Public employees, n (%) | 9 (9.6) | 2 (7.4) | 2 (8.0) | 2 (8.7) | 3 (15.8) | |
| Service industry, n (%) | 8 (8.5) | 4 (14.8) | 3 (12.0) | 0 (0) | 1 (5.3) | |
| Industrial and commercial, n (%) | 9 (9.6) | 0 (0) | 5 (20.0) | 3 (13.0) | 1 (5.3) | |
| Freelance, n (%) | 12 (12.8) | 3 (11.1) | 2 (8.0) | 4 (17.4) | 3 (15.8) | |
| Retirement, n (%) | 36 (38.3) | 13 (48.1) | 7 (28.0) | 9 (39.1) | 7 (36.8) | |
| Unemployed, n (%) | 4 (4.3) | 0 (0) | 1 (4.0) | 1 (4.4) | 2 (10.5) | |
| Others, n (%) | 16 (17.0) | 5 (18.5) | 5 (20.0) | 4 (17.4) | 2 (10.5) | |
| Marital status | 0.03 | |||||
| Single, n (%) | 18 (20.9) | 3 (12.5) | 9 (39.1) | 4 (20.0) | 2 (10.5) | |
| Married, n (%) | 56 (65.1) | 19 (79.2) | 9 (39.1) | 14 (70.0) | 14 (73.7) | |
| Divorced/Widowed, n (%) | 12 (14.0) | 2 (4.0) | 5 (21.7) | 2 (10.0) | 3 (15.8) | |
| Live alone, n (%) | 7 (5.0) | 2 (8.3) | 3 (8.3) | 1 (2.9) | 1 (2.9) | 0.66 |
| Accepted nutritional education/counseling before | 0.43 | |||||
| Yes, n (%) | 74 (79.6) | 22 (62.9) | 18 (72.0) | 17 (73.9) | 17 (89.5) | |
| Nurses | 0.20 | |||||
| Age, years | 37.7 ± 7.7 | 39.1 ± 9.7 | 35.3 ± 4.6 | 38.0 ± 7.8 | 38.4 ± 7.9 | |
| Dietary knowledge scores | 8.1 ± 1.1 | 8.2 ± 1.2 | 8.0 ± 1.0 | 8.0 ± 1.1 | 8.2 ± 0.9 | 0.79 |
| All (n = 94) | Non-C (n = 27) | CN (n = 25) | CP (n = 23) | CPN (n = 19) | p Value | |
|---|---|---|---|---|---|---|
| T1-T0 | 0.1 ± 1.6 | −0.3 ± 1.8 | 0.3 ± 1.6 | 0.3 ± 1.3 | 0.3 ± 1.6 | 0.48 |
| T2-T0 | 0.4 ± 1.6 * | 0.4 ± 1.8 | 0.3 ± 1.6 | 0.4 ± 1.7 | 0.3± 1.5 | 0.99 |
| T2-T1 | 0.2 ± 1.5 | 0.7 ± 1.4 * | 0.0 ± 1.3 | 0.2 ± 1.6 | 0.0 ± 1.7 | 0.35 |
| All (n = 94) | Non-C (n = 27) | CN (n = 25) | CP (n = 23) | CPN (n = 19) | p Value 1 | |
|---|---|---|---|---|---|---|
| T1-T0 | ||||||
| Total grains | −0.2 ± 2.1 | −0.4 ± 2.1 | −0.3 ± 1.8 | 0.4 ± 2.4 | −0.3 ± 1.8 | 0.48 |
| Total protein foods | −0.6 ± 2.1 | −0.3 ± 2.2 | −1.2 ± 2.1 * | 0.1 ± 2.0 | −1.0 ±1.9 * | 0.12 |
| Total vegetable | −0.5 ± 2.5 | −1.7 ± 2.6 c* | −0.8 ± 2.7 abc | 0.2 ± 1.5 ab | 0.5 ± 2.7 a | <0.01 |
| Whole fruits | −0.3 ± 1.5 * | −0.2 ± 1.7 | −0.1 ± 1.2 | −0.5 ± 1.9 | −0.4 ± 1.1 | 0.80 |
| Oils | −0.3 ± 1.7 | −0.2 ± 1.4 | −0.4 ± 1.7 | −0.4 ± 2.1 | −0.3 ± 1.5 | 0.95 |
| HBV proteins | 0.1 ± 0.4 | 0.1 ± 0.3 | 0.2 ± 0.6 # | 0.1 ± 0.5 | −0.01 ± 0.1 | 0.27 |
| The ratio of white to red meat | −0.6 ± 2.1 * | −1.2 ± 2.3 b* | −0.3 ± 1.6 ab | −1.1 ± 2.0 ab* | 0.5 ± 2.0 a | 0.03 |
| Processed meat | 0.3 ± 2.0 | 0.5 ± 2.4 | 0.2 ± 1.9 | −0.3 ± 1.8 | 0.9 ± 1.7 * | 0.26 |
| Fish and seafood | 0.3 ± 2.7 | 0.5 ± 2.5 | 0.6 ± 2.9 | 0.1 ± 3.1 | −0.3± 2.5 | 0.64 |
| SFA-rich oils | −0.02 ± 1.2 | −0.1 ± 1.1 | −0.5 ± 0.8 * | 0.2 ± 1.4 | 0.4 ± 1.7 | 0.09 |
| Sugar-sweetened beverages and fruit juice | 0.0 ± 1.8 | 0.2 ± 1.7 | 0.2 ± 2.0 | −0.7 ± 1.6 * | 0.3 ± 2.0 | 0.24 |
| Alcohol | −0.1 ± 0.8 | −0.1 ± 1.1 | 0.0 ± 0.0 | −0.1 ± 0.3 | −0.1 ± 1.3 | 0.99 |
| Whole grains | −0.1 ± 0.9 | −0.2 ± 0.5 # | 0.1 ± 1.1 | −0.1 ± 1.2 | −0.1 ± 0.4 | 0.58 |
| Nuts and seeds | −0.1 ± 1.2 | −0.2 ± 1.3 | 0.0 ± 1.3 | −0.1 ± 1.3 # | 0.2 ± 1.0 | 0.32 |
| Taste | 0.05 ± 1.0 | −0.1 ± 0.8 | 0.1 ± 1.4 | −0.1 ± 0.9 | 0.4 ± 1.1 | 0.31 |
| Milk and dairy products | 0.04 ± 2.0 | 0.2 ± 2.2 | −0.5 ± 2.2 | −0.2 ± 1.7 | 0.7 ± 1.6 # | 0.23 |
| Total HEI-HD score | −2.3 ± 8.4 | −3.3 ± 9.1 # | −3.2 ± 9.7 | −2.7 ± 7.3 # | 0.8 ± 6.4 | 0.36 |
| T2-T0 | ||||||
| Total grains | −0.03 ± 1.9 | −0.4 ± 2.0 | −0.1 ± 1.6 | 0.3 ± 1.8 | 0.1 ± 2.2 | 0.78 |
| Total protein foods | −0.1 ± 1.9 | 0.1 ± 2.5 | −0.5 ± 1.4 | 0.3 ± 1.6 | −0.4 ± 1.8 | 0.44 |
| Total vegetable | −0.3 ± 2.8 | −1.6 ± 2.4 b* | −0.3 ± 2.6 ab | 0.7 ± 2.7 a | 0.1 ± 3.4 ab | 0.03 |
| Whole fruits | −0.3 ± 1.6 | −0.2 ± 1.6 | −0.3 ± 1.8 | −0.4 ± 1.5 | −0.3 ± 1.6 | 0.95 |
| Oils | −0.1 ± 1.4 | −0.1 ± 1.3 | −0.1 ± 1.1 | −0.3 ± 1.5 | 0.3 ± 1.7 | 0.66 |
| HBV proteins | 0.1 ± 0.5 | 0.1 ± 0.3 | 0.2 ± 0.7 | 0.1 ± 0.5 | 0.0 ± 0.0 | 0.52 |
| The ratio of white to red meat | −0.6 ± 2.0 | −1.1 ± 2.3 ab* | −0.3 ± 1.7 ab | −1.3 ± 2.0 b* | 0.4 ± 1.8 a | 0.03 |
| Processed meat | −0.01 ± 2.2 | 0.1 ± 2.7 | 0.1 ± 2.4 | −0.4 ± 1.7 | 0.1 ± 1.6 | 0.81 |
| Fish and seafood | 0.3 ± 2.7 | 0.1 ± 2.7 | 0.5 ± 3.0 | 0.2 ± 2.6 | 0.6 ± 2.4 | 0.94 |
| SFA-rich oils | −0.2 ± 1.1 | −0.4 ± 1.2 | −0.5 ± 0.9 * | −0.1 ± 1.1 | 0.3 ± 1.1 | 0.12 |
| Sugar-sweetened beverages and fruit juice | 0.2 ± 2.4 | 1.1 ± 2.0 | 0.1 ± 2.1 | −0.03 ± 2.6 | 1.1 ± 2.0 * | 0.27 |
| Alcohol | 0.04 ± 0.8 | −0.1 ± 1.0 | −0.1 ± 0.3 | 0.0 ± 0.0 | 0.4 ± 1.3 | 0.26 |
| Whole grains | 0.0 ± 0.7 | −0.1 ± 0.3 | 0.1 ± 1.1 | 0.0 ± 0.7 | −0.1 ± 0.4 | 0.70 |
| Nuts and seeds | −0.2 ± 1.3 | −0.2 ± 1.4 | −0.1 ± 1.5 | −0.4 ± 1.0 | −0.3 ± 1.4 | 0.94 |
| Taste | 0.2 ± 1.5 | 0.4 ± 2.0 | 0.1 ± 1.0 | 0.0 ± 1.6 | 0.1 ± 1.2 | 0.79 |
| Milk and dairy products | −0.2 ± 2.0 | −0.1 ± 2.2 | −0.3 ± 2.0 | −0.8 ± 1.8 * | 0.6 ± 1.8 | 0.13 |
| Total HEI-HD score | −1.3 ± 7.8 | −3.4 ± 9.5 b# | −1.7 ± 7.4 ab | −2.0 ± 6.7 ab | 3.0 ± 5.5 a* | 0.05 |
| T2-T1 | ||||||
| Total grains | 0.2 ± 1.7 | 0.1 ± 1.7 | 0.2 ± 1.9 | −0.1 ± 1.6 | 0.5 ± 1.4 | 0.75 |
| Total protein foods | 0.5 ± 1.7 | 0.4 ± 1.9 | 0.7 ± 1.9 # | 0.2 ± 1.7 | 0.5 ± 1.4 | 0.72 |
| Total vegetable | 0.2 ± 2.5 | 0.1 ± 2.4 | 0.5 ± 2.7 | 0.5 ± 2.3 | −0.4 ± 2.6 | 0.62 |
| Whole fruits | 0.02 ± 1.2 | 0.03 ± 1.1 | −0.1 ± 1.4 | 0.1± 1.2 | 0.1 ± 1.2 | 0.88 |
| Oils | 0.2 ± 1.5 | 0.02 ± 1.7 | 0.3 ± 1.5 | 0.1 ± 1.3 | 0.5 ± 1.5 | 0.72 |
| HBV proteins | 0.0 ± 0.3 | 0.0 ± 0.0 | −0.02 ± 0.5 | 0.01 ± 0.1 | 0.01 ± 0.1 | 0.97 |
| The ratio of white to red meat | −0.03 ± 1.8 | 0.1 ± 2.1 | −0.01 ± 1.4 | −0.2± 1.8 | −0.1 ± 1.9 | 0.95 |
| Processed meat | −0.3 ± 2.0 | −0.4 ± 2.4 | −0.1 ± 1.9 | −0.1± 2.0 | −0.8 ± 1.4 * | 0.61 |
| Fish and seafood | 0.07 ± 2.6 | −0.4 ± 1.9 | −0.1 ± 2.7 | 0.1 ± 2.8 | 0.9 ± 2.7 | 0.35 |
| SFA-rich oils | −0.2 ± 1.2 | −0.3 ± 1.1 | 0.001 ± 1.4 | −0.3 ± 1.2 | −0.1 ± 1.3 | 0.78 |
| Sugar-sweetened beverages and fruit juice | 0.2 ± 2.3 | −0.4 ± 0.2 | −0.1 ± 1.9 | 0.7 ± 2.7 | 0.9 ± 2.4 | 0.19 |
| Alcohol | 0.1 ± 0.8 | 0.0 ± 0.9 | −0.1 ± 0.3 | 0.1 ± 0.3 | 0.4 ± 1.3 | 0.20 |
| Whole grains | 0.1 ± 0.6 | 0.1 ± 0.6 | 0.0 ± 0.5 | 0.1 ± 0.7 | 0.0 ± 0.6 | 0.76 |
| Nuts and seeds | −0.1 ± 1.3 | −0.03 ± 1.0 | −0.1 ± 1.3 | 0.1 ± 1.6 | −0.4 ± 1.2 | 0.52 |
| Taste | 0.1 ± 1.6 | 0.6 ± 1.8 | 0.1 ± 1.7 | 0.1 ± 1.6 | −0.3 ± 1.2 | 0.32 |
| Milk and dairy products | −0.2 ± 1.8 | −0.4 ± 1.9 | 0.2 ± 1.9 | −0.7 ± 2.1 | −0.1 ± 1.4 | 0.42 |
| Total HEI-HD score | 1.0 ± 7.9 | −0.1 ± 8.6 | 1.5 ± 10.0 | 0.7 ± 6.1 | 2.3 ± 6.0 | 0.78 |
| All (n = 94) | Non-C (n = 27) | CN (n = 25) | CP (n = 23) | CPN (n = 19) | p Value | |
|---|---|---|---|---|---|---|
| T1-T0 | ||||||
| SMM, kg | −0.7 ± 2.1 * | −0.9 ± 1.8 * | −0.3 ± 1.7 | −0.5 ± 1.9 | −1.3 ± 3.1 | 0.41 |
| SMMHt2, kg/m2 | −0.3 ± 0.7 * | −0.3 ± 0.6 * | −0.1 ± 0.6 | −0.2 ± 0.7 | −0.5 ± 1.1 | 0.51 |
| SMMWt, % | −0.9 ± 3.5 * | −0.8 ± 3.0 | −0.7 ± 2.6 | −0.3 ± 3.4 | −2.1 ± 5.1 | 0.83 |
| T2-T0 | ||||||
| SMM, kg | −0.1 ± 2.9 | −0.2 ± 1.8 | 0.5 ± 2.3 | 0.3 ± 3.8 | −1.3 ± 3.4 | 0.84 |
| SMMHt2, kg/m2 | −0.0 ± 1.0 | −0.0 ± 0.6 | 0.2 ± 0.9 | 0.1 ± 1.3 | −0.4 ± 1.2 | 0.87 |
| SMMWt, % | 0.1 ± 3.8 | 0.2 ± 2.4 | 0.5 ± 3.6 | 0.3 ± 4.6 | −1.0 ± 4.7 | 0.53 |
| T2-T1 | ||||||
| SMM, kg | 0.6 ± 2.2 * | 0.6 ± 1.1 * | 0.8 ± 1.2 * | 0.8 ± 3.4 | 0.0 ± 2.7 | 0.78 |
| SMMHt2, kg/m2 | 0.2 ± 0.8 * | 0.2 ± 0.4 * | 0.3 ± 0.5 * | 0.3 ± 1.1 | 0.0 ± 1.0 | 0.78 |
| SMMWt, % | 1.0 ± 2.7 * | 1.0 ± 1.4 * | 1.2 ± 1.9 * | 0.6 ± 3.9 | 1.0 ± 3.2 | 0.46 |
Publisher’s Note: MDPI stays neutral with regard to jurisdictional claims in published maps and institutional affiliations. |
© 2022 by the authors. Licensee MDPI, Basel, Switzerland. This article is an open access article distributed under the terms and conditions of the Creative Commons Attribution (CC BY) license (https://creativecommons.org/licenses/by/4.0/).
Share and Cite
Chen, Y.-H.; Liu, W.-L.; Duong, T.V.; Wong, T.-C.; Chen, H.-H.; Chen, T.-H.; Hsu, Y.-H.; Peng, S.-J.; Yang, S.-H. Effect of Different Nutritional Education Based on Healthy Eating Index for HemoDialysis Patients on Dietary Quality and Muscle Mass. Nutrients 2022, 14, 4617. https://doi.org/10.3390/nu14214617
Chen Y-H, Liu W-L, Duong TV, Wong T-C, Chen H-H, Chen T-H, Hsu Y-H, Peng S-J, Yang S-H. Effect of Different Nutritional Education Based on Healthy Eating Index for HemoDialysis Patients on Dietary Quality and Muscle Mass. Nutrients. 2022; 14(21):4617. https://doi.org/10.3390/nu14214617
Chicago/Turabian StyleChen, Yun-Han, Wan-Lin Liu, Tuyen Van Duong, Te-Chih Wong, Hsi-Hsien Chen, Tso-Hsiao Chen, Yung-Ho Hsu, Sheng-Jeng Peng, and Shwu-Huey Yang. 2022. "Effect of Different Nutritional Education Based on Healthy Eating Index for HemoDialysis Patients on Dietary Quality and Muscle Mass" Nutrients 14, no. 21: 4617. https://doi.org/10.3390/nu14214617