

Effects of Whey Protein or Its Hydrolysate Supplements Combined with an Energy-Restricted Diet on Weight Loss: A Randomized Controlled Trial in Older Women
 , , ,
, , ,
Abstract
:1. Introduction
2. Methods
2.1. Participants
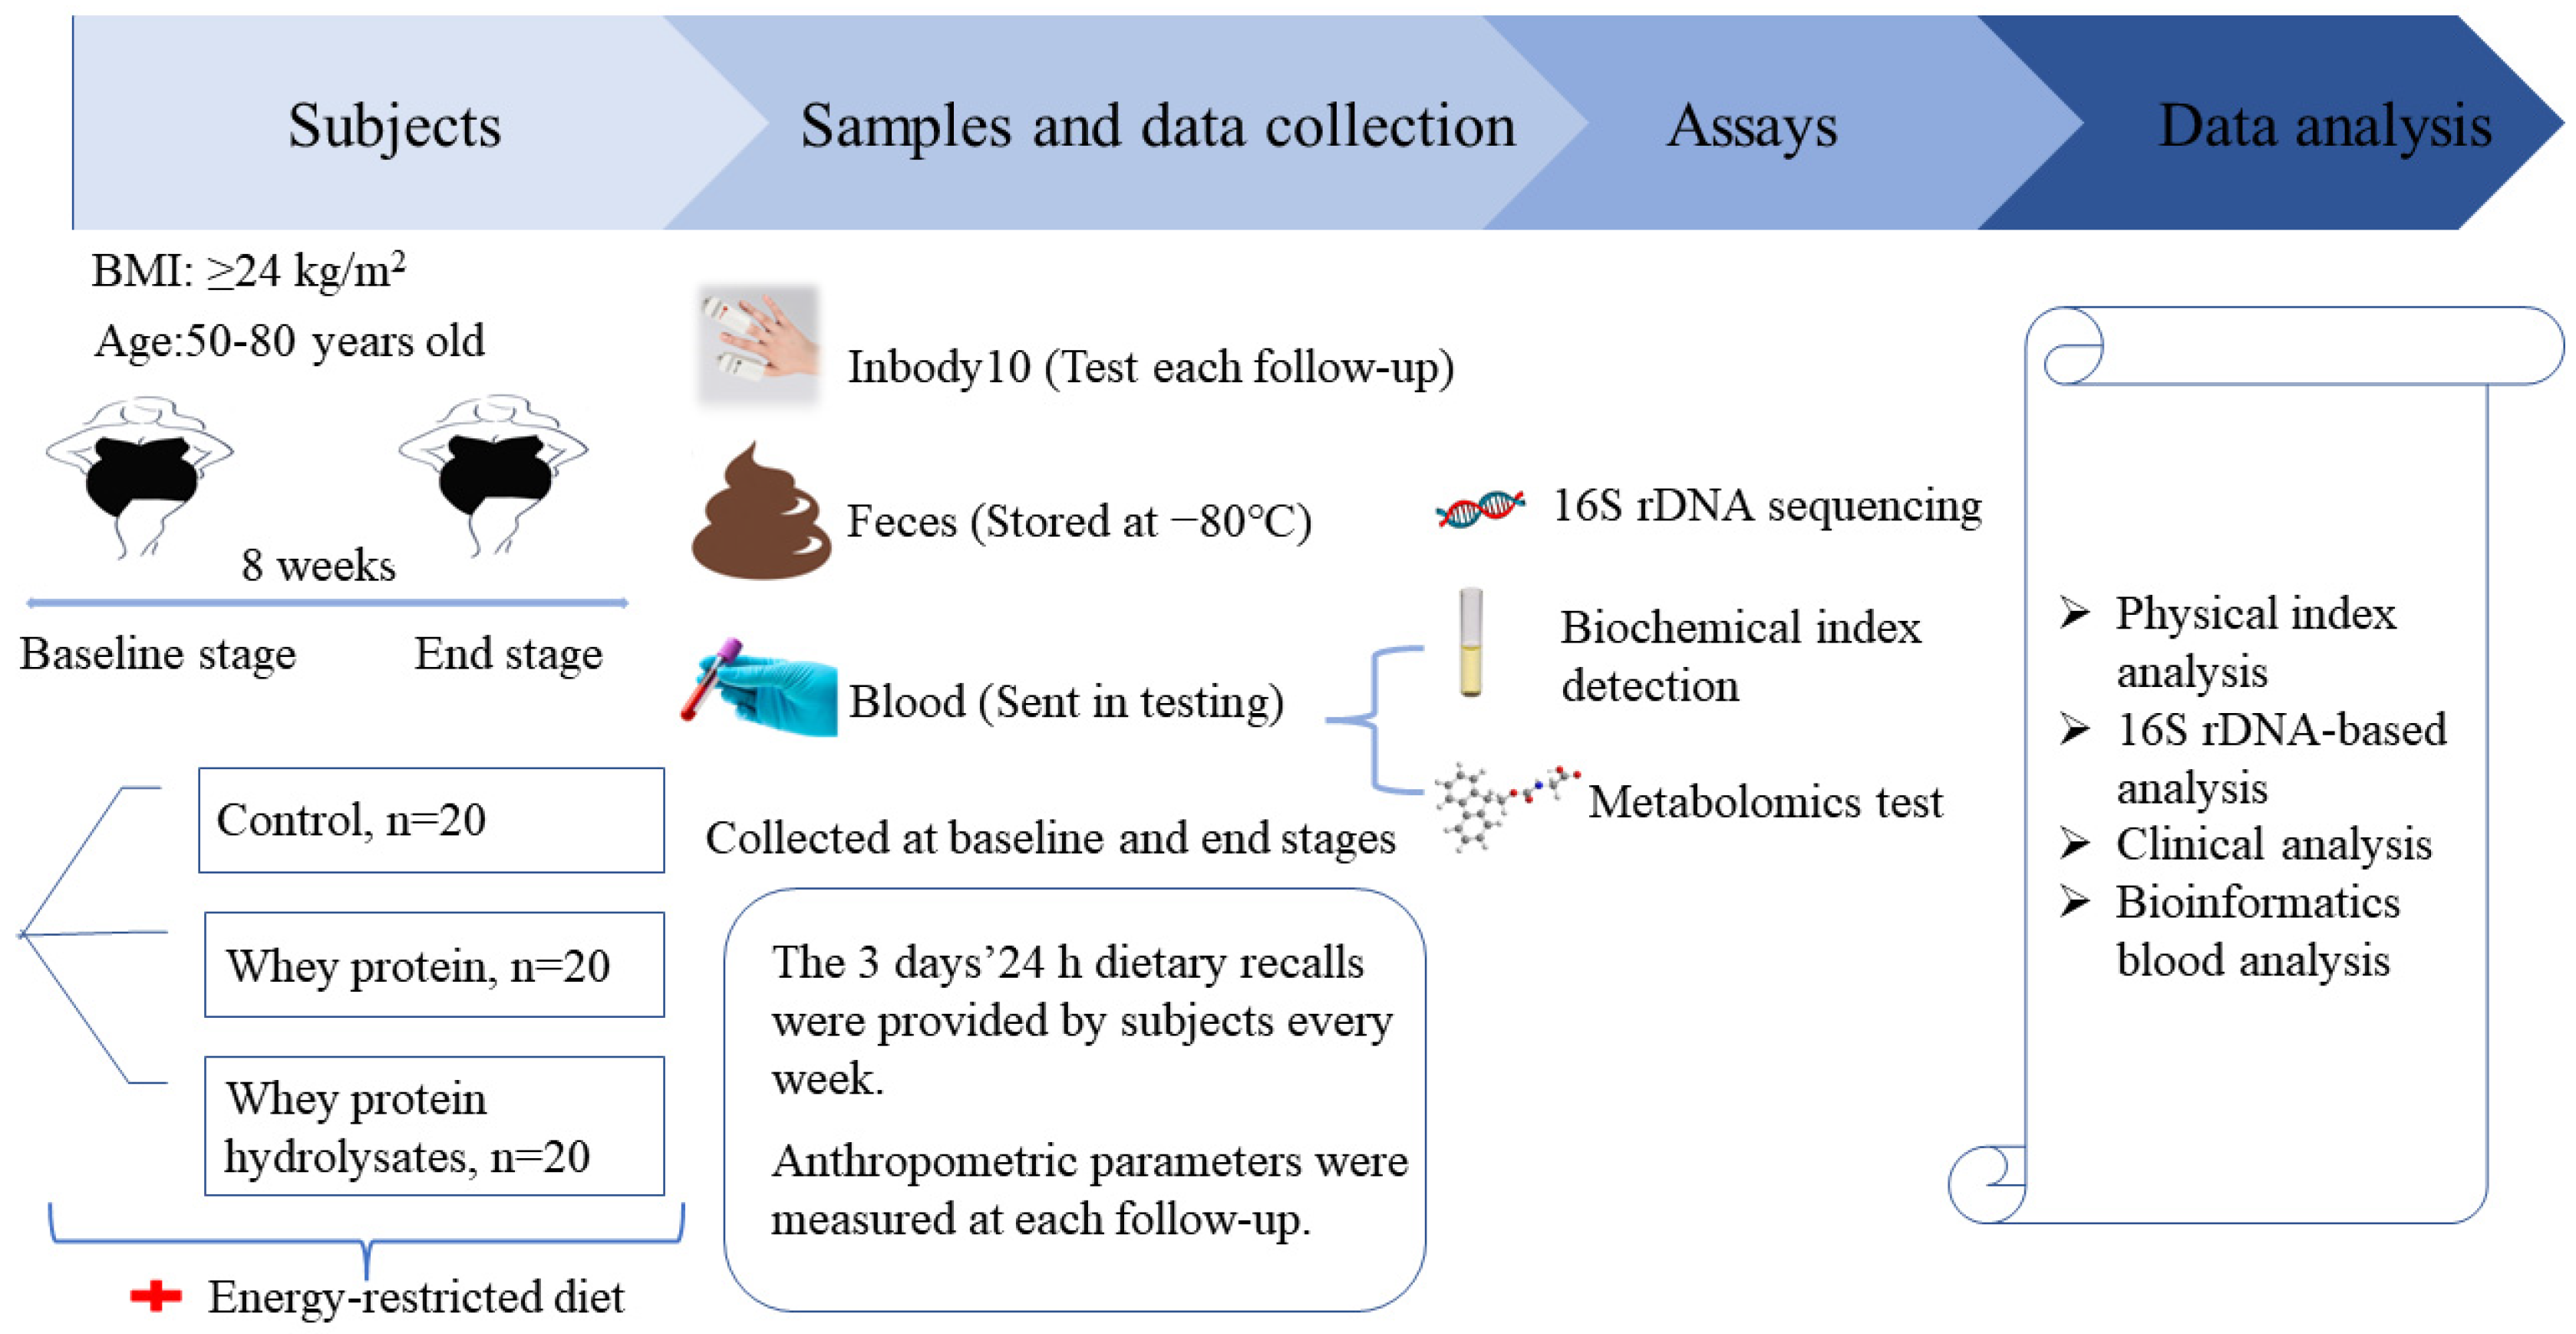
2.2. Study Design
2.3. Body Composition
2.4. Blood Pressure Measurement
2.5. Analysis of Glucose, Lipid Metabolism, and Inflammatory Factors
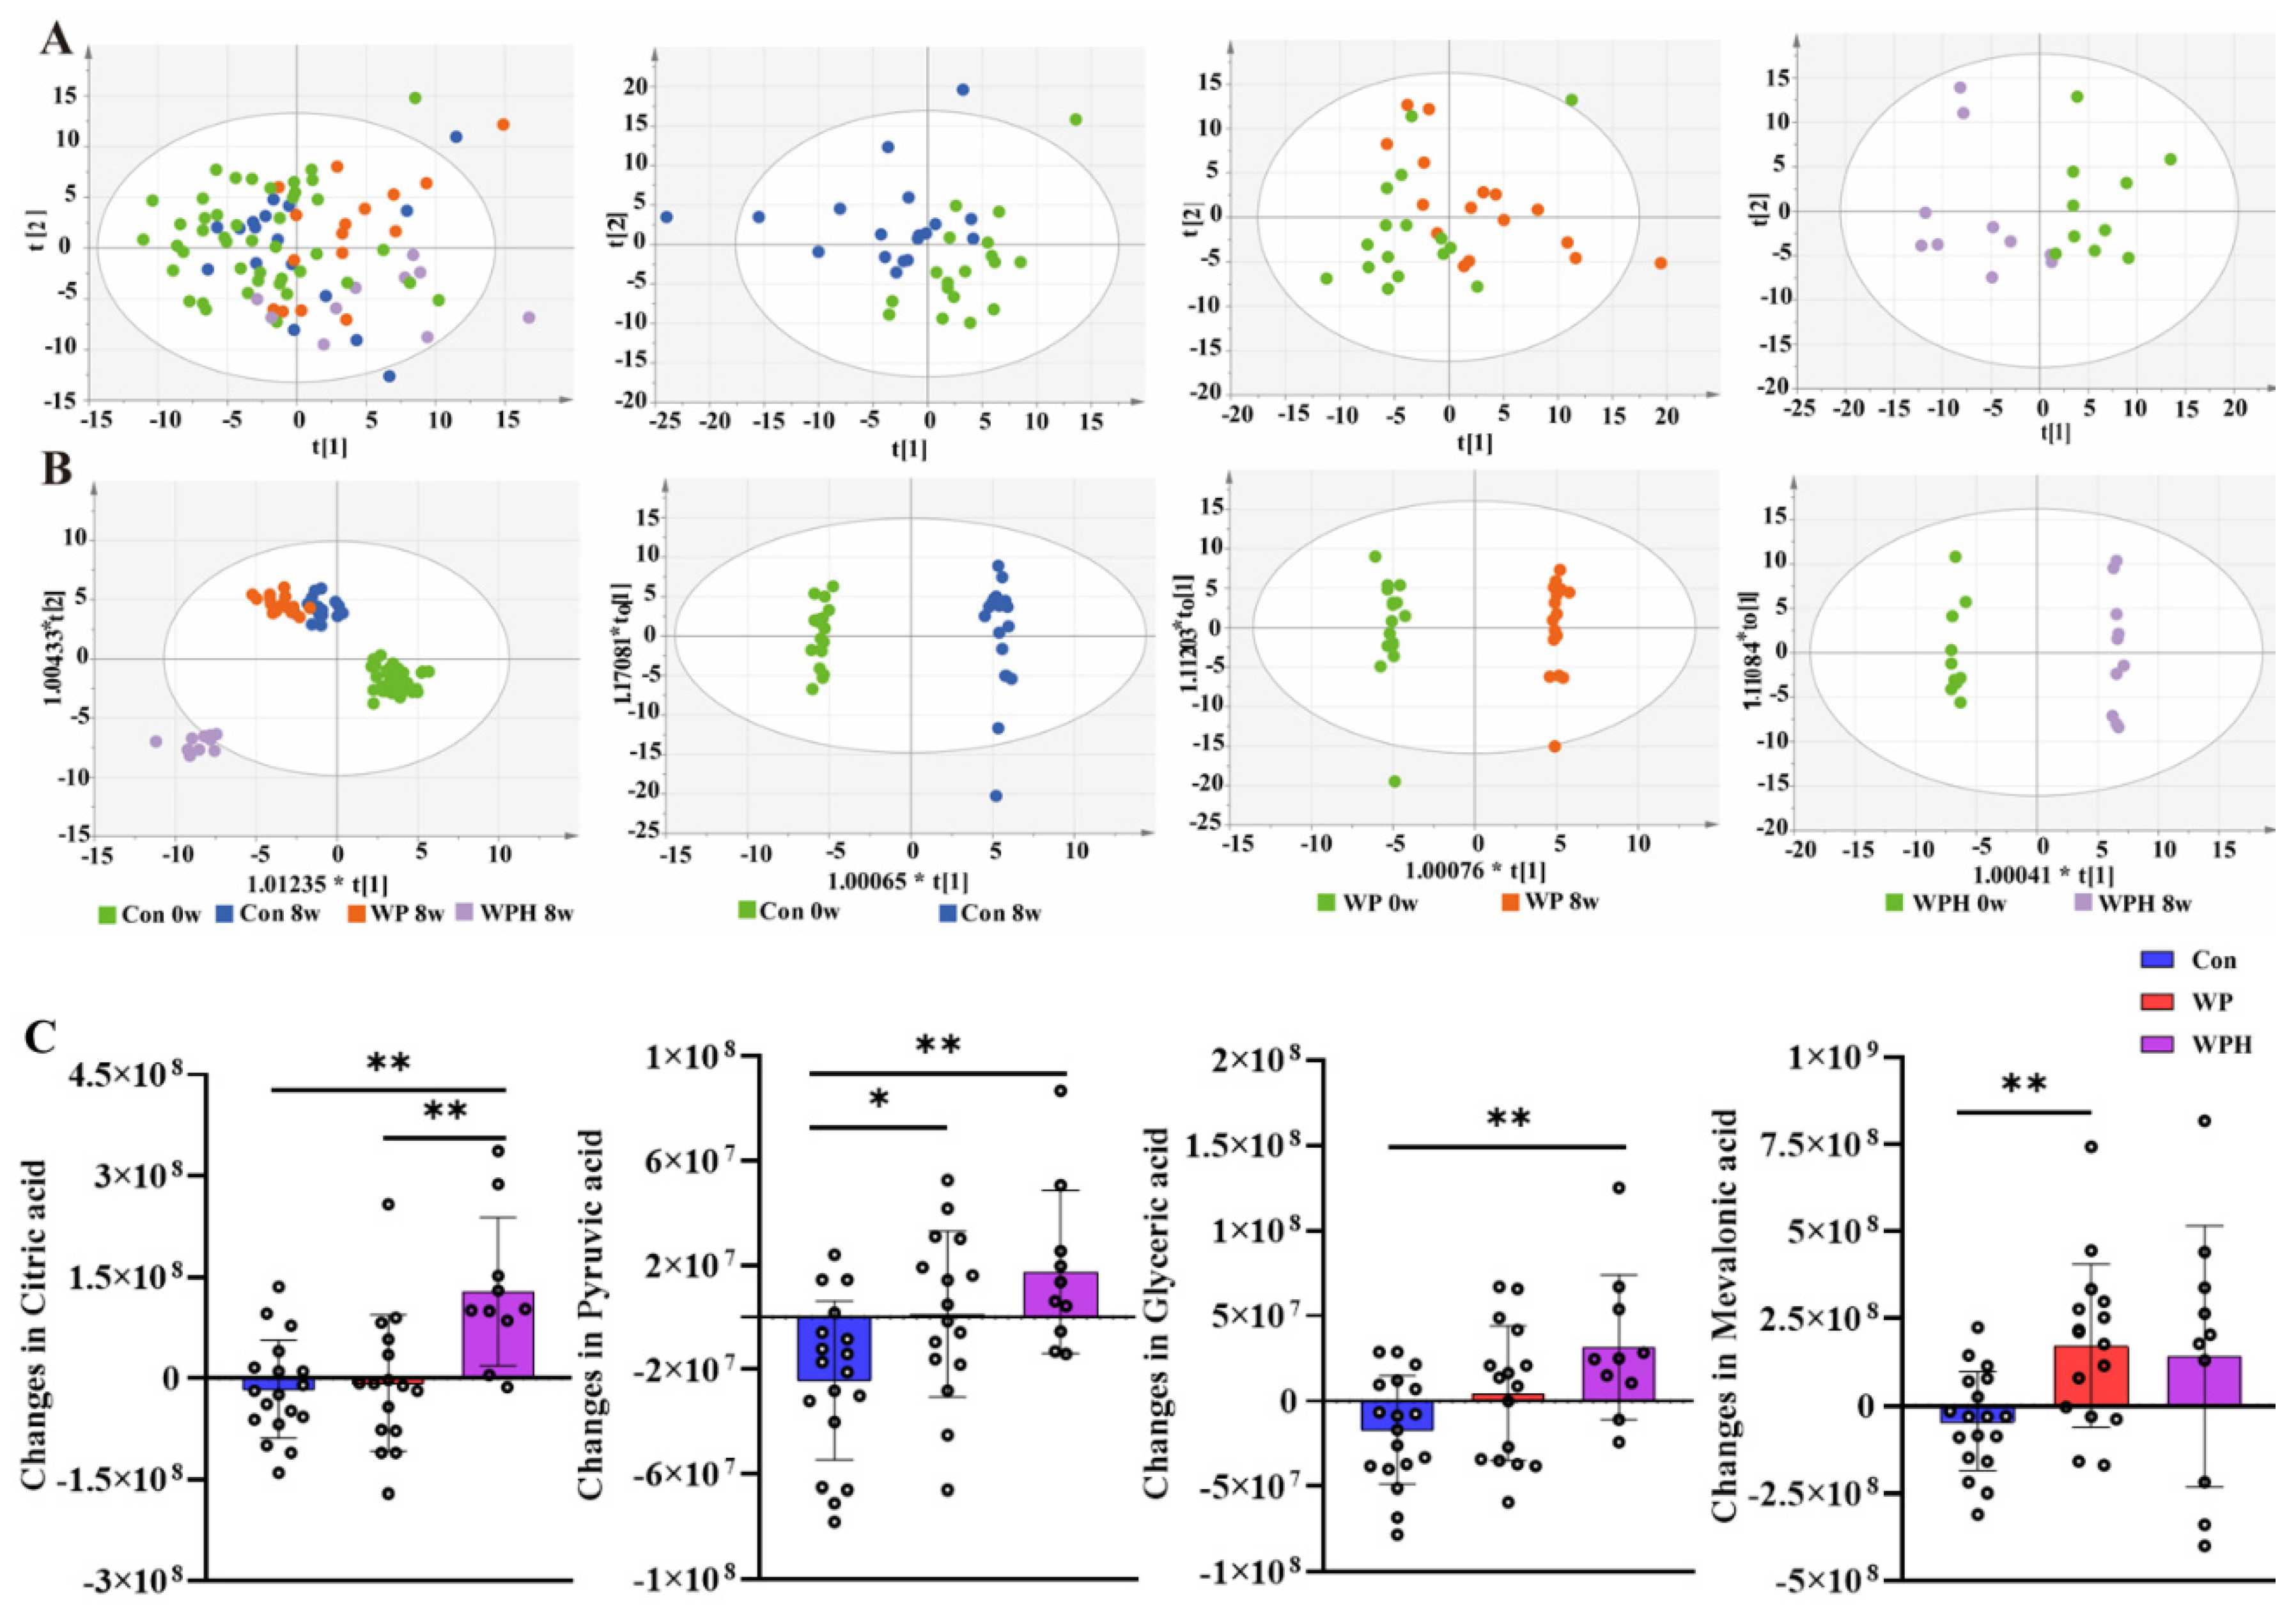
2.6. Nontargeted Metabolomics
2.7. Stool Sample Collection and DNA Extraction
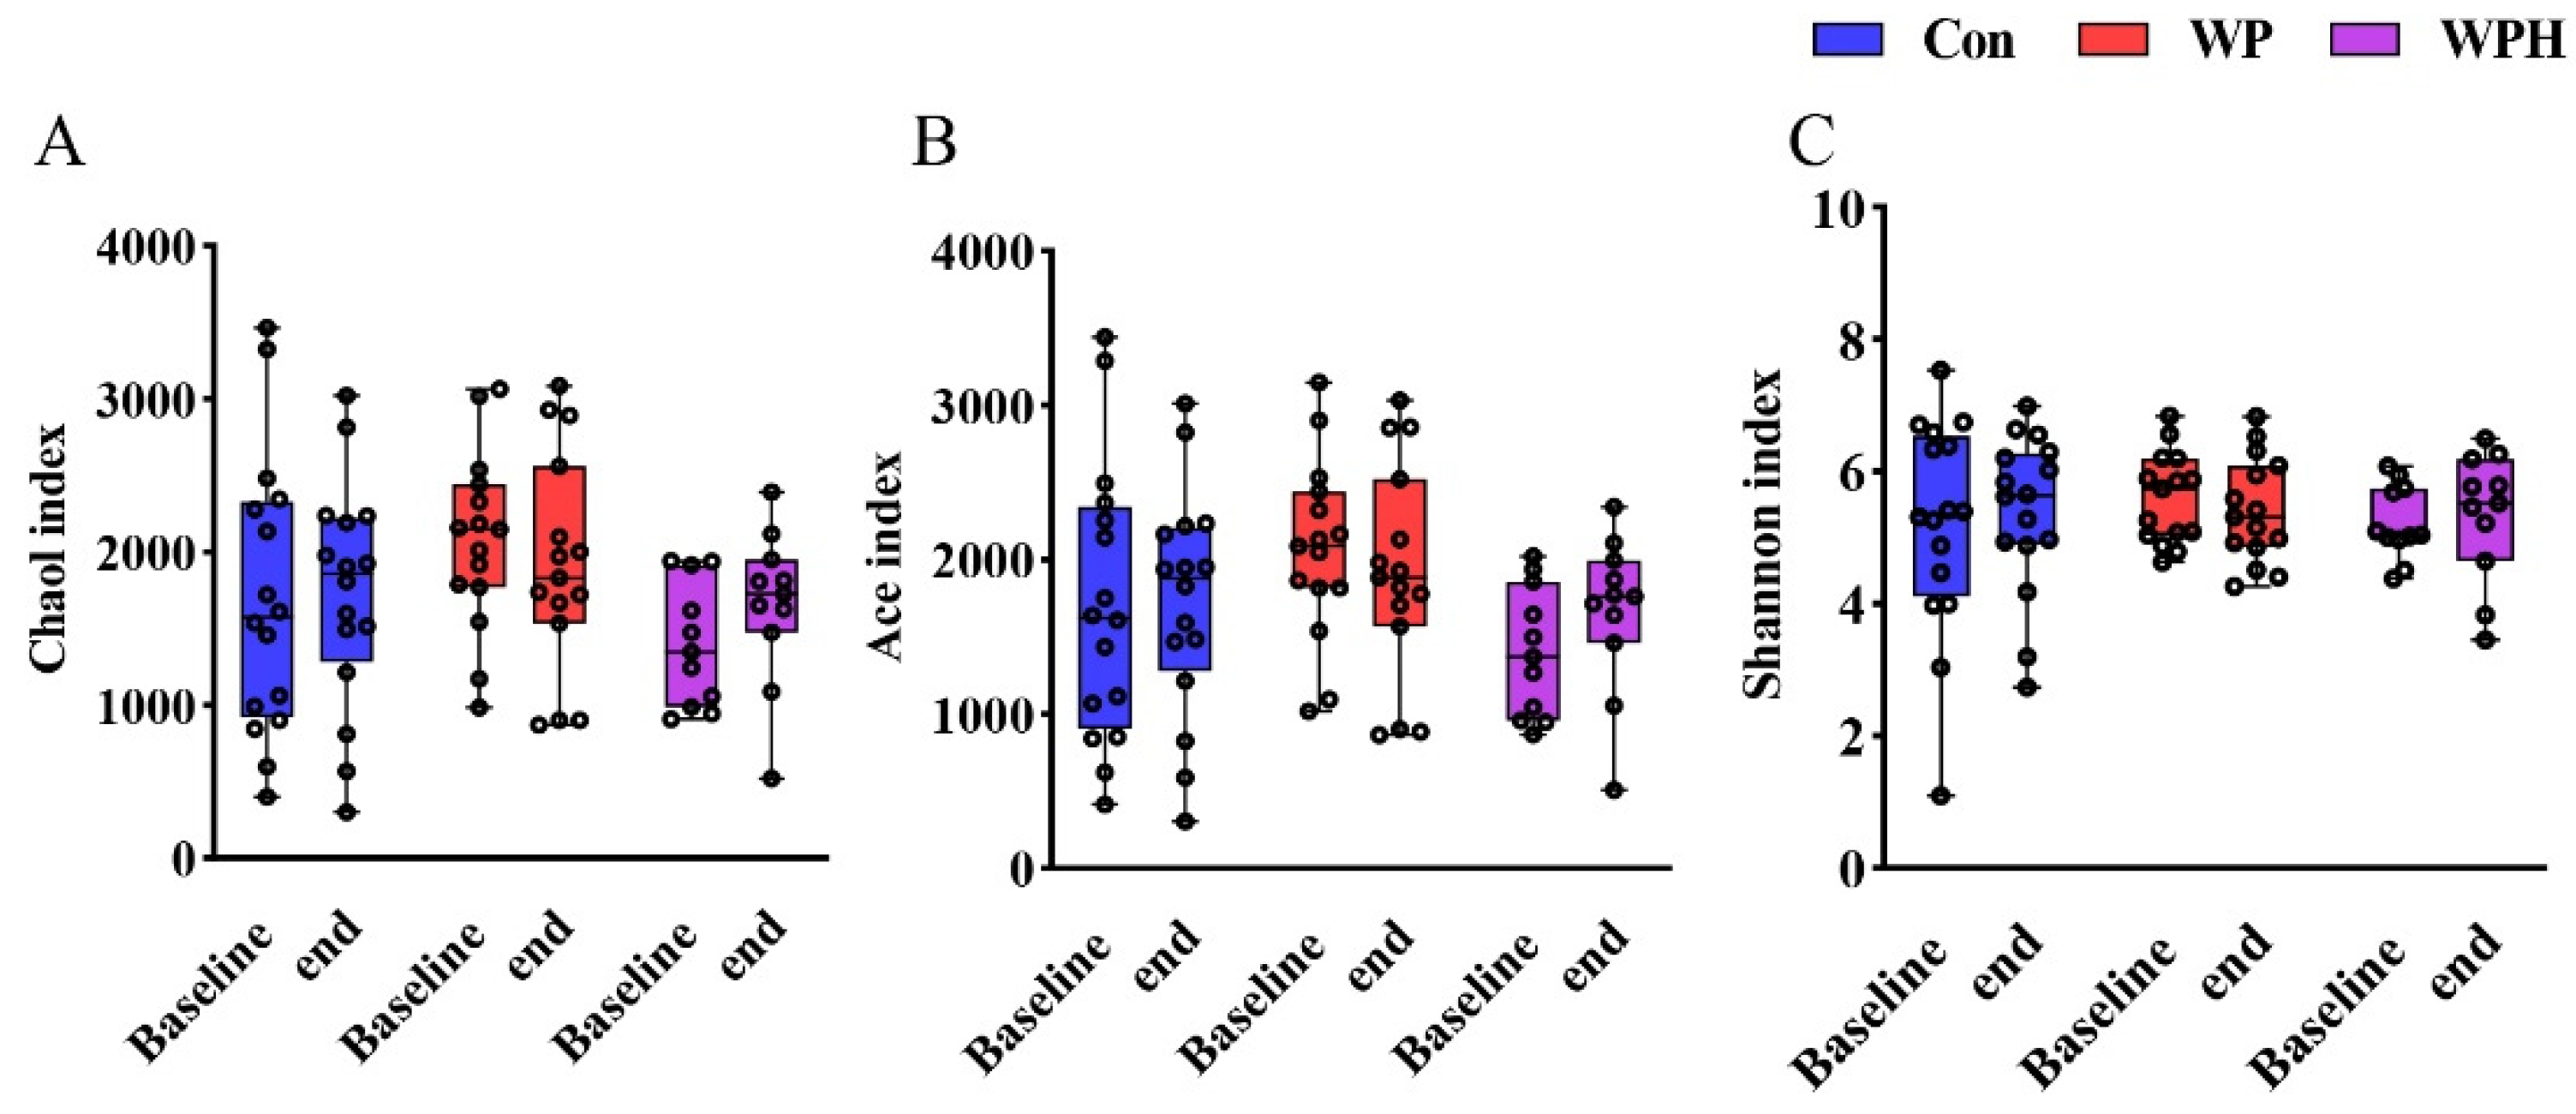
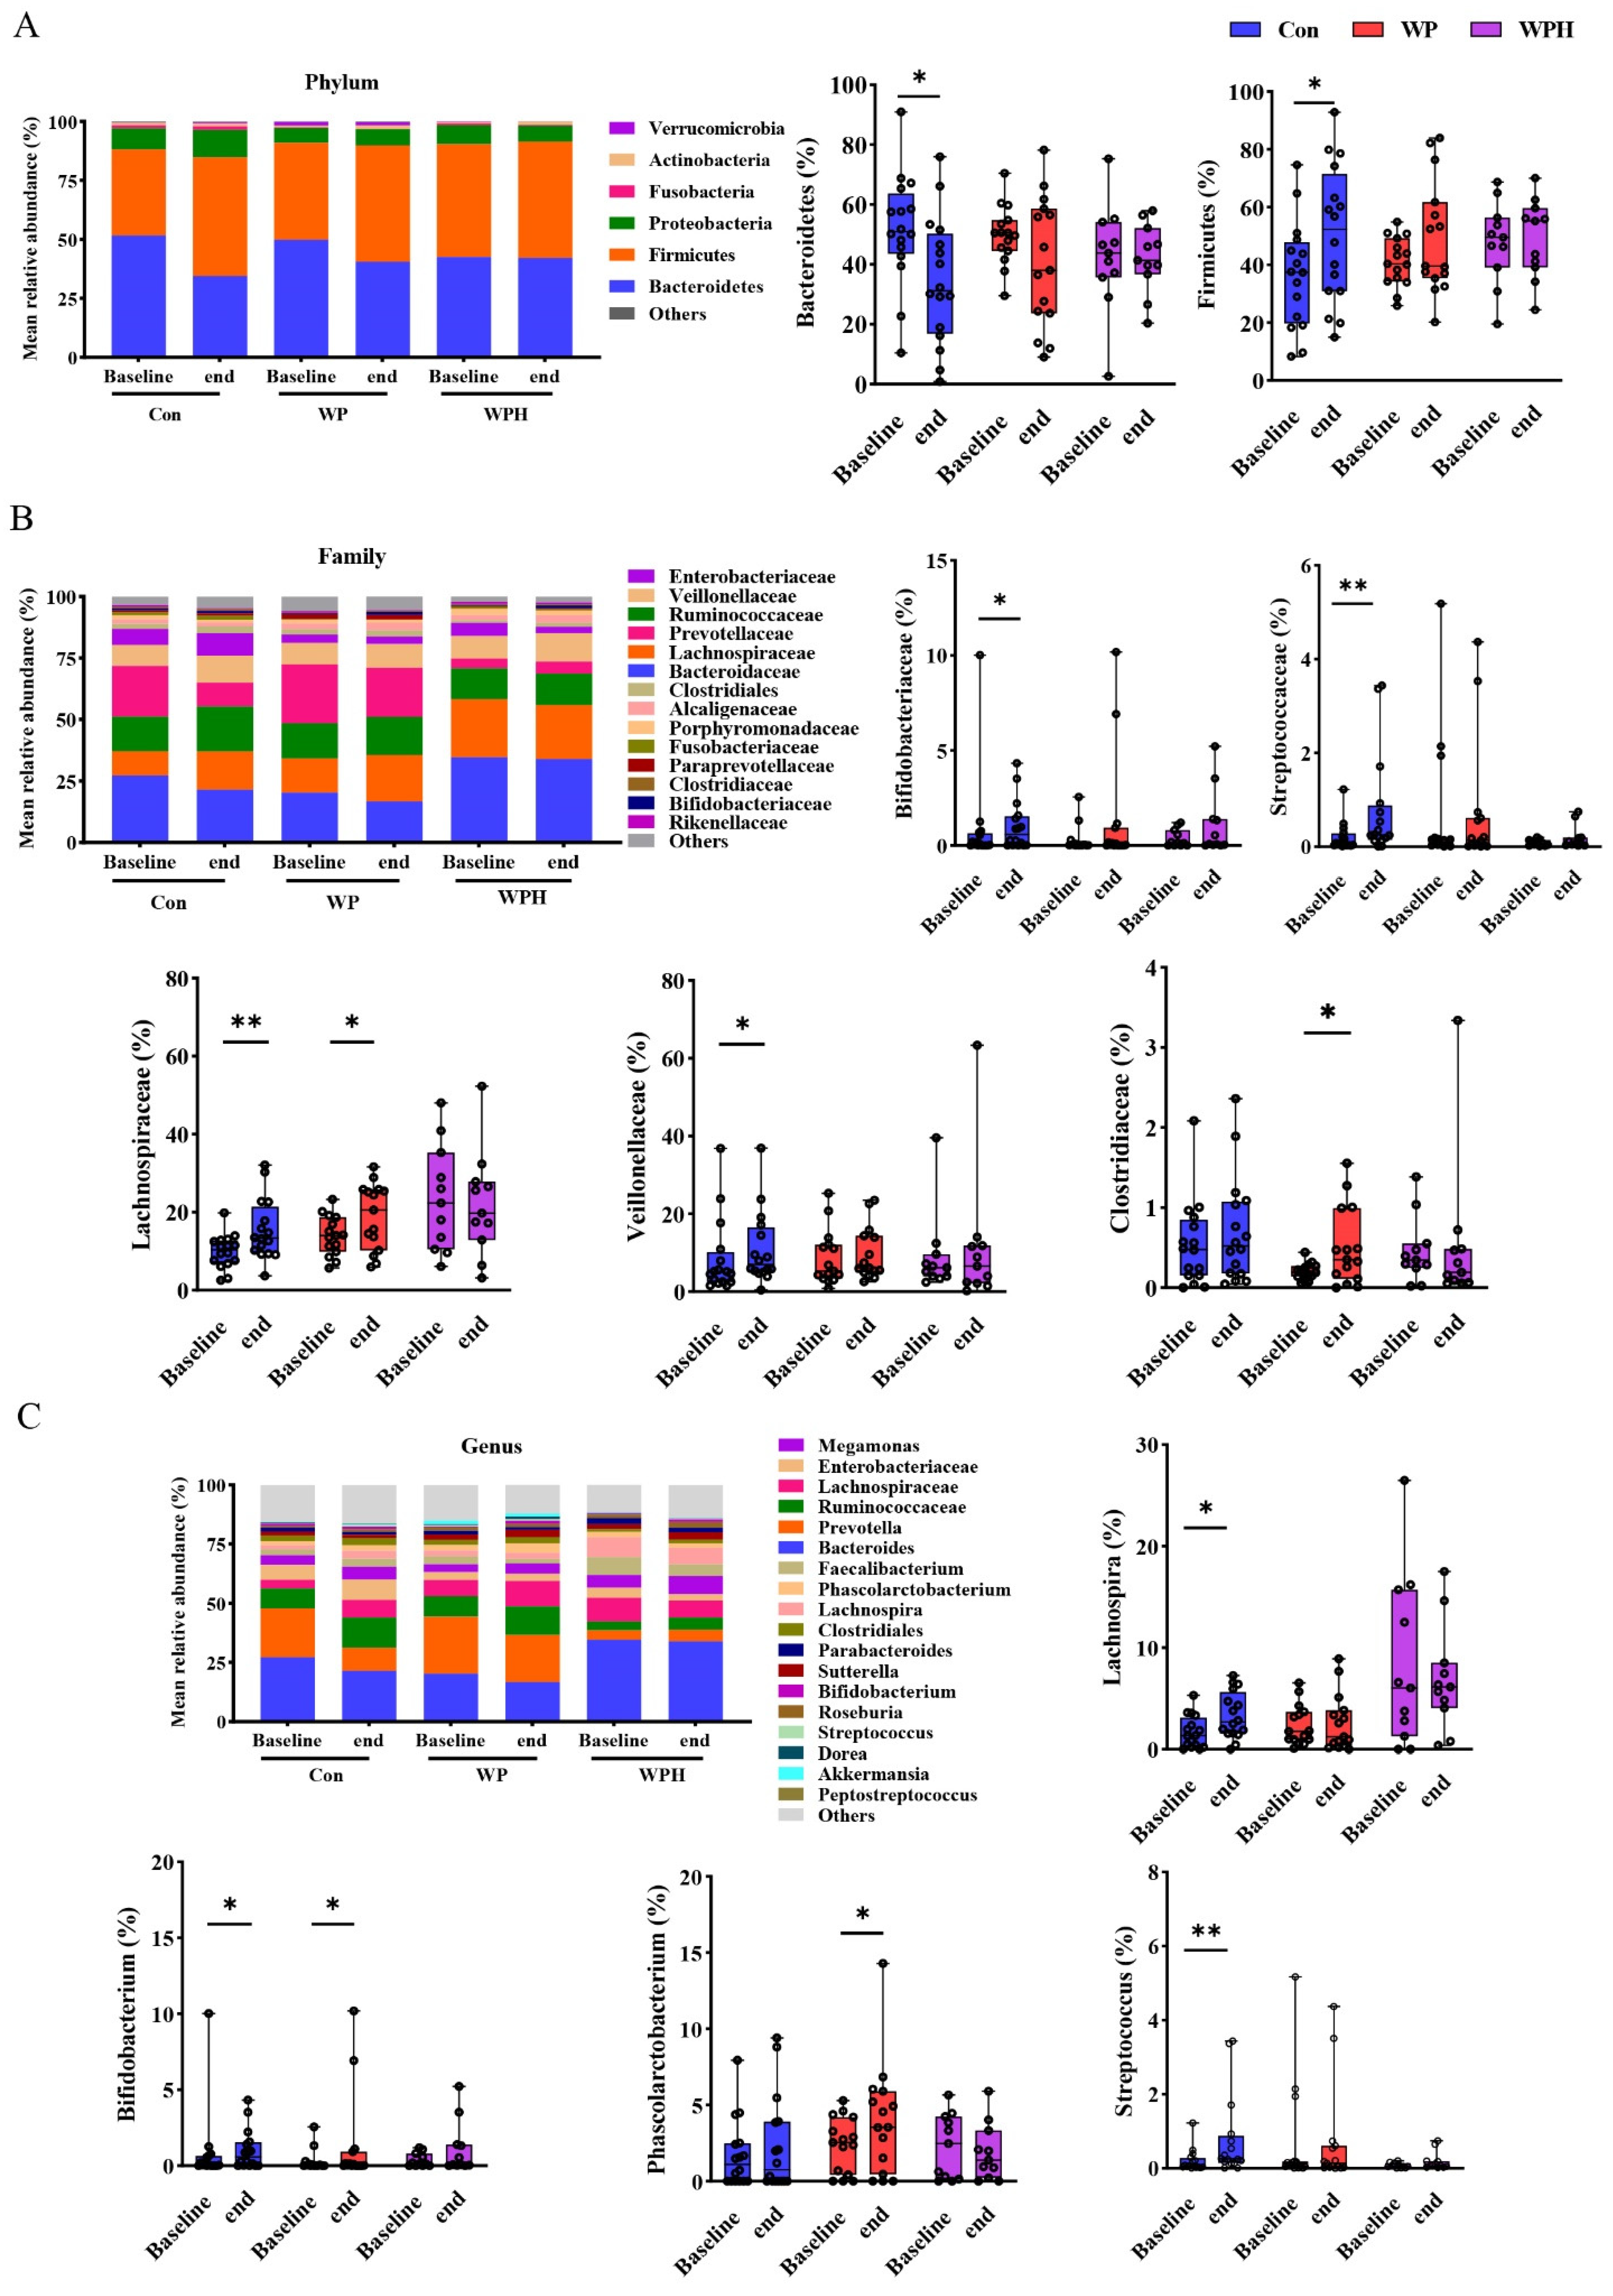
2.8. Gut Microbiota Analysis
2.9. Statistical Analysis
3. Results
4. Discussion
Supplementary Materials
Author Contributions
Funding
Institutional Review Board Statement
Informed Consent Statement
Data Availability Statement
Conflicts of Interest
References
- Pan, X.-F.; Wang, L.; Pan, A. Epidemiology and determinants of obesity in China. Lancet Diabetes Endocrinol. 2021, 9, 373–392. [Google Scholar] [CrossRef]
- Coker, R.H.; Miller, S.; Schutzler, S.; Deutz, N.; Wolfe, R.R. Whey protein and essential amino acids promote the reduction of adipose tissue and increased muscle protein synthesis during caloric restriction-induced weight loss in elderly, obese individuals. Nutr. J. 2012, 11, 105. [Google Scholar] [CrossRef] [PubMed] [Green Version]
- Oikawa, S.Y.; Kamal, M.J.; Webb, E.K.; McGlory, C.; Baker, S.K.; Phillips, S.M. Whey protein but not collagen peptides stimulate acute and longer-term muscle protein synthesis with and without resistance exercise in healthy older women: A randomized controlled trial. Am. J. Clin. Nutr. 2020, 111, 708–718. [Google Scholar] [CrossRef]
- Longland, T.M.; Oikawa, S.Y.; Mitchell, C.J.; Devries, M.C.; Phillips, S.M. Higher compared with lower dietary protein during an energy deficit combined with intense exercise promotes greater lean mass gain and fat mass loss: A randomized trial. Am. J. Clin. Nutr. 2016, 103, 738–746. [Google Scholar] [CrossRef] [Green Version]
- Wright, C.S.; Zhou, J.; Sayer, R.D.; Kim, J.E.; Campbell, W.W. Effects of a High-Protein Diet Including Whole Eggs on Muscle Composition and Indices of Cardiometabolic Health and Systemic Inflammation in Older Adults with Overweight or Obesity: A Randomized Controlled Trial. Nutrients 2018, 10, 946. [Google Scholar] [CrossRef] [PubMed] [Green Version]
- Kim, J.E.; O’Connor, L.E.; Sands, L.P.; Slebodnik, M.B.; Campbell, W.W. Effects of dietary protein intake on body composition changes after weight loss in older adults: A systematic review and meta-analysis. Nutr. Rev. 2016, 74, 210–224. [Google Scholar] [CrossRef] [PubMed] [Green Version]
- Sammarco, R.; Marra, M.; Di Guglielmo, M.L.; Naccarato, M.; Contaldo, F.; Poggiogalle, E.; Donini, L.M.; Pasanisi, F. Evaluation of Hypocaloric Diet with Protein Supplementation in Middle-Aged Sarcopenic Obese Women: A Pilot Study. Obes. Facts 2017, 10, 160–167. [Google Scholar] [CrossRef] [Green Version]
- Putra, C.; Konow, N.; Gage, M.; York, C.G.; Mangano, K.M. Protein Source and Muscle Health in Older Adults: A Literature Review. Nutrients 2021, 13, 743. [Google Scholar] [CrossRef]
- Lee, J. Nutrition: A Survey on Intake of Protein Supplement of University Students Majoring in Physical Education. J. Korean Soc. Food Sci. Nutr. 2014, 43, 1607–1613. [Google Scholar] [CrossRef] [Green Version]
- Cox, A.J.; West, N.P.; Cripps, A.W. Obesity, inflammation, and the gut microbiota. Lancet Diabetes Endocrinol. 2015, 3, 207–215. [Google Scholar] [CrossRef]
- Rothschild, D.; Weissbrod, O.; Barkan, E.; Kurilshikov, A.; Korem, T.; Zeevi, D.; Costea, P.I.; Godneva, A.; Kalka, I.N.; Bar, N.; et al. Environment dominates over host genetics in shaping human gut microbiota. Nature 2018, 555, 210–215. [Google Scholar] [CrossRef] [PubMed]
- Beaumont, M.; Portune, K.J.; Steuer, N.; Lan, A.; Cerrudo, V.; Audebert, M.; Dumont, F.; Mancano, G.; Khodorova, N.; Andriamihaja, M.; et al. Quantity and source of dietary protein influence metabolite production by gut microbiota and rectal mucosa gene expression: A randomized, parallel, double-blind trial in overweight humans. Am. J. Clin. Nutr. 2017, 106, 1005–1019. [Google Scholar] [CrossRef] [Green Version]
- Geidenstam, N.; Al-Majdoub, M.; Ekman, M.; Spegel, P.; Ridderstrale, M. Metabolite profiling of obese individuals before and after a one year weight loss program. Int. J. Obes. 2017, 41, 1369–1378. [Google Scholar] [CrossRef] [PubMed]
- Stroeve, J.H.; Saccenti, E.; Bouwman, J.; Dane, A.; Strassburg, K.; Vervoort, J.; Hankemeier, T.; Astrup, A.; Smilde, A.K.; van Ommen, B.; et al. Weight loss predictability by plasma metabolic signatures in adults with obesity and morbid obesity of the DiOGenes study. Obesity 2016, 24, 379–388. [Google Scholar]
- Pedersen, H.K.; Gudmundsdottir, V.; Nielsen, H.B.; Hyotylainen, T.; Nielsen, T.; Jensen, B.A.; Forslund, K.; Hildebrand, F.; Prifti, E.; Falony, G.; et al. Human gut microbes impact host serum metabolome and insulin sensitivity. Nature 2016, 535, 376–381. [Google Scholar] [CrossRef]
- Chen, W. Chinese Guidelines for Medical Nutrition treatment of Overweight/Obesity (2021). Asia Pac. J. Clin. Nutr. 2021, 13, 55. [Google Scholar]
- Washburn, R.A.; Smith, K.W.; Jette, A.M.; Janney, C.A. The Physical Activity Scale for the Elderly (PASE): Development and evaluation. J. Clin. Epidemiol. 1993, 46, 153–162. [Google Scholar] [CrossRef]
- Wan, C.; Zhu, C.; Jin, G.; Zhu, M.; Hua, J.; He, Y. Analysis of gut microbiota in patients with coronary artery disease and hypertension. Evid.-Based Complementary Altern. Med. 2021, 2021, 7195082. [Google Scholar] [CrossRef]
- Oikawa, S.Y.; McGlory, C.; D’Souza, L.K.; Morgan, A.K.; Saddler, N.I.; Baker, S.K.; Parise, G.; Phillips, S.M. A randomized controlled trial of the impact of protein supplementation on leg lean mass and integrated muscle protein synthesis during inactivity and energy restriction in older persons. Am. J. Clin. Nutr. 2018, 108, 1060–1068. [Google Scholar] [CrossRef] [PubMed] [Green Version]
- Verreijen, A.M.; Verlaan, S.; Engberink, M.F.; Swinkels, S.; de Vogel-van den Bosch, J.; Weijs, P.J. A high whey protein-, leucine-, and vitamin D-enriched supplement preserves muscle mass during intentional weight loss in obese older adults: A double-blind randomized controlled trial. Am. J. Clin. Nutr. 2015, 101, 279–286. [Google Scholar] [CrossRef] [PubMed] [Green Version]
- Xu, J.Y.; Qin, L.Q.; Wang, P.Y.; Li, W.; Chang, C. Effect of milk tripeptides on blood pressure: A meta-analysis of randomized controlled trials. Nutrition 2008, 24, 933–940. [Google Scholar] [CrossRef] [PubMed]
- Rakvaag, E.; Fuglsang-Nielsen, R.; Bach Knudsen, K.E.; Landberg, R.; Johannesson Hjelholt, A.; Sondergaard, E.; Hermansen, K.; Gregersen, S. Whey Protein Combined with Low Dietary Fiber Improves Lipid Profile in Subjects with Abdominal Obesity: A Randomized, Controlled Trial. Nutrients 2019, 11, 2091. [Google Scholar] [CrossRef] [PubMed]
- Zhang, J.W.; Tong, X.; Wan, Z.; Wang, Y.; Qin, L.Q.; Szeto, I.M. Effect of whey protein on blood lipid profiles: A meta-analysis of randomized controlled trials. Eur. J. Clin. Nutr. 2016, 70, 879–885. [Google Scholar] [CrossRef] [PubMed]
- Fuglsang-Nielsen, R.; Rakvaag, E.; Langdahl, B.; Knudsen, K.E.B.; Hartmann, B.; Holst, J.J.; Hermansen, K.; Gregersen, S. Effects of whey protein and dietary fiber intake on insulin sensitivity, body composition, energy expenditure, blood pressure, and appetite in subjects with abdominal obesity. Eur. J. Clin. Nutr. 2021, 75, 611–619. [Google Scholar] [CrossRef]
- Fekete, A.A.; Giromini, C.; Chatzidiakou, Y.; Givens, D.I.; Lovegrove, J.A. Whey protein lowers blood pressure and improves endothelial function and lipid biomarkers in adults with prehypertension and mild hypertension: Results from the chronic Whey2Go randomized controlled trial. Am. J. Clin. Nutr. 2016, 104, 1534–1544. [Google Scholar] [CrossRef] [Green Version]
- Frid, A.H.; Nilsson, M.; Holst, J.J.; Björck, I.M.E. Effect of whey on blood glucose and insulin responses to composite breakfast and lunch meals in type 2 diabetic subjects. Am. J. Clin. Nutr. 2005, 82, 69–75. [Google Scholar] [CrossRef]
- Zheng, Y.; Ceglarek, U.; Huang, T.; Li, L.; Rood, J.; Ryan, D.H.; Bray, G.A.; Sacks, F.M.; Schwarzfuchs, D.; Thiery, J.; et al. Weight-loss diets and 2-y changes in circulating amino acids in 2 randomized intervention trials. Am. J. Clin. Nutr. 2016, 103, 505–511. [Google Scholar] [CrossRef] [Green Version]
- Wang, Z.; Zhang, F.; Liu, W.; Sheng, N.; Sun, H.; Zhang, J. Impaired tricarboxylic acid cycle flux and mitochondrial aerobic respiration during isoproterenol induced myocardial ischemia is rescued by bilobalide. J. Pharm. Anal. 2021, 11, 764–775. [Google Scholar] [CrossRef]
- van der Kolk, B.W.; Saari, S.; Lovric, A.; Arif, M.; Alvarez, M.; Ko, A.; Miao, Z.; Sahebekhtiari, N.; Muniandy, M.; Heinonen, S.; et al. Molecular pathways behind acquired obesity: Adipose tissue and skeletal muscle multiomics in monozygotic twin pairs discordant for BMI. Cell Rep. Med. 2021, 2, 100226. [Google Scholar] [CrossRef]
- Piccolo, B.D.; Comerford, K.B.; Karakas, S.E.; Knotts, T.A.; Fiehn, O.; Adams, S.H. Whey protein supplementation does not alter plasma branched-chained amino acid profiles but results in unique metabolomics patterns in obese women enrolled in an 8-week weight loss trial. J. Nutr. 2015, 145, 691–700. [Google Scholar] [CrossRef] [Green Version]
- Valdes, A.M.; Walter, J.; Segal, E.; Spector, T.D. Role of the gut microbiota in nutrition and health. BMJ 2018, 361, k2179. [Google Scholar] [CrossRef] [PubMed] [Green Version]
- Jackson, M.A.; Verdi, S.; Maxan, M.E.; Shin, C.M.; Zierer, J.; Bowyer, R.C.E.; Martin, T.; Williams, F.M.K.; Menni, C.; Bell, J.T.; et al. Gut microbiota associations with common diseases and prescription medications in a population-based cohort. Nat. Commun. 2018, 9, 2655. [Google Scholar] [CrossRef] [PubMed]
- Dong, T.S.; Luu, K.; Lagishetty, V.; Sedighian, F.; Woo, S.L.; Dreskin, B.W.; Katzka, W.; Chang, C.; Zhou, Y.; Arias-Jayo, N.; et al. A High Protein Calorie Restriction Diet Alters the Gut Microbiome in Obesity. Nutrients 2020, 12, 3221. [Google Scholar] [CrossRef]
- Reimer, R.A.; Willis, H.J.; Tunnicliffe, J.M.; Park, H.; Madsen, K.L.; Soto-Vaca, A. Inulin-type fructans and whey protein both modulate appetite but only fructans alter gut microbiota in adults with overweight/obesity: A randomized controlled trial. Mol. Nutr. Food Res. 2017, 61, 1700484. [Google Scholar] [CrossRef] [PubMed]
- Moreno-Perez D, Bressa C, Bailen M, Hamed-Bousdar S, Naclerio F, Carmona M, Perez M, Gonzalez-Soltero R, Montalvo-Lominchar MG, Carabana C, Larrosa M: Effect of a Protein Supplement on the Gut Microbiota of Endurance Athletes: A Randomized, Controlled, Double-Blind Pilot Study. Nutrients 2018, 10, 337.
- Aslam, H.; Marx, W.; Rocks, T.; Loughman, A.; Chandrasekaran, V.; Ruusunen, A.; Dawson, S.L.; West, M.; Mullarkey, E.; Pasco, J.A.; et al. The effects of dairy and dairy derivatives on the gut microbiota: A systematic literature review. Gut Microbes 2020, 12, 1799533. [Google Scholar] [CrossRef]
- Boscaini, S.; Cabrera-Rubio, R.; Nychyk, O.; Roger Speakman, J.; Francis Cryan, J.; David Cotter, P.; Nilaweera, K.N. Age- and duration-dependent effects of whey protein on high-fat diet-induced changes in body weight, lipid metabolism, and gut microbiota in mice. Physiol. Rep. 2020, 8, e14523. [Google Scholar] [CrossRef]
- Boscaini, S.; Cabrera-Rubio, R.; Golubeva, A.; Nychyk, O.; Fulling, C.; Speakman, J.R.; Cotter, P.D.; Cryan, J.F.; Nilaweera, K.N. Depletion of the gut microbiota differentially affects the impact of whey protein on high-fat diet-induced obesity and intestinal permeability. Physiol. Rep. 2021, 9, e14867. [Google Scholar] [CrossRef]


| Characteristics | Total (n = 48) |
|---|---|
| Age (years) | 61.33 ± 7.73 |
| Body weight (kg) | 65.66 ± 5.15 |
| BMI (kg/m2) | 27.21 ± 1.61 |
| Energy intake (kcal) | 1458.17 ± 301.23 |
| Protein intake (g) | 44.15 (36.53, 53.03) |
| Carbohydrate intake (g) | 222.26 ± 52.20 |
| Fat intake (g) | 38.75 (33.78, 45.73) |
| PASE | 112.98 (89.53, 133.18) |
| Control | WP | WPH | |
|---|---|---|---|
| Energy-restricted diet | |||
| Protein (g) | 50.15 (45.99, 54.43) | 53.30 (48.35, 56.34) | 52.40 (50.38, 55.33) |
| Carbohydrate (g) | 137.91 (126.47, 149.67) | 146.58 (132.96, 154.93) | 144.10 (138.53, 152.14) |
| Fat (g) | 27.86 (25.55, 30.24) | 29.61 (26.86, 31.30) | 29.11 (27.99,30.74) |
| Energy (kcal) | 1003.00 (919.75, 1088.50) | 1066.00 (967.00, 1126.75) | 1048.00 (1007.50, 1106.50) |
| Intervention | |||
| Supplementary Protein (g) | 15.2 | 16.8 | |
| Total protein intake (g) | 50.15 (45.99, 54.43) | 68.50 (63.55, 71.53) ## | 69.24 (67.22, 72.17) ## |
| Protein (g)/weight (kg) | 0.78 ± 0.05 | 1.01 ± 0.07 ## | 1.08 ± 0.06 ## |
| Total energy intake (kcal) | 1003.00 (919.75, 1088.50) | 1126.80 (1027.80, 1187.55) ## | 1115.36 (1074.86, 1173.86) ## |
| Control | WP | WPH | |||||||
|---|---|---|---|---|---|---|---|---|---|
| Baseline | End | Change | Baseline | End | Change | Baseline | End | Change | |
| Body weight (kg) | 64.67 ± 4.00 | 63.57 ± 4.14 ** | −1.11 ± 1.11 | 67.93 ± 4.58 | 66.44 ± 4.35 ** | −1.49 ± 1.06 | 64.34 ± 6.41 | 62.00 ± 6.26 ** | −2.34 ± 1.35 # |
| BMI (kg/m2) | 27.38 ± 1.37 | 26.92 ± 1.54 ** | −0.46 ± 0.45 | 27.72 ± 1.71 | 27.13 ± 1.83 ** | −0.59 ± 0.42 | 26.41 ± 1.57 | 25.44 ± 1.62 ** | −0.97 ± 0.54 # |
| Body fat (kg) | 23.83 ± 2.92 | 23.13 ± 2.91 ** | −0.70 ± 0.92 | 25.51 ± 2.78 | 24.04 ± 2.89 ** | −1.46 ± 1.16 | 24.71 ± 3.49 | 22.26 ± 3.12 ** | −2.45 ± 1.65 ## |
| Body fat (%) | 36.45 (33.80, 39.70) | 36.85 (35.00, 38.70) | −0.83 (−1.40, 0.60) | 38.00 (34.53, 39.70) | 36.50 (33.50, 37.75) ** | −1.25 (−2.48, −0.72) | 38.00 (35.93, 40.70) | 35.70 (33.63, 38.83) ** | −2.55 (−3.63, −0.80) # |
| Visceral fat area (cm2) | 113.36 ± 21.31 | 109.48 ± 22.42 | −3.88 ± 8.72 | 121.82 ± 16.55 | 112.41 ± 18.73 ** | −9.41 ± 8.32 | 122.52 ± 23.72 | 107.21 ± 22.78 ** | −15.31 ± 10.11 ## |
| Fat-Free Mass (kg) | 40.85 ± 3.14 | 40.44 ± 3.25 | −0.41 ± 1.04 | 42.42 ± 3.61 | 42.39 ± 3.72 | −0.03 ± 1.11 | 39.64 ± 4.28 | 39.74 ± 4.58 | 0.11 ± 0.84 |
| Control | WP | WPH | |||||||
|---|---|---|---|---|---|---|---|---|---|
| Baseline | End | Change | Baseline | End | Change | Baseline | End | Change | |
| SBP (mmHg) | 133.00 (123.00, 151.00) | 130.25 (125.80, 135.33) | 1.00 (−11.00, 10.67) | 133.50 (125.00, 147.50) | 130.80 (127.50, 136.00) | −1.30 (−10.00, 2.50) | 132.75 (129.00, 140.25) | 122.67 (119.33, 127.50) ** | −9.75 (−13.75, −6.00) |
| DBP (mmHg) | 80.00 (76.00, 84.50) | 79.60 (75.33, 85.00) | 0.40 (−4.25, 4.25) | 83.00 (75.00, 88.67) | 85.20 (80.00, 87.33) | 1.67 (−5.50, 9.33) | 85.00 (79.60, 92.50) | 80.17 (74.00, 81.50) | −3.00 (−16.50, 1.00) |
| FBG (mmol/L) | 5.20 (4.99, 5.88) | 5.34 (5.12, 5.98) | 0.05 (−3.00, 4.33) | 5.08 (4.82, 5.29) | 5.13 (4.96, 5.56) * | 0.20 (0.03, 0.38) | 5.76 (5.59, 6.06) | 5.66 (5.29, 6.03) | 0.05 (−0.35, 0.26) |
| FINS (pmol/L) | 55.65 (43.47, 88.15) | 48.41 (35.54, 77.58) | −10.18 (−17.49, 11.07) | 64.85 (51.07, 95.44) | 83.26 (66.98, 104.90) * | 10.60 (−7.21, 26.54) | 74.39 (45.62, 98.56) | 58.88 (44.44, 69.35) | −9.18 (−32.53, 9.32) |
| HOMA-IR | 1.91 (1.41, 2.96) | 1.52 (1.22, 2.65) | −0.39 (−0.64, 0.30) | 2.05 (1.89, 3.15) | 2.80 (2.21, 3.76) * | 0.46 (0.03, 0.84) | 2.75 (1.72, 3.58) | 2.26 (1.51, 2.31) | −0.48 (−1.12, 0.33) & |
| TC (mmol/L) | 4.90 (4.32, 5.70) | 4.82 (4.40, 5.63) | 0.02 (−0.69, 0.55) | 5.13 (4.61, 5.70) | 5.05 (4.38, 5.62) | −0.14 (−0.49, 0.04) | 5.43 (5.06, 6.13) | 5.74 (5.37, 6.13) | 0.26 (−0.37, 0.34) |
| TG (mmol/L) | 1.57 (1.05, 2.85) | 1.12 (0.72, 2.23) | −0.37 (−0.69, 0.04) | 1.78 (1.39, 2.20) | 1.62 (1.10, 1.88) ** | −0.27 (−0.49, −0.11) | 1.26 (1.05, 2.17) | 1.50 (1.09, 1.77) | −0.07 (−0.59, 0.27) |
| LDL-C (mmol/L) | 2.82 (2.33, 3.31) | 2.83 (2.40, 3.41) | 0.08 (−0.02, 0.26) | 3.32 (2.58, 3.49) | 3.17 (2.39, 3.71) | −0.08 (−0.43, 0.13) | 3.61 (2.67, 4.02) | 3.89 (2.94, 4.14) | 0.18 (−0.25, 0.34) |
| HDL-C (mmol/L) | 1.32 (1.13, 1.47) | 1.29 (1.14, 1.59) | 0.04 (−0.06, 0.11) | 1.25 (1.06, 1.39) | 1.30 (1.08, 1.38) | 0.01 (−0.07, 0.09) | 1.44 (1.20, 1.68) | 1.43 (1.30, 1.85) | 0.01 (−0.07, 0.23) |
| CRP (mg/L) | 0.86 (0.56, 1.76) | 0.91 (0.53, 1.66) | 0.01 (−0.44, 0.27) | 1.36 (0.82, 2.17) | 1.48 (1.15, 2.66) | 0.11 (−0.32, 0.72) | 1.69 (0.74, 7.11) | 1.34 (0.69, 2.28) | −0.24 (−3.64, 0.15) |
| TNF-α (pg/mL) | 100.50 (87.84, 137.86) | 101.68 (88.61, 113.32) | 0.43 (−25.56, 18.58) | 86.93 (74.98, 99.35) | 84.62 (74.81, 105.72) | 0.59 (−11.78, 19.26) | 92.29 (81.41, 103.16) | 101.51 (87.54, 123.85) | 20.71 (−6.19, 31.57) |
| FFA (μg/mL) | 17.68 (12.54, 21.46) | 16.90 (12.03, 22.11) | −0.40 (−1.48, 1.24) | 14.88 (10.50, 21.44) | 15.03 (11.55, 23.50) | 0.47 (−2.07, 2.71) | 12.47 (9.73, 14.43) | 13.54 (11.10, 16.48) | 1.42 (−0.004, 3.87) |
| UA (μmol/L) | 267.05 (233.75, 348.63) | 274.75 (222.50, 330.45) | 3.60 (−32.25, 32.65) | 300.00 (275.00, 330.23) | 303.00 (249.80, 327.30) | 2.15 (−32.53, 23.00) | 316.75 (280.93, 354.70) | 301.60 (276.43, 334.90) | −16.45 (−49.83, 17.40) |
Publisher’s Note: MDPI stays neutral with regard to jurisdictional claims in published maps and institutional affiliations. |
© 2022 by the authors. Licensee MDPI, Basel, Switzerland. This article is an open access article distributed under the terms and conditions of the Creative Commons Attribution (CC BY) license (https://creativecommons.org/licenses/by/4.0/).
Share and Cite
Sun, Y.; Ling, C.; Liu, L.; Zhang, J.; Wang, J.; Tong, X.; Hidayat, K.; Chen, M.; Chen, X.; Zhou, H.; et al. Effects of Whey Protein or Its Hydrolysate Supplements Combined with an Energy-Restricted Diet on Weight Loss: A Randomized Controlled Trial in Older Women. Nutrients 2022, 14, 4540. https://doi.org/10.3390/nu14214540
Sun Y, Ling C, Liu L, Zhang J, Wang J, Tong X, Hidayat K, Chen M, Chen X, Zhou H, et al. Effects of Whey Protein or Its Hydrolysate Supplements Combined with an Energy-Restricted Diet on Weight Loss: A Randomized Controlled Trial in Older Women. Nutrients. 2022; 14(21):4540. https://doi.org/10.3390/nu14214540
Chicago/Turabian StyleSun, Yue, Chenjie Ling, Linsheng Liu, Jianwei Zhang, Jian Wang, Xing Tong, Khemayanto Hidayat, Mengting Chen, Xiaofang Chen, Hui Zhou, and et al. 2022. "Effects of Whey Protein or Its Hydrolysate Supplements Combined with an Energy-Restricted Diet on Weight Loss: A Randomized Controlled Trial in Older Women" Nutrients 14, no. 21: 4540. https://doi.org/10.3390/nu14214540