

Gout and Diet: A Comprehensive Review of Mechanisms and Management
Abstract
:1. Introduction
2. Role of Dietary Consumption in the Progression of Gouty Diseases
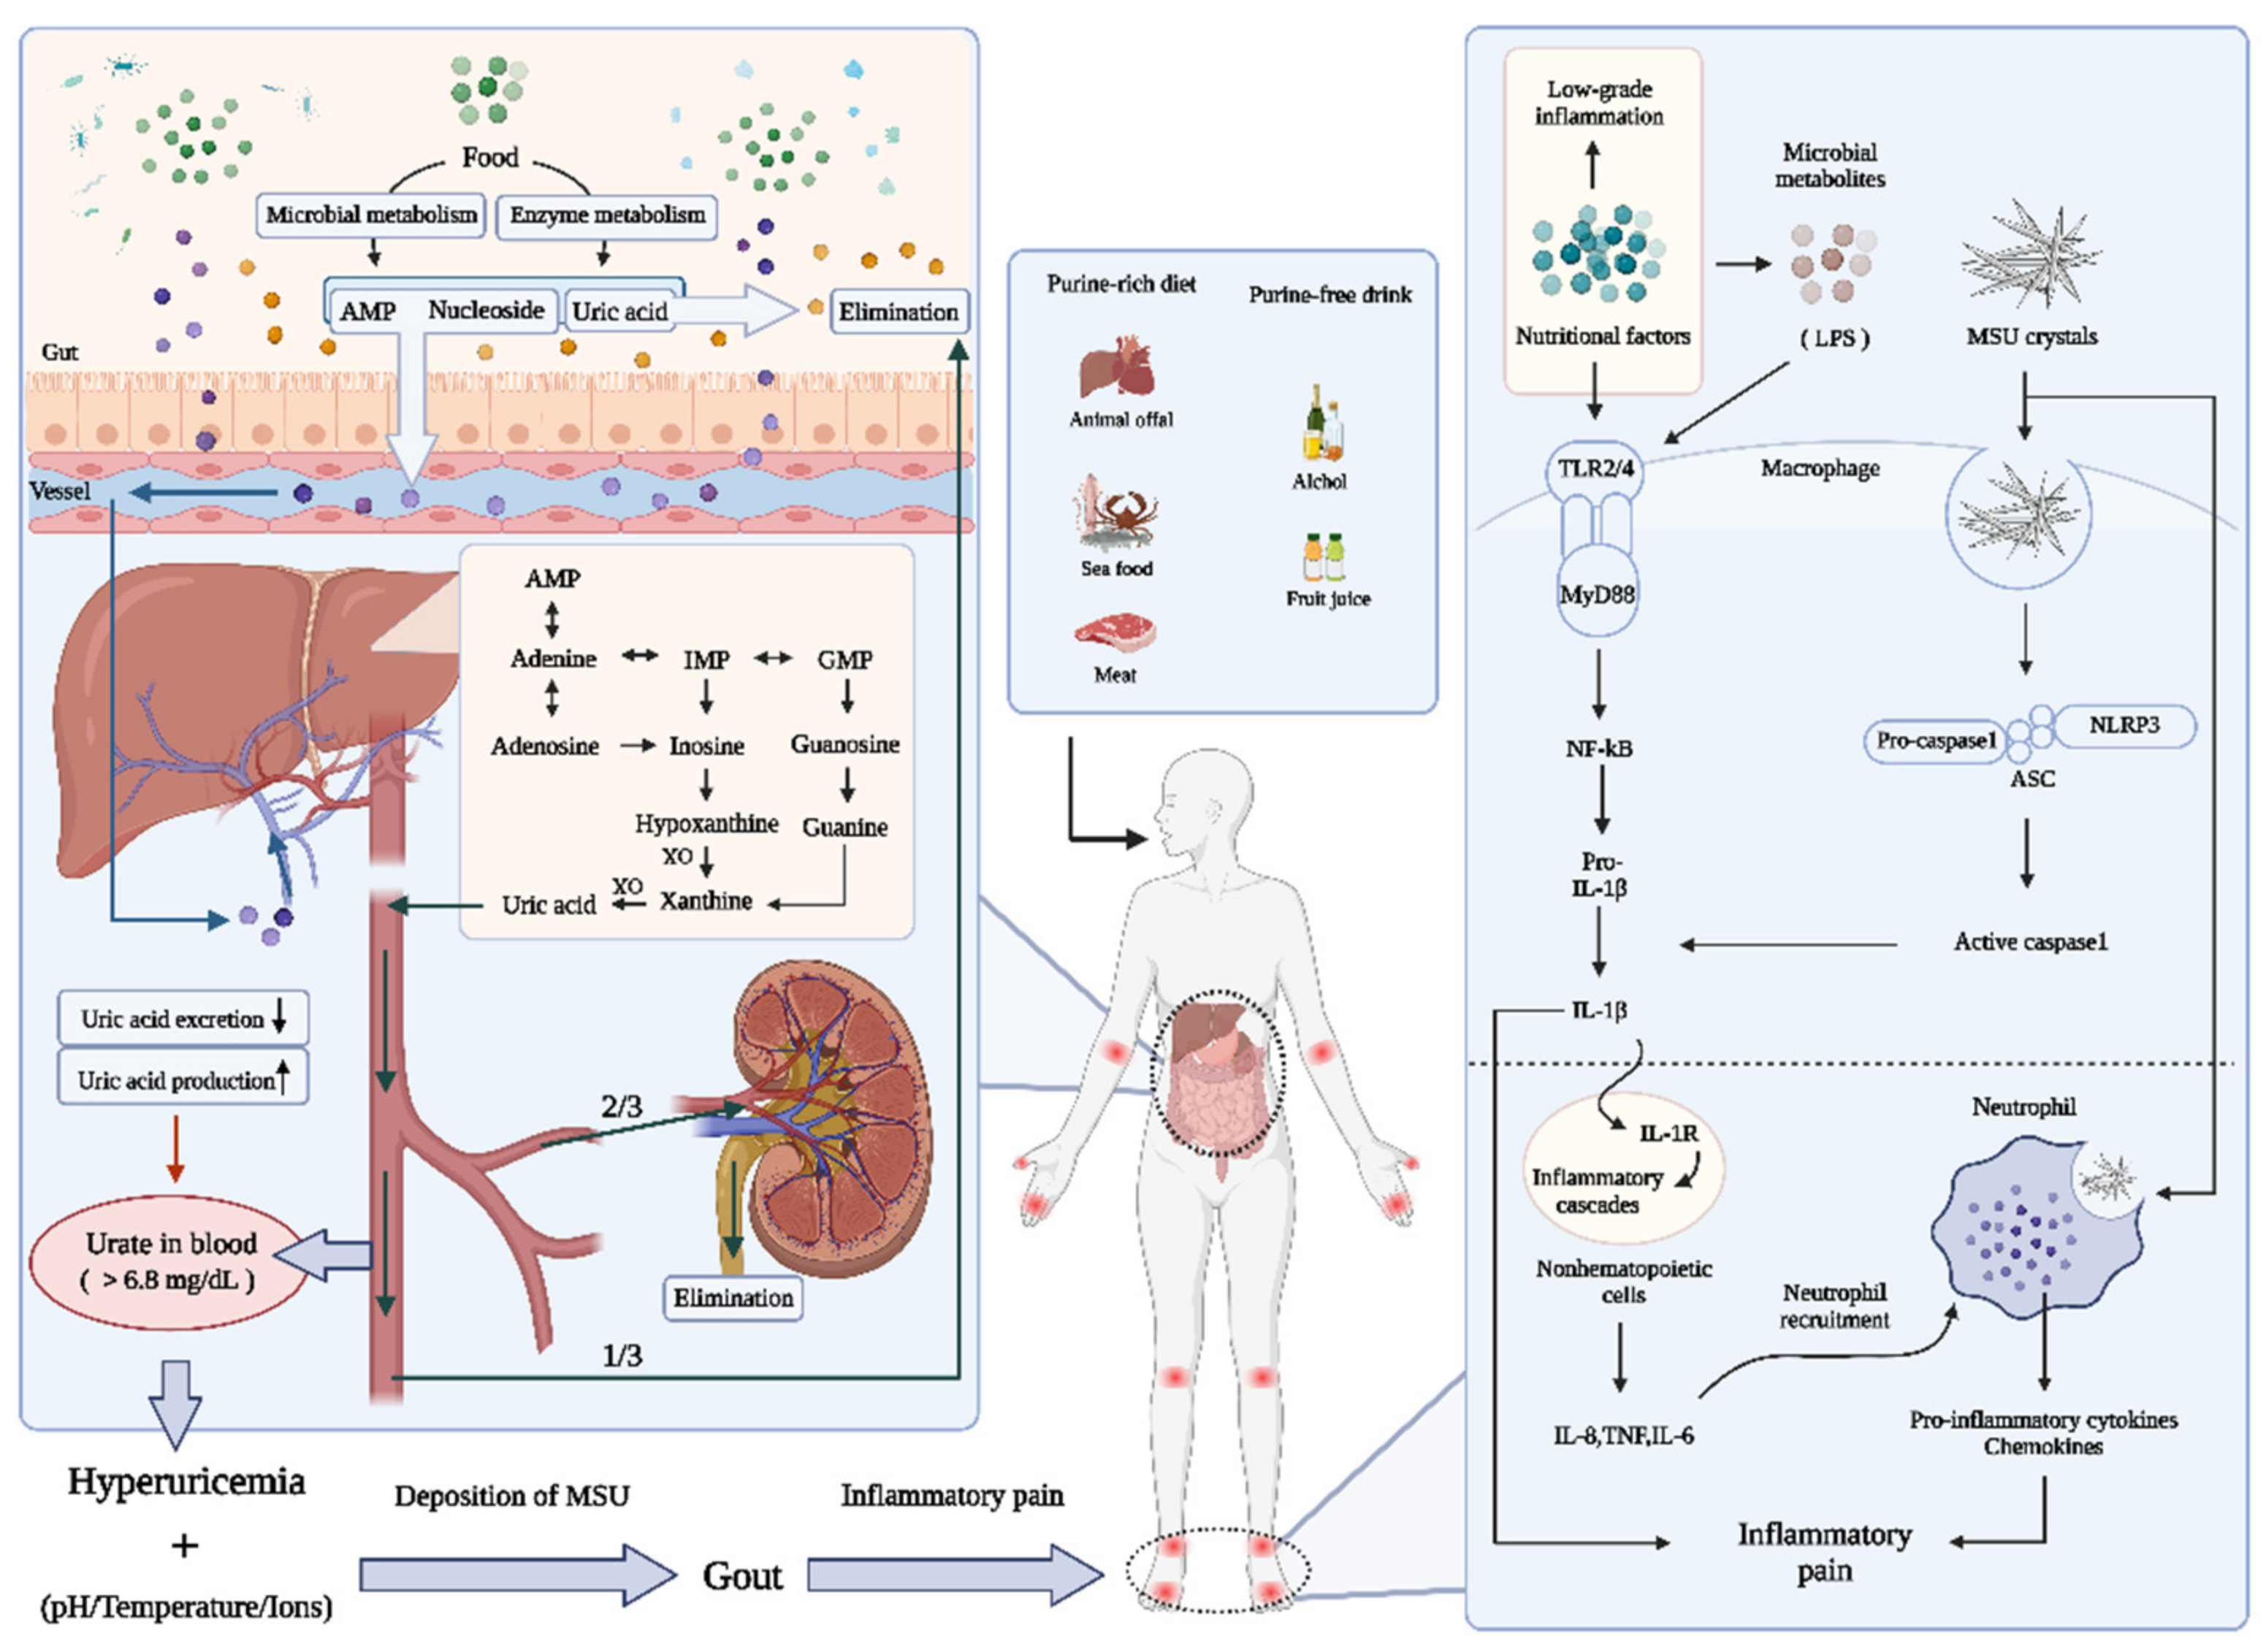
2.1. Uric Acid Disturbance: Emphasis on Purines
2.1.1. Formation of Uric Acid
2.1.2. The Excretion of Uric Acid
2.2. Uric Acid Disturbance: Emphasis on Purines
2.3. Gouty Inflammation
3. Nutrient Element-Richness and Structure Determine the Role of Dietary Factors in Gout
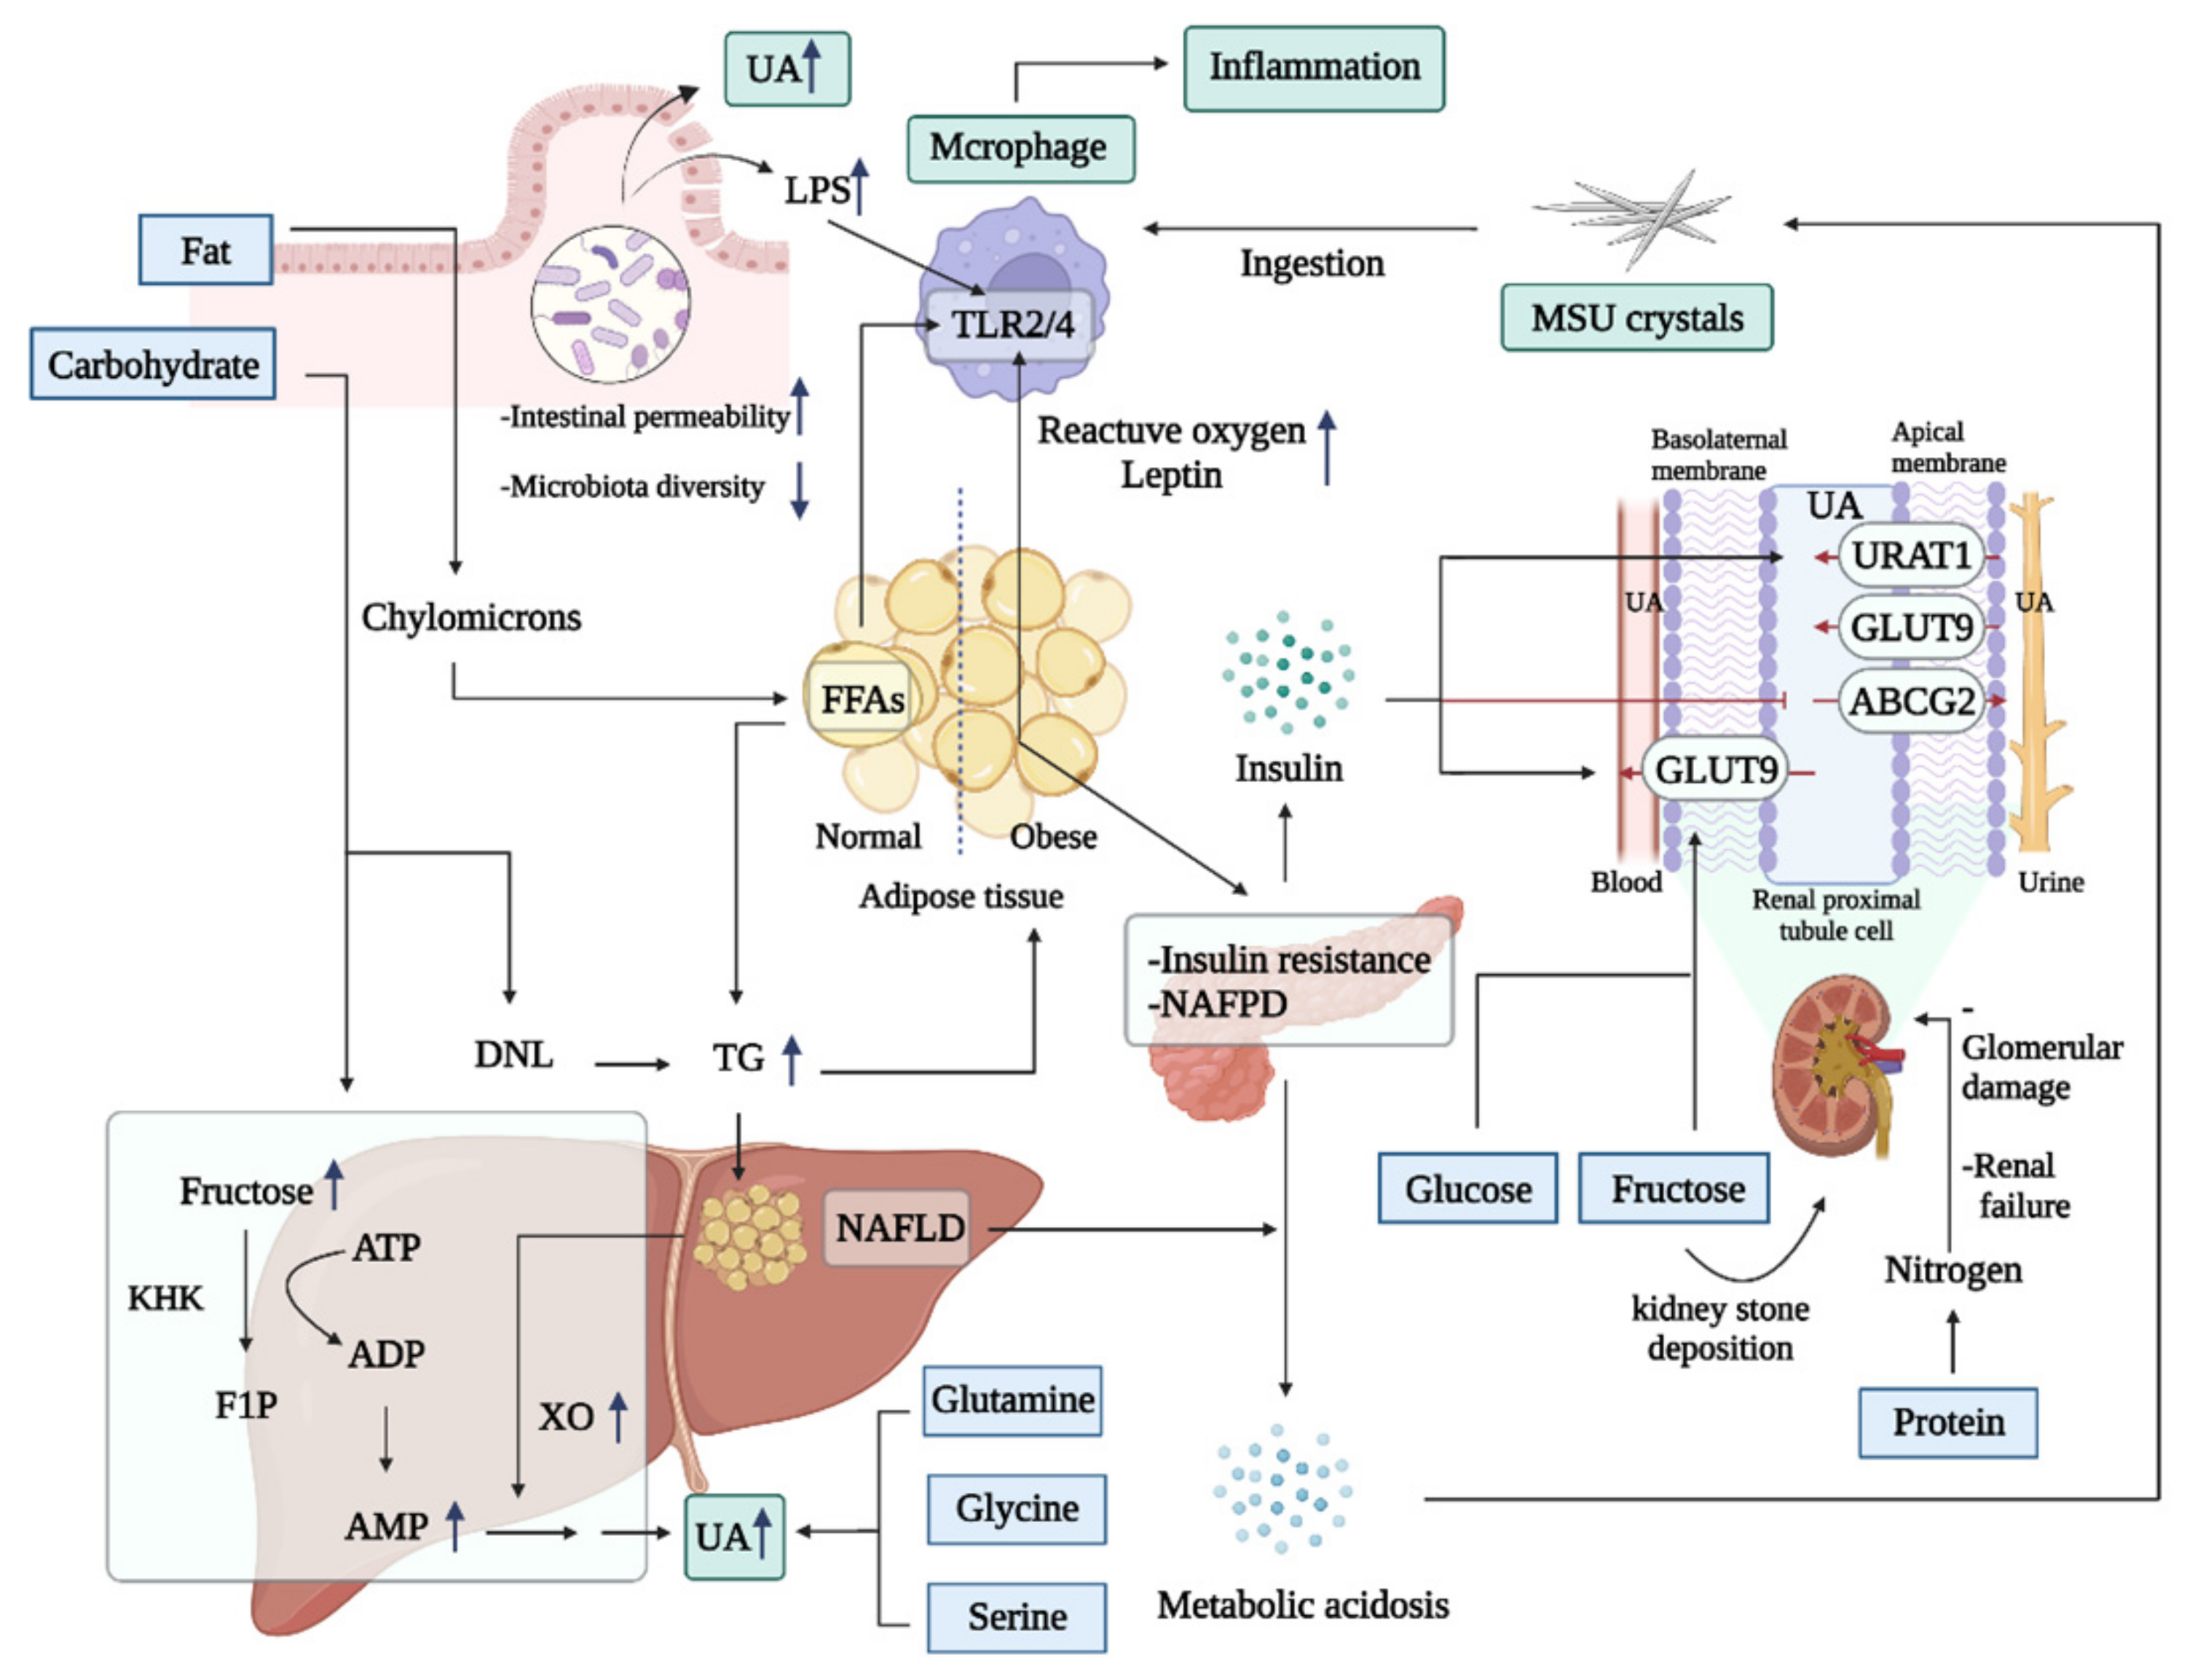
3.1. Energy-Type Nutrition Overload Can Induce Hyperuricemia and Inflammation
3.1.1. High Fat
3.1.2. High Sugar
3.1.3. High Protein
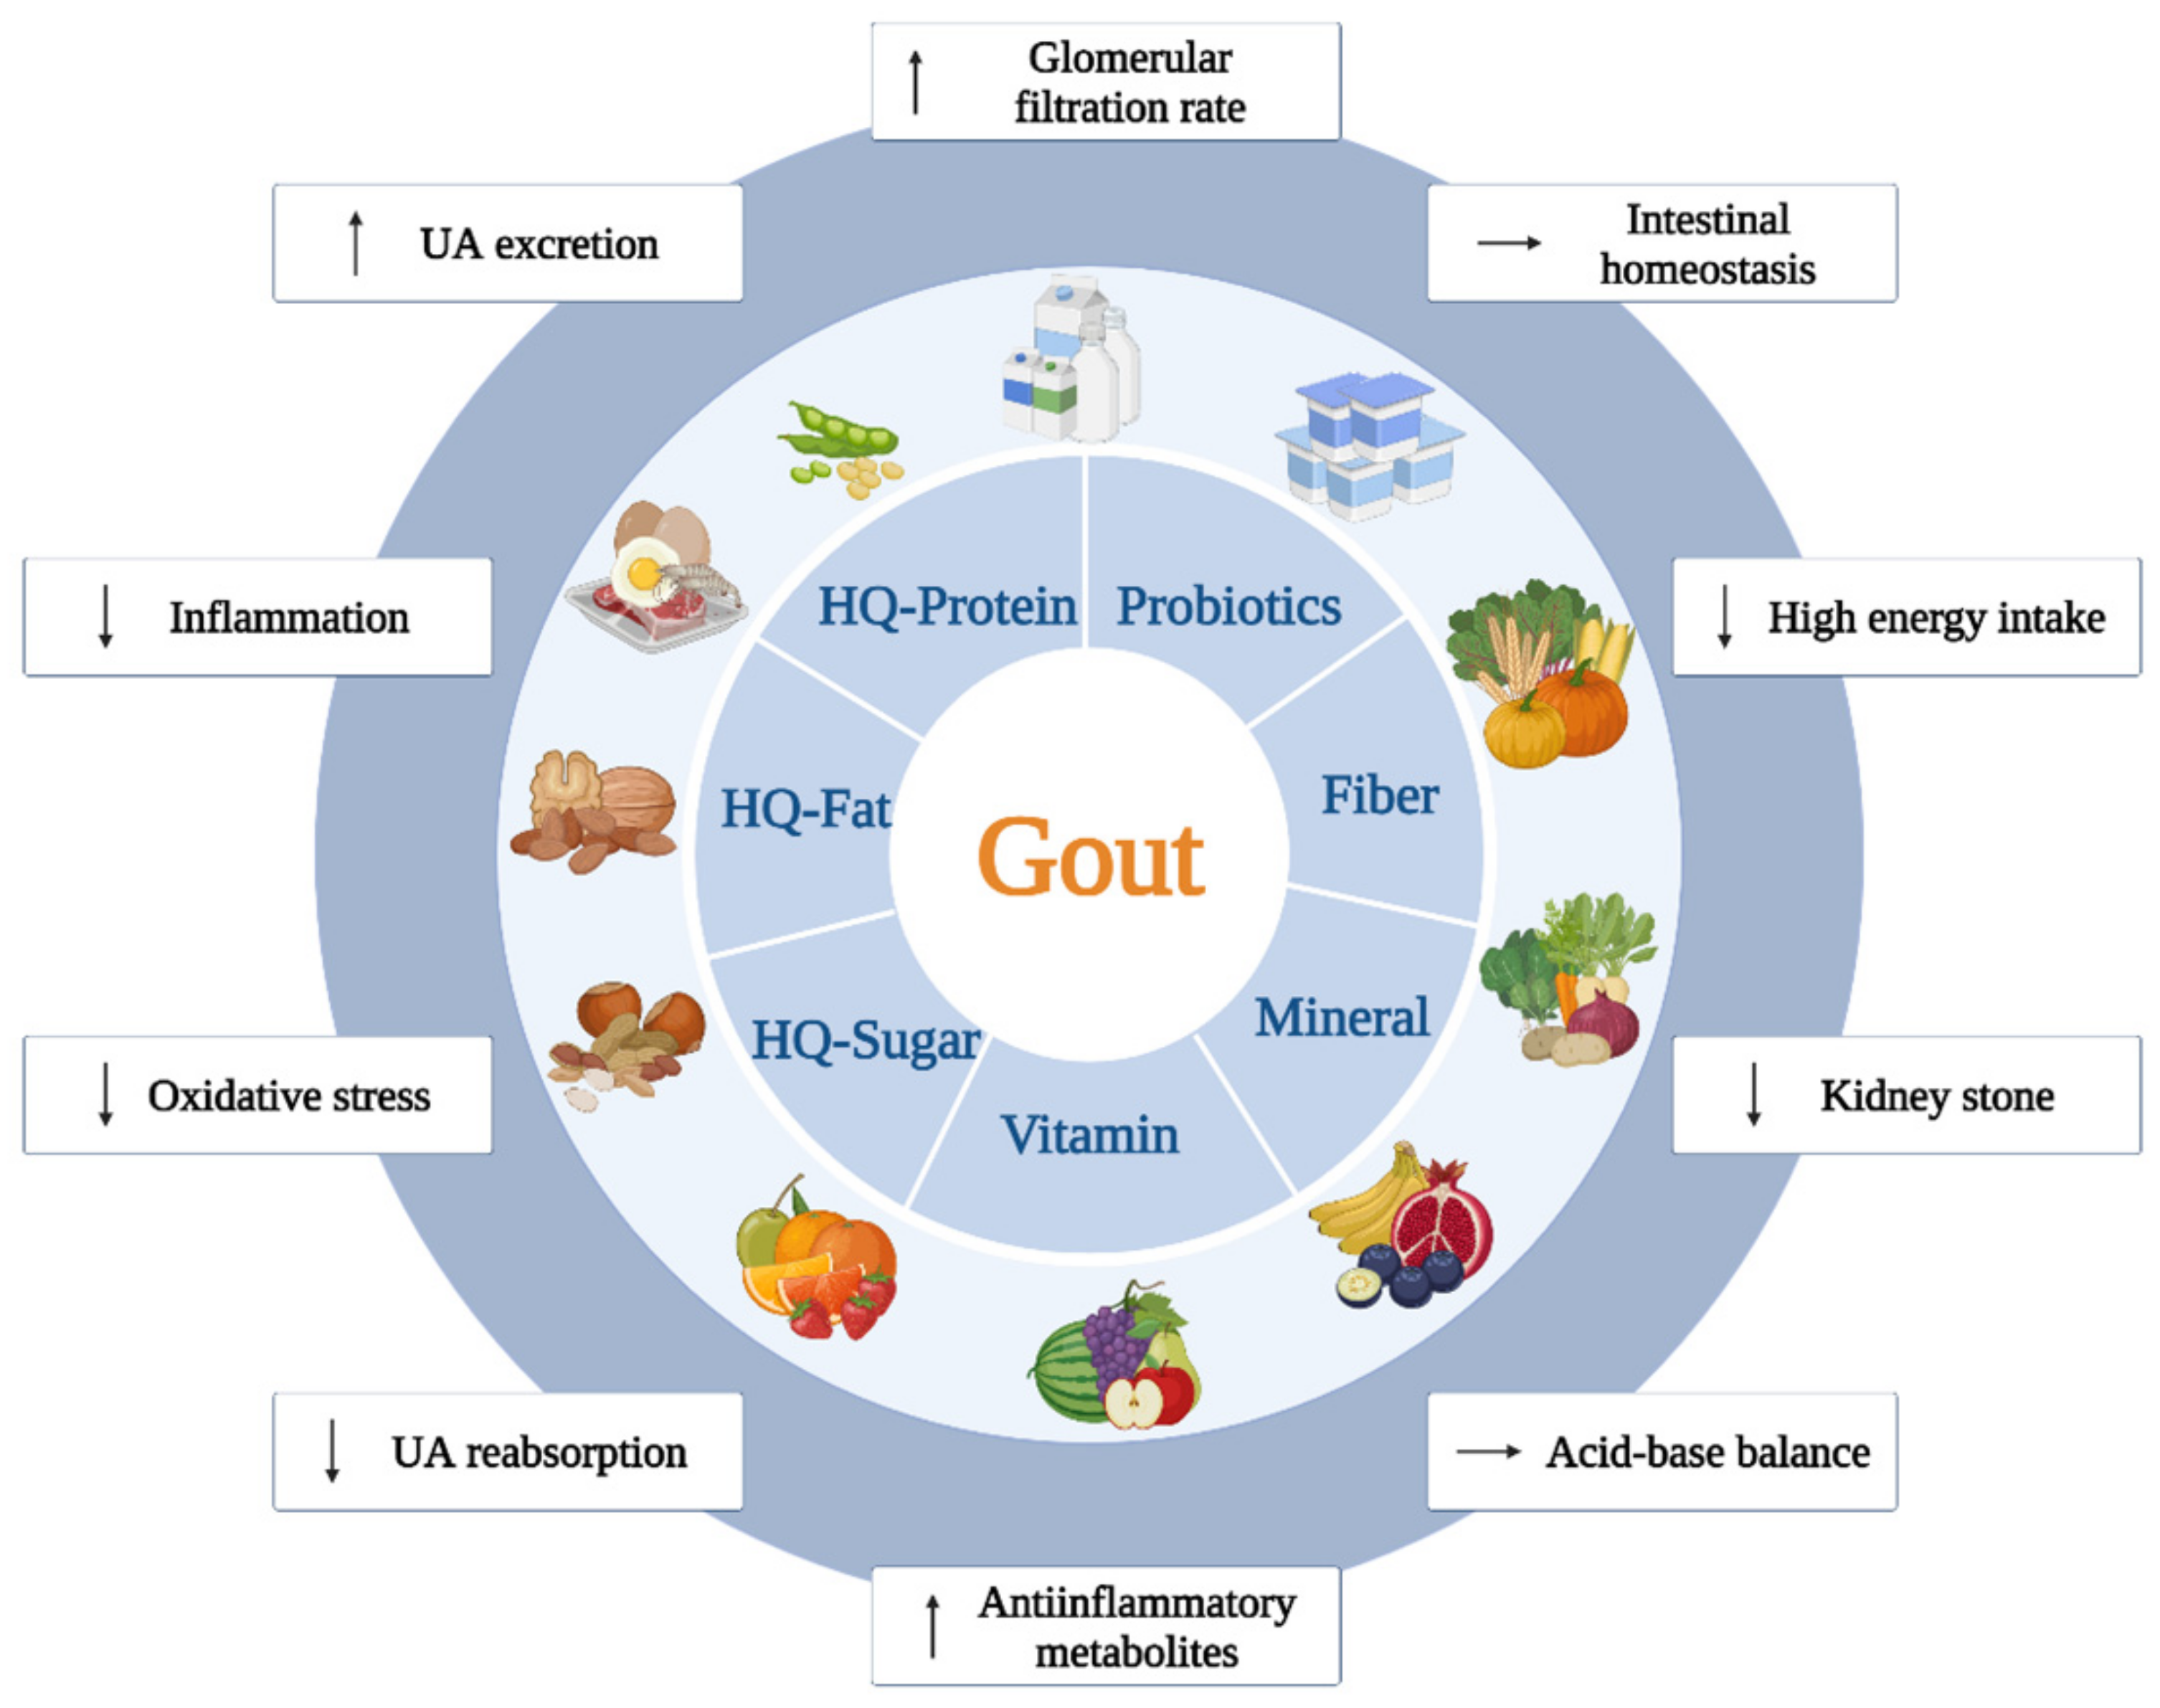
3.2. Adequate Consumption of Essential Nutritional Elements Leads to Beneficial Effects against Gout
3.2.1. Vitamins
3.2.2. Minerals
3.2.3. Fibers
4. Recommended Nutritional Management and Its Combination with Drug Therapy
5. Conclusions and Future Perspective
Author Contributions
Funding
Institutional Review Board Statement
Informed Consent Statement
Data Availability Statement
Acknowledgments
Conflicts of Interest
References
- Nuki, G.; Simkin, P.A. A concise history of gout and hyperuricemia and their treatment. Arthritis Res. Ther. 2006, 8 (Suppl. 1), S1. [Google Scholar] [CrossRef] [PubMed]
- Dehlin, M.; Jacobsson, L.; Roddy, E. Global epidemiology of gout: Prevalence, incidence, treatment patterns and risk factors. Nat. Rev. Rheumatol. 2020, 16, 380–390. [Google Scholar] [CrossRef] [PubMed]
- Taylor, W.J.; Fransen, J.; Jansen, T.L.; Dalbeth, N.; Schumacher, H.R.; Brown, M.; Louthrenoo, W.; Vazquez-Mellado, J.; Eliseev, M.; McCarthy, G.; et al. Study for Updated Gout Classification Criteria: Identification of Features to Classify Gout. Arthritis Care Res. 2015, 67, 1304–1315. [Google Scholar] [CrossRef] [PubMed]
- Bardin, T.; Richette, P. Definition of hyperuricemia and gouty conditions. Curr. Opin. Rheumatol. 2014, 26, 186–191. [Google Scholar] [CrossRef] [PubMed]
- Zhang, W.; Doherty, M.; Bardin, T.; Pascual, E.; Barskova, V.; Conaghan, P.; Gerster, J.; Jacobs, J.; Leeb, B.; Lioté, F.; et al. EULAR evidence based recommendations for gout. Part II: Management. Report of a task force of the EULAR Standing Committee For International Clinical Studies Including Therapeutics (ESCISIT). Ann. Rheum. Dis. 2006, 65, 1312–1324. [Google Scholar] [CrossRef]
- Bai, L.; Zhou, J.-B.; Zhou, T.; Newson, R.B.; Cardoso, M.A. Incident gout and weight change patterns: A retrospective cohort study of US adults. Arthritis Res. Ther. 2021, 23, 69. [Google Scholar] [CrossRef] [PubMed]
- Rho, Y.H.; Lu, N.; Peloquin, C.E.; Man, A.; Zhu, Y.; Zhang, Y.; Choi, H.K. Independent impact of gout on the risk of diabetes mellitus among women and men: A population-based, BMI-matched cohort study. Ann. Rheum. Dis. 2016, 75, 91–95. [Google Scholar] [CrossRef]
- Choi, H.K.; Atkinson, K.; Karlson, E.W.; Willett, W.; Curhan, G. Purine-Rich Foods, Dairy and Protein Intake, and the Risk of Gout in Men. N. Engl. J. Med. 2004, 350, 1093–1103. [Google Scholar] [CrossRef] [PubMed]
- Nielsen, S.M.; Zobbe, K.; Kristensen, L.E.; Christensen, R. Nutritional recommendations for gout: An update from clinical epidemiology. Autoimmun. Rev. 2018, 17, 1090–1096. [Google Scholar] [CrossRef]
- Danve, A.; Sehra, S.T.; Neogi, T. Role of diet in hyperuricemia and gout. Best Pr. Res. Clin. Rheumatol. 2021, 35, 101723. [Google Scholar] [CrossRef]
- Grimble, G.K. Dietary nucleotides and gut mucosal defence. Gut 1994, 35, S46–S51. [Google Scholar] [CrossRef] [PubMed]
- Yin, H.; Liu, N.; Chen, J. The Role of the Intestine in the Development of Hyperuricemia. Front. Immunol. 2022, 13, 845684. [Google Scholar] [CrossRef] [PubMed]
- Choi, H.K.; Mount, D.B.; Reginato, A.M. Pathogenesis of gout. Ann. Intern. Med. 2005, 143, 499–516. [Google Scholar] [CrossRef]
- Faller, J.; Fox, I.H. Ethanol-induced hyperuricemia: Evidence for increased urate production by activation of adenine nucleotide turnover. N. Engl. J. Med. 1982, 307, 1598–1602. [Google Scholar] [CrossRef] [PubMed]
- Chiaro, T.R.; Soto, R.; Stephens, W.Z.; Kubinak, J.L.; Petersen, C.; Gogokhia, L.; Bell, R.; Delgado, J.C.; Cox, J.; Voth, W.; et al. A member of the gut mycobiota modulates host purine metabolism exacerbating colitis in mice. Sci. Transl. Med. 2017, 9, eaaf9044. [Google Scholar] [CrossRef]
- Alvarez-Lario, B.; Macarron-Vicente, J. Uric acid and evolution. Rheumatology 2010, 49, 2010–2015. [Google Scholar] [CrossRef]
- Jain, N.; Walker, W.A. Diet and host–microbial crosstalk in postnatal intestinal immune homeostasis. Nat. Rev. Gastroenterol. Hepatol. 2014, 12, 14–25. [Google Scholar] [CrossRef] [PubMed]
- Toyoki, D.; Shibata, S.; Kuribayashi-Okuma, E.; Xu, N.; Ishizawa, K.; Hosoyamada, M.; Uchida, S. Insulin stimulates uric acid reabsorption via regulating urate transporter 1 and ATP-binding cassette subfamily G member 2. Am. J. Physiol. Physiol. 2017, 313, F826–F834. [Google Scholar] [CrossRef] [PubMed]
- Batt, C.; Phipps-Green, A.J.; Black, M.A.; Cadzow, M.; Merriman, M.E.; Topless, R.; Gow, P.; Harrison, A.; Highton, J.; Jones, P.; et al. Sugar-sweetened beverage consumption: A risk factor for prevalent gout with SLC2A9 genotype-specific effects on serum urate and risk of gout. Ann. Rheum. Dis. 2014, 73, 2101–2106. [Google Scholar] [CrossRef] [PubMed]
- Wan, Y.; Wang, F.; Yuan, J.; Li, J.; Jiang, D.; Zhang, J.; Li, H.; Wang, R.; Tang, J.; Huang, T.; et al. Effects of dietary fat on gut microbiota and faecal metabolites, and their relationship with cardiometabolic risk factors: A 6-month randomised controlled-feeding trial. Gut 2019, 68, 1417–1429. [Google Scholar] [CrossRef] [PubMed] [Green Version]
- Chu, Y.; Sun, S.; Huang, Y.; Gao, Q.; Xie, X.; Wang, P.; Li, J.; Liang, L.; He, X.; Jiang, Y.; et al. Metagenomic analysis revealed the potential role of gut microbiome in gout. NPJ Biofilms Microbiomes 2021, 7, 66. [Google Scholar] [CrossRef]
- Palmer, B.F.; Clegg, D.J. Starvation Ketosis and the Kidney. Am. J. Nephrol. 2021, 52, 467–478. [Google Scholar] [CrossRef]
- Dalbeth, N.; House, M.E.; Aati, O.; Tan, P.; Franklin, C.; Horne, A.; Gamble, G.D.; Stamp, L.K.; Doyle, A.J.; McQueen, F.M. Urate crystal deposition in asymptomatic hyperuricaemia and symptomatic gout: A dual energy CT study. Ann. Rheum. Dis. 2015, 74, 908–911. [Google Scholar] [CrossRef]
- Martillo, M.A.; Nazzal, L.; Crittenden, D.B. The Crystallization of Monosodium Urate. Curr. Rheumatol. Rep. 2013, 16, 400. [Google Scholar] [CrossRef]
- Wilcox, W.R.; Khalaf, A.A. Nucleation of monosodium urate crystals. Ann. Rheum. Dis. 1975, 34, 332–339. [Google Scholar] [CrossRef] [PubMed]
- Crișan, T.O.; Cleophas, M.C.P.; Oosting, M.; Lemmers, H.; Toenhake-Dijkstra, H.; Netea, M.G.; Jansen, T.L.; Joosten, L.A.B. Soluble uric acid primes TLR-induced proinflammatory cytokine production by human primary cells via inhibition of IL-1Ra. Ann. Rheum. Dis. 2016, 75, 755–762. [Google Scholar] [CrossRef] [PubMed]
- Terkeltaub, R. What makes gouty inflammation so variable? BMC Med. 2017, 15, 158. [Google Scholar] [CrossRef]
- Desai, J.; Steiger, S.; Anders, H.-J. Molecular Pathophysiology of Gout. Trends Mol. Med. 2017, 23, 756–768. [Google Scholar] [CrossRef] [PubMed]
- Saltiel, A.R.; Olefsky, J.M. Inflammatory mechanisms linking obesity and metabolic disease. J. Clin. Investig. 2017, 127, 1–4. [Google Scholar] [CrossRef]
- Yokose, C.; McCormick, N.; Lu, N.; Joshi, A.D.; Curhan, G.; Choi, H.K. Adherence to 2020 to 2025 Dietary Guidelines for Americans and the Risk of New-Onset Female Gout. JAMA Intern. Med. 2022, 182, 254–264. [Google Scholar] [CrossRef] [PubMed]
- Vieira, A.; Galvão, I.; Macia, L.; Sernaglia, M.; Vinolo, M.A.; Garcia, C.; Tavares, L.P.; Amaral, F.A.; Sousa, L.; Martins, F.; et al. Dietary fiber and the short-chain fatty acid acetate promote resolution of neutrophilic inflammation in a model of gout in mice. J. Leukoc. Biol. 2017, 101, 275–284. [Google Scholar] [CrossRef] [PubMed]
- Goldberg, E.L.; Asher, J.L.; Molony, R.D.; Shaw, A.C.; Zeiss, C.J.; Wang, C.; Morozova-Roche, L.A.; Herzog, R.I.; Iwasaki, A.; Dixit, V.D. β-Hydroxybutyrate Deactivates Neutrophil NLRP3 Inflammasome to Relieve Gout Flares. Cell Rep. 2017, 18, 2077–2087. [Google Scholar] [CrossRef] [PubMed]
- Belanger, M.J.; Wee, C.C.; Mukamal, K.J.; Miller, E.R.; Sacks, F.M.; Appel, L.J.; Shmerling, R.H.; Choi, H.K.; Juraschek, S.P. Effects of dietary macronutrients on serum urate: Results from the OmniHeart trial. Am. J. Clin. Nutr. 2021, 113, 1593–1599. [Google Scholar] [CrossRef] [PubMed]
- Rai, S.K.; Fung, T.T.; Lu, N.; Keller, S.F.; Curhan, G.C.; Choi, H.K. The Dietary Approaches to Stop Hypertension (DASH) diet, Western diet, and risk of gout in men: Prospective cohort study. BMJ 2017, 357, j1794. [Google Scholar] [CrossRef]
- Yang, Y.; Piao, W.; Huang, K.; Fang, H.; Ju, L.; Zhao, L.; Yu, D.; Ma, Y. Dietary Pattern Associated with the Risk of Hyperuricemia in Chinese Elderly: Result from China Nutrition and Health Surveillance 2015–2017. Nutrients 2022, 14, 844. [Google Scholar] [CrossRef] [PubMed]
- Retterstøl, K.; Svendsen, M.; Narverud, I.; Holven, K.B. Effect of low carbohydrate high fat diet on LDL cholesterol and gene expression in normal-weight, young adults: A randomized controlled study. Atherosclerosis 2018, 279, 52–61. [Google Scholar] [CrossRef] [PubMed]
- Juraschek, S.; Gelber, A.C.; Choi, H.K.; Appel, L.J.; Miller, E.R. Effects of the Dietary Approaches to Stop Hypertension (DASH) Diet and Sodium Intake on Serum Uric Acid. Arthritis Rheumatol. 2016, 68, 3002–3009. [Google Scholar] [CrossRef] [PubMed]
- Zhang, M.; Gao, Y.; Wang, X.; Liu, W.; Zhang, Y.; Huang, G. Comparison of the effect of high fruit and soybean products diet and standard diet interventions on serum uric acid in asymptomatic hyperuricemia adults: An open randomized controlled trial. Int. J. Food Sci. Nutr. 2016, 67, 335–343. [Google Scholar] [CrossRef] [PubMed]
- Wang, Y.; Chu, C.; Wang, K.-K.; Hu, J.-W.; Yan, Y.; Lv, Y.-B.; Cao, Y.-M.; Zheng, W.-L.; Dang, X.-L.; Xu, J.-T.; et al. Effect of Salt Intake on Plasma and Urinary Uric Acid Levels in Chinese Adults: An Interventional Trial. Sci. Rep. 2018, 8, 1434. [Google Scholar] [CrossRef] [PubMed]
- Koutsos, A.; Riccadonna, S.; Ulaszewska, M.M.; Franceschi, P.; Trošt, K.; Galvin, A.; Braune, T.; Fava, F.; Perenzoni, D.; Mattivi, F.; et al. Two apples a day lower serum cholesterol and improve cardiometabolic biomarkers in mildly hypercholesterolemic adults: A randomized, controlled, crossover trial. Am. J. Clin. Nutr. 2020, 111, 307–318. [Google Scholar] [CrossRef]
- Bruun, J.; Maersk, M.; Belza, A.; Astrup, A.; Richelsen, B. Consumption of sucrose-sweetened soft drinks increases plasma levels of uric acid in overweight and obese subjects: A 6-month randomised controlled trial. Eur. J. Clin. Nutr. 2015, 69, 949–953. [Google Scholar] [CrossRef] [PubMed]
- Jamshed, H.; Gilani, A.-U.; Sultan, F.A.T.; Amin, F.; Arslan, J.; Ghani, S.; Masroor, M. Almond supplementation reduces serum uric acid in coronary artery disease patients: A randomized controlled trial. Nutr. J. 2016, 15, 77. [Google Scholar] [CrossRef] [PubMed]
- Juraschek, S.P.; McAdams-Demarco, M.; Gelber, A.C.; Sacks, F.M.; Appel, L.J.; White, K.J.; Miller, E.R., 3rd. Effects of Lowering Glycemic Index of Dietary Carbohydrate on Plasma Uric Acid Levels: The OmniCarb Randomized Clinical Trial. Arthritis Rheumatol. 2016, 68, 1281–1289. [Google Scholar] [CrossRef] [PubMed]
- Rezazadeh, L.; Alipour, B.; Jafarabadi, M.A.; Behrooz, M.; Gargari, B.P. Daily consumption effects of probiotic yogurt containing Lactobacillus acidophilus La5 and Bifidobacterium lactis Bb12 on oxidative stress in metabolic syndrome patients. Clin. Nutr. ESPEN 2020, 41, 136–142. [Google Scholar] [CrossRef]
- Juraschek, S.P.; Yokose, C.; McCormick, N.; Miller, E.R., 3rd; Appel, L.J.; Choi, H.K. Effects of Dietary Patterns on Serum Urate: Results From a Randomized Trial of the Effects of Diet on Hypertension. Arthritis Rheumatol. 2020, 73, 1014–1020. [Google Scholar] [CrossRef] [PubMed]
- Büsing, F.; Hägele, F.A.; Nas, A.; Döbert, L.-V.; Fricker, A.; Dörner, E.; Podlesny, D.; Aschoff, J.; Pöhnl, T.; Schweiggert, R.; et al. High intake of orange juice and cola differently affects metabolic risk in healthy subjects. Clin. Nutr. 2019, 38, 812–819. [Google Scholar] [CrossRef]
- Meng, Y.; Bai, H.; Yu, Q.; Yan, J.; Zhao, L.; Wang, S.; Li, Z.; Wang, Q.; Chen, L. High–Resistant Starch, Low-Protein Flour Intervention on Patients With Early Type 2 Diabetic Nephropathy: A Randomized Trial. J. Ren. Nutr. 2019, 29, 386–393. [Google Scholar] [CrossRef] [PubMed]
- Chiu, S.; Siri-Tarino, P.; Bergeron, N.; Suh, J.H.; Krauss, R.M. A Randomized Study of the Effect of Replacing Sugar-Sweetened Soda by Reduced Fat Milk on Cardiometabolic Health in Male Adolescent Soda Drinkers. Nutrients 2020, 12, 405. [Google Scholar] [CrossRef] [PubMed]
- Juraschek, S.P.; Miller, E.R., 3rd; Wu, B.; White, K.; Charleston, J.; Gelber, A.C.; Rai, S.K.; Carson, K.A.; Appel, L.J.; Choi, H.K. A Randomized Pilot Study of DASH Patterned Groceries on Serum Urate in Individuals with Gout. Nutrients 2021, 13, 538. [Google Scholar] [CrossRef]
- Tracy, C.; Best, S.; Bagrodia, A.; Poindexter, J.R.; Adams-Huet, B.; Sakhaee, K.; Maalouf, N.; Pak, C.Y.; Pearle, M.S. Animal Protein and the Risk of Kidney Stones: A Comparative Metabolic Study of Animal Protein Sources. J. Urol. 2014, 192, 137–141. [Google Scholar] [CrossRef] [PubMed]
- Price, C.; Medici, V.; Nunez, M.; Lee, V.; Sigala, D.; Benyam, Y.; Keim, N.; Mason, A.; Chen, S.-Y.; Parenti, M.; et al. A Pilot Study Comparing the Effects of Consuming 100% Orange Juice or Sucrose-Sweetened Beverage on Risk Factors for Cardiometabolic Disease in Women. Nutrients 2021, 13, 760. [Google Scholar] [CrossRef] [PubMed]
- Stanhope, K.L.; Medici, V.; Bremer, A.A.; Lee, V.; Lam, H.D.; Nunez, M.V.; Chen, G.X.; Keim, N.L.; Havel, P.J. A dose-response study of consuming high-fructose corn syrup–sweetened beverages on lipid/lipoprotein risk factors for cardiovascular disease in young adults. Am. J. Clin. Nutr. 2015, 101, 1144–1154. [Google Scholar] [CrossRef] [PubMed]
- Vinha, A.F.; Barreira, S.V.P.; Costa, A.S.G.; Alves, R.C.; Oliveira, M.B.P.P. Pre-meal tomato (Lycopersicon esculentum) intake can have anti-obesity effects in young women? Int. J. Food Sci. Nutr. 2014, 65, 1019–1026. [Google Scholar] [CrossRef] [PubMed]
- Gomes, J.M.G.; de Assis Costa, J.; Ribeiro, P.V.D.M.; Alfenas, R.D.C.G. High calcium intake from fat-free milk, body composition and glycaemic control in adults with type 2 diabetes: A randomised crossover clinical trial. Br. J. Nutr. 2019, 122, 301–308. [Google Scholar] [CrossRef] [PubMed]
- Escudero-López, B.; Ortega, Á.; Cerrillo, I.; Rodríguez-Griñolo, M.-R.; Muñoz-Hernández, R.; Macher, H.C.; Martín, F.; Hornero-Méndez, D.; Mena, P.; Del Rio, D.; et al. Consumption of orange fermented beverage improves antioxidant status and reduces peroxidation lipid and inflammatory markers in healthy humans. J. Sci. Food Agric. 2018, 98, 2777–2786. [Google Scholar] [CrossRef] [PubMed]
- Johnston, R.D.; Stephenson, M.C.; Crossland, H.; Cordon, S.M.; Palcidi, E.; Cox, E.; Taylor, M.A.; Aithal, G.; Macdonald, I. No Difference Between High-Fructose and High-Glucose Diets on Liver Triacylglycerol or Biochemistry in Healthy Overweight Men. Gastroenterology 2013, 145, 1016–1025.e2. [Google Scholar] [CrossRef] [PubMed]
- Wong, V.; Foerster, J.; Maskarinec, G.; Reichardt, N.; Tett, A.; Narbad, A.; Blaut, M.; Boeing, H. The Influence of Whole Grain Products and Red Meat on Intestinal Microbiota Composition in Normal Weight Adults: A Randomized Crossover Intervention Trial. PLoS ONE 2014, 9, e109606. [Google Scholar] [CrossRef]
- Yokose, C.; McCormick, N.; Rai, S.K.; Lu, N.; Curhan, G.; Schwarzfuchs, D.; Shai, I.; Choi, H.K. Effects of Low-Fat, Mediterranean, or Low-Carbohydrate Weight Loss Diets on Serum Urate and Cardiometabolic Risk Factors: A Secondary Analysis of the Dietary Intervention Randomized Controlled Trial (DIRECT). Diabetes Care 2020, 43, 2812–2820. [Google Scholar] [CrossRef] [PubMed]
- Karagülle, O.; Smorag, U.; Candir, F.; Gundermann, G.; Jonas, U.; Becker, A.J.; Gehrke, A.; Gutenbrunner, C. Clinical study on the effect of mineral waters containing bicarbonate on the risk of urinary stone formation in patients with multiple episodes of CaOx-urolithiasis. World J. Urol. 2007, 25, 315–323. [Google Scholar] [CrossRef]
- de la Iglesia, R.; Lopez-Legarrea, P.; Abete, I.; Bondia-Pons, I.; Navas-Carretero, S.; Forga, L.; Martinez, J.A.; Zulet, M.A. A new dietary strategy for long-term treatment of the metabolic syndrome is compared with the American Heart Association (AHA) guidelines: The MEtabolic Syndrome REduction in NAvarra (RESMENA) project. Br. J. Nutr. 2014, 111, 643–652. [Google Scholar] [CrossRef] [PubMed] [Green Version]
- Sucher, S.; Markova, M.; Hornemann, S.; (Pivovarova), O.R.; Rudovich, N.; Thomann, R.; Schneeweiss, R.; Rohn, S.; Pfeiffer, A.F.H. Comparison of the effects of diets high in animal or plant protein on metabolic and cardiovascular markers in type 2 diabetes: A randomized clinical trial. Diabetes, Obes. Metab. 2017, 19, 944–952. [Google Scholar] [CrossRef] [PubMed]
- Tang, O.; Miller, E.R., 3rd; Gelber, A.C.; Choi, H.K.; Appel, L.J.; Juraschek, S.P. DASH diet and change in serum uric acid over time. Clin. Rheumatol. 2017, 36, 1413–1417. [Google Scholar] [CrossRef] [PubMed]
- Liu, Z.M.; Ho, C.S.; Chen, Y.M.; Woo, J. Can soy intake affect serum uric acid level? Pooled analysis from two 6-month randomized controlled trials among Chinese postmenopausal women with prediabetes or prehypertension. Eur. J. Nutr. 2015, 54, 51–58. [Google Scholar] [CrossRef] [PubMed]
- Jalal, S.; Alsultan, A.; Alotaibi, H.; Mary, E.; Alabdullatif, A. Effect of Phaseolus Vulgaris on Urinary Biochemical Parameters among Patients with Kidney Stones in Saudi Arabia. Nutrients 2020, 12, 3346. [Google Scholar] [CrossRef] [PubMed]
- Mahdavi-Roshan, M.; Salari, A.; Ghorbani, Z.; Nikpey, Z.; Haghighatkhah, M.; Mousavi, A.F.; Gholipour, M.; Pourfarzad, A. The effects of rice bran oil on left ventricular systolic function, cardiometabolic risk factors and inflammatory mediators in men with coronary artery disease: A randomized clinical trial. Food Funct. 2021, 12, 4446–4457. [Google Scholar] [CrossRef]
- Ji, L.; Gao, W.; Wei, J.; Pu, L.; Yang, J.; Guo, C. In vivo antioxidant properties of lotus root and cucumber: A pilot comparative study in aged subjects. J. Nutr. Health Aging 2015, 19, 765–770. [Google Scholar] [CrossRef] [PubMed]
- Duwaerts, C.C.; Maher, J.J. Macronutrients and the Adipose-Liver Axis in Obesity and Fatty Liver. Cell. Mol. Gastroenterol. Hepatol. 2019, 7, 749–761. [Google Scholar] [CrossRef]
- Khan, A.S.; Keast, R.; Khan, N.A. Preference for dietary fat: From detection to disease. Prog. Lipid Res. 2020, 78, 101032. [Google Scholar] [CrossRef]
- Mylona, E.E.; Mouktaroudi, M.; Crisan, T.O.; Makri, S.; Pistiki, A.; Georgitsi, M.; Savva, A.; Netea, M.G.; van der Meer, J.W.; Giamarellos-Bourboulis, E.J.; et al. Enhanced interleukin-1β production of PBMCs from patients with gout after stimulation with Toll-like receptor-2 ligands and urate crystals. Arthritis Res. Ther. 2012, 14, R158. [Google Scholar] [CrossRef] [PubMed]
- Choi, H.K.; McCormick, N.; Lu, N.; Rai, S.K.; Yokose, C.; Zhang, Y. Population Impact Attributable to Modifiable Risk Factors for Hyperuricemia. Arthritis Rheumatol. 2020, 72, 157–165. [Google Scholar] [CrossRef] [PubMed]
- Klisic, A.; Kocic, G.; Kavaric, N.; Jovanovic, M.; Stanisic, V.; Ninic, A. Body mass index is independently associated with xanthine oxidase activity in overweight/obese population. Eat. Weight. Disord.-Stud. Anorex. Bulim. Obes. 2020, 25, 9–15. [Google Scholar] [CrossRef] [PubMed]
- Lee, Y.S.; Kim, J.-W.; Osborne, O.; Oh, D.Y.; Sasik, R.; Schenk, S.; Chen, A.; Chung, H.; Murphy, A.; Watkins, S.M.; et al. Increased Adipocyte O2 Consumption Triggers HIF-1α, Causing Inflammation and Insulin Resistance in Obesity. Cell 2014, 157, 1339–1352. [Google Scholar] [CrossRef] [PubMed]
- Adeva, M.M.; Souto, G. Diet-induced metabolic acidosis. Clin. Nutr. 2011, 30, 416–421. [Google Scholar] [CrossRef] [PubMed]
- Wan, X.; Xu, C.; Lin, Y.; Lu, C.; Li, D.; Sang, J.; He, H.; Liu, X.; Li, Y.; Yu, C. Uric acid regulates hepatic steatosis and insulin resistance through the NLRP3 inflammasome-dependent mechanism. J. Hepatol. 2016, 64, 925–932. [Google Scholar] [CrossRef]
- Matsuzawa-Nagata, N.; Takamura, T.; Ando, H.; Nakamura, S.; Kurita, S.; Misu, H.; Ota, T.; Yokoyama, M.; Honda, M.; Miyamoto, K.-I.; et al. Increased oxidative stress precedes the onset of high-fat diet–induced insulin resistance and obesity. Metabolism 2008, 57, 1071–1077. [Google Scholar] [CrossRef]
- Yu, Y.; Yang, J.; Fu, S.; Xue, Y.; Liang, M.; Xuan, D.; Zhu, X.; Wan, W.; Lv, L.; Zou, H. Leptin Promotes Monosodium Urate Crystal–Induced Inflammation in Human and Murine Models of Gout. J. Immunol. 2019, 202, 2728–2736. [Google Scholar] [CrossRef]
- Ouchi, N.; Parker, J.L.; Lugus, J.J.; Walsh, K. Adipokines in inflammation and metabolic disease. Nat. Rev. Immunol. 2011, 11, 85–97. [Google Scholar] [CrossRef]
- Chandel, N.S. Carbohydrate Metabolism. Cold Spring Harb. Perspect. Biol. 2021, 13, a040568. [Google Scholar] [CrossRef]
- Fox, I.H.; John, D.; DeBruyne, S.; Dwosh, I.; Marliss, E.B. Hyperuricemia and hypertriglyceridemia: Metabolic basis for the association. Metab. Clin. Exp. 1985, 34, 741–746. [Google Scholar] [CrossRef]
- Park, S.; Xu, F.; Town, M.; Blanck, H.M. Prevalence of Sugar-Sweetened Beverage Intake Among Adults—23 States and the District of Columbia, 2013. MMWR. Morb. Mortal. Wkly. Rep. 2016, 65, 169–174. [Google Scholar] [CrossRef]
- León, J.M.; León-Maldonado, L.; Macías, N.; Torres-Ibarra, L.; Hernández-López, R.; Rivera-Paredez, B.; Flores, M.; Flores, Y.N.; Barrientos-Gutiérrez, T.; Quezada-Sánchez, A.D.; et al. Sugar-sweetened beverage consumption and risk of hyperuricemia: A longitudinal analysis of the Health Workers Cohort Study participants in Mexico. Am. J. Clin. Nutr. 2020, 112, 652–660. [Google Scholar] [CrossRef] [PubMed]
- van Dam, E.; van Leeuwen, L.A.G.; dos Santos, E.; James, J.; Best, L.; Lennicke, C.; Vincent, A.J.; Marinos, G.; Foley, A.; Buricova, M.; et al. Sugar-Induced Obesity and Insulin Resistance Are Uncoupled from Shortened Survival in Drosophila. Cell Metab. 2020, 31, 710–725e717. [Google Scholar] [CrossRef] [PubMed]
- Softic, S.; Meyer, J.G.; Wang, G.-X.; Gupta, M.K.; Batista, T.M.; Lauritzen, H.P.; Fujisaka, S.; Serra, D.; Herrero, L.; Willoughby, J.; et al. Dietary Sugars Alter Hepatic Fatty Acid Oxidation via Transcriptional and Post-translational Modifications of Mitochondrial Proteins. Cell Metab. 2019, 30, 735–753e734. [Google Scholar] [CrossRef] [PubMed]
- Softic, S.; Gupta, M.K.; Wang, G.-X.; Fujisaka, S.; O’Neill, B.; Rao, T.N.; Willoughby, J.; Harbison, C.; Fitzgerald, K.; Ilkayeva, O.; et al. Divergent effects of glucose and fructose on hepatic lipogenesis and insulin signaling. J. Clin. Investig. 2017, 127, 4059–4074. [Google Scholar] [CrossRef] [PubMed]
- Stanhope, K.L.; Schwarz, J.M.; Keim, N.L.; Griffen, S.C.; Bremer, A.A.; Graham, J.L.; Hatcher, B.; Cox, C.L.; Dyachenko, A.; Zhang, W.; et al. Consuming fructose-sweetened, not glucose-sweetened, beverages increases visceral adiposity and lipids and decreases insulin sensitivity in overweight/obese humans. J. Clin. Investig. 2009, 119, 1322–1334. [Google Scholar] [CrossRef]
- Choi, H.K.; Willett, W.; Curhan, G. Fructose-Rich Beverages and Risk of Gout in Women. JAMA 2010, 304, 2270–2278. [Google Scholar] [CrossRef] [PubMed]
- Taylor, S.R.; Ramsamooj, S.; Liang, R.J.; Katti, A.; Pozovskiy, R.; Vasan, N.; Hwang, S.-K.; Nahiyaan, N.; Francoeur, N.J.; Schatoff, E.M.; et al. Dietary fructose improves intestinal cell survival and nutrient absorption. Nature 2021, 597, 263–267. [Google Scholar] [CrossRef]
- Montrose, D.C.; Nishiguchi, R.; Basu, S.; Staab, H.A.; Zhou, X.K.; Wang, H.; Meng, L.; Johncilla, M.; Cubillos-Ruiz, J.R.; Morales, D.K.; et al. Dietary Fructose Alters the Composition, Localization, and Metabolism of Gut Microbiota in Association With Worsening Colitis. Cell. Mol. Gastroenterol. Hepatol. 2021, 11, 525–550. [Google Scholar] [CrossRef]
- Jang, C.; Hui, S.; Lu, W.; Cowan, A.J.; Morscher, R.J.; Lee, G.; Liu, W.; Tesz, G.J.; Birnbaum, M.J.; Rabinowitz, J.D. The Small Intestine Converts Dietary Fructose into Glucose and Organic Acids. Cell Metab. 2018, 27, 351–361.e53. [Google Scholar] [CrossRef]
- Flisiński, M.; Brymora, A.; Skoczylas-Makowska, N.; Stefańska, A.; Manitius, J. Fructose-Rich Diet Is a Risk Factor for Metabolic Syndrome, Proximal Tubule Injury and Urolithiasis in Rats. Int. J. Mol. Sci. 2021, 23, 203. [Google Scholar] [CrossRef]
- Glushakova, O.; Kosugi, T.; Roncal, C.; Mu, W.; Heinig, M.; Cirillo, P.; Sánchez-Lozada, L.G.; Johnson, R.J.; Nakagawa, T. Fructose Induces the Inflammatory Molecule ICAM-1 in Endothelial Cells. J. Am. Soc. Nephrol. 2008, 19, 1712–1720. [Google Scholar] [CrossRef] [PubMed]
- White, S.J.; Carran, E.L.; Reynolds, A.N.; Haszard, J.J.; Venn, B.J. The effects of apples and apple juice on acute plasma uric acid concentration: A randomized controlled trial. Am. J. Clin. Nutr. 2018, 107, 165–172. [Google Scholar] [CrossRef] [PubMed]
- Wang, F.; Sun, L.; Zong, G.; Gao, X.; Zhang, H.; Xiong, Q.; Huo, S.; Niu, Z.; Sun, Q.; Zeng, R.; et al. Associations of Amino Acid and Acylcarnitine Profiles With Incident Hyperuricemia in Middle-Aged and Older Chinese Individuals. Arthritis Care Res. 2020, 72, 1305–1314. [Google Scholar] [CrossRef]
- Ferraro, P.M.; Mandel, E.I.; Curhan, G.C.; Gambaro, G.; Taylor, E.N. Dietary Protein and Potassium, Diet–Dependent Net Acid Load, and Risk of Incident Kidney Stones. Clin. J. Am. Soc. Nephrol. 2016, 11, 1834–1844. [Google Scholar] [CrossRef] [PubMed]
- Ko, G.J.; Obi, Y.; Tortorici, A.R.; Kalantar-Zadeh, K. Dietary protein intake and chronic kidney disease. Curr. Opin. Clin. Nutr. Metab. Care 2017, 20, 77–85. [Google Scholar] [CrossRef] [PubMed]
- Meng, S.; Cui, Z.; Li, M.; Li, T.; Wu, F.; Kang, T.; Meng, H. Associations Between Dietary Animal and Plant Protein Intake and Cardiometabolic Risk Factors—A Cross-Sectional Study in China Health and Nutrition Survey. Nutrients 2021, 13, 336. [Google Scholar] [CrossRef] [PubMed]
- Kahleova, H.; Fleeman, R.; Hlozkova, A.; Holubkov, R.; Barnard, N.D. A plant-based diet in overweight individuals in a 16-week randomized clinical trial: Metabolic benefits of plant protein. Nutr. Diabetes 2018, 8, 58. [Google Scholar] [CrossRef]
- Wu, J.; Zhou, Y.; Hu, H.; Yang, D.; Yang, F. Effects of β-carotene on glucose metabolism dysfunction in humans and type 2 diabetic rats. Acta Mater. Medica 2022, 1. [Google Scholar] [CrossRef]
- Zhang, L.; Shi, X.; Yu, J.; Zhang, P.; Ma, P.; Sun, Y. Dietary Vitamin E Intake Was Inversely Associated with Hyperuricemia in US Adults: NHANES 2009–2014. Ann. Nutr. Metab. 2020, 76, 354–360. [Google Scholar] [CrossRef]
- Brzezińska, O.; Styrzyński, F.; Makowska, J.; Walczak, K. Role of Vitamin C in Prophylaxis and Treatment of Gout—A Literature Review. Nutrients 2021, 13, 701. [Google Scholar] [CrossRef]
- Han, Y.; Han, K.; Zhang, Y.; Zeng, X. Serum 25-hydroxyvitamin D might be negatively associated with hyperuricemia in U.S. adults: An analysis of the National Health and Nutrition Examination Survey 2007–2014. J. Endocrinol. Investig. 2022, 45, 719–729. [Google Scholar] [CrossRef] [PubMed]
- Xie, Q.; Li, S.; Feng, W.; Li, Y.; Wu, Y.; Hu, W.; Huang, Y. Inhibition of Monosodium Urate Monohydrate-mediated Hemolysis by Vitamin, E. Acta Biochim. et Biophys. Sin. 2007, 39, 273–277. [Google Scholar] [CrossRef] [PubMed]
- Berger, L.; Gerson, C.D.; Yü, T.-F. The effect of ascorbic acid on uric acid excretion with a commentary on the renal handling of ascorbic acid. Am. J. Med. 1977, 62, 71–76. [Google Scholar] [CrossRef]
- Chade, A.R.; Rodriguez-Porcel, M.; Herrmann, J.; Krier, J.D.; Zhu, X.; Lerman, A.; Lerman, L.O. Beneficial Effects of Antioxidant Vitamins on the Stenotic Kidney. Hypertension 2003, 42, 605–612. [Google Scholar] [CrossRef] [PubMed]
- Li, H.; Liu, X.; Lee, M.H.; Li, H. Vitamin C alleviates hyperuricemia nephropathy by reducing inflammation and fibrosis. J. Food Sci. 2021, 86, 3265–3276. [Google Scholar] [CrossRef]
- Morris, R.C., Jr.; Schmidlin, O.; Frassetto, L.A.; Sebastian, A. Relationship and Interaction between Sodium and Potassium. J. Am. Coll. Nutr. 2006, 25, 262S–270S. [Google Scholar] [CrossRef] [PubMed]
- Zhang, J.-L.; Yu, H.; Hou, Y.-W.; Wang, K.; Bi, W.-S.; Zhang, L.; Wang, Q.; Li, P.; Yu, M.-L.; Zhao, X.-X. Impact of long-term potassium supplementation on thiazide diuretic-induced abnormalities of glucose and uric acid metabolisms. J. Hum. Hypertens. 2018, 32, 301–310. [Google Scholar] [CrossRef]
- Furth-Walker, D.; Amy, N.K. Regulation of Xanthine Oxidase Activity and Immunologically Detectable Protein in Rats in Response to Dietary Protein and Iron. J. Nutr. 1987, 117, 1697–1703. [Google Scholar] [CrossRef] [PubMed]
- Martelin, E.; Lapatto, R.; Raivio, K.O. Regulation of xanthine oxidoreductase by intracellular iron. Am. J. Physiol. Physiol. 2002, 283, C1722–C1728. [Google Scholar] [CrossRef] [PubMed]
- Curhan, G.C.; Willett, W.C.; Speizer, F.E.; Spiegelman, D.; Stampfer, M.J. Comparison of Dietary Calcium with Supplemental Calcium and Other Nutrients as Factors Affecting the Risk for Kidney Stones in Women. Ann. Intern. Med. 1997, 126, 497–504. [Google Scholar] [CrossRef]
- Curhan, G.C.; Willett, W.C.; Rimm, E.B.; Stampfer, M.J. A Prospective Study of Dietary Calcium and Other Nutrients and the Risk of Symptomatic Kidney Stones. N. Engl. J. Med. 1993, 328, 833–838. [Google Scholar] [CrossRef] [PubMed]
- Müller, M.; Canfora, E.E.; Blaak, E.E. Gastrointestinal Transit Time, Glucose Homeostasis and Metabolic Health: Modulation by Dietary Fibers. Nutrients 2018, 10, 275. [Google Scholar] [CrossRef]
- Bolton, R.P.; Heaton, K.W.; Burroughs, L.F. The role of dietary fiber in satiety, glucose, and insulin: Studies with fruit and fruit juice. Am. J. Clin. Nutr. 1981, 34, 211–217. [Google Scholar] [CrossRef] [PubMed]
- Vuksan, V.; Jenkins, A.L.; Rogovik, A.L.; Fairgrieve, C.D.; Jovanovski, E.; Leiter, L.A. Viscosity rather than quantity of dietary fibre predicts cholesterol-lowering effect in healthy individuals. Br. J. Nutr. 2011, 106, 1349–1352. [Google Scholar] [CrossRef] [PubMed]
- Tanes, C.; Bittinger, K.; Gao, Y.; Friedman, E.S.; Nessel, L.; Paladhi, U.R.; Chau, L.; Panfen, E.; Fischbach, M.A.; Braun, J.; et al. Role of dietary fiber in the recovery of the human gut microbiome and its metabolome. Cell Host Microbe 2021, 29, 394–407.e5. [Google Scholar] [CrossRef] [PubMed]
- Baxter, N.T.; Schmidt, A.W.; Venkataraman, A.; Kim, K.S.; Waldron, C.; Schmidt, T.M. Dynamics of Human Gut Microbiota and Short-Chain Fatty Acids in Response to Dietary Interventions with Three Fermentable Fibers. mBio 2019, 10, e02566-18. [Google Scholar] [CrossRef] [PubMed]
- Cleophas, M.C.P.; Crişan, T.O.; Lemmers, H.; Toenhake-Dijkstra, H.; Fossati, G.; Jansen, T.L.; Dinarello, C.A.; Netea, M.G.; Joosten, L.A.B. Suppression of monosodium urate crystal-induced cytokine production by butyrate is mediated by the inhibition of class I histone deacetylases. Ann. Rheum. Dis. 2016, 75, 593–600. [Google Scholar] [CrossRef]
- Dalbeth, N.; Wong, S.; Gamble, G.; Horne, A.; Mason, B.; Pool, B.; Fairbanks, L.; McQueen, F.M.; Cornish, J.; Reid, I.; et al. Acute effect of milk on serum urate concentrations: A randomised controlled crossover trial. Ann. Rheum. Dis. 2010, 69, 1677–1682. [Google Scholar] [CrossRef] [PubMed]
- Dalbeth, N.; Ames, R.; Gamble, G.; Horne, A.; Wong, S.; Kuhn-Sherlock, B.; MacGibbon, A.; McQueen, F.M.; Reid, I.; Palmano, K. Effects of skim milk powder enriched with glycomacropeptide and G600 milk fat extract on frequency of gout flares: A proof-of-concept randomised controlled trial. Ann. Rheum. Dis. 2012, 71, 929–934. [Google Scholar] [CrossRef]
- Levine, M.; Wang, Y.; Padayatty, S.J.; Morrow, J. A new recommended dietary allowance of vitamin C for healthy young women. Proc. Natl. Acad. Sci. USA 2001, 98, 9842–9846. [Google Scholar] [CrossRef] [Green Version]
- Stein, H.B.; Hasan, A.; Fox, I.H. Ascorbic Acid-Induced Uricosuria. Ann. Intern. Med. 1976, 84, 385–388. [Google Scholar] [CrossRef] [PubMed]
- Urivetzky, M.; Kessaris, D.; Smith, A.D. Ascorbic Acid Overdosing: A Risk Factor for Calcium Oxalate Nephrolithiasis. J. Urol. 1992, 147, 1215–1218. [Google Scholar] [CrossRef]
- Baker, M.; Perazella, M.A. NSAIDs in CKD: Are They Safe? Am. J. Kidney Dis. 2020, 76, 546–557. [Google Scholar] [CrossRef] [PubMed]
- Webb, D.I.; Chodos, R.B.; Mahar, C.Q.; Faloon, W.W. Mechanism of Vitamin B12Malabsorption in Patients Receiving Colchicine. New Engl. J. Med. 1968, 279, 845–850. [Google Scholar] [CrossRef] [PubMed]
- Berlinger, W.G.; Park, G.D.; Spector, R. The Effect of Dietary Protein on the Clearance of Allopurinol and Oxypurinol. New Engl. J. Med. 1985, 313, 771–776. [Google Scholar] [CrossRef] [PubMed]
- Shen, Z.; Lee, C.A.; Valdez, S.; Yang, X.; Wilson, D.M.; Flanagan, T.; Gillen, M. Effects of Food and Antacids on Pharmacokinetics and Pharmacodynamics of Lesinurad, a Selective Urate Reabsorption Inhibitor. Clin. Pharmacol. Drug Dev. 2019, 8, 647–656. [Google Scholar] [CrossRef] [PubMed]
- Shen, Z.; Rowlings, C.; Kerr, B.; Hingorani, V.; Manhard, K.; Quart, B.; Yeh, L.-T.; Storgard, C. Pharmacokinetics, pharmacodynamics, and safety of lesinurad, a selective uric acid reabsorption inhibitor, in healthy adult males. Drug Des. Dev. Ther. 2015, 9, 3423–3434. [Google Scholar] [CrossRef] [PubMed]
- Wason, S.; DiGiacinto, J.L.; Davis, M.W. Effects of Grapefruit and Seville Orange Juices on the Pharmacokinetic Properties of Colchicine in Healthy Subjects. Clin. Ther. 2012, 34, 2161–2173. [Google Scholar] [CrossRef] [PubMed]
- Khosravan, R.; Grabowski, B.; Wu, J.-T.; Joseph-Ridge, N.; Vernillet, L. Effect of food or antacid on pharmacokinetics and pharmacodynamics of febuxostat in healthy subjects. Br. J. Clin. Pharmacol. 2008, 65, 355–363. [Google Scholar] [CrossRef] [PubMed]
- Agrawal, N.G.B.; Porras, A.G.; Matthews, C.Z.; Rose, M.J.; Woolf, E.J.; Musser, B.J.; Dynder, A.L.; Mazina, K.E.; Lasseter, K.C.; Hunt, T.L.; et al. Single- and Multiple-Dose Pharmacokinetics of Etoricoxib, a Selective Inhibitor of Cyclooxygenase-2, in Man. J. Clin. Pharmacol. 2003, 43, 268–276. [Google Scholar] [CrossRef]
- Peixoto, M.R.; Monego, E.T.; Jardim, P.C.; Carvalho, M.M.; Sousa, A.L.; Oliveira, J.S.; Balestra Neto, O. Diet and medication in the treatment of hyperuricemia in hypertensive patients. Arq. Bras. Cardiol. 2001, 76, 463–472. [Google Scholar] [CrossRef] [PubMed] [Green Version]


| Intervention Group | Control Group | Participants | Period | Major Findings |
|---|---|---|---|---|
| Low-carbohydrate (≤20 g/day) and high-fat diet [36] | Habitual diet (carbohydrate ≤ 20 g/day) | 30 heathy persons (ages ≥ 18 years) | 3 weeks | UAM: urate significantly ↑ in the LCHF group MS in the LCHF group: •apolipoprotein B, TC, HDL-C significantly ↑ •FFA and urea significantly ↑ •mean plasma LDL-C ↑ |
| DASH diet with low, medium, and high sodium levels [37] | The average American diet | 103 subjects (average age of 51.5 years) with pre- or stage 1 hypertension | 30 days | UAM: •mean SUA ↓ in the DASH diet group vs. the control group •SUA ↓ in medium and high sodium intake when aggregated across both diets |
| Fruit-rich and soybean products diet (Group 1) [38] | Standard diet for hyperuricemia (Group 2) | 187 Chinese adults (ages 20 to 59 years) with asymptomatic hyperuricemia | 3 months | UAM: SUA ↓ in the Group 1 and Group 2 vs. baseline MS: •HDL-C significantly ↑ in the Group 1 vs. the baseline •BMI, TC and TG significantly ↓ in the Group 2 vs. the baseline |
| Low-salt diet followed by a high-salt diet [39] | / | 90 subjects with similar dietary habits (ages 18 to 65 years) | 17 days | UAM: •PUA significantly ↑ in the low-salt diet group and PUA significantly ↓ in the high-salt diet group vs. baseline •24 h UUA significantly ↓ in the low-salt diet group and the high-salt diet group vs. baseline |
| 2 apples/day for 8 weeks, and then after a 4-weeks Washout period, consumed 500 mL of control beverage daily for a further 8 weeks (Group 1), or received the intervention foods in the reverse order (Group 2) [40] | / | 40 healthy and mildly hypercholesterolemic Volunteers (ages 29 to 65 years) | 20 weeks | UAM: SUA ↑ in the Group 1 vs. the Group 2 MS: TC, LDL-C, TG and ICAM-1 significantly ↓ in the Group 1 vs. the Group 2 |
| Regular cola (SSSD); Diet cola; Isocaloric semiskimmed milk; Water [41] | / | 47 overweight and obese adults (ages 20 to 50 years) | 6 months | UAM: PUA significantly ↑ in the SSSD group vs. other groups MS: •VAT significantly ↑ in the SSSD group vs. other beverages, and in liver fat of more than two-fold •Plasma TG ↑ in the SSSD group vs. the milk, the diet cola and the water group |
| High-carbohydrate diet (CARB); High-protein diet (PROT); High-unsaturated fat diet (UNSAT) [33] | / | 163 subjects (ages ≥ 30 years) | 6 weeks | UAM: •SUA ↓ in PROT group vs. baseline •SUA significantly ↓ in PROT group vs. the CARB and UNSAT group |
| Pakistani almonds (PA); American almonds (AA) [42] | No intervention | 150 patients with coronary artery disease (ages 55 to 63 years) | 12 weeks | UAM: •SUA ↓ in the PA group and the AA group at week 6 and week 12 vs. the NI group |
| High-carbohydrate and high/low-glycemic index diet (CG/Cg); low-carbohydrate and high/low-glycemic index diet (cG/cg) [43] | / | 163 overweight or obese adults without cardiovascular disease (ages ≥ 30 years) | 5 weeks | UAM: •PUA ↓ in the Cg group and PUA ↑ in the cG group vs. baseline •PUA ↓ in the Cg group vs. the CG group •PUA ↓ in the cg group vs. the cG group •PUA ↑ in the cG group vs. the CG group |
| Yogurt with 300 g/day of probiotic [44] | Regular yogurt | 44 metabolic syndrome patients (ages 20 to 65 years) | 8 weeks | UAM: •SUA ↓in the probiotic yogurt group •significantly changes in UA level MS in the probiotic yogurt group: •MDA and oxidized LDL ↓ •TAC ↑ |
| Fruit and vegetable (FV)-rich diet; DASH diet [45] | Typical American diet | 459 subjects with blood pressure (<160 mmHg, 80–95 mmHg) (ages ≥ 30 years) | 8 weeks | UAM: •SUA ↓ in the FV group and SUA ↓ in the DASH group •effects increased in DASH group with increasing baseline SU levels |
| 100% orange juice; caffeine-free cola [46] | / | 26 healthy adults have a habitual three-meals-per-day structure (ages 20 to 45 years) | 2 weeks | UAM: SUA significantly ↓ and UUA significant ↑ in the orange juice group vs. baseline MS: daylong glycemia and glucose variability significantly ↑, 24 h insulin secretion and serum potassium levels significantly ↓ in the cola group vs. orange juice group |
| High-resistant starch with low-protein flour staple (Group 1) [47] | Protein-restriction diet | 75 patients with early type 2 diabetic nephropathy (ages 18 to 80 years) | 12 weeks | UAM: SUA ↓ in the Group 1 MS: fasting BG, HbA1c, TC and TG significantly ↓ in the Group 1; serum superoxide dismutase level b2-microglobulin ↑ in the Group 1 |
| Sugar-sweetened soda or reduced-fat milk [48] | / | 30 overweight or obese subjects (males, ages 13 to 18 years) | Not specified | UAM after the milk intake phase: UA significantly ↓ MS after the milk intake phase: systolic blood pressure significantly ↓ after the milk intake phase |
| DASH diet followed by self-directed grocery purchases (DDG) or the reverse order (SDG) [49] | / | 43 gouty participants without taking urate lowering therapy (ages ≥ 18 years) | 8 weeks | UAM: •SUA ↓ in the DDG group during Period 1 •SUA ↓ in the SDG group and SUA ↓ in the DDG group after crossover (Period 2) MS: total spot urine sodium excretion ↓ in the DDG group |
| Standard metabolic diet (beef, fish, or chicken) [50] | / | 15 healthy subjects (ages 18 to 70 years) | Not specified | UAM: •SUA significantly ↑ for each diet phase, and beef was associated with lower SUA than chicken or fish •fish was associated with significant UUA ↑ than beef or chicken •calcium oxalate significantly ↑ in the beef diet phase vs. the chicken diet phase |
| 3 servings of 100% naturally sweetened orange juice (OJ)/day [51] | 3 servings of sucrose-sweetened beverages (sucrose-SB)/day | 20 healthy and overweight women (ages 25 to 40 years) | 2 weeks | UAM: PUA significantly ↑ in the sucrose-SB group, and PUA ↓ in the OJ group vs. AUC of baseline MS: •BW significantly ↑ in the sucrose-SB group vs. baseline •BW ↑ in the sucrose-SB group vs. OJ group •Matsuda insulin sensitivity index ↓ in both group |
| High-fructose corn syrup (HFCS): 0% (aspartame sweetened), 10%, 17.5%, 25% Ereq-HFCS [52] | / | 187 participants (ages 18 to 40 years) | 2 weeks | UAM: 24-h mean PUA significantly ↓ in 10%, 17.5% and 25% HFCS group vs. the 0% group MS: postprandial TG and fasting LDL-C significantly ↑ in 10%, 17.5% and 25% HFCS group vs. the 0% group |
| Tomatoes [53] | / | 35 Caucasian women (ages 18 to 25 years) | 4 weeks | UAM: PUA ↓ vs. baseline MS: mean BW, fasting BG, TG, C ↓ vs. baseline |
| High-calcium fat-free milk session and followed by consumption of low-Ca control session (HC group) or the reverse order (LC group) [54] | / | 14 type 2 diabetes subjects with habitual low calcium intake (ages 20 to 59 years) | 32 weeks | UA: SUA ↓ in the HC group and SUA significantly ↑ in the LC group MS: •25-hydroxyvitamin D significantly ↑, fructosamine and parathormone significantly ↓ in the HC group • 25-hydroxy-vitamin D significantly ↑ in the HC group vs. the LC group • Hb1Ac significantly ↑ and HOMA2-%B significantly ↓ in the LC group |
| 500 mL orange beverage (OB)/day [55] | Not consume OB | 30 healthy volunteers (average age of 33.9 years) | 2 weeks | UAM: PUA significantly ↓ in the OB intervention phase vs. both of baseline and washout phase MS: • ORAC ↑ while CAT, TBARS and C-reactive protein ↓ in the OB intervene phase vs. baseline •CAT, TBARS and oxidized LDL ↓ after the wash out phase vs. baseline |
| High-fructose or high-glucose diet [56] | / | 32 healthy but centrally overweight men (ages 18 to 50 years) | 10 weeks | UAM: SUA ↑ in the fructose group SUA ↓ in the glucose group MS: •the risk of insulin resistance ↑ in the fructose diet group vs. the glucose diet •BG, TAG and biochemical assays of liver function ↑ in both group |
| Diet rich in whole grain (WG) products for 3 weeks followed by red meat (RM), or the reverse order [57] | / | 20 healthy adults (ages 20 to 60 years) | 10 weeks | UAM: SUA significantly ↑ during RM intervention MS: •BMI, body fat mass and BW significantly ↓ in the WG group compared to baseline and after washout •creatinine significantly ↑ during RM intervention GB: • Collinsella aerofaciens appearing after WG intervention • Clostridium sp. ↑ after RM intervention |
| Low-fat and restricted-calorie diet; Low-carbohydrate and non–restricted-calorie diet Mediterranean and restricted-calorie; [58] | / | 235 participants with moderate obesity (ages 40 to 65 years) | 24 months | UAM: •SUA ↓ at 6 months and 24 months among all participants •the effect of SUA ↓ in all group was positively correlated with baseline MS: BW, HDL-C, TC: HDL-C, TG, insulin resistance significant improved in all three groups |
| 1.5 L of a mineral water with 2.673 mg HCO3/L [59] | The same amount of water with 98 mg HCO3/L | 34 patients with multiepisodic calcium oxalate urolithiasis (average age of 52.7 years) | Not specified | UAM in the intervention group: •UUA supersaturation, significant ↓ •pH -value in the intervention group, significant ↑ (p < 0.001) |
| Total energy value: 40% from carbohydrates, 30% from proteins and 30% from lipids, <300 mg/day of fatty acids and cholesterol (RESMENA group) [60] | Total energy value: 55% from carbohydrates, 15% from proteins and other treatments were the same as the intervention group | 41 women and 52 men with metabolic syndrome (ages 40 to 65 years) | 6 months | UAM: SUA significantly ↑ in the control group vs. baseline MS: •waist circumference, BMI, BW, waist: hip ratio, android fat mass and alanine aminotransferase and aspartate aminotransferase significantly ↓ in RESMENA group vs. baseline • glucose and aminotransferase significantly ↑ in the control group •LDL-C and HDL-C significantly ↑ in treatment groups vs. baseline |
| Isocaloric diets: 30% of energy from animal (AP) or plant (PP) protein [61] | / | 44 type 2 diabetes patients (ages 18 to 80 years) | 6 weeks | UAM: SUA ↓ in both groups MS: •M-value of insulin sensitivity significantly ↑ in the AP group vs. baseline •TC, LDL-C, HDL-C ↓ in both groups •fasting nonesterified fatty acids significant ↓ in the PP group vs. baseline •CRP significantly ↓ in the AP group |
| DASH diet [62] | The typical American diet. | 103 prehypertensive or hypertensive adults (ages ≥ 22 years) | 90 days | UAM: •SUA ↓ at 30 and 90 days in the DASH group •SUA ↓ at 30 and 90 days in the DASH group when participants with baseline SUA ≥6 mg/dL |
| Soy protein trial: soy protein group (soy protein and isoflavones); isoflavone group (milk protein and isoflavone); Soy flour trial: whole soy group (soy flour); daidzein group (low-fat milk powder and daidzein) [63] | Soy protein trial: milk protein Soy flour trial: low-fat milk powder | 450 postmenopausal women with either prediabetes or prehypertension (ages 48 to 65 years) | 6 months | UAM: •SUA significantly ↓ in the soy flour and soy protein groups (SCF group) compared with the isoflavone and daidzein groups and the milk placebo groups (MP group) •UA net decrease and UA% decrease between the SCF group and the MP group |
| Drinking filtered soup (250 g of fresh Phaseolus Vulgaris + 1000 mL water) at least an hour before breakfast every other day [64] | / | 5168 subjects (ages ≥ 40 years) | 6 weeks | UAM: SUA significantly ↓ in the intervention group |
| Rice bran oil plus a standard diet (RBO) [65] | Sunflower oil plus a standard diet (SO) | 40 patients with severe CAD undergoing angioplasty (ages 30 to 70 years) | 8 weeks | UAM: SUA ↓ in the RBO group MS: TG, BG, TC, LDL and TNF-α ↓ in the RBO group |
| The powders of lotus root and cucumber (first, they were squeezed into juices, and then freeze-dried under vacuum) in warm water [66] | / | 25 men and 9 women (ages > 60 years) | 30 days | UAM: •PUA ↓ in both of lotus root group and cucumber group MS: •plasma glutathione peroxidase ↑ in both of lotus root group and cucumber group •blood mononuclear cell DNA damage ↓ in the lotus root group |
| Medicine | Dietary Intervention | Participants | Time | Major Findings |
|---|---|---|---|---|
| Lesinurad [126] | High-fat and high-calorie meal | 16 healthy men (ages 18 to 55 years) | 6 days | •Cmax ↓ vs. the fasted phase •serum urate-lowering effect and renal clearance ↑ vs. the fasted phase •absorption was slightly delayed vs. fasted phase |
| Lesinurad [127] | Moderate-fat diet | 16 nonobese men (ages 18 to 55 years) | 10 days | •Tmax 4 h delay •Cmax ↓ in the fed state vs. the fasted phase |
| Colchicine [128] | Seville orange juice or grapefruit juice | 44 nonobese adults (ages 18 to 45 years) | 4 days | •Cmax and AUC ↓ in the seville orange juice group vs. the nonjuice group •Tmax occurred 1 h delay compared with in the seville orange juice group vs. the nonjuice group |
| Febuxostat [129] | High-fat breakfast | 68 healthy adults (ages 18 to 55 years) | Not specified | •Cmax and AUC ↓ under feeding conditions vs. fasting conditions •SUA concentrations ↓ after treatment with febuxostat (80 mg) |
| Etoricoxib [130] | High-fat meal | 12 healthy adults (ages 50 to 64 years) | 10 days | •the rate of absorption ↓ in the fed phase vs. the fasted phase •Tmax occurred with an approximately 2 h delay in the fed phase vs. the fasted phase |
| Allopurinol/oxipurinol [125] | High-protein or low-protein diet | 6 healthy adults (ages 20 to 30 years) | 28 days | •plasma AUC significantly ↑ in the high-protein diet group •renal clearance significantly ↓ in the high-protein diet group |
| Allopurinol [131] | Low-purine diet | 60 hypertensive patients with high SUA levels (average age of 54.4 years) | 36 weeks | •SUA significantly ↓ in the intervention groups •6 months after the intervention, SUA shows an elevation tendency in the low-purine diet + medication group and medication-only group •6 months after the intervention, SUA shows a continuous drop in the low-purine diet group |
Publisher’s Note: MDPI stays neutral with regard to jurisdictional claims in published maps and institutional affiliations. |
© 2022 by the authors. Licensee MDPI, Basel, Switzerland. This article is an open access article distributed under the terms and conditions of the Creative Commons Attribution (CC BY) license (https://creativecommons.org/licenses/by/4.0/).
Share and Cite
Zhang, Y.; Chen, S.; Yuan, M.; Xu, Y.; Xu, H. Gout and Diet: A Comprehensive Review of Mechanisms and Management. Nutrients 2022, 14, 3525. https://doi.org/10.3390/nu14173525
Zhang Y, Chen S, Yuan M, Xu Y, Xu H. Gout and Diet: A Comprehensive Review of Mechanisms and Management. Nutrients. 2022; 14(17):3525. https://doi.org/10.3390/nu14173525
Chicago/Turabian StyleZhang, Yingling, Simin Chen, Man Yuan, Yu Xu, and Hongxi Xu. 2022. "Gout and Diet: A Comprehensive Review of Mechanisms and Management" Nutrients 14, no. 17: 3525. https://doi.org/10.3390/nu14173525