
Ultra-Processed Food Consumption and Mental Health: A Systematic Review and Meta-Analysis of Observational Studies

 ,
,  ,
,
Abstract
:1. Introduction
2. Methods
2.1. Search Strategy
2.2. Study Selection, Inclusion and Exclusion Criteria
2.3. Data Extraction
2.4. Critical Appraisal Assessment
2.5. Data Analysis
3. Results
3.1. Search Results
3.2. Study Characteristics
3.3. Details of Exposure Variables and Average Ultra-Processed Food Consumption
3.4. Meta-Analyses and Narrative Syntheses
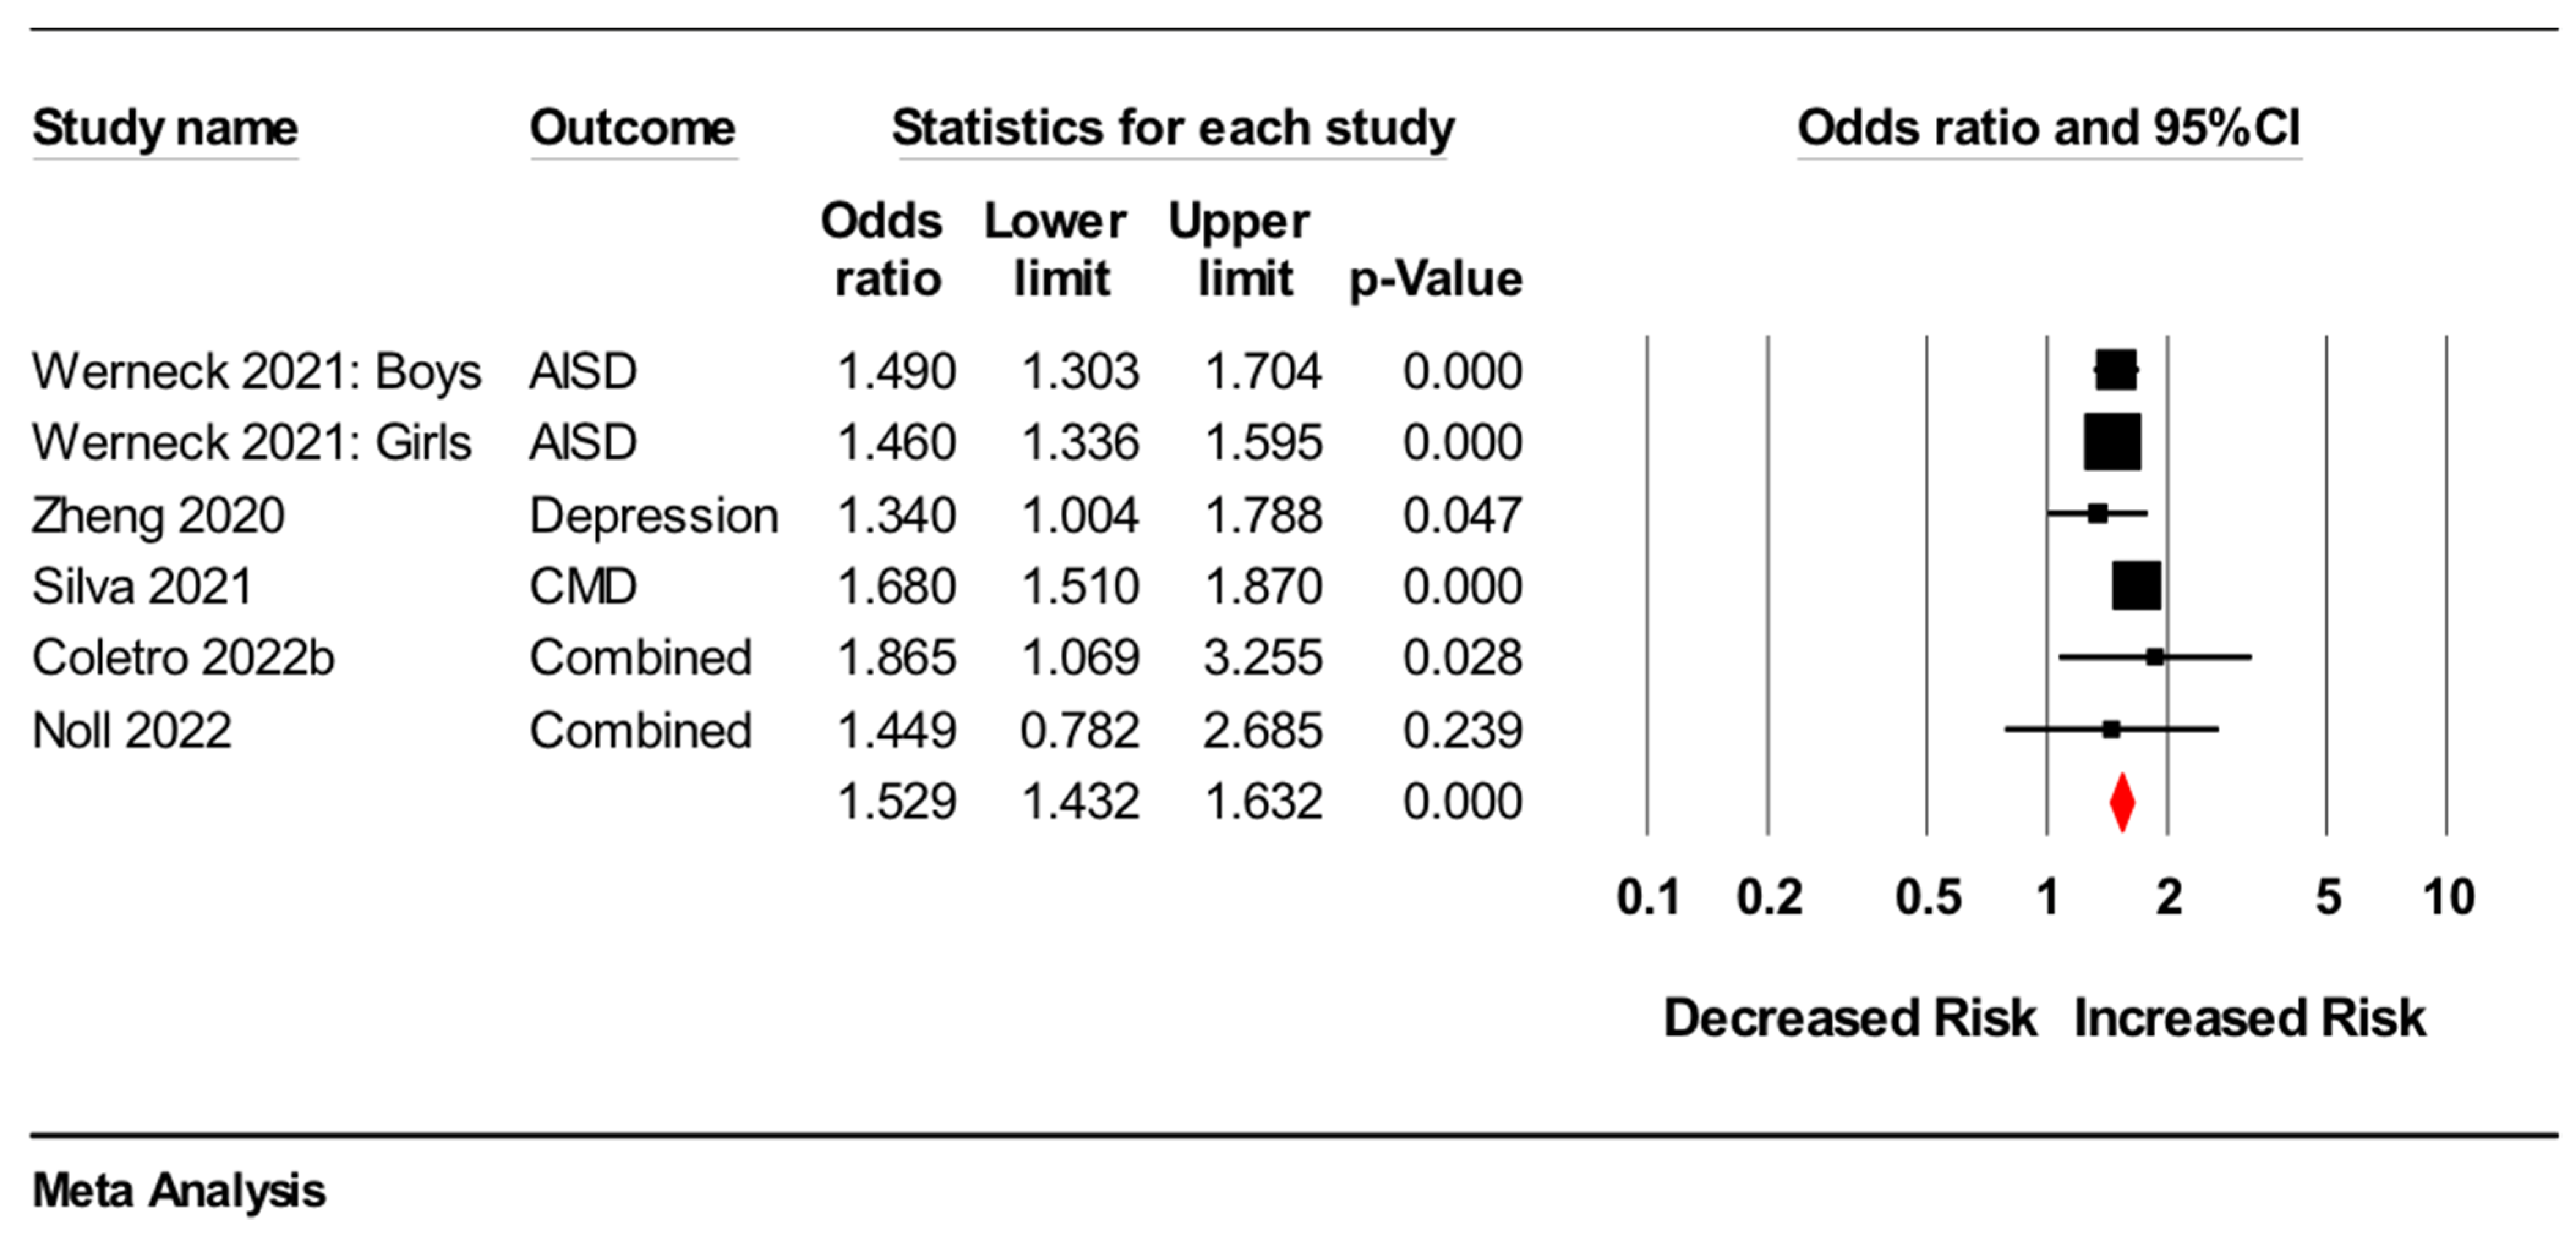
3.4.1. Common Mental disorders
Meta-Analysis
Narrative Synthesis
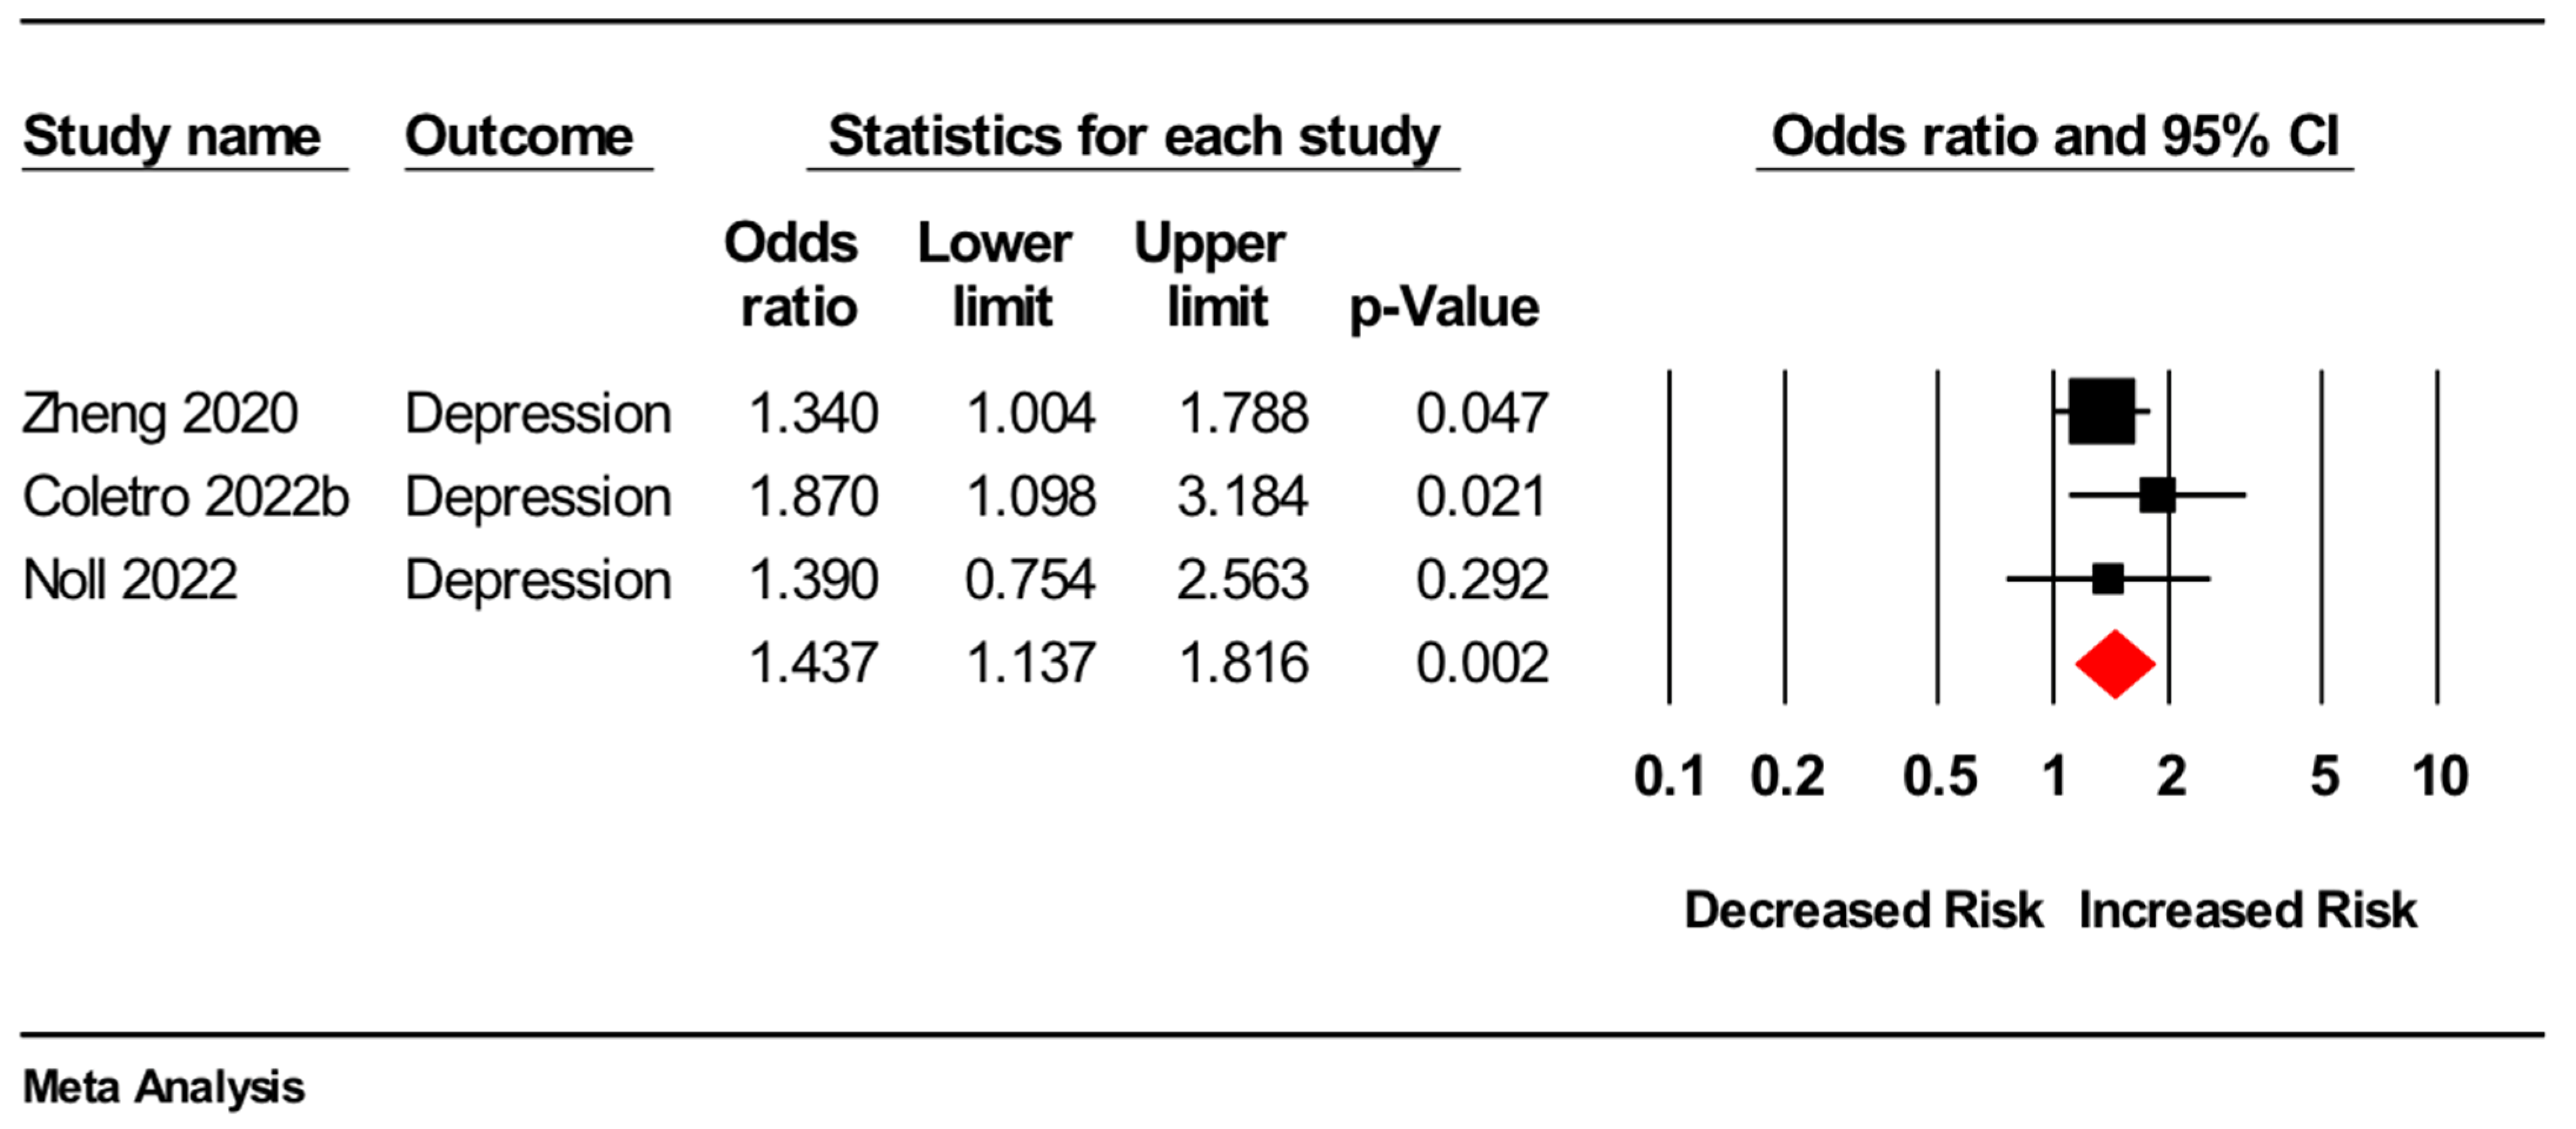
3.4.2. Depression
Meta-Analyses
Narrative Syntheses
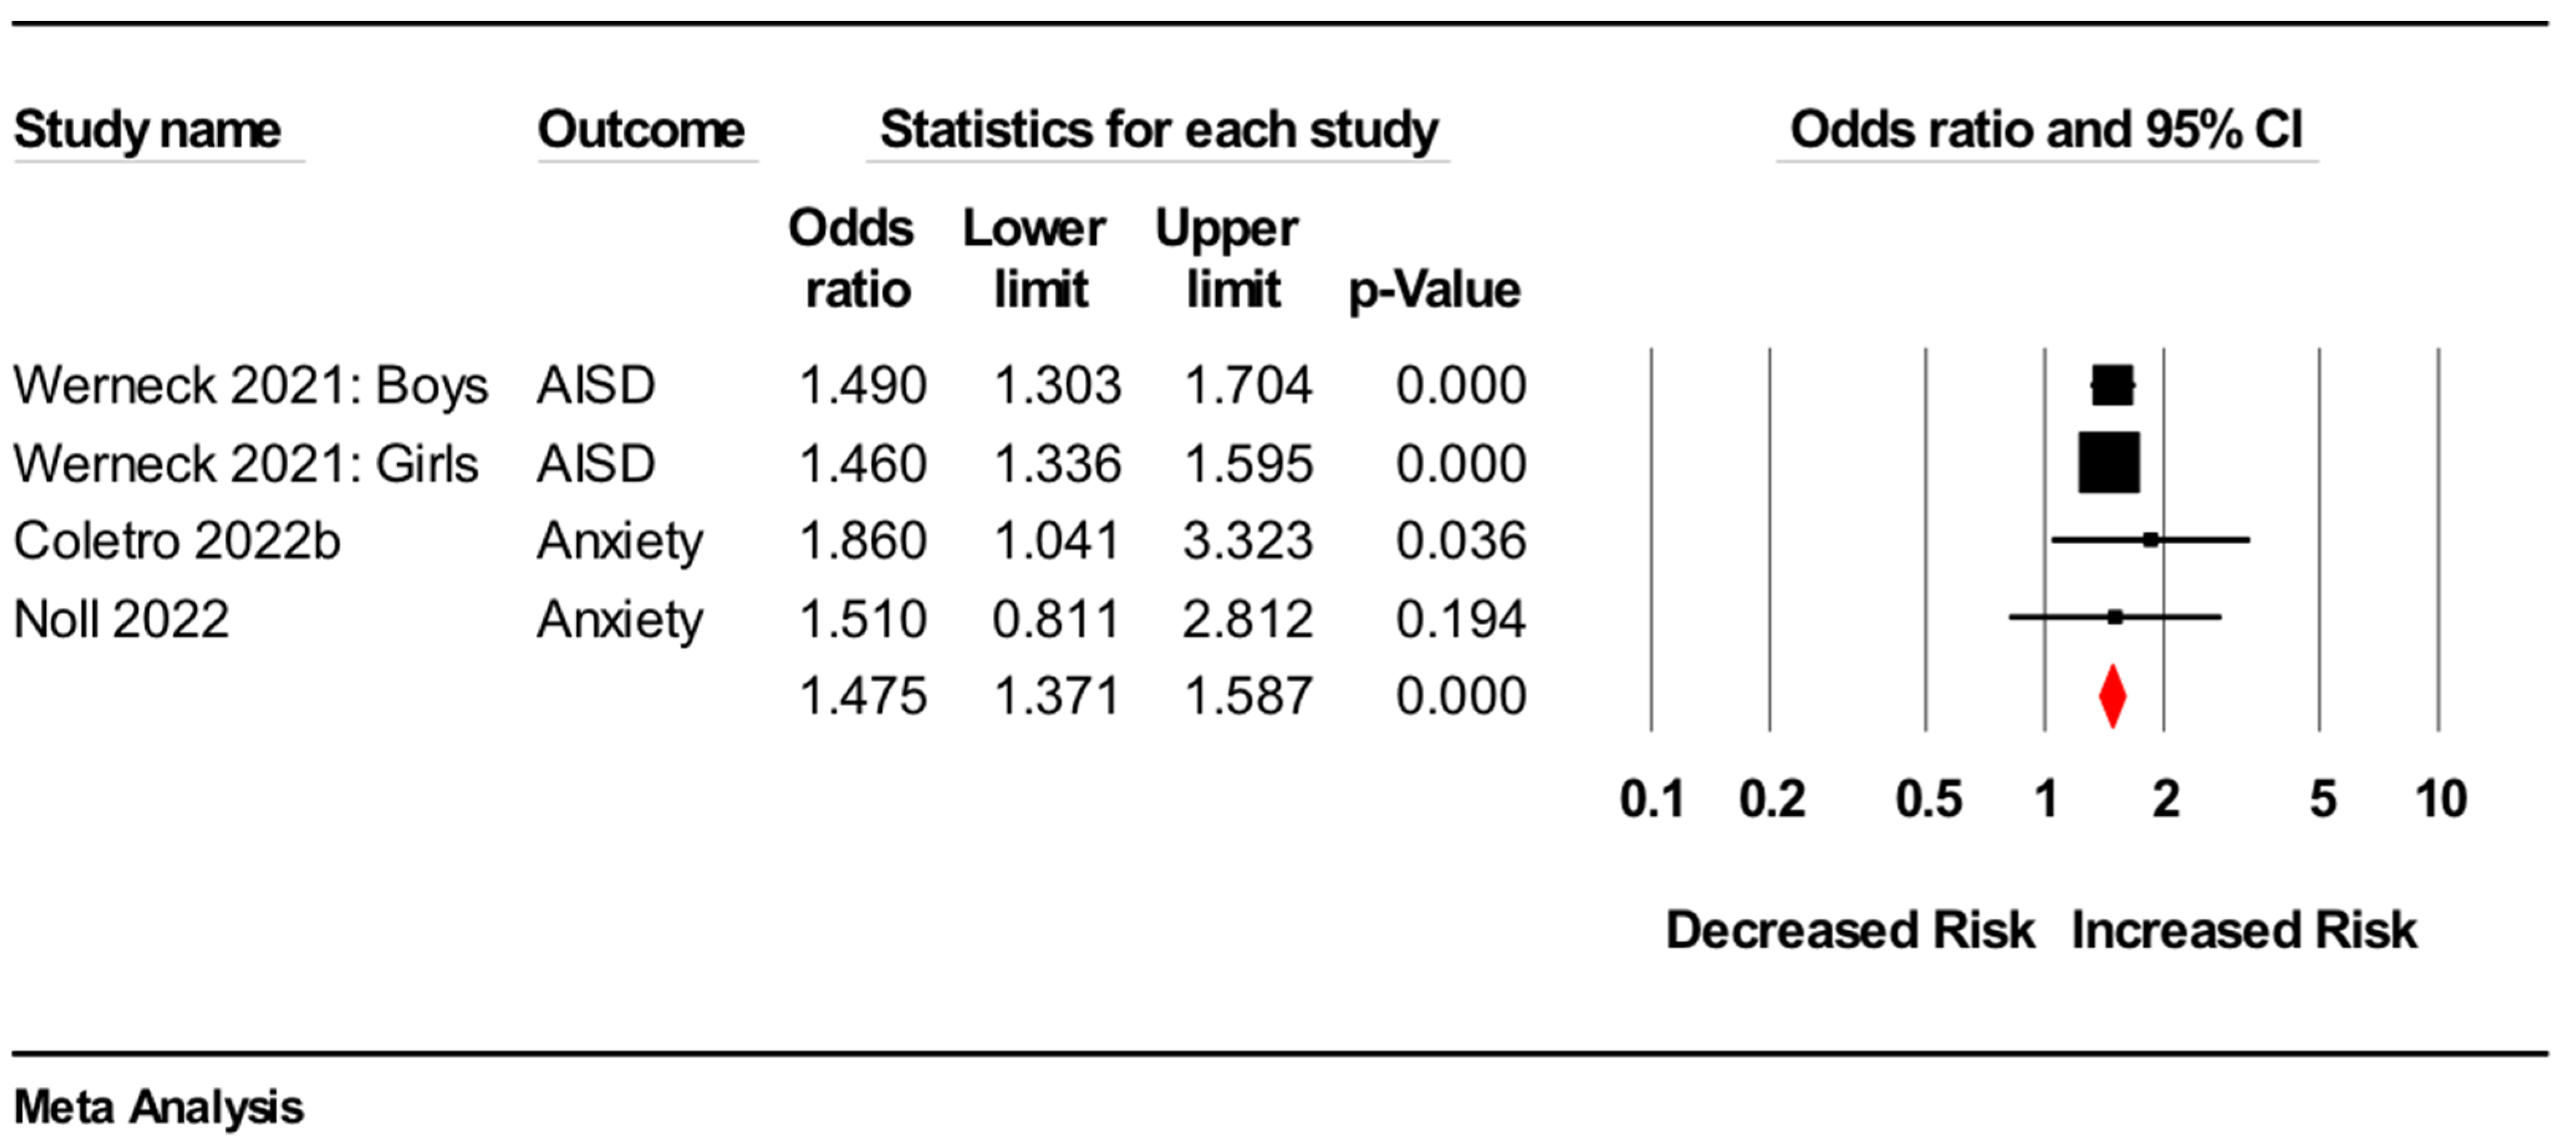
3.4.3. Anxiety
Meta-Analysis
Narrative Syntheses
3.4.4. Trauma and Stress
Narrative Syntheses
3.4.5. Addiction
Narrative Syntheses
3.4.6. Eating Disorders
Narrative Synthesis
4. Discussion
4.1. Limitations and Future Directions
4.2. Implications
5. Conclusions
Supplementary Materials
Author Contributions
Funding
Conflicts of Interest
References
- GBD 2019 Mental Disorders Collaborators. Global, regional, and national burden of 12 mental disorders in 204 countries and territories, 1990–2019: A systematic analysis for the Global Burden of Disease Study 2019. Lancet Psychiatry 2022, 9, 137–150. [Google Scholar] [CrossRef]
- Patel, V.; Saxena, S.; Lund, C.; Thornicroft, G.; Baingana, F.; Bolton, P.; Chisholm, D.; Collins, P.Y.; Cooper, J.L.; Eaton, J.; et al. The Lancet Commission on global mental health and sustainable development. Lancet 2018, 392, 1553–1598. [Google Scholar] [CrossRef] [Green Version]
- Stein, D.J.; Benjet, C.; Gureje, O.; Lund, C.; Scott, K.M.; Poznyak, V.; van Ommeren, M. Integrating mental health with other non-communicable diseases. BMJ 2019, 364, l295. [Google Scholar] [CrossRef] [PubMed] [Green Version]
- O’Neil, A.; Jacka, F.N.; Quirk, S.E.; Cocker, F.; Taylor, C.B.; Oldenburg, B.; Berk, M.A. shared framework for the common mental disorders and Non-Communicable Disease: Key considerations for disease prevention and control. BMC Psychiatry 2015, 15, 15. [Google Scholar] [CrossRef] [PubMed] [Green Version]
- Marx, W.; Moseley, G.; Berk, M.; Jacka, F. Nutritional psychiatry: The present state of the evidence. Proc. Nutr. Soc. 2017, 76, 427–436. [Google Scholar] [CrossRef] [Green Version]
- Marx, W.; Lane, M.; Hockey, M.; Aslam, H.; Berk, M.; Walder, K.; Borsini, A.; Firth, J.; Pariante, C.M.; Berding, K.; et al. Diet and depression: Exploring the biological mechanisms of action. Mol. Psychiatry 2021, 26, 134–150. [Google Scholar] [CrossRef]
- Li, Y.; Lv, M.R.; Wei, Y.J.; Sun, L.; Zhang, J.X.; Zhang, H.G.; Li, B. Dietary patterns and depression risk: A meta-analysis. Psychiatry Res. 2017, 253, 373–382. [Google Scholar] [CrossRef]
- Lassale, C.; Batty, G.D.; Baghdadli, A.; Jacka, F.; Sánchez-Villegas, A.; Kivimäki, M.; Akbaraly, T. Healthy dietary indices and risk of depressive outcomes: A systematic review and meta-analysis of observational studies. Mol. Psychiatry 2019, 24, 965–986. [Google Scholar] [CrossRef] [Green Version]
- Rahe, C.; Unrath, M.; Berger, K. Dietary patterns and the risk of depression in adults: A systematic review of observational studies. Eur. J. Nutr. 2014, 53, 997–1013. [Google Scholar] [CrossRef]
- Jacka, F.N.; Cherbuin, N.; Anstey, K.J.; Butterworth, P. Dietary Patterns and Depressive Symptoms over Time: Examining the Relationships with Socioeconomic Position, Health Behaviours and Cardiovascular Risk. PLoS ONE 2014, 9, e87657. [Google Scholar] [CrossRef]
- Monteiro, C.A.; Cannon, G.; Levy, R.B.; Moubarac, J.C.; Louzada, M.L.; Rauber, F.; Khandpur, N.; Cediel, G.; Neri, D.; Martinez-Steele, E.; et al. Ultra-processed foods: What they are and how to identify them. Public Health Nutr. 2019, 22, 936–941. [Google Scholar] [CrossRef] [PubMed]
- Monteiro, C.A.; Cannon, G.; Moubarac, J.-C.; Levy, R.B.; Louzada, M.L.C.; Jaime, P.C. The UN Decade of Nutrition, the NOVA food classification and the trouble with ultra-processing. Public Health Nutr. 2018, 21, 5–17. [Google Scholar] [CrossRef] [PubMed] [Green Version]
- Baker, P.; Machado, P.; Santos, T.; Sievert, K.; Backholer, K.; Hadjikakou, M.; Russell, C.; Huse, O.; Bell, C.; Scrinis, G.; et al. Ultra-processed foods and the nutrition transition: Global, regional and national trends, food systems transformations and political economy drivers. Obes. Rev. 2020, 21, e13126. [Google Scholar] [CrossRef] [PubMed]
- Monteiro, C.A.; Moubarac, J.C.; Cannon, G.; Ng, S.W.; Popkin, B. Ultra-processed products are becoming dominant in the global food system. Obes. Rev. 2013, 14 (Suppl. 2), 21–28. [Google Scholar] [CrossRef]
- Marino, M.; Puppo, F.; Del Bo’, C.; Vinelli, V.; Riso, P.; Porrini, M.; Martini, D. A Systematic Review of Worldwide Consumption of Ultra-Processed Foods: Findings and Criticisms. Nutrients 2021, 13, 2778. [Google Scholar] [CrossRef]
- Lane, M.M.; Davis, J.A.; Beattie, S.; Gómez-Donoso, C.; Loughman, A.; O’Neil, A.; Jacka, F.; Berk, M.; Page, R.; Marx, W.; et al. Ultraprocessed food and chronic noncommunicable diseases: A systematic review and meta-analysis of 43 observational studies. Obes. Rev. 2021, 22, e13146. [Google Scholar] [CrossRef]
- Faisal-Cury, A.; Leite, M.A.; Escuder, M.M.L.; Levy, R.B.; Peres, M.F.T. The relationship between ultra-processed food consumption and internalising symptoms among adolescents from São Paulo city, Southeast Brazil. Public Health Nutr. 2021, 1–9. [Google Scholar] [CrossRef]
- Silva, S.A.; do Carmo, A.S.; Carvalho, K.M.B. Lifestyle patterns associated with common mental disorders in Brazilian adolescents: Results of the Study of Cardiovascular Risks in Adolescents (ERICA). PLoS ONE 2021, 16, e0261261. [Google Scholar] [CrossRef]
- Zheng, L.; Sun, J.; Yu, X.; Zhang, D. Ultra-Processed Food Is Positively Associated with Depressive Symptoms Among United States Adults. Front. Nutr. 2020, 7, 600449. [Google Scholar] [CrossRef]
- Werneck, A.O.; Silva, D.R.D.; Malta, D.C.; Souza-Júnior, P.R.B.; Azevedo, L.O.; Barros, M.B.A.; Szwarcwald, C.L. Lifestyle behaviors changes during the COVID-19 pandemic quarantine among 6881 Brazilian adults with depression and 35,143 without depression. Cien. Saude Colet. 2020, 25 (Suppl. 2), 4151–4156. [Google Scholar] [CrossRef]
- Coletro, H.N.; de Deus Mendonça, R.; Meireles, A.L.; Machado-Coelho, G.L.L.; de Menezes, M.C. Ultra-processed and fresh food consumption and symptoms of anxiety and depression during the COVID-19 pandemic: COVID Inconfidentes. Clin. Nutr. ESPEN 2022, 47, 206–214. [Google Scholar] [CrossRef] [PubMed]
- Bonaccio, M.; Costanzo, S.; Bracone, F.; Gialluisi, A.; Di Castelnuovo, A.; Ruggiero, E.; Esposito, S.; Olivieri, M.; Persichillo, M.; Cerletti, C.; et al. Psychological distress resulting from the COVID-19 confinement is associated with unhealthy dietary changes in two Italian population-based cohorts. Eur. J. Nutr. 2021, 61, 1491–1505. [Google Scholar] [CrossRef]
- Amadieu, C.; Leclercq, S.; Coste, V.; Thijssen, V.; Neyrinck, A.M.; Bindels, L.B.; Cani, P.D.; Piessevaux, H.; Stärkel, P.; de Timary, P.; et al. Dietary fiber deficiency as a component of malnutrition associated with psychological alterations in alcohol use disorder. Clin. Nutr. 2021, 40, 2673–2682. [Google Scholar] [CrossRef] [PubMed]
- Noll, M.; Zangirolami-Raimundo, J.; Baracat, E.C.; da Costa Louzada, M.L.; Maria Soares, J., Jr.; Sorpreso, I.C.E. Life habits of postmenopausal women: Association of menopause symptom intensity and food consumption by degree of food processing. Maturitas 2022, 156, 1–11. [Google Scholar] [CrossRef] [PubMed]
- Werneck, A.O.; Hoare, E.; Silva, D.R. Do TV viewing and frequency of ultra-processed food consumption share mediators in relation to adolescent anxiety-induced sleep disturbance? Public Health Nutr. 2021, 24, 5491–5497. [Google Scholar] [CrossRef] [PubMed]
- Werneck, A.O.; Vancampfort, D.; Oyeyemi, A.L.; Stubbs, B.; Silva, D.R. Joint association of ultra-processed food and sedentary behavior with anxiety-induced sleep disturbance among Brazilian adolescents. J. Affect. Disord. 2020, 266, 135–142. [Google Scholar] [CrossRef] [PubMed]
- Lopes Cortes, M.; Andrade Louzado, J.; Galvão Oliveira, M.; Moraes Bezerra, V.; Mistro, S.; Souto Medeiros, D.; Arruda Soares, D.; Oliveira Silva, K.; Nicolaevna Kochergin, C.; Honorato Dos Santos de Carvalho, V.C.; et al. Unhealthy Food and Psychological Stress: The Association between Ultra-Processed Food Consumption and Perceived Stress in Working-Class Young Adults. Int. J. Environ. Res. Public Health 2021, 18, 3863. [Google Scholar] [CrossRef] [PubMed]
- Ruggiero, E.; Esposito, S.; Costanzo, S.; Di Castelnuovo, A.; Cerletti, C.; Donati, M.B.; de Gaetano, G.; Iacoviello, L.; Bonaccio, M. Ultra-processed food consumption and its correlates among Italian children, adolescents and adults from the Italian Nutrition & Health Survey (INHES) cohort study. Public Health Nutr. 2021, 24, 6258–6271. [Google Scholar] [CrossRef]
- Schulte, E.M.; Kral, T.V.; Allison, K.C. A cross-sectional examination of reported changes to weight, eating, and activity behaviors during the COVID-19 pandemic among United States adults with food addiction. Appetite 2022, 168, 105740. [Google Scholar] [CrossRef]
- Filgueiras, A.R.; Pires de Almeida, V.B.; Koch Nogueira, P.C.; Alvares Domene, S.M.; Eduardo da Silva, C.; Sesso, R.; Sawaya, A.L. Exploring the consumption of ultra-processed foods and its association with food addiction in overweight children. Appetite 2019, 135, 137–145. [Google Scholar] [CrossRef]
- Ayton, A.; Ibrahim, A.; Dugan, J.; Galvin, E.; Wright, O.W. Ultra-processed foods and binge eating: A retrospective observational study. Nutrition 2021, 84, 111023. [Google Scholar] [CrossRef] [PubMed]
- Page, M.J.; McKenzie, J.E.; Bossuyt, P.M.; Boutron, I.; Hoffmann, T.C.; Mulrow, C.D.; Shamseer, L.; Tetzlaff, J.M.; Akl, E.A.; Brennan, S.E.; et al. The PRISMA 2020 statement: An updated guideline for reporting systematic reviews. Syst. Rev. 2020, 10, 89. [Google Scholar] [CrossRef] [PubMed]
- Monteiro, C.A.; Cannon, G.; Lawrence, M.; Costa Louzada, M.L.; Pereira Machado, P. Ultra-Processed Foods, Diet Quality, and Health Using the NOVA Classification System; FAO: Rome, Italy, 2019. [Google Scholar]
- American Psychiatric Association. Diagnostic and Statistical Manual of Mental Disorders; DSM-5; American Psychiatric Association: Washington, DC, USA, 2013; Volume 5. [Google Scholar]
- Ter Meulen, W.G.; Draisma, S.; van Hemert, A.M.; Schoevers, R.A.; Kupka, R.W.; Beekman, A.T.F.; Penninx, B. Depressive and anxiety disorders in concert-A synthesis of findings on comorbidity in the NESDA study. J. Affect. Disord. 2021, 284, 85–97. [Google Scholar] [CrossRef] [PubMed]
- Moola, S.M.Z.; Tufanaru, C.; Aromataris, E.; Sears, K.; Sfetcu, R.; Currie, M.; Lisy, K.; Qureshi, R.; Mattis, P.; Mu, P. Chapter 7: Systematic Reviews of Etiology and Risk. 2017. Available online: https://reviewersmanual.joannabriggs.org/ (accessed on 9 March 2022).
- Borenstein, M.; Hedges, L.V.; Higgins, J.P.T.; Rothstein, H.R. When Does it Make Sense to Perform a Meta-Analysis? In Introduction to Meta-Analysis; John Wiley & Sons Ltd.: Hoboken, NJ, USA, 2009. [Google Scholar]
- Borenstein, M.; Hedges, L.; Higgins, J.; Rothstein, H. Comprehensive meta-analysis version 3. Biostat 104 Englewood 2011, NJ. [Google Scholar]
- DerSimonian, R.; Laird, N. Meta-analysis in clinical trials. Control. Clin. Trials 1986, 7, 177–188. [Google Scholar] [CrossRef]
- Higgins, J.P.T.; Thompson, S.G.; Deeks, J.J.; Altman, D.G. Measuring inconsistency in meta-analyses. BMJ 2003, 327, 557–560. [Google Scholar] [CrossRef] [Green Version]
- Greenland, S.; Senn, S.J.; Rothman, K.J.; Carlin, J.B.; Poole, C.; Goodman, S.N.; Altman, D.G. Statistical tests, P values, confidence intervals, and power: A guide to misinterpretations. Eur. J. Epidemiol. 2016, 31, 337–350. [Google Scholar] [CrossRef] [Green Version]
- Karpen, S.C. P value problems. Am. J. Pharm. Educ. 2017, 81, 6570. [Google Scholar] [CrossRef]
- Sullivan, G.M.; Feinn, R. Using effect size—Or why the P value is not enough. J. Grad. Med. Educ. 2012, 4, 279–282. [Google Scholar] [CrossRef] [Green Version]
- Wasserstein, R.L.; Lazar, N.A. The ASA statement on p-values: Context, process, and purpose. Am. Stat. 2016, 70, 129–133. [Google Scholar] [CrossRef] [Green Version]
- Altman, D.G.; Bland, J.M. How to obtain the confidence interval from a P value. BMJ 2011, 343, d2090. [Google Scholar] [CrossRef] [PubMed] [Green Version]
- Bishara, A.J.; Hittner, J.B. Confidence intervals for correlations when data are not normal. Behav. Res. Methods 2017, 49, 294–309. [Google Scholar] [CrossRef] [PubMed] [Green Version]
- Altman, D.G.; Bland, J.M. How to obtain the P value from a confidence interval. BMJ 2011, 343, d2304. [Google Scholar] [CrossRef] [PubMed] [Green Version]
- Adjibade, M.; Julia, C.; Allès, B.; Touvier, M.; Lemogne, C.; Srour, B.; Hercberg, S.; Galan, P.; Assmann, K.E.; Kesse-Guyot, E. Prospective association between ultra-processed food consumption and incident depressive symptoms in the French NutriNet-Santé cohort. BMC Med. 2019, 17, 78. [Google Scholar] [CrossRef] [Green Version]
- Gómez-Donoso, C.; Sánchez-Villegas, A.; Martínez-González, M.A.; Gea, A.; Mendonça, R.D.; Lahortiga-Ramos, F.; Bes-Rastrollo, M. Ultra-processed food consumption and the incidence of depression in a Mediterranean cohort: The SUN Project. Eur. J. Nutr. 2020, 59, 1093–1103. [Google Scholar] [CrossRef]
- Gómez-Donoso, C.; Martínez-González, M.Á.; Romanos-Nanclares, A.; Ruiz-Estigarribia, L.; Mendonça, R.; Sánchez-Villegas, A.; Lahortiga, F.; Bes-Rastrollo, M. Ultra-processed food consumption and the incidence of depression in a mediterranean cohort: The Seguimiento Universidad de Navarra Project. Eur. J. Clin. Investig. 2018, 48, 169. [Google Scholar] [CrossRef] [Green Version]
- Khalid, S.; Williams, C.M.; Reynolds, S.A. Is there an association between diet and depression in children and adolescents? A systematic review. Br. J. Nutr. 2016, 116, 2097–2108. [Google Scholar] [CrossRef]
- Firth, J.; Solmi, M.; Wootton, R.E.; Vancampfort, D.; Schuch, F.B.; Hoare, E.; Gilbody, S.; Torous, J.; Teasdale, S.B.; Jackson, S.E.; et al. A meta-review of “lifestyle psychiatry”: The role of exercise, smoking, diet and sleep in the prevention and treatment of mental disorders. World Psychiatry 2020, 19, 360–380. [Google Scholar] [CrossRef]
- Marx, W.; Veronese, N.; Kelly, J.T.; Smith, L.; Hockey, M.; Collins, S.; Trakman, G.L.; Hoare, E.; Teasdale, S.B.; Wade, A.; et al. The Dietary Inflammatory Index and Human Health: An Umbrella Review of Meta-Analyses of Observational Studies. Adv Nutr. 2021, 12, 1681–1690. [Google Scholar] [CrossRef]
- Tobias, D.K.; Hall, K.D. Eliminate or reformulate ultra-processed foods? Biological mechanisms matter. Cell Metab. 2021, 33, 2314–2315. [Google Scholar] [CrossRef]
- Choudhary, A.K.; Lee, Y.Y. Neurophysiological symptoms and aspartame: What is the connection? Nutr. Neurosci. 2018, 21, 306–316. [Google Scholar] [CrossRef]
- Quines, C.B.; Rosa, S.G.; Da Rocha, J.T.; Gai, B.M.; Bortolatto, C.F.; Duarte, M.M.M.F.; Nogueira, C.W. Monosodium glutamate, a food additive, induces depressive-like and anxiogenic-like behaviors in young Rats. Life Sci. 2014, 107, 27–31. [Google Scholar] [CrossRef] [PubMed]
- Swidsinski, A.; Ung, V.; Sydora, B.C.; Loening-Baucke, V.; Doerffel, Y.; Verstraelen, H.; Fedorak, R.N. Bacterial overgrowth and inflammation of small intestine after carboxymethylcellulose ingestion in genetically susceptible mice. Inflamm. Bowel Dis. 2009, 15, 359–364. [Google Scholar] [CrossRef] [PubMed]
- Chassaing, B.; Koren, O.; Goodrich, J.K.; Poole, A.C.; Srinivasan, S.; Ley, R.E.; Gewirtz, A.T. Dietary emulsifiers impact the mouse gut microbiota promoting colitis and metabolic syndrome. Nature 2015, 519, 92–96. [Google Scholar] [CrossRef] [PubMed] [Green Version]
- Singh, R.K.; Wheildon, N.; Ishikawa, S. Food Additive P-80 Impacts Mouse Gut Microbiota Promoting Intestinal Inflammation, Obesity and Liver Dysfunction. SOJ Microbiol. Infect. Dis. 2016, 4. [Google Scholar] [CrossRef] [PubMed] [Green Version]
- Zinöcker, M.K.; Lindseth, I.A. The Western Diet-Microbiome-Host Interaction and Its Role in Metabolic Disease. Nutrients 2018, 10, 365. [Google Scholar] [CrossRef] [Green Version]
- Chassaing, B.; Compher, C.; Bonhomme, B.; Liu, Q.; Tian, Y.; Walters, W.; Nessel, L.; Delaroque, C.; Hao, F.; Gershuni, V.; et al. Randomized controlled-feeding study of dietary emulsifier carboxymethylcellulose reveals detrimental impacts on the gut microbiota and metabolome. Gastroenterology 2021, 162, 743–756. [Google Scholar] [CrossRef]
- Grissa, I.; Guezguez, S.; Ezzi, L.; Chakroun, S.; Sallem, A.; Kerkeni, E.; Elghoul, J.; El Mir, L.; Mehdi, M.; Cheikh, H.B.; et al. The effect of titanium dioxide nanoparticles on neuroinflammation response in rat brain. Environ. Sci. Pollut. Res. Int. 2016, 23, 20205–20213. [Google Scholar] [CrossRef]
- Yuan, N.; Chen, Y.; Xia, Y.; Dai, J.; Liu, C. Inflammation-related biomarkers in major psychiatric disorders: A cross-disorder assessment of reproducibility and specificity in 43 meta-analyses. Transl. Psychiatry 2019, 9, 233. [Google Scholar] [CrossRef]
- Heidari, Z.; Mohammadipour, A.; Haeri, P.; Ebrahimzadeh-Bideskan, A. The effect of titanium dioxide nanoparticles on mice midbrain substantia nigra. Iran J. Basic Med. Sci. 2019, 22, 745–751. [Google Scholar] [CrossRef]
- Wiersielis, K.R.; Samuels, B.A.; Roepke, T.A. Perinatal exposure to bisphenol A at the intersection of stress, anxiety, and depression. Neurotoxicol. Teratol. 2020, 79, 106884. [Google Scholar] [CrossRef] [PubMed]
- Luppino, F.S.; de Wit, L.M.; Bouvy, P.F.; Stijnen, T.; Cuijpers, P.; Penninx, B.W.; Zitman, F.G. Overweight, obesity, and depression: A systematic review and meta-analysis of longitudinal studies. Arch. Gen. Psychiatry 2010, 67, 220–229. [Google Scholar] [CrossRef] [PubMed]
- Scott, K.M. Depression, anxiety and incident cardiometabolic diseases. Curr. Opin. Psychiatry 2014, 27, 289–293. [Google Scholar] [CrossRef] [PubMed] [Green Version]
- Forde, C.G.; Mars, M.; de Graaf, K. Ultra-Processing or Oral Processing? A Role for Energy Density and Eating Rate in Moderating Energy Intake from Processed Foods. Curr. Dev. Nutr. 2020, 4, nzaa019. [Google Scholar] [CrossRef]
- Small, D.M.; DiFeliceantonio, A.G. Processed foods and food reward. Science 2019, 363, 346–347. [Google Scholar] [CrossRef]
- Yau, Y.H.C.; Potenza, M.N. Stress and eating behaviors. Minerva Endocrinol. 2013, 38, 255–267. [Google Scholar]
- Gerritsen, S.; Egli, V.; Roy, R.; Haszard, J.; Backer, C.D.; Teunissen, L.; Cuykx, I.; Decorte, P.; Pabian, S.P.; Van Royen, K.; et al. Seven weeks of home-cooked meals: Changes to New Zealanders’ grocery shopping, cooking and eating during the COVID-19 lockdown. J. R. Soc. N. Zealand 2021, 51 (Suppl. 1), S4–S22. [Google Scholar] [CrossRef]
- Hall, K.D.; Ayuketah, A.; Brychta, R.; Cai, H.; Cassimatis, T.; Chen, K.Y.; Chung, S.T.; Costa, E.; Courville, A.; Darcey, V.; et al. Ultra-Processed Diets Cause Excess Calorie Intake and Weight Gain: An Inpatient Randomized Controlled Trial of Ad Libitum Food Intake. Cell Metab. 2019, 30, 67–77.e63. [Google Scholar] [CrossRef] [Green Version]
- Beslay, M.; Srour, B.; Méjean, C.; Allès, B.; Fiolet, T.; Debras, C.; Chazelas, E.; Deschasaux, M.; Wendeu-Foyet, M.G.; Hercberg, S.; et al. Ultra-processed food intake in association with BMI change and risk of overweight and obesity: A prospective analysis of the French NutriNet-Santé cohort. PLoS Med. 2020, 17, e1003256. [Google Scholar] [CrossRef]
- Srour, B.; Fezeu, L.K.; Kesse-Guyot, E.; Allès, B.; Debras, C.; Druesne-Pecollo, N.; Chazelas, E.; Deschasaux, M.; Hercberg, S.; Galan, P.; et al. Ultraprocessed Food Consumption and Risk of Type 2 Diabetes Among Participants of the NutriNet-Santé Prospective Cohort. JAMA Intern Med. 2019, 180, 283–291. [Google Scholar] [CrossRef]
- Srour, B.; Fezeu, L.K.; Kesse-Guyot, E.; Allès, B.; Méjean, C.; Andrianasolo, R.M.; Chazelas, E.; Deschasaux, M.; Hercberg, S.; Galan, P.; et al. Ultra-processed food intake and risk of cardiovascular disease: Prospective cohort study (NutriNet-Santé). BMJ 2019, 365, l1451. [Google Scholar] [CrossRef] [PubMed] [Green Version]
- Schnabel, L.; Kesse-Guyot, E.; Allès, B.; Touvier, M.; Srour, B.; Hercberg, S.; Buscail, C.; Julia, C. Association Between Ultraprocessed Food Consumption and Risk of Mortality Among Middle-aged Adults in France. JAMA Intern Med. 2019, 179, 490–498. [Google Scholar] [CrossRef] [PubMed]
- Julia, C.; Martinez, L.; Allès, B.; Touvier, M.; Hercberg, S.; Méjean, C.; Kesse-Guyot, E. Contribution of ultra-processed foods in the diet of adults from the French NutriNet-Santé study. Public Health Nutr. 2018, 21, 27–37. [Google Scholar] [CrossRef] [PubMed] [Green Version]
- Silva Meneguelli, T.; Viana Hinkelmann, J.; Hermsdorff, H.H.M.; Zulet, M.; Martínez, J.A.; Bressan, J. Food consumption by degree of processing and cardiometabolic risk: A systematic review. Int. J. Food Sci. Nutr. 2020, 71, 678–692. [Google Scholar] [CrossRef]
- Shamah-Levy, T.; Rodríguez-Ramírez, S.; Gaona-Pineda, E.B.; Cuevas-Nasu, L.; Carriquiry, A.L.; Rivera, J.A. Three 24-Hour Recalls in Comparison with One Improve the Estimates of Energy and Nutrient Intakes in an Urban Mexican Population. J. Nutr. 2016, 146, 1043–1050. [Google Scholar] [CrossRef] [Green Version]
- Monteiro, C.A.; Lawrence, M.; Millett, C.; Nestle, M.; Popkin, B.M.; Scrinis, G.; Swinburn, B. The need to reshape global food processing: A call to the United Nations Food Systems Summit. BMJ Glob. Health 2021, 6, e006885. [Google Scholar] [CrossRef]
- Monteiro, C.A.; Astrup, A. Does the concept of “ultra-processed foods” help inform dietary guidelines, beyond conventional classification systems? YES. Am. J. Clin. Nutr. 2022, nqac122. [Google Scholar] [CrossRef]
- Hodge, A.; Almeida, O.P.; English, D.R.; Giles, G.G.; Flicker, L. Patterns of dietary intake and psychological distress in older Australians: Benefits not just from a Mediterranean diet. Int. Psychogeriatr. 2013, 25, 456–466. [Google Scholar] [CrossRef]
- Jacka, F.N.; O’Neil, A.; Opie, R.; Itsiopoulos, C.; Cotton, S.; Mohebbi, M.; Castle, D.; Dash, S.; Mihalopoulos, C.; Chatterton, M.L.; et al. A randomised controlled trial of dietary improvement for adults with major depression (the ‘SMILES’ trial). BMC Med. 2017, 15, 23. [Google Scholar] [CrossRef] [Green Version]
- Parletta, N.; Zarnowiecki, D.; Cho, J.; Wilson, A.; Bogomolova, S.; Villani, A.; Itsiopoulos, C.; Niyonsenga, T.; Blunden, S.; Meyer, B.; et al. A Mediterranean-style dietary intervention supplemented with fish oil improves diet quality and mental health in people with depression: A randomized controlled trial (HELFIMED). Nutr. Neurosci. 2019, 22, 474–487. [Google Scholar] [CrossRef] [Green Version]
- Francis, H.M.; Stevenson, R.J.; Chambers, J.R.; Gupta, D.; Newey, B.; Lim, C.K. A brief diet intervention can reduce symptoms of depression in young adults—A randomised controlled trial. PLoS ONE 2019, 14, e0222768. [Google Scholar] [CrossRef] [PubMed]
- Firth, J.; Marx, W.; Dash, S.; Carney, R.; Teasdale, S.B.; Solmi, M.; Stubbs, B.; Schuch, F.B.; Carvalho, A.F.; Jacka, F.; et al. The Effects of Dietary Improvement on Symptoms of Depression and Anxiety: A Meta-Analysis of Randomized Controlled Trials. Psychosom. Med. 2019, 81, 265. [Google Scholar] [CrossRef] [PubMed]


| Author/Year | Study Characteristics | Confounding Variables | Mental Disorder Parameters | Results | Overall Critical Appraisal |
|---|---|---|---|---|---|
| Adjibade et al., 2019 [48] | Study design: Prospective Sample size: 26,730 Country: France Population: Adults Dietary assessment: 3 × 24-h dietary records | Age, sex, body mass index, marital status, educational level, occupational categories, household income per consumption unit, residential area, number of 24-h dietary records, inclusion month, energy consumption without alcohol, alcohol consumption, smoking status, and physical activity |
| ↑ vs. ↓ UPF
| No concerns. |
| Amadieu et al., 2021 [23] | Study design: Cross sectional Sample size: 48 Country: Belgium Population: Adults Dietary assessment: 3 × 24-h dietary records | Total energy intake |
| ↑ vs. ↓ UPF
| Potential bias: strategies to deal with confounding factors and statistical analysis domains. |
| Ayton et al., 2021 [31] | Study design: Cross sectional Sample size: 73 Country: UK Population: Adults and adolescents Dietary assessment: Clinician documented dietary intake by asking the patient to describe “a typical food intake per day over the past 2 weeks” | None |
| No between-group difference in average ultra-processed food consumption (Chi-squared test: p = 0.19):
| Potential bias: inclusion criteria; measurement validity; strategies to deal with confounding factors and statistical analysis domains. |
| Bonaccio et al., 2021 [22] | Study design: Cross sectional Sample size: 2741 Country: Italy Population: Adults Dietary assessment: Food-frequency questionnaire | Age, sex, geographical area, living area, educational level, household income, marital status, number of cohabitants, occupational class, history of chronic diseases, diagnosis of ≥1 disease during confinement, use of psychoactive drugs before and during lockdown |
| ↑ vs. ↓ UPF RISCOVID-19 sample
Moli-LOCK sample
| Potential bias: measurement validity domain. |
| Coletro et al., 2021 [21] | Study design: Cross sectional Sample size: 1693 Country: Brazil Population: Adults Dietary assessment: Food-frequency questionnaire | Sex, age, marital status, educational background, family income and medical diagnosis of depression or anxiety disorders |
| ↑ vs. ↓ UPF
| Potential bias: measurement validity domain. |
| Faisal-Cury et al., 2021 [17] | Study design: Cross sectional Sample size: 2680 Country: Brazil Population: Adolescents Dietary assessment: Food-frequency questionnaire | Sex, age, skin colour, indigenous mother schooling, school administrative dependency, physical activity practice and the habit of having meals with parents |
| ↑ vs. ↓ UPF
| No concerns. |
| Filgueiras et al., 2019 [30] | Study design: Cross sectional Sample size: 33 Country: Brazil Population: Children Dietary assessment: Semi-quantitative food-frequency questionnaire | Sugar, salt and fat consumption |
| Food addiction vs. no food addiction
| Potential bias: strategies to deal with confounding factors domain. |
| Gómez-Donoso et al., 2019 [49] | Study design: Prospective Sample size: 14,907 Country: Spain Population: Adults Dietary assessment: Semi-quantitative food-frequency questionnaire | Sex, stratified by age groups, and year of entrance to the cohort, baseline BMI, total energy consumption, physical activity, smoking status, marital status, living alone, employment status, working hours per week, health-related career, years of education, adherence to Trichopoulou’s MeDiet Score, and baseline self-perception of competitiveness, anxiety and dependence levels |
| ↑ vs. ↓ UPF
| No concerns. |
| Lopes Cortes et al., 2021 [27] | Study design: Cross sectional Sample size: 1270 Country: Brazil Population: Adults Dietary assessment: Food-frequency questionnaire | Sex, age, educational level, socioeconomic status, marital status, smoking, high-risk alcohol consumption, physical activity status, BMI status, and self-rated health |
| High vs. low/moderate perceived stress
| Potential bias: measurement validity domain. |
| Noll et al., 2022 [24] | Study design: Cross sectional Sample size: 225 Country: Brazil Population: Adults Dietary assessment: 3 × 24-h dietary records | Age, marital status, income, and early and late post-menopause |
| ↑ vs. ↓ UPF
| No concerns. |
| Ruggiero et al., 2020 [28] | Study design: Cross sectional Sample size: 8569 Country: Brazil Population: Adults Dietary assessment: 1 × 24-h dietary record | Age, sex and energy intake, education, geographical area, place of residence, sport activity, occupation, marital status, smoking, BMI, CVD, cancer, hypertension, diabetes and hyperlipidaemia |
|
| Potential bias: measurement validity domain. |
| Schulte et al., 2022 [29] | Study design: Cross sectional Sample size: 45 Country: USA Population: Adults Dietary assessment: Food-frequency questionnaire | Height and weight measurements considered biologically implausible values (height <44 inches (112 cm) or >90 inches (229 cm); weight <55 lb (24.95 kg) or >1000 lb (453.59 kg)), incorrectly answering “catch questions,” which have commonly-known answers (e.g., 2 + 2) designed to “catch” participants who respond without reading the questions carefully |
| Food addiction vs. no food addiction
| Potential bias: measurement validity domain. |
| Silva et al., 2021 [18] | Study design: Cross sectional Sample size: 70,427 Country: Brazil Population: Adolescents Dietary assessment: 1 × 24-h dietary record | Chronological age, ethnicity, region of the country, type of city (capital or interior), and physical activity |
| ↑ vs. ↓ UPF
| Potential bias: measurement validity domain. |
| Werneck et al., 2020 [26] | Study design: Cross sectional Sample size: 100,648 Country: Brazil Population: Adults Dietary assessment: Food-frequency questionnaire | Chronological age, ethnicity, region of the country, type of city (capital or interior), and physical activity |
| ↑ vs. ↓ UPF with high sedentary behaviour
↑ vs. ↓ UPF with high television viewing
| Potential bias: inclusion criteria and measurement validity domains. |
| Werneck et al., 2020 COVID [20] | Study design: Cross sectional Sample size: 42,024 Country: Brazil Population: Adolescents Dietary assessment: Food-frequency questionnaire | Sex, age group, highest academic achievement, working status during the pandemic, skin colour, alcohol use, tobacco smoking, diagnoses of COVID-19 on a close friend, co-worker or relative and adherence to the quarantine |
| Depression vs. no depression
| Potential bias: inclusion criteria and measurement validity domains. |
| Werneck et al., 2021 [25] | Study design: Cross sectional Sample size: 99,791 Country: Brazil Population: Adolescents Dietary assessment: Food-frequency questionnaire | Age group, ethnicity, food insecurity, country region, type of city and physical activity |
| ↑ vs. ↓ UPF
| Potential bias: inclusion criteria and measurement validity domains. |
| Zheng et al., 2020 [19] | Study design: Cross sectional Sample size: 13,637 Country: USA Population: Adults Dietary assessment: 1 × 24-h dietary record | Age, sex, race, BMI, educational level, annual family income, marital status, physical activity, drinking, smoking, current hypertension, diabetes history, heart disease history, and chronic bronchitis. |
| ↑ vs. ↓ UPF
| Potential bias: measurement validity domain. |
| Mental Disorder Parameters | Direct Association | Inverse Association | No Association |
|---|---|---|---|
| Meta-analyses (MA) | |||
| Common mental disorders combined | 1 Cross-sectional MA: OR 1.53, 95%CI 1.43 to 1.63, p < 0.001, N = 185,773 | ||
| Depression | 2 (a) Prospective MA: HR 1.22, 95%CI 1.16 to 1.28; p < 0.001, N = 41,637 (b) Cross-sectional MA: OR 1.44, 95%CI 1.14 to 1.82, p = 0.002, N = 15,555 | ||
| Anxiety | 1 Cross-sectional MA: OR 1.48, 95%CI 1.37 to 1.59, p < 0.001, N = 101,709 | ||
| Narrative synthesis of individual studies | |||
| Common mental disorders combined | 1 (Faisal-Cury, Leite et al., 2021) [17] | ||
| Depression | 3 (Werneck, Silva et al., 2020, Bonaccio, Costanzo et al., 2021) [20,22] | 1 (Amadieu, Leclercq et al., 2021) [23] | |
| Anxiety | 4 (Werneck, Vancampfort et al., 2020, Bonaccio, Costanzo et al., 2021) [22,26] | 1 (Amadieu, Leclercq et al., 2021) [23] | |
| Trauma and stress | 4 (Bonaccio, Costanzo et al., 2021, Lopes Cortes, Andrade Louzado et al., 2021) [22,27] | 3 (Ruggiero, Esposito et al., 2021) [28] | 3 (Bonaccio, Costanzo et al., 2021, Ruggiero, Esposito et al., 2021) [22,28] |
| Addiction | 5 (Filgueiras, Pires de Almeida et al., 2019, Amadieu, Leclercq et al., 2021, Schulte, Kral et al., 2021) [23,29,30] | 1 (Amadieu, Leclercq et al., 2021) [23] | |
Publisher’s Note: MDPI stays neutral with regard to jurisdictional claims in published maps and institutional affiliations. |
© 2022 by the authors. Licensee MDPI, Basel, Switzerland. This article is an open access article distributed under the terms and conditions of the Creative Commons Attribution (CC BY) license (https://creativecommons.org/licenses/by/4.0/).
Share and Cite
Lane, M.M.; Gamage, E.; Travica, N.; Dissanayaka, T.; Ashtree, D.N.; Gauci, S.; Lotfaliany, M.; O’Neil, A.; Jacka, F.N.; Marx, W. Ultra-Processed Food Consumption and Mental Health: A Systematic Review and Meta-Analysis of Observational Studies. Nutrients 2022, 14, 2568. https://doi.org/10.3390/nu14132568
Lane MM, Gamage E, Travica N, Dissanayaka T, Ashtree DN, Gauci S, Lotfaliany M, O’Neil A, Jacka FN, Marx W. Ultra-Processed Food Consumption and Mental Health: A Systematic Review and Meta-Analysis of Observational Studies. Nutrients. 2022; 14(13):2568. https://doi.org/10.3390/nu14132568
Chicago/Turabian StyleLane, Melissa M., Elizabeth Gamage, Nikolaj Travica, Thusharika Dissanayaka, Deborah N. Ashtree, Sarah Gauci, Mojtaba Lotfaliany, Adrienne O’Neil, Felice N. Jacka, and Wolfgang Marx. 2022. "Ultra-Processed Food Consumption and Mental Health: A Systematic Review and Meta-Analysis of Observational Studies" Nutrients 14, no. 13: 2568. https://doi.org/10.3390/nu14132568