
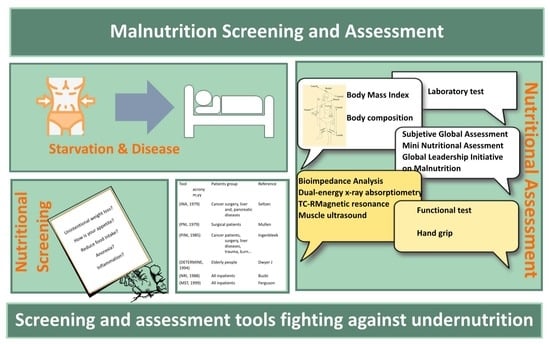
Malnutrition Screening and Assessment

 ,
,
Abstract
:
1. Introduction
2. Methods: Literature Search Strategy
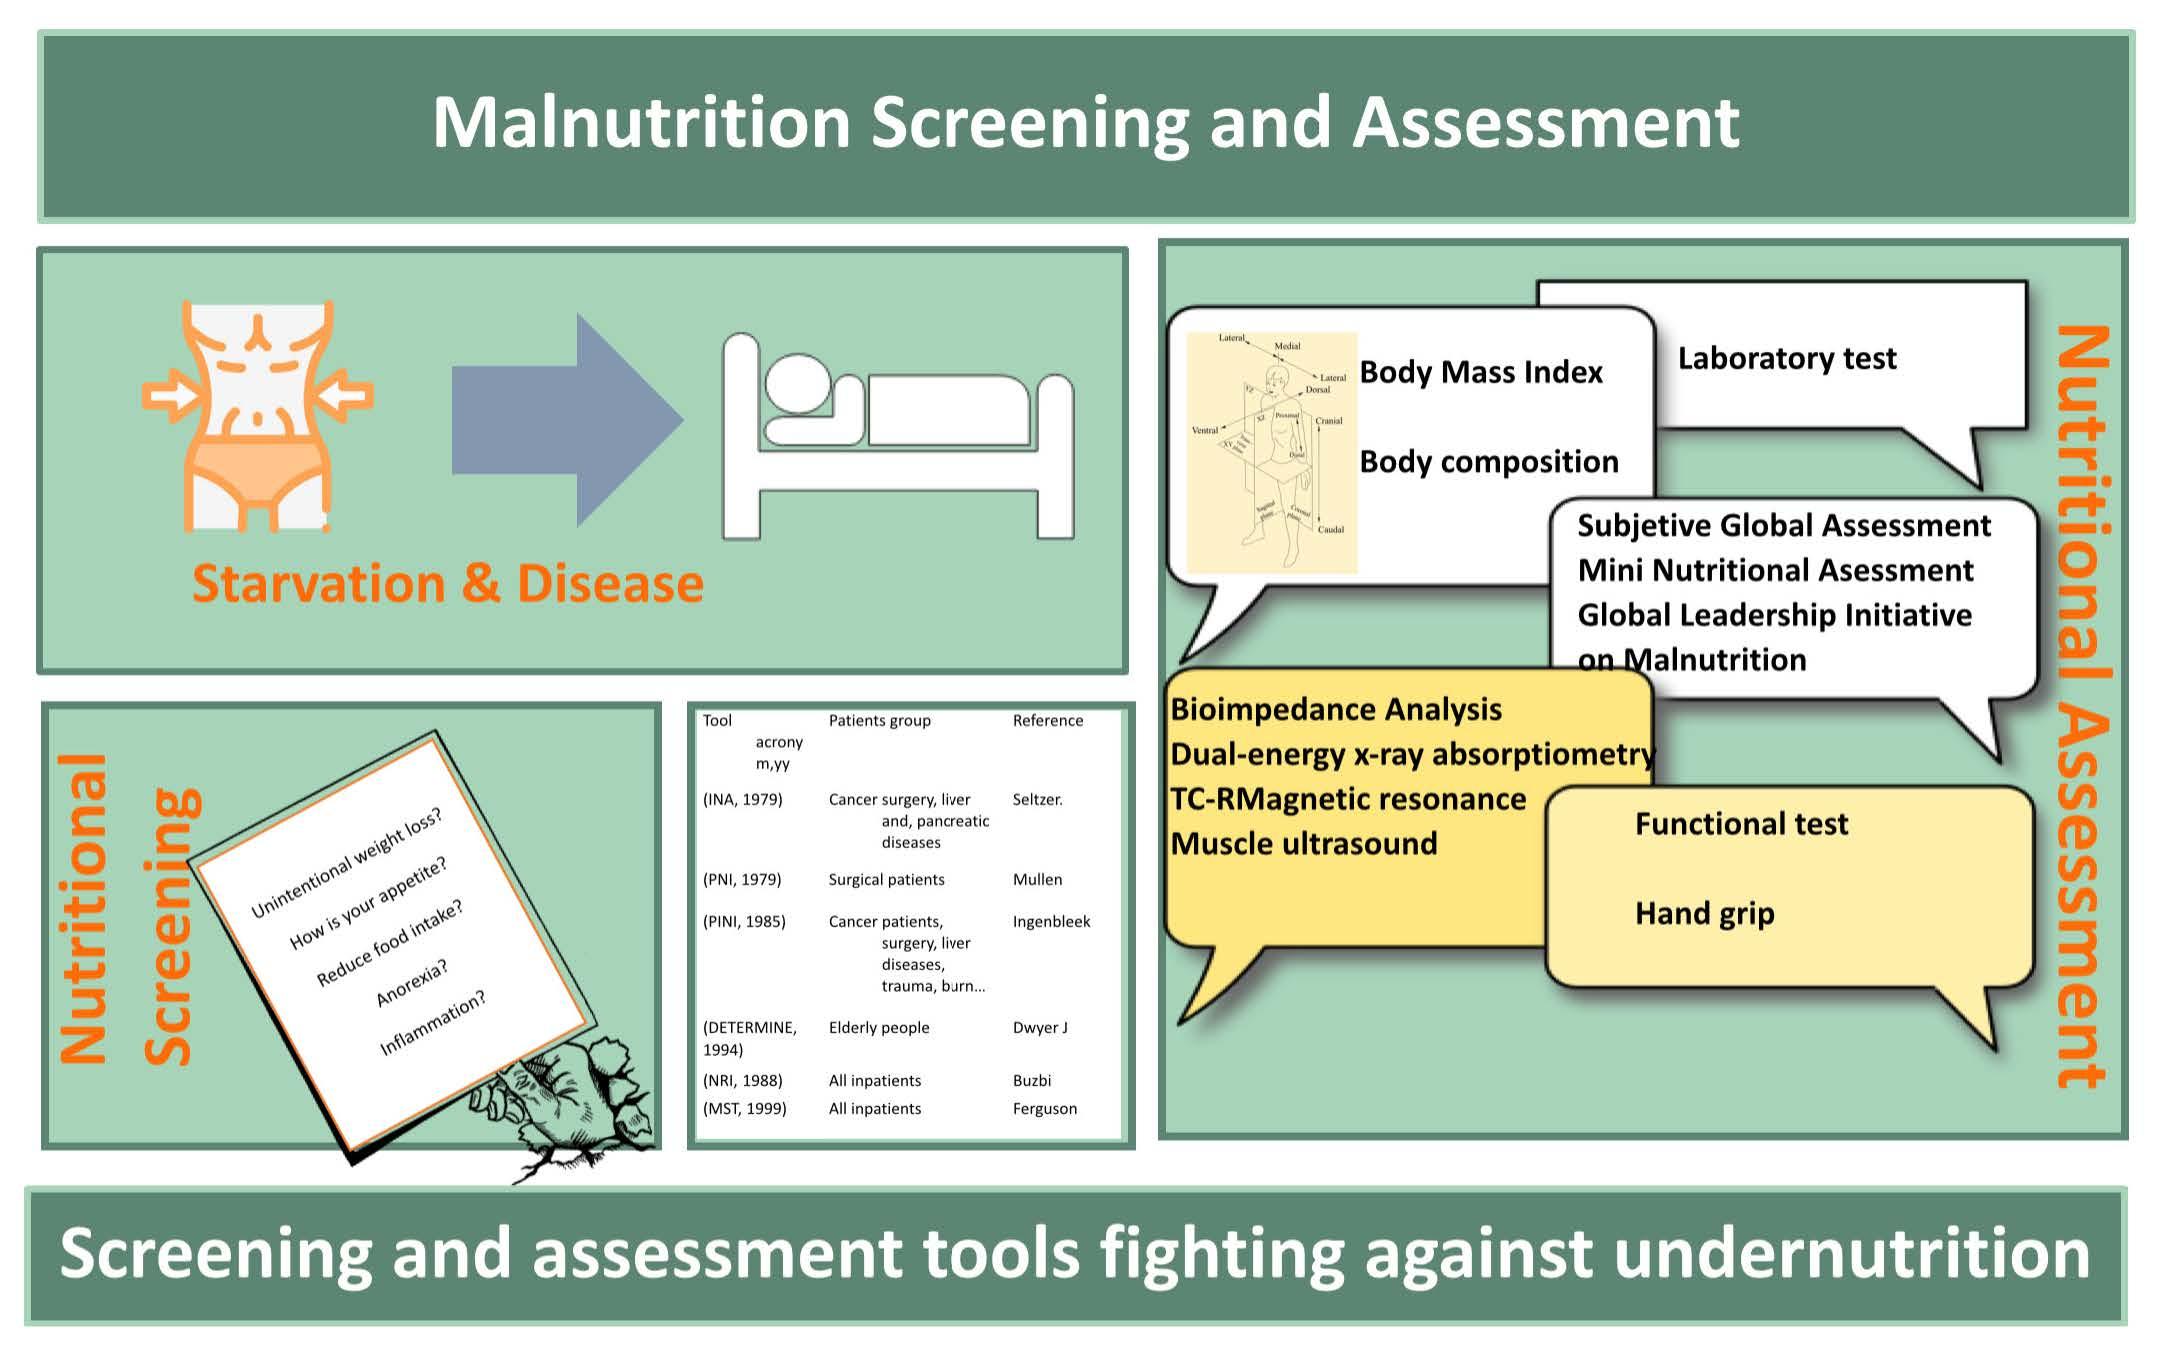
3. Early Diagnosis of Malnutrition: Nutritional Screening
4. Nutritional Screening Tools
4.1. Mini Nutritional Assessment Short Form (MNA-SF)
4.2. Malnutrition Universal Screening Test (MUST)
4.3. Simplified Nutritional Appetite Questionnaire (SNAQ)
4.4. Nutritional Risk Screening 2002 (NRS 2002)
4.5. Malnutrition Screening Tool (MST)
4.6. Nutrition Risk in the Critically Ill (NUTRIC Score)
4.7. Risk Scales Based on Nutritional Parameters
4.7.1. Nutritional Risk Index (NRI)
4.7.2. Geriatric Nutritional Risk Index (GNRI)
4.7.3. Prognostic Nutritional Index (PNI)
4.7.4. Prognostic Inflammatory and Nutritional Index (PINI)
4.8. Other Nutritional Screening Tools
5. Nutritional Assessment
5.1. Clinical Assessment
5.2. Anthropometry
5.2.1. Weight and Derived Indices
5.2.2. Body Mass Index (BMI)
5.2.3. Circumference Measures and Skinfolds
5.3. Body Composition Methods
5.3.1. Bioimpedance Analysis (BIA)
5.3.2. Dual-Energy X-ray Absorptiometry (DEXA)
5.3.3. Computed Tomography (TC)
5.3.4. Magnetic Resonance Imaging (MRI)
5.3.5. Densitometry
5.3.6. Other Techniques
5.3.7. Muscle Ultrasonography
5.4. Functional Examination
- Functional measurement of muscle strength is important, since protein and energy deficiency decrease muscle strength and power, and general physical condition. Muscle function tests are very sensitive to nutritional deficiencies and, therefore, to nutritional interventions as well. The most widely used test is dynamometry, which measures voluntary muscle strength (hand grip strength) and correlates well with nutritional status and results, as well as with the response to nutrition and the rehabilitation process. It is easy to perform and provides quantitative data that can be used in the diagnosis of sarcopenia; one diagnostic criterion is a manual compression force of <27 kg in men and <16 kg in women [132]. There is an inverse relationship between the pressure produced and the number of postoperative complications, length of hospital stays, and hospital readmission rate [133]. It is one of the diagnostic criteria for malnutrition for ASPEN [133];
- Respiratory function: the measurement of peak flow and FEV1 reflects respiratory muscle strength, related to catabolism and protein loss;
- Immune function: measures the cellular response to intradermal antigens. Situations of severe malnutrition led to anergy: a lack of response to antigens.
5.5. Laboratory Parameters
- Serum albumin is the most extensively studied protein in relation to malnutrition, and it is shown to be a good predictor of surgical risk [135,136]. However, due to its long half-life of 18 days, it reflects the severity of the disease and not of malnutrition in acute situations, behaving as a negative acute-phase reactant which, in inflammatory situations, causes a reduction in its synthesis, an increase in transcapillary losses, and an increase in degradation and dilution due to hyperhydration. However, it is a good nutritional indicator in chronic malnutrition. Serum albumin is often included in certain nutritional screening tools, particularly nutritional risk scores [110,137,138,139];
- Shorter half-life proteins, such as transthyretin (2 days) and transferrin (7 days), are also subject to the same distribution and influences of dilution as albumin, but may be better and more sensitive reflections of nutritional status. Transthyretin, also called prealbumin, is a good marker of malnutrition when there are no signs of inflammation [140], and it is a good data item for following evolution after a nutritional intervention, even when inflammation is present [137]. Normal values are between 20 and 30 mg/dL, a moderate degree of malnutrition is between 10 and 20 mg/dl, and severe malnutrition corresponds to values below 10 mg/dL. In different studies it is correlated with visceral and muscle proteins compared with studies using BIA and DXA [141]. The C-reactive protein (CRP)/prealbumin ratio, known to be a prognostic indicator of complications, is proposed for assessing the effect of inflammation on prealbumin levels [142];
- Creatinine reflects kidney function, but also correlates with muscle mass. Creatine is metabolized to creatinine at a steady rate, and it is related to the muscle mass. Its excretion in 24 h is used to calculate the creatinine height index CHI% = (urine creatinine in 24 h × 100)/ideal creatin uria index obtained from standard tables. Values of >30% indicate severe muscle depletion, values between 15% and 30% are moderate, and below 15% is mild [110];
- Another parameter measured in urine is 3-Methylhistidine (3MH), which fundamentally depends on muscle degradation, pointing to a decrease in situations of muscle mass loss, and to an increase in situations of stress-associated protein catabolism [143];
- Nitrogen balance can be useful in critically ill patients in whom nitrogen intake is known, and nitrogen losses through urine can be measured either directly using the Kjeldahl method, or by extrapolating it from the urine’s urea content. Although it is not exact, it can provide guidance in ascertaining protein catabolism and as an indication for intake [143];
6. Methods of Nutritional Screening and Assessment
6.1. Subjective Global Assessment (SGA)
6.2. Mini Nutritional Assessment (MNA)
6.3. ESPEN Criteria
6.4. AND/ASPEN Tool (ASPEN)
6.5. Global Leadership Initiative on Malnutrition (GLIM)
6.6. Resume of Nutritional Assessments Tools
7. Discussion
- Body composition measurement tools are used mostly in research, although some of them, such as anthropometry and BIA, can be used in the clinical setting, supported by CT, DXA, and MRI;
- Initiatives for performing nutritional assessment through tools such as SGA, MNA, ESPEN criteria, AND-ASPEN, and GLIM are recommended by the scientific societies, are intended to reach an easier and faster diagnosis, and can be applied to a greater typology of patients;
- The NFPE, together with anthropometric and biochemical values, and particularly with function measurements, such as quality of life and dietary intake surveys, together with muscle strength measurements. Although it is costly in time, it can give a nutritional diagnosis, determine the severity of the malnutrition, and help to highlight specific vitamin and micronutrient deficiencies.
8. Conclusions
Author Contributions
Funding
Institutional Review Board Statement
Informed Consent Statement
Data Availability Statement
Conflicts of Interest
References
- Cederholm, T.; Barazzoni, R.; Austin, P.; Ballmer, P.; Biolo, G.; Bischoff, S.C.; Compher, C.; Correia, I.; Higashiguchi, T.; Holst, M.; et al. ESPEN Guidelines on Definitions and Terminology of Clinical Nutrition. Clin. Nutr. 2017, 36, 49–64. [Google Scholar] [CrossRef]
- Soeters, P.; Bozzetti, F.; Cynober, L.; Forbes, A.; Shenkin, A.; Sobotka, L. Defining Malnutrition: A Plea to Rethink. Clin. Nutr. 2017, 36, 896–901. [Google Scholar] [CrossRef] [PubMed] [Green Version]
- Leij-Halfwerk, S.; Verwijs, M.H.; van Houdt, S.; Borkent, J.W.; Guaitoli, P.R.; Pelgrim, T.; Heymans, M.W.; Power, L.; Visser, M.; Corish, C.A.; et al. Prevalence of Protein-Energy Malnutrition Risk in European Older Adults in Community, Residential and Hospital Settings, According to 22 Malnutrition Screening Tools Validated for Use in Adults ≥65 Years: A Systematic Review and Meta-Analysis. Maturitas 2019, 126, 80–89. [Google Scholar] [CrossRef] [PubMed]
- Barker, L.A.; Gout, B.S.; Crowe, T.C. Hospital Malnutrition: Prevalence, Identification and Impact on Patients and the Healthcare System. Int. J. Environ. Res. Public Health 2011, 8, 514–527. [Google Scholar] [CrossRef] [PubMed] [Green Version]
- Leiva Badosa, E.; Badia Tahull, M.; Virgili Casas, N.; Elguezabal Sangrador, G.; Faz Méndez, C.; Herrero Meseguer, I.; Izquierdo González, À.; López Urdiales, R.; de Oca Burguete, F.J.; Tubau Molas, M.; et al. Cribado de La Desnutrición Hospitalaria En La Admisión: La Desnutrición Aumenta La Mortalidad y La Duración de La Estancia Hospitalaria. Nutr. Hosp. 2017, 34, 907–913. [Google Scholar] [CrossRef] [PubMed]
- Allard, J.P.; Keller, H.; Jeejeebhoy, K.N.; Laporte, M.; Duerksen, D.R.; Gramlich, L.; Payette, H.; Bernier, P.; Davidson, B.; Teterina, A.; et al. Decline in Nutritional Status Is Associated with Prolonged Length of Stay in Hospitalized Patients Admitted for 7 Days or More: A Prospective Cohort Study. Clin. Nutr. 2016, 35, 144–152. [Google Scholar] [CrossRef]
- Zhang, H.; Wang, Y.; Jiang, Z.M.; Kondrup, J.; Fang, H.; Andrews, M.; Nolan, M.T.; Mu, S.Y.; Zhang, J.; Yu, K.; et al. Impact of Nutrition Support on Clinical Outcome and Cost-Effectiveness Analysis in Patients at Nutritional Risk: A Prospective Cohort Study with Propensity Score Matching. Nutrition 2017, 37, 53–59. [Google Scholar] [CrossRef]
- Cardenas, D.; Bermúdez, C.; Pérez, A.; Diaz, G.; Cortes, L.Y.; Contreras, C.P.; Pinzón-Espitia, O.L.; Gomez, G.; Gonzalez, M.C.; Fantin, R.; et al. Nutritional Risk Is Associated with an Increase of In-Hospital Mortality and a Reduction of Being Discharged Home: Results of the 2009–2015 NutritionDay Survey. Clin. Nutr. ESPEN 2020, 38, 138–145. [Google Scholar] [CrossRef]
- Zhang, X.; Tang, T.; Pang, L.; Sharma, S.V.; Li, R.; Nyitray, A.G.; Edwards, B.J. Malnutrition and Overall Survival in Older Adults with Cancer: A Systematic Review and Meta-Analysis. J. Geriatr. Oncol. 2019, 10, 874–883. [Google Scholar] [CrossRef]
- Bauer, J.M.; Kaiser, M.J.; Sieber, C.C. Evaluation of Nutritional Status in Older Persons: Nutritional Screening and Assessment. Curr. Opin. Clin. Nutr. Metab. Care 2010, 13, 8–13. [Google Scholar] [CrossRef]
- Yárnoz-Esquíroz, P.; Lacasa, C.; Riestra, M.; Silva, C.; Frühbeck, G. Clinical and Financial Implications of Hospital Malnutrition in Spain. Eur. Eat. Disord. Rev. 2019, 27, 581–602. [Google Scholar] [CrossRef] [PubMed]
- Schindler, K.; Pernicka, E.; Laviano, A.; Howard, P.; Schütz, T.; Bauer, P.; Grecu, I.; Jonkers, C.; Kondrup, J.; Ljungqvist, O.; et al. How Nutritional Risk Is Assessed and Managed in European Hospitals: A Survey of 21,007 Patients Findings from the 2007–2008 Cross-Sectional NutritionDay Survey. Clin. Nutr. 2010, 29, 552–559. [Google Scholar] [CrossRef] [PubMed]
- Smith, L.; Chapman, A.; Flowers, K.; Wright, K.; Chen, T.; O’Connor, C.; Astorga, C.; Francis, N.; Vigh, G.; Wainwright, C. Nutritional Screening, Assessment and Implementation Strategies for Adults in an Australian Acute Tertiary Hospital: A Best Practice Implementation Report. JBI Database Syst. Rev. Implement. Rep. 2018, 16, 233–246. [Google Scholar] [CrossRef] [PubMed]
- Mogensen, K.M.; Malone, A.; Becker, P.; Cutrell, S.; Frank, L.; Gonzales, K.; Hudson, L.; Miller, S.; Guenter, P. Academy of Nutrition and Dietetics/American Society for Parenteral and Enteral Nutrition Consensus Malnutrition Characteristics: Usability and Association with Outcomes. Nutr. Clin. Pract. 2019, 34, 657–665. [Google Scholar] [CrossRef]
- Ukleja, A.; Gilbert, K.; Mogensen, K.M.; Walker, R.; Ward, C.T.; Ybarra, J.; Holcombe, B. Standards for Nutrition Support: Adult Hospitalized Patients. Nutr. Clin. Pract. 2018, 33, 906–920. [Google Scholar] [CrossRef]
- Mueller, C.; Compher, C.; Ellen, D.M. ASPEN Clinical Guidelines: Nutrition Screening, Assessment, and Intervention in Adults. J. Parenter. Enter. Nutr. 2011, 35, 16–24. [Google Scholar] [CrossRef]
- Bokhorst-De Van Der Schueren, V.A.N.; Guaitoli, P.R.; Jansma, E.P.; de Vet, H.C.W. Nutrition Screening Tools: Does One Size Fit All? A Systematic Review of Screening Tools for the Hospital Setting. Clin. Nutr. 2014, 33, 39–58. [Google Scholar] [CrossRef]
- Kondrup, J.; Allison, S.P.; Elia, M.; Vellas, B.; Plauth, M. ESPEN Guidelines for Nutrition Screening 2002. Clin. Nutr. 2003, 22, 415–421. [Google Scholar] [CrossRef]
- Skipper, A.; Ferguson, M.; Thompson, K.; Castellanos, V.H.; Porcari, J. Nutrition Screening Tools: An Analysis of the Evidence. J. Parenter. Enter. Nutr. 2012, 36, 292–298. [Google Scholar] [CrossRef]
- Skipper, A.; Coltman, A.; Tomesko, J.; Charney, P.; Porcari, J.; Piemonte, T.A.; Handu, D.; Cheng, F.W. Adult Malnutrition (Undernutrition) Screening: An Evidence Analysis Center Systematic Review. J. Acad. Nutr. Diet. 2020, 120, 669–708. [Google Scholar] [CrossRef]
- Amaral, T.F.; Antunes, A.; Cabral, S.; Alves, P.; Kent-Smith, L. An Evaluation of Three Nutritional Screening Tools in a Portuguese Oncology Centre. J. Hum. Nutr. Diet. 2008, 21, 575–583. [Google Scholar] [CrossRef] [PubMed]
- Boulhosa, R.S.S.B.; Lourenço, R.P.; Côrtes, D.M.; Oliveira, L.P.M.; Lyra, A.C.; de Jesus, R.P. Comparison between Criteria for Diagnosing Malnutrition in Patients with Advanced Chronic Liver Disease: GLIM Group Proposal versus Different Nutritional Screening Tools. J. Hum. Nutr. Diet. 2020, 33, 862–868. [Google Scholar] [CrossRef] [PubMed]
- Cascio, B.L.; Logomarsino, J.V. Evaluating the Effectiveness of Five Screening Tools Used to Identify Malnutrition Risk in Hospitalized Elderly: A Systematic Review. Geriatr. Nurs. 2018, 39, 95–102. [Google Scholar] [CrossRef] [PubMed]
- Corish, C.A.; Flood, P.; Kennedy, N.P. Comparison of Nutritional Risk Screening Tools in Patients on Admission to Hospital. J. Hum. Nutr. Diet. 2004, 17, 133–139. [Google Scholar] [CrossRef] [PubMed]
- Rubenstein, L.Z.; Harker, J.O.; Salvà, A.; Guigoz, Y.; Vellas, B. Screening for Undernutrition in Geriatric Practice: Developing the Short-Form Mini-Nutritional Assessment (MNA-SF). J. Gerontol. Ser. A Biol. Sci. Med. Sci. 2001, 56, 366–372. [Google Scholar] [CrossRef] [Green Version]
- Salvi, F.; Giorgi, R.; Grilli, A.; Morichi, V.; Espinosa, E.; Spazzafumo, L.; Marinozzi, M.L.; Dessì-Fulgheri, P. Mini Nutritional Assessment (Short Form) and Functional Decline in Older Patients Admitted to an Acute Medical Ward Aging Clinical and Experimental Research. Aging Clin. Exp. Res. 2008, 20, 322–328. [Google Scholar] [CrossRef]
- Dent, E.; Chapman, I.M.; Piantadosi, C.; Visvanathan, R. Performance of Nutritional Screening Tools in Predicting Poor Six-Month Outcome in Hospitalised Older Patients. Asia Pac. J. Clin. Nutr. 2014, 23, 394–399. [Google Scholar] [CrossRef]
- Dent, E.; Chapman, I.; Piantadosi, C.; Visvanathan, R. Nutritional Screening Tools and Anthropometric Measures Associate with Hospital Discharge Outcomes in Older People. Australas. J. Ageing 2015, 34, E1–E6. [Google Scholar] [CrossRef]
- Raslan, M.; Gonzalez, M.C.; Gonçalves Dias, M.C.; Nascimento, M.; Castro, M.; Marques, P.; Segatto, S.; Torrinhas, R.S.; Cecconello, I.; Waitzberg, D.L. Comparison of Nutritional Risk Screening Tools for Predicting Clinical Outcomes in Hospitalized Patients. Nutrition 2010, 26, 721–726. [Google Scholar] [CrossRef]
- Phillips, M.B.; Foley, A.L.; Barnard, R.; Isenring, E.A.; Miller, M.D. Nutritional Screening in Community-Dwelling Older Adults: A Systematic Literature Review. Asia Pac. J. Clin. Nutr. 2010, 19, 440–449. [Google Scholar]
- Elia, M. The “MUST” Report. Nutritional Screening of Adults: A Multidisciplinary Responsibility. Development and Use of the “Malnutrition Universal Screening Tool” (‘MUST’) for Adults; Chairman of MAG and Editor Advancing Clinical Nutrition, a Standing Committee of BAPEN; BAPEN: Redditch, UK, 2003. [Google Scholar]
- Poulia, K.A.; Klek, S.; Doundoulakis, I.; Bouras, E.; Karayiannis, D.; Baschali, A.; Passakiotou, M.; Chourdakis, M. The Two Most Popular Malnutrition Screening Tools in the Light of the New ESPEN Consensus Definition of the Diagnostic Criteria for Malnutrition. Clin. Nutr. 2017, 36, 1130–1135. [Google Scholar] [CrossRef] [PubMed]
- Lomivorotov, V.V.; Efremov, S.M.; Boboshko, V.A.; Nikolaev, D.A.; Vedernikov, P.E.; Deryagin, M.N.; Lomivorotov, V.N.; Karaskov, A.M. Prognostic Value of Nutritional Screening Tools for Patients Scheduled for Cardiac Surgery. Interact. Cardiovasc. Thorac. Surg. 2013, 16, 612–618. [Google Scholar] [CrossRef] [PubMed]
- Calleja Fernández, A.; Vidla Casariego, A.; Cano Rodríguez, I.; Ballesteros Pomar, M.D. Eficacia y Efectividad de Las Distintas Herramientas de Cribado Nutricional En Un Hospital de Tercer Nivel. Nutr. Hosp. 2015, 31, 2240–2246. [Google Scholar] [CrossRef] [PubMed]
- Fiol-Martínez, L.; Calleja-Fernández, A.; Pintor de la Maza, B.; Vidal-Casariego, A.; Villar-Taibo, R.; Urioste-Fondo, A.; Cuervo, M.; Cano-Rodríguez, I.; Ballesteros-Pomar, M.D. Comparison of Two Nutritional Screening Tools to Detect Nutritional Risk in Hematologic Inpatients. Nutrition 2017, 34, 97–100. [Google Scholar] [CrossRef] [PubMed]
- Poulia, K.A.; Yannakoulia, M.; Karageorgou, D.; Gamaletsou, M.; Panagiotakos, D.B.; Sipsas, N.V.; Zampelas, A. Evaluation of the Efficacy of Six Nutritional Screening Tools to Predict Malnutrition in the Elderly. Clin. Nutr. 2012, 31, 378–385. [Google Scholar] [CrossRef]
- Anthony, P.S. Nutrition Screening Tools for Hospitalized Patients. Nutr. Clin. Pract. 2008, 23, 373–382. [Google Scholar] [CrossRef]
- Stratton, R.J.; Hackston, A.; Longmore, D.; Dixon, R.; Price, S.; Stroud, M.; King, C.; Elia, M. Malnutrition in Hospital Outpatients and Inpatients: Prevalence, Concurrent Validity and Ease of Use of the ‘Malnutrition Universal Screening Tool’ (‘MUST’) for Adults. Br. J. Nutr. 2004, 92, 799–808. [Google Scholar] [CrossRef]
- Kruizenga, H.M.; Seidell, J.C.; de Vet, H.C.W.; Wierdsma, N.J.; van Bokhorst-de van der Schueren, M.A.E. Development and Validation of a Hospital Screening Tool for Malnutrition: The Short Nutritional Assessment Questionnaire (SNAQ©). Clin. Nutr. 2005, 24, 75–82. [Google Scholar] [CrossRef]
- Kondrup, J.; Ramussen, H.H.; Hamberg, O.; Stanga, Z.; Camilo, M.; Richardson, R.; Elia, M.; Allison, S.; Meier, R.; Plauth, M. Nutritional Risk Screening (NRS 2002): A New Method Based on an Analysis of Controlled Clinical Trials. Clin. Nutr. 2003, 22, 321–336. [Google Scholar] [CrossRef]
- Bolayir, B.; Arik, G.; Yeşil, Y.; Kuyumcu, M.E.; Varan, H.D.; Kara, Ö.; Güngör, A.E.; Yavuz, B.B.; Cankurtaran, M.; Halil, M.G. Validation of Nutritional Risk Screening-2002 in a Hospitalized Adult Population. Nutr. Clin. Pract. 2019, 34, 297–303. [Google Scholar] [CrossRef]
- Rattanachaiwong, S.; Zribi, B.; Kagan, I.; Theilla, M.; Heching, M.; Singer, P. Comparison of Nutritional Screening and Diagnostic Tools in Diagnosis of Severe Malnutrition in Critically Ill Patients. Clin. Nutr. 2020, 39, 3419–3425. [Google Scholar] [CrossRef] [PubMed]
- Martinuzzi, A.L.N.; Manzanares, W.; Quesada, E.; Reberendo, M.J.; Baccaro, F.; Aversa, I.; Kecskes, C.E.; Magnifico, L.; González, V.; Bolzicco, D.; et al. Nutritional Risk and Clinical Outcomes in Critically Ill Adult Patients with Covid-19. Nutr. Hosp. 2021, 38, 1119–1125. [Google Scholar] [CrossRef] [PubMed]
- Zhen, S.; Kong, X.-J.; Jing, X.; Deng, R.-J.; Tian, Z.-B. Nutritional Risk Screening 2002 as a Predictor of Postoperative Outcomes in Patients Undergoing Abdominal Surgery: A Systematic Review and Meta-Analysis of Prospective Cohort Studies. PLoS ONE 2015, 10, e0132857. [Google Scholar]
- Ocón Bretón, M.J.; Altemir Trallero, J.; Mañas Martínez, A.B.; Sallán Díaz, L.; Aguillo Gutiérrez, E.; Gimeno Orna, J.A. Comparación de Dos Herramientas de Cribado Nutricional Para Predecir La Aparición de Complicaciones En Pacientes Hospitalizados. Nutr. Hosp. 2012, 27, 701–706. [Google Scholar] [PubMed]
- Ferguson, M.; Capra, S.; Bauer, J.; Banks, M. Development of a Valid and Reliable Malnutrition Screening Tool for Adult Acute Hospital Patients. Nutrition 1999, 15, 458–464. [Google Scholar] [CrossRef]
- De Ulibarri Perez, J.I.; Giménez, A.G.M.; Pérez, P.G.; Fernandez, G.; Salvanés, F.R.; Estrada, A.M.A.; Diaz, A.; Travé, T.D.; Romero, C.D.; Sánchez, P.H.; et al. New Procedure for the Early Detection and Control of Under-Nourishment in Hospitals. Nutr. Hosp. 2002, 17, 179–188. [Google Scholar] [PubMed]
- Heyland, D.K.; Dhaliwal, R.; Jiang, X.; Day, A.G. Identifying Critically Ill Patients Who Benefit the Most from Nutrition Therapy: The Development and Initial Validation of a Novel Risk Assessment Tool. Crit. Care 2011, 15, 1–11. [Google Scholar] [CrossRef] [Green Version]
- Rahman, A.; Hasan, R.M.; Agarwala, R.; Martin, C.; Day, A.G.; Heyland, D.K. Identifying Critically-Ill Patients Who Will Benefit Most from Nutritional Therapy: Further Validation of the “Modified NUTRIC” Nutritional Risk Assessment Tool. Clin. Nutr. 2016, 35, 158–162. [Google Scholar] [CrossRef]
- Zhang, P.; He, Z.; Yu, G.; Peng, D.; Feng, Y.; Ling, J.; Wang, Y.; Li, S.; Bian, Y. The Modified NUTRIC Score Can Be Used for Nutritional Risk Assessment as Well as Prognosis Prediction in Critically Ill COVID-19 Patients. Clin. Nutr. 2021, 40, 534–541. [Google Scholar] [CrossRef]
- Kondrup, J. Nutrition Risk Screening in the ICU. Curr. Opin. Clin. Nutr. Metab. Care 2019, 22, 159–161. [Google Scholar] [CrossRef]
- Cattani, A.; Eckert, I.C.; Brito, J.E.; Tartari, R.F.; Silva, F.M. Nutritional Risk in Critically Ill Patients: How It Is Assessed, Its Prevalence and Prognostic Value: A Systematic Review. Nutr. Rev. 2020, 78, 1052–1068. [Google Scholar] [CrossRef] [PubMed]
- Canales, C.; Elsayes, A.; Yeh, D.D.; Belcher, D.; Nakayama, A.; McCarthy, C.M.; Chokengarmwong, N.; Quraishi, S.A. Nutrition Risk in Critically Ill Versus the Nutritional Risk Screening 2002: Are They Comparable for Assessing Risk of Malnutrition in Critically Ill Patients? J. Parenter. Enter. Nutr. 2019, 43, 81–87. [Google Scholar] [CrossRef] [PubMed]
- Coruja, M.K.; Cobalchini, Y.; Wentzel, C.; da Fink, S.J. Nutrition Risk Screening in Intensive Care Units: Agreement Between NUTRIC and NRS 2002 Tools. Nutr. Clin. Pract. 2020, 35, 567–571. [Google Scholar] [CrossRef] [PubMed]
- Brascher, J.M.M.; Peres, W.A.F.; Padilha, P.C. Use of the Modified “Nutrition Risk in the Critically Ill” Score and Its Association with the Death of Critically Ill Patients. Clin. Nutr. ESPEN 2020, 35, 162–166. [Google Scholar] [CrossRef] [PubMed]
- Buzby, G.P.; Peterson, O.L.; Page, C.P.; Reinhardt, G.F.; Mullen, J.L. A Randomized Clinical Trial of Total Parenteral Nutrition in Malnourished Surgical Patients: The Rationale and Impact of Previous Clinical Trials and Pilot Study on Protocol Design. Am. J. Clin. Nutr. 1988, 47, 357–365. [Google Scholar] [CrossRef] [PubMed]
- Kyle, U.G.; Pirlich, M.; Schuetz, T.; Lochs, H.; Pichard, C. Is Nutritional Depletion by Nutritional Risk Index Associated with Increased Length of Hospital Stay? A Population-Based Study. J. Parenter. Enter. Nutr. 2004, 28, 99–104. [Google Scholar] [CrossRef] [PubMed]
- Bouillanne, O.; Morineau, G.; Dupont, C.; Coulombel, I.; Vincent, J.-P.; Nicolis, I.; Benazeth, S.; Cynober, L.; Aussel, C. Geriatric Nutritional Risk Index: A New Index for Evaluating at-Risk Elderly Medical Patients. Am. J. Clin. Nutr. 2005, 82, 777–783. [Google Scholar] [CrossRef] [Green Version]
- Cereda, E.; Pedrolli, C. The Geriatric Nutritional Risk Index. Curr. Opin. Clin. Nutr. Metab. Care 2009, 12, 1–7. [Google Scholar] [CrossRef]
- Dong, C.H.; Chen, S.Y.; Zeng, H.L.; Yang, B.; Pan, J. Geriatric Nutritional Risk Index Predicts All-Cause Mortality in Patients with Heart Failure: A Systematic Review and Meta-Analysis. Clinics 2021, 76, e2258. [Google Scholar] [CrossRef]
- Lv, G.Y.; An, L.; Sun, D.W. Geriatric Nutritional Risk Index Predicts Adverse Outcomes in Human Malignancy: A Meta-Analysis. Dis. Markers 2019, 2019, 4796598. [Google Scholar] [CrossRef] [Green Version]
- Hao, X.; Li, D.; Zhang, N. Geriatric Nutritional Risk Index as a Predictor for Mortality: A Meta-Analysis of Observational Studies. Nutr. Res. 2019, 71, 8–20. [Google Scholar] [CrossRef] [PubMed]
- Yamada, K.; Furuya, R.; Takita, T.; Maruyama, Y.; Yamaguchi, Y.; Ohkawa, S.; Kumagai, H. Simplified Nutritional Screening Tools for Patients on Maintenance Hemodialysis. Am. J. Clin. Nutr. 2008, 87, 106–119. [Google Scholar] [CrossRef] [PubMed] [Green Version]
- Nakagawa, N.; Maruyama, K.; Hasebe, N. Utility of Geriatric Nutritional Risk Index in Patients with Chronic Kidney Disease: A Mini-review. Nutrients 2021, 13, 3688. [Google Scholar] [CrossRef] [PubMed]
- Rasheedy, D.; El-Kawaly, W.H. The Accuracy of the Geriatric Nutritional Risk Index in Detecting Frailty and Sarcopenia in Hospitalized Older Adults. Aging Clin. Exp. Res. 2020, 32, 2469–2477. [Google Scholar] [CrossRef]
- Mullen, J.L.; Buzby, G.P.; Waldman, T.G.; Gertner, M.H.; Hobbs, C.L.; Rosato, E.F. Prediction of Operative Morbidity and Mortality by Preoperative Nutritional As-Sessment. Surg. Forum 1979, 30, 80–82. [Google Scholar]
- Mullen, J.L.; Buzby, G.P.; Matthews, D.C.; Smale, B.F.; Rosato, E.F. Reduction of Operative Morbidity and Mortality by Combined Preoperative and Postoperative Nutritional Support. Ann. Surg. 1980, 192, 604–613. [Google Scholar] [CrossRef]
- Sun, K.; Chen, S.; Xu, J.; Li, G.; He, Y. The Prognostic Significance of the Prognostic Nutritional Index in Cancer: A Systematic Review and Meta-Analysis. J. Cancer Res. Clin. Oncol. 2014, 140, 1537–1549. [Google Scholar] [CrossRef]
- Li, P.; Wang, X.; Lai, Y.; Zhou, K.; Tang, Y.; Che, G. The Prognostic Value of Pre-Treatment Prognostic Nutritional Index in Esophageal Squamous Cell Carcinoma: A Meta-Analysis. Medicine 2019, 98, e15280. [Google Scholar] [CrossRef]
- Yang, Y.; Gao, P.; Chen, X.; Song, Y.; Shi, J.; Zhao, J.; Sun, J.; Xu, Y.; Wang, Z. Prognostic Significance of Preoperative Prognostic Nutritional Index in Colorectal Cancer: Results from a Retrospective Cohort Study and a Meta-Analysis. Oncotarget 2016, 7, 58543–58552. [Google Scholar] [CrossRef] [Green Version]
- Gao, Q.L.; Shi, J.G.; Huang, Y.D. Prognostic Significance of Pretreatment Prognostic Nutritional Index (PNI) in Patients with Nasopharyngeal Carcinoma: A Meta-Analysis. Nutr. Cancer 2021, 73, 1657–1667. [Google Scholar] [CrossRef]
- Çakmak, E.; Öcal, L.; Erdoğan, E.; Cerşit, S.; Efe, S.Ç.; Karagöz, A.; Yılmaz, F.; Fidan, S.; Alizade, E.; Zehir, R.; et al. Prognostic Value of 3 Nutritional Screening Tools to Predict 30-Day Outcome in Patients Undergoing Carotid Artery Stenting. Angiology 2022, 73, 225–233. [Google Scholar] [CrossRef] [PubMed]
- Ingenbleek, Y.; Carpentier, Y.A. A Prognostic Inflammatory and Nutritional Index Scoring Critically Ill Patients. Int. J. Vitam. Nutr. Res. 1985, 55, 91–101. [Google Scholar]
- Seltzer, M.H.; Bastidas, J.A.; Cooper, D.M.; Engler, P.; Slocum, B.; Fletcher, H.S. Instant Nutritional Assessment. J. Parenter. Enter. Nutr. 1979, 3, 157–159. [Google Scholar] [CrossRef] [PubMed]
- Dwyer, J. Strategies to Detect and Prevent Malnutrition in the Elderly; the Nutrition Screening Initiative. Nutr. Today 1994, 29, 14–24. [Google Scholar] [CrossRef]
- Keller, H.; Hedley, M.; Brownlee, S. The Development of Seniors in the Community: Risk Evaluation for Eating and Nutrition (SCREEN). Can. J. Diet. Pract. Res. 2000, 61, 67–72. [Google Scholar]
- Kalantar-Zadeh, K.; Kopple, J.D.; Block, G.; Humphreys, M.H. A Malnutrition-Inflammation Score Is Correlated with Morbidity and Mortality in Maintenance Hemodialysis Patients. Am. J. Kidney Dis. 2001, 38, 1251–1263. [Google Scholar] [CrossRef] [Green Version]
- Burden, S.T.; Bodey, S.; Bradburn, Y.J.; Murdoch, S.; Thompson, A.L.; Sim, J.M.; Sowerbutts, A.M. Validation of a Nutrition Screening Tool: Testing the Reliability and Validity. J. Hum. Nutr. Diet. 2001, 14, 269–275. [Google Scholar] [CrossRef]
- Visvanathan, R.; Penhall, R.; Chapman, I. Nutritional Screening of Older People in a Sub-Acute Care Facility in Australia and Its Relation to Discharge Outcomes. Age Ageing 2004, 33, 260–265. [Google Scholar] [CrossRef] [Green Version]
- Weekes, E.; Marinos, E.; Peter, E. The Development, Validation and Reliability of a Nutrition Screening Tool Based on the Recommendations of the British Association for Parenteral and Enteral Nutrition (BAPEN). Clin. Nutr. 2004, 23, 1104–1112. [Google Scholar] [CrossRef]
- McMillan, D.C.; Crozier, J.E.M.; Canna, K.; Angerson, W.J.; McArdle, C.S. Evaluation of an Inflammation-Based Prognostic Score (GPS) in Patients Undergoing Resection for Colon and Rectal Cancer. Int. J. Colorectal Dis. 2007, 22, 881–886. [Google Scholar] [CrossRef]
- Fouque, D.; Kalantar-Zadeh, K.; Kopple, J.; Cano, N.; Chauveau, P.; Cuppari, L.; Franch, H.; Guarnieri, G.; Ikizler, T.A.; Kaysen, G.; et al. A Proposed Nomenclature and Diagnostic Criteria for Protein-Energy Wasting in Acute and Chronic Kidney Disease. Kidney Int. 2008, 73, 391–398. [Google Scholar] [CrossRef] [PubMed] [Green Version]
- Evans, W.J.; Morley, J.E.; Argilés, J.; Bales, C.; Baracos, V.; Guttridge, D.; Jatoi, A.; Kalantar-Zadeh, K.; Lochs, H.; Mantovani, G.; et al. Cachexia: A New Definition. Clin. Nutr. 2008, 27, 793–799. [Google Scholar] [CrossRef] [PubMed]
- Tammam, J.; Gardner, L.; Hickson, M. Validity, Reliability and Acceptability of the Imperial Nutritional Screening System (INSYST): A Tool That Does Not Require the Body Mass Index. J. Hum. Nutr. Diet. 2009, 22, 536–544. [Google Scholar] [CrossRef] [PubMed]
- Lim, S.L.; Tong, C.Y.; Ang, E.; Lee, E.J.C.; Loke, W.C.; Chen, Y.; Ferguson, M.; Daniels, L. Development and Validation of 3-Minute Nutrition Screening (3-MinNS) Tool for Acute Hospital Patients in Singapore. Asia Pac. J. Clin. Nutr. 2009, 18, 395–403. [Google Scholar] [PubMed]
- Beberashvili, I.; Azar, A.; Sinuani, I.; Yasur, H.; Feldman, L.; Averbukh, Z.; Weissgarten, J. Objective Score of Nutrition on Dialysis (OSND) as an Alternative for the Malnutrition-Inflammation Score in Assessment of Nutritional Risk of Haemodialysis Patients. Nephrol. Dial. Transplant. 2010, 25, 2662–2671. [Google Scholar] [CrossRef] [Green Version]
- Fearon, K.; Strasser, F.; Anker, S.D.; Bosaeus, I.; Bruera, E.; Fainsinger, R.L.; Jatoi, A.; Loprinzi, C.; Macdonald, N.; Mantovani, G.; et al. Definition and Classification of Cancer Cachexia: An International Consensus. Lancet Oncol. 2011, 12, 489–495. [Google Scholar] [CrossRef]
- Wong, S.; Derry, F.; Jamous, A.; Hirani, S.P.; Grimble, G.; Forbes, A. Validation of the Spinal Nutrition Screening Tool (SNST) in Patients with Spinal Cord Injuries (SCI): Result from a Multicentre Study. Eur. J. Clin. Nutr. 2012, 66, 382–387. [Google Scholar] [CrossRef]
- Arora, S.; Greenslade, L.; Morgan, M. Prioritising Tool for Use in Patients with Chronic Liver Disease. J. Hepatol. 2012, 56, S241. [Google Scholar] [CrossRef]
- Campbell, K.L.; Bauer, J.D.; Ikehiro, A. Role of Nutrition Impact Symptoms in Predicting Nutritional Status and Clinical Outcome in Hemodialysis Patients: A Potential Screening Tool. J. Ren. Nutr. 2013, 23, 302–307. [Google Scholar] [CrossRef]
- Beck, A.M.; Beermann, T.; Kjær, S.; Rasmussen, H.H. Ability of Different Screening Tools to Predict Positive Effect on Nutritional Intervention among the Elderly in Primary Health Care. Nutrition 2013, 29, 993–999. [Google Scholar] [CrossRef]
- Laporte, M.; Keller, H.H.; Payette, H.; Allard, J.P.; Duerksen, D.R.; Bernier, P.; Jeejeebhoy, K.; Gramlich, L.; Davidson, B.; Vesnaver, E.; et al. Validity and Reliability of the New Canadian Nutrition Screening Tool in the “Real-World” Hospital Setting. Eur. J. Clin. Nutr. 2015, 69, 558–564. [Google Scholar] [CrossRef] [PubMed] [Green Version]
- Shaw, C.; Fleuret, C.; Pickard, J.M.; Mohammed, K.; Black, G.; Wedlake, L. Comparison of a Novel, Simple Nutrition Screening Tool for Adult Oncology Inpatients and the Malnutrition Screening Tool (MST) against the Patient-Generated Subjective Global Assessment (PG-SGA). Supportive Care Cancer 2015, 23, 47–54. [Google Scholar] [CrossRef] [PubMed]
- Jansen, I.; Prager, M.; Valentini, L.; Büning, C. Inflammation-Driven Malnutrition: A New Screening Tool Predicts Outcome in Crohn’s Disease. Br. J. Nutr. 2016, 116, 1061–1067. [Google Scholar] [CrossRef] [PubMed] [Green Version]
- Arribas, L.; Hurtós, L.; Sendrós, M.J.; Peiró, I.; Salleras, N.; Fort, E.; Sánchez-Migallón, J.M. NUTRISCORE: A New Nutritional Screening Tool for Oncological Outpatients. Nutrition 2017, 33, 297–303. [Google Scholar] [CrossRef] [PubMed]
- Haskey, N.; Peña-Sánchez, J.N.; Jones, J.L.; Fowler, S.A. Development of a Screening Tool to Detect Nutrition Risk in Patients with Inflammatory Bowel Disease. Asia Pac. J. Clin. Nutr. 2018, 27, 756–762. [Google Scholar] [CrossRef] [PubMed]
- Xu, J.; Cao, J.; Wang, Y.; Yao, X.; Wang, Y.; He, Z.; Lv, W.; Hu, J. Novel Preoperative Nutritional Assessment Tool and Prognostic Model for ESCC Patients. J. Cancer 2019, 10, 3883–3892. [Google Scholar] [CrossRef] [Green Version]
- Van, B.P.; Thuy, L.N.; Thanh, H.N.T.; Tuan, A.N.L.; Thi, P.D.; Thi, Y.D.; Huu, T.N.; Van, C.N.; Thi, H.L. Comparison of Novel, Bach Mai Boston Tool (BBT) and the Patient-Generated Subjective Global Assessment (PG-SGA) for Oncology Inpatients. Cancer Control 2019, 26. [Google Scholar] [CrossRef] [Green Version]
- Hassanin, I.A.; Hassanein, H.; Elmenshawy, P.; El-Gameel, D.; Elsheikh, A.A.; El-Kobrosly, A.; Samir, B.; Emil, R.; Alaa, M.; Selim, D.H. Malnutrition Score and Body Mass Index as Nutritional Screening Tools for Hemodialysis Patients. Clin. Nutr. ESPEN 2021, 42, 403–406. [Google Scholar] [CrossRef]
- Fiorindi, C.; Dragoni, G.; Scaringi, S.; Staderini, F.; Nannoni, A.; Ficari, F.; Giudici, F. Relationship between Nutritional Screening Tools and Glim in Complicated IBD Requiring Surgery. Nutrients 2021, 13, 3899. [Google Scholar] [CrossRef]
- Swan, W.I.; Vivanti, A.; Hakel-Smith, N.A.; Hotson, B.; Orrevall, Y.; Trostler, N.; Beck Howarter, K.; Papoutsakis, C. Nutrition Care Process and Model Update: Toward Realizing People-Centered Care and Outcomes Management. J. Acad. Nutr. Diet. 2017, 117, 2003–2014. [Google Scholar] [CrossRef]
- Correia, M.I.T.D. Nutrition Screening vs Nutrition Assessment: What’s the Difference? Nutr. Clin. Pract. 2018, 33, 62–72. [Google Scholar] [CrossRef] [PubMed]
- Omran, M.L.; Morley, J.E. Assessment of Protein Energy Malnutrition in Older Persons, Part I: History, Examination, Body Composition, and Screening Tools. Nutrition 2000, 16, 50–63. [Google Scholar] [CrossRef]
- Hummell, A.C.; Cummings, M. Role of the Nutrition-Focused Physical Examination in Identifying Malnutrition and Its Effectiveness. Nutr. Clin. Pract. 2022, 37, 41–49. [Google Scholar] [CrossRef] [PubMed]
- Bullock, A.F.; Greenley, S.L.; McKenzie, G.A.G.; Paton, L.W.; Johnson, M.J. Relationship between Markers of Malnutrition and Clinical Outcomes in Older Adults with Cancer: Systematic Review, Narrative Synthesis and Meta-Analysis. Eur. J. Clin. Nutr. 2020, 74, 1519–1535. [Google Scholar] [CrossRef] [PubMed]
- Forster, H.; Walsh, M.C.; Gibney, M.J.; Brennan, L.; Gibney, E.R. Personalised Nutrition: The Role of New Dietary Assessment Methods. Proc. Nutr. Soc. 2016, 75, 96–105. [Google Scholar] [CrossRef] [PubMed] [Green Version]
- Walton, J. Dietary Assessment Methodology for Nutritional Assessment: A Practical Approach. Top. Clin. Nutr. 2015, 30, 33–46. [Google Scholar] [CrossRef]
- Cederholm, T.; Bosaeus, I.; Barazzoni, R.; Bauer, J.; van Gossum, A.; Klek, S.; Muscaritoli, M.; Nyulasi, I.; Ockenga, J.; Schneider, S.M.; et al. Diagnostic Criteria for Malnutrition—An ESPEN Consensus Statement. Clin. Nutr. 2015, 34, 335–340. [Google Scholar] [CrossRef]
- García-Almeida, J.; Garcia-García, C.; Bellido-Castañeda, V.; Bellido-Guerrero, D. Nuevo Enfoque de La Nutrición. Valoración Del Estado Nutricional Del Paciente. Nutr. Hosp. 2018, 35, 1–14. [Google Scholar] [CrossRef]
- Hamada, Y. Objetive Data Assessment (ODA) Methods and Nutritional Assessment Tools. J. Med. Investig. 2015, 62, 119–122. [Google Scholar] [CrossRef] [Green Version]
- Real, G.G.; Frühauf, I.R.; Sedrez, J.H.K.; Dall’Aqua, E.J.F.; Gonzalez, M.C. Calf Circumference: A Marker of Muscle Mass as a Predictor of Hospital Readmission. J. Parenter. Enter. Nutr. 2018, 42, 1272–1279. [Google Scholar] [CrossRef]
- Pinto, A.C.; Sousa, A.S.; Amaral, T.F.; Guerra, R.S. Association between Anthropometric Indicators of Nutrition Status and Length of Hospital Stay in Hospitalized Patients. J. Parenter. Enter. Nutr. 2021, 45, 381–393. [Google Scholar] [CrossRef] [PubMed]
- Nakamura, T.; Kamiya, K.; Matsunaga, A.; Hamazaki, N.; Matsuzawa, R.; Nozaki, K.; Tanaka, S.; Yamashita, M.; Maekawa, E.; Noda, C.; et al. Prognostic Usefulness of Arm Circumference and Nutritional Screening Tools in Older Patients with Cardiovascular Disease. Nutr. Metab. Cardiovasc. Dis. 2018, 28, 743–748. [Google Scholar] [CrossRef] [PubMed]
- Madden, A.M.; Smith, S. Body Composition and Morphological Assessment of Nutritional Status in Adults: A Review of Anthropometric Variables. J. Hum. Nutr. Diet. 2016, 29, 7–25. [Google Scholar] [CrossRef] [PubMed]
- Smith, S.; Madden, A.M. Body Composition and Functional Assessment of Nutritional Status in Adults: A Narrative Review of Imaging, Impedance, Strength and Functional Techniques. J. Hum. Nutr. Diet. 2016, 29, 714–732. [Google Scholar] [CrossRef] [PubMed]
- Borga, M.; West, J.; Bell, J.D.; Harvey, N.C.; Romu, T.; Heymsfield, S.B.; Leinhard, O.D. Advanced Body Composition Assessment: From Body Mass Index to Body Composition Profiling. J. Investig. Med. 2018, 66, 887–895. [Google Scholar] [CrossRef]
- Kyle, U.G.; Bosaeus, I.; de Lorenzo, A.D.; Deurenberg, P.; Elia, M.; Gómez, J.M.; Heitmann, B.L.; Kent-Smith, L.; Melchior, J.C.; Pirlich, M.; et al. Bioelectrical Impedance Analysis—Part I: Review of Principles and Methods. Clin. Nutr. 2004, 23, 1226–1243. [Google Scholar] [CrossRef]
- Kyle, U.G.; Bosaeus, I.; de Lorenzo, A.D.; Deurenberg, P.; Elia, M.; Gómez, J.M.; Heitmann, B.L.; Kent-Smith, L.; Melchior, J.C.; Pirlich, M.; et al. Bioelectrical Impedance Analysis—Part II: Utilization in Clinical Practice. Clin. Nutr. 2004, 23, 1430–1453. [Google Scholar] [CrossRef]
- Llames, L.; Baldomero, V.; Iglesias, M.L.; Rodota, L.P. Values of the Phase Angle by Bioelectrical Impedance: Nutritional Status and Prognostic Value. Nutr. Hosp. 2013, 28, 286–295. [Google Scholar] [CrossRef]
- Di Vincenzo, O.; Marra, M.; di Gregorio, A.; Pasanisi, F.; Scalfi, L. Bioelectrical Impedance Analysis (BIA)-Derived Phase Angle in Sarcopenia: A Systematic Review. Clin. Nutr. 2021, 40, 3052–3061. [Google Scholar] [CrossRef]
- Camina Martín, M.A.; de Mateo Silleras, B.; Redondo Del Río, M.P. Body Composition Analysis in Older Adults with Dementia. Anthropometry and Bioelectrical Impedance Analysis: A Critical Review. Eur. J. Clin. Nutr. 2014, 68, 1228–1233. [Google Scholar] [CrossRef] [Green Version]
- Andreoli, A.; Garaci, F.; Cafarelli, F.P.; Guglielmi, G. Body Composition in Clinical Practice. Eur. J. Radiol. 2016, 85, 1461–1468. [Google Scholar] [CrossRef] [PubMed] [Green Version]
- Sheean, P.; Gonzalez, M.C.; Prado, C.M.; McKeever, L.; Hall, A.M.; Braunschweig, C.A. American Society for Parenteral and Enteral Nutrition Clinical Guidelines: The Validity of Body Composition Assessment in Clinical Populations. J. Parenter. Enter. Nutr. 2020, 44, 12–43. [Google Scholar] [CrossRef] [PubMed] [Green Version]
- Tosato, M.; Marzetti, E.; Cesari, M.; Savera, G.; Miller, R.R.; Bernabei, R.; Landi, F.; Calvani, R. Measurement of Muscle Mass in Sarcopenia: From Imaging to Biochemical Markers. Aging Clin. Exp. Res. 2017, 29, 19–27. [Google Scholar] [CrossRef] [PubMed]
- Ní Bhuachalla, É.B.; Daly, L.E.; Power, D.G.; Cushen, S.J.; MacEneaney, P.; Ryan, A.M. Computed Tomography Diagnosed Cachexia and Sarcopenia in 725 Oncology Patients: Is Nutritional Screening Capturing Hidden Malnutrition? J. Cachexia Sarcopenia Muscle 2018, 9, 295–305. [Google Scholar] [CrossRef] [PubMed] [Green Version]
- Van der Kroft, G.; Bours, D.M.J.L.; Janssen-Heijnen, D.M.; van Berlo, D.C.L.H.; Konsten, D.J.L.M. Value of Sarcopenia Assessed by Computed Tomography for the Prediction of Postoperative Morbidity Following Oncological Colorectal Resection: A Comparison with the Malnutrition Screening Tool. Clin. Nutr. ESPEN 2018, 24, 114–119. [Google Scholar] [CrossRef]
- Tillquist, M.; Kutsogiannis, D.J.; Wischmeyer, P.E.; Kummerlen, C.; Leung, R.; Stollery, D.; Karvellas, C.J.; Preiser, J.C.; Bird, N.; Kozar, R.; et al. Bedside Ultrasound Is a Practical and Reliable Measurement Tool for Assessing Quadriceps Muscle Layer Thickness. J. Parenter. Enter. Nutr. 2014, 38, 886–890. [Google Scholar] [CrossRef] [Green Version]
- Strasser, E.M.; Draskovits, T.; Praschak, M.; Quittan, M.; Graf, A. Association between Ultrasound Measurements of Muscle Thickness, Pennation Angle, Echogenicity and Skeletal Muscle Strength in the Elderly. Age 2013, 35, 2377–2388. [Google Scholar] [CrossRef] [Green Version]
- Heymsfield, S.B.; Gonzalez, M.C.; Lu, J.; Jia, G.; Zheng, J. Skeletal Muscle Mass and Quality: Evolution of Modern Measurement Concepts in the Context of Sarcopenia. Proc. Nutr. Soc. 2015, 74, 355–366. [Google Scholar] [CrossRef] [Green Version]
- Detsky, A.S.; Mclaughlin, J.; Baker, J.P.; Johnston, N.; Whittaker, S.; Mendelson, R.A.; Jeejeebhoy, K.N. What Is Subjective Global Assessment of Nutritional Status? J. Parenter. Enter. Nutr. 1987, 11, 8–13. [Google Scholar] [CrossRef] [Green Version]
- Russell, M.K. Functional Assessment of Nutrition Status. Nutr. Clin. Pract. 2015, 30, 211–218. [Google Scholar] [CrossRef]
- Cruz-Jentoft, A.J.; Bahat, G.; Bauer, J.; Boirie, Y.; Bruyère, O.; Cederholm, T.; Cooper, C.; Landi, F.; Rolland, Y.; Sayer, A.A.; et al. Sarcopenia: Revised European Consensus on Definition and Diagnosis. Age Ageing 2019, 48, 16–31. [Google Scholar] [CrossRef] [PubMed] [Green Version]
- White, J.V.; Guenter, P.; Jensen, G.; Malone, A.; Schofield, M. Consensus Statement: Academy of Nutrition and Dietetics and American Society for Parenteral and Enteral Nutrition: Characteristics Recommended for the Identification and Documentation of Adult Malnutrition (Undernutrition). J. Parenter. Enter. Nutr. 2012, 36, 275–283. [Google Scholar] [CrossRef] [PubMed] [Green Version]
- Zhang, Z.; Pereira, S.L.; Luo, M.; Matheson, E.M. Evaluation of Blood Biomarkers Associated with Risk of Malnutrition in Older Adults: A Systematic Review and Meta-Analysis. Nutrients 2017, 9, 829. [Google Scholar] [CrossRef] [PubMed]
- Larson, D.W.; Abd El Aziz, M.A.; Perry, W.; D’Angelo, A.L.; Behm, K.T.; Mathis, K.L.; Grass, F. Additional Value of Preoperative Albumin for Surgical Risk Stratification among Colorectal Cancer Patients. Ann. Nutr. Metab. 2021, 76, 422–430. [Google Scholar] [CrossRef]
- Loftus, T.J.; Brown, M.P.; Slish, J.H.; Rosenthal, M.D. Serum Levels of Prealbumin and Albumin for Preoperative Risk Stratification. Nutr. Clin. Pract. 2019, 34, 340–348. [Google Scholar] [CrossRef]
- Keller, U. Nutritional Laboratory Markers in Malnutrition. J. Clin. Med. 2019, 8, 775. [Google Scholar] [CrossRef] [Green Version]
- Cabrerizo, S.; Cuadras, D.; Gomez-Busto, F.; Artaza-Artabe, I.; Marín-Ciancas, F.; Malafarina, V. Serum Albumin and Health in Older People: Review and Meta Analysis. Maturitas 2015, 81, 17–27. [Google Scholar] [CrossRef]
- De Ulíbarri Pérez, J.I.; Fernández, G.; Salvanés, F.R.; López, A.M.D. Cribado Nutricional; Control de La Desnutrición Clínica Con Parámetros Analíticos. Nutr. Hosp. 2014, 29, 797–811. [Google Scholar] [CrossRef]
- Robinson, M.K.; Trujillo, E.B.; Mogensen, K.M.; Rounds, J.; McManus, K.; Jacobs, D.O. Improving Nutritional Screening of Hospitalized Patients: The Role of Prealbumin. J. Parenter. Enter. Nutr. 2003, 27, 389–395. [Google Scholar] [CrossRef]
- Dellière, S.; Cynober, L. Is Transthyretin a Good Marker of Nutritional Status? Clin. Nutr. 2017, 36, 364–370. [Google Scholar] [CrossRef]
- Férard, G.; Gaudias, J.; Bourguignat, A.; Ingenbleek, Y. C-Reactive Protein to Transthyretin Ratio for the Early Diagnosis and Follow-up of Postoperative Infection. Clin. Chem. Lab. Med. 2002, 40, 1334–1338. [Google Scholar] [CrossRef] [PubMed]
- Cynober, L. Advances in Analytical Techniques: From Biochemical Assessment of Nutritional Status to the Identification of Controlling Factors. Clin. Nutr. 2003, 22 (Suppl. 2), 37–42. [Google Scholar] [CrossRef]
- González Madroño, A.; Mancha, A.; Rodríguez, F.J.; de Ulibarri, J.I.; Culebras, J. The Use of Biochemical and Immunological Parameters in Nutritionalscreening and Assessment. Nutr. Hosp. 2011, 26, 594–601. [Google Scholar] [CrossRef] [PubMed]
- Baker, J.P.; Detsky, A.S.; Wesson, D.E.; Wolman, S.L.; Stewart, S.; Whitewell, J.; Langer, B.; Jeejeebhoy, K.N. A Comparison of Clinical Judgment and Objective Measurements. N. Engl. J. Med. 1982, 306, 969–972. [Google Scholar] [CrossRef] [PubMed]
- Reber, E.; Schönenberger, K.A.; Vasiloglou, M.F.; Stanga, Z. Nutritional Risk Screening in Cancer Patients: The First Step toward Better Clinical Outcome. Front. Nutr. 2021, 8, 1–9. [Google Scholar] [CrossRef]
- Jeejeebhoy, K.N.; Keller, H.; Gramlich, L.; Allard, J.P.; Laporte, M.; Duerksen, D.R.; Payette, H.; Bernier, P.; Vesnaver, E.; Davidson, B.; et al. Nutritional Assessment: Comparison of Clinical Assessment and Objective Variables for the Prediction of Length of Hospital Stay and Readmission. Am. J. Clin. Nutr. 2015, 101, 956–965. [Google Scholar] [CrossRef] [Green Version]
- Da Silva Fink, J.; Daniel de Mello, P.; Daniel de Mello, E. Subjective Global Assessment of Nutritional Status—A Systematic Review of the Literature. Clin. Nutr. 2015, 34, 785–792. [Google Scholar] [CrossRef]
- Lew, C.C.H.; Yandell, R.; Fraser, R.J.L.; Chua, A.P.; Chong, M.F.F.; Miller, M. Association between Malnutrition and Clinical Outcomes in the Intensive Care Unit: A Systematic Review. J. Parenter. Enter. Nutr. 2017, 41, 744–758. [Google Scholar] [CrossRef]
- Duerksen, D.R.; Laporte, M.; Jeejeebhoy, K. Evaluation of Nutrition Status Using the Subjective Global Assessment: Malnutrition, Cachexia, and Sarcopenia. Nutr. Clin. Pract. 2021, 36, 942–956. [Google Scholar] [CrossRef]
- Khor, B.H.; Tiong, H.C.; Tan, S.C.; Rahman, R.A.; Gafor, A.H.A. Protein-Energy Wasting Assessment and Clinical Outcomes in Patients with Acute Kidney Injury: A Systematic Review with Meta-Analysis. Nutrients 2020, 12, 2809. [Google Scholar] [CrossRef]
- Ottery, F.D. Definition of Standardized Nutritional Assessment and Interventional Pathways in Oncology. Nutrition 1996, 12, S15–S19. [Google Scholar] [CrossRef]
- Jager-Wittenaar, H.; Ottery, F.D. Assessing Nutritional Status in Cancer: Role of the Patient-Generated Subjective Global Assessment. Curr. Opin. Clin. Nutr. Metab. Care 2017, 20, 322–329. [Google Scholar] [CrossRef] [PubMed] [Green Version]
- De Groot, L.M.; Lee, G.; Ackerie, A.; van der Meij, B.S. Malnutrition Screening and Assessment in the Cancer Care Ambulatory Setting: Mortality Predictability and Validity of the Patient-Generated Subjective Global Assessment Short Form (PG-SGA SF) and the GLIM Criteria. Nutrients 2020, 12, 2287. [Google Scholar] [CrossRef]
- Abe Vicente, M.; Barão, K.; Donizetti Silva, T.; Forones, N.M. ¿Cuáles Son Los Métodos Más Eficaces de Valoración Del Estado Nutricional En Pacientes Ambulatorios Con Cáncer Gástrico y Colorrectal? Nutr. Hosp. 2013, 28, 585–591. [Google Scholar] [CrossRef] [PubMed] [Green Version]
- Gupta, D.; Vashi, P.G.; Lammersfeld, C.A.; Braun, D.P. Role of Nutritional Status in Predicting the Length of Stay in Cancer: A Systematic Review of the Epidemiological Literature. Ann. Nutr. Metab. 2011, 59, 96–106. [Google Scholar] [CrossRef] [PubMed]
- Ruan, X.; Nakyeyune, R.; Shao, Y.; Shen, Y.; Niu, C.; Zang, Z.; Miles, T.; Liu, F. Nutritional Screening Tools for Adult Cancer Patients: A Hierarchical Bayesian Latent-Class Meta-Analysis. Clin. Nutr. 2021, 40, 1733–1743. [Google Scholar] [CrossRef] [PubMed]
- Guigoz, Y.; Vellas, B.; Garry, P.J. Nutrition Surveys in the Elderly Assessing the Nutritional Status of the Elderly: The Mini Nutritional Assessment as Part of the Geriatric Evaluation. Nutr. Rev. 1996, 54, S59–S65. [Google Scholar] [CrossRef]
- Bauer, J.M.; Kaiser, M.J.; Anthony, P.; Guigoz, Y.; Sieber, C.C. The Mini Nutritional Assessment®—Its History, Today’s Practice, and Future Perspectives. Nutr. Clin. Pract. 2008, 23, 388–396. [Google Scholar] [CrossRef]
- Vellas, B.; Guigoz, Y.; Garry, P.J.; Nourhashemi, F.; Bennahum, D.; Lauque, S.; Albarede, J.-L. The Mini Nutritional Assessment (MNA) and Its Use in Grading the Nutritional State of Elderly Patients. Nutrition 1999, 15, 116–122. [Google Scholar] [CrossRef]
- Cereda, E. Mini Nutritional Assessment. Curr. Opin. Clin. Nutr. Metab. Care 2012, 15, 29–41. [Google Scholar] [CrossRef]
- Guigoz, Y.; Lauque, S.; Vellas, B.J. Identifying the Elderly at Risk for Malnutrition: The Mini Nutritional Assessment. Clin. Geriatr. Med. 2002, 18, 737–757. [Google Scholar] [CrossRef]
- Joaquín, C.; Puig, R.; Gastelurrutia, P.; Lupón, J.; de Antonio, M.; Domingo, M.; Moliner, P.; Zamora, E.; Martin, M.; Alonso, N.; et al. Mini Nutritional Assessment Is a Better Predictor of Mortality than Subjective Global Assessment in Heart Failure Out-Patients. Clin. Nutr. 2019, 38, 2740–2746. [Google Scholar] [CrossRef]
- Guerra, R.S.; Fonseca, I.; Sousa, A.S.; Jesus, A.; Pichel, F.; Amaral, T.F. ESPEN Diagnostic Criteria for Malnutrition—A Validation Study in Hospitalized Patients. Clin. Nutr. 2017, 36, 1326–1332. [Google Scholar] [CrossRef] [PubMed]
- Rondel, A.L.M.A.; Langius, J.A.E.; de van der Schueren, M.A.E.; Kruizenga, H.M. The New ESPEN Diagnostic Criteria for Malnutrition Predict Overall Survival in Hospitalised Patients. Clin. Nutr. 2018, 37, 163–168. [Google Scholar] [CrossRef] [PubMed]
- Cederholm, T.; Jensen, G.L.; Correia, M.I.T.D.; Gonzalez, M.C.; Fukushima, R.; Higashiguchi, T.; Baptista, G.; Barazzoni, R.; Blaauw, R.; Coats, A.; et al. GLIM Criteria for the Diagnosis of Malnutrition—A Consensus Report from the Global Clinical Nutrition Community. Clin. Nutr. 2019, 38, 1–9. [Google Scholar] [CrossRef] [Green Version]
- De van der Schueren, M.A.E.; Keller, H.; Cederholm, T.; Barazzoni, R.; Compher, C.; Correia, M.I.T.D.; Gonzalez, M.C.; Jager-Wittenaar, H.; Pirlich, M.; Steiber, A.; et al. Global Leadership Initiative on Malnutrition (GLIM): Guidance on Validation of the Operational Criteria for the Diagnosis of Protein-Energy Malnutrition in Adults. Clin. Nutr. 2020, 39, 2872–2880. [Google Scholar] [CrossRef]
- Jensen, G.L.; Cederholm, T.; Correia, M.I.T.D.; Gonzalez, M.C.; Fukushima, R.; Higashiguchi, T.; de Baptista, G.A.; Barazzoni, R.; Blaauw, R.; Coats, A.J.S.; et al. GLIM Criteria for the Diagnosis of Malnutrition: A Consensus Report from the Global Clinical Nutrition Community. J. Parenter. Enter. Nutr. 2019, 43, 32–40. [Google Scholar] [CrossRef] [Green Version]
- Keller, H.; de van der Schueren, M.A.E.; Jensen, G.L.; Barazzoni, R.; Compher, C.; Correia, M.I.T.D.; Gonzalez, M.C.; Jager-Wittenaar, H.; Pirlich, M.; Steiber, A.; et al. Global Leadership Initiative on Malnutrition (GLIM): Guidance on Validation of the Operational Criteria for the Diagnosis of Protein-Energy Malnutrition in Adults. J. Parenter. Enter. Nutr. 2020, 44, 992–1003. [Google Scholar] [CrossRef]
- Brito, J.E.; Burgel, C.F.; Lima, J.; Chites, V.S.; Saragiotto, C.B.; Rabito, E.I.; Silva, F.M. GLIM Criteria for Malnutrition Diagnosis of Hospitalized Patients Presents Satisfactory Criterion Validity: A Prospective Cohort Study. Clin. Nutr. 2021, 40, 4366–4372. [Google Scholar] [CrossRef]
- Theilla, M.; Rattanachaiwong, S.; Kagan, I.; Rigler, M.; Bendavid, I.; Singer, P. Validation of GLIM Malnutrition Criteria for Diagnosis of Malnutrition in ICU Patients: An Observational Study. Clin. Nutr. 2021, 40, 3578–3584. [Google Scholar] [CrossRef]
- Allard, J.P.; Keller, H.; Gramlich, L.; Jeejeebhoy, K.N.; Laporte, M.; Duerksen, D.R. GLIM Criteria Has Fair Sensitivity and Specificity for Diagnosing Malnutrition When Using SGA as Comparator. Clin. Nutr. 2020, 39, 2771–2777. [Google Scholar] [CrossRef] [PubMed]
- Galindo Martín, C.A.; Aportela Vázquez, V.A.; Becerril Hernández, F.; Aguilar Medina, C.R.; Ayala Carrillo, S.L.; Chávez Flores, A.; Gabriel Almanza, E.; Guizar Agredano, M.I.; Montoya Vilchis, J.D. The GLIM Criteria for Adult Malnutrition and Its Relation with Adverse Outcomes, a Prospective Observational Study. Clin. Nutr. ESPEN 2020, 38, 67–73. [Google Scholar] [CrossRef]
- Henriksen, C.; Paur, I.; Pedersen, A.; Kværner, A.S.; Ræder, H.; Henriksen, H.B.; Bøhn, S.K.; Wiedswang, G.; Blomhoff, R. Agreement between GLIM and PG-SGA for Diagnosis of Malnutrition Depends on the Screening Tool Used in GLIM. Clin. Nutr. 2022, 41, 329–336. [Google Scholar] [CrossRef] [PubMed]
- Shahbazi, S.; Hajimohammadebrahim-Ketabforoush, M.; Vahdat Shariatpanahi, M.; Shahbazi, E.; Vahdat Shariatpanahi, Z. The Validity of the Global Leadership Initiative on Malnutrition Criteria for Diagnosing Malnutrition in Critically Ill Patients with COVID-19: A Prospective Cohort Study. Clin. Nutr. ESPEN 2021, 43, 377–382. [Google Scholar] [CrossRef] [PubMed]
- Milà Villarroel, R.; Formiga, F.; Duran Alert, P.; Abellana Sangrà, R. Prevalencia de Malnutrición En La Población Anciana Española: Una Revisión Sistemática. Med. Clin. 2012, 139, 502–508. [Google Scholar] [CrossRef]
- Chivu, E.C.; Artero-Fullana, A.; Alfonso-García, A.; Sánchez-Juan, C. Detección Del Riesgo de Desnutrición En El Medio Hospitalario. Nutr. Hosp. 2016, 33, 894–900. [Google Scholar] [CrossRef]
- Cereda, E.; Pedrolli, C.; Klersy, C.; Bonardi, C.; Quarleri, L.; Cappello, S.; Turri, A.; Rondanelli, M.; Caccialanza, R. Nutritional Status in Older Persons According to Healthcare Setting: A Systematic Review and Meta-Analysis of Prevalence Data Using MNA®. Clin. Nutr. 2016, 35, 1282–1290. [Google Scholar] [CrossRef]
- Wojzischke, J.; van Wijngaarden, J.; van den Berg, C.; Cetinyurek-Yavuz, A.; Diekmann, R.; Luiking, Y.; Bauer, J. Nutritional status and functionality in geriatric rehabilitation patients: A systematic review and meta-analysis. Eur. Geriatr. Med. 2020, 11, 195–207. [Google Scholar] [CrossRef] [Green Version]
- Zhang, Z.; Wan, Z.; Zhu, Y.; Zhang, L.; Zhang, L.; Wan, H. Prevalence of Malnutrition Comparing NRS2002, MUST, and PG-SGA with the GLIM Criteria in Adults with Cancer: A Multi-Center Study. Nutrition 2021, 83, 111072. [Google Scholar] [CrossRef]
- Ding, P.; Guo, H.; Yang, P.; Sun, C.; Tian, Y.; Liu, Y.; Li, Y.; Zhao, Q. Association Between the Nutritional Risk and the Survival Rate in Newly Diagnosed GIST Patients. Front. Nutr. 2021, 8, 868. [Google Scholar] [CrossRef]
- Villaverde-Núñez, A.; Ramos, C.P.; Sanz Lobo, M.V.; Morgado Benito, M.D.C.; Martínez-Ibáñez, V.; Avecilla Nieto, N.; Antón Rodríguez, C. Assessment of Nutritional Status on Admission and Outcome after Seven Days of Hospitalization in a Second-Level Hospital in Madrid. Nutr. Hosp. 2021, 38, 780–789. [Google Scholar] [CrossRef] [PubMed]
- Zugasti-Murillo, A.; Petrina-Jáuregui, M.E.; Ripa-Ciáurriz, C.; Sánchez-Sánchez, R.; Villazón-González, F.; Faes, Á.G.D.; Fernández-López, C.; Calles-Romero, L.; Martín-Palmero, Á.; Riestra-Fernández, M.; et al. Sedreno Study—Prevalence of Hospital Malnutrition According to Glim Criteria, Ten Years after the Predyces Study. Nutr. Hosp. 2021, 38, 1016–1025. [Google Scholar] [CrossRef] [PubMed]
- Preiser, J.C.; Ichai, C.; Orban, J.C.; Groeneveld, A.B.J. Metabolic Response to the Stress of Critical Illness. Br. J. Anaesth. 2014, 113, 945–954. [Google Scholar] [CrossRef] [PubMed] [Green Version]
- De Ulíbarri Pérez, J.I. La Desnutrición Clínica En 2014; Patogenia, Detección Precoz y Consecuencias; Desnutrición y Trofopatía. Nutr. Hosp. 2014, 29, 785–796. [Google Scholar] [CrossRef] [PubMed]
- Subwongcharoen, S.; Areesawangvong, P.; Chompoosaeng, T. Impact of Nutritional Status on Surgical Patients. Clin. Nutr. ESPEN 2019, 32, 135–139. [Google Scholar] [CrossRef]
- Ruiz, A.J.; Buitrago, G.; Rodríguez, N.; Gómez, G.; Sulo, S.; Gómez, C.; Partridge, J.; Misas, J.; Dennis, R.; Alba, M.J.; et al. Clinical and Economic Outcomes Associated with Malnutrition in Hospitalized Patients. Clin. Nutr. 2019, 38, 1310–1316. [Google Scholar] [CrossRef] [Green Version]
- Bellanti, F.; lo Buglio, A.; Quiete, S.; Vendemiale, G. Malnutrition in Hospitalized Old Patients: Screening and Diagnosis, Clinical Outcomes, and Management. Nutrients 2022, 14, 910. [Google Scholar] [CrossRef]
- Taipa-Mendes, A.M.; Amaral, T.F.; Gregório, M. Undernutrition Risk and Nutritional Screening Implementation in Hospitals: Barriers and Time Trends (2019–2020). Clin. Nutr. ESPEN 2021, 45, 192–199. [Google Scholar] [CrossRef]
- Schuetz, P.; Fehr, R.; Baechli, V.; Geiser, M.; Deiss, M.; Gomes, F.; Kutz, A.; Tribolet, P.; Bregenzer, T.; Braun, N.; et al. Individualised Nutritional Support in Medical Inpatients at Nutritional Risk: A Randomised Clinical Trial. Lancet 2019, 393, 2312–2321. [Google Scholar] [CrossRef]
- Gomes, F.; Baumgartner, A.; Bounoure, L.; Bally, M.; Deutz, N.E.; Greenwald, J.L.; Stanga, Z.; Mueller, B.; Schuetz, P. Association of Nutritional Support with Clinical Outcomes among Medical Inpatients Who Are Malnourished or at Nutritional Risk: An Updated Systematic Review and Meta-Analysis. JAMA Netw. Open 2019, 2, e1915138. [Google Scholar] [CrossRef] [Green Version]
- Donini, L.M.; Savina, C.; Rosano, A.; Cannella, C. Systematic Review of Nutritional Status Evaluation and Screening Tools in the Elderly. J. Nutr. Health Aging 2007, 11, 421. [Google Scholar] [PubMed]
- Dent, E.; Visvanathan, R.; Piantadosi, C.; Chapman, I. Nutritional Screening Tools as Predictors of Mortality, Functional Decline, and Move to Higher Level Care in Older People: A Systematic Review. J. Nutr. Gerontol. Geriatr. 2012, 31, 97–145. [Google Scholar] [CrossRef] [PubMed]
- Castro-Vega, I.; Veses Martín, S.; Cantero Llorca, J.; Barrios Marta, C.; Bañuls, C.; Hernández-Mijares, A. Validity, Efficacy and Reliability of 3 Nutritional Screening Tools Regarding the Nutritional Assessment in Different Social and Health Areas. Med. Clin. 2018, 150, 185–187. [Google Scholar] [CrossRef] [PubMed]
- Skipper, A.; Coltman, A.; Tomesko, J.; Charney, P.; Porcari, J.; Piemonte, T.A.; Handu, D.; Cheng, F.W. Position of the Academy of Nutrition and Dietetics: Malnutrition (Undernutrition) Screening Tools for All Adults. J. Acad. Nutr. Diet. 2020, 120, 709–713. [Google Scholar] [CrossRef] [PubMed] [Green Version]
- Deftereos, I.; Djordjevic, A.; Carter, V.M.; McNamara, J.; Yeung, J.M.; Kiss, N. Malnutrition Screening Tools in Gastrointestinal Cancer: A Systematic Review of Concurrent Validity. Surg. Oncol. 2021, 38, 101627. [Google Scholar] [CrossRef] [PubMed]
- Liu, P.; Wang, B.; Yan, X.; Cai, J.J.; Wang, Y. Comprehensive Evaluation of Nutritional Status before and after Hematopoietic Stem Cell Transplantation in 170 Patients with Hematological Diseases. Chin. J. Cancer Res. 2016, 28, 626–633. [Google Scholar] [CrossRef] [PubMed] [Green Version]
- Mendes, N.P.; Barros, T.A.D.; Rosa, C.D.O.B.; Franceschini, S.D.C.C. Nutritional Screening Tools Used and Validated for Cancer Patients: A Systematic Review. Nutr. Cancer 2019, 71, 898–907. [Google Scholar] [CrossRef]
- Nakyeyune, R.; Ruan, X.; Shen, Y.; Shao, Y.; Niu, C.; Zang, Z.; Liu, F. Diagnostic Performance of SGA, PG-SGA and MUST for Malnutrition Assessment in Adult Cancer Patients: A Systematic Literature Review and Hierarchical Bayesian Meta-Analysis. Nutr. Cancer 2021, 74, 903–915. [Google Scholar] [CrossRef]
- Yıldırım, R.; Candaş, B.; Arif Usta, M.; Erkul, O.; Türkyılmaz, S.; Güner, A. Comparison of Nutritional Screening Tools in Patients Undergoing Surgery for Gastric Cancer. Haseki Tip Bulteni 2020, 58, 153–161. [Google Scholar] [CrossRef]
- Chen, X.Y.; Zhang, X.Z.; Ma, B.W.; Li, B.; Zhou, D.L.; Liu, Z.C.; Chen, X.L.; Shen, X.; Yu, Z.; Zhuang, C.L. A Comparison of Four Common Malnutrition Risk Screening Tools for Detecting Cachexia in Patients with Curable Gastric Cancer. Nutrition 2020, 70, 110498. [Google Scholar] [CrossRef]
- Kaya, A.Ş.; Pekcan, G.; Kaya, A.Ş.; Pekcan, G. Evaluation of Preoperative Nutritional Status of Patients with Gastrointestinal Cancer Using Different Nutritional Screening Tests. Prog. Nutr. 2020, 22, 2020073. [Google Scholar] [CrossRef]
- Velasco, C.; García, E.; Rodríguez, V.; Frias, L.; Garriga, R.; Álvarez, J.; García-Peris, P.; León, M. Comparison of Four Nutritional Screening Tools to Detect Nutritional Risk in Hospitalized Patients: A Multicentre Study. Eur. J. Clin. Nutr. 2011, 65, 269–274. [Google Scholar] [CrossRef] [PubMed]
- Daysa Hanusch, F.; Da Silva Bezerra, M.D.G.; da Silva Prado, L.V.; de Souza Costa, M.D.; Pinheiro Gadelha, P.C.F. Nutritional Assessment in Surgical Patients: Association between Subjective Global Assessment, Nutritional Screening Tools and Objective Methods. Nutr. Clin. Diet. Hosp. 2016, 36, 10–19. [Google Scholar] [CrossRef]
- Boutata, F.Z.; Bencharif, M.; Abdessemed, D. Validity of Four Nutritional Screening Tools against Subjective Global Assessment for Inpatients with Non Communicable Diseases (Algeria, 2020). Nutr. Clin. Metab. 2022, 36, 54–58. [Google Scholar] [CrossRef]
- Bellanti, F.; Buglio, A.L.; Quiete, S.; Pellegrino, G.; Dobrakowski, M.; Kasperczyk, A.; Kasperczyk, S.; Vendemiale, G. Comparison of Three Nutritional Screening Tools with the New Glim Criteria for Malnutrition and Association with Sarcopenia in Hospitalized Older Patients. J. Clin. Med. 2020, 9, 1898. [Google Scholar] [CrossRef] [PubMed]
- Padilla-Romo, M.; Martinez-Cordero, E.; Martinez-Cordero, C. A Simple and Reliable Tool for Detection of Nutritional Risk in Hospitalized Patients. Nutr. Hosp. 2015, 32, 379–382. [Google Scholar] [CrossRef] [PubMed]
- Gomes-Neto, A.W.; van Vliet, I.M.Y.; Osté, M.C.J.; de Jong, M.F.C.; Bakker, S.J.L.; Jager-Wittenaar, H.; Navis, G.J. Malnutrition Universal Screening Tool and Patient-Generated Subjective Global Assessment Short Form and Their Predictive Validity in Hospitalized Patients. Clin. Nutr. ESPEN 2021, 45, 252–261. [Google Scholar] [CrossRef]
- MacLaughlin, H.L.; Twomey, J.; Saunt, R.; Blain, S.; Campbell, K.C.; Emery, P. The Nutrition Impact Symptoms (NIS) Score Detects Malnutrition Risk in Patients Admitted to Nephrology Wards. J. Hum. Nutr. Diet. 2018, 31, 683–688. [Google Scholar] [CrossRef]
- Isautier, J.; Bosnic, M.; Yeung, S.; Trappenburg, M.; Meskers, C.; Whittaker, A.; Maier, A. Validity of Nutritional Screening Tools for Community-Dwelling Older Adults: A Systematic Review and Meta-Analysis. J. Am. Med. Dir. Assoc. 2019, 20, 1351.e13–1351.e25. [Google Scholar] [CrossRef]
- Inoue, T.; Misu, S.; Tanaka, T.; Kakehi, T.; Ono, R. Acute Phase Nutritional Screening Tool Associated with Functional Outcomes of Hip Fracture Patients: A Longitudinal Study to Compare MNA-SF, MUST, NRS-2002 and GNRI. Clin. Nutr. 2019, 38, 220–226. [Google Scholar] [CrossRef] [Green Version]
- Shuhada, N.A.; Aziz, A.; Mohd, N.I.; Teng, F.; Abdul, M.R.; Hamid; Ismail, N.H. Assessing the Nutritional Status of Hospitalized Elderly. Clin. Interv. Aging 2017, 12, 1615–1625. [Google Scholar] [CrossRef] [Green Version]
- Dent, E.; Hoogendijk, E.O.; Visvanathan, R.; Wright, O.R.L. Malnutrition Screening and Assessment in Hospitalised Older People: A Review. J. Nutr. Health Aging 2019, 23, 431–441. [Google Scholar] [CrossRef] [PubMed]
- Power, L.; de van der Schueren, M.A.E.; Leij-Halfwerk, S.; Bauer, J.; Clarke, M.; Visser, M.; Volkert, D.; Bardon, L.; Gibney, E.; Corish, C.A. Development and Application of a Scoring System to Rate Malnutrition Screening Tools Used in Older Adults in Community and Healthcare Settings—A MaNuEL Study. Clin. Nutr. 2019, 38, 1807–1819. [Google Scholar] [CrossRef] [PubMed]
- Christner, S.; Ritt, M.; Volkert, D.; Wirth, R.; Sieber, C.C.; Gaßmann, K.G. Evaluation of the Nutritional Status of Older Hospitalised Geriatric Patients: A Comparative Analysis of a Mini Nutritional Assessment (MNA) Version and the Nutritional Risk Screening (NRS 2002). J. Hum. Nutr. Diet. 2016, 29, 704–713. [Google Scholar] [CrossRef] [PubMed]
- Castillo-Martinez, L.; Castro-Eguiluz, D.; Copca-Mendoza, E.T.; Perez-Camargo, D.A.; Reyes-Torres, C.A.; Avila, E.A.D.; Lopez-Cordova, G.; Fuentes-Hernandez, M.R.; Cetina-Perez, L.; Milke-Garcia, M.D.P. Nutritional Assessment Tools for the Identification of Malnutrition and Nutritional Risk Associated with Cancer Treatment. Rev. Investig. Clin. 2018, 70, 121–125. [Google Scholar] [CrossRef] [Green Version]


| Questions | Points |
|---|---|
| Did you lose weight unintentionally? | |
| More than 6 kg in the last 6 months | 3 |
| More than 6 kg in the last 3 months | 2 |
| Did you experience a decreased appetite over the last month? | 1 |
| Did you use supplemental drinks or tube feeding over the last month? | 1 |
| Impaired Nutritional Status | Severity of Disease (Stress Metabolism) | ||
|---|---|---|---|
| Absent score 0 | Normal nutritional status | Absent score 0 | Normal nutritional requirements |
| Mild score 1 | Weight loss 45% in 3 months or Food intake below 50–75% of normal requirement in preceding week | Mild score 1 | Hip fracture; chronic patients, in particular with acute complications: cirrhosis; COPD; chronic hemodialysis, diabetes, oncology |
| Moderate score 2 | Weight loss 45% in 2 months or BMI 18.5–20.5 + impaired general condition or Food intake 25–50% of normal requirement in preceding week | Moderate score 2 | Major abdominal surgery; stroke; severe pneumonia, hematologic malignancy |
| Severe score 3 | Weight loss >5% in 1 month >15% in 3 months or Body Mass Index of 18.5 + impaired general condition or Food intake 0–25% of normal requirement in preceding week | Severe score 3 | Head injury; bone marrow transplantation; intensive care patients (APACHE 10) |
| Have you lost weight recently without trying? | |
| No | 0 |
| Unsure | 2 |
| If yes, how much weight (kilograms) have you lost? | |
| 1–5 | 1 |
| 6–10 | 2 |
| 11–15 | 3 |
| >15 | 4 |
| Unsure | 2 |
| Have you been eating poorly because of a decreased appetite? | |
| No | 0 |
| Yes | 1 |
| Total | |
| Score of 2 or more = patient at risk of malnutrition. |
| Variable | Range | Points | |
|---|---|---|---|
| Age | <50 | 0 | |
| 50–<75 | 1 | ||
| ≥75 | 2 | ||
| APACHE II | <15 | 0 | |
| 15–<20 | 1 | ||
| 20–28 | 2 | ||
| ≥28 | 3 | ||
| SOFA | <6 | 0 | |
| 6–<10 | 1 | ||
| ≥10 | 2 | ||
| Number of co-morbidities | 0–1 | 0 | |
| ≥2 | 1 | ||
| Days from hospital to ICU admission | 0–<1 | 0 | |
| ≥1 | 1 | ||
| IL-6 | 0–<400 | 0 | |
| ≥400 | 1 | ||
| Sum of points | Category | Explanation | |
| NUTRIC score scoring system, if IL-6 available | |||
| 6–10 | High score |
| |
| 0–5 | Low score |
| |
| NUTRIC score scoring system, if no IL-6 available | |||
| 5–9 | High score |
| |
| 0–4 | Low score |
| |
| Tool/Acronym/Year | Features/Aspects | Patients Group | Reference |
|---|---|---|---|
| Instant nutritional assessment (INA, 1979) | Serum albumin levels and total lymphocyte counts | Cancer surgery, liver, and pancreatic diseases | Seltzer et al. [74] |
| Prognostic nutritional index (PNI, 1979) | Serum albumin, TSF, TFN, DH | Surgical patients | Mullen et al. [66] |
| Prognostic inflammatory and nutritional index (PINI, 1985) | C-reactive protein, orosomucoid, albumin, and transthyretin | Cancer patients, surgery, liver diseases, trauma, burn | Ingenbleek et al. [73] |
| Nutritional screening initiative checklist (DETERMINE, 1994) | Questionary about nutritional well being | Elderly people | Dwyer J. [75] |
| Nutritional Risk Index (NRI, 1988) | Serum albumin, current/usual body weight ratio. | All inpatients | Buzby et al. [56] |
| Malnutrition screening tool (MST, 1999) | Data about recent appetite status and weight loss | All inpatients | Ferguson et al. [46] |
| Risk Evaluation for Eating and Nutrition (SCREEN, 2000). | Factors affecting food intake, access to food, social factors, anthropometry, dietary intake | Elderly people | Keller et al. [76] |
| Malnutrition inflammatory score (MIS, 2001) | SGA method combined with BMI, serum albumin, and serum TIBC | Dialysis patients | Kalantar-Zadeh et al. [77] |
| South Manchester University Hospitals nutritional Assessment Score (2001) | Age, mental condition, weight, dietary intake, ability to eat, medical condition, and gut function | All inpatients | Burden ST [78] |
| Controlling nutritional status (CONUT, 2002) | Laboratory data (serum albumin, cholesterol, total lymphocytes, and hematocrit) | All inpatients | Ulibarri et al. [47] |
| Nutritional risk screening 2002 (NRS-2002, 2003) | BMI, weight loss, and acute disease score | All inpatients | Kondrup et al. [40] |
| Malnutrition Universal Screening Tool (MUST, 2004) | BMI, weight loss, and illness in relation to food intake | All inpatients | Elia et al. [31] |
| Rapid Screen (2004) | Weight change, BMI | Inpatients | Visvanathan et al. [79] |
| British nutrition screening tool (NST) 2004 | Weight, height, recent unintentional weight loss, and appetite | All inpatients | Weekes et al. [80] |
| Simplified Nutritional Appetite Questionnaire (SNAQ, 2005) | Items related to appetite, food timing during day, food preferences, and daily number of meals | Elderly patients | Kruizenga et al. [39] |
| Geriatric Nutritional Risk Index (GNRI, 2005) | Serum albumin and the relationships between current weight and ideal weight | Elderly patients | Bouillane et al. [58] |
| Glasgow Prognostic Score (GPS, 2007) | Serum levels of albumin and C-reactive protein (CRP) | Cancer patients | McMillan et al. [81] |
| Protein Energy Wasting (PEW, 2008) | Serum chemistry, BMI, muscle mass, and dietary intake | Dialysis patients | Fouque et al. [82] |
| Cachexia consensus (2008) | Decreased muscle strength, fatigue, anorexia, low fat-free mass index, abnormal biochemistry | Cachexia diseases | Evans WJ et al. [83] |
| Mini Nutritional Assessment short form (MNA-SF, 2009) | First 6 items of 18 MNA | Elderly patients | Rubenstein et al. [25] |
| Imperial Nutritional Screening (INSYST, 2009) | Unintentional weight loss, reduced food intake | All inpatients | Tammam et al. [84] |
| 3-Minute Nutrition Screening (3-MinNS, 2009) | Unintentional weight loss in the past six months, intake in the past week, body mass index (BMI), disease with nutrition risks, and presence of muscle wasting in the temporalis and clavicular areas | All inpatients | Lim et al. [85] |
| Objective screening nutrition dialysis (OSND, 2010) | Some anthropometric measurements, albumin, transferrin, and cholesterol levels | Dialysis patients | Beberashvili et al. [86] |
| Cancer cachexia classification (2011) | Weight loss, BMI, dietary intake, anorexia, muscle mass, metabolic change | Cancer patients | Fearon et al. [87] |
| Nutrition Risk in Critically ill (NUTRIC, 2011) | Age, APACHE II score, SOFA score, comorbidities, days in the hospital before admission to the ICU, and interleukin-6 | Critically ill patients | Heyland et al. [48] Rahman et al. [49] |
| Spinal nutrition screening tool (SNST, 2012) | History of recent weight loss, BMI, age, level of SCI, presence of co-morbidity, skin condition, appetite, and ability to eat. | Spinal cord-injured patients | Wong et al. [88] |
| Royal Free Hospital Nutritional Prioritizing Tool (RFH-NPT, 2012) | Unintentional weight loss, BMI, influence of excess body fluids, and food intake. | Chronic liver disease | Arora et al. [89] |
| Nutrition impact symptoms score (NIS, 2013) | Symptoms impacting on food intake | Dialysis patients | Campbell et al. [90] |
| Eating Validation Scheme (EVS, 2013) | Eating habits | Elderly in primary care | Beck et al. [91] |
| Canadian Nutrition Screening Tool (CNST, 2015) | Weight loss, decreased food intake, body mass index (BMI) | All inpatients | Laporte et al. [92] |
| Royal Marsden Nutrition Screening Tool (RMNST, 2015) | Weight loss during the previous 3 months, a food intake of less than 50 % of normal in the previous 5 days, symptoms affecting intake | Cancer patients | Shaw er al. [93] |
| Malnutrition Inflammation Risk Tool (MIRT, 2016) | BMI, weight Loss, CRP | Inflammatory bowel diseases | Jansen et al. [94] |
| NUTRISCORE (2017) | MST, tumor location, active treatment | Cancer patients | Arribas et al. [95] |
| Saskatchewan Inflammatory Bowel Disease Nutrition Risk Tool (SaskIBD-NRT, 2018) | Weight loss, GI symptoms, anorexia, food intake restriction | Inflammatory bowel diseases | Haskey et al. [96] |
| BMI–lymphocyte–uric acid–triglyceride (BULT, 2019) | BMI, lymphocyte, uric acid, and triglyceride | Esophageal squamous cell carcinoma | Xu et al. [97] |
| Bach Mai Boston Tool (BBT, 2019) | Oral intake, body mass index (BMI), and weight loss in the last 3 months. | Cancer patients | Van et al. [98] |
| Dialysis Malnutrition Score (DMS, 2021) | Similar to PS-SGA with additional questions about dialysis history, and physical examination concerning loss of subcutaneous fat and muscle wasting. | Dialysis patients | Hassanin et al. [99] |
| Nutritional Screening inflammatory bowel diseases (NS-IBD, 2021) | BMI, unintended weight loss, GI symptoms, surgery for IBD | Inflammatory bowel diseases | Fiorindi et al. [100] |
| Alternative 1: | BMI < 18.5 kg/m2 |
| Alternative 2: | Weight loss (unintentional) > 10% indefinite of time, or >5% over the last 3 months combined with either: BMI < 20 kg/m2 if <70 years of age, or <22 kg/m2 if =>70 years of age, or FFMI < 15 kg/m2 in women and 17 kg/m2 in men |
| Phenotypic Criteria | Etiologic Criteria | |||
|---|---|---|---|---|
| Weight Loss (%) | Low Body Mass Index (kg/m2) | Reduced Muscle Mass | Reduced Food Intake or Assimilation | Inflammation |
| >5% within past 6 months or >10% beyond 6 months | <20 if <70 years, or <22 if >70 years | Reduced by validated body composition measuring techniques | <50% of ER >1 week, or any reduction for >2 weeks or any chronic GI condition that adversely impacts food assimilation or absorption | Acute disease/injury or chronic disease-related |
| Subjective Global Assessment (SGA, 1987) | Weight change, dietary intake change, gastrointestinal symptoms, functional capacity, and physical examination | Cancer patients, surgery, liver diseases | Detsky et al. [145] |
| Patient-Generated Subjective Global Assessment (PG-SGA, 1996) | Weight change, dietary intake change, gastrointestinal symptoms, functional capacity, and physical examination | Cancer patients, surgery, liver diseases | Ottery FD. [152] |
| Mini nutritional assessment (MNA, 1996) | Anthropometric measures, clinical history, and nutritional data | Elderly people | Guigoz et al. [158] |
| ASPEN Criteria for malnutrition (2012) | Insufficient energy intake, weight loss, loss of muscle mass, loss of subcutaneous fat, localized or generalized fluid accumulation, diminished functional status | All patients | White J et al. [133] |
| ESPEN criteria for malnutrition (2015) | BMI (<18.5 kg/m2), or weight loss and reduced BMI, or a low FFMI | All patients | Cederholm T et al. [108] |
| GLIM (2019) | Weight loss, BMI, muscle mass, dietary intake change, inflammation | All patients | Cederholm T et al. [166] |
| Tool | Sensitivity | Specificity | Positive Predictive Value | Negative Predictive Value | Overall Validity | Agreement | Reliability |
|---|---|---|---|---|---|---|---|
| MST | Moderate | Moderate | Moderate | Moderate | Moderate | Moderate | Moderate |
| MUST | Moderate | Moderate | Moderate | High | High | Moderate | Moderate |
| MNA-SF | Moderate | Moderate | Low | Moderate | Moderate | Low | Moderate |
| SNAQ | Moderate | High | Low | High | Moderate | — | Moderate |
| MNA-SF-BMI | Moderate | Moderate | Moderate | High | Moderate | Moderate | — |
| NRS-2002 | Moderate | High | Moderate | Moderate | Moderate | Moderate | — |
Publisher’s Note: MDPI stays neutral with regard to jurisdictional claims in published maps and institutional affiliations. |
© 2022 by the authors. Licensee MDPI, Basel, Switzerland. This article is an open access article distributed under the terms and conditions of the Creative Commons Attribution (CC BY) license (https://creativecommons.org/licenses/by/4.0/).
Share and Cite
Serón-Arbeloa, C.; Labarta-Monzón, L.; Puzo-Foncillas, J.; Mallor-Bonet, T.; Lafita-López, A.; Bueno-Vidales, N.; Montoro-Huguet, M. Malnutrition Screening and Assessment. Nutrients 2022, 14, 2392. https://doi.org/10.3390/nu14122392
Serón-Arbeloa C, Labarta-Monzón L, Puzo-Foncillas J, Mallor-Bonet T, Lafita-López A, Bueno-Vidales N, Montoro-Huguet M. Malnutrition Screening and Assessment. Nutrients. 2022; 14(12):2392. https://doi.org/10.3390/nu14122392
Chicago/Turabian StyleSerón-Arbeloa, Carlos, Lorenzo Labarta-Monzón, José Puzo-Foncillas, Tomas Mallor-Bonet, Alberto Lafita-López, Néstor Bueno-Vidales, and Miguel Montoro-Huguet. 2022. "Malnutrition Screening and Assessment" Nutrients 14, no. 12: 2392. https://doi.org/10.3390/nu14122392