
Effect of Early Nutritional Support on Clinical Outcomes of Critically Ill Patients with Sepsis and Septic Shock: A Single-Center Retrospective Study


 ,
,
Abstract
:1. Introduction
2. Methods
2.1. Ethics Approval and Consent to Participate
2.2. Patient Population
2.3. Nutritional Support
2.4. Data Collection
2.5. Endpoint
2.6. Statistical Analysis
3. Results
3.1. Clinical Outcomes
3.1.1. In-Hospital Mortality and Nutrition Supply
3.1.2. Nutrition Supply and 30-Day Mortality
3.1.3. Ventilator-Free Days within 28 Days of Sepsis Onset and Nutritional Support
3.1.4. Length of Stay in the ICU and Hospital and Nutritional Support
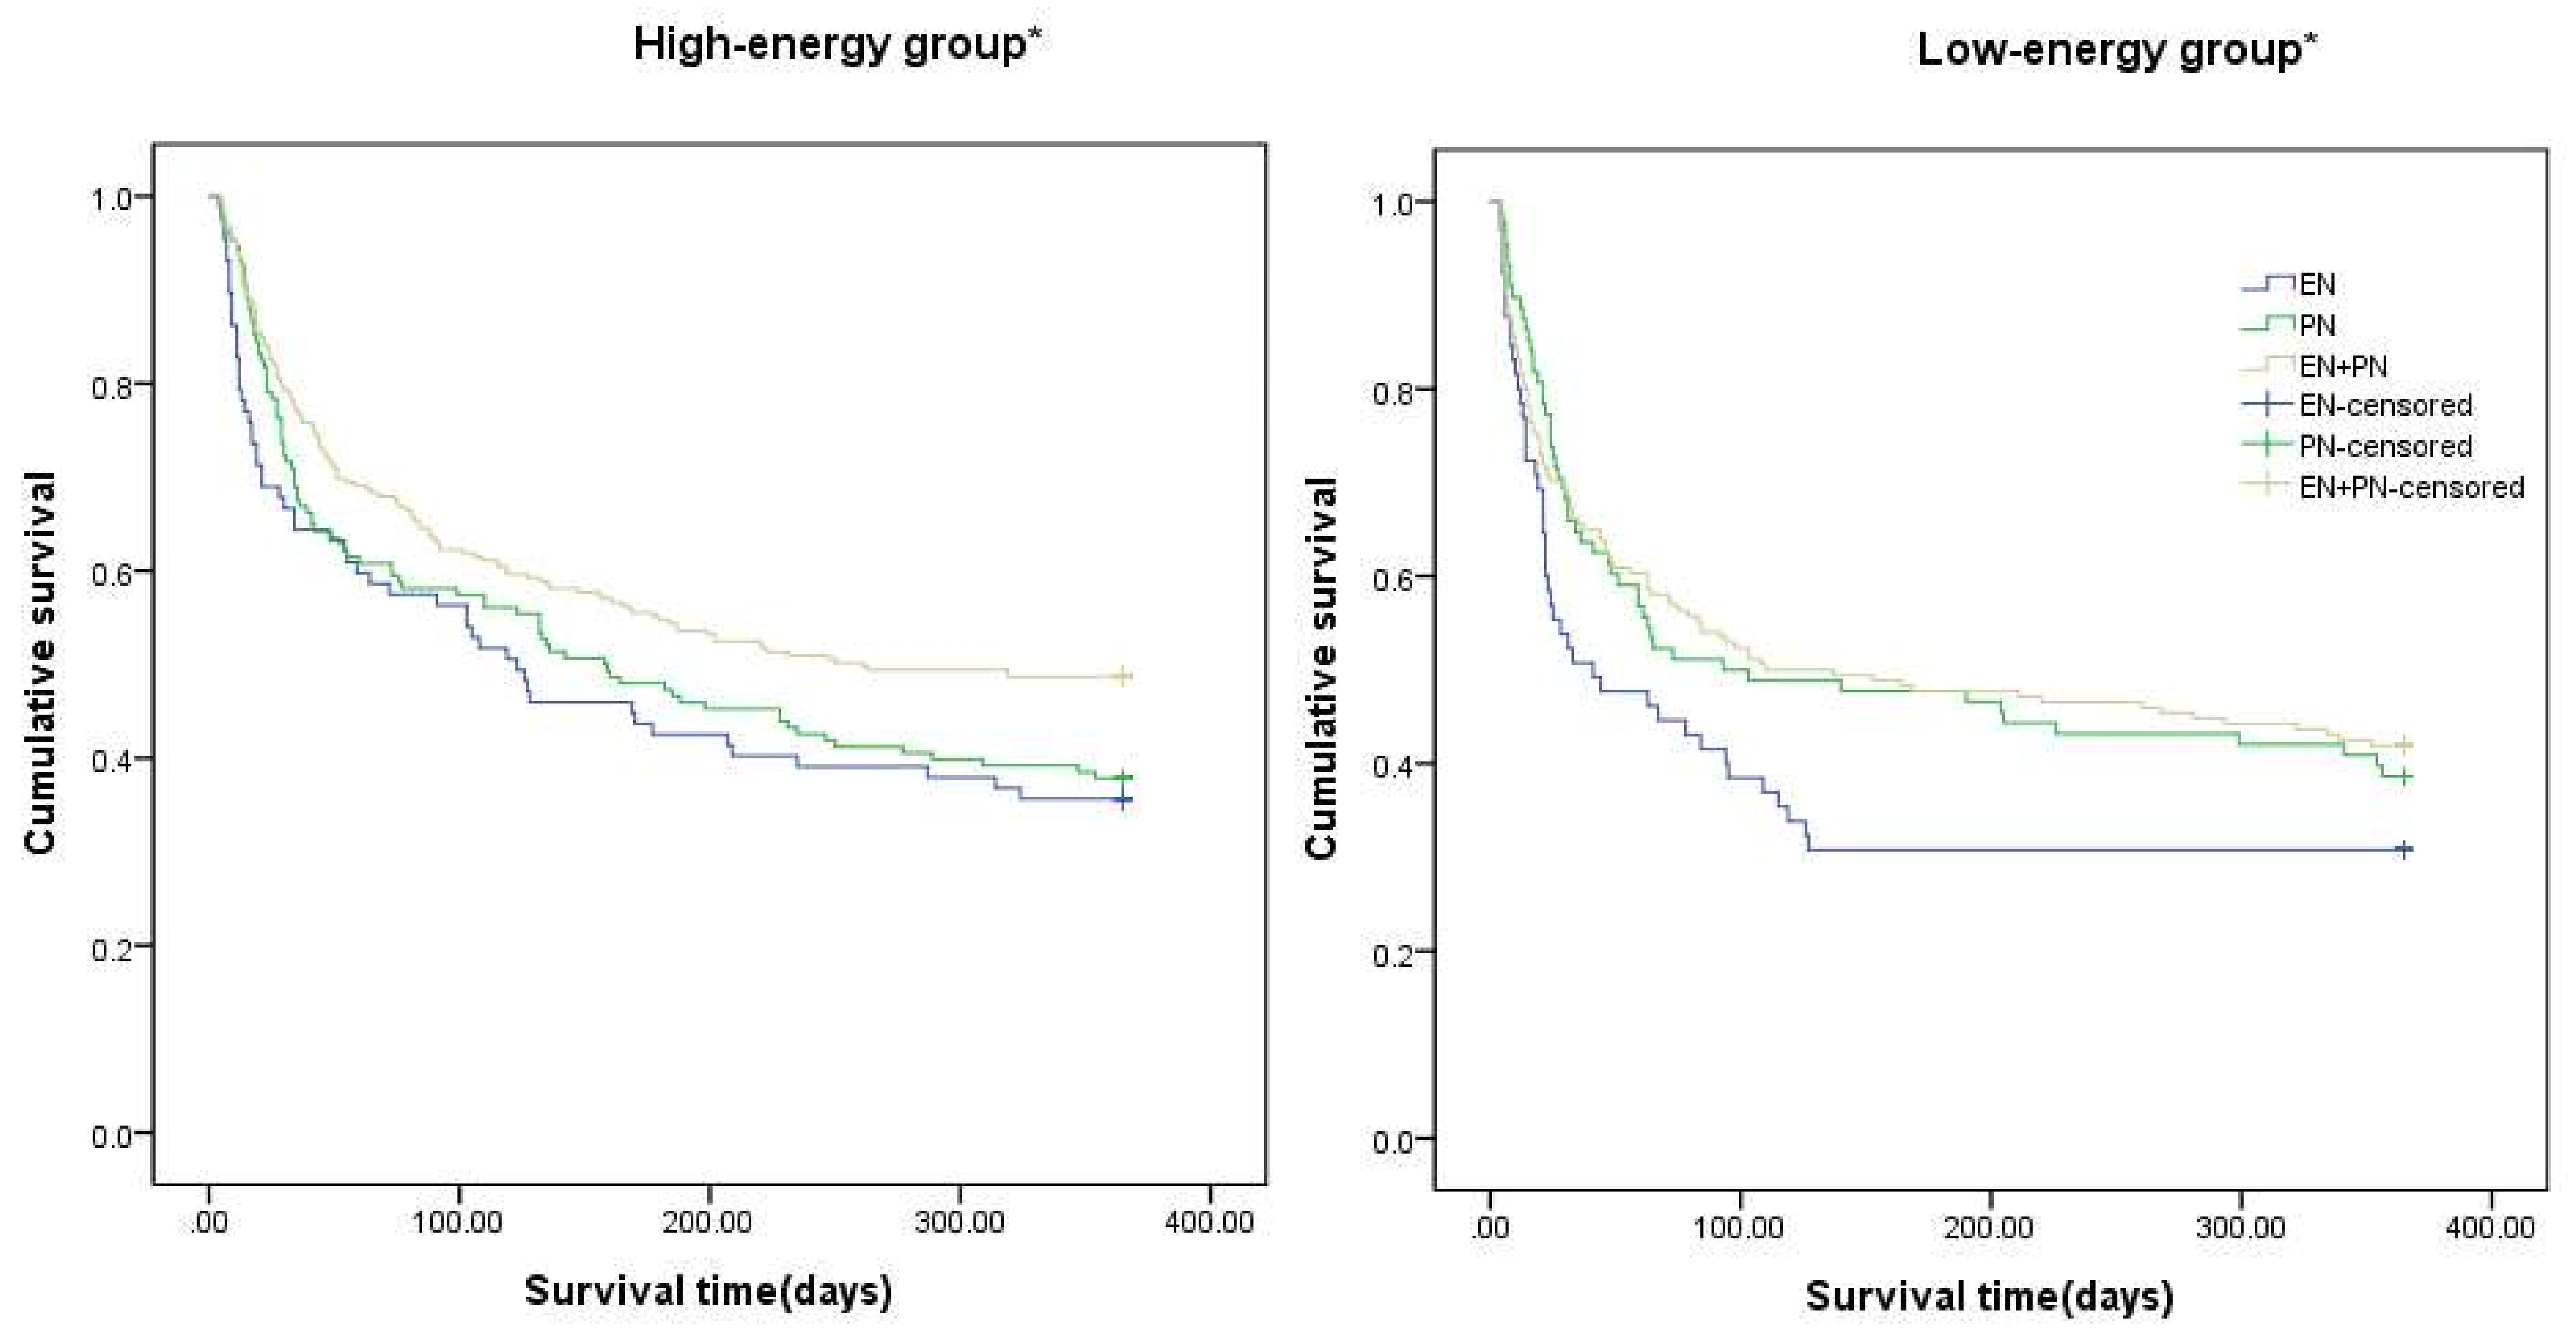
3.1.5. Route of Nutrition Delivery and 1-Year Mortality
4. Discussion
5. Conclusions
Author Contributions
Funding
Institutional Review Board Statement
Informed Consent Statement
Data Availability Statement
Acknowledgments
Conflicts of Interest
References
- Arabi, Y.M.; Al-Dorzi, H.M.; Sadat, M. Protein intake and outcome in critically ill patients. Curr. Opin. Clin. Nutr. Metab. Care 2020, 23, 51–58. [Google Scholar] [CrossRef]
- Rahmel, T.; Hübner, M.; Koos, B.; Wolf, A.; Willemsen, K.-M.; Strauß, G.; Effinger, D.; Adamzik, M.; Kreth, S. Impact of carbohydrate-reduced nutrition in septic patients on ICU: Study protocol for a prospective randomised controlled trial. BMJ Open 2020, 10, e038532. [Google Scholar] [CrossRef] [PubMed]
- Weijs, P.J.; Mogensen, K.M.; Rawn, J.D.; Christopher, K.B. Protein Intake, Nutritional Status and Outcomes in ICU Survivors: A Single Center Cohort Study. J. Clin. Med. 2019, 8, 43. [Google Scholar] [CrossRef] [PubMed] [Green Version]
- Reid, C.L.; Campbell, I.T.; Little, R.A. Muscle wasting and energy balance in critical illness. Clin. Nutr. 2004, 23, 273–280. [Google Scholar] [CrossRef]
- Wischmeyer, P.E. Nutrition Therapy in Sepsis. Crit. Care Clin. 2018, 34, 107–125. [Google Scholar] [CrossRef] [PubMed]
- Weijs, P.J.; Looijaard, W.G.; Beishuizen, A.; Girbes, A.R.; Straaten, H.M.O.-V. Early high protein intake is associated with low mortality and energy overfeeding with high mortality in non-septic mechanically ventilated critically ill patients. Crit. Care 2014, 18, 701. [Google Scholar] [CrossRef] [PubMed] [Green Version]
- Zusman, O.; Theilla, M.; Cohen, J.; Kagan, I.; Bendavid, I.; Singer, P. Resting energy expenditure, calorie and protein consumption in critically ill patients: A retrospective cohort study. Crit. Care 2016, 20, 367. [Google Scholar] [CrossRef] [Green Version]
- Nicolo, M.; Heyland, D.K.; Chittams, J.; Sammarco, T.; Compher, C. Clinical outcomes related to protein delivery in a critically ill population: A multicenter, multinational observation study. J. Parenter. Enter. Nutr. 2016, 40, 45–51. [Google Scholar] [CrossRef]
- De Waele, E.; Malbrain, M.L.; Spapen, H. Nutrition in Sepsis: A Bench-to-Bedside Review. Nutrients 2020, 12, 395. [Google Scholar] [CrossRef] [Green Version]
- Rhodes, A.; Evans, L.E.; Alhazzani, W.; Levy, M.M.; Antonelli, M.; Ferrer, R.; Kumar, A.; Sevransky, J.E.; Sprung, C.L.; Nunnally, M.E.; et al. Surviving Sepsis Campaign: International Guidelines for Management of Sepsis and Septic Shock: 2016. Intensive Care Med. 2017, 43, 304–377. [Google Scholar] [CrossRef]
- Singer, P.; Blaser, A.R.; Berger, M.M.; Alhazzani, W.; Calder, P.C.; Casaer, M.P.; Hiesmayr, M.; Mayer, K.; Montejo, J.C.; Pichard, C.; et al. ESPEN guideline on clinical nutrition in the intensive care unit. Clin. Nutr. 2019, 38, 48–79. [Google Scholar] [CrossRef] [PubMed] [Green Version]
- Turon-Findley, M.P.; LaRose, E.; MacEachern, K.; Pash, E. Mueller CM, ed. The ASPEN Adult Nutrition Support Core Curriculum. 3rd ed. Silver Spring, MD: American Society for Parenteral and Enteral Nutrition; 2017. $280.00. 845 pp. Print ISBN: 978-1-889622-31-6; e-book ISBN: 978-1-889622-32-3. Nutr. Clin. Pract. 2018, 33, 725–726. [Google Scholar] [CrossRef]
- Evans, L.; Rhodes, A.; Alhazzani, W.; Antonelli, M.; Coopersmith, C.M.; French, C.; Machado, F.R.; Mcintyre, L.; Ostermann, M.; Prescott, H.C.; et al. Executive Summary: Surviving Sepsis Campaign: International Guidelines for the Management of Sepsis and Septic Shock 2021. Crit. Care Med. 2021, 49, 1974–1982. [Google Scholar] [CrossRef] [PubMed]
- Harvey, S.E.; Parrott, F.; Harrison, D.A.; Bear, D.E.; Segaran, E.; Beale, R.; Bellingan, G.; Leonard, R.; Mythen, M.G.; Rowan, K.M.; et al. Trial of the Route of Early Nutritional Support in Critically Ill Adults. N. Engl. J. Med. 2014, 371, 1673–1684. [Google Scholar] [CrossRef] [PubMed]
- Harvey, S.E.; Parrott, F.; Harrison, D.A.; Sadique, M.Z.; Grieve, R.D.; Canter, R.R.; McLennan, B.K.; Tan, J.C.; Bear, D.E.; Segaran, E.; et al. A multicentre, randomised controlled trial comparing the clinical effectiveness and cost-effectiveness of early nutritional support via the parenteral versus the enteral route in critically ill patients (CALORIES). Health Technol. Assess. 2016, 20, 1–144. [Google Scholar] [CrossRef]
- Oshima, T.; Berger, M.M.; De Waele, E.; Guttormsen, A.B.; Heidegger, C.-P.; Hiesmayr, M.; Singer, P.; Wernerman, J.; Pichard, C. Indirect calorimetry in nutritional therapy. A position paper by the ICALIC study group. Clin. Nutr. 2017, 36, 651–662. [Google Scholar] [CrossRef]
- Weijs, P.J. Fundamental determinants of protein requirements in the ICU. Curr. Opin. Clin. Nutr. Metab. Care 2014, 17, 183–189. [Google Scholar] [CrossRef] [Green Version]
- Rahman, A.; Hasan, R.M.; Agarwala, R.; Martin, C.; Day, A.G.; Heyland, D.K. Identifying critically-ill patients who will benefit most from nutritional therapy: Further validation of the “modified NUTRIC” nutritional risk assessment tool. Clin. Nutr. 2016, 35, 158–162. [Google Scholar] [CrossRef]
- Singer, M.; Deutschman, C.S.; Seymour, C.W.; Shankar-Hari, M.; Annane, D.; Bauer, M.; Bellomo, R.; Bernard, G.R.; Chiche, J.-D.; Coopersmith, C.M.; et al. The Third International Consensus Definitions for Sepsis and Septic Shock (Sepsis-3). JAMA 2016, 315, 801–810. [Google Scholar] [CrossRef]
- Fay, K.; Sapiano, M.R.P.; Gokhale, R.; Dantes, R.; Thompson, N.; Katz, D.E.; Ray, S.M.; Wilson, L.E.; Perlmutter, R.; Nadle, J.; et al. Assessment of Health Care Exposures and Outcomes in Adult Patients With Sepsis and Septic Shock. JAMA Netw. Open 2020, 3, e206004. [Google Scholar] [CrossRef]
- Datta, A.; Flynn, N.R.; Barnette, D.A.; Woeltje, K.F.; Miller, G.P.; Swamidass, S.J. Machine learning liver-injuring drug interactions with non-steroidal anti-inflammatory drugs (NSAIDs) from a retrospective electronic health record (EHR) cohort. PLoS Comput. Biol. 2021, 17, e1009053. [Google Scholar] [CrossRef] [PubMed]
- Datta, A.; Matlock, M.K.; Le Dang, N.; Moulin, T.; Woeltje, K.F.; Yanik, E.L.; Swamidass, S.J. ‘Black Box’to ‘Conversational’Machine Learning: Ondansetron Reduces Risk of Hospital-Acquired Venous Thromboembolism. IEEE J. Biomed. Health Inform. 2020, 25, 2204–2214. [Google Scholar] [CrossRef] [PubMed]
- Park, S.; Baek, S.H.; Ahn, S.; Lee, K.-H.; Hwang, H.; Ryu, J.; Ahn, S.Y.; Chin, H.J.; Na, K.Y.; Chae, D.-W.; et al. Impact of Electronic Acute Kidney Injury (AKI) Alerts with Automated Nephrologist Consultation on Detection and Severity of AKI: A Quality Improvement Study. Am. J. Kidney Dis. 2018, 71, 9–19. [Google Scholar] [CrossRef] [Green Version]
- Casaer, M.; Mesotten, D.; Hermans, G.; Wouters, P.J.; Schetz, M.; Meyfroidt, G.; Van Cromphaut, S.; Ingels, C.; Meersseman, P.; Muller, J.; et al. Early versus Late Parenteral Nutrition in Critically Ill Adults. N. Engl. J. Med. 2011, 365, 506–517. [Google Scholar] [CrossRef] [PubMed] [Green Version]
- Bendavid, I.; Zusman, O.; Kagan, I.; Theilla, M.; Cohen, J.; Singer, P. Early Administration of Protein in Critically Ill Patients: A Retrospective Cohort Study. Nutrients 2019, 11, 106. [Google Scholar] [CrossRef] [Green Version]
- Doig, G.S.; Simpson, F.; Sweetman, E.A.; Finfer, S.R.; Cooper, D.J.; Heighes, P.T.; Davies, A.R.; O’Leary, M.; Solano, T.; Peake, S. Early parenteral nutrition in critically ill patients with short-term relative contraindications to early enteral nutrition: A randomized controlled trial. JAMA 2013, 309, 2130–2138. [Google Scholar] [CrossRef] [Green Version]
- McClave, S.A.; Taylor, B.E.; Martindale, R.G.; Warren, M.M.; Johnson, D.R.; Braunschweig, C.; McCarthy, M.S.; Davanos, E.; Rice, T.W.; Cresci, G.A.; et al. Guidelines for the Provision and Assessment of Nutrition Support Therapy in the Adult Critically Ill Patient: Society of Critical Care Medicine (SCCM) and American Society for Parenteral and Enteral Nutrition (ASPEN). JPEN J. Parenter. Enter. Nutr. 2016, 40, 159–211. [Google Scholar] [CrossRef]
- Hung, K.-Y.; Chen, Y.-M.; Wang, C.-C.; Wang, Y.-H.; Lin, C.-Y.; Chang, Y.-T.; Huang, K.-T.; Lin, M.-C.; Fang, W.-F. Insufficient Nutrition and Mortality Risk in Septic Patients Admitted to ICU with a Focus on Immune Dysfunction. Nutrients 2019, 11, 367. [Google Scholar] [CrossRef] [Green Version]
- Chapman, M.; Peake, S.L.; Bellomo, R.; Davies, A.; Deane, A.; Horowitz, M.; Hurford, S.; Lange, K.; Little, L.; Mackle, D.; et al. Energy-Dense versus Routine Enteral Nutrition in the Critically Ill. N. Engl. J. Med. 2018, 379, 1823–1834. [Google Scholar] [CrossRef]


| Characteristic | Total (n = 834) | Septic Shock (n = 467) | Sepsis without Septic Shock (n = 367) | p-Value |
|---|---|---|---|---|
| Sex, male | 546 (66%) | 303 (65%) | 243 (73%) | 0.714 |
| Age (years) | 72 (62–78) | 72 (63–78) | 73 (60–79) | 0.795 |
| BMI (kg/m2) | 21 (18–24) | 22 (18–24) | 21 (18–24) | 0.091 |
| SOFA score | 11 (9–13) | 12 (10–14) | 9 (6–12) | <0.001 * |
| APACHE II score | 32 (26–38) | 35 (29–40) | 29 (23–24) | <0.001 * |
| mNUTRIC scores | 7 (6–8) | 7 (6–8) | 7 (5–8) | <0.001 * |
| Low score (0–4 points) | 84 (10.1%) | 20 (4.3%) | 64 (17.4%) | |
| High score (5–9 points) | 750 (89.9%) | 447 (95.7%) | 303 (82.6%) | |
| Comorbidities | 2.5 (1.7) | 2.5 (1.7) | 2.4 (1.7) | 0.661 |
| Myocardial disease | 216 (25.9%) | 127 (27%) | 89 (24%) | |
| Peripheral vascular disease | 438 (52.5%) | 249 (53%) | 189 (24%) | |
| Pulmonary disease | 139 (16.7%) | 63 (13%) | 76 (51%) | |
| Neurologic disease | 161 (19.3%) | 75 (16%) | 86 (23%) | |
| Endocrinal disease | 233 (27.9%) | 145 (31%) | 88 (24%) | |
| Chronic renal disease | 108 (12.9%) | 63 (13%) | 45 (12%) | |
| Previous RRT | 41 (4.9%) | 23 (5%) | 18 (5%) | |
| Gastrointestinal disease | 82 (9.8%) | 55 (12%) | 27 (7%) | |
| Cancer/immunocompromised state | 267 (32.0%) | 157 (34%) | 110 (30%) | |
| Psychological disease | 24 (2.9%) | 17 (4%) | 7 (2%) | |
| Musculoskeletal disease | 86 (10.3%) | 51 (11%) | 35 (10%) | |
| Substance use disorder | 27 (3.2%) | 11 (2%) | 16 (4%) | |
| Miscellaneous | 26 (3.1%) | 17 (4%) | 9 (2%) | |
| Types of intensive care units (ICUs) | <0.001 * | |||
| Medical ICU | 578 (69.3%) | 327 (70%) | 251 (68%) | |
| Surgical ICU | 103 (12.4%) | 71 (15%) | 32 (9%) | |
| Emergency ICU | 93 (11.2%) | 58 (12%) | 35 (10%) | |
| Neuro/neurosurgical ICU | 60 (7.2%) | 11 (2%) | 49 (13%) | |
| Source of infection | <0.001 * | |||
| Respiratory infection | 480 (57.6%) | 227 (49%) | 253 (69%) | |
| Genitourinary infection | 41 (4.9%) | 26 (6%) | 14 (4%) | |
| Gastrointestinal infection | 126 (15.1%) | 97 (21%) | 29 (8%) | |
| Other infections | 115 (13.8%) | 72 (15%) | 44 (12%) | |
| Multiple infections | 53 (6.4%) | 27 (6%) | 16 (4%) | |
| Unknown source of infection | 19 (2.3%) | 18 (4%) | 1 (0%) | |
| Pathogen type | 0.039 * | |||
| Gram-positive pathogens | 176 (21.1%) | 96 (21%) | 80 (22%) | |
| Gram-negative pathogens | 269 (32.3%) | 167 (36%) | 102 (28%) | |
| Other | 12 (1.4%) | 6 (1%) | 60 (16%) | |
| Multimicrobial infections | 125 (15.0%) | 70 (15%) | 55 (15%) | |
| Fungi | 30 (3.6%) | 18 (4%) | 12 (3%) | |
| Viruses | 27 (3.2%) | 8 (2%) | 19 (5%) | |
| Unidentified pathogens | 195 (23.4%) | 102 (22%) | 93 (25%) | |
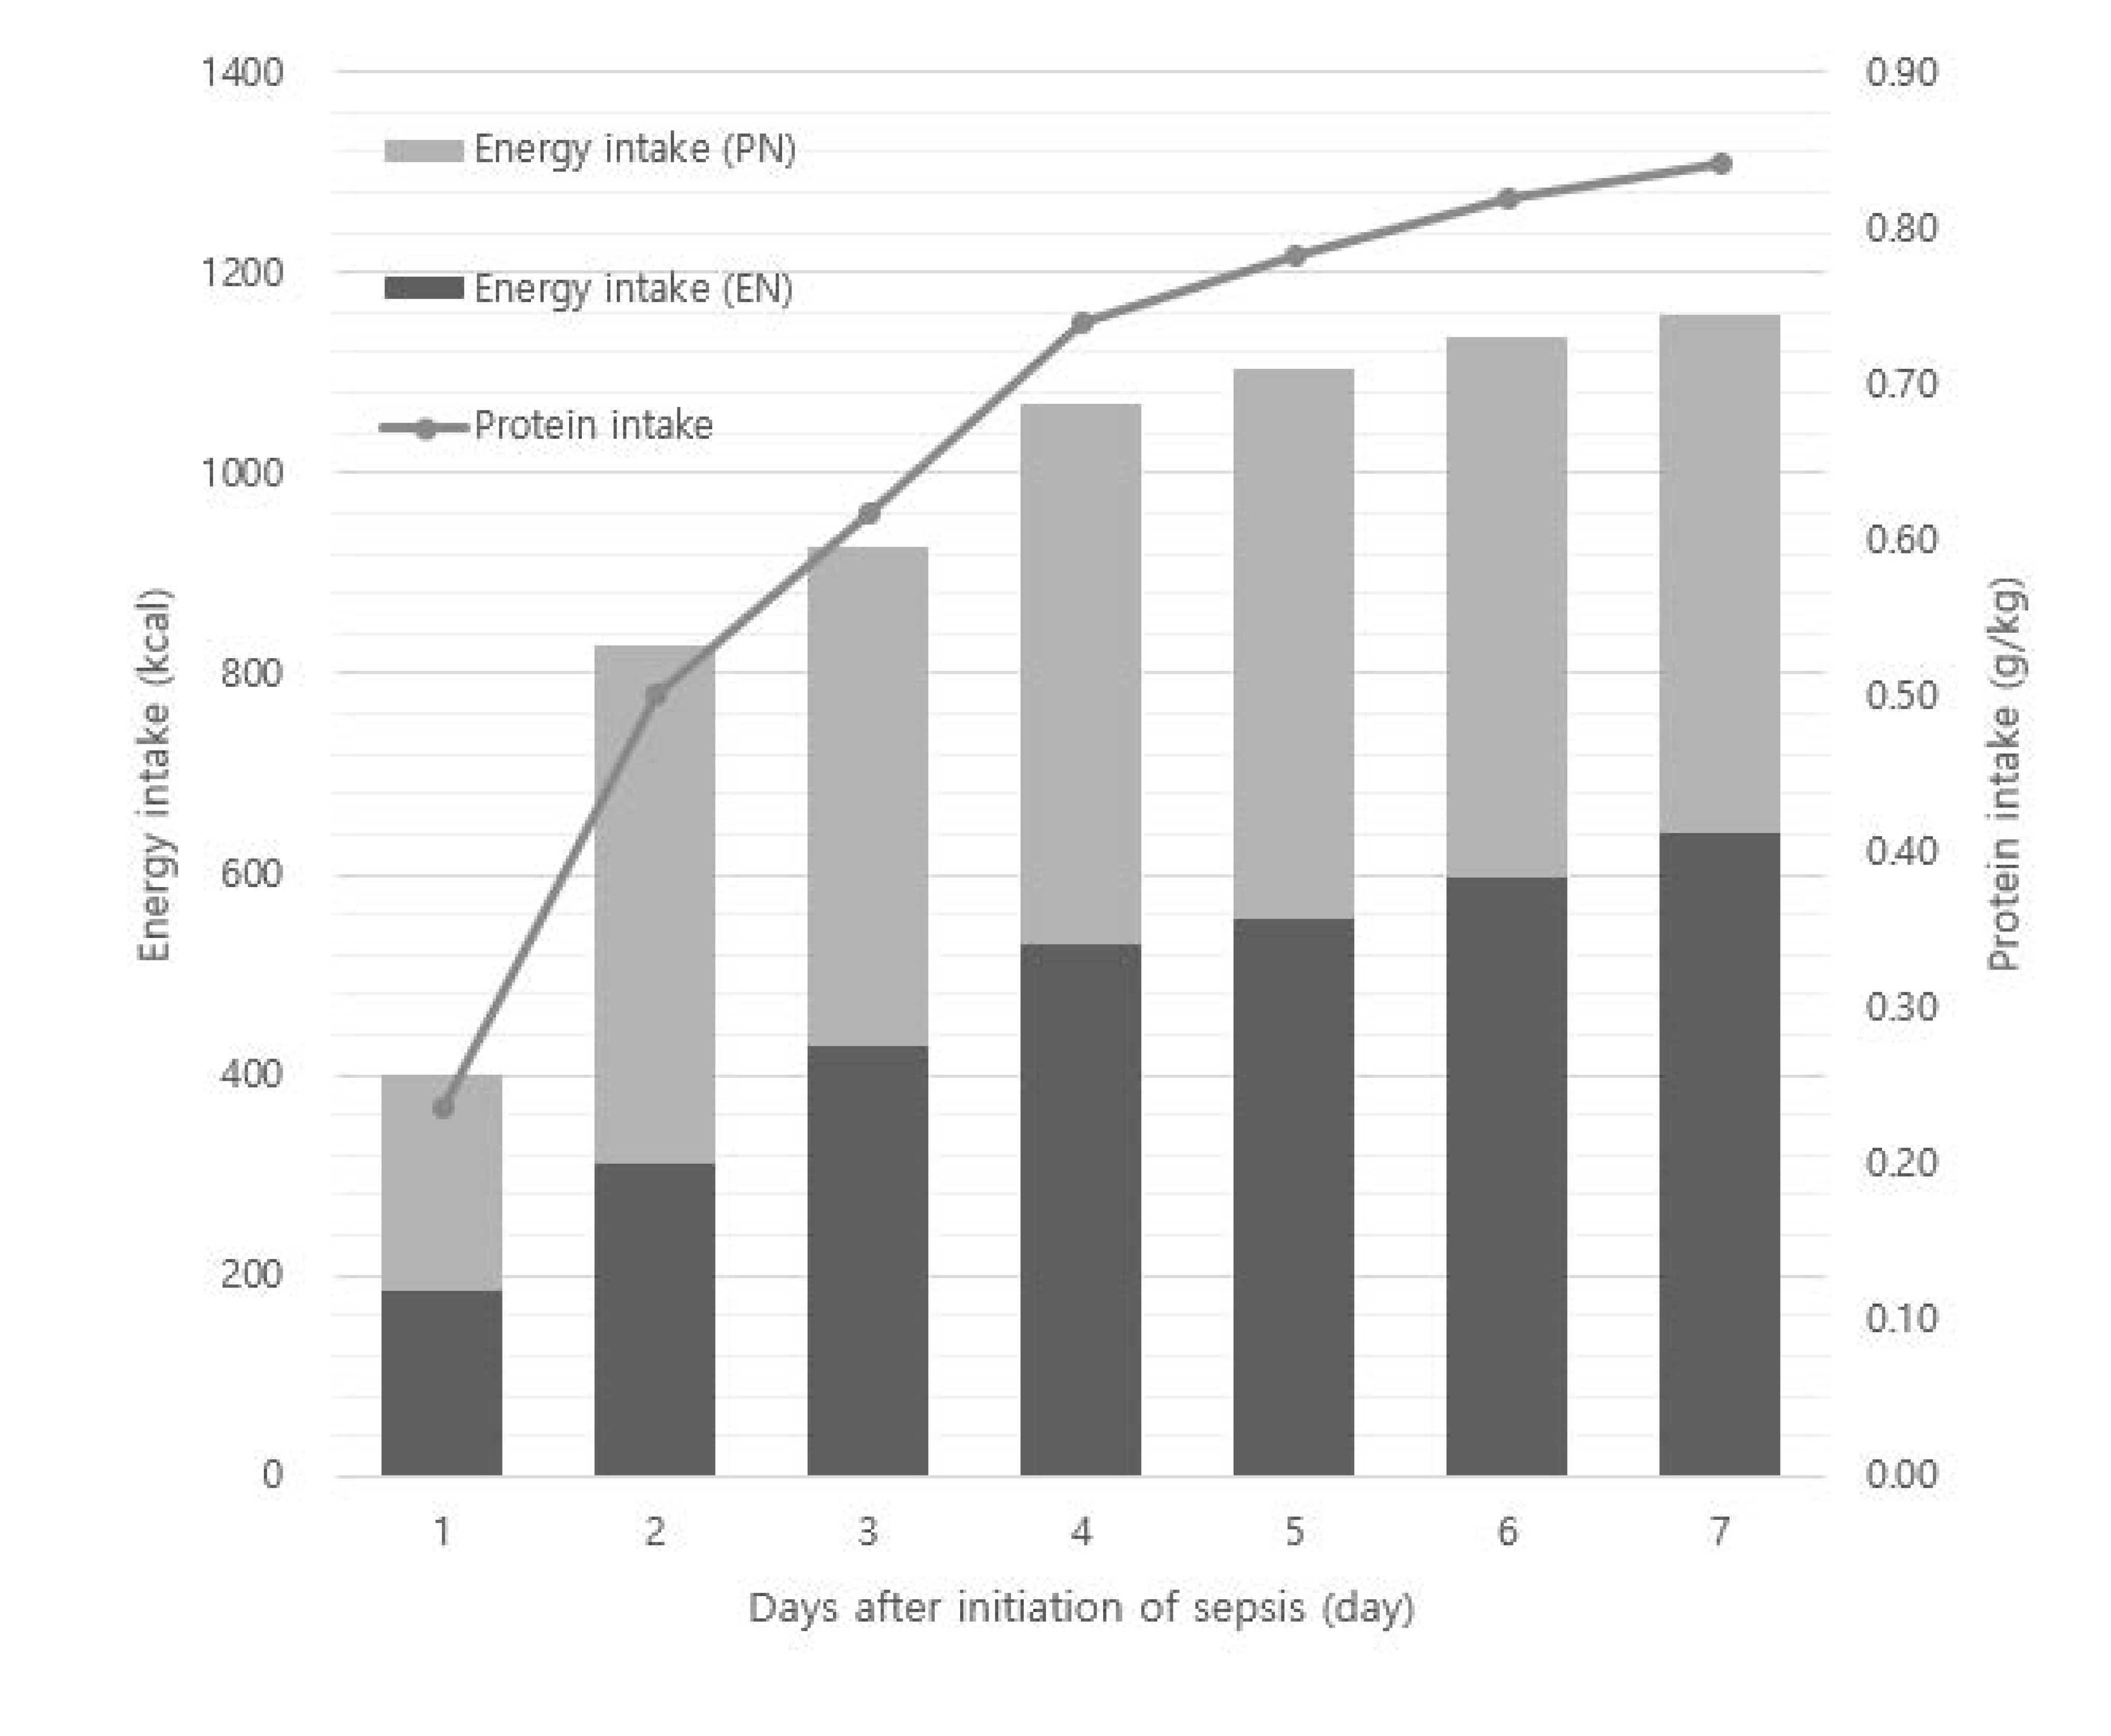
| Nutrition † | ||||
| Protein intake per body weight (g/kg/day) † | 0.6 (0.4–0.9) | 0.6 (0.3–0.8) | 0.7 (0.5–1.0) | <0.001 * |
| Protein intake (g/day) † | 34.9 (18.7) | 31.3 (18.7) | 39.3 (17.8) | <0.001 * |
| Energy intake (kcal/day) † | 926.0 (377.2) | 867.2 (36.2.5) | 1000.9 (382.7) | <0.001 * |
| Target energy achievement (%) † | 80.0 (33.7) | 74.5 (32.0) | 87.0 (34.6) | <0.001 * |
| Treatment in ICU | ||||
| Vasopressor use days | 5 (2–8) | 6 (4–11) | 2 (0–6) | <0.001 * |
| Ventilator-free days during 28 days | 23 (14–26) | 24 (18–28) | 26 (21–28) | 0.005 |
| New continuous renal replacement therapy | 200 (24.0%) | 166 (36%) | 34 (9%) | <0.001 * |
| Clinical outcomes | ||||
| Length of ICU stay (days) | 9 (6–15) | 9 (6–16) | 8 (6–14) | <0.001 * |
| Length of hospital stay (days) | 25 (14–43) | 24 (14–42) | 26 (15–44) | 0.137 |
| ICU mortality | 175 (21.0%) | |||
| In-hospital mortality | 281 (33.7%) | 201 (43%) | 80 (22%) | <0.001 * |
| 30-day mortality | 240 (28.8%) | 163 (35%) | 77 (21%) | <0.001 * |
| 1-year mortality | 488 (58.5%) | 306 (66%) | 182 (50%) | <0.001 * |
| Discharge course | <0.001 * | |||
| Other hospital | 211 (25.3%) | 104 (22%) | 107 (29%) | |
| Healthcare center | 58 (7.0%) | 27 (6%) | 31 (8%) | |
| Home | 276 (33.1%) | 130 (28%) | 146 (40%) | |
| Death | 280 (33.6%) | 201 (43%) | 79 (22%) | |
| Other courses | 9 (1.1%) | 5 (1%) | 4 (1%) |
| Total (n = 834) | mNUTRIC Scores | |||||||||||
|---|---|---|---|---|---|---|---|---|---|---|---|---|
| Low (n = 84) | High (n = 750) | |||||||||||
| Unadjusted | Adjusted † | Unadjusted | Adjusted † | Unadjusted | Adjusted † | |||||||
| Hazard Ratio (95% CI) | p-Value | Hazard Ratio (95% CI) | p-Value | Hazard Ratio (95% CI) | p-Value | Hazard Ratio (95% CI) | p-Value | Hazard Ratio (95% CI) | p-Value | Hazard Ratio (95% CI) | p-Value | |
| Sex, male | 1.11 (0.86–1.43) | 0.412 | 0.77 (0.18–3.28) | 0.727 | 1.11 (0.86–1.44) | 0.413 | ||||||
| SOFA score | 1.14 (1.10–1.18) | <0.001 * | 1.07 (1.02–1.12) | 0.006 * | 1.15 (1.00–1.34) | 0.065 | 1.12 (1.08–1.16) | <0.001 * | 1.07 (1.02–1.12) | 0.009 * | ||
| APACHE II score | 1.05 (1.04–1.07) | <0.001 * | 1.02 (1.00–1.04) | 0.083 | 1.00 (0.89–1.12) | 0.971 | 1.05 (1.03–1.06) | <0.001 * | 1.03 (1.01–1.05) | 0.015 * | ||
| Comorbidities | 1.06 (1.00–1.13) | 0.070 | 1.01 (0.61–1.68) | 0.975 | 1.03 (0.96–1.10) | 0.457 | ||||||
| Protein intake (g/kg/day) † | 0.43 (0.30–0.60) | <0.001 * | 0.55 (0.39–0.78) | 0.001 * | 0.22 (0.03–1.50) | 0.121 | 0.46 (0.32–0.65) | <0.001 * | 0.59 (0.42–0.84) | 0.004 * | ||
| Energy intake, target 10% † | 0.93 (0.90–0.96) | <0.001 * | 0.88 (0.71–1.09) | 0.250 | 0.93 (0.89–0.96) | <0.001 * | ||||||
| mNUTRIC score | 1.25 (1.16–1.36) | <0.001 * | 1.11 (1.01–1.23) | 0.039 * | ||||||||
| Total (n = 834) | mNUTRIC Score | |||||||||||
|---|---|---|---|---|---|---|---|---|---|---|---|---|
| Low (n = 84) | High (n = 750) | |||||||||||
| Unadjusted | Adjusted † | Unadjusted | Adjusted † | Unadjusted | Adjusted † | |||||||
| Hazard Ratio (95% CI) | p-Value | Hazard Ratio (95% CI) | p-Value | Hazard Ratio (95% CI) | p-Value | Hazard Ratio (95% CI) | p-Value | Hazard Ratio (95% CI) | p-Value | Hazard Ratio (95% CI) | p-Value | |
| Sex, male | 1.17 (0.89–1.54) | 0.249 | 1.30 (1.10–1.53) | 0.002 * | 1.28 (1.08–1.53) | 0.006 * | 1.13 (1.09–1.18) | <0.001 * | 1.07 (1.02–1.13) | 0.010 * | ||
| SOFA score | 1.06 (1.05–1.08) | <0.001 * | 1.07 (1.02–1.13) | 0.009 * | 1.06 (0.92–1.21) | 0.390 | 1.05 (1.04–1.07) | <0.001 * | 1.03 (1.01–1.06) | 0.003 * | ||
| APACHE II score | 1.36 (1.24–1.50) | <0.001 * | 1.02 (1.00–1.05) | 0.049 * | 0.89 (0.43–1.83) | 0.749 | 1.05 (0.98–1.13) | 0.184 | ||||
| Comorbidities | 1.09 (1.02–1.17) | 0.016 * | 0.10 (0.01–2.03) | 0.132 | 0.51 (0.35–0.73) | <0.001 * | ||||||
| Protein intake (g/kg/day) ** | 0.47 (0.32–0.68) | <0.001 * | 0.70 (0.49–0.99) | 0.043 * | 0.71 (0.48–1.05) | 0.084 | 0.93 (0.89–0.97) | <0.001 * | 0.96 (0.92–1.00) | 0.026 * | ||
| Energy intake, target 10% ** | 0.92 (0.89–0.96) | <0.001 * | 0.94 (0.90–0.98) | 0.003 * | 0.98 (0.18–5.36) | 0.983 | 1.19 (0.90–1.57) | 0.220 | ||||
| mNUTRIC score | 1.16 (1.12–1.20) | <0.001 * | 1.21 (1.08–1.36) | 0.001 * | ||||||||
| Septic Shock (n = 467) | Sepsis without Shock (n = 367) | |||||||
|---|---|---|---|---|---|---|---|---|
| Unadjusted | Adjusted † | Unadjusted | Adjusted † | |||||
| Hazard Ratio (95% CI) | p-Value | Hazard Ratio (95% CI) | p-Value | Hazard Ratio (95% CI) | p-Value | Hazard Ratio (95% CI) | p-Value | |
| Sex, male | 0.93 (0.67–1.29) | 0.657 | 0.68 (0.41–1.13) | 0.135 | ||||
| SOFA score | 1.14 (1.08–1.20) | <0.001 * | 1.06 (1.04–1.16) | 0.001 * | 1.16 (1.08–1.23) | <0.001 * | ||
| APACHE II score | 1.05 (1.03–1.07) | <0.001 * | 1.07 (1.04–1.10) | <0.001 * | 1.04 (1.00–1.08) | 0.047 * | ||
| Comorbidities | 1.07 (0.98–1.17) | 0.169 | 1.11 (0.98–1.26) | 0.088 | ||||
| Protein intake (g/kg/day) ** | 0.57 (0.36–0.91) | 0.018 * | 0.51 (0.26–0.99) | 0.045 * | ||||
| Energy intake, target 10% ** | 0.99 (0.98–0.99) | 0.012 * | 0.99 (0.98–0.99) | 0.03 * | 0.99 (0.99–1.00) | 0.06 | ||
| mNUTRIC score | 1.32 (1.16–1.51) | <0.001 * | 1.25 (0.09–1.44) | 0.002 * | 1.37 (1.19–1.59) | <0.001 * | 1.21 (1.00–1.46) | 0.048 * |
| Total (n = 827) | ||||
|---|---|---|---|---|
| Unadjusted | Adjusted † | |||
| Hazard Ratio (95% CI) | p-Value | Hazard Ratio (95% CI) | p-Value | |
| Sex, male | 1.29 (1.07–1.57) | 0.009 * | 0.75 (0.62–0.92) | 0.004 * |
| SOFA score | 1.10 (1.08–1.13) | <0.001 * | ||
| APACHE II score | 1.05 (1.04–1.06) | <0.001 * | 1.03 (1.02–1.05) | <0.001 * |
| Comorbidities | 1.12 (10.7–1.18) | <0.001 * | 1.06 (1.01–1.13) | 0.034 * |
| mNUTRIC score | 1.25 (1.18–1.33) | <0.001 * | 1.11 (1.03–1.21) | 0.008 * |
| Energy, target 10% | 0.97 (0.94–0.99) | 0.013 * | 0.97 (0.94–1.00) | 0.032 * |
| Route of nutrition delivery | 0.005 * | 0.067 | ||
| EN | 1.46 (1.16–1.84) | <0.001 ** | 1.31 (1.03–1.65) | 0.026 ** |
| PN | 1.19 (0.97–1.47) | 0.093 | 1.16 (0.94–1.42) | 0.171 |
| EN with supplemental PN | 1 | 1 | ||
Publisher’s Note: MDPI stays neutral with regard to jurisdictional claims in published maps and institutional affiliations. |
© 2022 by the authors. Licensee MDPI, Basel, Switzerland. This article is an open access article distributed under the terms and conditions of the Creative Commons Attribution (CC BY) license (https://creativecommons.org/licenses/by/4.0/).
Share and Cite
Cha, J.-K.; Kim, H.-S.; Kim, E.-J.; Lee, E.-S.; Lee, J.-H.; Song, I.-A. Effect of Early Nutritional Support on Clinical Outcomes of Critically Ill Patients with Sepsis and Septic Shock: A Single-Center Retrospective Study. Nutrients 2022, 14, 2318. https://doi.org/10.3390/nu14112318
Cha J-K, Kim H-S, Kim E-J, Lee E-S, Lee J-H, Song I-A. Effect of Early Nutritional Support on Clinical Outcomes of Critically Ill Patients with Sepsis and Septic Shock: A Single-Center Retrospective Study. Nutrients. 2022; 14(11):2318. https://doi.org/10.3390/nu14112318
Chicago/Turabian StyleCha, Jun-Kwon, Hyung-Sook Kim, Eun-Ji Kim, Eun-Sook Lee, Jae-Ho Lee, and In-Ae Song. 2022. "Effect of Early Nutritional Support on Clinical Outcomes of Critically Ill Patients with Sepsis and Septic Shock: A Single-Center Retrospective Study" Nutrients 14, no. 11: 2318. https://doi.org/10.3390/nu14112318