
Muscle-Related Effect of Whey Protein and Vitamin D3 Supplementation Provided before or after Bedtime in Males Undergoing Resistance Training

Abstract
:1. Introduction
2. Materials and Methods
2.1. Subjects
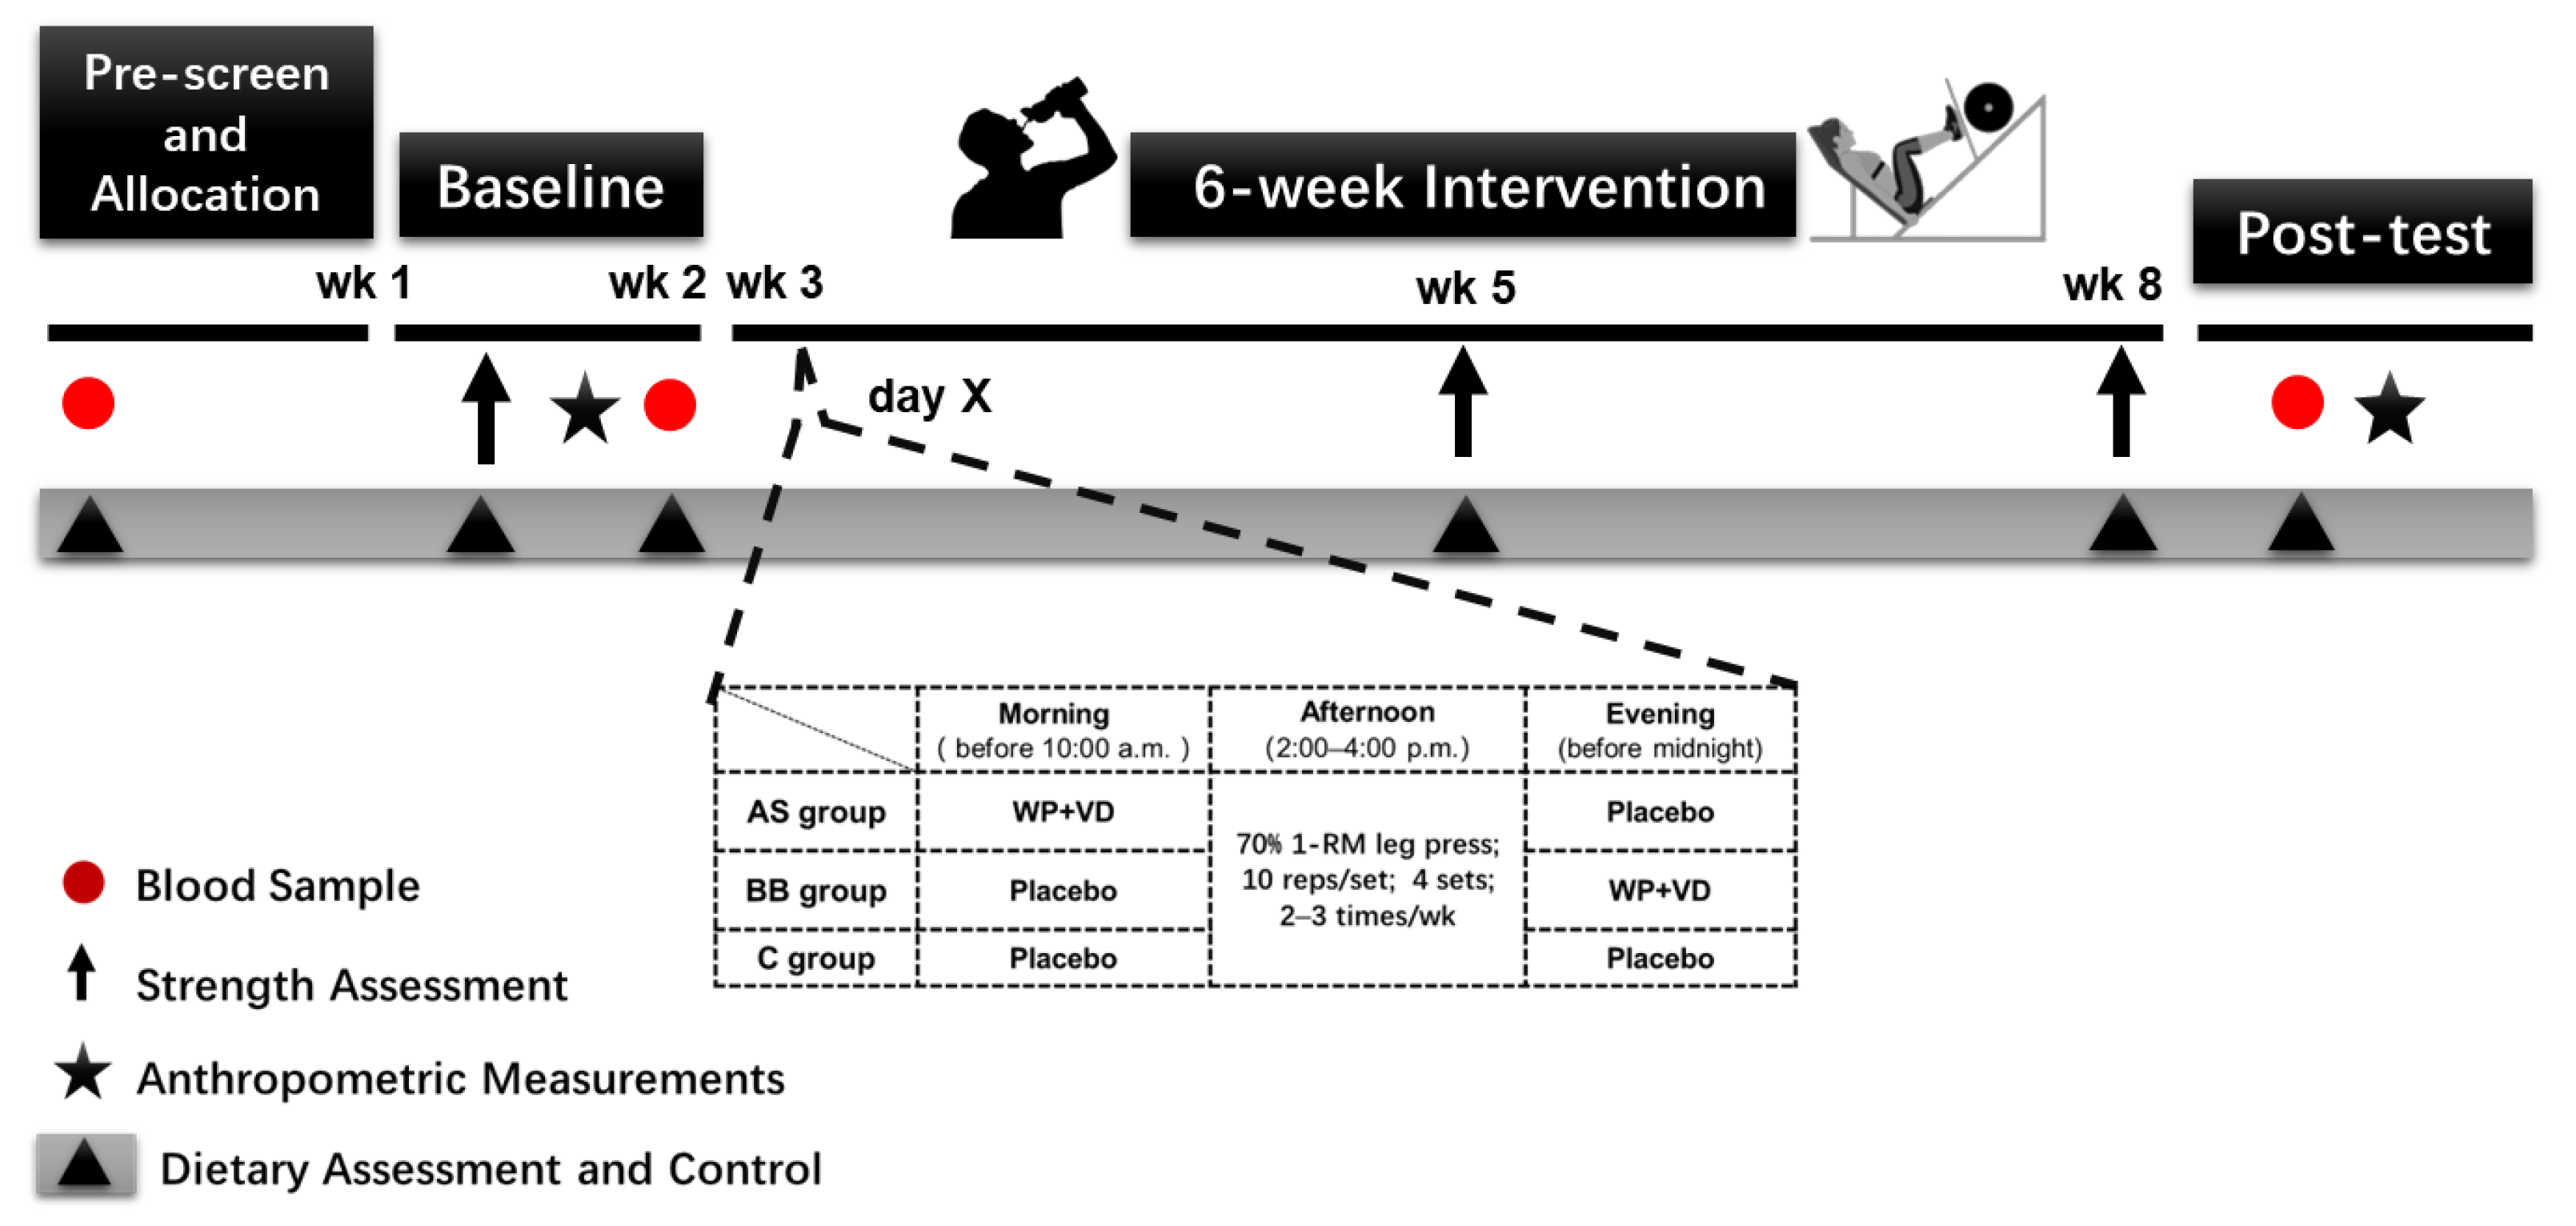
2.2. Study Design and Randomization Procedures
2.3. Supplement Intervention
2.4. Dietary Assessment and Control
2.5. RT Program
2.6. Self-Reported Dietary and Lifestyle Questionnaire
2.7. Strength Assessment
2.7.1. 1 RM Test
2.7.2. Isometric Knee Extension
2.8. Body Composition and Anthropometric Measurements
2.8.1. DXA
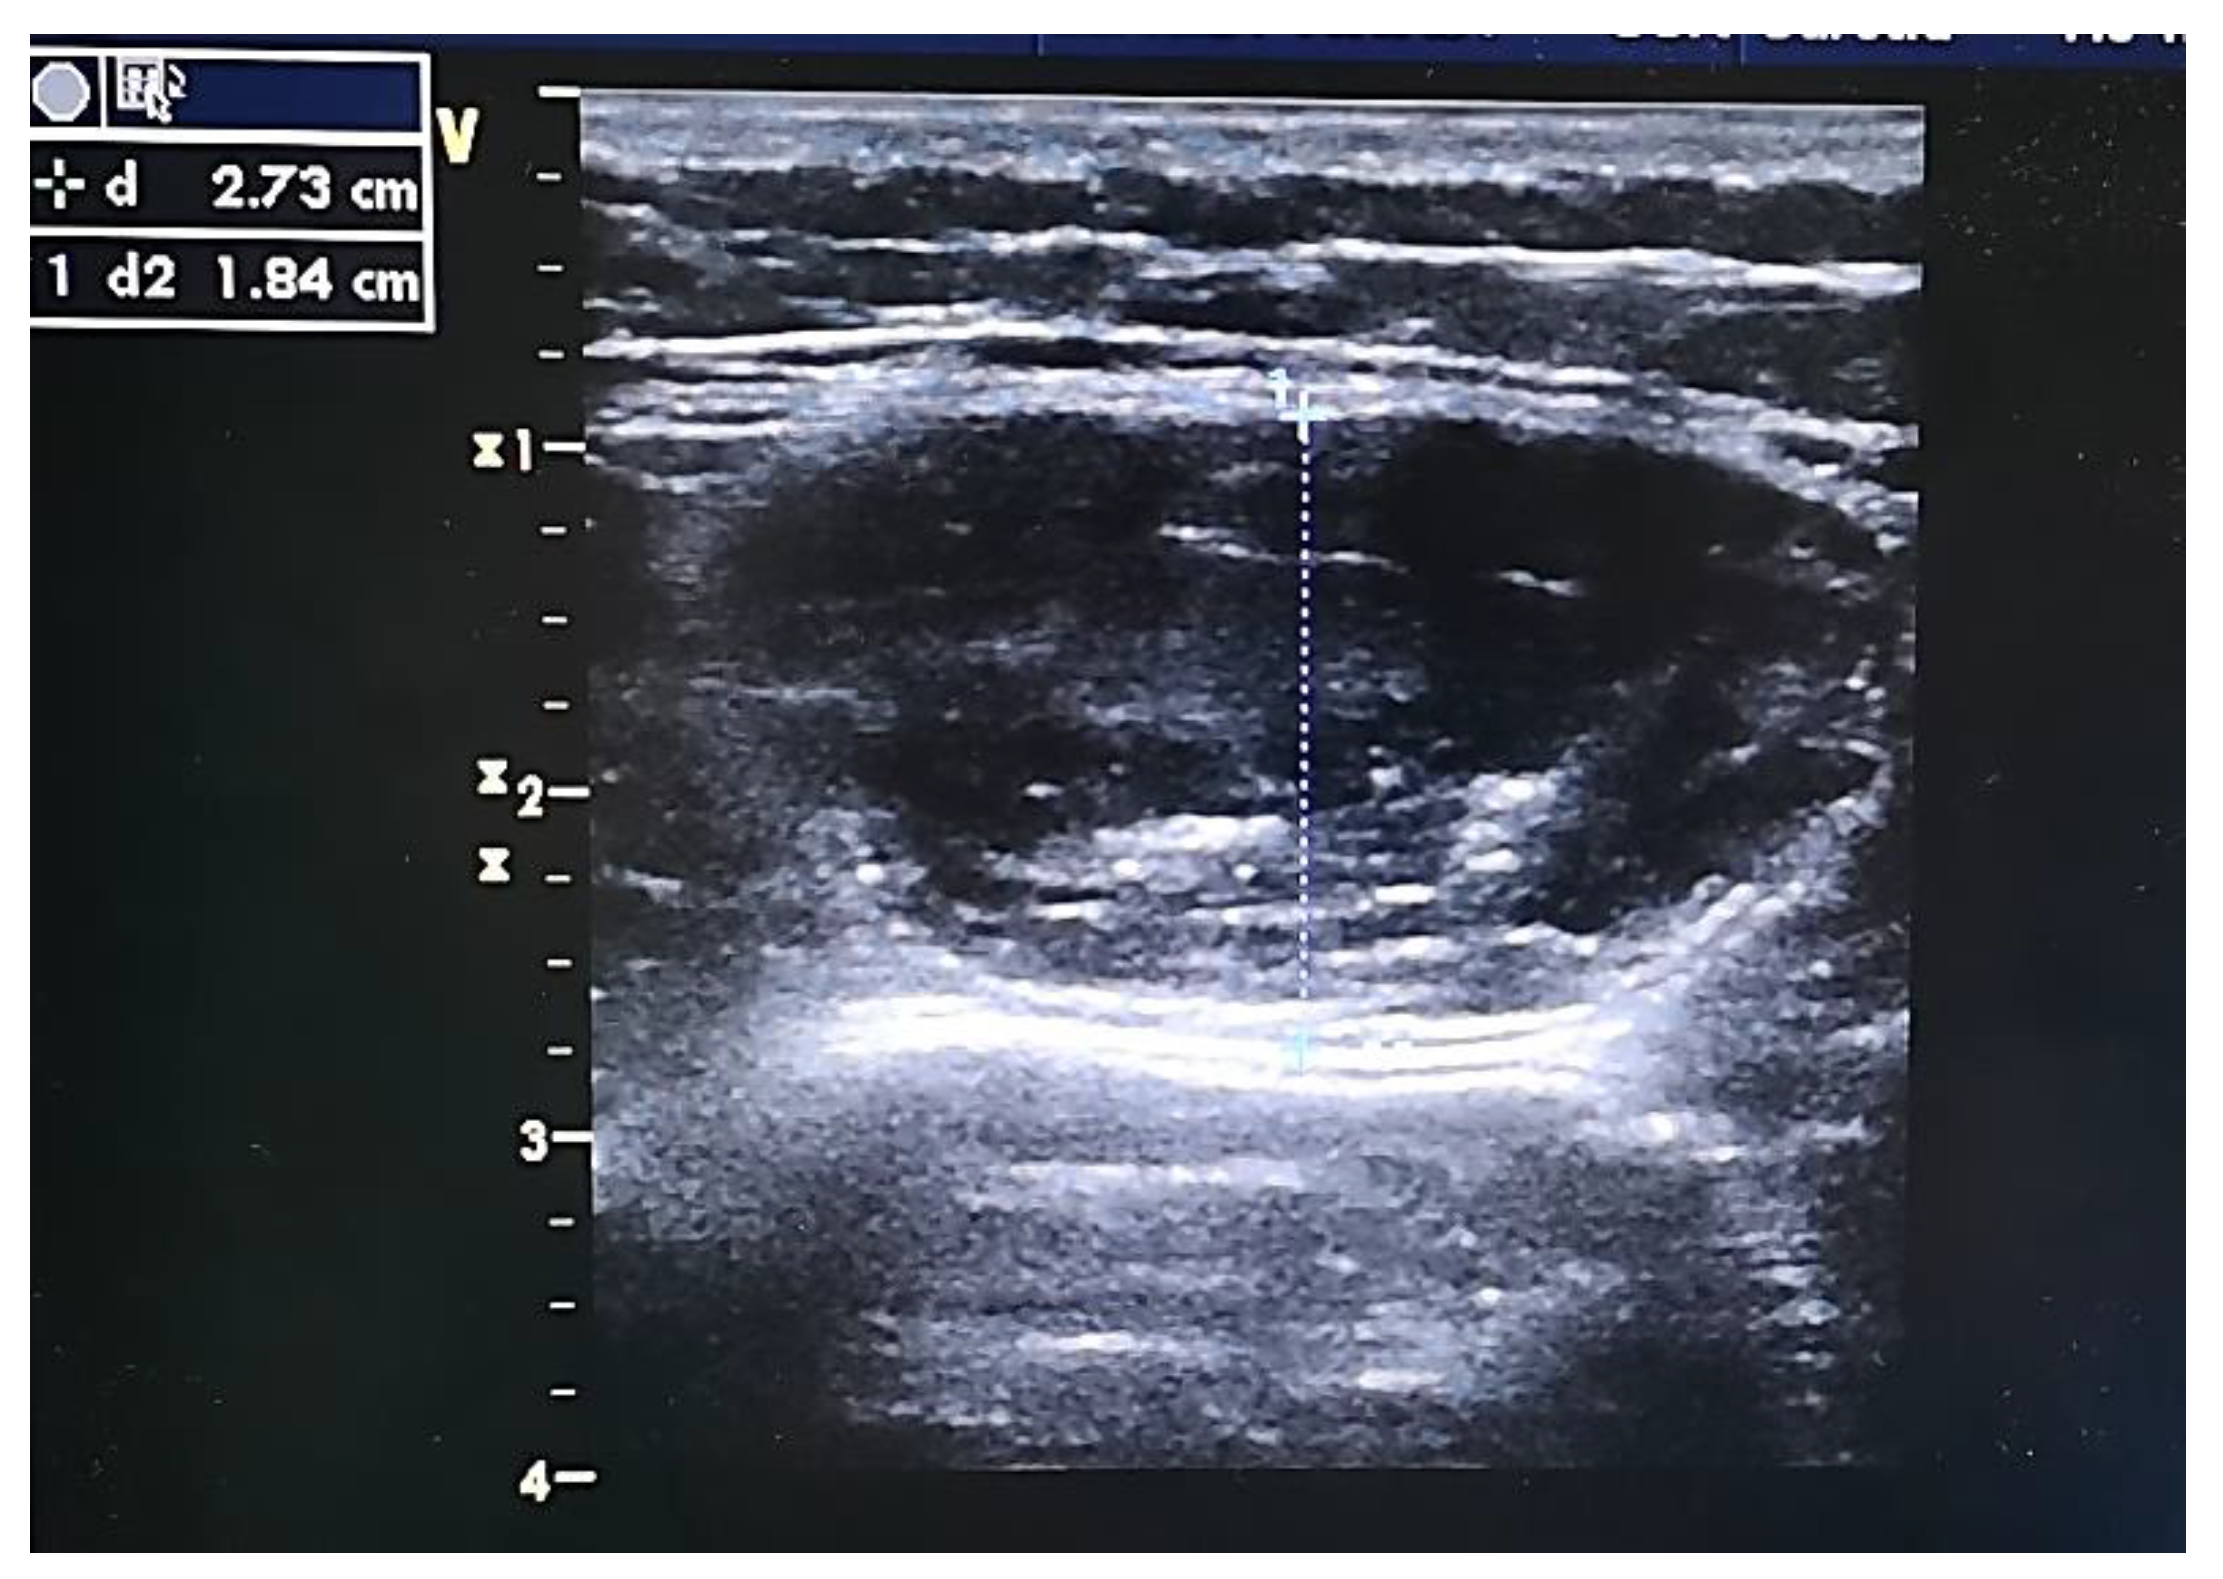
2.8.2. B-Mode US
2.9. Blood Analysis
2.10. Statistical Analysis
3. Results
3.1. Nutrient Intakes
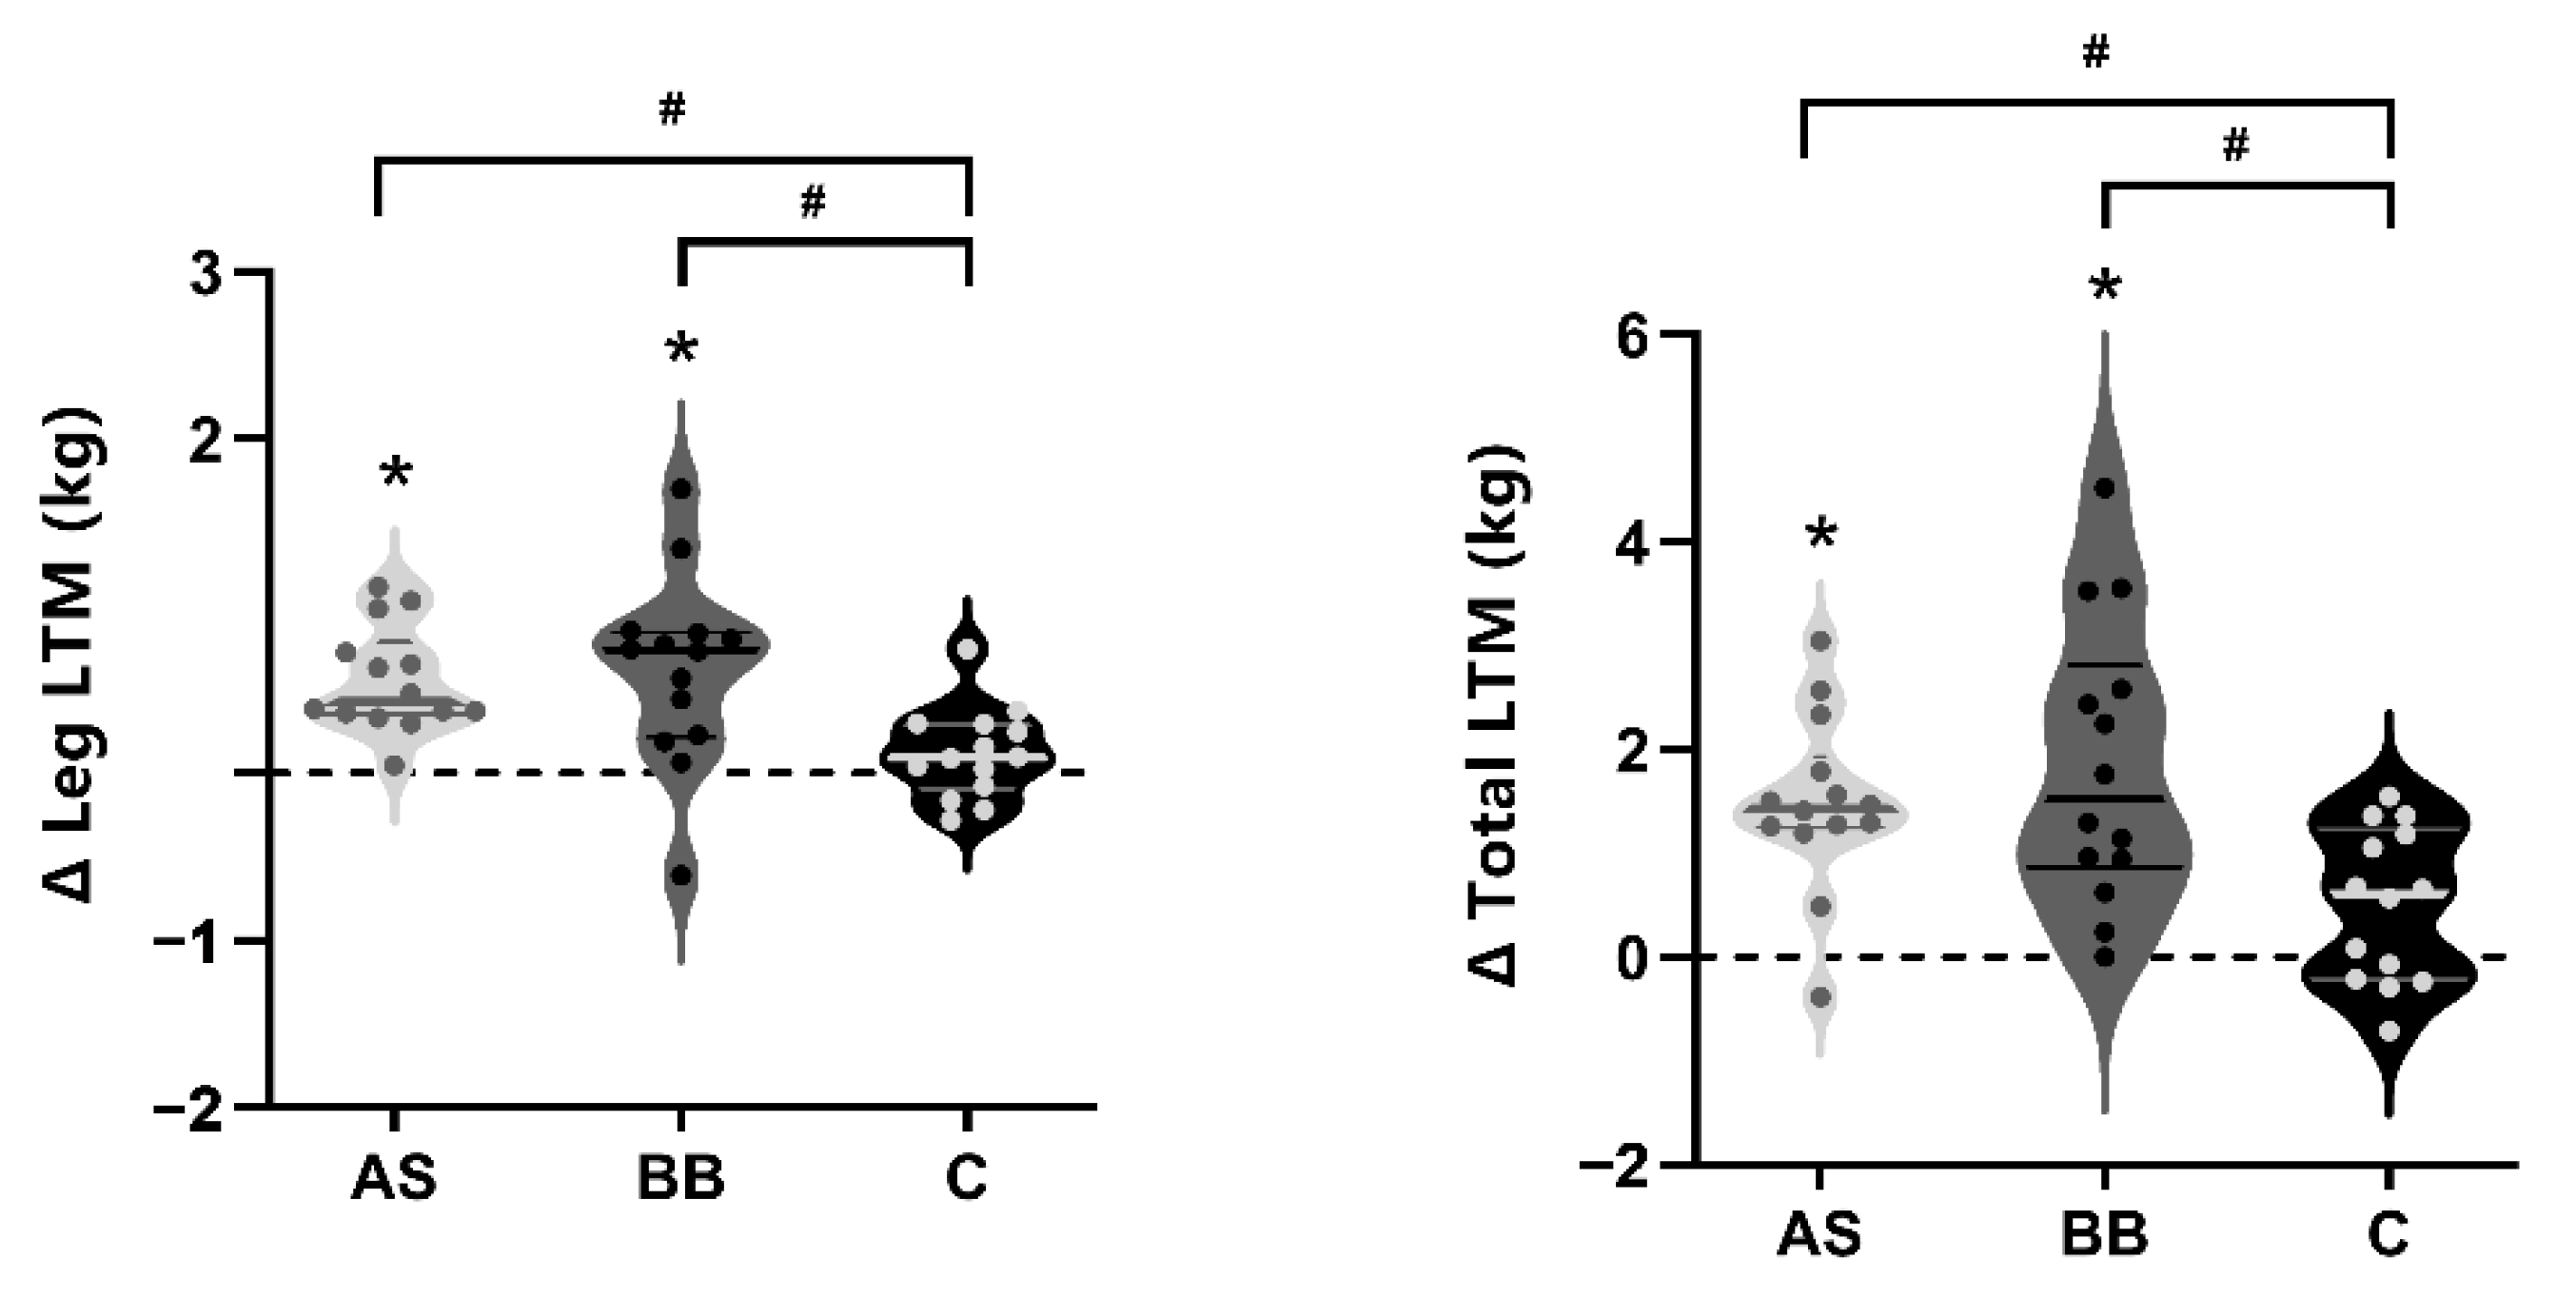
3.2. Body Composition and Anthropometry
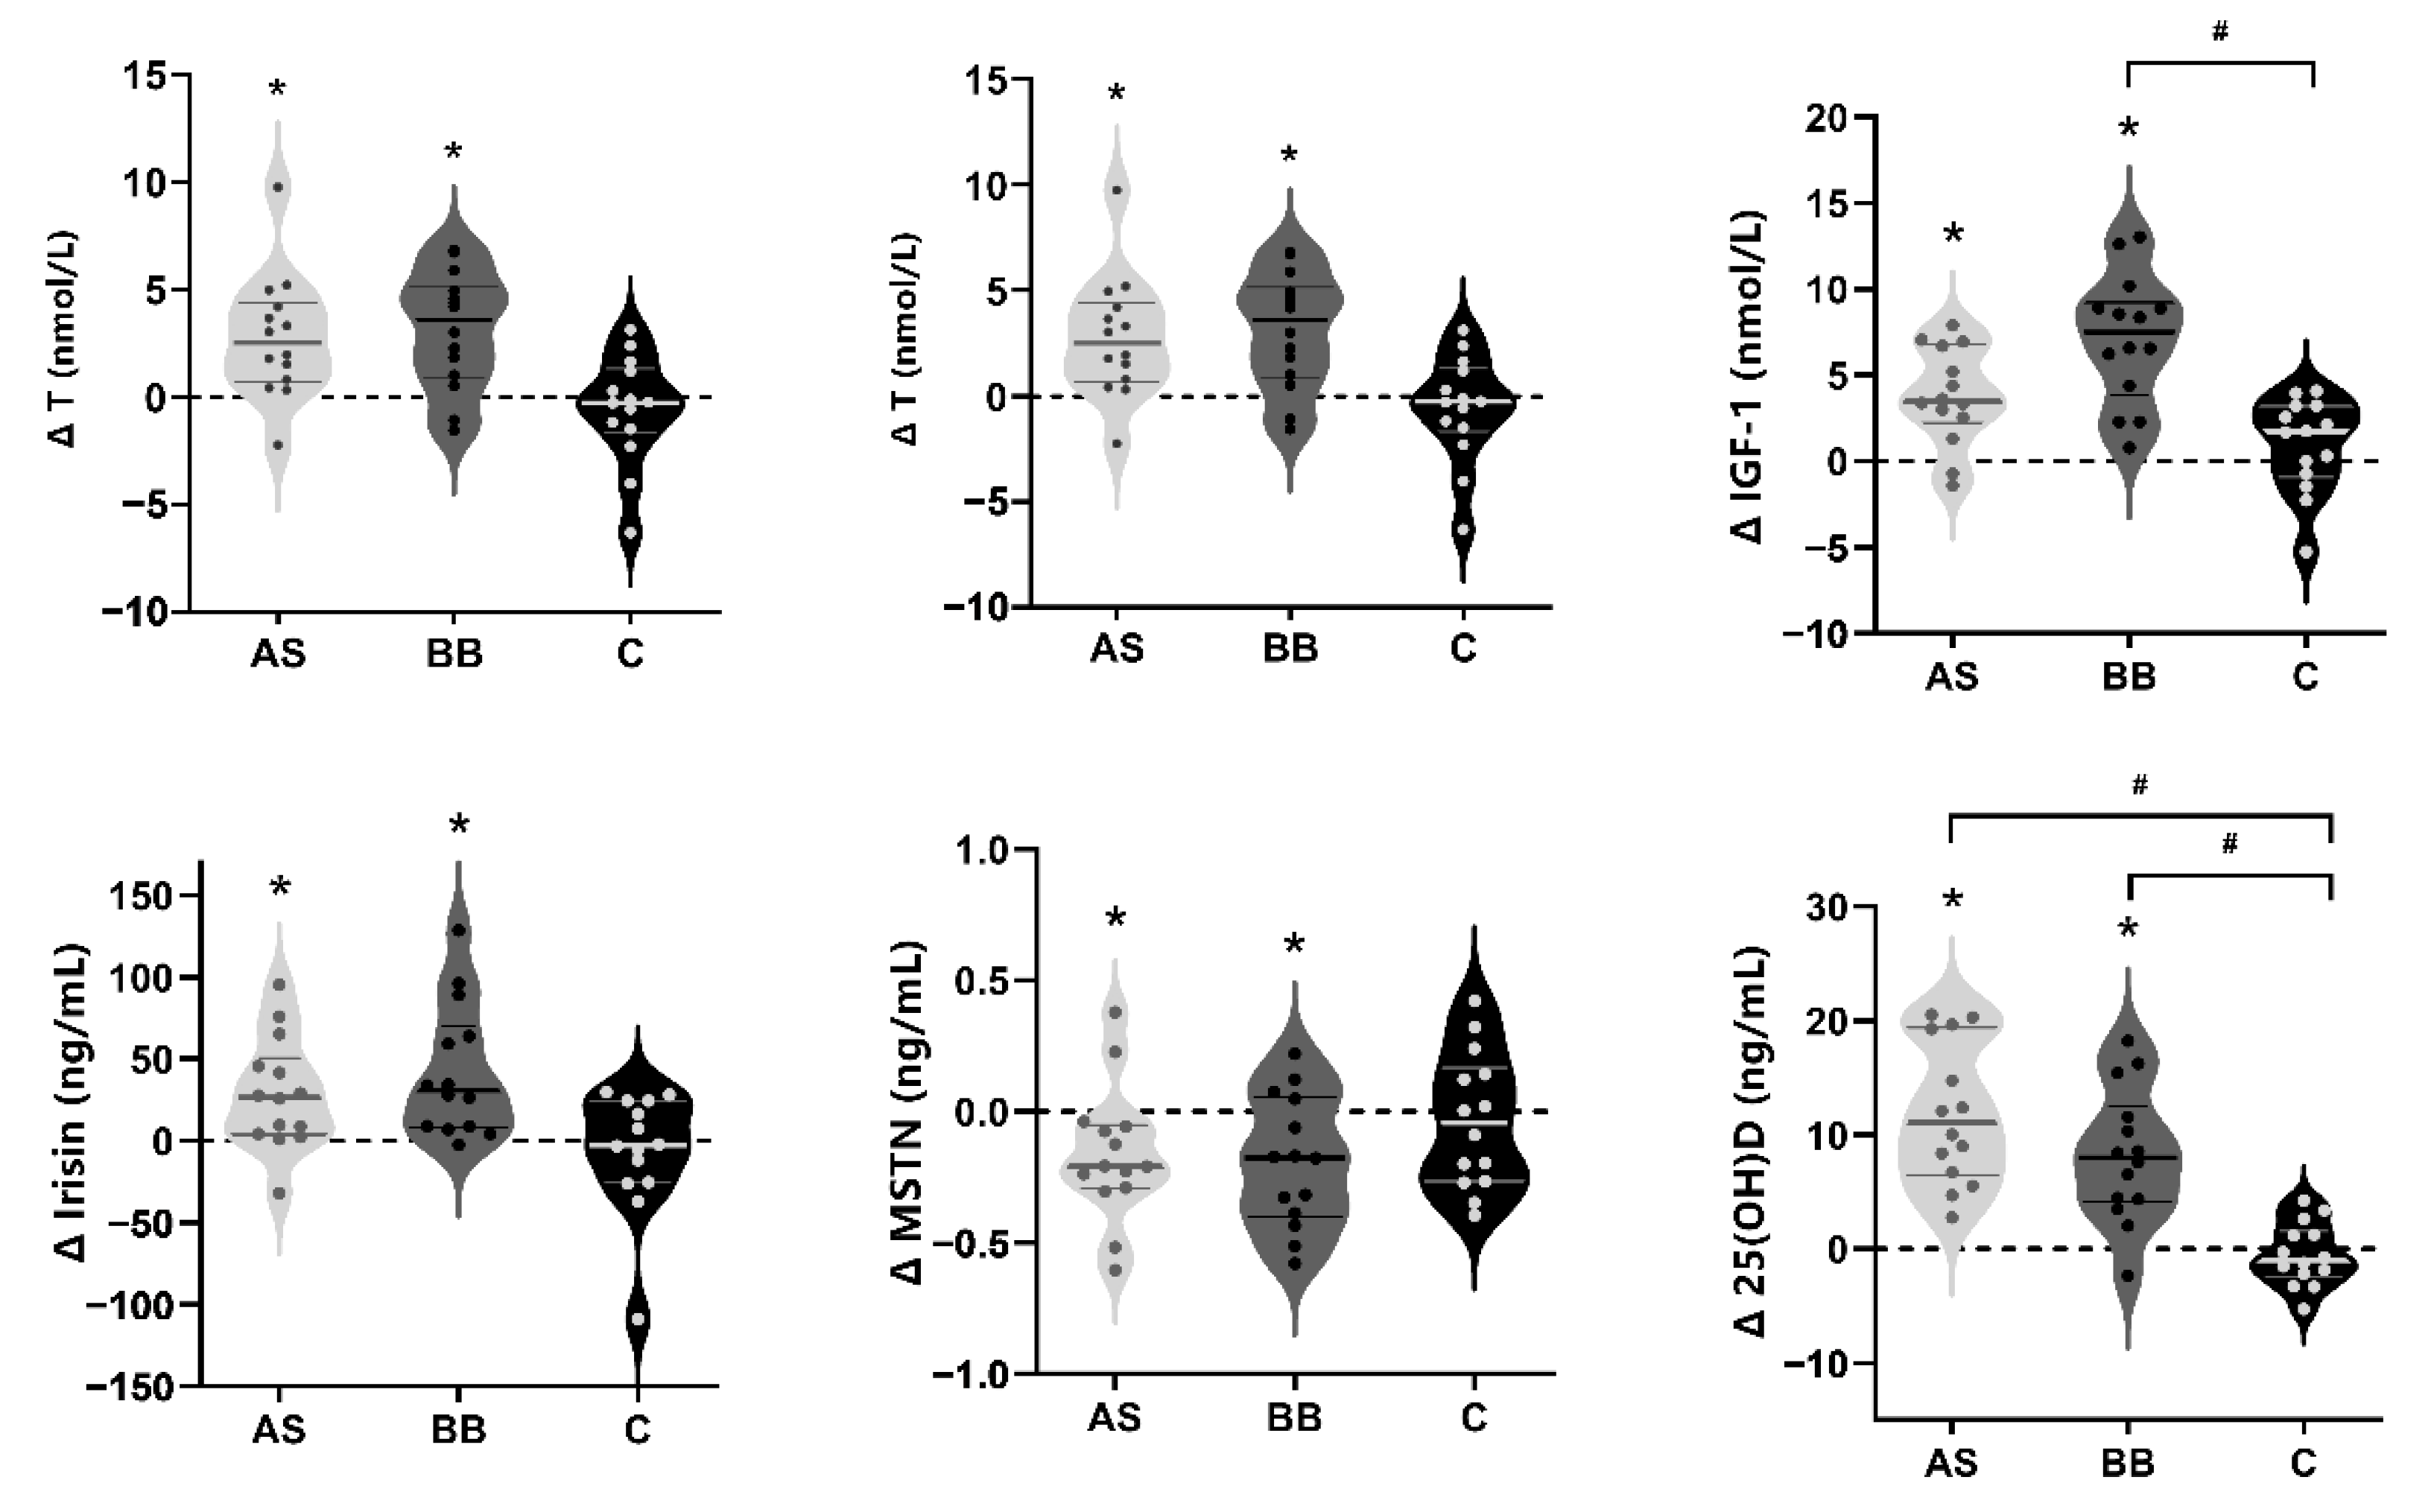
3.3. Blood Hormones
3.4. Muscle Strength
4. Discussion
5. Conclusions
Author Contributions
Funding
Institutional Review Board Statement
Informed Consent Statement
Data Availability Statement
Acknowledgments
Conflicts of Interest
References
- Phillips, S.M.; Tipton, K.D.; Aarsland, A.; Wolf, S.E.; Wolfe, R.R. Mixed muscle protein synthesis and breakdown after resistance exercise in humans. Am. J. Physiol. 1997, 273 Pt 1, E99–E107. [Google Scholar] [CrossRef]
- Mckendry, J.; Currier, B.S.; Lim, C.; McLeod, J.C.; Thomas, A.C.; Phillips, S.M. Nutritional Supplements to Support Resistance Exercise in Countering the Sarcopenia of Aging. Nutrients 2020, 12, 2057. [Google Scholar] [CrossRef]
- Churchward-Venne, T.A.; Tieland, M.; Verdijk, L.B.; Leenders, M.; Dirks, M.L.; van Loon Luc, J.C. There Are No Nonresponders to Resistance-Type Exercise Training in Older Men and Women. J. Am. Med. Dir. Assoc. 2015, 16, 400–411. [Google Scholar] [CrossRef]
- Karlsen, A.; Soendenbroe, C.; Malmgaard-Clausen, N.M.; Wagener, F.; Moeller, C.E.; Senhaji, Z.; Damberg, K.; Andersen, J.L.; Schjerling, P.; Kjaer, M.; et al. Preserved capacity for satellite cell proliferation, regeneration, and hypertrophy in the skeletal muscle of healthy elderly men. FASEB J. 2020, 34, 6418–6436. [Google Scholar] [CrossRef] [Green Version]
- Morton, R.W.; Mcglory, C.; Phillips, S.M. Nutritional interventions to augment resistance training-induced skeletal muscle hypertrophy. Front. Physiol. 2015, 6, 245. [Google Scholar] [CrossRef] [Green Version]
- Westerterp, K.R. Exercise, energy balance and body composition. Eur. J. Clin. Nutr. 2018, 72, 1246–1250. [Google Scholar] [CrossRef]
- Schoenfeld, B.J.; Aragon, A.A. How much protein can the body use in a single meal for muscle-building? Implications for daily protein distribution. J. Int. Soc. Sports Nutr. 2018, 15, 10. [Google Scholar] [CrossRef] [Green Version]
- Jäger, R.; Kerksick, C.M.; Campbell, B.I.; Cribb, P.J.; Wells, S.D.; Skwiat, T.M.; Purpura, M.; Ziegenfuss, T.N.; Ferrando, A.A.; Arent, S.M.; et al. International society of sports nutrition position stand: Protein and exercise. J. Int. Soc. Sport Nutr. 2017, 14, 20. [Google Scholar] [CrossRef] [Green Version]
- Antonio, J.; Ellerbroek, A.; Peacock, C.; Silver, T. Casein Protein Supplementation in Trained Men and Women: Morning versus Evening. Int. J. Exerc. Sci. 2017, 10, 479–486. [Google Scholar]
- Bauer, J.; Biolo, G.; Cederholm, T.; Cesari, M.; Cruz-Jentoft, A.J.; Morley, J.E.; Phillips, S.; Sieber, C.; Stehle, P.; Teta, D.; et al. Evidence-Based Recommendations for Optimal Dietary Protein Intake in Older People: A Position Paper from the PROT-AGE Study Group. J. Am. Med. Dir. Assoc. 2013, 14, 542–559. [Google Scholar] [CrossRef]
- Delk-Licata, A.; Behrens, C.; Benardot, D.; Bertrand, B.M.; Chandler-Laney, P.C.; Fernandez, J.R.; Plaisance, E.P. The association between dietary protein intake frequency, amount, and state of energy balance on body composition in a women’s collegiate soccer team. Int. J. Sports Exer. Med. 2019, 5, 123–129. [Google Scholar]
- Fahrenholtz, I.L.; Sjödin, A.; Benardot, D.; Tornberg, Å.B.; Skouby, S.; Faber, J.; Sundgot-Borgen, J.K.; Melin, A.K. Within-day energy deficiency and reproductive function in female endurance athletes. Scand. J. Med. Sci. Sports 2018, 28, 1139–1146. [Google Scholar] [CrossRef] [Green Version]
- Tipton, K.D.; Elliott, T.A.; Cree, M.G.; Wolf, S.E.; Sanford, A.P.; Wolfe, R.R. Ingestion of casein and whey proteins result in muscle anabolism after resistance exercise. Med. Sci. Sports Exerc. 2004, 36, 2073–2081. [Google Scholar] [CrossRef] [Green Version]
- Cribb, P.J.; Williams, A.D.; Carey, M.F.; Hayes, A. The effect of whey isolate and resistance training on strength, body composition, and plasma glutamine. Int. J. Sport Nutr. Exerc. Metab. 2006, 16, 494–509. [Google Scholar] [CrossRef]
- Loenneke, J.P.; Loprinzi, P.D.; Murphy, C.H.; Phillips, S. Per meal dose and frequency of protein consumption is associated with lean mass and muscle performance. Clin. Nutr. 2016, 35, 1506–1511. [Google Scholar] [CrossRef]
- Hudson, J.L.; Bergia, R.E.; Campbell, W.W. Protein distribution and muscle-related outcomes: Does the evidence support the concept? Nutrients 2020, 12, 1441. [Google Scholar] [CrossRef]
- Smeuninx, B.; Greig, C.; Breen, L. Amount, Source and Pattern of Dietary Protein Intake across the Adult Lifespan: A Cross-Sectional Study. Front. Nutr. 2020, 7, 25. [Google Scholar] [CrossRef] [Green Version]
- Cardon-Thomas, D.K.; Riviere, T.; Tieges, Z.; Greig, C.A. Dietary protein in older adults: Adequate daily intake but potential for improved distribution. Nutrients 2017, 9, 184. [Google Scholar] [CrossRef]
- Gingrich, A.; Spiegel, A.; Kob, R.; Schoene, D.; Skurk, T.; Hauner, H.; Sieber, C.C.; Volkert, D.; Kiesswetter, E. Amount, distribution, and quality of protein intake are not associated with muscle mass, strength, and power in healthy older adults without functional limitations—An enable study. Nutrients 2017, 9, 1358. [Google Scholar] [CrossRef] [Green Version]
- Ten Haaf, D.S.M.; Van Dongen, E.J.I.; Nuijten, M.A.H.; Eijsvogels, T.M.H.; De Groot, L.C.; Hopman, M.T.E. Protein intake and distribution in relation to physical functioning and quality of life in community-dwelling elderly people: Acknowledging the role of physical activity. Nutrients 2018, 10, 506. [Google Scholar] [CrossRef] [Green Version]
- Farsijani, S.; Morais, J.A.; Payette, H.; Gaudreau, P.; Shatenstein, B.; Gray-Donald, K.; Chevalier, S. Relation between mealtime distribution of protein intake and lean mass loss in free-living older adults of the NuAge study. Am. J. Clin. Nutr. 2016, 104, 694–703. [Google Scholar] [CrossRef] [PubMed]
- Farsijani, S.; Payette, H.; Morais, J.A.; Shatenstein, B.; Gaudreau, P.; Chevalier, S. Even mealtime distribution of protein intake is associated with greater muscle strength, but not with 3-y physical function decline, in free-living older adults: The Quebec longitudinal study on Nutrition as a Determinant of Successful Aging (NuAge study). Am. J. Clin. Nutr. 2017, 106, 113–124. [Google Scholar] [CrossRef] [PubMed]
- Liu, W.; Hu, J.; Fang, Y.; Wang, P.; Lu, Y.; Shen, N. Vitamin D status in Mainland of China: A systematic review and meta-analysis. eClinicalMedicine 2021, 38, 101017. [Google Scholar] [CrossRef] [PubMed]
- Tomlinson, P.B.; Joseph, C.; Angioi, M. Effects of vitamin D supplementation on upper and lower body muscle strength levels in healthy individuals. A systematic review with meta-analysis. J. Sci. Med. Sport 2015, 18, 575–580. [Google Scholar] [CrossRef]
- Agergaard, J.; Trøstrup, J.; Uth, J.; Iversen, J.V.; Boesen, A.; Andersen, J.L.; Schjerling, P.; Langberg, H. Does vitamin-D intake during resistance training improve the skeletal muscle hypertrophic and strength response in young and elderly men?—A randomized controlled trial. Nutr. Metab. 2015, 12, 32. [Google Scholar] [CrossRef] [Green Version]
- Salles, J.; Chanet, A.; Giraudet, C.; Patrac, V.; Pierre, P.; Jourdan, M.; Luiking, Y.C.; Verlaan, S.; Migne, C.; Boirie, Y.; et al. 1,25(OH)2-vitamin D3 enhances the stimulating effect of leucine and insulin on protein synthesis rate through A kt/PKB and m TOR mediated pathways in murine C2C12 skeletal myotubes. Mol. Nutr. Food Res. 2013, 57, 2137–2146. [Google Scholar] [CrossRef]
- Van Vliet, S.; Fappi, A.; Reeds, D.N.; Mittendorfer, B. No independent or combined effects of vitamin D and conjugated linoleic acids on muscle protein synthesis in older adults: A randomized, double-blind, placebo-controlled clinical trial. Am. J. Clin. Nutr. 2020, 112, 1382–1389. [Google Scholar] [CrossRef]
- Che, K.; Qiu, J.; Yi, L.; Zou, M.; Li, Z.; Carr, A.; Snipe, R.; Benardot, D. Effects of a Short-Term “Fat Adaptation with Carbohydrate Restoration” Diet on Metabolic Responses and Exercise Performance in Well-Trained Runners. Nutrients 2021, 13, 1033. [Google Scholar] [CrossRef]
- Larson-Meyer, D.E.; Douglas, C.S.; Thomas, J.J.; Johnson, E.C.; Barcal, J.N.; Heller, J.E.; Hollis, B.W.; Halliday, T.M. Validation of a vitamin D specific questionnaire to determine vitamin D status in athletes. Nutrients 2019, 11, 2732. [Google Scholar] [CrossRef] [Green Version]
- Mccurdy, K.; Langford, G.A.; Cline, A.L.; Doscher, M.; Hoff, R. The reliability of 1-and 3RM tests of unilateral strength in trained and untrained men and women. J. Sports Sci. Med. 2004, 3, 190. [Google Scholar]
- Yan, B.; Lai, X.; Yi, L.; Wang, Y.; Hu, Y. Effects of Five-Week Resistance Training in Hypoxia on Hormones and Muscle Strength. J. Strength Cond. Res. 2016, 30, 184–193. [Google Scholar] [CrossRef] [PubMed]
- Hacker, E.D.; Peters, T.; Garkova, M. Ultrasound assessment of the rectus femoris cross-sectional area: Subject position implications. West. J. Nurs. Res. 2016, 38, 1221–1230. [Google Scholar] [CrossRef] [PubMed]
- Chanet, A.; Verlaan, S.; Salles, J.; Giraudet, C.; Patrac, V.; Pidou, V.; Pouyet, C.; Hafnaoui, N.; Blot, A.; Cano, N.; et al. Supplementing Breakfast with a Vitamin D and Leucine–Enriched Whey Protein Medical Nutrition Drink Enhances Postprandial Muscle Protein Synthesis and Muscle Mass in Healthy Older Men. J. Nutr. 2017, 147, 2262–2271. [Google Scholar] [CrossRef] [PubMed] [Green Version]
- Yasuda, J.; Asako, M.; Arimitsu, T.; Fujita, S. Association of Protein Intake in Three Meals with Muscle Mass in Healthy Young Subjects: A Cross-Sectional Study. Nutrients 2019, 11, 612. [Google Scholar] [CrossRef] [Green Version]
- Park, Y.; Choi, J.-E.; Hwang, H.-S. Protein supplementation improves muscle mass and physical performance in undernourished prefrail and frail elderly subjects: A randomized, double-blind, placebo-controlled trial. Am. J. Clin. Nutr. 2018, 108, 1026–1033. [Google Scholar] [CrossRef]
- Mitchell, C.J.; Milan, A.M.; Mitchell, S.M.; Zeng, N.; Ramzan, F.; Sharma, P.; Knowles, S.O.; Roy, N.C.; Sjödin, A.; Wagner, K.-H.; et al. The effects of dietary protein intake on appendicular lean mass and muscle function in elderly men: A 10-wk randomized controlled trial. Am. J. Clin. Nutr. 2017, 106, 1375–1383. [Google Scholar] [CrossRef] [Green Version]
- Bollwein, J.; Diekmann, R.; Kaiser, M.J.; Bauer, J.M.; Uter, W.; Sieber, C.C.; Volkert, D. Distribution but not amount of protein intake is associated with frailty: A cross-sectional investigation in the region of Nürnberg. Nutr. J. 2013, 12, 109. [Google Scholar] [CrossRef] [Green Version]
- Moore, D.R.; Churchward-Venne, T.A.; Witard, O.; Breen, L.; Burd, N.A.; Tipton, K.D.; Phillips, S.M. Protein ingestion to stimulate myofibrillar protein synthesis requires greater relative protein intakes in healthy older versus younger men. J. Gerontol. Ser. A Biomed. Sci. Med. Sci. 2015, 70, 57–62. [Google Scholar] [CrossRef] [Green Version]
- Rousset, S.; Mirand, P.P.; Brandolini, M.; Martin, J.-F.; Boirie, Y. Daily protein intakes and eating patterns in young and elderly French. Br. J. Nutr. 2003, 90, 1107–1115. [Google Scholar] [CrossRef] [Green Version]
- Tieland, M.; Borgonjen-Van den Berg, K.J.; Van Loon, L.J.; De Groot, L.C.P.G.M. Dietary protein intake in Dutch elderly people: A focus on protein sources. Nutrients 2015, 7, 9697–9706. [Google Scholar] [CrossRef]
- Pennings, B.; Boirie, Y.; Senden, J.M.; Gijsen, A.P.; Kuipers, H.; van Loon, L.J. Whey protein stimulates postprandial muscle protein accretion more effectively than do casein and casein hydrolysate in older men. Am. J. Clin. Nutr. 2011, 93, 997–1005. [Google Scholar] [CrossRef] [PubMed] [Green Version]
- Ishikawa-Takata, K.; Takimoto, H. Current protein and amino acid intakes among Japanese people: Analysis of the 2012 National Health and Nutrition Survey. Geriatr. Gerontol. Int. 2018, 18, 723–731. [Google Scholar] [CrossRef] [PubMed]
- Ervice, U.A.R. Energy Intakes: Percentages of Energy from Protein, Carbohydrate, Fat, and Alcohol, by Gender and Age, What We Eat in America. 2012. Available online: https://www.ars.usda.gov/ba/bhnrc/fsrg (accessed on 10 March 2022).
- Yasuda, J.; Tomita, T.; Arimitsu, T.; Fujita, S. Evenly distributed protein intake over 3 meals augments resistance exercise-induced muscle hypertrophy in healthy young men. J. Nutr. 2020, 150, 1845–1851. [Google Scholar] [CrossRef] [PubMed]
- Kim, I.-Y.; Schutzler, S.; Schrader, A.M.; Spencer, H.J.; Azhar, G.; Wolfe, R.R.; Ferrando, A.A. Protein intake distribution pattern does not affect anabolic response, lean body mass, muscle strength or function over 8 weeks in older adults: A randomized-controlled trial. Clin. Nutr. 2018, 37, 488–493. [Google Scholar] [CrossRef]
- Baron, K.G.; Reid, K.J.; Kern, A.S.; Zee, P.C. Role of sleep timing in caloric intake and BMI. Obesity 2011, 19, 1374–1381. [Google Scholar] [CrossRef]
- Ormsbee, M.J.; Gorman, K.A.; Miller, E.A.; Baur, D.A.; Eckel, L.A.; Contreras, R.J.; Panton, L.B.; Spicer, M.T. Nighttime feeding likely alters morning metabolism but not exercise performance in female athletes. Appl. Physiol. Nutr. Metab. 2016, 41, 719–727. [Google Scholar] [CrossRef]
- Kinsey, A.W.; Ormsbee, M.J. The health impact of nighttime eating: Old and new perspectives. Nutrients 2015, 7, 2648–2662. [Google Scholar] [CrossRef]
- Trommelen, J.; Van Loon, L.J. Pre-sleep protein ingestion to improve the skeletal muscle adaptive response to exercise training. Nutrients 2016, 8, 763. [Google Scholar] [CrossRef] [Green Version]
- Snijders, T.; Res, P.T.; Smeets, J.S.; van Vliet, S.; van Kranenburg, J.; Maase, K.; Kies, A.K.; Verdijk, L.B.; van Loon, L.J.C. Protein ingestion before sleep increases muscle mass and strength gains during prolonged resistance-type exercise training in healthy young men. J. Nutr. 2015, 145, 1178–1184. [Google Scholar] [CrossRef] [Green Version]
- Burk, A.; Timpmann, S.; Medijainen, L.; Vähi, M.; Ööpik, V. Time-divided ingestion pattern of casein-based protein supplement stimulates an increase in fat-free body mass during resistance training in young untrained men. Nutr. Res. 2009, 29, 405–413. [Google Scholar] [CrossRef]
- Hamilton, B.; Whiteley, R.; Farooq, A.; Chalabi, H. Vitamin D concentration in 342 professional football players and association with lower limb isokinetic function. J. Sci. Med. Sport 2014, 17, 139–143. [Google Scholar] [CrossRef] [PubMed]
- Koundourakis, N.E.; Androulakis, N.E.; Malliaraki, N.; Margioris, A.N. Vitamin D and exercise performance in professional soccer players. PLoS ONE 2014, 9, e101659. [Google Scholar] [CrossRef] [PubMed]
- Książek, A.; Zagrodna, A.; Słowińska-Lisowska, M. Vitamin D, Skeletal Muscle Function and Athletic Performance in Athletes—A Narrative Review. Nutrients 2019, 11, 1800. [Google Scholar] [CrossRef] [PubMed] [Green Version]
- Pludowski, P.; Holick, M.F.; Grant, W.B.; Konstantynowicz, J.; Mascarenhas, M.R.; Haq, A.; Povoroznyuk, V.; Balatska, N.; Barbosa, A.P.; Karonova, T.; et al. Vitamin D supplementation guidelines. J. Steroid Biochem. Mol. Biol. 2018, 175, 125–135. [Google Scholar] [CrossRef] [Green Version]
- Bischoff-Ferrari, H.A.; Dietrich, T.; Orav, E.J.; Hu, F.B.; Zhang, Y.; Karlson, E.W.; Dawson-Hughes, B. Higher 25-hydroxyvitamin D concentrations are associated with better lower-extremity function in both active and inactive persons aged > or =60 y. Am. J. Clin. Nutr. 2004, 80, 752–758. [Google Scholar] [CrossRef]
- Dam, T.T.; von Mühlen, D.; Barrett-Connor, E.L. Sex-specific association of serum vitamin D levels with physical function in older adults. Osteoporos. Int. 2009, 20, 751–760. [Google Scholar] [CrossRef] [Green Version]
- Houston, D.K.; Cesari, M.; Ferrucci, L.; Cherubini, A.; Maggio, D.; Bartali, B.; Johnson, M.A.; Schwartz, G.G.; Kritchevsky, S.B. Association between vitamin D status and physical performance: The InCHIANTI study. J. Gerontol. Ser. A Biol. Sci. Med. Sci. 2007, 62, 440–446. [Google Scholar] [CrossRef]
- Wicherts, I.S.; Van Schoor, N.M.; Boeke, A.J.; Visser, M.; Deeg, D.J.H.; Smit, J.; Knol, D.L.; Lips, P. Vitamin D status predicts physical performance and its decline in older persons. J. Clin. Endocrinol. Metab. 2007, 92, 2058–2065. [Google Scholar] [CrossRef]
- Dzik, K.; Skrobot, W.; Flis, D.J.; Karnia, M.; Libionka, W.; Kloc, W.; Kaczor, J.J. Vitamin D supplementation attenuates oxidative stress in paraspinal skeletal muscles in patients with low back pain. Psychol. Res. 2017, 118, 143–151. [Google Scholar] [CrossRef]
- Ross, A.C.; Manson, J.E.; Abrams, S.A.; Aloia, J.F.; Brannon, P.M.; Clinton, S.K.; Durazo-Arvizu, R.A.; Gallagher, J.C.; Gallo, R.L.; Jones, G.; et al. The 2011 report on dietary reference intakes for calcium and vitamin D from the Institute of Medicine: What clinicians need to know. J. Clin. Endocrinol. Metab. 2011, 96, 53–58. [Google Scholar] [CrossRef]
- Holick, M.F.; Binkley, N.C.; Bischoff-Ferrari, H.A.; Gordon, C.M.; Hanley, D.A.; Heaney, R.P.; Murad, M.H.; Weaver, C.M. Evaluation, treatment, and prevention of vitamin D deficiency: An Endocrine Society clinical practice guideline. J. Clin. Endocrinol. Metab. 2011, 96, 1911–1930. [Google Scholar] [CrossRef] [PubMed] [Green Version]
- Yoon, S.; Kwon, O.; Kim, J. Vitamin D in athletes: Focus on physical performance and musculoskeletal injuries. Phys. Act. Nutr. 2021, 25, 20–25. [Google Scholar] [CrossRef] [PubMed]
- Schoenfeld, B.J.; Ogborn, D.; Krieger, J.W. Dose-response relationship between weekly resistance training volume and increases in muscle mass: A systematic review and meta-analysis. J. Sports Sci. 2017, 35, 1073–1082. [Google Scholar] [CrossRef] [PubMed]
- Ceglia, L.; Niramitmahapanya, S.; da Silva Morais, M.; Rivas, D.A.; Harris, S.S.; Bischoff-Ferrari, H.; Fielding, R.A.; Dawson-Hughes, B. A Randomized Study on the Effect of Vitamin D3 Supplementation on Skeletal Muscle Morphology and Vitamin D Receptor Concentration in Older Women. J. Clin. Endocrinol. Metab. 2013, 98, E1927–E1935. [Google Scholar] [CrossRef] [Green Version]
- Bollen, S.E.; Atherton, P.J. Myogenic, genomic and non-genomic influences of the vitamin D axis in skeletal muscle. Cell Biochem. Funct. 2021, 39, 48–59. [Google Scholar] [CrossRef]
- Savolainen, L.; Timpmann, S.; Mooses, M.; Mäestu, E.; Medijainen, L.; Tõnutare, L.; Ross, F.; Lellsaar, M.; Unt, E.; Ööpik, V. Vitamin D supplementation does not enhance resistance training-induced gains in muscle strength and lean body mass in vitamin D deficient young men. Eur. J. Appl. Physiol. 2021, 121, 2077–2090. [Google Scholar] [CrossRef]
- Gharahdaghi, N.; Rudrappa, S.; Brook, M.; Idris, I.; Crossland, H.; Hamrock, C.; Aziz, M.H.A.; Kadi, F.; Tarum, J.; Greenhaff, P.L.; et al. Testosterone therapy induces molecular programming augmenting physiological adaptations to resistance exercise in older men. J. Cachex-Sarcopenia Muscle 2019, 10, 1276–1294. [Google Scholar] [CrossRef] [Green Version]
- Yin, L.; Lu, L.; Lin, X.; Wang, X. Crucial role of androgen receptor in resistance and endurance trainings-induced muscle hypertrophy through IGF-1/IGF-1R-PI3K/Akt-mTOR pathway. Nutr. Metab. 2020, 17, 26. [Google Scholar] [CrossRef]
- Huh, J.Y.; Panagiotou, G.; Mougios, V.; Brinkoetter, M.; Vamvini, M.T.; Schneider, B.E.; Mantzoros, C.S. FNDC5 and irisin in humans: I. Predictors of circulating concentrations in serum and plasma and II. mRNA expression and circulating concentrations in response to weight loss and exercise. Metabolism 2012, 61, 1725–1738. [Google Scholar] [CrossRef] [Green Version]
- Baczek, J.; Silkiewicz, M.; Wojszel, Z.B. Myostatin as a Biomarker of Muscle Wasting and other Pathologies-State of the Art and Knowledge Gaps. Nutrients 2020, 12, 2401. [Google Scholar] [CrossRef]
- Colaianni, G.; Cinti, S.; Colucci, S.; Grano, M. Irisin and musculoskeletal health. Ann. N. Y. Acad. Sci. 2017, 1402, 5–9. [Google Scholar] [CrossRef]
- Shabani, R.; Izaddoust, F. Effects of aerobic training, resistance training, or both on circulating irisin and myostatin in untrained women. Acta Gymnica 2018, 48, 47–55. [Google Scholar] [CrossRef] [Green Version]
- Planella-Farrugia, C.; Comas, F.; Sabater-Masdeu, M.; Moreno, M.; Moreno-Navarrete, J.M.; Rovira, O.; Ricart, W.; Fernández-Real, J.M. Circulating irisin and myostatin as markers of muscle strength and physical condition in elderly subjects. Front. Physiol. 2019, 10, 871. [Google Scholar] [CrossRef] [PubMed] [Green Version]
- Hudson, J.L.; Kim, J.E.; Paddon-Jones, D.; Campbell, W.W. Within-day protein distribution does not influence body composition responses during weight loss in resistance-training adults who are overweight. Am. J. Clin. Nutr. 2017, 106, 1190–1196. [Google Scholar] [CrossRef] [PubMed] [Green Version]
- Verreijen, A.M.; Verlaan, S.; Engberink, M.F.; Swinkels, S.; de Vogel-van den Bosch, J.; Weijs, P.J.M. A high whey protein-, leucine-, and vitamin D-enriched supplement preserves muscle mass during intentional weight loss in obese older adults: A double-blind randomized controlled trial. Am. J. Clin. Nutr. 2015, 101, 279–286. [Google Scholar] [CrossRef] [Green Version]
- Rondanelli, M.; Klersy, C.; Terracol, G.; Talluri, J.; Maugeri, R.; Guido, D.; Faliva, M.A.; Solerte, B.S.; Fioravanti, M.; Lukaski, H.; et al. Whey protein, amino acids, and vitamin D supplementation with physical activity increases fat-free mass and strength, functionality, and quality of life and decreases inflammation in sarcopenic elderly. Am. J. Clin. Nutr. 2016, 103, 830–840. [Google Scholar] [CrossRef]


| All Subjects (N = 42) | AS Group (n = 14) | BB Group (n = 14) | C Group (n = 14) | F | P | |
|---|---|---|---|---|---|---|
| Age, y | 21 ± 1.5 | 21 ± 1.7 | 22 ± 1.3 | 21 ± 1.4 | 0.737 | 0.485 |
| Height, cm | 177.3 ± 5.25 | 179.9 ± 5.21 | 175.3 ± 4.16 | 176.6 ± 5.47 | 3.27 | 0.490 |
| Weight, kg | 70.1 ± 9.32 | 72.2 ± 11.29 | 66.9 ± 7.31 | 71.3 ± 8.70 | 1.291 | 0.286 |
| BMI, kg/m2 | 22.2 ± 2.24 | 22.2 ± 2.51 | 21.9 ± 1.94 | 22.5 ± 2.35 | 0.34 | 0.714 |
| 25(OH)D, ng/mL | 14.3 ± 5.72 | 12.5 ± 3.91 | 16.1 ± 7.25 | 14.2 ± 5.34 | 1.424 | 0.253 |
| All Subjects (N = 42) | AS Group (n = 14) | BB Group (n = 14) | C Group (n = 14) | F | P | |
|---|---|---|---|---|---|---|
| Energy intake, kcal/d | 1873 ± 503 | 1989 ± 396 | 1981 ± 341 | 2048 ± 622 | 4.15 | 0.24 |
| Protein, g/d | 92 ± 30 | 87 ± 20 | 82 ± 30 | 97 ± 33 | 2.874 | 0.068 |
| Protein, g/kg BW/d | 1.3 ± 0.49 | 1.3 ± 0.44 | 1.2 ± 0.46 | 1.4 ± 0.53 | 1.485 | 0.239 |
| Breakfast | 0.2 ± 0.09 | 0.2 ± 0.09 | 0.2 ± 0.06 | 0.2 ± 0.09 | 0.056 | 0.946 |
| Lunch | 0.5 ± 0.23 | 0.5 ± 0.22 | 0.5 ± 0.20 | 0.5 ± 0.27 | 0.962 | 0.351 |
| Dinner | 0.6 ± 0.31 | 0.6 ± 0.28 | 0.5 ± 0.20 | 0.6 ± 0.33 | 1.886 | 0.165 |
| Fat, g/d | 72 ± 24 | 79 ± 26 | 61 ± 17 | 75 ± 24 | 3.416 | 0.431 |
| CHO, g/d | 232 ± 78 | 253 ± 57 | 295 ± 56 | 249 ± 60 | 2.546 | 0.091 |
| All Subjects (N = 42) | AS Group (n = 14) | BB Group (n = 14) | C Group (n = 14) | F | P ➂ | |
|---|---|---|---|---|---|---|
| Total ➀ | ||||||
| Energy, kcal | 2393 ± 467 | 2428 ± 487 | 2417 ± 449 | 2397 ± 461 | 3.21 | 0. 443 |
| Protein, g | 126 ± 28 | 130 ± 11 | 133 ± 21 | 117 ± 25 | 1.69 | 0.554 |
| Protein, g/kg BW | 1.6 ± 0.51 | 1.7 ± 0.27 | 1.7 ± 0.50 | 1.4 ± 0.37 | 1.221 | 0.361 |
| Fat, g | 85 ± 21 | 90 ± 19 | 80 ± 26 | 89 ± 25 | 2.989 | 0.334 |
| CHO, g | 270 ± 53 | 285 ± 56 | 281 ± 45 | 272 ± 54 | 3.315 | 0.182 |
| VD, ug | 68.6 ± 47.59 | 101.8 ± 0.80 | 102.0 ± 1.09 | 2.1 ± 1.85 | 263.991 | <0.001 |
| Breakfast | ||||||
| Energy, kcal | 541 ± 181 | 637 ± 120 | 450 ± 155 | 535 ± 109 | 20.529 | <0.001 |
| Protein, g | 27 ± 15 | 41 ± 7 | 17 ± 8 | 22 ± 8 | 43.971 | <0.001 |
| Protein, g/kg BW | 0.3 ± 0.12 | 0.5 ± 0.13 | 0.2 ± 0.14 | 0.2 ± 0.09 | 19.376 | <0.001 |
| Fat, g | 18 ± 7 | 18 ± 6 | 17 ± 7 | 19 ± 7 | 2.436 | 0.101 |
| CHO, g | 68 ± 24 | 78 ± 18 | 58 ± 21 | 68 ± 15 | 17.209 | <0.001 |
| Lunch | ||||||
| Energy, kcal | 658 ± 151 | 711 ± 134 | 684 ± 154 | 706 ± 146 | 2.799 | 0.073 |
| Protein, g | 39 ± 10 | 38 ± 8 | 39 ± 9 | 38 ± 9 | 2.651 | 0.832 |
| Protein, g/kg BW | 0.5 ± 0.15 | 0.5 ± 1.46 | 0.6 ± 0.16 | 0.5 ± 0.12 | 1.862 | 0.731 |
| Fat, g | 26 ± 8 | 28 ± 8 | 22 ± 8 | 27 ± 7 | 2.436 | 0.101 |
| CHO, g | 79 ± 21 | 77 ± 19 | 83 ± 21 | 77 ± 17 | 4.126 | 0.213 |
| Dinner | ||||||
| Energy, kcal | 746 ± 229 | 778 ± 153 | 697 ± 145 | 762 ± 210 | 3.294 | 0.048 |
| Protein, g | 39 ± 11 | 37 ± 7 | 40 ± 9 | 40 ± 12 | 3.045 | 0.059 |
| Protein, g/kg BW | 0.5 ± 0.18 | 0.5 ± 0.13 | 0.6 ± 0.16 | 0.6 ± 0.22 | 1.736 | 0.102 |
| Fat, g | 27 ± 10 | 30 ± 9 | 24 ± 9 | 28 ± 12 | 2.27 | 0.117 |
| CHO, g | 85 ± 27 | 90 ± 17 | 78 ± 19 | 89 ± 36 | 2.874 | 0.068 |
| Snacks ➁ | ||||||
| Energy, kcal | 397 ± 214 | 455 ± 214 | 372 ± 257 | 365 ± 152 | 0.474 | 0.628 |
| Protein, g | 17 ± 14 | 14 ± 9 | 20 ± 19 | 16 ± 9 | 0.388 | 0.683 |
| Fat, g | 16 ± 12 | 18 ± 10 | 17 ± 16 | 12 ± 7 | 0.525 | 0.598 |
| CHO, g | 46 ± 30 | 59 ± 35 | 36 ± 31 | 43 ± 19 | 1.494 | 0.244 |
| AS Group | BB Group | C Group | Group | Time | Group * Time | ||
|---|---|---|---|---|---|---|---|
| Body weight, kg | Pre | 72.2 ± 11.29 | 66.9 ± 7.31 | 71.3 ± 8.70 | 0.244 | 0.043 | 0.8 |
| Post | 72.9 ± 11.22 | 67.2 ± 9.04 | 71.9 ± 8.15 | ||||
| Change (95% CI) | 0.756 (−0.193 to 1.705) | 0.322 (−0.627 to 1.271) | 0.626 (−0.323 to 1.575) | ||||
| Fat mass, kg | Pre | 12.8 ± 5.35 | 12.0 ± 5.29 | 13.3 ± 5.50 | 0.676 | <0.001 | 0.091 |
| Post | 12.1 ± 5.12 | 10.9 ± 4.56 | 13.0 ± 5.23 | ||||
| Change | −0.718 * (−1.216 to 0.221) | −1.070 * (−1.567 to −0.573) | −0.287 (−0.784 to 0.210) | ||||
| Fat mass % | Pre | 17.3 ± 5.05 | 17.5 ± 5.37 | 18.2 ± 5.37 | 0.782 | <0.001 | 0.047 |
| Post | 16.2 ± 4.95 | 16.0 ± 5.12 | 17.7 ± 5.14 | ||||
| Change | −1.11 * (−1.67 to −0.56) | −1.50 *# (−2.05 to −0.95) | −0.514 (−1.06 to 0.04) | ||||
| Total LTM, kg | Pre | 56.2 ± 7.12 | 52.6 ± 4.21 | 55.1 ± 4.53 | 0.266 | <0.001 | 0.003 |
| Post | 57.7 ± 7.12 | 54.4 ± 4.54 | 55.6 ± 5.05 | ||||
| Change | 1.488 * (0.940 to 2.036) | 1.847 * (1.299 to 2.394) | 0.5 (0.048 to 1.047) | ||||
| Total LTM% | Pre | 78.4 ± 4.84 | 79.0 ± 5.49 | 77.7 ± 5.04 | 0.419 | <0.001 | 0.001 |
| Post | 79.6 ± 4.70 | 81.2 ± 5.22 $ | 77.6 ± 4.39 | ||||
| Change | 1.21 *# (0.35 to 2.09) | 2.2 *# (1.40 to 3.13) | −0.14 (−1.01 to 0.72) | ||||
| Leg-LTM, kg | Pre | 19.1 ± 2.92 | 18.1 ± 1.54 | 19.7 ± 1.86 | 0.242 | <0.001 | 0.004 |
| Post | 19.7 ± 2.88 | 18.8 ± 1.54 | 19.9 ± 1.94 | ||||
| Change | 0.556 *# (0.338 to 0.773) | 0.618 *# (0.401 to 0.835) | 0.117 (−0.1 to 0.334) | ||||
| Leg fat mass, kg | Pre | 4.3 ± 1.68 | 3.8 ± 1.35 | 4.6 ± 1.70 | 0.439 | <0.001 | 0.18 |
| Post | 4.0 ± 1.63 | 3.7 ± 1.26 | 4.4 ± 1.63 | ||||
| Change | −0.276 * (−0.386 to 0.165) | −0.188 * (−0.298 to −0.077) | −0.13 * (−0.241 to −0.020) | ||||
| App-LTM, kg | Pre | 25.9 ± 3.91 | 24.6 ± 2.10 | 26.3 ± 2.42 | 0.341 | <0.001 | 0.078 |
| Post | 26.6 ± 2.02 | 25.2 ± 2.07 | 26.6 ± 2.50 | ||||
| Change | 0.759 * (0.463 to 1.054) | 0.655 * (0.360 to 0.951) | 0.3 * (0.005 to 0.595) | ||||
| App-LTM % | Pre | 35.9 ± 2.41 | 36.9 ± 2.62 | 37.0 ± 2.24 | 0.446 | 0.009 | 0.208 |
| Post | 36.6 ± 2.29 | 37.7 ± 2.41 | 37.1 ± 1.88 | ||||
| Change | 0.64 * (0.03 to 1.25) | 0.76 * (0.150 to 1.37) | 0.04 (−0.57 to 0.65) | ||||
| Bone mineral density, g/cm2 | Pre | 1.27 ± 0.137 | 1.24 ± 0.102 | 1.22 ± 0.107 | 0.56 | 0.311 | 0.164 |
| Post | 1.28 ± 0.130 | 1.23 ± 0.093 | 1.24 ± 0.110 | ||||
| Change | 0.009 (−0.10 to 0.027) | −0.009 (−0.027 to 0.010) | 0.016 (−0.002 to 0.035) | ||||
| AS Group (n = 14) | BB Group (n = 14) | C Group (n = 14) | Group | Time | Group * Time | ||||
|---|---|---|---|---|---|---|---|---|---|
| Pre | Post | Pre | Post | Pre | Post | ||||
| Testosterone, nmol/L | 19.3 ± 4.14 | 22.0 ± 5.80 | 18.6 ± 4.15 | 21.7 ± 4.78 | 20.2 ± 3.82 | 19.6 ± 4.79 | 0.901 | <0.001 | 0.001 |
| Cortisol, nmol/L | 364.9 ± 47.45 | 315.1 ± 64.98 | 353.3 ± 73.16 | 295.4 ± 95.50 $ | 316.3 ± 85.18 | 372.9 ± 65.33 | 0.67 | 0.164 | <0.001 |
| Insulin-likegrowth factor-1, nmol/L | 8.1 ± 5.98 | 11.9 ± 5.92 | 8.7 ± 4.17 | 15.8 ± 3.95 $ | 12.4 ± 5.39 | 13.3 ± 5.34 | 0.291 | <0.001 | <0.001 |
| Irisin, ng/mL | 154.5 ± 34.43 | 190.3 ± 54.92 | 156.8 ± 34.04 | 200.1 ± 69.87 | 171.7 ± 49.98 | 164.7 ± 44.30 | 0.828 | 0.001 | 0.009 |
| Myostatin, ng/mL | 0.54 ± 0.334 | 0.37 ± 0.294 | 0.58 ± 0.247 | 0.39 ± 9.293 | 0.51 ± 0.210 | 0.48 ± 0.280 | 0.895 | 0.002 | 0.237 |
| 25(OH)D, ng/mL | 12.49 ± 3.91 | 24.37 ± 6.41 $ | 16.10 ± 7.25 | 21.76 ± 8.07 $ | 14.16 ± 5.34 | 13.67 ± 5.34 | 0.032 | <0.001 | <0.001 |
Publisher’s Note: MDPI stays neutral with regard to jurisdictional claims in published maps and institutional affiliations. |
© 2022 by the authors. Licensee MDPI, Basel, Switzerland. This article is an open access article distributed under the terms and conditions of the Creative Commons Attribution (CC BY) license (https://creativecommons.org/licenses/by/4.0/).
Share and Cite
Chen, Y.; Liang, Y.; Guo, H.; Meng, K.; Qiu, J.; Benardot, D. Muscle-Related Effect of Whey Protein and Vitamin D3 Supplementation Provided before or after Bedtime in Males Undergoing Resistance Training. Nutrients 2022, 14, 2289. https://doi.org/10.3390/nu14112289
Chen Y, Liang Y, Guo H, Meng K, Qiu J, Benardot D. Muscle-Related Effect of Whey Protein and Vitamin D3 Supplementation Provided before or after Bedtime in Males Undergoing Resistance Training. Nutrients. 2022; 14(11):2289. https://doi.org/10.3390/nu14112289
Chicago/Turabian StyleChen, Yan, Yiheng Liang, Hang Guo, Kun Meng, Junqiang Qiu, and Dan Benardot. 2022. "Muscle-Related Effect of Whey Protein and Vitamin D3 Supplementation Provided before or after Bedtime in Males Undergoing Resistance Training" Nutrients 14, no. 11: 2289. https://doi.org/10.3390/nu14112289