Dietary and Lifestyle Changes During COVID-19 and the Subsequent Lockdowns among Polish Adults: A Cross-Sectional Online Survey PLifeCOVID-19 Study


Abstract
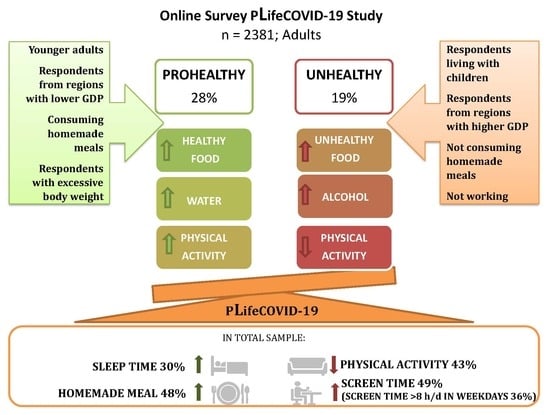
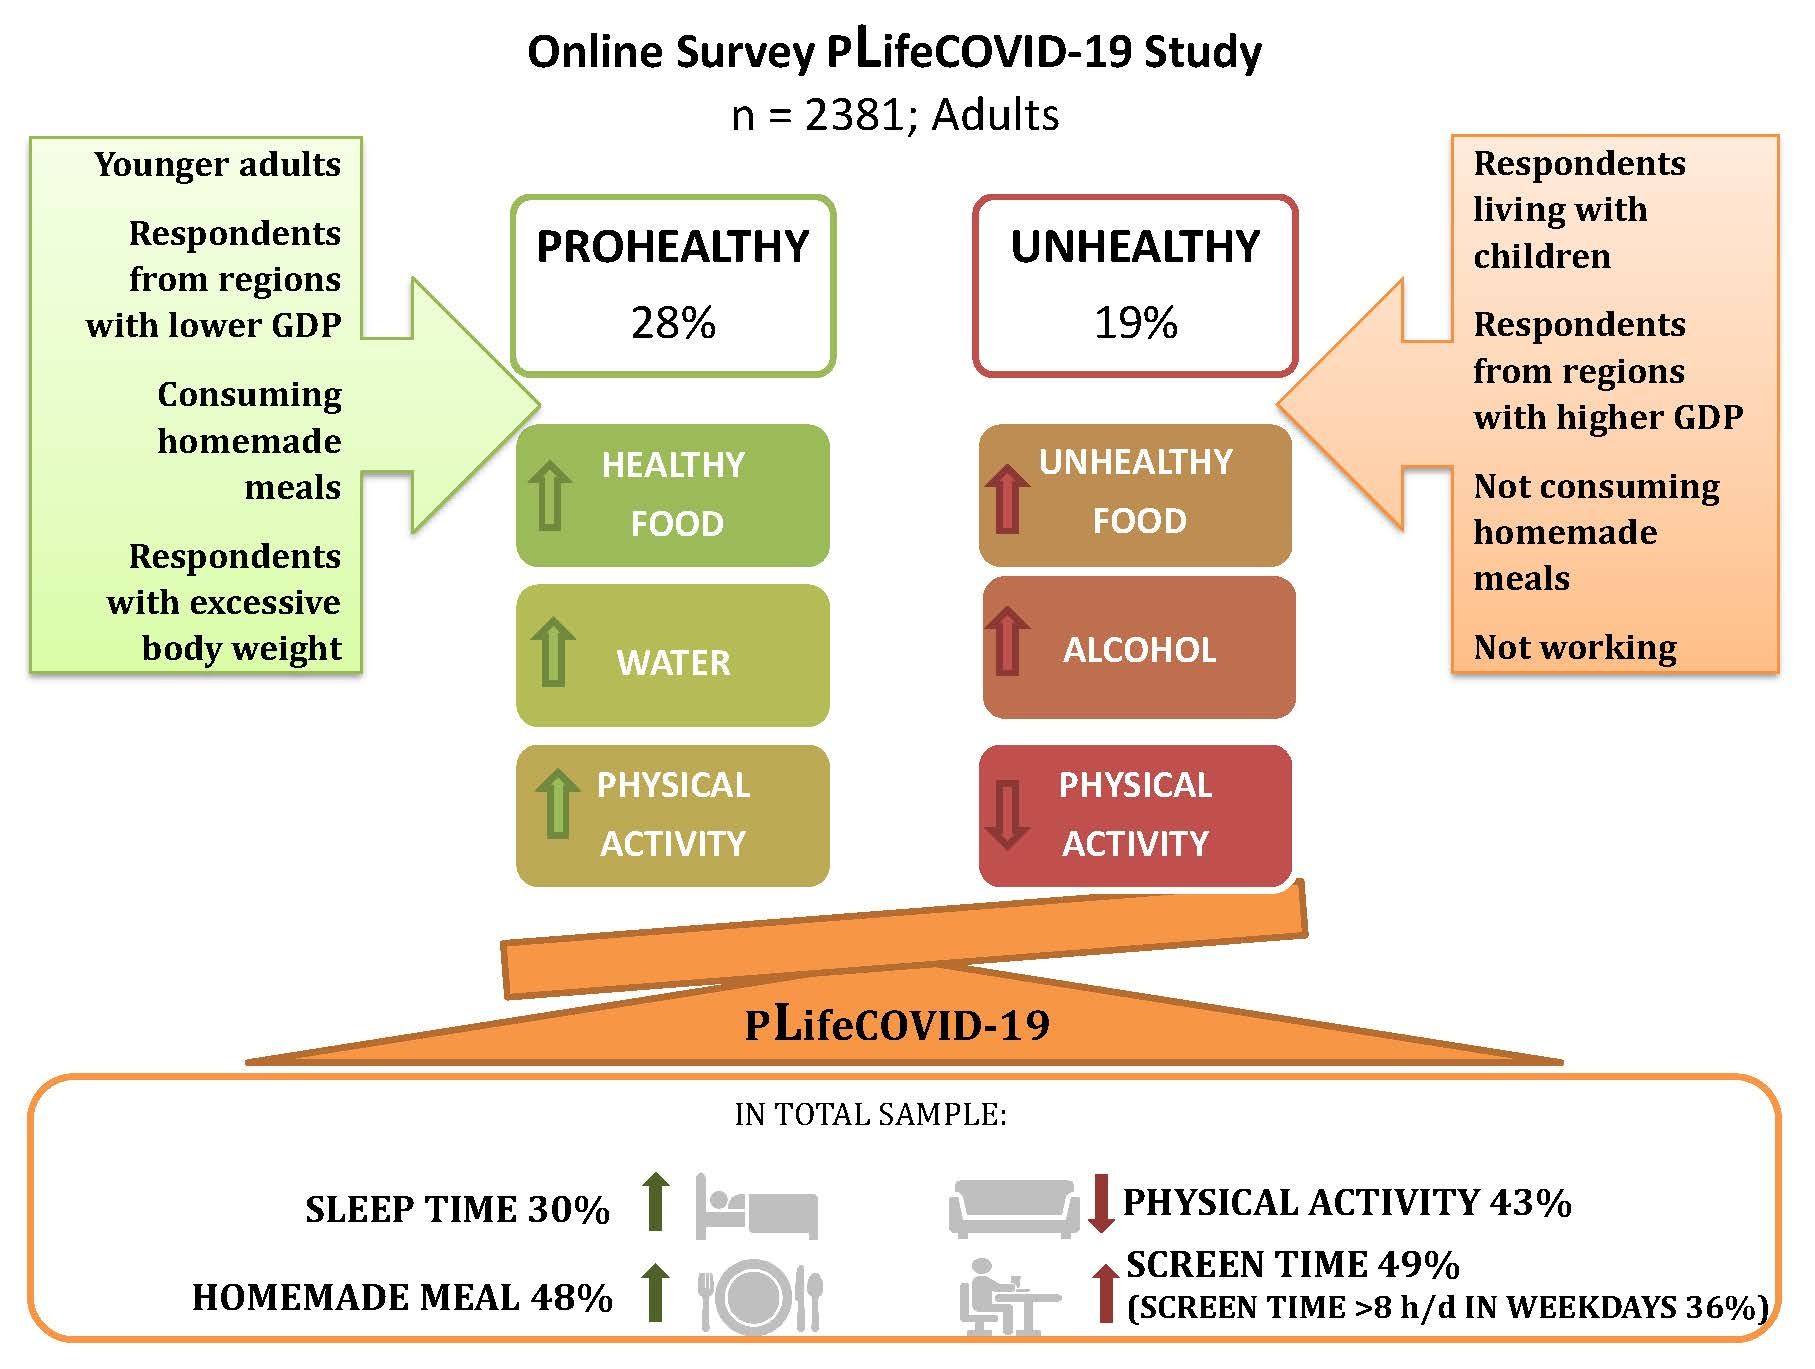
:
1. Introduction
2. Materials and Methods
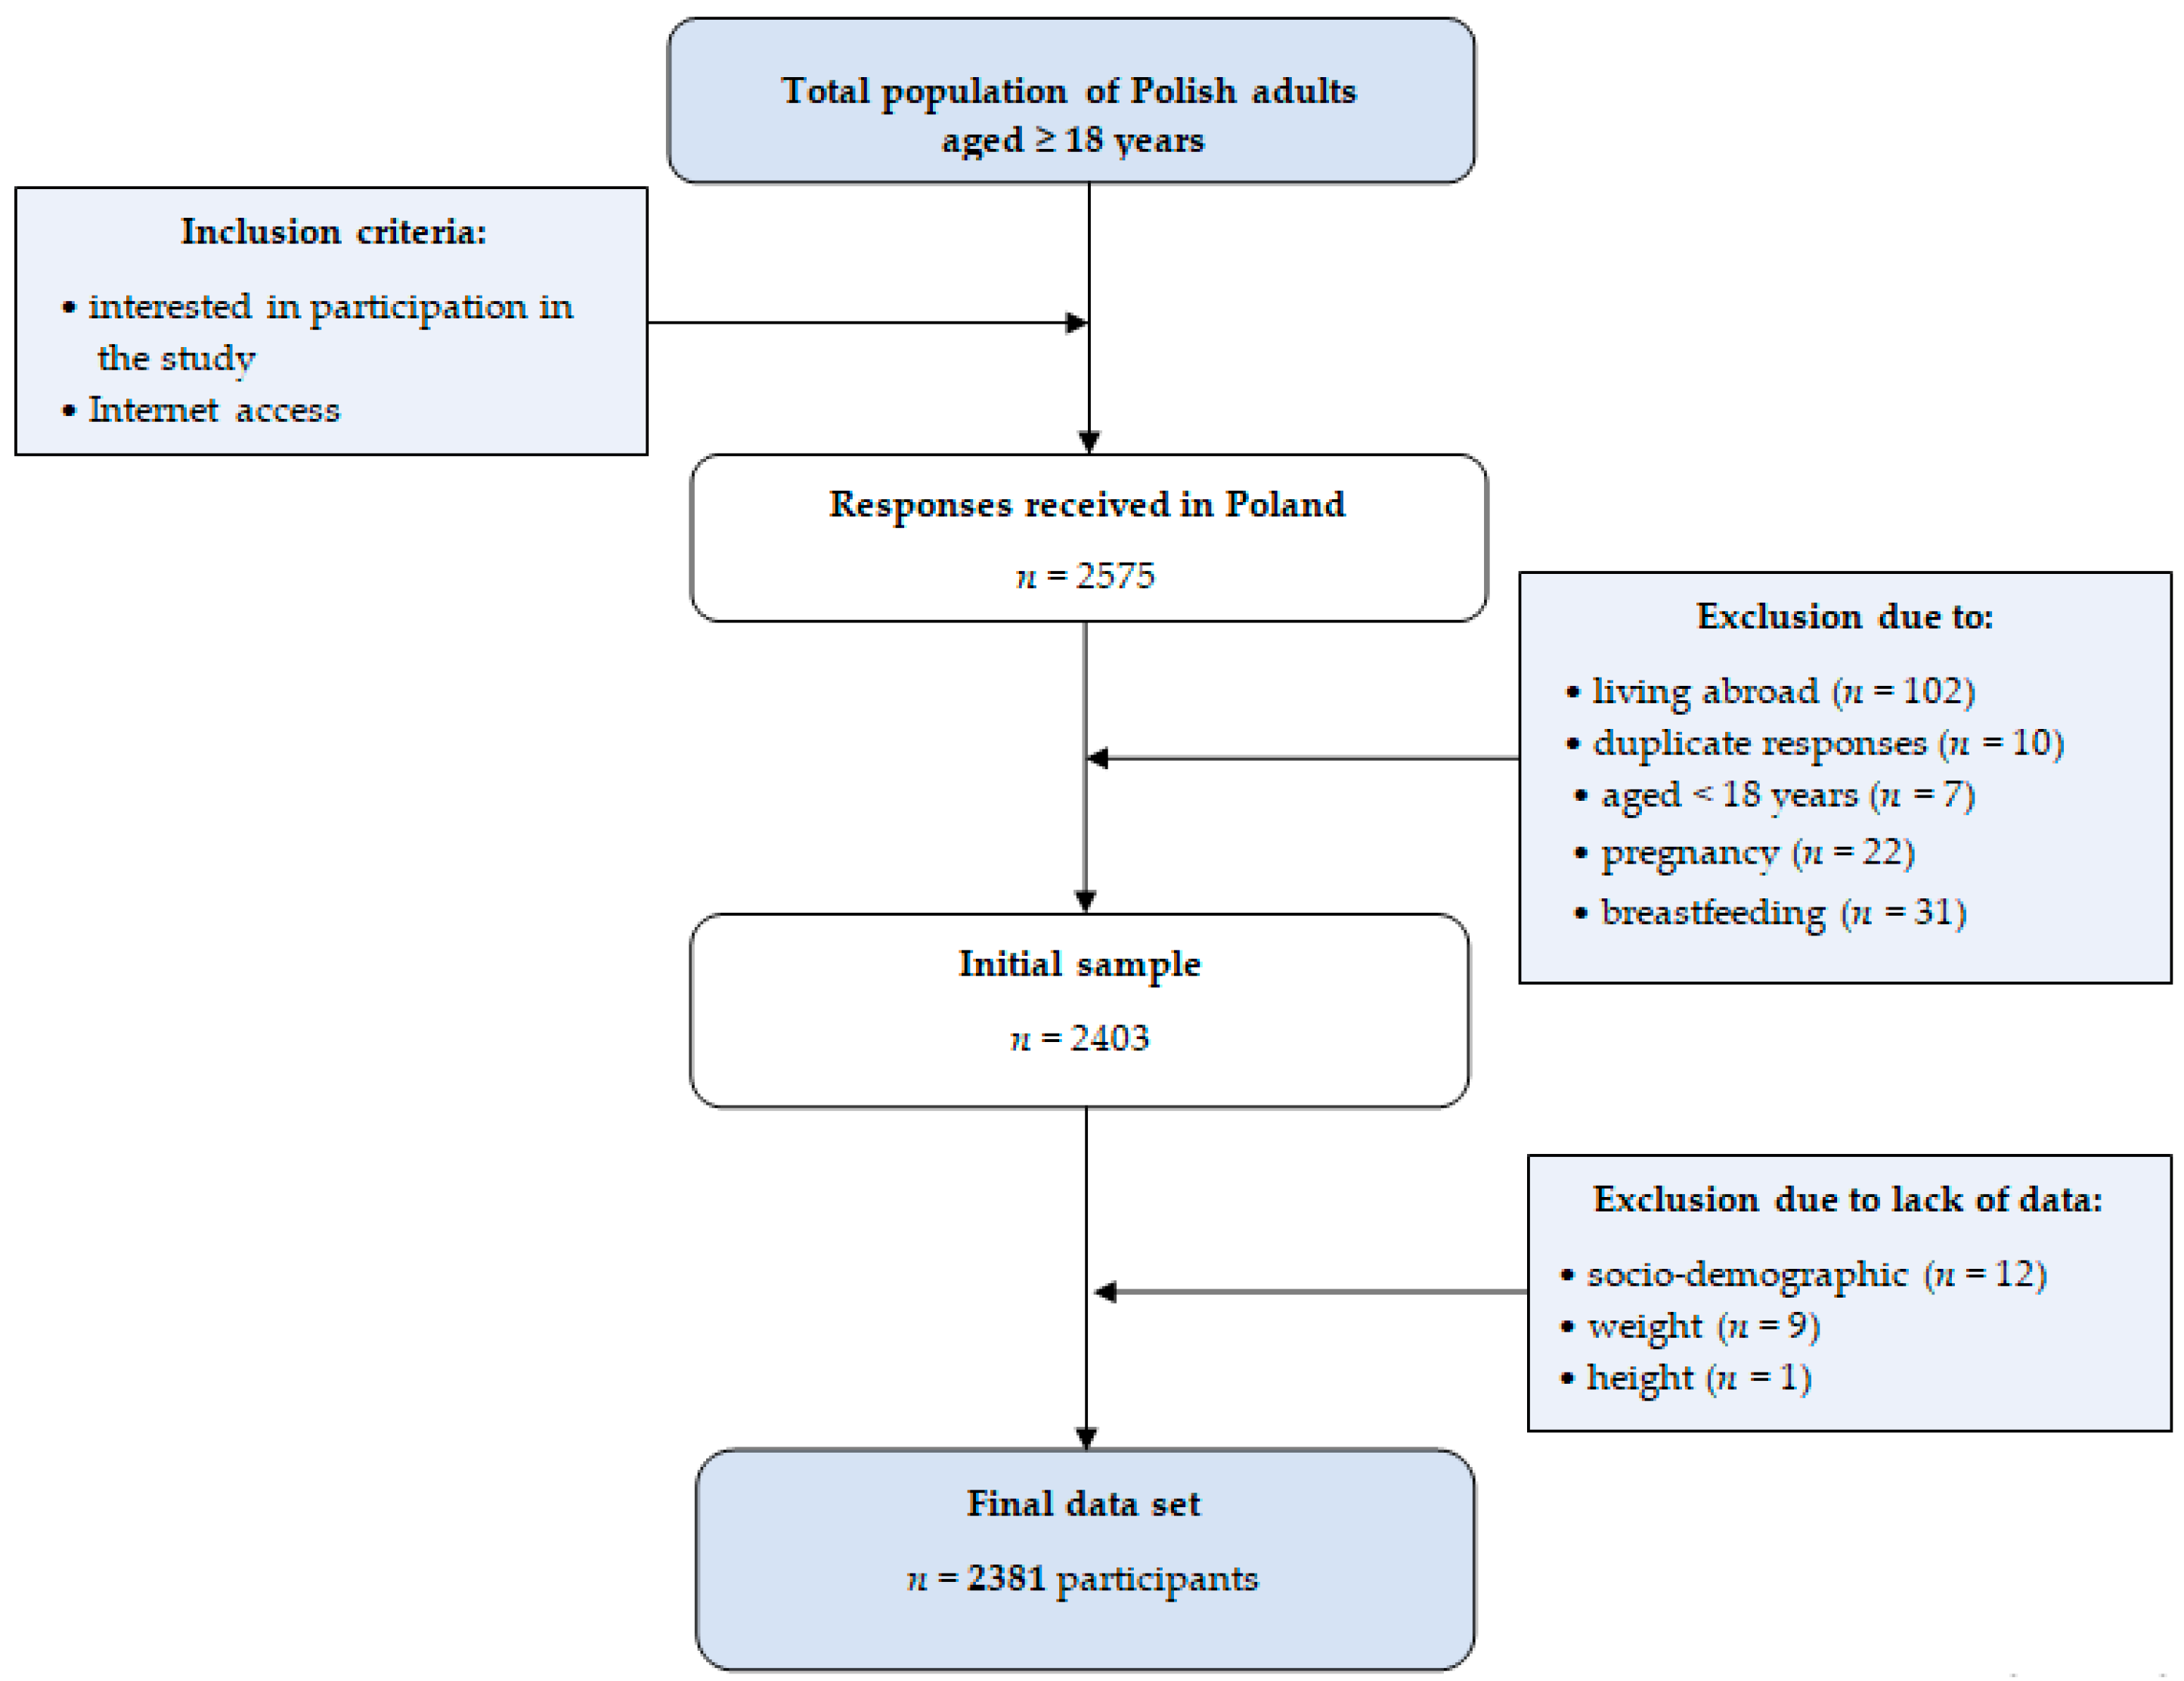
2.1. Study Design and Participants
2.2. Questionnaire
2.2.1. Dietary–lifestyle Data
2.2.2. Sociodemographics Data
2.2.3. Anthropometric Data
2.3. Statistical Analysis
3. Results
4. Discussion
Strengths and Limitations
5. Conclusions
Author Contributions
Funding
Acknowledgments
Conflicts of Interest
Appendix A

| Question | Answer | |
|---|---|---|
| Dietary Habits During COVID-19 the Pandemic | ||
| 1. | How many vegetable portions do you consume per day? 1 portion = 100 g | More than 3 portions/1–3 portions/less than 1 portion/I do not eat at all |
| 2. | How many fruit (including juices) portions do you consume per day? 1 portion = 100 g | More than 3 portions/1–3 portions/less than 1 portion/I do not eat at all |
| 3. | How many fish and seafood (fresh and/or smoked) portions do you consume per week? 1 portion = 100–150 g | More than 2 portions/1–2 portions/less than 1 portion/I do not eat at all |
| 4. | How many sugar-sweetened beverages do you drink per day? | More than 2 glasses (>500 mL)/1–2 glasses (250–500 mL)/less than 1 glass (<250 mL)/I do not drink at all |
| 5. | How many water do you drink per day? | More than 2 glasses (>500 mL) /1–2 glasses (250–500 mL) /less than 1 glass (<250 mL)/I do not drink at all |
| 6. | How many alcohol do you drink per day? | Less than 1 drink/1-2 drink/more than 2 drink/I don’t drink at all |
| 7. | Has your consumption of vegetables changed since the beginning of the pandemic (compared to the period before the pandemic)? | I eat more/I eat the same/I eat less/I didn’t eat before and during the pandemic I eat more/I eat the same/I eat less/I didn’t eat before and during the pandemic |
| 8. | Has your consumption of fruit changed since the beginning of the pandemic (compared to the period before the pandemic)? | |
| 9. | Has your consumption of wholegrain cereal products changed since the beginning of the pandemic (compared to the period before the pandemic)? | |
| 10. | Has your consumption of low fat meat and/or eggs changed since the beginning of the pandemic (compared to the period before the pandemic)? | |
| 11. | Has your consumption of pulses changed since the beginning of the pandemic (compared to the period before the pandemic)? | |
| 12. | Has your consumption of fish and seafood changed since the beginning of the pandemic (compared to the period before the pandemic)? | |
| 13. | Has your consumption of milk and milk products changed since the beginning of the pandemic (compared to the period before the pandemic)? | |
| 14. | Has your consumption of processed meats changed since the beginning of the pandemic (compared to the period before the pandemic)? | |
| 15. | Has your consumption of fast foods changed since the beginning of the pandemic (compared to the period before the pandemic)? | |
| 16. | Has your consumption of salty snacks changed since the beginning of the pandemic (compared to the period before the pandemic)? | |
| 17. | Has your consumption of confectionary changed since the beginning of the pandemic (compared to the period before the pandemic)? | |
| 18. | Has your consumption of sweetened spreads changed since the beginning of the pandemic (compared to the period before the pandemic)? | |
| 19. | Has your consumption of commercial pastry changed since the beginning of the pandemic (compared to the period before the pandemic)? | |
| 20. | Has your consumption of homemade pastry changed since the beginning of the pandemic (compared to the period before the pandemic)? | |
| 21. | Has your consumption of ice-cream and puddings changed since the beginning of the pandemic (compared to the period before the pandemic)? | |
| 22. | Has your consumption of sweetened cereals and/or cereal bars changed since the beginning of the pandemic (compared to the period before the pandemic)? | |
| 23. | Has your consumption of sugar sweetened beverages changed since the beginning of the pandemic (compared to the period before the pandemic)? | |
| 24. | Has your consumption of energy drink changed since the beginning of the pandemic (compared to the period before the pandemic)? | |
| 25. | Has your consumption of alcohol changed since the beginning of the pandemic (compared to the period before the pandemic)? | |
| 26. | Has your consumption of water changed since the beginning of the pandemic (compared to the period before the pandemic)? | |
| 27. | Has your consumption of coffee changed since the beginning of the pandemic (compared to the period before the pandemic)? | |
| 28. | Has your consumption of tea changed since the beginning of the pandemic (compared to the period before the pandemic)? | |
| 29. | Has your consumption of homemade meals changed since the beginning of the pandemic (compared to the period before the pandemic)? | |
| 30. | Has your consumption of take-away meals changed since the beginning of the pandemic (compared to the period before the pandemic)? | |
| 31. | Has your consumption of snacking between meals changed since the beginning of the pandemic (compared to the period before the pandemic)? | |
| 32. | Has your total food consumption changed since the beginning of the pandemic (compared to the period before the pandemic)? | I eat more/I eat the same/I eat less |
| 33. | Have you had any difficulties with foods purchases since the beginning of the pandemic (compared to the period before the pandemic)? | No/Yes, which ones: |
| Lifestyle during COVID-19 the pandemic | ||
| 34. | How many hours, on average, during the day do you spend actively at home and outside (e.g., exercising, walking, running, cycling, gardening) during the pandemic? | <0.5 h/0.5–1 h/1–2 h/>2 h |
| 35. | Has your physical activity (PA) changed during the pandemic? | My PA has decreased/it has not changed, my PA was low before isolation and it is now the same /it has not changed, my PA was moderate before isolation and it is now the same /it has not changed, my PA was high before isolation and it is now the same /my PA has increased |
| 36. | How many hours per day do you spend on sleep during the pandemic? | <2 h/2–4 h/4–6 h/6–8 h/8–10 h |
| 37. | Has your time spent on sleeping changed during the pandemic? | Decreased /it has not changed /increased |
| 38. | Do you take any supplements? If yes: What dietary supplements or medications containing nutrients (e.g., vitamins, minerals, fatty acids) do you take during the pandemic? please provide the trade name of the preparation or the ingested nutrients (e.g., vitamin D) | Yes/No |
| 39. | Do you take the same supplements as you took before the pandemic? | Yes, all/ yes, just some/ no, I started taking them during the pandemic |
| 40. | Please specify what supplements have you started to use during the pandemic: if not applicable, please leave it blank | |
| 41. | How many hours during the working day do you spend in total (including work and entertainment) in front of the screen of the computer, TV, tablet and / or telephone since the beginning of the pandemic? | <2 h/2–4 h/4–6 h/6–8 h/8–10 h/>10 h |
| 42. | How many hours during a non-working day do you spend (including work and entertainment) in front of the screen of your computer, TV, tablet and / or telephone since the beginning of the pandemic? | <2 h/2–4 h/4–6 h/6–8 h/8–10 h/>10 h |
| 43. | Has the time spent in front of the screen (computer, TV, tablet, phone) changed during the pandemic? | Decreased /it has not changed /increased |
| 44. | Increase in the time spent in front of the screen (computer, TV, tablet, phone) is related to: | Work/entertainment/learning/boredom/the need to help children in lessons andhomework |
| Socio-demographic data | ||
| 45. | Gender: | Female/male |
| 46. | Age (years): | |
| 47. | Education level: | Primary/vocational/high school/university |
| 48. | Family composition: | Living with partner /living with partner and/or children/living with parents or others relatives /homesharing/living alone |
| 49. | Professional situation during the pandemic: | Did not work before and during the pandemic/did not work during the pandemic /rarely worked at the work place and did not worked remotely/childcare/full-time remote working/part-time remote working/did not change during the pandemic |
| 50. | Place of living: | Village/town < 50,000 inhabitants/town 50,000–100,000 inhabitants/town 101,000–500,000 inhabitants/town > 500,000 inhabitants/city agglomeration |
| 51. | Place of living (voivodeship): | Warmińsko-Mazurskie/Świętokrzyskie/Lubelskie/Podkarpackie/Podlaskie/ Małopolskie/Śląskie/Wielkopolskie/Zachodniopomorskie/Lubuskie/Dolnośląskie/Opolskie/Kujawsko-Pomorskie/Pomorskie/Mazowieckie/Łódzkie/Living abroad |
| 52. | Height (cm): | |
| 53. | Weight before the pandemic (kg): | |
| 54. | Has your body weight changed during the pandemic? | No/My body weight has increased/My body weight has decreased/I don’t know |
| 55. | Current body weight (kg): | |
References
- COVID-19 Map—Johns Hopkins Coronavirus Resource Center. Available online: https://coronavirus.jhu.edu/map.html (accessed on 12 June 2020).
- Decree of the Minister of Health of 20 March 2020 Regarding the Announcement of the State of the Epidemic in the Territory of the Republic of Poland. Available online: http://prawo.sejm.gov.pl/isap.nsf/DocDetails.xsp?id=WDU20200000491 (accessed on 2 June 2020). (In Polish)
- Giustino, V.; Parroco, A.M.; Gennaro, A.; Musumeci, G.; Palma, A.; Battaglia, G. Physical Activity Levels and Related Energy Expenditure during COVID-19 Quarantine among the Sicilian Active Population: A Cross-Sectional Online Survey Study. Sustainability 2020, 12, 4356. [Google Scholar] [CrossRef]
- Ammar, A.; Brach, M.; Trabelsi, K.; Chtourou, H.; Boukhris, O.; Masmoudi, L.; Bouaziz, B.; Bentlage, E.; How, D.; Ahmed, M.; et al. Effects of COVID-19 Home Confinement on Eating Behaviour and Physical Activity: Results of the ECLB-COVID19 International Online Survey. Nutrients 2020, 12, 1583. [Google Scholar] [CrossRef] [PubMed]
- Guthold, R.; Stevens, G.A.; Riley, L.M.; Bull, F.C. Worldwide trends in insufficient physical activity from 2001 to 2016: A pooled analysis of 358 population-based surveys with 1·9 million participants. Lancet Glob. Health 2018, 6, e1077–e1086. [Google Scholar] [CrossRef] [Green Version]
- Finkelstein, E.A.; Khavjou, O.A.; Thompson, H.; Trogdon, J.G.; Pan, L.; Sherry, B.; Dietz, W. Obesity and severe obesity forecasts through 2030. Am. J. Prev. Med. 2012, 42, 563–570. [Google Scholar] [CrossRef]
- Ravalli, S.; Musumeci, G. Coronavirus Outbreak in Italy: Physiological Benefits of Home-Based Exercise During Pandemic. J. Funct. Morphol. Kinesiol. 2020, 5, 31. [Google Scholar] [CrossRef]
- Naja, F.; Hamadeh, R. Nutrition amid the COVID-19 pandemic: A multi-level framework for action. Eur. J. Clin. Nutr. 2020, 1–5. [Google Scholar] [CrossRef] [Green Version]
- Zhang, Y.; Zhang, H.; Ma, X.; Di, Q. Mental Health Problems during the COVID-19 Pandemics and the Mitigation Effects of Exercise: A Longitudinal Study of College Students in China. Int. J. Environ. Res. Public Health 2020, 17, 3722. [Google Scholar] [CrossRef]
- Zabetakis, I.; Lordan, R.; Norton, C.; Tsoupras, A. COVID-19: The Inflammation Link and the Role of Nutrition in Potential Mitigation. Nutrients 2020, 12, 1466. [Google Scholar] [CrossRef]
- Martinez-Ferran, M.; de la Guía-Galipienso, F.; Sanchis-Gomar, F.; Pareja-Galeano, H. Metabolic Impacts of Confinement during the COVID-19 Pandemic Due to Modified Diet and Physical Activity Habits. Nutrients 2020, 12, 1549. [Google Scholar] [CrossRef]
- World Health Organization Stay Physically Active during Self-Quarantine. Available online: http://www.euro.who.int/en/health-topics/health-emergencies/coronavirus-covid-19/technical-guidance/stay-physically-active-during-self-quarantine (accessed on 4 June 2020).
- Chaput, J.P.; Klingenberg, L.; Astrup, A.; Sjödin, A.M. Modern sedentary activities promote overconsumption of food in our current obesogenic environment. Obes. Rev. 2011, 12, e12–e20. [Google Scholar] [CrossRef]
- Scully, M.; Dixon, H.; Wakefield, M. Association between commercial television exposure and fast-food consumption among adults. Public Health Nutr. 2009, 12, 105–110. [Google Scholar] [CrossRef] [PubMed] [Green Version]
- World Health Organization Food and Nutrition Tips during Self-Quarantine. Available online: https://www.euro.who.int/en/health-topics/health-emergencies/coronavirus-covid-19/technical-guidance/food-and-nutrition-tips-during-self-quarantine (accessed on 2 June 2020).
- Calder, P.C. Nutrition, immunity and COVID-19. BMJ Nutr. Prev. Health 2020. [Google Scholar] [CrossRef]
- Valdés-Ramos, R.; Martnez-Carrillo, B.E.; Aranda-González, I.I.; Guadarrama, A.L.; Pardo-Morales, R.V.; Tlatempa, P.; Jarillo-Luna, R.A. Diet, exercise and gut mucosal immunity. Proc. Nutr. Soc. 2010, 69, 644–650. [Google Scholar] [CrossRef] [PubMed]
- Sidor, A.; Rzymski, P. Dietary Choices and Habits during COVID-19 Lockdown: Experience from Poland. Nutrients 2020, 12, 1657. [Google Scholar] [CrossRef] [PubMed]
- Rodríguez-Pérez, C.; Molina-Montes, E.; Verardo, V.; Artacho, R.; García-Villanova, B.; Guerra-Hernández, E.J.; Ruíz-López, M.D. Changes in Dietary Behaviours during the COVID-19 Outbreak Confinement in the Spanish COVIDiet Study. Nutrients 2020, 12, 1730. [Google Scholar] [CrossRef]
- Eurostat GDP at Regional Level. Available online: https://ec.europa.eu/eurostat/statistics-explained/index.php/GDP_at_regional_level#Regional_gross_domestic_product_.28GDP.29 (accessed on 2 June 2020).
- Branca, F.; Nikogosian, H.; Lobstein, T.; World Health Organization. Regional Office for Europe. In The Challenge of Obesity in the WHO European Region and the Strategies for Response; WHO Regional Office for Europe: Copenhagen, Denmark, 2007; ISBN 9789289014083. [Google Scholar]
- Ashwell, M.; Gibson, S. Waist-to-height ratio as an indicator of early health risk: Simpler and more predictive than using a matrix based on BMI and waist circumference. BMJ Open 2016, 6, e010159. [Google Scholar] [CrossRef] [Green Version]
- De Oliveira Neto, L.; Elsangedy, H.M.; Tavares, V.D.D.O.; Teixeira, C.V.L.S.; Behm, D.G.; Da Silva-Grigoletto, M.E. #TrainingInHome—Home-based training during COVID-19 (SARS-COV2) pandemic: Physical exercise and behavior-based approach. Rev. Bras. Fisiol. Exerc. 2020, 19 (Suppl. S2), S9–S19. [Google Scholar]
- Campbell, J.P.; Turner, J.E. Debunking the myth of exercise-induced immune suppression: Redefining the impact of exercise on immunological health across the lifespan. Front. Immunol. 2018, 9, 648. [Google Scholar] [CrossRef]
- Koster, A.; Caserotti, P.; Patel, K.V.; Matthews, C.E.; Berrigan, D.; van Domelen, D.R.; Brychta, R.J.; Chen, K.Y.; Harris, T.B. Association of Sedentary time with mortality independent of moderate to vigorous physical activity. PLoS ONE 2012, 7, e37696. [Google Scholar] [CrossRef]
- Meldrum, D.R.; Morris, M.A.; Gambone, J.C. Obesity pandemic: Causes, consequences, and solutions—But do we have the will? Fertil. Steril. 2017, 107, 833–839. [Google Scholar] [CrossRef] [Green Version]
- Westerterp, K.R. Physical activity and body-weight regulation. Am. J. Clin. Nutr. 2019, 110, 791–792. [Google Scholar] [CrossRef] [PubMed] [Green Version]
- Jakicic, J.M.; Davis, K.K. Obesity and physical activity. Psychiatr. Clin. N. Am. 2011, 34, 829–840. [Google Scholar] [CrossRef] [PubMed]
- Li, B.; Yang, J.; Zhao, F.; Zhi, L.; Wang, X.; Liu, L.; Bi, Z.; Zhao, Y. Prevalence and impact of cardiovascular metabolic diseases on COVID-19 in China. Clin. Res. Cardiol. 2020, 109, 531–538. [Google Scholar] [CrossRef] [PubMed]
- Dietz, W.; Santos-Burgoa, C. Obesity and its Implications for COVID-19 Mortality. Obesity 2020, 28, 1005. [Google Scholar] [CrossRef] [PubMed] [Green Version]
- Wu, Z.; McGoogan, J.M. Characteristics of and Important Lessons from the Coronavirus Disease 2019 (COVID-19) Outbreak in China: Summary of a Report of 72314 Cases from the Chinese Center for Disease Control and Prevention. J. Am. Med. Assoc. 2020, 323, 1239–1242. [Google Scholar] [CrossRef]
- Cleland, V.J.; Patterson, K.; Breslin, M.; Schmidt, M.D.; Dwyer, T.; Venn, A.J. Longitudinal associations between TV viewing and BMI not explained by the “mindless eating” or “physical activity displacement” hypotheses among adults. BMC Public Health 2018, 18, 797. [Google Scholar] [CrossRef]
- Shin, J. Joint association of screen time and physical activity with obesity: Findings from the Korea media panel study. Osong Public Health Res. Perspect. 2018, 9, 207–212. [Google Scholar] [CrossRef]
- Bell, J.A.; Hamer, M.; David Batty, G.; Singh-Manoux, A.; Sabia, S.; Kivimaki, M. Combined effect of physical activity and leisure time sitting on long-term risk of incident obesity and metabolic risk factor clustering. Diabetologia 2014, 57, 2048–2056. [Google Scholar] [CrossRef] [Green Version]
- Metelski, A. Physical activity in Poland and the European Union. Qual. Sport 2019, 5, 7. [Google Scholar] [CrossRef] [Green Version]
- Pearson, N.; Biddle, S.J.H. Sedentary behavior and dietary intake in children, adolescents, and adults: A systematic review. Am. J. Prev. Med. 2011, 41, 178–188. [Google Scholar] [CrossRef] [Green Version]
- Stelmach-Mardas, M.; Mardas, M.; Warcho, W.; Jamka, M.; Walkowiak, J. Successful maintenance of body weight reduction after individualized dietary counseling in obese subjects. Sci. Rep. 2015, 4, 6620. [Google Scholar] [CrossRef] [PubMed] [Green Version]
- Lin, C.T.J.; Gao, Z.; Lee, J.Y. Associations between self-reported weight management methods with diet quality as measured by the Healthy Eating Index-2005. Prev. Med. 2013, 57, 238–243. [Google Scholar] [CrossRef] [PubMed]
- Thorpe, M.G.; Milte, C.M.; Crawford, D.; McNaughton, S.A. Education and lifestyle predict change in dietary patterns and diet quality of adults 55 years and over. Nutr. J. 2019, 18, 67. [Google Scholar] [CrossRef] [PubMed] [Green Version]
- Govindaraju, T.; Sahle, B.W.; McCaffrey, T.A.; McNeil, J.J.; Owen, A.J. Dietary patterns and quality of life in older adults: A systematic review. Nutrients 2018, 10, 971. [Google Scholar] [CrossRef] [PubMed] [Green Version]
- Tourlouki, E.; Matalas, A.L.; Panagiotakos, D.B. Dietary habits and cardiovascular disease risk in middle-aged and elderly populations: A review of evidence. Clin. Interv. Aging 2009, 4, 319–330. [Google Scholar] [CrossRef] [PubMed] [Green Version]
- Weyh, C.; Krüger, K.; Strasser, B. Physical Activity and Diet Shape the Immune System during Aging. Nutrients 2020, 12, 622. [Google Scholar] [CrossRef] [Green Version]
- Abbade, E.B.; Dewes, H. Behavioral and societal drivers of an obesogenic environment worldwide. Nutr. Food Sci. 2015, 45, 229–241. [Google Scholar] [CrossRef]
- Zienkiewicz, E.; Okoński, M.; Matuszewski, Ł.; Zienkiewicz, T.; Goździewska, M.; Klatka, M. Influence of urbanization level and Gross Domestic Product on the prevalence of adolescent obesity in Poland. Ann. Agric. Environ. Med. 2014, 21, 136–142. [Google Scholar]
- Rosenheck, R. Fast food consumption and increased caloric intake: A systematic review of a trajectory towards weight gain and obesity risk. Obes. Rev. 2008, 9, 535–547. [Google Scholar] [CrossRef]
- World Health Organization #HealthyAtHome—Healthy Diet. Available online: https://www.who.int/campaigns/connecting-the-world-to-combat-coronavirus/healthyathome/healthyathome---healthy-diet (accessed on 2 June 2020).
- Polish Academy of Sciences Coronavirus: Immunologist Recommendations. Available online: https://informacje.pan.pl/index.php/informacje/materialy-dla-prasy/2909-koronawirus-zalecenia-immunologow (accessed on 2 June 2020).
- Balanzá–Martínez, V.; Atienza–Carbonell, B.; Kapczinski, F.; De Boni, R.B. Lifestyle behaviours during the COVID-19—Time to connect. Acta Psychiatr. Scand. 2020, 141, 399–400. [Google Scholar] [CrossRef]

| Variables | Total 100% (n = 2381) | Dietary Changes Patterns | p-Value | ||
|---|---|---|---|---|---|
| Prohealthy 27.6% (n = 658) | Constant 53.0% (n = 1262) | Unhealthy 19.4% (n = 461) | |||
| Gender: | 0.001 | ||||
| female | 89.8 (2138) | 90.6 (596) | 87.9 (1109) | 93.9 (433) | |
| male | 10.2 (243) | 9.4 (62) | 12.1 (153) | 6.1 (28) | |
| Age: | <0.001 | ||||
| <30 years | 29.4 (700) | 35.1 (231) | 26.7 (337) | 28.6 (132) | |
| 30–39 years | 44.8 (1067) | 47.0 (309) | 41.1 (519) | 51.8 (239) | |
| 40–49 years | 12.9 (306) | 12.2 (80) | 14.3 (180) | 10.0 (46) | |
| 50–59 years | 6.7 (160) | 3.6 (24) | 9.2 (116) | 4.3 (20) | |
| ≥60 years | 6.1 (145) | 2.0 (13) | 8.6 (108) | 5.2 (24) | |
| Education Level: | 0.007 | ||||
| lower | 22.6 (538) | 19.6 (129) | 25.1 (317) | 20.0 (92) | |
| higher (university) | 77.4 (1843) | 80.4 (529) | 74.9 (945) | 80.0 (369) | |
| Family Composition: | 0.039 | ||||
| living alone | 9.9 (236) | 9.0 (59) | 11.2 (141) | 7.8 (36) | |
| living with partner | 22.2 (528) | 21.0 (138) | 23.5 (296) | 20.4 (94 | |
| living with partner and/or children | 56.2 (1338) | 55.9 (368) | 54.8 (692) | 60.3 (278) | |
| living with parents or other relatives | 11.7 (279) | 14.1 (93) | 10.5 (133) | 11.5 (53) | |
| Place of Living: | 0.535 | ||||
| rural | 16.2 (386) | 16.3 (107) | 16.4 (207) | 15.6 (72) | |
| town <50,000 inhabitants | 16.0 (382) | 15.8 (104) | 17.4 (219) | 12.8 (59) | |
| town 50,000–100,000 inhabitants | 11.4 (272) | 12.6 (83) | 11.1 (140) | 10.6 (49) | |
| town 101,000–500,000 inhabitants | 14.2 (338) | 13.7 (90) | 14.3 (180) | 14.8 (68) | |
| town >500,000 inhabitants | 15.8 (377) | 15.2 (100) | 15.2 (192) | 18.4 (85) | |
| urban agglomeration | 26.3 (626) | 26.4 (174) | 25.7 (324) | 27.8 (128) | |
| Macroeconomic Region: | 0.031 | ||||
| <50% of EU-28 GDP | 17.0 (405) | 17.8 (117) | 18.4 (232) | 12.1 (56) | |
| 50–100% of EU-28 GDP | 60.0 (1428) | 60.2 (396) | 59.2 (747) | 61.8 (285) | |
| >100% of EU-28 GDP | 23.0 (548) | 22.0 (145) | 22.4 (283) | 26.0 (120) | |
| Employment Forms During Pandemic: | <0.001 | ||||
| did not work or considerable work time reduction | 43.2 (1029) | 40.9 (269) | 43.5 (549) | 45.8 (211) | |
| began remote work and/or study | 42.0 (1000) | 47.3 (311) | 38.3 (483) | 44.7 (206) | |
| work in the same form as earlier | 14.8 (352) | 11.9 (78) | 18.2 (230) | 9.5 (44) | |
| BMI Before Pandemic: | 0.211 | ||||
| underweight | 5.8 (138) | 4.9 (32) | 6.4 (81) | 5.4 (25) | |
| normal weight | 58.2 (1385) | 56.2 (370) | 58.2 (735) | 60.7 (280) | |
| overweight | 25.8 (614) | 27.4 (180) | 26.1 (330) | 22.6 (104) | |
| obesity | 10.2 (244) | 11.6 (76) | 9.2 (116) | 11.3 (52) | |
| Difficulties with Food Availability During Pandemic | <0.001 | ||||
| no | 67.8 (1615) | 67.6 (445) | 71.9 (907) | 57.0 (263) | |
| yes | 32.2 (766) | 32.4 (213) | 28.1 (355) | 43.0 (198) | |
| Changes in Total Food Intake During Pandemic: | <0.001 | ||||
| ate less | 14.1 (336) | 24.8 (163) | 9.8 (124) | 10.6 (49) | |
| no changes | 51.6 (1229) | 41.6 (274) | 66.4 (838) | 25.4 (117) | |
| ate more | 34.3 (816) | 33.6 (221) | 23.8 (300) | 64.0 (295) | |
| Variables | Total 100% (n = 2381) | Dietary Changes Patterns | p-Value | ||
|---|---|---|---|---|---|
| Prohealthy 27.6% (n = 658) | Constant 53.0% (n = 1262) | Unhealthy 19.4% (n = 461) | |||
| Physical Activity: | <0.001 | ||||
| low (<0.5 h/d) | 26.1 (621) | 23.9 (157) | 23.4 (295) | 36.7 (169) | |
| average (0.5–2 h/d) | 57.9 (1379) | 60.6 (399) | 58.7 (741) | 51.8 (239) | |
| high (>2 h) | 16.0 (381) | 15.5 (102) | 17.9 (226) | 11.5 (53) | |
| Physical Activity Changes: | <0.001 | ||||
| decreased | 43.3 (1032) | 39.4 (259) | 37.6 (475) | 64.6 (298) | |
| no changes | 37.6 (895) | 33.3 (219) | 45.2 (571) | 22.8 (105) | |
| increased | 19.1 (454) | 27.4 (180) | 17.1 (216) | 12.6 (58) | |
| Screen Time (weekdays): | 0.021 | ||||
| <4 h | 30.7 (7300 | 28.7 (189) | 32.4 (409) | 28.6 (132) | |
| 4–8 h | 33.5 (797) | 33.4 (220) | 34.6 (437) | 30.4 (140) | |
| >8 h | 35.9 (854) | 37.8 (249) | 33.0 (416) | 41.0 (189) | |
| Screen Time (weekend): | 0.031 | ||||
| <4 h | 49.4 (1177) | 47.6 (313) | 52.3 (660) | 44.3 (204) | |
| 4–8 h | 39.0 (929) | 40.1 (264) | 37.2 (470) | 42.3 (195) | |
| >8 h | 11.5 (275) | 12.3 (81) | 10.5 (132) | 13.4 (62) | |
| Screen Time Changes: | <0.001 | ||||
| decreased | 5.1 (122) | 5.8 (38) | 4.7 (59) | 5.4 (25) | |
| no changes | 45.8 (1090) | 40.3 (265) | 52.9 (667) | 34.3 (158) | |
| increased | 49.1 (1169) | 54.0 (355) | 42.5 (536) | 60.3 (278) | |
| Reasons of Increased Screen Time: 1 | |||||
| work | 6.2 (148) | 7.0 (46) | 4.9 (62) | 8.7 (40) | 0.010 |
| entertainment | 4.8 (114) | 4.0 (26) | 5.3 (67) | 4.6 (21) | 0.403 |
| learning | 1.6 (38) | 2.0 (13) | 1.5 (19) | 1.3 (6) | 0.631 |
| boredom | 7.8 (186) | 8.8 (58) | 7.2 (91) | 8.0 (37) | 0.453 |
| help children in lessons | 1.0 (25) | 0.3 (2) | 1.3 (17) | 1.3 (6) | 0.087 |
| Sleep Per Day: | 0.103 | ||||
| <6 h | 10.8 (256) | 10.8 (71) | 9.7 (123) | 13.4 (62) | |
| 6–8 h | 63.0 (1501) | 61.1 (402) | 65.1 (822) | 60.1 (277) | |
| ≥8 h | 26.2 (624) | 28.1 (185) | 25.1 (317) | 26.5 (122) | |
| Sleep Changes: | <0.001 | ||||
| decreased | 9.3 (221) | 11.2 (74) | 7.6 (96) | 11.1 (51) | |
| no changes–low | 60.7 (1445) | 51.4 (338) | 67.5 (852) | 55.3 (255) | |
| increased | 30.0 (715) | 37.4 (246) | 24.9 (314) | 33.6 (155) | |
| Vegetable Intake: | <0.001 | ||||
| decreased | 19.4 (463) | 10.3 (68) | 8.5 (107) | 62.5 (288) | |
| no changes | 62.1 (1478) | 58.7 (386) | 78.0 (984) | 23.4 (108) | |
| increased | 18.5 (440) | 31.0 (204) | 13.5 (171) | 14.1 (65) | |
| Fruit Intake: | <0.001 | ||||
| decreased | 20.1 (479) | 13.1 (86) | 9.4 (119) | 59.4 (274) | |
| no changes | 64.7 (1540) | 64.4 (424) | 80.3 (1014) | 22.1 (102) | |
| increased | 15.2 (362) | 22.5 (148) | 10.2 (129) | 18.4 (85) | |
| Whole Grain Product Intake: | <0.001 | ||||
| decreased | 11.4 (271) | 10.0 (66) | 6.9 (87) | 25.6 (118) | |
| no changes | 72.3 (1721) | 65.8 (433) | 81.4 (1027) | 56.6 (261) | |
| increased | 16.3 (389) | 24.2 (159) | 11.7 (148) | 17.8 (82) | |
| Low Fat Meat and/or Egg Intake: | <0.001 | ||||
| decreased | 9.7 (230) | 12.3 (81) | 7.1 (89) | 13.0 (160) | |
| no changes | 74.7 (1778) | 66.6 (438) | 81.9 (1033) | 66.6 (307) | |
| increased | 15.7 (373) | 21.1 (139) | 11.1 (140) | 20.4 (94) | |
| Pulse Intake: | <0.001 | ||||
| decreased | 8.5 (202) | 8.7 (57) | 5.3 (67) | 16.9 (78) | |
| no changes | 77.7 (1849) | 70.2 (462) | 84.5 (1067) | 69.4 (320) | |
| increased | 13.9 (330) | 21.1 (139) | 10.1 (128) | 13.7 (63) | |
| Fish and Seafood Intake: | <0.001 | ||||
| decreased | 17.0 (404) | 17.6 (116) | 12.1 (153) | 29.3 (135) | |
| no changes | 76.2 (1814) | 72.0 (474) | 82.7 (1044) | 64.2 (296) | |
| increased | 6.8 (163) | 10.3 (68) | 5.2 (65) | 6.5 (30) | |
| Milk and Milk Product Intake: | <0.001 | ||||
| decreased | 8.2 (195) | 11.9 (78) | 5.5 (70) | 10.2 (47) | |
| no changes | 71.0 (1691) | 60.2 (396) | 80.3 (1014) | 61.0 (281) | |
| increased | 20.8 (495) | 28.0 (184) | 14.1 (178) | 28.9 (133) | |
| Processed Meat Intake: | <0.001 | ||||
| decreased | 17.7 (422) | 28.3 (186) | 13.6 (172) | 13.9 (64) | |
| no changes | 71.4 (1699) | 60.8 (400) | 79.6 (1005) | 63.8 (294) | |
| increased | 10.9 (260) | 10.9 (72) | 6.7 (85) | 22.3 (103) | |
| Fast Food Intake: | <0.001 | ||||
| decreased | 36.6 (872) | 76.4 (503) | 21.3 (269) | 21.7 (100) | |
| no changes | 55.3 (1317) | 19.3 (127) | 72.6 (916) | 59.4 (274) | |
| increased | 8.1 (192) | 4.3 (28) | 6.1 (77) | 18.9 (87) | |
| Salty Snack Intake: | <0.001 | ||||
| decreased | 19.7 (469) | 54.9 (361) | 5.6 (71) | 8.0 (37) | |
| no changes | 62.2 (1480) | 32.7 (215) | 85.2 (1075) | 41.2 (190) | |
| increased | 18.1 (432) | 12.5 (82) | 9.2 (116) | 50.8 (234) | |
| Confectionary Intake: | <0.001 | ||||
| decreased | 18.8 (447) | 51.1 (336) | 6.8 (86) | 5.4 (25) | |
| no changes | 48.7 (1159) | 23.1 (152) | 74.3 (938) | 15.0 (69) | |
| increased | 32.5 (775) | 25.8 (170) | 18.9 (238) | 79.6 (367) | |
| Sweetened Spread Intake: | <0.001 | ||||
| decreased | 4.7 (111) | 11.1 (73) | 2.1 (26) | 2.6 (12) | |
| no changes | 91.6 (2181) | 86.8 (571) | 95.5 (1205) | 87.9 (405) | |
| increased | 3.7 (89) | 2.1 (14) | 2.5 (31) | 9.5 (44) | |
| Commercial Pastry Intake: | <0.001 | ||||
| decreased | 29.4 (701) | 69.6 (458) | 13.3 (168) | 16.3 (75) | |
| no changes | 59.6 (1420) | 22.0 (145) | 80.6 (1017) | 56.0 (258) | |
| increased | 10.9 (260) | 8.4 (55) | 6.1 (77) | 27.8 (128) | |
| Homemade Pastry Intake: | <0.001 | ||||
| decreased | 9.0 (215) | 18.5 (122) | 4.9 (62) | 6.7 (31) | |
| no changes | 51.1 (1217) | 25.4 (167) | 74.6 (941) | 23.6 (109) | |
| increased | 39.9 (949) | 56.1 (369) | 20.5 (259) | 69.6 (321) | |
| Ice Cream and Pudding Intake: | <0.001 | ||||
| decreased | 15.0 (358) | 28.6 (188) | 9.0 (114) | 12.1 (56) | |
| no changes | 74.9 (1784) | 62.2 (409) | 84.4 (1065) | 67.2 (310) | |
| increased | 10.0 (239) | 9.3 (61) | 6.6 (83) | 20.6 (95) | |
| Sweetened Cereal and/or Cereal Bar Intake: | <0.001 | ||||
| decreased | 6.3 (150) | 14.1 (93) | 3.1 (39) | 3.9 (18) | |
| no changes | 88.3 (2102) | 79.6 (524) | 93.5 (1180) | 86.3 (398) | |
| increased | 5.4 (129) | 6.2 (41) | 3.4 (43) | 9.8 (45) | |
| Sugar-Sweetened Beverages Intake: | <0.001 | ||||
| decreased | 8.4 (199) | 19.6 (129) | 3.7 (47) | 5.0 (23) | |
| no changes | 86.0 (2047) | 74.5 (490) | 93.7 (1182) | 81.3 (375) | |
| increased | 5.7 (135) | 5.9 (39) | 2.6 (33) | 13.7 (63) | |
| Energy Drink Intake: | <0.001 | ||||
| decreased | 5.0 (120) | 8.5 (56) | 3.1 (39) | 5.4 (25) | |
| no changes | 93.4 (2223) | 89.4 (588) | 95.8 (1209) | 92.4 (426) | |
| increased | 1.6 (38) | 2.1 (14) | 1.1 (14) | 2.2 (10) | |
| Alcohol Intake: | <0.001 | ||||
| decreased | 10.7 (254) | 18.4 (121) | 8.0 (101) | 6.9 (32) | |
| no changes | 71.3 (1697) | 64.0 (421) | 77.7 (981) | 64.0 (295) | |
| increased | 18.1 (430) | 17.6 (116) | 14.3 (180) | 29.1 (134) | |
| Water Intake: | <0.001 | ||||
| decreased | 8.8 (210) | 9.0 (59) | 4.9 (62) | 19.3 (89) | |
| no changes | 67.1 (1598) | 43.6 (287) | 80.0 (1010) | 65.3 (301) | |
| increased | 24.1 (573) | 47.4 (312) | 15.1 (190) | 15.4 (71) | |
| Consumption of Homemade Meals: | <0.001 | ||||
| decreased | 3.1 (75) | 2.1 (14) | 2.3 (29) | 6.9 (32) | |
| no changes | 48.8 (1162) | 34.8 (229) | 59.0 (744) | 41.0 (189) | |
| increased | 48.0 (1144) | 63.1 (415) | 38.7 (489) | 52.1 (240) | |
| Variables | Dietary Change Patterns | |||||
|---|---|---|---|---|---|---|
| Prohealthy | Constant | Unhealthy | ||||
| OR 1 (95% CI 2) | aOR 3 (95% CI) | OR (95% CI) | aOR (95% CI) | OR (95% CI) | aOR (95% CI) | |
| Age: | ||||||
| <30 years | 1 | 1 | 1 | 1 | 1 | 1 |
| 30–39 years | 0.83 (0.67–1.02) | 0.79 (0.62–1.01) | 1.02 (0.84–1.23) | 1.12 (0.89–1.40) | 1.24 (0.98–1.68) | 1.11 (0.84–1.47) |
| 40–49 years | 0.72 (0.53–0.97) * | 0.65 (0.47–0.91) ** | 1.54 (1.17–2.02) ** | 1.77 (1.30–2.41) *** | 0.76 (0.53–1.10) | 0.70 (0.46–1.05) |
| 50–59 years | 0.36 (0.23–0.57) ** | 0.33 (0.20–0.54) *** | 2.84 (1.95–4.14) *** | 2.99 (1.98–4.53) *** | 0.61 (0.37–1.02) | 0.66 (0.38–1.14) |
| ≥60 years | 0.20 (0.11–0.36) *** | 0.22 (0.12–0.41) *** | 3.14 (2.10–4.70) *** | 2.76 (1.74–4.38) *** | 0.85 (0.53–1.38) | 1.00 (0.58–1.72) |
| Education Level: | ||||||
| lower | 0.78 (0.63–0.98) * | 0.86 (0.67–1.12) | 1.36 (1.12–1.66) ** | 1.09 (0.86–1.37) | 0.82 (0.64–1.06) | 1.03 (0.77–1.38) |
| higher (university) | 1 | 1 | 1 | 1 | 1 | 1 |
| Family Composition During Pandemic: | ||||||
| living alone | 1 | 1 | 1 | 1 | 1 | 1 |
| living with partner | 1.06 (0.75–1.51) | 1.05 (0.72–1.53) | 0.86 (0.63–1.17) | 0.79 (0.56–1.11) | 1.20 (0.79–1.83) | 1.35 (0.87–2.10) |
| living with partner and/or children | 1.14 (0.83–1.56) | 1.10 (0.77–1.58) | 0.72 (0.54–0.96) * | 0.64 (0.46–0.89) ** | 1.46 (1.00–2.13) | 1.78 (1.17–2.72) ** |
| living with parents or other relatives | 1.50 (1.02–2.21)* | 1.16 (0.75–1.79) | 0.61 (0.43–0.87)** | 0.67 (0.45–0.99)* | 1.30 (0.82–2.07) | 1.51 (0.90–2.53) |
| Employment Forms During Pandemic: | ||||||
| did not work or considerable work time reduction | 1.24 (0.93–1.66) | 1.18 (0.87–1.61) | 0.61 (0.47–0.78) *** | 0.70 (0.53–0.92) ** | 1.81 (1.27–2.56) *** | 1.50 (1.03–2.18) * |
| began remote work and/or study | 1.59 (1.19–2.11) ** | 1.17 (0.86–1.59) | 0.50 (0.04–0.64) *** | 0.72 (0.55–0.96) * | 1.82 (1.28–2.58) *** | 1.45 (1.00–2.12) |
| work in the same form as earlier | 1 | 1 | 1 | 1 | 1 | 1 |
| Macroeconomic Region: | ||||||
| <50% of EU-28 GDP | 1 | 1 | 1 | 1 | 1 | 1 |
| 50–100% of EU-28 GDP | 1.06 (0.83–1.35) | 0.93 (0.72–1.21) | 0.82 (0.65–1.02) | 0.85 (0.67–1.08) | 1.55 (1.14–2.12) ** | 1.43 (1.04–1.99) * |
| >100% of EU-28 GDP | 0.94 (0.75–1.17) | 0.73 (0.53–0.99) * | 0.80 (0.61–1.03) | 1.02 (0.77–1.36) | 1.75 (1.23–2.47) ** | 1.47 (1.01–2.13) * |
| BMI before Pandemic: | ||||||
| underweight | 0.83 (0.55–1.25) | 0.71 (0.46–1.10) | 1.26 (0.88–1.79) | 1.43 (0.98–2.08) | 0.87 (0.56–1.37) | 0.87 (0.54–1.40) |
| normal weight | 1 | 1 | 1 | 1 | 1 | 1 |
| overweight | 1.14 (0.92–1.40) | 1.31 (1.05–1.64) ** | 1.03 (0.85–1.24) | 0.89 (0.72–1.10) | 0.80 (0.63–1.03) | 0.83 (0.64–1.08) |
| obesity | 1.24 (0.92–1.67) | 1.64 (1.19–2.27) ** | 0.80 (0.61–1.05) | 0.58 (0.43–0.79) *** | 1.07 (0.77–1.49) | 1.21 (0.85–1.74) |
| Physical Activity Changes: | ||||||
| decreased | 1.03 (0.84–1.27) | 0.87 (0.69–1.09) | 0.48 (0.40–0.58) *** | 0.60 (0.49–0.73) *** | 3.05 (2.39–3.90) *** | 2.62 (2.03–3.39) *** |
| no changes | 1 | 1 | 1 | 1 | 1 | 1 |
| increased | 2.03 (1.59–2.58) *** | 1.53 (1.18–1.98) *** | 0.51 (0.41–0.65) *** | 0.69 (0.54–0.88) ** | 1.10 (0.78–1.55) | 0.98 (0.69–1.39) |
| Screen Time Changes: | ||||||
| decreased | 1.41 (0.94–2.12) | 1.01 (0.66–1.55) | 0.59 (0.41–0.86) ** | 0.87 (0.58–1.29) | 1.52 (0.95–2.43) | 1.27 (0.77–2.09) |
| no changes | 1 | 1 | 1 | 1 | 1 | 1 |
| increased | 1.36 (1.13–1.64) ** | 1.17 (0.94–1.44) | 0.54 (0.45–0.63) *** | 0.68 (0.56–0.82) *** | 1.84 (1.48–2.28) *** | 1.54 (1.21–1.96) *** |
| Sleep Changes: | ||||||
| decreased | 1.65 (1.22–2.24) *** | 1.50 (1.09–2.08) ** | 0.53 (0.40–0.71) *** | 0.70 (0.52–0.95) * | 1.40 (1.00–1.97) | 1.08 (0.75–1.55) |
| no changes | 1 | 1 | 1 | 1 | 1 | 1 |
| increased | 1.72 (1.41–2.09) *** | 1.36 (1.09–1.70) ** | 0.55 (0.45–0.65) *** | 0.74 (0.60–0.90) ** | 1.29 (1.03–1.62) | 1.09 (0.85–1.40) |
| Consumption of Homemade Meals: | ||||||
| decreased | 0.94 (0.51–1.70) | 0.70 (0.38–1.30) | 0.35 (0.22–0.57) *** | 0.51 (0.31–0.85) ** | 3.83 (2.36–6.21) * | 3.06 (1.81–5.17) *** |
| no changes | 1 | 1 | 1 | 1 | 1 | 1 |
| increased | 2.32 (1.92–2.80) *** | 2.03 (1.66–2.48) *** | 0.42 (0.35–0.50) *** | 0.50 (0.41–0.60) *** | 1.37 (1.11–1.69) ** | 1.21 (0.96–1.52) |
© 2020 by the authors. Licensee MDPI, Basel, Switzerland. This article is an open access article distributed under the terms and conditions of the Creative Commons Attribution (CC BY) license (http://creativecommons.org/licenses/by/4.0/).
Share and Cite
Górnicka, M.; Drywień, M.E.; Zielinska, M.A.; Hamułka, J. Dietary and Lifestyle Changes During COVID-19 and the Subsequent Lockdowns among Polish Adults: A Cross-Sectional Online Survey PLifeCOVID-19 Study. Nutrients 2020, 12, 2324. https://doi.org/10.3390/nu12082324
Górnicka M, Drywień ME, Zielinska MA, Hamułka J. Dietary and Lifestyle Changes During COVID-19 and the Subsequent Lockdowns among Polish Adults: A Cross-Sectional Online Survey PLifeCOVID-19 Study. Nutrients. 2020; 12(8):2324. https://doi.org/10.3390/nu12082324
Chicago/Turabian StyleGórnicka, Magdalena, Małgorzata Ewa Drywień, Monika A. Zielinska, and Jadwiga Hamułka. 2020. "Dietary and Lifestyle Changes During COVID-19 and the Subsequent Lockdowns among Polish Adults: A Cross-Sectional Online Survey PLifeCOVID-19 Study" Nutrients 12, no. 8: 2324. https://doi.org/10.3390/nu12082324