Article

Land Cover, Land Use, and Climate Change Impacts on Endemic Cichlid Habitats in Northern Tanzania

by
Margaret Kalacska
1,*,
J. Pablo Arroyo-Mora
2,
Oliver Lucanus
3 and
Mary A. Kishe-Machumu
4
1
Department of Geography, McGill University, Montreal, QC H3A 0B9, Canada
2
Flight Research Laboratory, National Research Council of Canada, Ottawa, ON K1A 0R6, Canada
3
Below Water Pictures, Vaudreuil-Dorion, QC J7V 0K4, Canada
4
Tanzania Fisheries Research Institute, P.O. Box 9750, Dar es Salaam, Tanzania
*
Author to whom correspondence should be addressed.
Remote Sens. 2017, 9(6), 623; https://doi.org/10.3390/rs9060623
Submission received: 27 March 2017 / Revised: 6 June 2017 / Accepted: 8 June 2017 / Published: 17 June 2017
(This article belongs to the Special Issue Remote Sensing of Climate Change and Water Resources)

Abstract

:
Freshwater ecosystems are among the most threatened on Earth, facing environmental and anthropogenic pressures often surpassing their terrestrial counterparts. Land use and land cover change (LUCC) such as degradation and fragmentation of the terrestrial landscape negatively impacts aquatic ecosystems. Satellite imagery allows for an impartial assessment of the past to determine habitat alterations. It can also be used as a forecasting tool in the development of species conservation strategies through models based on ecological factors extracted from imagery. In this study, we analyze Landsat time sequences (1984–2015) to quantify LUCC around three freshwater ecosystems with endemic cichlids in Tanzania. In addition, we examine population growth, agricultural expansion, and climate change as stressors that impact the habitats. We found that the natural vegetation cover surrounding Lake Chala decreased from 15.5% (1984) to 3.5% (2015). At Chemka Springs, we observed a decrease from 7.4% to 3.5% over the same period. While Lake Natron had minimal LUCC, severe climate change impacts have been forecasted for the region. Subsurface water data from the Gravity Recovery and Climate Experiment (GRACE) satellite observations further show a decrease in water resources for the study areas, which could be exacerbated by increased need from a growing population and an increase in agricultural land use.

Graphical Abstract

1. Introduction

Freshwater aquatic ecosystems are under increasing threat from human activity and climate change. They are among the most heavily altered ecosystems with disproportionately high biodiversity loss worldwide [1,2]. Major systematic drivers of aquatic species loss include land cover and land use change (LUCC), overexploitation, invasive species, and climate change [3,4,5,6,7,8]. Direct and indirect competition for water resources with humans (e.g., water abstraction for irrigation) impose stress upon aquatic ecosystems and imperil fauna [9]. Aquatic ecosystems are particularly vulnerable because they receive the cumulative effects of stressors within the watershed. Reconstruction of a region’s LUCC history can be used to determine the potential stressors that have impacted or degraded habitats over time and thereby can enhance current and future management [10]. While some sources of aquatic habitat degradation such as the construction of manmade dams and river impoundments are obvious, others are more obscure. For example, land burning as the primary cause of eutrophication in Lake Victoria was only recently determined [11].
Combining standardized geospatial data of population and climate (e.g., [12,13,14]) with remotely sensed data can produce spatially explicit models of a region’s environmental geography, distribution of endangered species and biodiversity at regional and global scales [15]. Satellite imagery provides critical information for assessing changes in terrestrial ecosystems that can be linked to effects on aquatic ecosystems [16]. In Tanzania, an assessment of the Usangu Plains wetlands and Malagarasi River drainage concluded that these large river catchments suffered substantial land cover changes with declines in woodland and wetland habitats co-occurring with increases in settlements, agriculture and grassland [17,18]. In the Usangu Plains wetlands in particular, vegetated swamp cover decreased by 67% between 1984 and 2001 [18].
Relatively little is known about the endemic African fishes outside of the Great Lakes (primarily Lakes Victoria, Tanganyika and Malawi). Habitat specializations, phylogeny, reproduction and diet have been sparsely documented for fishes inhabiting the smaller lakes, wetlands and river systems in Tanzania, while LUCC and climate change effects on the species are almost entirely unknown [19]. Many endemic fishes are highly specialized to their local environment (e.g., rheophilic cichlids and thermal-alkaline-salt tolerant cichlids). The survival of others, such as annual killifish that rely on ephemeral pools in the savannah, is critically dependent upon the land use and land cover [20]. Even recently, new species of fishes have been discovered in areas affected by LUCC, for example, three new species of sucker-mouth catfishes (genus Chiloglanis) were found in the lower Malagrasi River [21], and a previously unknown rheophilic cichlid, Haplochromis vanheusdeni (Schedel, Friel & Schliewen 2014), was discovered in the Great Ruaha River drainage [22]. Others such as the characin Petersius conserialis (Hilgendorf 1894), from the Ruvu and Rufiji Rivers are only known from past sightings. LUCC also affects endemic species in lakes, such as the cichlids inhabiting African crater lakes (e.g., Lakes Ejagham, Bermin, Barombi-Mbo, and Bosumtwi) that evolved in small bodies of water and are sensitive to environmental change. Some of these cichlids are also highly specialized in their diets, for example Pungu maclareni (Trewavas 1962), and Coptodon spongotroktis (Stiassny, Schliewen & Dominey 1992), feed predominantly on freshwater sponges [23]. The primary threats to the aquatic fauna of these crater lakes are siltation due to LUCC and water extraction for agriculture and other uses [24].
In the context of this study, we adopt the definition of vulnerability provided by the fourth assessment report from the Intergovernmental Panel on Climate Change (IPCC) as “the degree to which a system is susceptible to, and unable to cope with, adverse effects of climate change, including climate variability and extremes” [25]. Climate change projected for East Africa, including decreased precipitation and increased temperature affect freshwater fish vulnerability by lessening the capacity of water bodies to regulate against temperature change, altering the thermal suitability of the habitats [26] and, in extreme cases, the spatial extent of the habitats and resulting in a decrease in the natural ecosystem’s ability to mitigate against the effects of climate change. Native riparian vegetation is known to lessen the impacts of LUCC and climate change on aquatic ecosystems by improving water quality [27,28,29,30], moderating water temperature [29,31], providing food and resources [32] and improving biodiversity [29,31,33]. Therefore, degradation or conversion of the riparian vegetation to other land cover types such as crops unavoidably results in the deterioration of aquatic ecosystems [34]. In addition to the integrity of the vegetation adjacent to aquatic habitats, historical LUCC (i.e., land use legacy) at larger landscape scales has been shown to be important for fish and invertebrate diversity [10,35]. Aquatic habitat quality is dependent upon the extent of LUCC at catchment or regional scales [10]. Furthermore, the rarity of many individual species within diverse freshwater communities often hinders conservation efforts. A lack of thorough natural history data on rare species results in extreme difficulties in forecasting the identity of taxa affected by climate change or LUCC at large scales [24]. There is a fundamental gap in knowledge of the vulnerability of endemic species to LUCC, climate change and socio-economic factors that threaten their habitats.
The overall objective of this study was to examine the LUCC from satellite imagery over the 1984–2015 period for three freshwater habitats of endemic cichlids. We also summarize putative climate and landscape stressors including population growth and forecasted climate change.
The family Cichlidae contains 1693 described species (as of May 2017), with many new species yet to be described. Cichlids are distributed exclusively in tropical fresh water, have colonized most major bodies of water, and share these habitats with a great diversity of other aquatic species. Because many have limited ranges and high levels of specialization and/or endemism, they are good indicators for overall aquatic habitat degradation from LUCC and climate change.

2. Materials and Methods
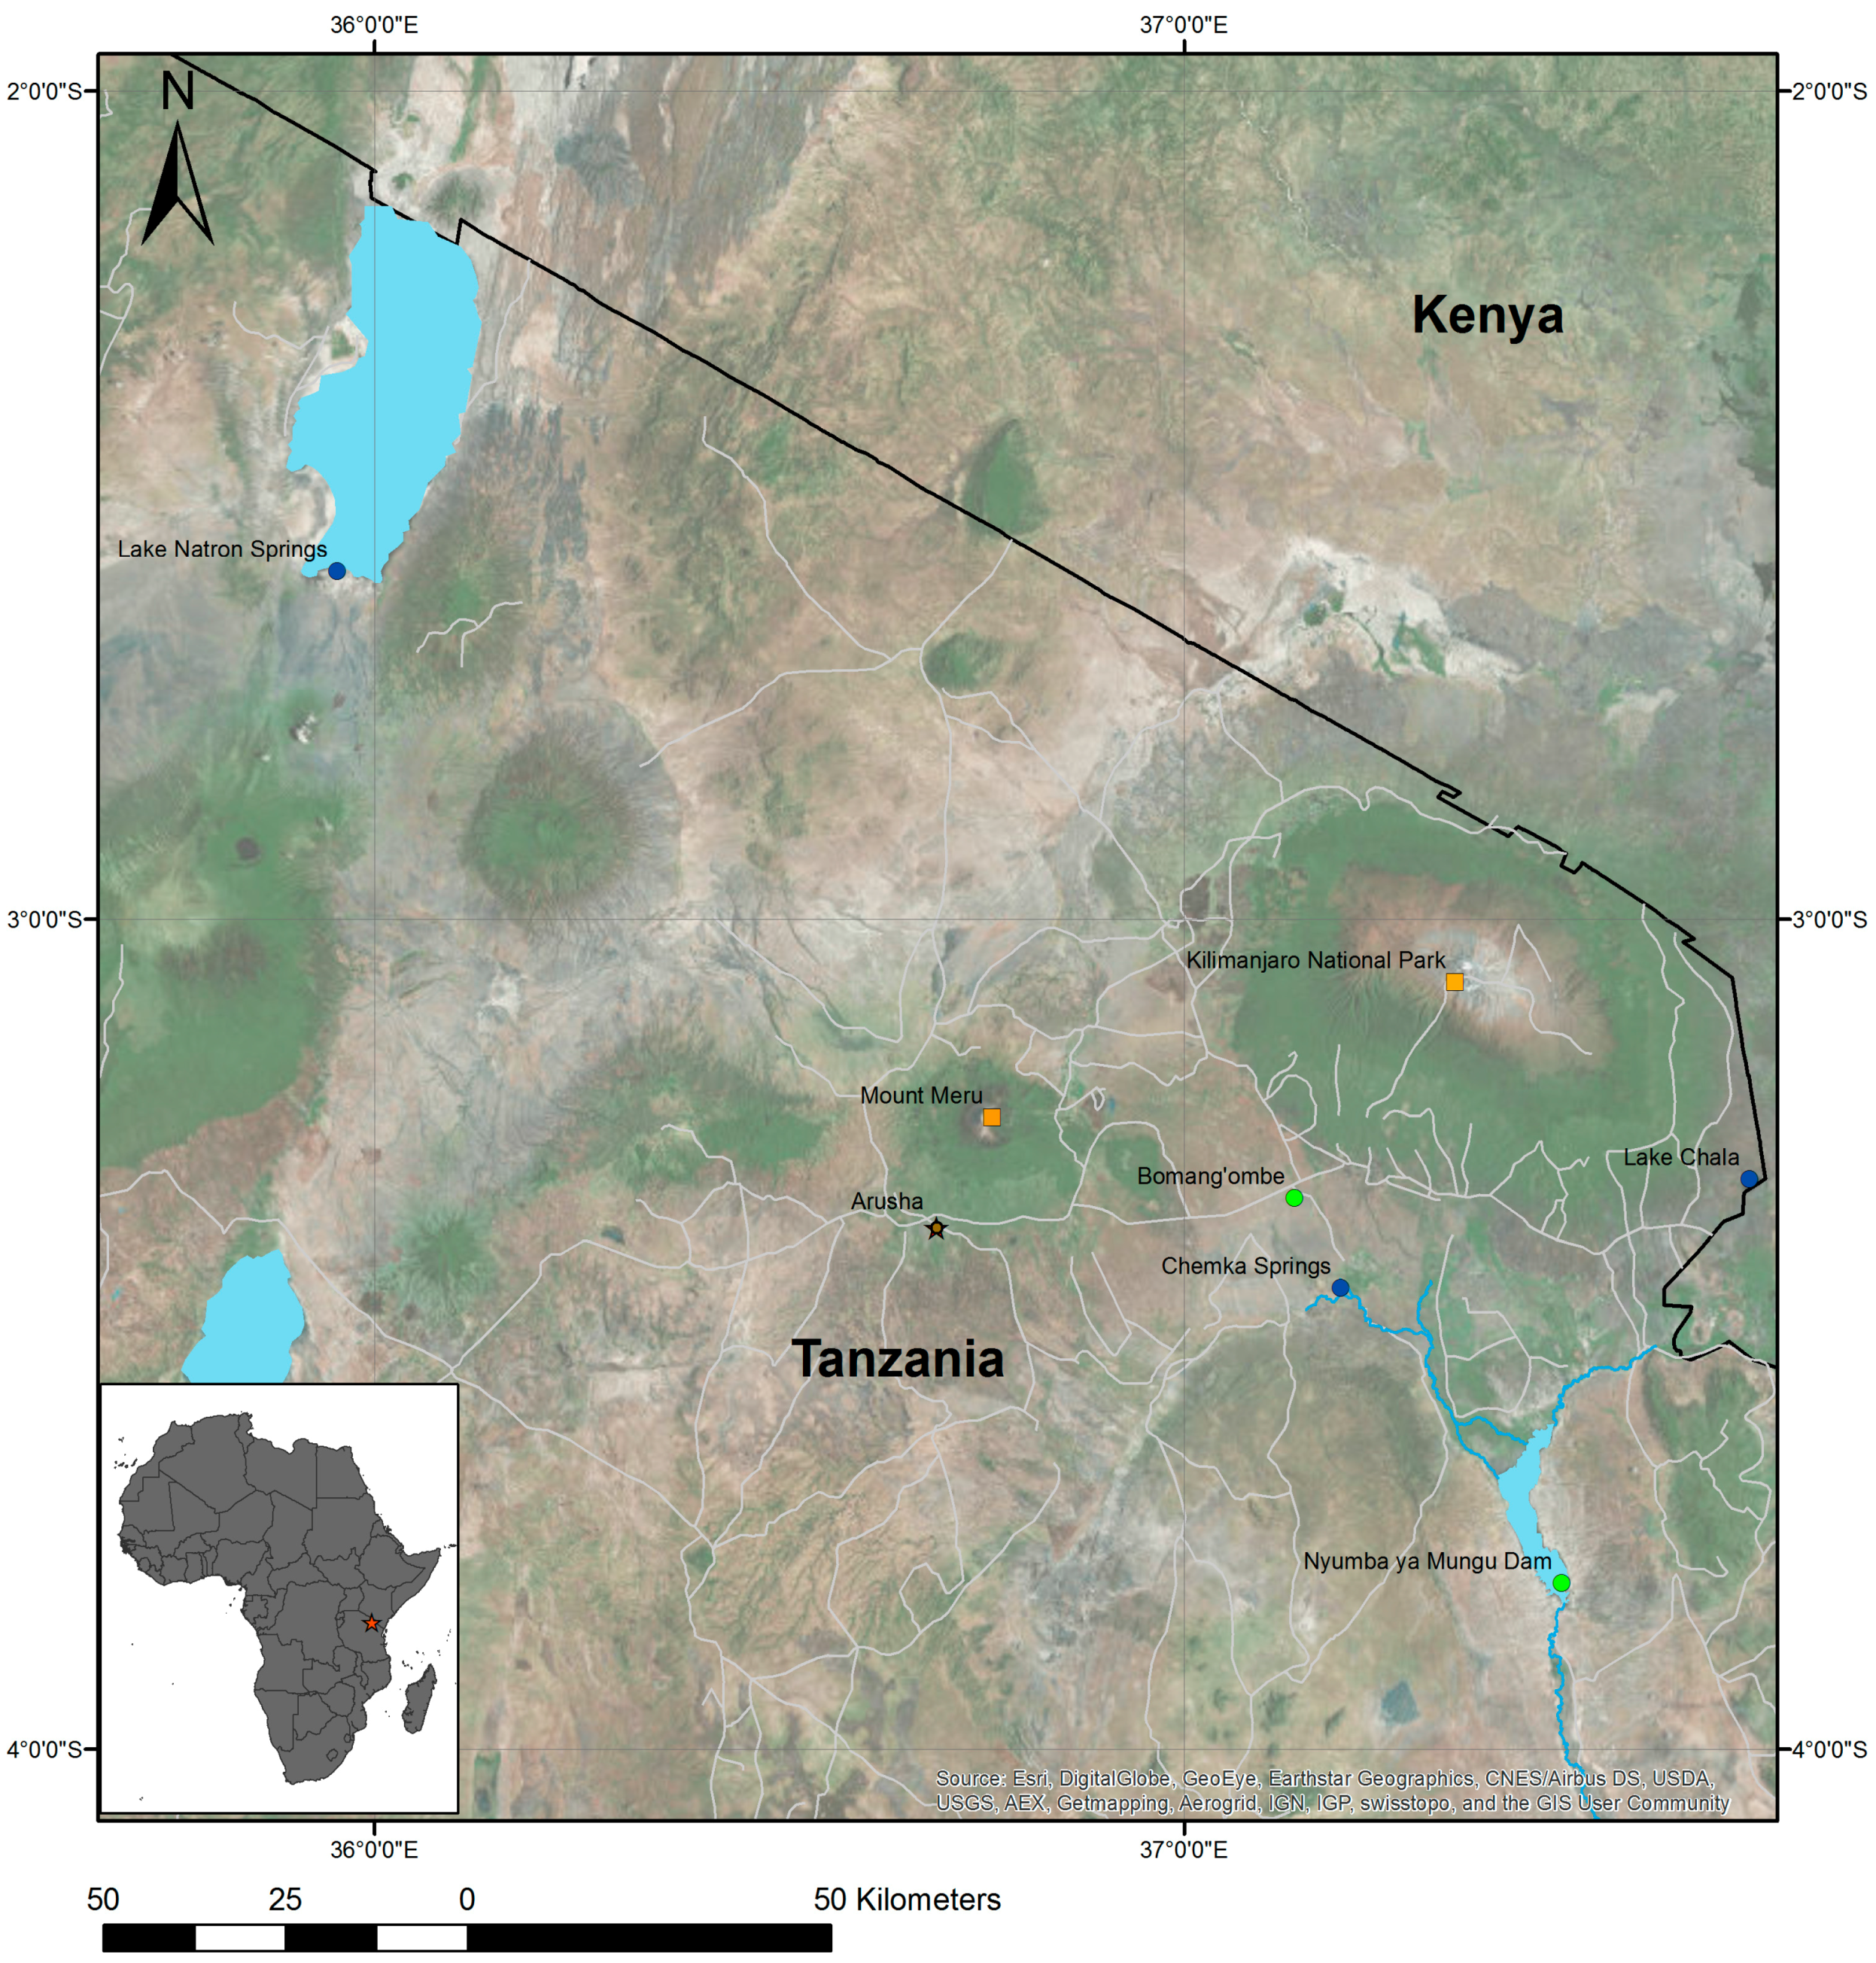
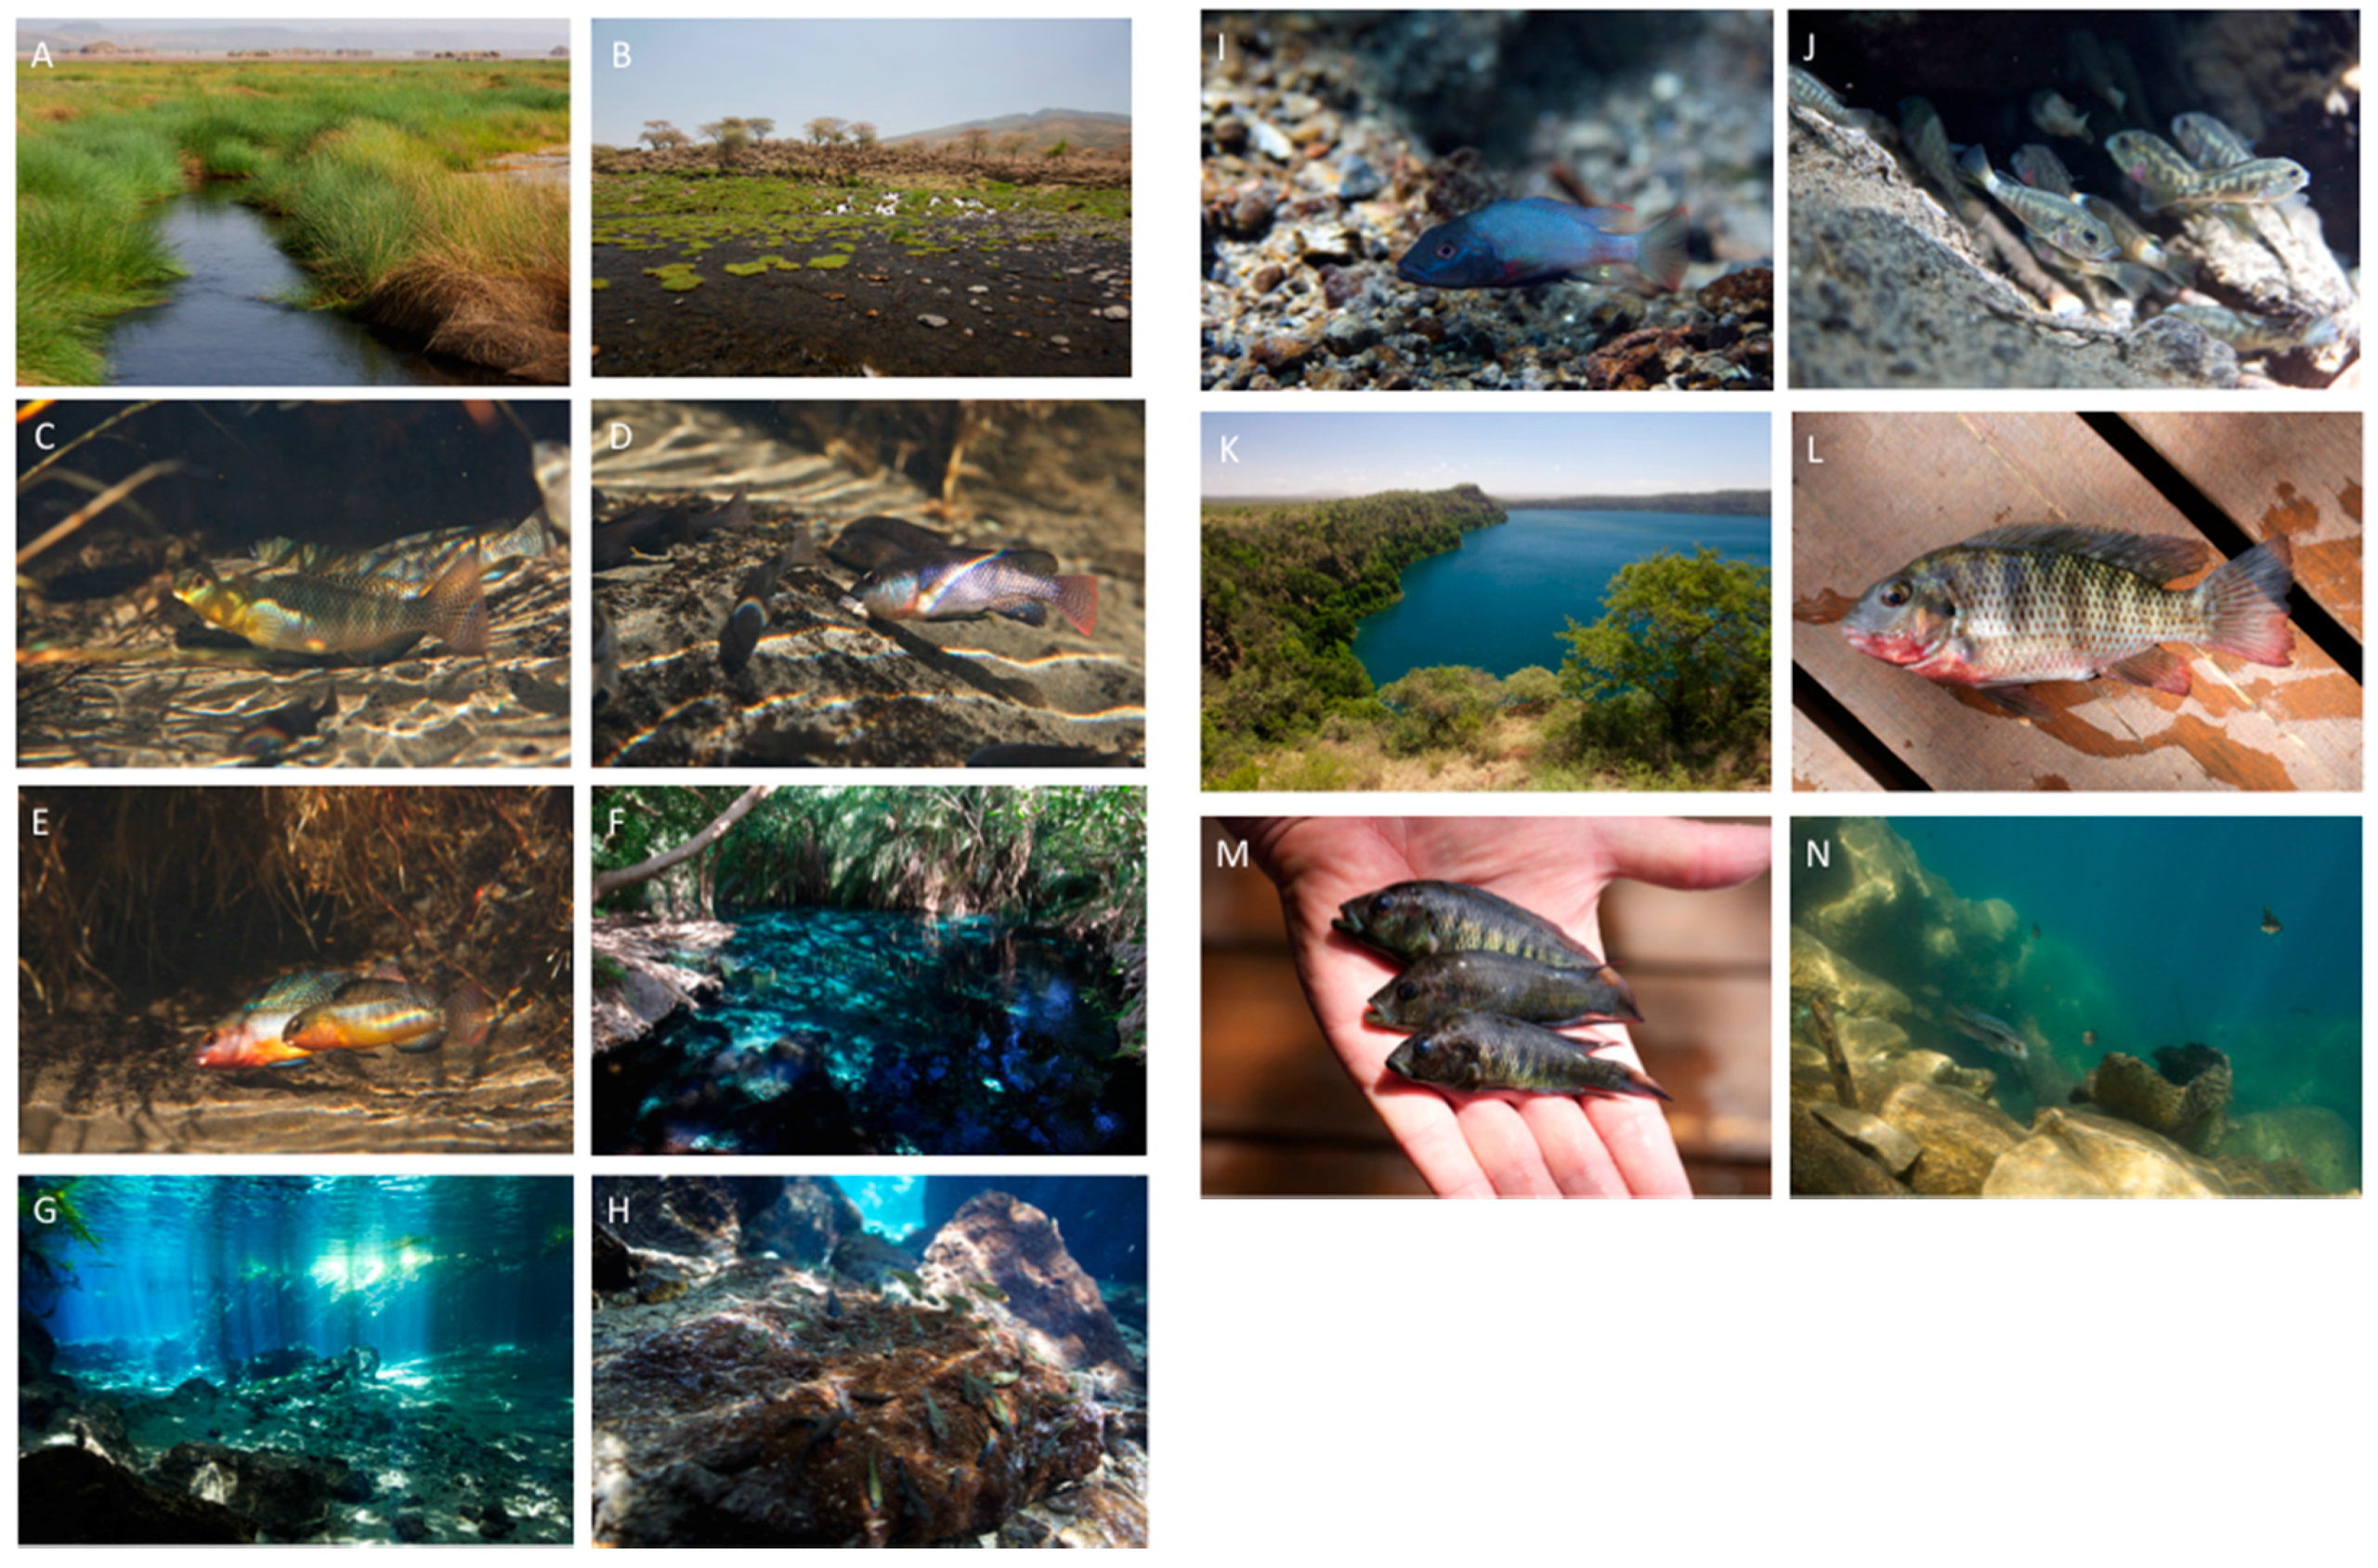
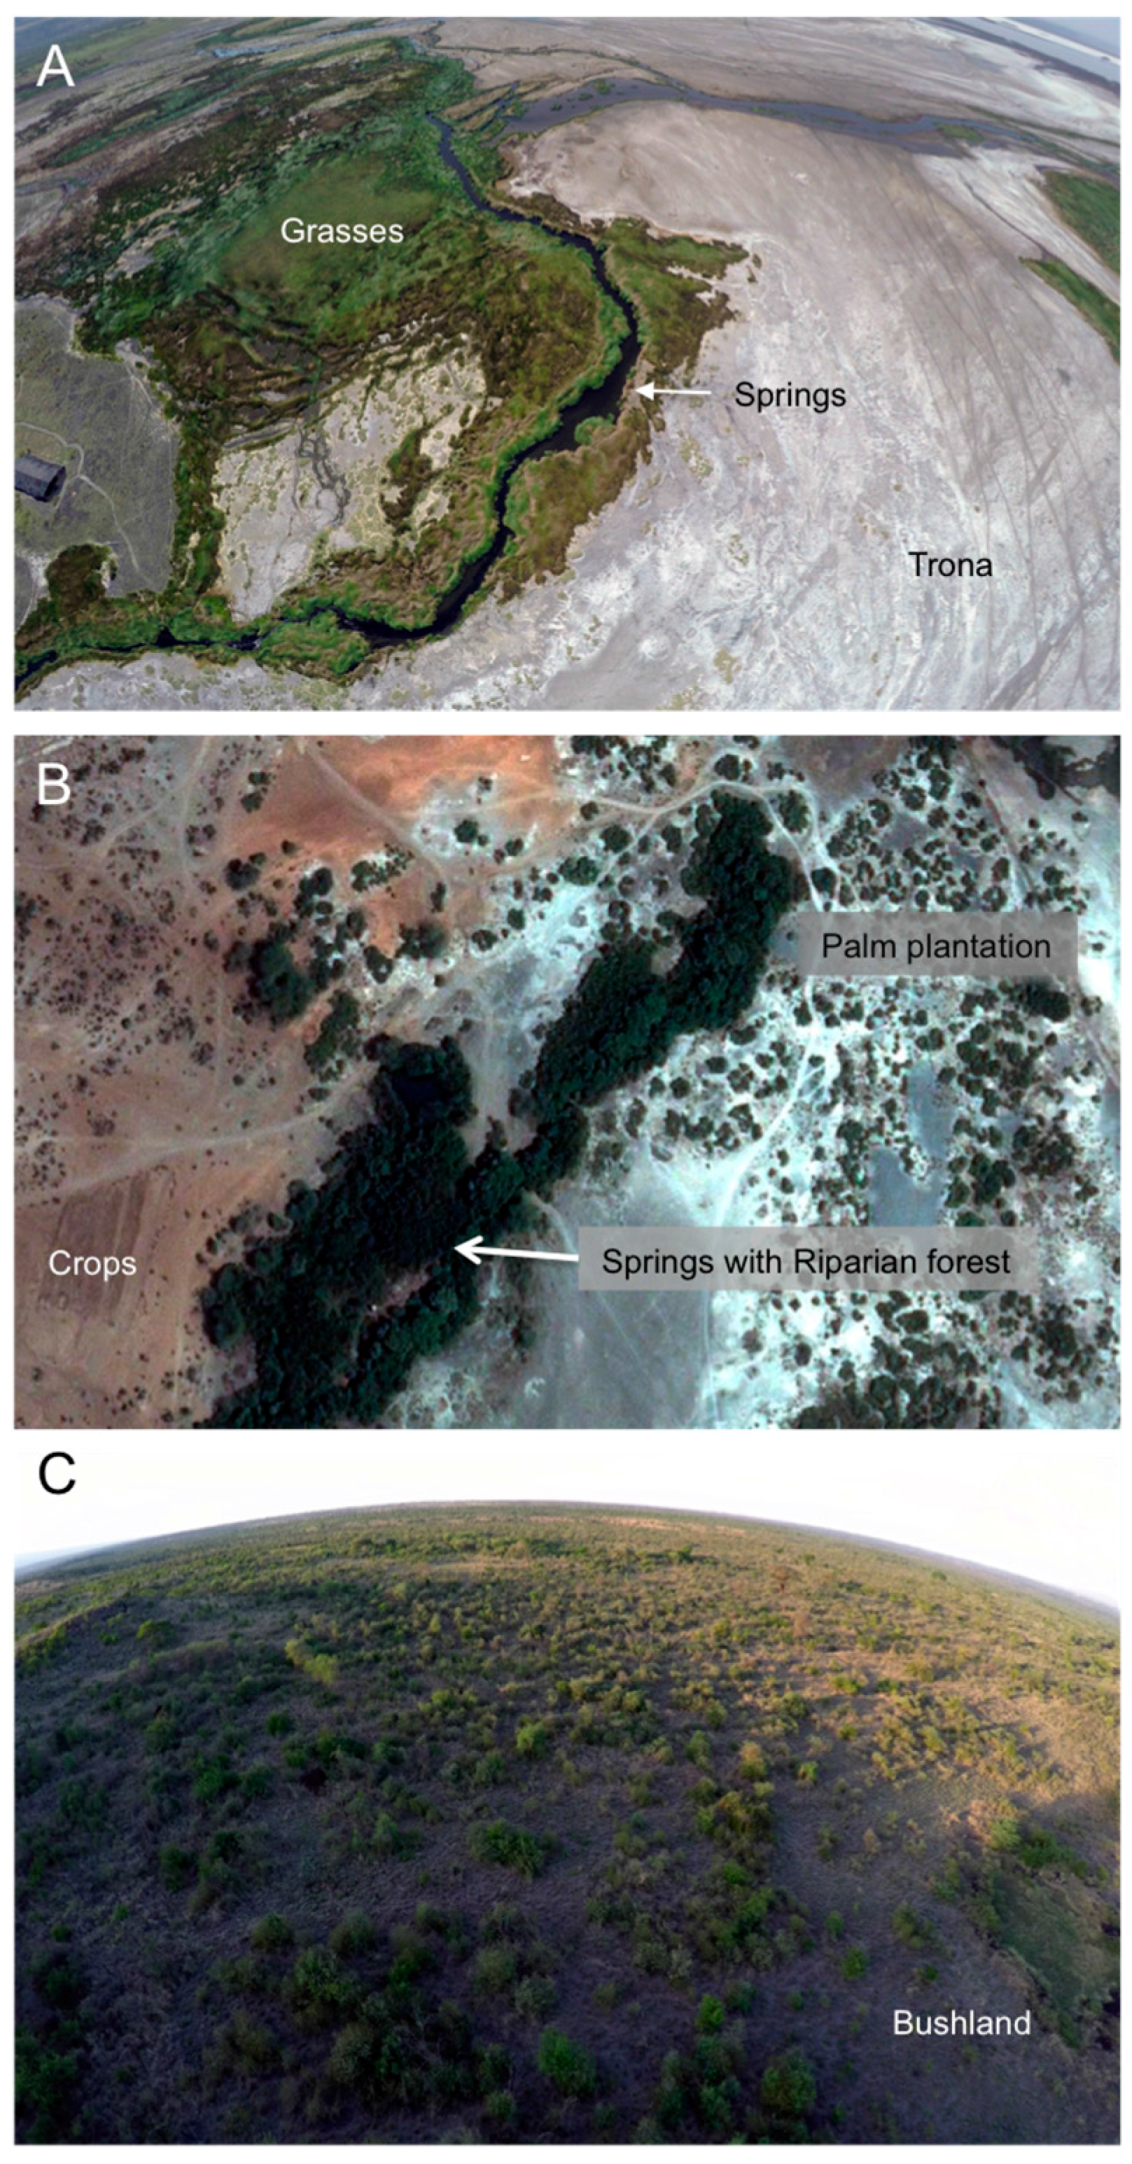
2.1. Study Areas

The study was carried out in three inland freshwater habitats: (1) the thermal freshwater springs on the southern end of Lake Natron, (2) Chemka Springs, a freshwater spring near the town of Bomang’ombe, and (3) Lake Chala a crater lake in the foothills of Mount Kilimanjaro (Figure 1, Supplementary Video S1). All three sites are arid to semi-arid with a bimodal pattern of precipitation. The long rainy season spans from March to May with a short rainy season from October to December.
Lake Natron, a thermal hypersaline lake, is part of a Ramsar Wetland site but is unprotected except for hunting regulations [36]. The main water source for this shallow (<3 m) lake is the Southern Ewaso Ng’iro River originating in Kenya. The lake belongs to the Southern Eastern Rift ecoregion classified as having ‘globally outstanding’ aquatic biological distinctiveness with a ‘critical’ conservation status [19]. The surrounding anthropogenic biomes are predominantly rangeland, with small areas considered ‘semi-natural’ and ‘cropland’ [37]. Located on the Southern flank of the Kenyan dome in the Gregory Rift at relatively low elevation (600 m above sea level) Lake Natron is rain shadowed from the Indian Ocean moisture and experiences high air temperatures, resulting in an arid condition with evapotranspiration exceeding precipitation [38]. Due to a combination of its aridity and topography, lake levels are not amplified by precipitation events [38], therefore, future water abstraction is a severe threat [36]. A planned soda ash mine would severely impact this ecosystem. The notion of soda mining at Lake Natron is not new: in the mid-1820s, 400–500 camel loads amounting to approximately 400 lbs each were reported to have been extracted on an annual basis [39]. Saline ecosystems are keystone habitats for specialized endemic fishes such as the Alcolapia species flock (Figure 2A–E, Table 1, Supplementary Video S1), which are confined to the alkaline hydrothermal springs that feed the lake. The lake itself is uninhabitable for fishes. The springs are unique but hostile environments; pH 10.5, salt > 20 ppt, water temperature of 30–42.8 °C, and low dissolved oxygen (0.08–6.46 mg/L) [40]. The springs provide 25% of the water influx to the lake [41].
Both Lake Chala and Chemka Springs are part of the Pangani River Basin, which covers approximately 43,650 km2 [42]. Ninety-five percent of the basin is in Tanzania, with five percent in Kenya. Both sites are part of the Pangani ecoregion classified as having ‘bioregionally outstanding’ aquatic biological distinctiveness with an overall conservation status of ‘endangered’ [19]. At the confluence of the Ruvu and Kikuletwa Rivers (tributaries of the Pangani River) is the Nyumba ya Mungu Dam (NYM) with a 140 km2 reservoir (Figure 1) [43]. Despite one third of the known fishes in the Pangani River Basin being endemic, the ecoregion is considered to be data deficient requiring more comprehensive taxonomic and ecological surveys [44]. The Pangani River Basin has been water stressed since the 1940s due to high water losses from irrigation (up to 85%) [42]. The ice caps on Mt. Kilimanjaro have decreased by over 75% since 1912; with projected climate change, the Pangani River Basin will no longer receive water input from glacial melt [42].
Chemka Springs is a large volume ground water spring (10 m3/s) south of Mount Kilimanjaro near the town of Bomang’ombe (Figure 1, Supplementary Video S1). While the origins of the springs are unknown, the flow remains constant throughout the year. The springs are important water sources for the NYM hydroelectric dam [43]. The anthropogenic biomes surrounding the springs consist of rangeland, cropland, villages and dense settlements [37]. The high population density in the region has resulted in fires of anthropogenic origins, illegal timber extraction, and overutilization of natural resources [42]. The clear, warm, neutral water (28 °C, pH 7.3) of the spring [45] is home to a yet to be described cichlid belonging to the genus Ctenochromis (Figure 2F–J, Table 1, Supplementary Video S1).
Lake Chala is a 98 m deep international volcanic crater lake shared by Tanzania and Kenya on the Eastern side of Mt. Kilimanjaro with a 4.2 km2 surface area (16.23 km2 catchment) and an estimated volume of 300–350 Mm3 [46,47] (Figure 1 and Figure 2K, Supplementary Video S1). The anthropogenic biomes surrounding the lake include residential woodland, remote rangeland, residential rangeland, remote croplands, residential rain fed crops, irrigated villages, rain fed villages, pastoral villages, and mixed settlements [37]. Arable land has been increasing in the region since 1973 [48]. The lake is fed by groundwater from Mt. Kilimanjaro and receives on average 565 mm of precipitation, exceeded by surface evaporation estimated at 1735 mm per year [46]. The water depth is maintained by seepage from precipitation in the forested slopes of Mt. Kilimanjaro and minimal outflow [49]; only 2.5% of the lake volume [50]. Permanent anoxic conditions exist below 60 m [49], therefore, only the upper two thirds of the lake are inhabitable by fishes. Due to the high water quality, 7 Mm3 per year are projected to be abstracted for Kenya’s growing population [47,51]. Lake Chala is inhabited by Oreochromis hunteri (Günther, 1889), the type species of the genus Oreochromis (Table 1). Fossil evidence from lake sediments suggest that the lake was inhabited by closely related cichlids dating back to ~25 kyr BP [52]. Two other cichlids were introduced over the latter half of the 20th century: O. korogwe (Lowe, 1955), by the lake’s owner during the colonial era, and Coptodon rendalli (Boulenger, 1896) [52] (Figure 2L). There is uncertainty whether a third cichlid referred to as Haplochromis spec. Chala (Figure 2M,N, Supplementary Video S1) was also introduced [52,53].

2.2. Remotely Sensed Data

Remotely sensed data (i.e., satellite and unmanned aerial vehicle imagery) were used to determine the LUCC and subsurface water storage for the study areas. The primary remotely sensed data consisted of Landsat 5 TM, 7 ETM+, and 8 OLI imagery downloaded from the USGS Earth Explorer archives (https://earthexplorer.usgs.gov/). Images with less than 15% cloud cover were downloaded for the period spanning 1984–2015. In addition to total cloud cover, each scene was also examined for minimal cloud coverage over the specific study areas. For Landsat 7 ETM+, only images collected prior to 2003 (SLC-ON) were considered to avoid missing data from the scan line corrector malfunction. In total, 19 scenes were downloaded for Lake Chala (7 TM5, 8 ETM+, 4 OLI), 19 for Chemka Springs (9 TM5, 3 ETM+, 7 OLI) and 41 for Lake Natron (15 TM5, 11 ETM+, 15 OLI).
To determine the natural land cover classes at Lake Natron and Lake Chala, a DJI Phantom 2 quadcopter (UAV) was used for 4K aerial videography with a GoPro Hero 4™ (stock fisheye lens 2.92 mm, equal to 16.6 mm on a standard sensor, f/2.8 123° FOV) in March 2015. Every 15th frame from the video files was extracted and saved as a full resolution TIFF (Figure 3A,C). For Chemka Springs, a Pleides satellite image from March 1, 2015 was acquired consisting of four 2 m multispectral bands and a 50 cm panchromatic band. The multispectral bands were pan-sharpened with the nearest neighbor diffusion algorithm [55] in ENVI 5.3 (Figure 3B).
The spatial distribution of ground water availability was also assessed from satellite data. The main water influx for all three habitats is from groundwater sources. A study of the world’s largest aquifers found that the two largest in Eastern Africa (Ogaden-Juba and the Sudd Basin) have a negative mean annual recharge indicating flow out of the system [56]. Both of these large aquifers have also been classified as overstressed systems in terms of their renewable groundwater stress ratio (groundwater use to groundwater availability). During 2002–2006 period, the Eastern African Rift Valley region from Lake Victoria to Lake Malawi experienced a substantial decrease in water levels resulting in the Great Lakes becoming shallower by up to 2 m [57]. This period of water depletion was followed by large precipitation events caused by the 2006 Indian Ocean Dipole (IOD) returning the lakes to pre-drought levels by 2007 [58]. The IOD is an ocean-atmosphere interaction over the Indian Ocean with alternating positive and negative sea surface temperature anomalies; during periods of positive anomalies, flooding is common in East Africa [58]. In order to determine the spatial distribution of ground water availability in the study areas, monthly mass grids (Global mascons) from the Gravity Recovery and Climate Experiment (GRACE) [59,60] were retrieved from the Colorado University GRACE-Interactive Visualization Tool and the GRACE Tellus data portal. The twin satellites launched in 2002 measure monthly changes in total terrestrial water storage through the analysis of observed gravity anomalies [61]. The mascons are discrete cells of mass concentration (3-degree resolution) over the surface of the Earth, each with its own gravity signal. Small changes in the gravity signal of the cells are due primarily to changes in the amount of water located in the cell [59].

2.3. Population Growth, Agriculture Expansion and Climate Change Data

The Hyde model [12] was used to determine historical cropland, rainfed agriculture and irrigated agriculture extent and population density from 1950 to 2015. While the model reports the variables at a scale of 5 arc minutes, they were summarized at the GRACE mascon scale (i.e., 5 degrees). Cropland extent refers to arable land and permanent crops [12]. Population growth rate projections were extracted from the World Bank for the years 1950–2050 [62]. Because the spatial distribution of the population in Tanzania is heterogenous (i.e., there are large cities with high population density and remote locations with little to no population), the World Bank “high” population growth rate estimate for 2050 was scaled according to the local growth rates estimated for the 1950–2015 period calculated from the Hyde model.
Current and projected temperature and precipitation changes for the study areas were obtained from WorldClim v1.4 [13]. For the projected temperature and precipitation for the year 2050, downscaled and calibrated NASA Goddard Institute for Space Studies (GISS) global climate model projections (RCP 8.5) using WorldClim v1.4 as the baseline were chosen [63,64]. Representative Concentration Pathway 8.5 represents high future greenhouse gas emissions. Characteristics of a future under RCP 8.5 include three times the present-day CO2 emissions by 2100, rapid methane emissions, an increased use of croplands and grasslands due to an increase in the human population, and heavy reliance on fossil fuels [65]. Some key differences between RCP 8.5 and intermediate scenarios are that the intermediate scenarios assume either a decrease in the use of croplands and grasslands due to dietary changes or a decrease in CO2 emission following 2060 [65]. While not a forecast, RCP 8.5 represents a business as usual scenario and currently, emissions have been shown to be consistent with this scenario [66]. Contemporary surface temperature anomalies calculated from monthly instrumental temperature records were retrieved from the HadCRU4 global dataset for the 1931–2014 period [14,67].

2.4. Image Analysis

Cloud and cloud shadow masks were calculated with Fmask 3.2 [68] implemented in Matlab v. 2015a (Mathworks, Natick, MA, USA). Because the study areas are substantially smaller than an entire Landsat scene, each image and corresponding cloud mask were subset to an area of 1278 km2 for Lake Natron, 491 km2 for Lake Chala, and 38 km2 for Chemka Springs. Total cloud area was recalculated for the subsets and only images with less than 3% cloud cover were retained, resulting in 33 scenes for Lake Natron, 19 for Lake Chala and 15 for Chemka Springs (Figure 4). Individual cloud masks were combined to create one comprehensive mask spanning the entire period (1984–2015) for each study area. From the comprehensive cloud masks, there was 89.5% cloud free area for Lake Natron, 97.3% for Chemka Springs, and 85.3% for Lake Chala on which the remainder of the analyses were based (Figure 5).
The three Landsat datasets (5 TM, 7 ETM+, 8 OLI) have different radiometric and spectral characteristics, therefore, to make the outputs comparable over the multiple image dates and sensors, a tasseled cap transformation was applied to the cloud-free pixels of the images calibrated to top-of-the-atmosphere reflectance in ENVI 5.3 [69]. The tasseled cap transformation compresses and decorrelates the multispectral bands into three bands orthogonally distributed along new axes associated with brightness, greenness, and wetness [70,71]. The brightness component is associated with the presence of soil and highly reflective natural and manmade features. The greenness component exploits the contrast between the red and near infrared bands commonly seen with vegetation. The third component, wetness, is associated with soil moisture and other ‘wet’ features in the landscape.
Because several natural and anthropogenic land use classes in the study areas have similar land cover components (e.g., various proportions of exposed soil and vegetation) a time sequence of the tasseled cap transformed image subsets was made for the 1984–2015 period for each study area (Figure 6). The premise of examining the land use trajectory of the pixels over time in the time sequence rather than classifications conducted on single images is that pixels representing natural vegetation will have a spectral phenology that is different from pixels representing land cover modified by human intervention (e.g., irrigated agriculture) during the time sequence. By examining a time sequence of several years the goal was to locate areas of natural vegetation within a complex land cover matrix with a variety of small-scale anthropogenic modifications (Figure 6).
In order to determine the natural land cover in each study area, the high spatial resolution UAV images and pan sharpened Pleides image were examined in addition to GPS tagged field photographs collected in March 2015. For Lake Natron the natural land cover classes include exposed soil, trona, grassland, aquatic grasses, and bushland (Figure 3A). For Chemka Springs, ‘closed canopy tree stand’ (Riparian forest) is the natural land cover class (Figure 3B). The primary natural land cover class around Lake Chala is bushland (Figure 3C).
The high spatial resolution data sets (Pleides and UAV), geotagged field photographs and Google Earth were used to select training and validation points for classification. All training and validation points were located at least 90 m apart. Prior to classification the bands in the time sequence were reduced with the BandMax algorithm with the natural class(es) as the target class(es). This algorithm provides a subset of bands that maximize the separability between target(s) and the background. The reduced time sequences were then classified with Spectral Angle Mapper [72]. This algorithm determines the similarity between two spectra by calculating the angle between them; smaller angles represent spectra that are a better match to the reference provided. In this case, the reference was the reduced time sequence for the ‘natural’ land cover class(es). The first time sequence analyzed for all sites spanned 1984–2015. Areas classified as ‘natural’ in this time sequence are expected not to have changed over the 31 years and represent the 2015 extent of the natural land cover class(es). Additional time sequences spanning 1984–1987, 1984–1995, and 1984–2000 were analyzed for Lake Chala and 1984–1995 for Chemka Springs. There were not enough images available for Chemka Springs to examine the 1984–1987 and 1984–2000 time sequences. For Lake Natron, no additional time sequences beyond the 1984–2015 period were examined because the entire study area consisted of natural land cover classes with the exception of an agricultural area and Maasai villages (~90 km2) that remained consistent over time (confirmed during the field visit in March 2015).
For an expected accuracy of 85% and allowable error of 5% the minimum number of validation points required to assess the classification accuracy was calculated to be 203 [73]. A stratified random sampling scheme was used to assign the points to the two classes of interest, ‘natural’ and ‘modified’ for each study area separately.

2.5. Fragmentation Analysis

Fragmentation analysis describes the spatial configuration of the landscape classes of interest. Fragstats 4.1 was used to calculate patch and class level statistics [74]. Evidence suggests that reporting solely the total area of natural vegetation in a catchment is insufficient and that the spatial configuration and quality of the patches of natural vegetation are also important considerations [30,75,76,77]. At the patch level, we analyzed the distribution of the number of natural vegetation fragments for each period as a proxy for measuring landscape composition and configuration. At the class level the following metrics were calculated: total class area (CA), percentage of the landscape (PLAND), largest patch index (LPI), landscape shape index (LSI), as well as the clumpiness (CLUMPY) index for the ‘natural’ class. The indices CA and PLAND measure the total amount of the class in hectares and the percentage of that class in the landscape, respectively. LPI is a measure of the percentage of the landscape comprised by the largest patch. LSI quantifies the perimeter-to-area ratio for the landscape as a whole, therefore, it is a proxy for the overall geometric complexity of the ‘natural’ class; moreover, it can be interpreted as a measure of patch dispersion. The CLUMPY index measures the degree of distribution of patches in the landscape as a measure of landscape configuration. It ranges from −1 for maximally disaggregated patches to 1 for maximally computed patches, while a value of zero indicates a random distribution. Because the fragmentation statistics are based on a single land cover class (i.e., ‘natural’), we did not address landscape level metrics.

3. Results

3.1. Land Cover Change

Based on the classification of the satellite imagery for Lake Chala, a decrease in natural vegetation cover (bushland) from 15.5% (1987) to 3.5% in 2015 was observed (Figure 7). Calculation of the bushland extent within the smaller catchment area (16.23 km2) revealed a decline in total extent from 39.2% (1987) to 16% (2000) and a slight increase to 18.6% in 2015. User’s accuracy for the bushland class ranged from 83% to 88% for the four time sequence classifications. Producer’s accuracy ranged from 88% to 95% for the four classifications. At the patch level, results indicate a large number of small bushland fragments (<10 ha), two medium fragments (10–100 ha) and a very large fragment (6200 ha) in the landscape in 1987 (Table 2, Figure 7 and Figure 8). As land degradation increased in the area, by 1995 we found a reduction in the number of small bushland fragments and an increase in medium sized fragments as a result of the reduction of the largest fragment (Figure 7 and Figure 8). This also resulted in a substantial reduction in the area of the core bushland fragment to 1520 ha. A large increase in the number of bushland fragments from 203 to 526 (Table 2), and a decrease in the mean patch area from 18.2 ha to 4.93 ha (Table 2) was found by the year 2000. For the most recent time period (2015), we found a steep reduction in the number of bushland fragments to 62 indicating that only a few fragments are left in the landscape around the lake.
At the class level, the fragmentation statistics are consistent with patch level statistics, showing a consistent reduction in CA and PLAND. For instance, the total bushland cover decreased from 7633 ha from the initial time period (1987) to 1726 ha by 2015, representing a change in PLAND from 15.5% to 3.5% (Table 2). The LPI, which represents the percentage of the landscape comprised by the largest patch, consistently decreases in the core area around Lake Chala from 12.73 in 1987 to 2.26 in 2000, with a slight increase to 2.88 in 2015. The LSI for Lake Chala shows a peak value in 2000 (28.81) with a decrease to 11.49 by 2015. Finally, the CLUMPY index ranges from 0.83 in 2000 to 0.90 in 1987, indicating a decreased aggregation of the bushland class.
For Chemka Springs, the natural vegetation (closed canopy forest) decreased to 3.5% (2015) from an initial extent of 7.4% (1995). The user’s accuracy for the natural vegetation ranged from 88% to 94% for the two classifications. Similarly, the producer’s accuracy ranged from 80% to 96%. A change in the landscape structure based on patch size distribution can be seen (Figure 8). The results from 1995 illustrate a large number of fragments smaller than 15 ha, however, by 2015 most of the fragments are less than 5 ha, with a lower number of patches overall (194 vs. 104, respectively) and a reduction in the mean patch area (1.45 ha to 0.92 ha). At the class level, there is a decrease from 281.8 ha to 95.7 ha (CA) as well as a decrease in PLAND from 7.4% to 2.5%. This pattern is more dramatic in the LPI, which decreases from 1.19% to 0.25%. Overall, the CLUMPY values are lower than Lake Chala for both periods, with 0.61 and 0.52 for 1995 and 2015, respectively, indicating a more disaggregated landscape than that found around Lake Chala.

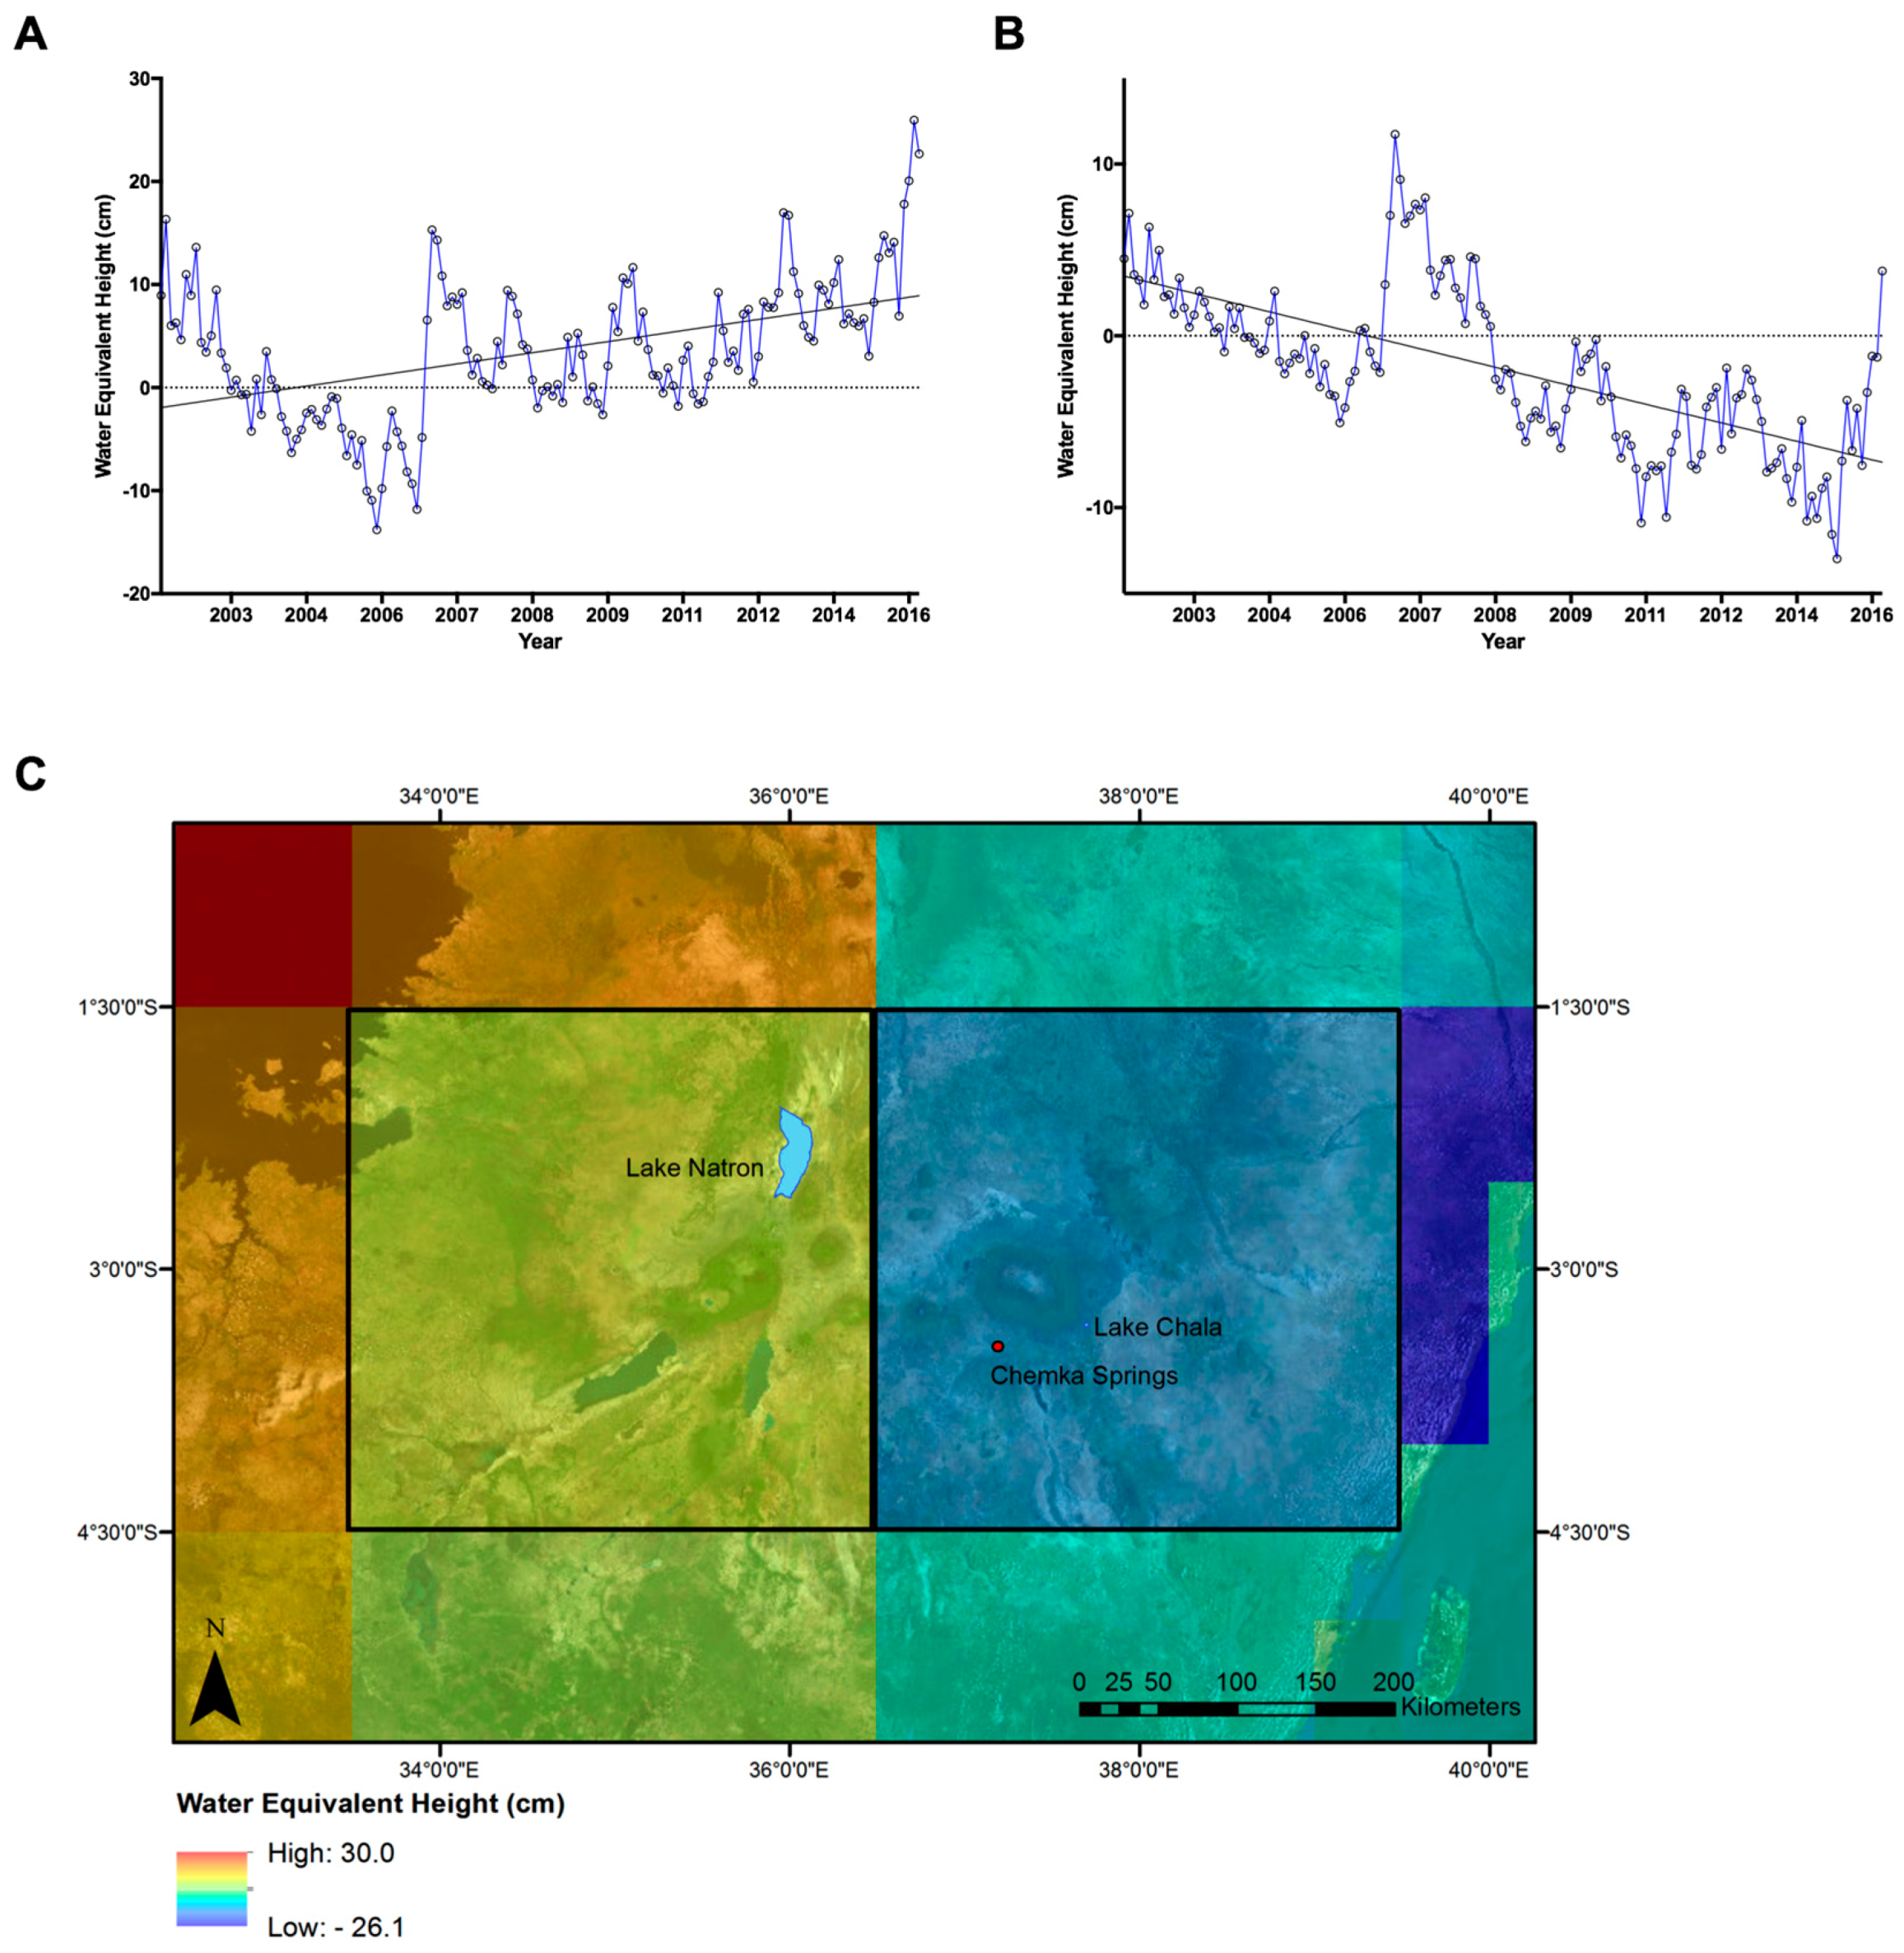
3.2. GRACE Satellite Subsurface Water Data

The assessment of the GRACE satellite data indicates a sharp decreasing trend of water availability for both the Lake Natron (−4.4 cm/yr) mascon and the Lake Chala and Chemka Springs (−1.69 cm/yr) mascon over the 2002–2006 period followed by a rapid increase in 2007 to a maximum value of 14.8 cm of water equivalent height for Lake Natron and 10.8 cm for Lake Chala and Chemka Springs (Figure 9A,B). The overall trend over the observation period of the GRACE satellites from 2002 to 2015 is 0.82 cm/yr for the Lake Natron mascon and −0.81cm/yr for the Lake Chala and Chemka Springs mascon. The mascon for Lake Natron also includes the southeastern edge of Lake Victoria, the largest African lake by surface area (68,800 km2). Therefore, any decrease in subsurface water near the Lake Natron springs specifically may be obscured by the larger gravity signal from Lake Victoria (Figure 9C).

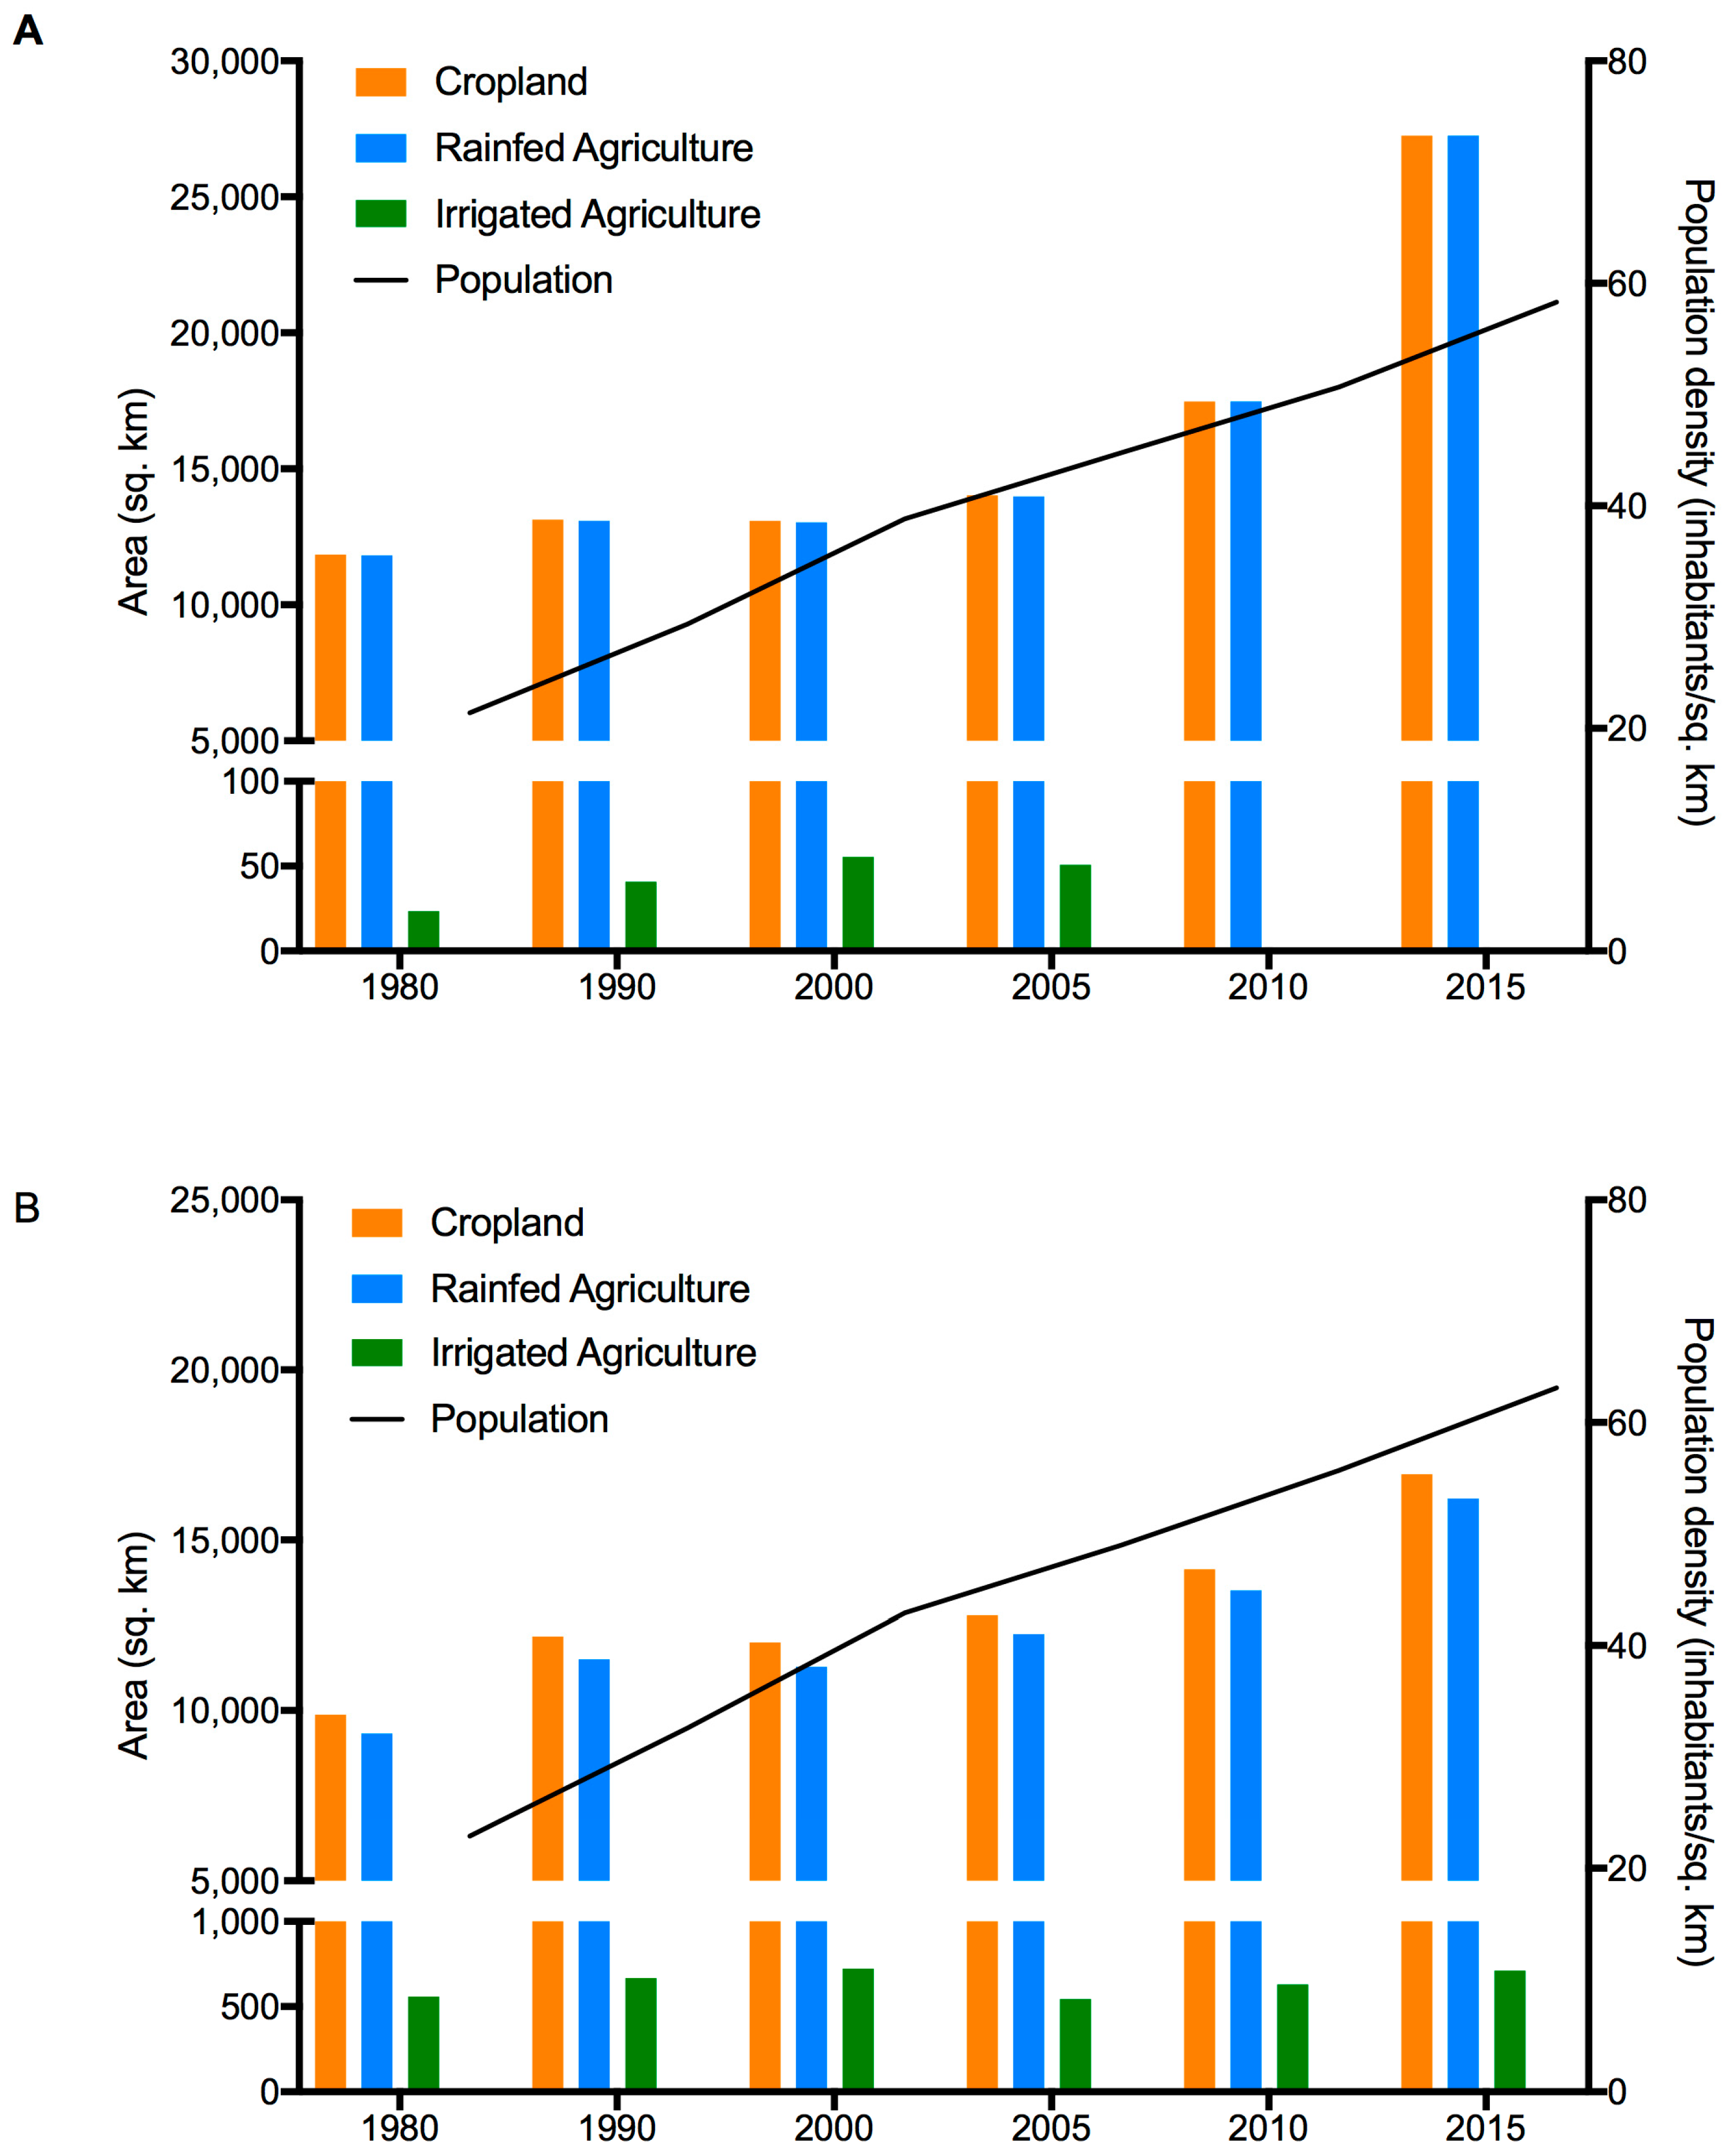
3.3. Population and Climate Model Results

The changes in cropland extent and rainfed and irrigated agriculture extents summarized at the mascon scale (Figure 10) illustrate how a larger region around the catchments has changed over the 1980–2015 period providing insight into potential future stressors caused by the conversion of natural land cover to agricultural activities. An increase in the area of cropland and rainfed agriculture can be seen for both mascons. Irrigated agriculture also increased for the Chala/Chemka mascon. While covering the smallest total area of the three categories, the irrigated agriculture in the Chala/Chemka mascon for the entire 1980–2015 period is concentrated around Chemka Springs, increasing from 16.7 to 34.0 km2 immediately surrounding the Ctenchromis habitat. A large increase in cropland and rainfed agriculture can also be seen for the Natron mascon between 2010 and 2015. While there is no increase in agriculture within the Natron basin, encroachment can be seen east of the Gelai volcano (located SE of Lake Natron) and on the western slopes of the Gregory Rift (western border of the Natron basin).
Based on the World Bank high population growth model, Tanzania will experience an increase in population density from 54.9 people/km2 (1950) to 170.7 people/km2 by 2050. Regional population density estimates project 102 people/km2 for Lake Natron, 245 people/km2 for Chemka Springs, and 249 people/km2 for Lake Chala. Over the period of this study, the population density tripled for both of the two mascon areas (Figure 10). The total number of inhabitants increased from 2.6 to 7.2 million and 2.3 to 6.2 million for the 1980–2015 period for the Chala/Chemka and Natron mascon regions respectively.
For the three sites the HadCRUT4 data illustrate an increasing trend in the 20-year average surface temperature anomalies since 1968 by 1.6 °C. By 2050, the GISS (RCP 8.5) model predicts an increase in temperature of 2.5 °C and precipitation decrease of 15 mm/yr for Lake Natron, +1.8 °C and −4.6 mm/yr for Chemka Springs and +1.7 °C and −3.9 mm/yr for Lake Chala.

4. Discussion

The LUCC history around aquatic habitats has been shown to have an important influence on the present-day fish diversity and habitat conditions [10,78]. However, the classification of satellite imagery in the arid ecosystems examined here is inherently challenging. In an assessment of LUCC for the slopes of Mt. Kilimanjaro, it was indicated that from single date imagery, bushland, grassland and cropland cannot be readily separated due to the transitional nature of the classes and their spectral similarity [48]. Furthermore, vegetation dynamics in the region are strongly influenced by cultivation and land conversion [16]. Small-scale agriculture, with variable irrigation practices can be difficult to separate from the natural vegetation phenological cycles in arid regions [79]. However, separating the natural landscape from modified areas is needed in order to understand trends in LUCC dynamics [69]. The tasseled cap time sequence of the historical Landsat imagery allowed us to separate out the natural land cover classes from the modified areas and reduce the confusion between spectrally similar classes at single points in time. The results also illustrate an isolation and fragmentation of the natural vegetation around Lake Chala and Chemka Springs. In both cases the total native vegetation area was found to be below the recommended 70% for the maintenance of water quality [30]. The width of the Riparian buffer around Chemka springs is below the recommended thresholds for aquatic wildlife protection (30 m), and is at the lower limit of the thresholds for stream temperature stabilization (10 m), nutrient retention (15 m), sediment control (10 m), and pesticide retention (15 m) [80]. However, when land use intensity is considered, the minimum buffer recommended to moderate water temperature and quality increases to 30 m [81]. In contrast, for Lake Chala the vegetated slopes of the crater and the bushland vegetation on the Tanzanian side afford some protection but this is greatly reduced on the Kenyan side of the lake where, outside of the crater the natural vegetation has been removed. If the rate of natural vegetation loss were to remain constant, the remaining fragments of bushland in the Lake Chala catchment would be converted to other land covers by 2040 and the remaining closed canopy forest around Chemka Springs would be lost by 2033. Mitigation and management efforts could in the long-term to protect the remaining natural vegetation and potentially also to allow it to regrow.
The rapid decline of groundwater in the region followed by the increase in water availability can be seen in the mascon grid time series for our study areas (Figure 9A,B). With the rainfall patterns (and associated vegetation phenology) in East Africa closely associated with IOD and El Nino Southern Oscillation (ENSO) events, further depletion events in terrestrial water storage can be expected [16,82]. Depletion events would be important for small aquatic habitats where subsurface sources (e.g., springs) are the primary source of incoming water. Irrigation and other water use such as drinking water in the region almost entirely draws water from sources originating from groundwater [42,47]. With precipitation being a significant driver of the water storage behavior of the region encompassing our study areas [83], climate change scenarios for the region suggest an increase in water stress in the future. In addition, interannual high precipitation events associated with large-scale circulations (i.e., IOD, ENSO) will play increasingly important roles in mitigating accumulated water storage deficits [83]. A global assessment by Reference [84] found high correlations between threats to human water security and biodiversity, with the strongest correlations in heavily settled regions indicating the negative influence a growing population has on aquatic ecosystems.
The continent-wide approach by Reference [19] assessed ecoregions based on land degradation and threats to aquatic habitats. Our approach focuses on a finer scale by considering current and future stressors to the specific aquatic habitats of cichlid species taking into account the global and regional drivers of ecosystem vulnerability recommended by Reference [85]. Of the habitats examined here, we found that the Alcolapia species flock restricted to the Lake Natron Springs was vulnerable to forecasted climate change and potential future landscape alteration. The water in the lake itself is uninhabitable for fish to survive, even a short period of time. Therefore, if the temperature of the shallow springs surpasses their thermal tolerance or the water conditions are altered by future water abstraction [86,87], these fish have no migratory recourse. While the total area of the springs is estimated to be less than 10 km2, it is unknown how much of that is inhabited by the Alcolapia. A planned contemporary soda ash mine would result in the construction of dikes and other infrastructure, as well as an increase in the local population. Such mines require large amounts of water, and any impact on water levels could impact the Alcolapia populations that rely on the shallow springs [36]. A hydropower dam proposed for the Ewaso Ngiro River in Kenya would further decrease the main source of water input to the lake from the northern side [36], putting additional pressure on the southern freshwater springs.
The highest upper critical temperature (45.6 °C) recorded for a freshwater fish was for Alcolapia grahami (Boulenger 1912), from nearby Lake Magadi in Kenya [87], which is less than 3 °C warmer than the current upper range of the water temperature for the Natron Springs Alcolapia. The only other cichlids known to naturally inhabit similar temperatures are the endemic cichlids from the genus Danakilia, found in the shallow (<10 m) waters of Lake Abaeded in the Danakil Depression of Northern Eritrea and Lake Afrera in Ethiopia [88], and Iranochicla from Southern Iran [89]. The water influx to the lakes inhabited by Danakilia is also mainly from springs and ranges in temperature from 29–45 °C [88]. Nevertheless, the Danakilia, while abundant in lakes, are generally found in the coolest areas, and rarely in the upper extremes of water temperature, suggesting that while these cichlids may be thermal tolerant, if conditions allow the fish will reside in the cooler temperature range of their habitat. The projected air temperature increase of 2.5 °C (by 2050) from the GISS model for the Natron Springs Alcolapia is consistent with contemporary surface temperature increases observed from ground monitoring stations (HadCRUT4 data). While the high specific heat capacity of water will protect the fish from abrupt temperature changes, we believe that projected climate change will subject the Alcolapia to prolonged exposures to warmer conditions. As ectotherms, fish have poor insulation and their body temperature is predominantly controlled by the water body in which they live [90]. Short-term positive impacts on growth of increases in environmental temperature are negated if the temperature surpasses the fish’s optimal range, beyond which growth and other necessary biological processes are compromised [91]. Tropical fish, in general, experience narrower temperature fluctuations than temperate species and many already live close to their maximal thermal tolerance [92,93]. With climate change, fish are expected to be exposed to thermal regimes outside their thermal tolerance windows [94].
Based on the 2006 the IUCN Red List assessment A. alcalicus is considered endangered with a decreasing population trend. One of the primary causes listed for the imperilment of A. alcalicus is climate change. Given that A. ndalalani and A. latilabris are more specialized than A. alcalicus (Table 1), we expect them to be more threatened by changes in their habitat [95,96]. Both A. ndalalani and A. latilabris are categorized as vulnerable by the IUCN Red List; the primary threat listed for both is habitat degradation. A projected decrease in precipitation and a potential decrease in the subsurface aquifer could lead to an overall loss of habitat extent or depth. All three species graze on algae and biocover growing on the rocks and stems of marginal plants. The marginal grasses also act as a nursery for juvenile fishes. A decrease in water depth in the springs could have devastating effects on the available habitat including a reduced amount of marginal vegetation (Juncus sp.) that acts both as a vital habitat for the young cichlids, once released from the mouth of the female, cover from cannibalistic larger specimens, and extended surface area for algae and biocover. The projected population growth (average 102 inhabitants/km2) by 2050 is further expected to stress the water resources of the arid region.
Our results also highlight the importance of the management of the local water resources at Chemka Springs. Chemka Springs contribute a major influx of water to the NYM dam reservoir. All natural vegetation except the Riparian zone immediately next to the springs have been removed (Figure 2B and Figure 7F). Palm plantations were observed to be encroaching on the springs. With an increase in population density, cropland, and agriculture (Figure 10), the need for water abstraction also increases. Irrigated agriculture doubled in extent in the immediate vicinity of the springs; this is expected to further increase as rainfall and subsurface water may become inadequate for the growing needs of the population. Pollution from agricultural runoff may further adversely affect the limited habitat of undescribed Ctenochromis sp. Due to potential fluvial habitat fragmentation and breaks in connectivity, it is unclear how much area would be available for the fishes to migrate if their current habitat at the mouth of the springs becomes uninhabitable. The site (springhead) is a popular swimming spot for both locals and tourists, but no formal management of the site exists to protect it from degradation, refuse left behind by visitors and other activities that are potentially detrimental to the habitat (e.g., washing vehicles in the shallow portions of the stream).
Arguably, the habitat of O. hunteri in Lake Chala may undergo the least amount of change unless there is large water abstraction from Lake Chala, increased agricultural runoff, or introduction of additional species. The large volume of Lake Chala provides some protection against climate change. However, increased water abstraction due to climate change, introduced species and water quality degradation from sedimentation and agricultural runoff are important detrimental factors. Based on a 2006 assessment, the IUCN Red List categorizes O. hunteri as critically endangered with a decreasing population. The primary threats listed by the IUCN are climate change and habitat degradation. Another threat to O. hunteri is the introduction of species, especially C. rendalli that compete directly for food and territory. The high reproduction rate of C. rendalli also outnumbers the slower reproduction rate of the mouth brooding Oreochromis. The wide range of tolerated environmental conditions, trophic adaptability and high reproductive rates have been shown to be predominant factors that have allowed tilapias (such as C. rendalli) to become one of the groups of exotics fishes most widely distributed worldwide, exacerbating damage to native fish, and making them a primary cause of species endangerment and extinction [97]. The voracity of these tilapias, especially during times of year where food resources are scarce leads to their ability to outcompete native fishes [98].
One of the limitations in this study is the lack of historical or contemporary population data for the species examined. However, as described earlier, such data on African fishes outside the Great Lakes in small aquatic systems are non-existent for most of the endemic species. Therefore, our conclusions on the putative effects of environmental and local human induced stressors are based upon studies of other fishes worldwide undergoing similar stressors [99,100,101,102,103,104,105] among many others. A well-studied example of a fish critically endangered by climate change and water abstraction for human uses is the Devil’s Hole pupfish (Cyprinodon diabolis Wales, 1930). It lives in an underground cave with water from a single aquifer-fed thermal pool in the Desert National Wildlife Refuge Complex in Nye County, Nevada [106]. By 2013, the wild population was recorded to have decreased to less than 40 individuals [107]. It was among the first species to be listed on the U.S. Endangered Species Act in 1967 and was the focus of a legal battle over water rights, the culmination of which was a U.S. Supreme Court decision to cease groundwater abstraction for development. Despite this protection, populations of C. diabolis have declined since 1995; one of the potential causes being increased water temperatures caused by climate change, and therefore, decreased dissolved oxygen. Projected climate change by 2050 was found to compromise the recruitment window for juvenile fish, decrease egg viability and increase larval mortality [107].
While not examined here, increasing atmospheric deposition of sulphur, nitrogen, mercury and other compounds has been shown to have adverse effects on a variety of ecosystems including lakes and streams [108,109,110,111]. Future analyses should incorporate modeled rates of atmospheric pollutant deposition on the habitats.
Another recommendation is to increase the scope of the analyses to the continental scale with a focus on small aquatic habitats outside the Great Lakes. In a systematic review of studies examining predicted and observed effects of climate change on freshwater fishes, Reference [112] found that tropical arid and semi-arid regions have been grossly understudied. Future predictions were heavily biased to the Nearctic (~75%), while the Palaearctic dominated studies examining the effect of recent climate change (~46%). Over half the published studies included at least one salmonid species, indicating a taxonomic bias. The recently recognized Ovalentaria [113,114] includes a number of the fish groups previously classified within the “perciformes” of previous authors. As currently recognized, the Ovalentaria includes an array of marine, and a few freshwater groups, among which the Cichlidae represent a major component of tropical freshwater diversity. Despite this taxonomic importance, Reference [112] highlighted a general lack of studies from tropical freshwaters. Furthermore, less than 10% of the studies focused on fishes categorized as ‘threatened with extinction’ by the IUCN. Based on the IUCN Red List version 3.1, of the species assessed, 1045 freshwater fish are considered critically endangered or endangered. Of those, climate change is a primary threat for 185 species; six are cichlids, with Cyprinidae accounting for 48.6%. When considering human-induced stressors such as agriculture, energy production, logging/wood harvesting, fishing, human intrusions, natural system modification, and pollution, 838 species have been listed as affected. Of these 143 (17.1%) are cichlids. When invasive species are considered as a major threat, 336 species have been assessed as critically endangered or endangered, of which 76 (22.6%) are cichlids. Native African species account for 33.1% of critically endangered or endangered species for which climate change, human-induced stressors, or invasive species are primary threats.

5. Conclusions

Humanity’s aggregate resource consumption has grown by 78% since 1970, leading to a sustained increase in pressure on global biodiversity [115]. For all types of freshwater ecosystems, strong negative relationships have been shown between biodiversity intactness and stressors such as human impact (e.g., LUCC) and climate change [116]. Rapid population growth in the regions surrounding the habitats studied here will lead to increased stress on the aquatic ecosystems through water abstraction and pollution of the surface waters. The minimal buffers of natural vegetation surrounding Lake Chala and Chemka Springs are insufficient to moderate water quality degradation from agricultural runoff in the long term. For Chemka Springs with the high intensity agricultural land use surrounding the springs the vegetative buffer is further insufficient to moderate water temperature changes due to projected climate change scenarios. The region encompassed by all three study areas is likely to become increasingly reliant on interannual high precipitation events to mitigate accumulated water storage deficits.
Without protection, the observed trends of decreasing natural vegetation surrounding the aquatic habitats are likely to intensify throughout Tanzania due to large population growth and resulting increases in food demands [117]. Deducing the main stressors acting upon the habitats of aquatic species may allow for the development of mitigation measures, the refinement of regional development plans, or the adoption of new paradigms in the management and protection of aquatic habitats [118]. With proper management and conservation strategies these habitats could become hydrologic refugia for endemic aquatic species [119].
We reiterate the importance of considering the unique landscape conditions surrounding relatively small ecosystems when conducting remote sensing analyses. Global models of land cover are often unable to take into account the challenges of mapping land cover at such a small scale.

Supplementary Materials

The following are available online at www.mdpi.com/2072-4292/9/6/623/s1, Video S1: Underwater video of the habitats (https://youtu.be/5BDXo8e05n0).

Acknowledgments

We thank Kisena Mollel from Dorobo Safaris as well as the Lake Natron Tented Camp staff for their help in the field. We also thank Ulrich Schliewen, Hans van Heusden and Anton Lamboj for providing information about the Cichlids and their habitats and George Leblanc, Mark Sabaj-Perez and Gary Elson for constructive comments to improve the study. We further thank the Tanzania Commission for Science and Technology (COSTECH) for research permits and the Acting Director General Dr. Mzighani from the Tanzania Fisheries Research Institute for logistical support. We appreciate the cooperation received from the Tanzania Wildlife Division in allowing us to carry out research in Lake Chala. Funding for the fieldwork was provided by the Natural Sciences and Engineering Research Council of Canada. We appreciate the comments of three anonymous reviewers, which helped to improve this manuscript.

Author Contributions

M.K., P.A., O.L., M.K.M. conceived and designed the experiments; M.K., P.A., O.L., M.K.M. participated in the fieldwork; M.K. and P.A. performed the analyses; M.K., P.A., O.L. M.K.M. wrote the paper.

Conflicts of Interest

The authors declare no conflict of interest. The funding sponsors had no role in the design of the study; in the collection, analyses, or interpretation of data; in the writing of the manuscript, and in the decision to publish the results.

References

  1. Geist, J. Integrative freshwater ecology and biodiversity conservation. Ecol. Indic. 2011, 11, 1507–1516. [Google Scholar] [CrossRef]
  2. Sundermann, A.; Gerhardt, M.; Kappes, H.; Haase, P. Stressor prioritisation in riverine ecosystems: Which environmental factors shape benthic invertebrate assemblage metrics? Ecol. Indic. 2013, 27, 83–96. [Google Scholar] [CrossRef]
  3. Bootsma, H.A.; Hecky, R.E. A comparative introduction to the biology and limnology of the African Great Lakes. J. Gt. Lakes Res. 2003, 29, 3–18. [Google Scholar] [CrossRef]
  4. Guse, B.; Kail, J.; Radinger, J.; Schroder, M.; Kiesel, J.; Hering, D.; Wolter, C.; Fohrer, N. Eco-hydrologic model cascades: Simulating land use and climate change impacts on hydrology, hydraulics and habitats for fish and macroinvertebrates. Sci. Total Environ. 2015, 533, 542–556. [Google Scholar] [CrossRef] [PubMed]
  5. Mantyka-Pringle, C.S.; Martin, T.G.; Moffatt, D.B.; Linke, S.; Rhodes, J.R. Understanding and predicting the combined effects of climate change and land-use change on freshwater macroinvertebrates and fish. J. Appl. Ecol. 2014, 51, 572–581. [Google Scholar] [CrossRef]
  6. Olden, J.D.; Hogan, Z.S.; Vander Zanden, M.J. Small fish, big fish, red fish, blue fish: Size-biased extinction risk of the world’s freshwater and marine fishes. Glob. Ecol. Biogeogr. 2007, 16, 694–701. [Google Scholar] [CrossRef]
  7. Reyolds, J.D.; Dulvy, N.K.; Roberta, C.M. Exploitation and other threats to fish conservation. In Handbook of Fish Biology and Fisheries: Volume 2; Hart, P.J.B., Reynolds, J.D., Eds.; Blackwell Publishing: Oxford, UK, 2002; pp. 319–341. [Google Scholar]
  8. Sodhi, N.S.; Brook, B.W.; Bradshaw, C.A.J. Causes and consequences of species extinctions. In Princeton Guide to Ecology; Levin, S.A., Ed.; Princeton University Press: Princeton, NJ, USA, 2009; pp. 514–520. [Google Scholar]
  9. Jelks, H.L.; Walsh, S.J.; Burkhead, N.M.; Contreras-Balderas, S.; Diaz-Pardo, E.; Hendrickson, D.A.; Lyons, J.; Mandrak, N.E.; McCormick, F.; Nelson, J.S.; et al. Conservation Status of Imperiled North American Freshwater and Diadromous Fishes. Fisheries 2008, 33, 372–407. [Google Scholar] [CrossRef]
  10. Harding, J.S.; Benfield, E.F.; Bolstad, P.V.; Helfman, G.S.; Jones, E.B.D. Stream biodiversity: The ghost of land use past. Proc. Natl. Acad. Sci. USA 1998, 95, 14843–14847. [Google Scholar] [CrossRef] [PubMed]
  11. Downing, A.S.; van Nes, E.H.; Balirwa, J.S.; Beuving, J.; Bwathondi, P.O.J.; Chapman, L.J.; Cornelissen, I.J.M.; Cowx, I.G.; Goudswaard, K.P.C.; Hecky, R.E.; et al. Coupled human and natural system dynamics as key to the sustainability of Lake Victoria’s ecosystem services. Ecol. Soc. 2014, 19. [Google Scholar] [CrossRef]
  12. Goldewijk, K.K.; Beusen, A.; van Drecht, G.; de Vos, M. The HYDE 3.1 spatially explicit database of human-induced global land-use change over the past 12,000 years. Glob. Ecol. Biogeogr. 2011, 20, 73–86. [Google Scholar] [CrossRef]
  13. Hijmans, R.J.; Cameron, S.E.; Parra, J.L.; Jones, P.G.; Jarvis, A. Very high resolution interpolated climate surfaces for global land areas. Int. J. Climatol. 2005, 25, 1965–1978. [Google Scholar] [CrossRef]
  14. Jones, P.D.; Lister, D.H.; Osborn, T.J.; Harpham, C.; Salmon, M.; Morice, C.P. Hemispheric and large-scale land-surface air temperature variations: An extensive revision and an update to 2010. J. Geophys. Res. Atmos. 2012, 117, D05127. [Google Scholar] [CrossRef]
  15. McKee, J.K.; Sciulli, P.W.; Fooce, C.D.; Waite, T.A. Forecasting global biodiversity threats associated with human population growth. Biol. Conserv. 2004, 115, 161–164. [Google Scholar] [CrossRef]
  16. Detsch, F.; Otte, I.; Appelhans, T.; Hemp, A.; Nauss, T. Seasonal and long-term vegetation dynamics from 1-km GIMMS-based NDVI time series at Mt. Kilimanjaro, Tanzania. Remote Sens. Environ. 2016, 178, 70–83. [Google Scholar] [CrossRef]
  17. Kashaigili, J.J.; Majaliwa, A.M. Integrated assessment of land use and cover changes in the Malagarasi river catchment in Tanzania. Phys. Chem. Earth 2010, 35, 730–741. [Google Scholar] [CrossRef]
  18. Kashaigili, J.J.; Mbilinyi, B.P.; McCartney, M.; Mwanuzi, F.L. Dynamics of Usangu plains wetlands: Use of remote sensing and GIS as management decision tools. Phys. Chem. Earth 2006, 31, 967–975. [Google Scholar] [CrossRef]
  19. Thieme, M.; Abell, R.; Stiassny, M.L.J.; Skelton, P.; Lehnher, B.; Teugels, G.G.; Dinerstein, E.; Kamden-Toham, A.; Burgess, N.; Olson, D. Freshwater Ecoregions of Arica and Madagascar: A Conservation Assessment; Island Press: Washington, DC, USA, 2005. [Google Scholar]
  20. Dorn, A.; Musilova, Z.; Platzer, M.; Reichwald, K.; Cellerino, A. The strange case of East African annual fishes: Aridification correlates with diversification for a savannah aquatic group? BMC Evolut. Biol. 2014, 14. [Google Scholar] [CrossRef] [PubMed]
  21. Friel, J.P.; Vigliotta, T.R. Three new species of African suckermouth catfishes, genus Chiloglanis (Siluriformes: Mochokidae), from the lower Malagarasi and Luiche rivers of western Tanzania. Zootaxa 2011, 3063, 1–21. [Google Scholar]
  22. Schedel, F.D.B.; Friel, J.P.; Schliewen, U.K. Haplochromis vanheusdeni, a new haplochromine cichlid species from the Great Ruaha River drainage, Rufiji basin, Tanzania (Teleostei, Perciformes, Cichlidae). Spixiana 2014, 37, 135–149. [Google Scholar]
  23. Schliewen, U.K. Cichlid species flocks in small Cameroonian Lakes. In Freshwater Ecoregions of Africa and Madagascar; Thieme, M., Abell, R., Stiassny, M.L.J., Skelton, P., Lehnher, B., Teugels, G.G., Dinerstein, E., Kamden Tohan, A., Burgess, N., Olson, D., Eds.; Island Press: Washington, DC, USA, 2005; pp. 58–60. [Google Scholar]
  24. Dudgeon, D.; Arthington, A.H.; Gessner, M.O.; Kawabata, Z.I.; Knowler, D.J.; Leveque, C.; Naiman, R.J.; Prieur-Richard, A.H.; Soto, D.; Stiassny, M.L.J.; et al. Freshwater biodiversity: Importance, threats, status and conservation challenges. Biol. Rev. 2006, 81, 163–182. [Google Scholar] [CrossRef] [PubMed]
  25. Parry, M.; Canziani, O.; Palutikof, J.; van der Linden, P.; Hanson, C. Climate Change 2007: Impacts, Adaptation and Vulnerability; Working Group II Contribution to the Fourth Assessment Report of the Intergovernmental Panel on Climate Change; Cambridge University Press: New York, NY USA, 2007. [Google Scholar]
  26. McDonnell, L.H.; Chapman, L.J. At the edge of the thermal window: Effects of elevated temperature on the resting metabolism, hypoxia tolerance and upper critical thermal limit of a widespread African cichlid. Conserv. Physiol. 2015, 3, 13. [Google Scholar] [CrossRef] [PubMed]
  27. Ferreira, A.; Cyrino, J.E.P.; Duarte-Neto, P.J.; Martinelli, L.A. Permeability of riparian forest strips in agricultural, small subtropical watersheds in south-eastern Brazil. Mar. Freshw. Res. 2012, 63, 1272–1282. [Google Scholar] [CrossRef]
  28. Kyriakeas, S.A.; Watzin, M.C. Effects of adjacent agricultural activities and watershed characteristics on stream macroinvertebrate communities. J. Am. Water Resour. Assoc. 2006, 42, 425–441. [Google Scholar] [CrossRef]
  29. Kasangaki, A.; Chapman, L.J.; Balirwa, J. Land use and the ecology of benthic macroinvertebrate assemblages of high-altitude rainforest streams in Uganda. Freshw. Biol. 2008, 53, 681–697. [Google Scholar] [CrossRef]
  30. Iniguez-Armijos, C.; Leiva, A.; Frede, H.G.; Hampel, H.; Breuer, L. Deforestation and Benthic Indicators: How Much Vegetation Cover Is Needed to Sustain Healthy Andean Streams? PLoS ONE 2014, 9, e105869. [Google Scholar] [CrossRef] [PubMed]
  31. Lorion, C.M.; Kennedy, B.P. Riparian forest buffers mitigate the effects of deforestation on fish assemblages in tropical headwater streams. Ecol. Appl. 2009, 19, 468–479. [Google Scholar] [CrossRef] [PubMed]
  32. Ferreira, A.; de Paula, F.R.; Ferraz, S.F.D.; Gerhard, P.; Kashiwaqui, E.A.L.; Cyrino, J.E.P.; Martinelli, L.A. Riparian coverage affects diets of characids in neotropical streams. Ecol. Freshw. Fish 2012, 21, 12–22. [Google Scholar] [CrossRef]
  33. Lorion, C.M.; Kennedy, B.P. Relationships between deforestation, riparian forest buffers and benthic macroinvertebrates in neotropical headwater streams. Freshw. Biol. 2009, 54, 165–180. [Google Scholar] [CrossRef]
  34. Rodrigues, M.E.; Roque, F.D.; Quintero, J.M.O.; Pena, J.C.D.; de Sousa, D.C.; de Marco, P. Nonlinear responses in damselfly community along a gradient of habitat loss in a savanna landscape. Biol. Conserv. 2016, 194, 113–120. [Google Scholar] [CrossRef]
  35. Roth, N.E.; Allan, J.D.; Erickson, D.L. Landscape influences on stream biotic integrity assessed at multiple spatial scales. Landsc. Ecol. 1996, 11, 141–156. [Google Scholar] [CrossRef]
  36. Brown, A.; Abell, R. Southern Eastern Rift. In Freshwater Ecoregions of Arica and Madagascar: A Conservation Assessment; Thieme, M., Abell, R., Stiassny, M.L.J., Skelton, P., Lehnher, B., Teugels, G.G., Dinerstein, E., Kamden Tohan, A., Burgess, N., Olson, D., Eds.; Island Press: Washington, DC, USA, 2005; pp. 176–180. [Google Scholar]
  37. Ellis, E.C.; Ramankutty, N. Putting people in the map: Anthropogenic biomes of the world. Front. Ecol. Environ. 2008, 6, 439–447. [Google Scholar] [CrossRef]
  38. Olaka, L.A.; Odada, E.O.; Trauth, M.H.; Olago, D.O. The sensitivity of East African rift lakes to climate fluctuations. J. Paleolimnol. 2010, 44, 629–644. [Google Scholar] [CrossRef]
  39. Jameson, R.; Wilson, J.; Murray, H. Narrative of Discovery and Adventure in Africa, from the Earliest Ages to the Present Time: With Illustrations of the Geology, Minerology and Zoology; Harper Brothers: New York, NY, USA, 1842. [Google Scholar]
  40. Ford, A.G.P.; Dasmahapatra, K.K.; Ruber, L.; Gharbi, K.; Cezard, T.; Day, J.J. High levels of interspecific gene flow in an endemic cichlid fish adaptive radiation from an extreme lake environment. Mol. Ecol. 2015, 24, 3421–3440. [Google Scholar] [CrossRef] [PubMed]
  41. Tebbs, E.J.; Remedios, J.J.; Avery, S.T.; Harper, D.M. Remote sensing the hydrological variability of Tanzania’s Lake Natron, a vital Lesser Flamingo breeding site under threat. Ecohydrol. Hydrobiol. 2013, 13, 148–158. [Google Scholar] [CrossRef]
  42. IUCN. IUCN Water and Nature Initiative Pangani Basin Water Board. Pangani Basin: A Situation Analysis, 2nd ed.; International Union for Conservation of Nature and Naturals Resources: Nairobi, Kenya, 2009. [Google Scholar]
  43. Røhr, P.C.; Killingtveit, A. Study of two catchments on the hillside of Mt. Kilimanjaro. In Water Resources Management: The Case of Pangani River Basin Issues and Approaches; Ngana, J.O., Ed.; Dar es Salaam Univesity Press: Dar es Salaam, Tanzania, 2002; pp. 211–231. [Google Scholar]
  44. Oyugi, D.; Thieme, M. Freshwater Ecoregions of Arica and Madagascar: A Conservation Assessment; Thieme, M., Abell, R., Stiassny, M.L.J., Skelton, P., Lehnher, B., Teugels, G.G., DInerstein, E., Kamden Tohan, A., Burgess, N., Olden, J.D., Eds.; Island Press: Washington, DC, USA, 2005; pp. 316–318. [Google Scholar]
  45. Van Heusden, H. Ctenochromis pectoralis: A most mysterious Tanzanian river cichlid. Cichlid News 2015, 24, 14–17. [Google Scholar]
  46. Moernaut, J.; Verschuren, D.; Charlet, F.; Kristen, I.; Fagot, M.; De Batist, M. The seismic-stratigraphic record of lake-level fluctuations in Lake Challa: Hydrological stability and change in equatorial East Africa over the last 140 kyr. Earth Planet. Sci. Lett. 2010, 290, 214–223. [Google Scholar] [CrossRef]
  47. Mulwa, J.; Mwega, B.; Kigomo, M. Hydrogeochemical analysis and evaluation of water quality in Lake Chala catchment area, Kenya. Glob. Adv. Res. J. Phys. Appl. Sci. 2013, 2, 1–7. [Google Scholar]
  48. Misana, S.B.; Sokoni, C.; Mbonile, M.J. Land-use/cover changes and their drivers on the slopes of Mount Kilimanjaro, Tanzania. J. Geogr. Reg. Plan. 2012, 5, 151–164. [Google Scholar]
  49. Wolff, C.; Kristen-Jenny, I.; Schettler, G.; Plessen, B.; Meyer, H.; Dulski, P.; Naumann, R.; Brauer, A.; Verschuren, D.; Haug, G.H. Modern seasonality in Lake Chala (Kenya/Tanzania) and its sedimentary documentation in recent lake sediments. Limnol. Oceanogr. 2014, 59, 1621–1636. [Google Scholar] [CrossRef]
  50. Payne, B.R. Water balance of Lake Chala and its relation to groundwater from tritium and stable isotope data. J. Hydrol. 1970, 11, 47–58. [Google Scholar] [CrossRef]
  51. Musyoki, M.M. The Situation Analysis of the Kenyan Part of the Pangani River Basin Catchment: The Lake Jipe Watershed and System; Coastal Development Authority: Mombasa, Kenya, 2003.
  52. Dieleman, J.; van Bocxlaer, B.; Manntschke, C.; Nyingi, D.W.; Adriaens, D.; Verschuren, D. Tracing functional adaptation in African cichlid fishes through morphometric analysis of fossil teeth: Exploring the methods. Hydrobiologia 2015, 755, 73–88. [Google Scholar] [CrossRef]
  53. Hermann, C.M.; Sefc, K.M.; Koblmuller, S. Ancient origin and recent divergence of a haplochromine cichlid lineage from isolated water bodies in the East African Rift system. J. Fish Biol. 2011, 79, 1356–1369. [Google Scholar] [CrossRef] [PubMed]
  54. Trewavas, E. Tilapiine Fishes of the Genera Sarotherodon, Oreochromis and Danakilia; British Museum of Natural History: London, UK, 1983. [Google Scholar]
  55. Sun, W.; Chen, B.; Messinger, D.W. Nearest-neighbor diffusion-based pan-sharpening algorithm for spectral images. Opt. Eng. 2014, 53, 013107. [Google Scholar] [CrossRef]
  56. Richey, A.S.; Thomas, B.F.; Lo, M.H.; Reager, J.T.; Famiglietti, J.S.; Voss, K.; Swenson, S.; Rodell, M. Quantifying renewable groundwater stress with GRACE. Water Resour. Res. 2015, 51, 5217–5238. [Google Scholar] [CrossRef] [PubMed]
  57. Swenson, S.; Wahr, J. Monitoring the water balance of Lake Victoria, East Africa, from space. J. Hydrol. 2009, 370, 163–176. [Google Scholar] [CrossRef]
  58. Becker, M.; Llovel, W.; Cazenave, A.; Guntner, A.; Cretaux, J.F. Recent hydrological behavior of the East African great lakes region inferred from GRACE, satellite altimetry and rainfall observations. C. R. Geosci. 2010, 342, 223–233. [Google Scholar] [CrossRef]
  59. Watkins, M.M.; Wiese, D.N.; Yuan, D.N.; Boening, C.; Landerer, F.W. Improved methods for observing Earth’s time variable mass distribution with GRACE using spherical cap mascons. J. Geophys. Res. Solid Earth 2015, 120, 2648–2671. [Google Scholar] [CrossRef]
  60. Wiese, D.N.; Yuan, D.N.; Boening, C.; Landerer, F.W.; Watkins, M.M. Mascon Ocean, Ice, and Hydrology Equivalent Water Height RL05M.1 CRI Filtered Version 2. Ver. 2. PO.DAAC, CA, USA. 2015. Available online: http://dx.doi.org/10.5067/TEMSC-2LCR5 (accessed on 27 October 2016).
  61. Rodell, M.; Famiglietti, J.S. Detectability of variations in continental water storage from satellite observations of the time dependent gravity field. Water Resour. Res. 1999, 35, 2705–2723. [Google Scholar] [CrossRef]
  62. World Bank. Population Estimates and Projections. Available online: http://datatopics.worldbank.org/hnp/popestimates (accessed on 27 October 2016).
  63. Hansen, J.; Russell, G.; Rind, D.; Stone, P.; Lacis, A.; Lebedeff, S.; Ruedy, R.; Travis, L. Efficient Three-Dimensional Global Models for Climate Studies: Models I and II. Mon. Weather Rev. 1983, 111, 609–662. [Google Scholar] [CrossRef]
  64. Miller, R.L.; Schmidt, G.A.; Nazarenko, L.S.; Tausnev, N.; Bauer, S.E.; DelGenio, A.D.; Kelley, M.; Lo, K.K.; Ruedy, R.; Shindell, D.T.; et al. CMIP5 historical simulations (1850–2012) with GISS ModelE2. J. Adv. Model. Earth Syst. 2014, 6, 441–477. [Google Scholar] [CrossRef]
  65. Van Vuuren, D.P.; Edmonds, J.; Kainuma, M.; Riahi, K.; Thomson, A.; Hibbard, K.; Hurtt, G.C.; Kram, T.; Krey, V.; Lamarque, J.-F.; et al. The representative concentration pathways: An overview. Clim. Chang. 2011, 109, 5. [Google Scholar] [CrossRef]
  66. Sanford, T.; Frumhoff, P.C.; Luers, A.; Gulledge, J. The climate policy narrative for a dangerously warming world. Nat. Clim. Chang. 2014, 4, 164–166. [Google Scholar] [CrossRef]
  67. Osborn, T.J.; Jones, P.G. The CRUTEM4 land-surface air temperature dataset: Construction, previous versions and dissemination via Google Earth. Earth Syst. Sci. Data 2014, 6, 61–68. [Google Scholar] [CrossRef]
  68. Zhu, Z.; Woodcock, C.E. Automated cloud, cloud shadow, and snow detection in multitemporal Landsat data: An algorithm designed specifically for monitoring land cover change. Remote Sens. Environ. 2014, 152, 217–234. [Google Scholar] [CrossRef]
  69. Rufin, P.; Muller, H.; Pflugmacher, D.; Hostert, P. Land use intensity trajectories on Amazonian pastures derived from Landsat time series. Int. J. Appl. Earth Obs. Geoinf. 2015, 41, 1–10. [Google Scholar] [CrossRef]
  70. Crist, E.P. ATM tasseled cap equivalent transformation for reflectance factor data. Remote Sens. Environ. 1985, 17, 301–306. [Google Scholar] [CrossRef]
  71. Baig, M.H.A.; Zhang, L.F.; Shuai, T.; Tong, Q.X. Derivation of a tasselled cap transformation based on Landsat 8 at-satellite reflectance. Remote Sens. Lett. 2014, 5, 423–431. [Google Scholar] [CrossRef]
  72. Kruse, F.A.; Lefkoff, A.B.; Boardman, J.W.; Heidebrecht, K.B.; Shapiro, A.T.; Barloon, P.J.; Goetz, A.F.H. The spectral image-processing system (SIPS)—Interactive visualization and analysis of imaging spectrometer data. Remote Sens. Environ. 1993, 44, 145–163. [Google Scholar] [CrossRef]
  73. Olofsson, P.; Foody, G.M.; Herold, M.; Stehman, S.V.; Woodcock, C.E.; Wulder, M.A. Good practices for estimating area and assessing accuracy of land change. Remote Sens. Environ. 2014, 148, 42–57. [Google Scholar] [CrossRef]
  74. McGarigal, K.; Cushman, S.A.; Ene, E. FRAGSTATS v4: Spatial Pattern Analysis Program for Categorical and Continuous Maps. Computer Software Program Produced by the Authors at the University of Massachusetts, Amherst. Available online: http://www.umass.edu/landeco/research/fragstats/fragstats.html2012 (accessed on 14 August 2015).
  75. Hopkins, R.L.; Whiles, M.R. The importance of land use/land cover data in fish and mussel conservation planning. Ann. Limnol.-Int. J. Limnol. 2011, 47, 199–209. [Google Scholar] [CrossRef]
  76. Nagy, R.C.; Porder, S.; Neill, C.; Brando, P.; Quintino, R.M.; do Nascimento, S.A. Structure and composition of altered riparian forests in an agricultural Amazonian landscape. Ecol. Appl. 2015, 25, 1725–1738. [Google Scholar] [CrossRef] [PubMed]
  77. Qiu, J.X.; Turner, M.G. Importance of landscape heterogeneity in sustaining hydrologic ecosystem services in an agricultural watershed. Ecosphere 2015, 6, 19. [Google Scholar] [CrossRef]
  78. Wang, L.Z.; Lyons, J.; Kanehl, P.; Gatti, R. Influences of watershed land use on habitat quality and biotic integrity in Wisconsin streams. Fisheries 1997, 22, 6–12. [Google Scholar] [CrossRef]
  79. Heller, E.; Rhemtulla, J.M.; Lele, S.; Kalacska, M.; Badiger, S.; Sengupta, R.; Ramankutty, N. Mapping Crop Types, Irrigated Areas, and Cropping Intensities in Heterogeneous Landscapes of Southern India Using Multi-Temporal Medium-Resolution Imagery: Implications for Assessing Water Use in Agriculture. Photogramm. Eng. Remote Sens. 2012, 78, 815–827. [Google Scholar] [CrossRef]
  80. Hawes, E.; Smith, M. Riparian Buffer Zones: Functions and Recommended Widths; Yale School of Forestry and Environmental Studies: New Haven, CT, USA, 1995. [Google Scholar]
  81. Hansen, B.; Reich, P.; Lake, P.S.; Cavagnaro, T. Minimum Width Requirements for Riparian Zones to Protect Flowing Waters and to Conserve Biodiversity: A Review and Recommendations; Monash University: Melbourne, Australia, 2010. [Google Scholar]
  82. Behera, S.K.; Luo, J.J.; Masson, S.; Delecluse, P.; Gualdi, S.; Navarra, A.; Yamagata, T. Paramount impact of the Indian Ocean dipole on the East African short rains: A CGCM study. J. Clim. 2005, 18, 4514–4530. [Google Scholar] [CrossRef]
  83. Nanteza, J.; de Linage, C.R.; Thomas, B.F.; Famiglietti, J.S. Monitoring groundwater storage changes in complex basement aquifers: An evaluation of the GRACE satellites over East Africa. Water Resour. Res. 2016, 52, 9542–9564. [Google Scholar] [CrossRef]
  84. Vörösmarty, C.J.; McIntyre, P.B.; Gessner, M.O.; Dudgeon, D.; Prusevich, A.; Green, P.; Glidden, S.; Bunn, S.E.; Sullivan, C.A.; Liermann, C.R.; et al. Global threats to human water security and river biodiversity. Nature 2010, 467, 555–561. [Google Scholar] [CrossRef] [PubMed]
  85. Watson, J.E.M.; Iwamura, T.; Butt, N. Mapping vulnerability and conservation adaptation strategies under climate change. Nat. Clim. Chang. 2013, 3, 989–994. [Google Scholar] [CrossRef]
  86. Johnston, I.A.; Eddy, F.B.; Maloiy, G.M.O. The effects of temperature on muscle pH, adenylate and phosphogen concentrations in Oreochromis-alcalicus-grahami, a fish adapted to an alkaline hot-spring. J. Fish Biol. 1983, 23, 717–724. [Google Scholar] [CrossRef]
  87. Wood, C.M.; Brix, K.V.; de Boeck, G.; Bergman, H.L.; Bianchini, A.; Bianchini, L.F.; Maina, J.N.; Johannsson, O.E.; Kavembe, G.D.; Papah, M.B.; et al. Mammalian metabolic rates in the hottest fish on earth. Sci. Rep. 2016, 6, 26990. [Google Scholar] [CrossRef] [PubMed]
  88. Stiassny, M.L.J.; de Marchi, G.; Lamboj, A. A new species of Danakilia (Teleostei, Cichlidae) from Lake Abaeded in the Danakil Depression of Eritrea (East Africa). Zootaxa 2010, 2690, 43–52. [Google Scholar]
  89. Coad, B. A new genus and species of cichlid endemic to southern Iran. Copeia 1982, 1, 28–37. [Google Scholar] [CrossRef]
  90. McNab, B.K. The Physiological Ecology of Vertebrates: A View from Energetics; Cornell University Press: Ithaca, NY, USA, 2002. [Google Scholar]
  91. Portner, H.O. Oxygen- and capacity-limitation of thermal tolerance: A matrix for integrating climate-related stressor effects in marine ecosystems. J. Exp. Biol. 2010, 213, 881–893. [Google Scholar] [CrossRef] [PubMed]
  92. Portner, H.O.; Peck, M.A. Climate change effects on fishes and fisheries: Towards a cause-and-effect understanding. J. Fish Biol. 2010, 77, 1745–1779. [Google Scholar] [CrossRef] [PubMed]
  93. Tewksbury, J.J.; Huey, R.B.; Deutsch, C.A. Ecology—Putting the heat on tropical animals. Science 2008, 320, 1296–1297. [Google Scholar] [CrossRef] [PubMed]
  94. Deutsch, C.A.; Tewksbury, J.J.; Huey, R.B.; Sheldon, K.S.; Ghalambor, C.K.; Haak, D.C.; Martin, P.R. Impacts of climate warming on terrestrial ectotherms across latitude. Proc. Natl. Acad. Sci. USA 2008, 105, 6668–6672. [Google Scholar] [CrossRef] [PubMed]
  95. Brown, J.H. On the relationship between abundance and distribution of species. Am. Nat. 1984, 124, 255–279. [Google Scholar] [CrossRef]
  96. Lawton, R.J.; Pratchett, M.S. Influence of dietary specialization and resource availability on geographical variation in abundance of butterflyfish. Ecol. Evol. 2012, 2, 1347–1361. [Google Scholar] [CrossRef] [PubMed]
  97. Canonico, G.C.; Arthington, A.; McCrary, J.K.; Thieme, M.L. The effects of introduced tilapias on native biodiversity. Aquat. Conserv.-Mar. Freshw. Ecosyst. 2005, 15, 463–483. [Google Scholar] [CrossRef]
  98. Spataru, P. Food and feeding-habits of Tilapia-zillii (gervais) (cichlidae) in Lake Kinneret (Israel). Aquaculture 1978, 14, 327–338. [Google Scholar] [CrossRef]
  99. Johnston, C.E.; Henderson, A.R.; Hartup, W.W. Precipitous decline and conservation of Slackwater Darter (Etheostoma boschungi) in tributaries of the Tennessee River, Tennessee and Alabama. Biodivers. Conserv. 2013, 22, 3247–3259. [Google Scholar] [CrossRef]
  100. Kadarusman; Sudarto; Paradis, E.; Pouyaud, L. Description of Melanotaenia fasinensis, a new species of rainbowfish (Melanotaeniidae) from West Papua, Indonesia with comments on the rediscovery of M. ajamaruensis and the endangered status of M. parva. Cybium 2010, 34, 207–215. [Google Scholar]
  101. Nicol, S.; Haynes, T.B.; Fensham, R.; Kerezsy, A. Quantifying the impact of Gambusia holbrooki on the extinction risk of the critically endangered red-finned blue-eye. Ecosphere 2015, 6, 41. [Google Scholar] [CrossRef]
  102. Griffiths, D.; McGonigle, C.; Quinn, R. Climate and species richness patterns of freshwater fish in North America and Europe. J. Biogeogr. 2014, 41, 452–463. [Google Scholar] [CrossRef]
  103. Nilsson, C.; Reidy, C.A.; Dynesius, M.; Revenga, C. Fragmentation and flow regulation of the world’s large river systems. Science 2005, 308, 405–408. [Google Scholar] [CrossRef] [PubMed]
  104. Ogutuohwayo, R. The decline of the native fishes of Lakes Victoria and Kyoga (East-Africa) and the impact of introduced species, especially the nile perch, Lates-niloticus, and the nile tilapia, Oreochromis-niloticus. Environ. Biol. Fishes 1990, 27, 81–96. [Google Scholar] [CrossRef]
  105. Raghavan, R.; Das, S.; Nameer, P.O.; Bijukumar, A.; Dahanukar, N. Protected areas and imperilled endemic freshwater biodiversity in the Western Ghats Hotspot. Aquat. Conserv.-Mar. Freshw. Ecosyst. 2016, 26, 78–90. [Google Scholar] [CrossRef]
  106. Beissinger, S.R. Digging the pupfish out of its hole: Risk analyses to guide harvest of Devils Hole pupfish for captive breeding. PeerJ 2014, 2, e549. [Google Scholar] [CrossRef] [PubMed]
  107. Hausner, M.B.; Wilson, K.P.; Gaines, D.B.; Suarez, F.; Scoppettone, G.G.; Tyler, S.W. Life in a fishbowl: Prospects for the endangered Devils Hole pupfish (Cyprinodon diabolis) in a changing climate. Water Resour. Res. 2014, 50, 7020–7034. [Google Scholar] [CrossRef]
  108. Fan, J.L.; Xu, Y.H.; Chen, Z.M.; Xiao, J.; Liu, D.Y.; Luo, J.F.; Bolan, N.; Ding, W.X. Sulfur deposition suppressed nitrogen-induced soil N2O emission from a subtropical forestland in southeastern China. Agric. For. Meteorol. 2017, 233, 163–170. [Google Scholar] [CrossRef]
  109. Williams, J.J.; Chung, S.H.; Johansen, A.M.; Lamb, B.K.; Vaughan, J.K.; Beutel, M. Evaluation of atmospheric nitrogen deposition model performance in the context of US critical load assessments. Atmos. Environ. 2017, 150, 244–255. [Google Scholar] [CrossRef]
  110. Sawicka, K.; Rowe, E.C.; Evans, C.D.; Monteith, D.T.; Vanguelova, E.I.; Wade, A.J.; Clark, J.M. Modelling impacts of atmospheric deposition and temperature on long-term DOC trends. Sci. Total Environ. 2017, 578, 323–336. [Google Scholar] [CrossRef] [PubMed]
  111. Nasr, M.; Arp, P.A. Mercury and Organic Matter Concentrations in Lake and Stream Sediments in relation to One Another and to Atmospheric Mercury Deposition and Climate Variations across Canada. J. Chem. 2017, 2017, 8949502. [Google Scholar] [CrossRef]
  112. Comte, L.; Buisson, L.; Daufresne, M.; Grenouillet, G. Climate-induced changes in the distribution of freshwater fish: Observed and predicted trends. Freshw. Biol. 2013, 58, 625–639. [Google Scholar] [CrossRef]
  113. Betancur-R, R.; Broughton, R.E.; Wiley, E.O.; Carpenter, K.; López, J.A.; Li, C.; Holcroft, N.I.; Arcila, D.; Sanciangco, M.; Cureton, I.I.J.C.; et al. The Tree of Life and a New Classification of Bony Fishes. PLoS Curr. 2013. [Google Scholar] [CrossRef] [PubMed]
  114. Wainwright, P.C.; Smith, W.L.; Price, S.A.; Tang, K.L.; Sparks, J.S.; Ferry, L.A.; Kuhn, K.L.; Eytan, R.I.; Near, T.J. The Evolution of Pharyngognathy: A Phylogenetic and Functional Appraisal of the Pharyngeal Jaw Key Innovation in Labroid Fishes and Beyond. Syst. Biol. 2012, 61, 1001–1027. [Google Scholar] [CrossRef] [PubMed]
  115. Butchart, S.H.M.; Walpole, M.; Collen, B.; van Strien, A.; Scharlemann, J.P.W.; Almond, R.E.A.; Baillie, J.E.M.; Bomhard, B.; Brown, C.; Bruno, J.; et al. Global Biodiversity: Indicators of Recent Declines. Science 2010, 328, 1164–1168. [Google Scholar] [CrossRef] [PubMed]
  116. Janse, J.H.; Kuiper, J.J.; Weijters, M.J.; Westerbeek, E.P.; Jeuken, M.; Bakkenes, M.; Alkemade, R.; Mooij, W.M.; Verhoeven, J.T.A. GLOBIO-Aquatic, a global model of human impact on the biodiversity of inland aquatic ecosystems. Environ. Sci. Policy 2015, 48, 99–114. [Google Scholar] [CrossRef]
  117. Zinkina, J.; Korotayev, A. Explosive population growth in tropical Africa: Crucial omission in development forecasts – emerging risks and way out. World Futures 2014, 70, 120–139. [Google Scholar] [CrossRef]
  118. Juffe-Bignoli, D.; Harrison, I.; Butchart, S.H.M.; Flitcroft, R.; Hermoso, V.; Jonas, H.; Lukasiewicz, A.; Thieme, M.; Turak, E.; Bingham, H.; et al. Achieving Aichi Biodiversity Target 11 to improve the performance of protected areas and conserve freshwater biodiversity. Aquat. Conserv.-Mar. Freshw. Ecosyst. 2016, 26, 133–151. [Google Scholar] [CrossRef]
  119. McLaughlin, B.C.; Ackerly, D.D.; Klos, P.Z.; Natali, J.; Dawson, T.E. Hydrologic refugia, plants, and climate change. Glob. Chang. Biol. 2017. [Google Scholar] [CrossRef] [PubMed]
Figure 1. Map of the study areas in Northern Tanzania. Blue circles represent the locations of the study areas at Lake Natron Springs, Chemka Springs, and Lake Chala. Other important points of references such as Mt. Kilimanjaro, Mt. Meru, Lake Manyara, the town of Bomang’ombe, Nyumba ya Mungu Dam and the city of Arusha are also illustrated.
Remotesensing 09 00623 g001
Figure 2. Photographs of the fishes and their habitats. (A) Lake Natron Springs with flamingoes and Lake Natron in the background; (B) Shallow Alcolapia habitat on the Eastern side of Lake Natron; (C) Spawning pair of A. alcalicus; (D) Male A. latilibris scraping algae off substrate; (E) Sparring male A. ndalalani; (F) Chemka Springs; (G) Clear water of Chemka Springs; (H) Ctenochromis sp. with Garra sp. grazing algae; (I) Courting male Ctenochromis sp.; (J) Female Ctenochromis sp.; (K) Lake Chala; (L) Introduced Coptodon rendalli; (M) Male Haplochromis sp.; (N) Haplochromis sp. in the clear water of Lake Chala.
Remotesensing 09 00623 g002
Figure 3. Natural land cover classes surrounding the freshwater habitats. (A) Lake Natron Springs: grass and trona; (B) Chemka Springs: closed canopy Riparian forest (C) Lake Chala: bushland.
Remotesensing 09 00623 g003
Figure 4. Dates of Landsat TM, ETM+, and OLI used in the analysis.
Remotesensing 09 00623 g004
Figure 5. Example of a false color composite (FCC), a tasseled cap transform (TC) and 31 year cloud mask (black) for the three study areas. (A) Lake Natron FCC; (B) Lake Natron TC; (C) Lake Natron cloud mask; (D) Chemka Springs FCC; (E) Chemka Springs TC; (F) Chemka Springs cloud mask; (G) Lake Chala FCC; (H) Lake Chala TC; (I) Lake Chala cloud mask.
Remotesensing 09 00623 g005
Figure 6. Example of the tasseled cap time sequence for the Lake Chala study area. The differences between the natural land cover class (bushland) and modified classes of agriculture and mixed land use are illustrated.
Remotesensing 09 00623 g006
Figure 7. Extent of the natural land cover classes (i.e., bushland at Lake Chala and closed canopy forest at Chemka Springs) surrounding the freshwater habitats for Lake Chala and Chemka Springs. (A) Lake Chala, 1987; (B) Lake Chala, 1995; (C) Lake Chala, 2000; (D) Lake Chala, 2015; (E) Chemka Springs, 1995; (F) Chemka Springs, 2015. For Lake Chala, the border between Tanzania and Kenya is shown in purple.
Remotesensing 09 00623 g007
Figure 8. Natural vegetation patch size distributions for Lake Chala and Chemka Springs.
Remotesensing 09 00623 g008
Figure 9. GRACE satellite derived time series of water equivalent height (cm) for the mascon encompassing (A) Lake Natron and; (B) Chemka Springs and Lake Chala; (C) Mascon grid cells representing water equivalent height from March 2015.
Remotesensing 09 00623 g009
Figure 10. Changes in cropland extent and agriculture (rainfed and irrigated) for the (A) Natron and (B) Chemka/Chala mascons. Mean population density for the two mascons is also shown. The area covered by the mascons is illustrated in Figure 9.
Remotesensing 09 00623 g010
Table 1. Descriptions of endemic cichlids from the three study areas.
SiteSpeciesBrief Description
Natron SpringsAlcolapia alcalicus. Formerly Oreochromis alcalicus. Species authority: Hilgendorf, 1905.Physiological adaptions to extreme habitat conditions, including ureotelism, specialized gills, high intracellular pH, trifurcated esophagus, and facultative air-breathing. Generalist, up to 16 cm total length (TL), terminal mouth for feeding on algae and insect larvae. Mouth brooding, breeds in large high walled crater nests. IUCN Red List: Endangered. Potential area of occupancy <10 km2.
Natron SpringsAlcolapia ndalalani. Formerly O. ndalalani. Species authority: Seegers & Tichy, 1999.Physiological adaptions to extreme habitat conditions, including ureotelism, specialized gills, high intracellular pH, trifurcated esophagus and facultative air-breathing. Specialist, up to 8 cm TL, subterminal thin-lipped mouth used to pick algae and insect larvae. Mouth brooding, male defends a single fist sized boulder or elevation. IUCN Red List: Vulnerable. Potential area of occupancy < 10 km2.
Natron SpringsAlcolapia latilabris. Formerly O. latilabris. Species authority: Seegers & Tichy, 1999.Physiological adaptions to extreme habitat conditions, including ureotelism, specialized gills, high intracellular pH, trifurcated esophagus, and facultative air-breathing. Specialist, up to 12 cm TL, mouth brooding, algae grazer with hypertrophied lips, breeds in crater nests consisting of two concentric low walls. IUCN Red List: Vulnerable. Potential area of occupancy <10 km2.
Chemka SpringsCtenochromis sp. (undescribed).Potential area of occupancy <1 km2. Closely related to C. pectoralis (Pfeffer, 1893), described from the Pangani River further downstream. Up to 12 cm TL, mouth brooding, feeds on snails and micro invertebrates. Dominant males excavate large crater nests (up to 60 cm in diameter) under large boulders. IUCN Red List: Not assessed.
Lake ChalaOreochromis hunter. Species authority: Günther, 1889.This is the type species of the genus Oreochromis. It is known from only a few specimens, and little is known about its reproduction and breeding habits. Young O. hunteri feed on algae and organic debris [54]. Tooth morphology suggests aufwuchs (small animals, plants and algae that adhere to open surfaces) form a part of their diet [52]. IUCN Red List: Critically endangered.
Table 2. Natural vegetation fragmentation statistics for Lake Chala and Chemka Springs. Values for total class area (CA), percentage of the class in the landscape (PLAND), largest patch index (LPI), landscape shape index (LSI), and clumpiness (CLUMPY) are shown. The ‘natural’ land cover classes examined are bushland for Lake Chala and closed canopy tree stand for Chemka Springs.
Site/PeriodNo. PatchesMean Patch Area (ha)Patch Standard Deviation (ha)CA (ha)PLAND (%)LPI (%)LSICLUMPY
Lake Chala, 198722334.2419.77633.315.512.724.90.90
Lake Chala, 199520318.2112.03695.37.53.122.20.89
Lake Chala, 20005264.949.32595.35.32.328.80.83
Lake Chala, 20156227.8180.01726.13.52.911.50.92
Chemka Springs, 19951941.54.3281.87.41.220.60.61
Chemka Springs, 20151040.91.595.72.50.315.70.52

