Next Issue
Volume 8, June
Previous Issue
Volume 8, April
 
 
remotesensing-logo

Journal Browser

Journal Browser

Remote Sens., Volume 8, Issue 5 (May 2016) – 84 articles

Cover Story (view full-size image): 
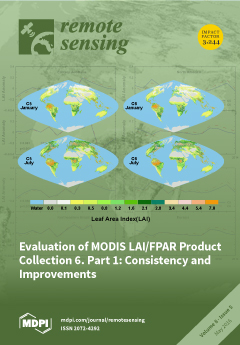
Leaf Area Index (LAI) and Fraction of Photosynthetically Active Radiation absorbed by vegetation (FPAR) are important parameters in most global models. Global LAI/FPAR products were generated using measurements from Moderate Resolution Imaging Spectroradiometer (MODIS) instruments from 2000.
The science team aims to refine the datasets by updating product cohorts. Collection 6 (C6), as the latest version, has been distributed since 2015. We compare C6 and C5 to check for consistency and discuss the improvements of C6. Global and seasonal comparisons indicate good continuity and consistency for all biome types.
Moreover, inter-annual anomalies of C5 and C6 at regional scale agree well, which imbues confidence in the new dataset. C6 benefits from the improved calibration algorithm which reduces the sensor degradation effect. Thus, some C5-based analysis should be revisited using C6 data. View this paper
  • Issues are regarded as officially published after their release is announced to the table of contents alert mailing list.
  • You may sign up for e-mail alerts to receive table of contents of newly released issues.
  • PDF is the official format for papers published in both, html and pdf forms. To view the papers in pdf format, click on the "PDF Full-text" link, and use the free Adobe Reader to open them.
Order results
Result details
Section
Select all
Export citation of selected articles as:
9396 KiB  
Article
Error-Component Analysis of TRMM-Based Multi-Satellite Precipitation Estimates over Mainland China
by Bin Yong, Bo Chen, Yudong Tian, Zhongbo Yu and Yang Hong
Remote Sens. 2016, 8(5), 440; https://doi.org/10.3390/rs8050440 - 23 May 2016
Cited by 56 | Viewed by 6790
Abstract
The Tropical Rainfall Measuring Mission (TRMM) Multi-Satellite Precipitation Analysis (TMPA) products have been widely used, but their error and uncertainty characteristics over diverse climate regimes still need to be quantified. In this study, we focused on a systematic evaluation of TMPA’s error characteristics [...] Read more.
The Tropical Rainfall Measuring Mission (TRMM) Multi-Satellite Precipitation Analysis (TMPA) products have been widely used, but their error and uncertainty characteristics over diverse climate regimes still need to be quantified. In this study, we focused on a systematic evaluation of TMPA’s error characteristics over mainland China, with an improved error-component analysis procedure. We performed the analysis for both the TMPA real-time and research product suite at a daily scale and 0.25° × 0.25° resolution. Our results show that, in general, the error components in TMPA exhibit rather strong regional and seasonal differences. For humid regions, hit bias and missed precipitation are the two leading error sources in summer, whereas missed precipitation dominates the total errors in winter. For semi-humid and semi-arid regions, the error components of two real-time TMPA products show an evident topographic dependency. Furthermore, the missed and false precipitation components have the similar seasonal variation but they counter each other, which result in a smaller total error than the individual components. For arid regions, false precipitation is the main problem in retrievals, especially during winter. On the other hand, we examined the two gauge-correction schemes, i.e., climatological calibration algorithm (CCA) for real-time TMPA and gauge-based adjustment (GA) for post-real-time TMPA. Overall, our results indicate that the upward adjustments of CCA alleviate the TMPA’s systematic underestimation over humid region but, meanwhile, unfavorably increased the original positive biases over the Tibetan plateau and Tianshan Mountains. In contrast, the GA technique could substantially improve the error components for local areas. Additionally, our improved error-component analysis found that both CCA and GA actually also affect the hit bias at lower rain rates (particularly for non-humid regions), as well as at higher ones. Finally, this study recommends that future efforts should focus on improving hit bias of humid regions, false error of arid regions, and missed snow events in winter. Full article
(This article belongs to the Special Issue Uncertainties in Remote Sensing)
Show Figures

Graphical abstract

19404 KiB  
Article
Mass Flux Solution in the Tibetan Plateau Using Mascon Modeling
by Tianyi Chen, Yunzhong Shen and Qiujie Chen
Remote Sens. 2016, 8(5), 439; https://doi.org/10.3390/rs8050439 - 23 May 2016
Cited by 9 | Viewed by 5435
Abstract
Mascon modeling is used in this paper to produce the mass flux solutions in the Tibetan Plateau. In the mascon modeling, the pseudo observations and their covariance matrices are derived from the GRACE monthly gravity field models. The sampling density of the pseudo [...] Read more.
Mascon modeling is used in this paper to produce the mass flux solutions in the Tibetan Plateau. In the mascon modeling, the pseudo observations and their covariance matrices are derived from the GRACE monthly gravity field models. The sampling density of the pseudo observations is determined based on the eigenvalues of the covariance matrices. In the Tibetan Plateau, the sampling density of per 1.5° is the most appropriate among all choices. The mass flux variations from 2003 to 2014 are presented in this paper, which show large mass loss (about −15.5 Gt/year) in Tianshan, North India, and Eastern Himalaya, as well as strong positive signals (about 9 Gt/year) in the Inner Tibetan Plateau. After the glacier isostatic adjustment effects from Pau-5-AUT model are removed, the mass change rates in the Tibetan Plateau derived from CSR RL05, JPL RL05, GFZ RL05a, and Tongji-GRACE02 monthly models are −6.41 ± 4.74 Gt/year, −5.87 ± 4.88 Gt/year, −6.08 ± 4.65 Gt/year, and −11.50 ± 4.79 Gt/year, respectively, which indicate slight mass loss in this area. Our results confirm that mascon modeling is efficient in the recovery of time-variable gravity signals in the Tibetan Plateau. Full article
(This article belongs to the Special Issue Remote Sensing in Tibet and Siberia)
Show Figures

Graphical abstract

4939 KiB  
Article
Hierarchical Coding Vectors for Scene Level Land-Use Classification
by Hang Wu, Baozhen Liu, Weihua Su, Wenchang Zhang and Jinggong Sun
Remote Sens. 2016, 8(5), 436; https://doi.org/10.3390/rs8050436 - 23 May 2016
Cited by 46 | Viewed by 5714
Abstract
Land-use classification from remote sensing images has become an important but challenging task. This paper proposes Hierarchical Coding Vectors (HCV), a novel representation based on hierarchically coding structures, for scene level land-use classification. We stack multiple Bag of Visual Words (BOVW) coding layers [...] Read more.
Land-use classification from remote sensing images has become an important but challenging task. This paper proposes Hierarchical Coding Vectors (HCV), a novel representation based on hierarchically coding structures, for scene level land-use classification. We stack multiple Bag of Visual Words (BOVW) coding layers and one Fisher coding layer to develop the hierarchical feature learning structure. In BOVW coding layers, we extract local descriptors from a geographical image with densely sampled interest points, and encode them using soft assignment (SA). The Fisher coding layer encodes those semi-local features with Fisher vectors (FV) and aggregates them to develop a final global representation. The graphical semantic information is refined by feeding the output of one layer into the next computation layer. HCV describes the geographical images through a high-level representation of richer semantic information by using a hierarchical coding structure. The experimental results on the 21-Class Land Use (LU) and RSSCN7 image databases indicate the effectiveness of the proposed HCV. Combined with the standard FV, our method (FV + HCV) achieves superior performance compared to the state-of-the-art methods on the two databases, obtaining the average classification accuracy of 91.5% on the LU database and 86.4% on the RSSCN7 database. Full article
Show Figures

Graphical abstract

5317 KiB  
Article
Impact of Satellite Remote Sensing Data on Simulations of Coastal Circulation and Hypoxia on the Louisiana Continental Shelf
by Dong S. Ko, Richard W. Gould, Bradley Penta and John C. Lehrter
Remote Sens. 2016, 8(5), 435; https://doi.org/10.3390/rs8050435 - 23 May 2016
Cited by 5 | Viewed by 7375
Abstract
We estimated surface salinity flux and solar penetration from satellite data, and performed model simulations to examine the impact of including the satellite estimates on temperature, salinity, and dissolved oxygen distributions on the Louisiana continental shelf (LCS) near the annual hypoxic zone. Rainfall [...] Read more.
We estimated surface salinity flux and solar penetration from satellite data, and performed model simulations to examine the impact of including the satellite estimates on temperature, salinity, and dissolved oxygen distributions on the Louisiana continental shelf (LCS) near the annual hypoxic zone. Rainfall data from the Tropical Rainfall Measurement Mission (TRMM) were used for the salinity flux, and the diffuse attenuation coefficient (Kd) from Moderate Resolution Imaging Spectroradiometer (MODIS) were used for solar penetration. Improvements in the model results in comparison with in situ observations occurred when the two types of satellite data were included. Without inclusion of the satellite-derived surface salinity flux, realistic monthly variability in the model salinity fields was observed, but important inter-annual variability was missed. Without inclusion of the satellite-derived light attenuation, model bottom water temperatures were too high nearshore due to excessive penetration of solar irradiance. In general, these salinity and temperature errors led to model stratification that was too weak, and the model failed to capture observed spatial and temporal variability in water-column vertical stratification. Inclusion of the satellite data improved temperature and salinity predictions and the vertical stratification was strengthened, which improved prediction of bottom-water dissolved oxygen. The model-predicted area of bottom-water hypoxia on the Louisiana shelf, an important management metric, was substantially improved in comparison to observed hypoxic area by including the satellite data. Full article
(This article belongs to the Special Issue Remote Sensing in Coastal Environments)
Show Figures

Graphical abstract

4536 KiB  
Article
Mapping Paddy Rice in China in 2002, 2005, 2010 and 2014 with MODIS Time Series
by Kersten Clauss, Huimin Yan and Claudia Kuenzer
Remote Sens. 2016, 8(5), 434; https://doi.org/10.3390/rs8050434 - 23 May 2016
Cited by 80 | Viewed by 10622
Abstract
Rice is an important food crop and a large producer of green-house relevant methane. Accurate and timely maps of paddy fields are most important in the context of food security and greenhouse gas emission modelling. During their life-cycle, rice plants undergo a phenological [...] Read more.
Rice is an important food crop and a large producer of green-house relevant methane. Accurate and timely maps of paddy fields are most important in the context of food security and greenhouse gas emission modelling. During their life-cycle, rice plants undergo a phenological development that influences their interaction with waves in the visible light and infrared spectrum. Rice growth has a distinctive signature in time series of remotely-sensed data. We used time series of MODIS (Moderate Resolution Imaging Spectroradiometer) products MOD13Q1 and MYD13Q1 and a one-class support vector machine to detect these signatures and classify paddy rice areas in continental China. Based on these classifications, we present a novel product for continental China that shows rice areas for the years 2002, 2005, 2010 and 2014 at 250-m resolution. Our classification has an overall accuracy of 0.90 and a kappa coefficient of 0.77 compared to our own reference dataset for 2014 and correlates highly with rice area statistics from China’s Statistical Yearbooks (R2 of 0.92 for 2010, 0.92 for 2005 and 0.90 for 2002). Moderate resolution time series analysis allows accurate and timely mapping of rice paddies over large areas with diverse cropping schemes. Full article
Show Figures

Graphical abstract

2209 KiB  
Article
Spatiotemporal Variability in Start and End of Growing Season in China Related to Climate Variability
by Quansheng Ge, Junhu Dai, Huijuan Cui and Huanjiong Wang
Remote Sens. 2016, 8(5), 433; https://doi.org/10.3390/rs8050433 - 23 May 2016
Cited by 33 | Viewed by 6274
Abstract
Satellite-derived vegetation phenophases are frequently used to study the response of ecosystems to climate change. However, limited studies have identified the common phenological variability across different climate and vegetation zones. Using NOAA/Advanced Very High Resolution Radiometer (AVHRR) Normalized Difference Vegetation Index (NDVI) dataset, [...] Read more.
Satellite-derived vegetation phenophases are frequently used to study the response of ecosystems to climate change. However, limited studies have identified the common phenological variability across different climate and vegetation zones. Using NOAA/Advanced Very High Resolution Radiometer (AVHRR) Normalized Difference Vegetation Index (NDVI) dataset, we estimated start of growing season (SOS) and end of growing season (EOS) for Chinese vegetation during the period 1982–2012 based on the Midpoint method. Subsequently, the empirical orthogonal function (EOF) analysis was applied to extract the main patterns of phenophases and their annual variability. The impact of climate parameters such as temperature and precipitation on phenophases was investigated using canonical correlation analysis (CCA). The first EOF mode of phenophases exhibited widespread earlier or later SOS and EOS signals for almost the whole country. The attendant time coefficients revealed an earlier SOS between 1996 and 2008, but a later SOS in 1982–1995 and 2009–2012. Regarding EOS, it was clearly happening later in recent years, mainly after 1993. The preseason temperature contributed to such spatiotemporal phenological change significantly. The first pair of CCA patterns for phenology and preseason temperature was found to be similar and its time coefficients were highly correlated to each other (correlation coefficient >0.7). These results indicate that there is a substantial amount of common variance in SOS and EOS across different vegetation types that is related to large-scale modes of climate variability. Full article
Show Figures

Graphical abstract

2961 KiB  
Article
Evaluation of the Chinese Fine Spatial Resolution Hyperspectral Satellite TianGong-1 in Urban Land-Cover Classification
by Xueke Li, Taixia Wu, Kai Liu, Yao Li and Lifu Zhang
Remote Sens. 2016, 8(5), 438; https://doi.org/10.3390/rs8050438 - 21 May 2016
Cited by 30 | Viewed by 6873
Abstract
The successful launch of the Chinese high spatial resolution hyperspectral satellite TianGong-1 (TG-1) opens up new possibilities for applications of remotely-sensed satellite imagery. One of the main goals of the TG-1 mission is to provide observations of surface attributes at local and landscape [...] Read more.
The successful launch of the Chinese high spatial resolution hyperspectral satellite TianGong-1 (TG-1) opens up new possibilities for applications of remotely-sensed satellite imagery. One of the main goals of the TG-1 mission is to provide observations of surface attributes at local and landscape spatial scales to map urban land cover accurately using the hyperspectral technique. This study attempted to evaluate the TG-1 datasets for urban feature analysis, using existing data over Beijing, China, by comparing the TG-1 (with a spatial resolution of 10 m) to EO-1 Hyperion (with a spatial resolution of 30 m). The spectral feature of TG-1 was first analyzed and, thus, finding out optimal hyperspectral wavebands useful for the discrimination of urban areas. Based on this, the pixel-based maximum likelihood classifier (PMLC), pixel-based support vector machine (PSVM), hybrid maximum likelihood classifier (HMLC), and hybrid support vector machine (HSVM) were implemented, as well as compared in the application of mapping urban land cover types. The hybrid classifier approach, which integrates the pixel-based classifier and the object-based segmentation approach, was demonstrated as an effective alternative to the conventional pixel-based classifiers for processing the satellite hyperspectral data, especially the fine spatial resolution data. For TG-1 imagery, the pixel-based urban classification was obtained with an average overall accuracy of 89.1%, whereas the hybrid urban classification was obtained with an average overall accuracy of 91.8%. For Hyperion imagery, the pixel-based urban classification was obtained with an average overall accuracy of 85.9%, whereas the hybrid urban classification was obtained with an average overall accuracy of 86.7%. Overall, it can be concluded that the fine spatial resolution satellite hyperspectral data TG-1 is promising in delineating complex urban scenes, especially when using an appropriate classifier, such as the hybrid classifier. Full article
Show Figures

Graphical abstract

1688 KiB  
Article
Simulation of the Impact of a Sensor’s PSF on Mixed Pixel Decomposition: 1. Nonuniformity Effect
by Chao Xu, Zhaoli Liu and Guanglei Hou
Remote Sens. 2016, 8(5), 437; https://doi.org/10.3390/rs8050437 - 21 May 2016
Cited by 4 | Viewed by 4758
Abstract
The nonuniformity of the spatial response to surface radiation is a fundamental characteristic of all airborne and spaceborne sensors that inevitably introduces uncertainty into the estimation of object proportions by the spectral unmixing of mixed pixels. Simulated data of the surface radiation distribution [...] Read more.
The nonuniformity of the spatial response to surface radiation is a fundamental characteristic of all airborne and spaceborne sensors that inevitably introduces uncertainty into the estimation of object proportions by the spectral unmixing of mixed pixels. Simulated data of the surface radiation distribution and a TM (thematic mapper) response matrix were developed and utilized to imitate the generation of mixed pixels and the extraction of the object proportion via a Monte Carlo simulation, and then, the nonuniformity effect of a sensor’s PSF (point spread function) was explored. The following conclusions were drawn: (1) given a nonuniform spatial response of a sensor to a surface scene with a constant object proportion and various object distribution patterns, the mixed pixel DN (digital number) of a remotely-sensed image becomes a random variable, which causes a PSF nonuniform effect on the object proportion extraction; (2) for the estimated object proportion, the corresponding true object proportion appears with a random variation; its upper and lower bounds take on an asymmetrical spindle shape; and models of these bound curves at any probability level were established; (3) there exists a negative linear relationship between the bias of the spectral unmixing and the estimated proportion; the bias is zero at an estimated proportion of 50%, and when the estimated proportions are approximately 100% and 0%, the object proportion is overestimated by 0.78% and underestimated by 0.78%, respectively; (4) the relationship between the standard deviation of the spectral unmixing and the estimated proportion follows a symmetrical polynomial function opening downward; the standard deviation reaches a maximum of 4.4% at the estimated proportion of 50%, and when the estimated proportion is approximately 100% or 0%, the standard deviation is a minimum, 1.05%. The above findings contribute to a comprehensive understanding of the PSF nonuniformity effect, have the potential to compensate for the bias of proportion estimation and present its confidence interval at any probability level. Full article
(This article belongs to the Special Issue Uncertainties in Remote Sensing)
Show Figures

Graphical abstract

11945 KiB  
Article
Monitoring Cultural Heritage Sites with Advanced Multi-Temporal InSAR Technique: The Case Study of the Summer Palace
by Panpan Tang, Fulong Chen, Xiaokun Zhu and Wei Zhou
Remote Sens. 2016, 8(5), 432; https://doi.org/10.3390/rs8050432 - 21 May 2016
Cited by 40 | Viewed by 7447
Abstract
Cultural heritage sites are rare and irreplaceable wealth of human civilization. The majority of them are becoming unstable due to a combination of human and natural disturbances. High-precision, efficient deformation monitoring facilitates the early recognition of potential risks and enables preventive diagnosis of [...] Read more.
Cultural heritage sites are rare and irreplaceable wealth of human civilization. The majority of them are becoming unstable due to a combination of human and natural disturbances. High-precision, efficient deformation monitoring facilitates the early recognition of potential risks and enables preventive diagnosis of heritage sites. In this study, an advanced Multi-Temporal Interferometric Synthetic Aperture Radar (MTInSAR) approach was developed by jointly analyzing Persistent Scatterers (PSs) and Distributed Scatterers (DSs) using high-resolution SAR images. Taking the World Heritage Site of Summer Palace in Beijing as the experimental site, deformation resulting from PSs/DSs showed that overall the site was generally stable except for specific areas and/or monuments. Urbanization (construction and demolition) triggered new subsidence in the vicinity of East and South Gate of the site. Slight to moderate (mm/cm-level) instabilities of ruins and monuments on Longevity Hill were detected, perhaps due to a combination of destructive anthropogenic activities and long-term natural decay. Subsidence was also detected along the Kunming Lakeside and was probably attributable to variation of the groundwater level, excessive visitor numbers as well as lack of maintenance. This study presents the potential of the MTInSAR approach for the monitoring and conservation of cultural heritage sites. Full article
(This article belongs to the Special Issue Remote Sensing for Cultural Heritage)
Show Figures

Graphical abstract

1861 KiB  
Article
Study of the Effect of Temporal Sampling Frequency on DSCOVR Observations Using the GEOS-5 Nature Run Results (Part II): Cloud Coverage
by Daniel Holdaway and Yuekui Yang
Remote Sens. 2016, 8(5), 431; https://doi.org/10.3390/rs8050431 - 20 May 2016
Cited by 8 | Viewed by 4400
Abstract
This is the second part of a study on how temporal sampling frequency affects satellite retrievals in support of the Deep Space Climate Observatory (DSCOVR) mission. Continuing from Part 1, which looked at Earth’s radiation budget, this paper presents the effect of sampling [...] Read more.
This is the second part of a study on how temporal sampling frequency affects satellite retrievals in support of the Deep Space Climate Observatory (DSCOVR) mission. Continuing from Part 1, which looked at Earth’s radiation budget, this paper presents the effect of sampling frequency on DSCOVR-derived cloud fraction. The output from NASA’s Goddard Earth Observing System version 5 (GEOS-5) Nature Run is used as the “truth”. The effect of temporal resolution on potential DSCOVR observations is assessed by subsampling the full Nature Run data. A set of metrics, including uncertainty and absolute error in the subsampled time series, correlation between the original and the subsamples, and Fourier analysis have been used for this study. Results show that, for a given sampling frequency, the uncertainties in the annual mean cloud fraction of the sunlit half of the Earth are larger over land than over ocean. Analysis of correlation coefficients between the subsamples and the original time series demonstrates that even though sampling at certain longer time intervals may not increase the uncertainty in the mean, the subsampled time series is further and further away from the “truth” as the sampling interval becomes larger and larger. Fourier analysis shows that the simulated DSCOVR cloud fraction has underlying periodical features at certain time intervals, such as 8, 12, and 24 h. If the data is subsampled at these frequencies, the uncertainties in the mean cloud fraction are higher. These results provide helpful insights for the DSCOVR temporal sampling strategy. Full article
(This article belongs to the Special Issue Uncertainties in Remote Sensing)
Show Figures

Graphical abstract

3161 KiB  
Article
Tree Root Automatic Recognition in Ground Penetrating Radar Profiles Based on Randomized Hough Transform
by Wentao Li, Xihong Cui, Li Guo, Jin Chen, Xuehong Chen and Xin Cao
Remote Sens. 2016, 8(5), 430; https://doi.org/10.3390/rs8050430 - 20 May 2016
Cited by 66 | Viewed by 9025
Abstract
As a nondestructive geophysical tool, Ground penetrating radar (GPR) has been applied in tree root study in recent years. With increasing amounts of GPR data collected for roots, it is imperative to develop an efficient automatic recognition of roots in GPR images. However, [...] Read more.
As a nondestructive geophysical tool, Ground penetrating radar (GPR) has been applied in tree root study in recent years. With increasing amounts of GPR data collected for roots, it is imperative to develop an efficient automatic recognition of roots in GPR images. However, few works have been completed on this topic because of the complexity in root recognition problem. Based on GPR datasets from both controlled and in situ experiments, the randomized Hough transform (RHT) algorithm was evaluated in root object recognition for different center frequencies (400 MHz, 900 MHz, and 2000 MHz) in this paper. Reasonable accuracy was obtained (both a high recognition rate and a low false alarm rate) in these datasets, which shows it is feasible to apply the RHT algorithm for root recognition. Furthermore, we evaluated the influence of root and soil factors on the recognition. We found that the performance of RHT algorithm is mainly affected by root interval length, root orientation, and clutter noise of soil. The recognition results by RHT could be applied for large scale root system distribution study in belowground ecology. Further studies should be conducted to reduce clutter noise and improve the recognition of the complex root reflections. Full article
Show Figures

Graphical abstract

22323 KiB  
Article
Production of the Japan 30-m Land Cover Map of 2013–2015 Using a Random Forests-Based Feature Optimization Approach
by Ram C. Sharma, Ryutaro Tateishi, Keitarou Hara and Kotaro Iizuka
Remote Sens. 2016, 8(5), 429; https://doi.org/10.3390/rs8050429 - 20 May 2016
Cited by 22 | Viewed by 7764
Abstract
Achieving more timely, accurate and transparent information on the distribution and dynamics of the world’s land cover is essential to understanding the fundamental characteristics, processes and threats associated with human-nature-climate interactions. Higher resolution (~30–50 m) land cover mapping is expected to advance the [...] Read more.
Achieving more timely, accurate and transparent information on the distribution and dynamics of the world’s land cover is essential to understanding the fundamental characteristics, processes and threats associated with human-nature-climate interactions. Higher resolution (~30–50 m) land cover mapping is expected to advance the understanding of the multi-dimensional interactions of the human-nature-climate system with the potentiality of representing most of the biophysical processes and characteristics of the land surface. However, mapping at 30-m resolution is complicated with existing manual techniques, due to the laborious procedures involved with the analysis and interpretation of huge volumes of satellite data. To cope with this problem, an automated technique was explored for the production of a high resolution land cover map at a national scale. The automated technique consists of the construction of a reference library by the optimum combination of the spectral, textural and topographic features and predicting the results using the optimum random forests model. The feature-rich reference library-driven automated technique was used to produce the Japan 30-m resolution land cover (JpLC-30) map of 2013–2015. The JpLC-30 map consists of seven major land cover types: water bodies, deciduous forests, evergreen forests, croplands, bare lands, built-up areas and herbaceous. The resultant JpLC-30 map was compared to the existing 50-m resolution JAXA High Resolution Land-Use and Land-Cover (JHR LULC) map with reference to Google Earth™ images. The JpLC-30 map provides more accurate and up-to-date land cover information than the JHR LULC map. This research recommends an effective utilization of the spectral, textural and topographic information to increase the accuracy of automated land cover mapping. Full article
Show Figures

Graphical abstract

6315 KiB  
Article
Advantages of Using Microwave Satellite Soil Moisture over Gridded Precipitation Products and Land Surface Model Output in Assessing Regional Vegetation Water Availability and Growth Dynamics for a Lateral Inflow Receiving Landscape
by Tiexi Chen, Tim R. McVicar, Guojie Wang, Xing Chen, Richard A. M. De Jeu, Yi Y. Liu, Hong Shen, Fangmin Zhang and Albertus J. Dolman
Remote Sens. 2016, 8(5), 428; https://doi.org/10.3390/rs8050428 - 20 May 2016
Cited by 17 | Viewed by 7846
Abstract
To improve the understanding of water–vegetation relationships, direct comparative studies assessing the utility of satellite remotely sensed soil moisture, gridded precipitation products, and land surface model output are needed. A case study was investigated for a water-limited, lateral inflow receiving area in northeastern [...] Read more.
To improve the understanding of water–vegetation relationships, direct comparative studies assessing the utility of satellite remotely sensed soil moisture, gridded precipitation products, and land surface model output are needed. A case study was investigated for a water-limited, lateral inflow receiving area in northeastern Australia during December 2008 to May 2009. In January 2009, monthly precipitation showed strong positive anomalies, which led to strong positive soil moisture anomalies. The precipitation anomalies disappeared within a month. In contrast, the soil moisture anomalies persisted for months. Positive anomalies of Normalized Difference Vegetation Index (NDVI) appeared in February, in response to water supply, and then persisted for several months. In addition to these temporal characteristics, the spatial patterns of NDVI anomalies were more similar to soil moisture patterns than to those of precipitation and land surface model output. The long memory of soil moisture mainly relates to the presence of clay-rich soils. Modeled soil moisture from four of five global land surface models failed to capture the memory length of soil moisture and all five models failed to present the influence of lateral inflow. This case study indicates that satellite-based soil moisture is a better predictor of vegetation water availability than precipitation in environments having a memory of several months and thus is able to persistently affect vegetation dynamics. These results illustrate the usefulness of satellite remotely sensed soil moisture in ecohydrology studies. This case study has the potential to be used as a benchmark for global land surface model evaluations. The advantages of using satellite remotely sensed soil moisture over gridded precipitation products are mainly expected in lateral-inflow and/or clay-rich regions worldwide. Full article
Show Figures

Graphical abstract

6477 KiB  
Article
Landsat ETM+ and SRTM Data Provide Near Real-Time Monitoring of Chimpanzee (Pan troglodytes) Habitats in Africa
by Samuel M. Jantz, Lilian Pintea, Janet Nackoney and Matthew C. Hansen
Remote Sens. 2016, 8(5), 427; https://doi.org/10.3390/rs8050427 - 20 May 2016
Cited by 24 | Viewed by 10663
Abstract
All four chimpanzee sub-species populations are declining due to multiple factors including human-caused habitat loss. Effective conservation efforts are therefore needed to ensure their long-term survival. Habitat suitability models serve as useful tools for conservation planning by depicting relative environmental suitability in geographic [...] Read more.
All four chimpanzee sub-species populations are declining due to multiple factors including human-caused habitat loss. Effective conservation efforts are therefore needed to ensure their long-term survival. Habitat suitability models serve as useful tools for conservation planning by depicting relative environmental suitability in geographic space over time. Previous studies mapping chimpanzee habitat suitability have been limited to small regions or coarse spatial and temporal resolutions. Here, we used Random Forests regression to downscale a coarse resolution habitat suitability calibration dataset to estimate habitat suitability over the entire chimpanzee range at 30-m resolution. Our model predicted habitat suitability well with an r2 of 0.82 (±0.002) based on 50-fold cross validation where 75% of the data was used for model calibration and 25% for model testing; however, there was considerable variation in the predictive capability among the four sub-species modeled individually. We tested the influence of several variables derived from Landsat Enhanced Thematic Mapper Plus (ETM+) that included metrics of forest canopy and structure for four three-year time periods between 2000 and 2012. Elevation, Landsat ETM+ band 5 and Landsat derived canopy cover were the strongest predictors; highly suitable areas were associated with dense tree canopy cover for all but the Nigeria-Cameroon and Central Chimpanzee sub-species. Because the models were sensitive to such temporally based predictors, our results are the first to highlight the value of integrating continuously updated variables derived from satellite remote sensing into temporally dynamic habitat suitability models to support near real-time monitoring of habitat status and decision support systems. Full article
(This article belongs to the Special Issue Remote Sensing of Biodiversity)
Show Figures

Graphical abstract

11246 KiB  
Article
Automatic Registration Method for Optical Remote Sensing Images with Large Background Variations Using Line Segments
by Xiaolong Shi and Jie Jiang
Remote Sens. 2016, 8(5), 426; https://doi.org/10.3390/rs8050426 - 19 May 2016
Cited by 22 | Viewed by 5635
Abstract
Image registration is an essential step in the process of image fusion, environment surveillance and change detection. Finding correct feature matches during the registration process proves to be difficult, especially for remote sensing images with large background variations (e.g., images taken pre and [...] Read more.
Image registration is an essential step in the process of image fusion, environment surveillance and change detection. Finding correct feature matches during the registration process proves to be difficult, especially for remote sensing images with large background variations (e.g., images taken pre and post an earthquake or flood). Traditional registration methods based on local intensity probably cannot maintain steady performances, as differences are significant in the same area of the corresponding images, and ground control points are not always available in many disaster images. In this paper, an automatic image registration method based on the line segments on the main shape contours (e.g., coastal lines, long roads and mountain ridges) is proposed for remote sensing images with large background variations because the main shape contours can hold relatively more invariant information. First, a line segment detector called EDLines (Edge Drawing Lines), which was proposed by Akinlar et al. in 2011, is used to extract line segments from two corresponding images, and a line validation step is performed to remove meaningless and fragmented line segments. Then, a novel line segment descriptor with a new histogram binning strategy, which is robust to global geometrical distortions, is generated for each line segment based on the geometrical relationships,including both the locations and orientations of theremaining line segments relative to it. As a result of the invariance of the main shape contours, correct line segment matches will have similar descriptors and can be obtained by cross-matching among the descriptors. Finally, a spatial consistency measure is used to remove incorrect matches, and transformation parameters between the reference and sensed images can be figured out. Experiments with images from different types of satellite datasets, such as Landsat7, QuickBird, WorldView, and so on, demonstrate that the proposed algorithm is automatic, fast (4 ms faster than the second fastest method, i.e., the rotation- and scale-invariant shape context) and can achieve a recall of 79.7%, a precision of 89.1% and a root mean square error (RMSE) of 1.0 pixels on average for remote sensing images with large background variations. Full article
Show Figures

Graphical abstract

10395 KiB  
Article
An ESTARFM Fusion Framework for the Generation of Large-Scale Time Series in Cloud-Prone and Heterogeneous Landscapes
by Kim Knauer, Ursula Gessner, Rasmus Fensholt and Claudia Kuenzer
Remote Sens. 2016, 8(5), 425; https://doi.org/10.3390/rs8050425 - 19 May 2016
Cited by 53 | Viewed by 10571
Abstract
Monitoring the spatio-temporal development of vegetation is a challenging task in heterogeneous and cloud-prone landscapes. No single satellite sensor has thus far been able to provide consistent time series of high temporal and spatial resolution for such areas. In order to overcome this [...] Read more.
Monitoring the spatio-temporal development of vegetation is a challenging task in heterogeneous and cloud-prone landscapes. No single satellite sensor has thus far been able to provide consistent time series of high temporal and spatial resolution for such areas. In order to overcome this problem, data fusion algorithms such as the Enhanced Spatial and Temporal Adaptive Reflectance Fusion Model (ESTARFM) have been established and frequently used in recent years to generate high-resolution time series. In order to make it applicable to larger scales and to increase the input data availability especially in cloud-prone areas, an ESTARFM framework was developed in this study introducing several enhancements. An automatic filling of cloud gaps was included in the framework to make best use of available, even partly cloud-covered Landsat images. Furthermore, the ESTARFM algorithm was enhanced to automatically account for regional differences in the heterogeneity of the study area. The generation of time series was automated and the processing speed was accelerated significantly by parallelization. To test the performance of the developed ESTARFM framework, MODIS and Landsat-8 data were fused for generating an 8-day NDVI time series for a study area of approximately 98,000 km2 in West Africa. The results show that the ESTARFM framework can accurately produce high temporal resolution time series (average MAE (mean absolute error) of 0.02 for the dry season and 0.05 for the vegetative season) while keeping the spatial detail in such a heterogeneous, cloud-prone region. The developments introduced within the ESTARFM framework establish the basis for large-scale research on various geoscientific questions related to land degradation, changes in land surface phenology or agriculture. Full article
Show Figures

Graphical abstract

2439 KiB  
Article
PATMOS-x Cloud Climate Record Trend Sensitivity to Reanalysis Products
by Michael J. Foster, Andrew Heidinger, Michael Hiley, Steve Wanzong, Andi Walther and Denis Botambekov
Remote Sens. 2016, 8(5), 424; https://doi.org/10.3390/rs8050424 - 18 May 2016
Cited by 5 | Viewed by 5547
Abstract
Continuous satellite-derived cloud records now extend over three decades, and are increasingly used for climate applications. Certain applications, such as trend detection, require a clear understanding of uncertainty as it relates to establishing statistical significance. The use of reanalysis products as sources of [...] Read more.
Continuous satellite-derived cloud records now extend over three decades, and are increasingly used for climate applications. Certain applications, such as trend detection, require a clear understanding of uncertainty as it relates to establishing statistical significance. The use of reanalysis products as sources of ancillary data could be construed as one such source of uncertainty, as there has been discussion regarding the suitability of reanalysis products for trend detection. Here we use three reanalysis products: Climate Forecast System Reanalysis (CFSR), Modern Era Retrospective Analysis for Research and Applications (MERRA) and European Center for Medium range Weather Forecasting (ECMWF) ERA-Interim (ERA-I) as sources of ancillary data for the Pathfinder Atmospheres Extended/Advanced Very High Resolution Radiometer (PATMOS-x/AVHRR) Satellite Cloud Climate Data Record (CDR), and perform inter-comparisons to determine how sensitive the climatology is to choice of ancillary data source. We find differences among reanalysis fields required for PATMOS-x processing, which translate to small but not insignificant differences in retrievals of cloud fraction, cloud top height and cloud optical depth. The retrieval variability due to choice of reanalysis product is on the order of one third the size of the retrieval uncertainty, making it a potentially significant factor in trend detection. Cloud fraction trends were impacted the most by choice of reanalysis while cloud optical depth trends were impacted the least. Metrics used to determine the skill of the reanalysis products for use as ancillary data found no clear best choice for use in PATMOS-x. We conclude use of reanalysis products as ancillary data in the PATMOS-x/AVHRR Cloud CDR do not preclude its use for trend detection, but for that application uncertainty in reanalysis fields should be better represented in the PATMOS-x retrieval uncertainty. Full article
(This article belongs to the Special Issue Satellite Climate Data Records and Applications)
Show Figures

Graphical abstract

4715 KiB  
Article
MODIS-Based Mapping of Secchi Disk Depth Using a Qualitative Algorithm in the Shallow Arabian Gulf
by Muna. R. Al Kaabi, Jun Zhao and Hosni Ghedira
Remote Sens. 2016, 8(5), 423; https://doi.org/10.3390/rs8050423 - 17 May 2016
Cited by 23 | Viewed by 6700
Abstract
Regionally calibrated algorithms for water quality are strongly needed, especially for optically complex waters such as coastal areas in the Arabian Gulf. In this study, a regional qualitative algorithm was proposed to retrieve seawater transparency, with Secchi disk depth (SDD) as a surrogate, [...] Read more.
Regionally calibrated algorithms for water quality are strongly needed, especially for optically complex waters such as coastal areas in the Arabian Gulf. In this study, a regional qualitative algorithm was proposed to retrieve seawater transparency, with Secchi disk depth (SDD) as a surrogate, in the Arabian Gulf. A two-step process was carried out, first estimating the diffuse attenuation coefficient of downwelling irradiance at 490 nm (Kd_490) from MODIS/Aqua imagery and then SDD based on empirical correlations with Kd_490. Three satellite derived Kd products were tested and assessed against a set of in situ measurements, and one from a semi-analytical algorithm based on inherent optical properties gave the best performance with a R2 of 0.62. Comparisons between the performances of SDD models developed in this study and those established in other regions indicated higher accuracy of our proposed model for the Gulf region. The potential factors causing uncertainties of the proposed algorithm were also discussed. Seasonal and inter-annual variations of SDD over the entire Gulf were demonstrated using a 14-year time series of MODIS/Aqua data from 2002 to 2015. High SDD values were generally observed in summer while low values were found in winter. Inter-annual variations of SDD did not shown any significant trend with exceptions during algal bloom outbreaks that resulted in low SDD. Full article
Show Figures

Graphical abstract

8316 KiB  
Article
Early Drought Detection by Spectral Analysis of Satellite Time Series of Precipitation and Normalized Difference Vegetation Index (NDVI)
by Mattijn Van Hoek, Li Jia, Jie Zhou, Chaolei Zheng and Massimo Menenti
Remote Sens. 2016, 8(5), 422; https://doi.org/10.3390/rs8050422 - 17 May 2016
Cited by 34 | Viewed by 9373
Abstract
The time lag between anomalies in precipitation and vegetation activity plays a critical role in early drought detection as agricultural droughts are caused by precipitation shortages. The aim of this study is to explore a new approach to estimate the time lag between [...] Read more.
The time lag between anomalies in precipitation and vegetation activity plays a critical role in early drought detection as agricultural droughts are caused by precipitation shortages. The aim of this study is to explore a new approach to estimate the time lag between a forcing (precipitation) and a response (NDVI) signal in the frequency domain by applying cross-spectral analysis. We prepared anomaly time series of image data on TRMM3B42 precipitation (accumulated over antecedent durations of 10, 60, and 150 days) and NDVI, reconstructed and interpolated MOD13A2 and MYD13A2 to daily interval using a Fourier series method to model time series affected by gaps and outliers (iHANTS) for a dry and a wet year in a drought-prone area in the northeast region of China. Then, the cross-spectral analysis was applied pixel-wise and only the phase lag of the annual component of the forcing and response signal was extracted. The 10-day antecedent precipitation was retained as the best representation of forcing. The estimated phase lag was interpreted using maps of land cover and of available soil water-holding capacity and applied to investigate the difference in phenology responses between a wet and dry year. In both the wet and dry year, we measured consistent phase lags across land cover types. In the wet year with above-average precipitation, the phase lag was rather similar for all land cover types, i.e., 7.6 days for closed to open grassland and 14.5 days for open needle-leaved deciduous or evergreen forest. In the dry year, the phase lag increased by 7.0 days on average, but with specific response signals for the different land cover types. Interpreting the phase lag against the soil water-holding capacity, we observed a slightly higher phase lag in the dry year for soils with a higher water-holding capacity. The accuracy of the estimated phase lag was assessed through Monte Carlo simulations and presented reliable estimates for the annual component. Full article
Show Figures

Graphical abstract

11803 KiB  
Article
Building Point Detection from Vehicle-Borne LiDAR Data Based on Voxel Group and Horizontal Hollow Analysis
by Yu Wang, Liang Cheng, Yanming Chen, Yang Wu and Manchun Li
Remote Sens. 2016, 8(5), 419; https://doi.org/10.3390/rs8050419 - 17 May 2016
Cited by 44 | Viewed by 10535
Abstract
Information extraction and three-dimensional (3D) reconstruction of buildings using the vehicle-borne laser scanning (VLS) system is significant for many applications. Extracting LiDAR points, from VLS, belonging to various types of building in large-scale complex urban environments still retains some problems. In this paper, [...] Read more.
Information extraction and three-dimensional (3D) reconstruction of buildings using the vehicle-borne laser scanning (VLS) system is significant for many applications. Extracting LiDAR points, from VLS, belonging to various types of building in large-scale complex urban environments still retains some problems. In this paper, a new technical framework for automatic and efficient building point extraction is proposed, including three main steps: (1) voxel group-based shape recognition; (2) category-oriented merging; and (3) building point identification by horizontal hollow ratio analysis. This article proposes a concept of “voxel group” based on the voxelization of VLS points: each voxel group is composed of several voxels that belong to one single real-world object. Then the shapes of point clouds in each voxel group are recognized and this shape information is utilized to merge voxel group. This article puts forward a characteristic nature of vehicle-borne LiDAR building points, called “horizontal hollow ratio”, for efficient extraction. Experiments are analyzed from two aspects: (1) building-based evaluation for overall experimental area; and (2) point-based evaluation for individual building using the completeness and correctness. The experimental results indicate that the proposed framework is effective for the extraction of LiDAR points belonging to various types of buildings in large-scale complex urban environments. Full article
Show Figures

Graphical abstract

2875 KiB  
Article
Moho Density Contrast in Central Eurasia from GOCE Gravity Gradients
by Mehdi Eshagh, Matloob Hussain, Robert Tenzer and Mohsen Romeshkani
Remote Sens. 2016, 8(5), 418; https://doi.org/10.3390/rs8050418 - 17 May 2016
Cited by 26 | Viewed by 5783
Abstract
Seismic data are primarily used in studies of the Earth’s inner structure. Since large parts of the world are not yet sufficiently covered by seismic surveys, products from the Earth’s satellite observation systems have more often been used for this purpose in recent [...] Read more.
Seismic data are primarily used in studies of the Earth’s inner structure. Since large parts of the world are not yet sufficiently covered by seismic surveys, products from the Earth’s satellite observation systems have more often been used for this purpose in recent years. In this study we use the gravity-gradient data derived from the Gravity field and steady-state Ocean Circulation Explorer (GOCE), the elevation data from the Shuttle Radar Topography Mission (SRTM) and other global datasets to determine the Moho density contrast at the study area which comprises most of the Eurasian plate (including parts of surrounding continental and oceanic tectonic plates). A regional Moho recovery is realized by solving the Vening Meinesz-Moritz’s (VMM) inverse problem of isostasy and a seismic crustal model is applied to constrain the gravimetric solution. Our results reveal that the Moho density contrast reaches minima along the mid-oceanic rift zones and maxima under the continental crust. This spatial pattern closely agrees with that seen in the CRUST1.0 seismic crustal model as well as in the KTH1.0 gravimetric-seismic Moho model. However, these results differ considerably from some previously published gravimetric studies. In particular, we demonstrate that there is no significant spatial correlation between the Moho density contrast and Moho deepening under major orogens of Himalaya and Tibet. In fact, the Moho density contrast under most of the continental crustal structure is typically much more uniform. Full article
(This article belongs to the Special Issue Remote Sensing in Tibet and Siberia)
Show Figures

Graphical abstract

2676 KiB  
Article
Comparison of XH2O Retrieved from GOSAT Short-Wavelength Infrared Spectra with Observations from the TCCON Network
by Eric Dupuy, Isamu Morino, Nicholas M. Deutscher, Yukio Yoshida, Osamu Uchino, Brian J. Connor, Martine De Mazière, David W. T. Griffith, Frank Hase, Pauli Heikkinen, Patrick W. Hillyard, Laura T. Iraci, Shuji Kawakami, Rigel Kivi, Tsuneo Matsunaga, Justus Notholt, Christof Petri, James R. Podolske, David F. Pollard, Markus Rettinger, Coleen M. Roehl, Vanessa Sherlock, Ralf Sussmann, Geoffrey C. Toon, Voltaire A. Velazco, Thorsten Warneke, Paul O. Wennberg, Debra Wunch and Tatsuya Yokotaadd Show full author list remove Hide full author list
Remote Sens. 2016, 8(5), 414; https://doi.org/10.3390/rs8050414 - 17 May 2016
Cited by 22 | Viewed by 9643 | Correction
Abstract
Understanding the atmospheric distribution of water (H 2 O) is crucial for global warming studies and climate change mitigation. In this context, reliable satellite data are extremely valuable for their global and continuous coverage, once their quality has been assessed. Short-wavelength infrared spectra [...] Read more.
Understanding the atmospheric distribution of water (H 2 O) is crucial for global warming studies and climate change mitigation. In this context, reliable satellite data are extremely valuable for their global and continuous coverage, once their quality has been assessed. Short-wavelength infrared spectra are acquired by the Thermal And Near-infrared Sensor for carbon Observation-Fourier Transform Spectrometer (TANSO-FTS) aboard the Greenhouse gases Observing Satellite (GOSAT). From these, column-averaged dry-air mole fractions of carbon dioxide, methane and water vapor (XH 2 O) have been retrieved at the National Institute for Environmental Studies (NIES, Japan) and are available as a Level 2 research product. We compare the NIES XH 2 O data, Version 02.21, with retrievals from the ground-based Total Carbon Column Observing Network (TCCON, Version GGG2014). The datasets are in good overall agreement, with GOSAT data showing a slight global low bias of −3.1% ± 24.0%, good consistency over different locations (station bias of −1.53% ± 10.35%) and reasonable correlation with TCCON (R = 0.89). We identified two potential sources of discrepancy between the NIES and TCCON retrievals over land. While the TCCON XH 2 O amounts can reach 6000–7000 ppm when the atmospheric water content is high, the correlated NIES values do not exceed 5500 ppm. This could be due to a dry bias of TANSO-FTS in situations of high humidity and aerosol content. We also determined that the GOSAT-TCCON differences directly depend on the altitude difference between the TANSO-FTS footprint and the TCCON site. Further analysis will account for these biases, but the NIES V02.21 XH 2 O product, after public release, can already be useful for water cycle studies. Full article
Show Figures

Graphical abstract

8021 KiB  
Article
Development, Production and Evaluation of Aerosol Climate Data Records from European Satellite Observations (Aerosol_cci)
by Thomas Popp, Gerrit De Leeuw, Christine Bingen, Christoph Brühl, Virginie Capelle, Alain Chedin, Lieven Clarisse, Oleg Dubovik, Roy Grainger, Jan Griesfeller, Andreas Heckel, Stefan Kinne, Lars Klüser, Miriam Kosmale, Pekka Kolmonen, Luca Lelli, Pavel Litvinov, Linlu Mei, Peter North, Simon Pinnock, Adam Povey, Charles Robert, Michael Schulz, Larisa Sogacheva, Kerstin Stebel, Deborah Stein Zweers, Gareth Thomas, Lieuwe Gijsbert Tilstra, Sophie Vandenbussche, Pepijn Veefkind, Marco Vountas and Yong Xueadd Show full author list remove Hide full author list
Remote Sens. 2016, 8(5), 421; https://doi.org/10.3390/rs8050421 - 16 May 2016
Cited by 136 | Viewed by 13703
Abstract
Producing a global and comprehensive description of atmospheric aerosols requires integration of ground-based, airborne, satellite and model datasets. Due to its complexity, aerosol monitoring requires the use of several data records with complementary information content. This paper describes the lessons learned while developing [...] Read more.
Producing a global and comprehensive description of atmospheric aerosols requires integration of ground-based, airborne, satellite and model datasets. Due to its complexity, aerosol monitoring requires the use of several data records with complementary information content. This paper describes the lessons learned while developing and qualifying algorithms to generate aerosol Climate Data Records (CDR) within the European Space Agency (ESA) Aerosol_cci project. An iterative algorithm development and evaluation cycle involving core users is applied. It begins with the application-specific refinement of user requirements, leading to algorithm development, dataset processing and independent validation followed by user evaluation. This cycle is demonstrated for a CDR of total Aerosol Optical Depth (AOD) from two subsequent dual-view radiometers. Specific aspects of its applicability to other aerosol algorithms are illustrated with four complementary aerosol datasets. An important element in the development of aerosol CDRs is the inclusion of several algorithms evaluating the same data to benefit from various solutions to the ill-determined retrieval problem. The iterative approach has produced a 17-year AOD CDR, a 10-year stratospheric extinction profile CDR and a 35-year Absorbing Aerosol Index record. Further evolution cycles have been initiated for complementary datasets to provide insight into aerosol properties (i.e., dust aerosol, aerosol absorption). Full article
(This article belongs to the Special Issue Satellite Climate Data Records and Applications)
Show Figures

Graphical abstract

3186 KiB  
Article
Diatom Phenology in the Southern Ocean: Mean Patterns, Trends and the Role of Climate Oscillations
by Mariana A. Soppa, Christoph Völker and Astrid Bracher
Remote Sens. 2016, 8(5), 420; https://doi.org/10.3390/rs8050420 - 16 May 2016
Cited by 35 | Viewed by 8684
Abstract
Diatoms are the major marine primary producers in the Southern Ocean and a key component of the carbon and silicate biogeochemical cycle. Using 15 years of satellite-derived diatom concentration from September to April (1997–2012), we examine the mean patterns and the interannual variability [...] Read more.
Diatoms are the major marine primary producers in the Southern Ocean and a key component of the carbon and silicate biogeochemical cycle. Using 15 years of satellite-derived diatom concentration from September to April (1997–2012), we examine the mean patterns and the interannual variability of the diatom bloom phenology in the Southern Ocean. Mean spatial patterns of timing and duration of diatom blooms are generally associated with the position of the Southern Antarctic Circumpolar Current Front and of the maximum sea ice extent. In several areas the anomalies of phenological indices are found to be correlated with ENSO and SAM. Composite maps of the anomalies reveal distinct spatial patterns and opposite events of ENSO and SAM have similar effects on the diatom phenology. For example, in the Ross Sea region, a later start of the bloom and lower diatom biomass were observed associated with El Niño and negative SAM events; likely influenced by an increase in sea ice concentration during these events. Full article
Show Figures

Graphical abstract

9088 KiB  
Article
Retrieval of Aerosol Fine-Mode Fraction from Intensity and Polarization Measurements by PARASOL over East Asia
by Yang Zhang, Zhengqiang Li, Lili Qie, Ying Zhang, Zhihong Liu, Xingfeng Chen, Weizhen Hou, Kaitao Li, Donghui Li and Hua Xu
Remote Sens. 2016, 8(5), 417; https://doi.org/10.3390/rs8050417 - 16 May 2016
Cited by 30 | Viewed by 7260
Abstract
The fine-mode fraction (FMF) of aerosol optical depth (AOD) is a key optical parameter that represents the proportion of fine particles relative to total aerosols in the atmosphere. However, in comparison to ground-based measurements, the FMF is still difficult to retrieve from satellite [...] Read more.
The fine-mode fraction (FMF) of aerosol optical depth (AOD) is a key optical parameter that represents the proportion of fine particles relative to total aerosols in the atmosphere. However, in comparison to ground-based measurements, the FMF is still difficult to retrieve from satellite observations, as attempted by a Moderate-resolution Imaging Spectroradiometer (MODIS) algorithm. In this paper, we introduce the retrieval of FMF based on Polarization and Anisotropy of Reflectances for Atmospheric Science coupled with Observations from a Lidar (PARASOL) data. This method takes advantage of the coincident multi-angle intensity and polarization measurements from a single satellite platform. In our method, we use intensity measurements to retrieve the total AOD and polarization measurements to retrieve the fine-mode AOD. The FMF is then calculated as the ratio of the retrieved fine-mode AOD to the total AOD. The important processes in our method include the estimation of the surface intensity and polarized reflectance by using two semi-empirical models, and the building of two sets of aerosol retrieval lookup tables for the intensity and polarized measurements via the 6SV radiative transfer code. We apply this method to East Asia, and comparisons of the retrieved FMFs for the Beijing, Xianghe and Seoul_SNU sites with those of the Aerosol Robotic Network (AERONET) ground-based observations produce correlation coefficients (R2) of 0.838, 0.818, and 0.877, respectively. However, the comparison results are relatively poor (R2 = 0.537) in low-AOD areas, such as the Osaka site, due to the low signal-to-noise ratio of the satellite observations. Full article
Show Figures

Graphical abstract

5117 KiB  
Article
Remote Estimation of Vegetation Fraction and Flower Fraction in Oilseed Rape with Unmanned Aerial Vehicle Data
by Shenghui Fang, Wenchao Tang, Yi Peng, Yan Gong, Can Dai, Ruhui Chai and Kan Liu
Remote Sens. 2016, 8(5), 416; https://doi.org/10.3390/rs8050416 - 16 May 2016
Cited by 77 | Viewed by 9110
Abstract
This study developed an approach for remote estimation of Vegetation Fraction (VF) and Flower Fraction (FF) in oilseed rape, which is a crop species with conspicuous flowers during reproduction. Canopy reflectance in green, red, red edge and NIR bands was obtained by a [...] Read more.
This study developed an approach for remote estimation of Vegetation Fraction (VF) and Flower Fraction (FF) in oilseed rape, which is a crop species with conspicuous flowers during reproduction. Canopy reflectance in green, red, red edge and NIR bands was obtained by a camera system mounted on an unmanned aerial vehicle (UAV) when oilseed rape was in the vegetative growth and flowering stage. The relationship of several widely-used Vegetation Indices (VI) vs. VF was tested and found to be different in different phenology stages. At the same VF when oilseed rape was flowering, canopy reflectance increased in all bands, and the tested VI decreased. Therefore, two algorithms to estimate VF were calibrated respectively, one for samples during vegetative growth and the other for samples during flowering stage. The results showed that the Visible Atmospherically Resistant Index (VARIgreen) worked most accurately for estimating VF in flower-free samples with an Root Mean Square Error (RMSE) of 3.56%, while the Enhanced Vegetation Index (EVI2) was the best in flower-containing samples with an RMSE of 5.65%. Based on reflectance in green and NIR bands, a technique was developed to identify whether a sample contained flowers and then to choose automatically the appropriate algorithm for its VF estimation. During the flowering season, we also explored the potential of using canopy reflectance or VIs to estimate FF in oilseed rape. No significant correlation was observed between VI and FF when soil was visible in the sensor’s field of view. Reflectance at 550 nm worked well for FF estimation with coefficient of determination (R2) above 0.6. Our model was validated in oilseed rape planted under different nitrogen fertilization applications and in different phenology stages. The results showed that it was able to predict VF and FF accurately in oilseed rape with RMSE below 6%. Full article
Show Figures

Graphical abstract

12875 KiB  
Article
Three-Dimensional Reconstruction of Building Roofs from Airborne LiDAR Data Based on a Layer Connection and Smoothness Strategy
by Yongjun Wang, Hao Xu, Liang Cheng, Manchun Li, Yajun Wang, Nan Xia, Yanming Chen and Yong Tang
Remote Sens. 2016, 8(5), 415; https://doi.org/10.3390/rs8050415 - 16 May 2016
Cited by 14 | Viewed by 6981
Abstract
A new approach for three-dimensional (3-D) reconstruction of building roofs from airborne light detection and ranging (LiDAR) data is proposed, and it includes four steps. Building roof points are first extracted from LiDAR data by using the reversed iterative mathematic morphological (RIMM) algorithm [...] Read more.
A new approach for three-dimensional (3-D) reconstruction of building roofs from airborne light detection and ranging (LiDAR) data is proposed, and it includes four steps. Building roof points are first extracted from LiDAR data by using the reversed iterative mathematic morphological (RIMM) algorithm and the density-based method. The corresponding relations between points and rooftop patches are then established through a smoothness strategy involving “seed point selection, patch growth, and patch smoothing.” Layer-connection points are then generated to represent a layer in the horizontal direction and to connect different layers in the vertical direction. Finally, by connecting neighboring layer-connection points, building models are constructed with the second level of detailed data. The key contributions of this approach are the use of layer-connection points and the smoothness strategy for building model reconstruction. Experimental results are analyzed from several aspects, namely, the correctness and completeness, deviation analysis of the reconstructed building roofs, and the influence of elevation to 3-D roof reconstruction. In the two experimental regions used in this paper, the completeness and correctness of the reconstructed rooftop patches were about 90% and 95%, respectively. For the deviation accuracy, the average deviation distance and standard deviation in the best case were 0.05 m and 0.18 m, respectively; and those in the worst case were 0.12 m and 0.25 m. The experimental results demonstrated promising correctness, completeness, and deviation accuracy with satisfactory 3-D building roof models. Full article
(This article belongs to the Special Issue Airborne Laser Scanning)
Show Figures

Graphical abstract

30039 KiB  
Article
Application of Open Source Coding Technologies in the Production of Land Surface Temperature (LST) Maps from Landsat: A PyQGIS Plugin
by Milton Isaya Ndossi and Ugur Avdan
Remote Sens. 2016, 8(5), 413; https://doi.org/10.3390/rs8050413 - 13 May 2016
Cited by 103 | Viewed by 18666
Abstract
This paper presents a Python QGIS (PyQGIS) plugin, which has been developed for the purpose of producing Land Surface Temperature (LST) maps from Landsat 5 TM, Landsat 7 ETM+ and Landsat 8 TIRS, Thermal Infrared (TIR) imagery. The plugin has been developed purposely [...] Read more.
This paper presents a Python QGIS (PyQGIS) plugin, which has been developed for the purpose of producing Land Surface Temperature (LST) maps from Landsat 5 TM, Landsat 7 ETM+ and Landsat 8 TIRS, Thermal Infrared (TIR) imagery. The plugin has been developed purposely to ease the process of LST extraction from Landsat Visible, Near Infrared (VNIR) and TIR imagery. It has the ability to estimate Land Surface Emissivity (LSE), calculating at-sensor radiance, calculating brightness temperature and performing correction of brightness temperature against atmospheric interference though the Plank function, Mono Window Algorithm (MWA), Single Channel Algorithm (SCA) and the Radiative Transfer Equation (RTE). Using the plugin, LST maps of Moncton, New Brunswick, Canada have been produced for Landsat 5 TM, Landsat 7 ETM+ and Landsat 8 TIRS. The study put much more emphasis on the examination of LST derived from the different algorithms of LST extraction from VNIR and TIR satellite imagery. In this study, the best LST values derived from Landsat 5 TM were obtained from the RTE and the Planck function with RMSE of 2.64 °C and 1.58 °C, respectively. While the RTE and the Planck function produced the best results for Landsat 7 ETM+ with RMSE of 3.75 °C and 3.58 °C respectively and for Landsat 8 TIRS LST retrieval, the best results were obtained from the Planck function and the SCA with RMSE of 2.07 °C and 3.06 °C, respectively. Full article
Show Figures

Graphical abstract

2183 KiB  
Article
Analysis of Red and Far-Red Sun-Induced Chlorophyll Fluorescence and Their Ratio in Different Canopies Based on Observed and Modeled Data
by Micol Rossini, Michele Meroni, Marco Celesti, Sergio Cogliati, Tommaso Julitta, Cinzia Panigada, Uwe Rascher, Christiaan Van der Tol and Roberto Colombo
Remote Sens. 2016, 8(5), 412; https://doi.org/10.3390/rs8050412 - 13 May 2016
Cited by 54 | Viewed by 8271
Abstract
Sun-induced canopy chlorophyll fluorescence in both the red (FR) and far-red (FFR) regions was estimated across a range of temporal scales and a range of species from different plant functional types using high resolution radiance spectra collected on the [...] Read more.
Sun-induced canopy chlorophyll fluorescence in both the red (FR) and far-red (FFR) regions was estimated across a range of temporal scales and a range of species from different plant functional types using high resolution radiance spectra collected on the ground. Field measurements were collected with a state-of-the-art spectrometer setup and standardized methodology. Results showed that different plant species were characterized by different fluorescence magnitude. In general, the highest fluorescence emissions were measured in crops followed by broadleaf and then needleleaf species. Red fluorescence values were generally lower than those measured in the far-red region due to the reabsorption of FR by photosynthetic pigments within the canopy layers. Canopy chlorophyll fluorescence was related to plant photosynthetic capacity, but also varied according to leaf and canopy characteristics, such as leaf chlorophyll concentration and Leaf Area Index (LAI). Results gathered from field measurements were compared to radiative transfer model simulations with the Soil-Canopy Observation of Photochemistry and Energy fluxes (SCOPE) model. Overall, simulation results confirmed a major contribution of leaf chlorophyll concentration and LAI to the fluorescence signal. However, some discrepancies between simulated and experimental data were found in broadleaf species. These discrepancies may be explained by uncertainties in individual species LAI estimation in mixed forests or by the effect of other model parameters and/or model representation errors. This is the first study showing sun-induced fluorescence experimental data on the variations in the two emission regions and providing quantitative information about the absolute magnitude of fluorescence emission from a range of vegetation types. Full article
(This article belongs to the Special Issue Field Spectroscopy and Radiometry)
Show Figures

Graphical abstract

4378 KiB  
Article
Radiometric cross Calibration of Gaofen-1 WFV Cameras Using Landsat-8 OLI Images: A Simple Image-Based Method
by Juan Li, Lian Feng, Xiaoping Pang, Weishu Gong and Xi Zhao
Remote Sens. 2016, 8(5), 411; https://doi.org/10.3390/rs8050411 - 13 May 2016
Cited by 23 | Viewed by 7394
Abstract
WFV (Wide Field of View) cameras on-board Gaofen-1 satellite (gaofen means high resolution) provide unparalleled global observations with both high spatial and high temporal resolutions. However, the accuracy of the radiometric calibration remains unknown. Using an improved cross calibration method, the WFV cameras [...] Read more.
WFV (Wide Field of View) cameras on-board Gaofen-1 satellite (gaofen means high resolution) provide unparalleled global observations with both high spatial and high temporal resolutions. However, the accuracy of the radiometric calibration remains unknown. Using an improved cross calibration method, the WFV cameras were re-calibrated with well-calibrated Landsat-8 OLI (Operational Land Imager) data as reference. An objective method was proposed to guarantee the homogeneity and sufficient dynamic coverage for calibration sites and reference sensors. The USGS spectral library was used to match the most appropriate hyperspectral data, based on which the spectral band differences between WFV and OLI were adjusted. The TOA (top-of-atmosphere) reflectance of the cross-calibrated WFV agreed very well with that of OLI, with the mean differences between the two sensors less than 5% for most of the reflectance ranges of the four spectral bands, after accounting for the spectral band difference between the two sensors. Given the calibration error of 3% for Landsat-8 OLI TOA reflectance, the uncertainty of the newly-calibrated WFV should be within 8%. The newly generated calibration coefficients established confidence when using Gaofen-1 WFV observations for their further quantitative applications, and the proposed simple cross calibration method here could be easily extended to other operational or planned satellite missions. Full article
Show Figures

Graphical abstract

Previous Issue
Next Issue
Back to TopTop