1. Introduction
The creation of 3D models of heritage and archaeological objects and sites in their current state requires a powerful methodology able to capture and digitally model the fine geometric and appearance details of such sites. Digital recording, documentation and preservation are demanded as our heritages (natural, cultural or mixed) suffer from on-going attritions and wars, natural disasters, climate changes and human negligence. In particular the built environment and natural heritage have received a lot of attention and benefits from the recent advances of range sensors and imaging devices [
1,
2]. Nowadays 3D data are a critical component to permanently record the form of important objects and sites so that, in digital form at least, they might be passed down to future generations. This has generated in the last decade a large number of projects, mainly led by research groups, which have realized very good quality and complete digital models [
3,
4,
5,
6,
7,
8,
9]. Indeed remote sensing technologies and methodologies for Cultural Heritage 3D documentation and modeling [
10] allow the generation of very realistic 3D results (in terms of geometric and radiometric accuracy) that can be used for many purposes, such as historical documentation [
11,
12], digital preservation and conservation [
13,
14], cross-comparisons, monitoring of shape and colors, simulation of aging and deterioration, virtual reality/computer graphics applications [
15,
16], 3D repositories and catalogues [
17], web-based geographic systems, computer-aided restoration [
18], multimedia museum exhibitions [
19], visualization and so on. However, despite all these potential applications and the constant pressure of international heritage organizations, a systematic and targeted use of 3D surveying and modeling in the Cultural Heritage field is still not yet employed as a default approach and when a 3D model is generated, it is often subsampled or reduced to a 2D drawing due to a lack of software or knowledge in properly handling 3D data by non-expert. However, the availability and use of 3D data opens a wide spectrum of further applications and allows new analyses, studies, interpretations, conservation policies or digital restoration. Thus 3D virtual heritages should be more frequently used due to the great advantages that remote sensing technologies and the third dimension offer to the heritage world and to recognize the digital documentation and preservation needs stated in numerous international charters and resolutions. Unfortunately, there are still some difficulties of communications between the geomatics people and the heritage community. New technologies and new hardware are increasing the quality of 3D models with the purpose of attracting new people into the 3D world. Many companies entered inside this market developing and employing software and survey systems with good potentialities and often with very impressive results. Thus the number of 3D products is huge and if, on one hand, the cost of these technologies is slowly reducing, on the other hand it is difficult, in particular for non-specialists, to select the right product due to a lack of standard terminologies, specifications and performance benchmarking. Furthermore, new technologies can be a powerful tool to improve the classical standard of heritage recording and documentation and create a new methodology. However caution must be used and the new recording technologies have to be further studied and customized to be fully effective and useful, since even the standard bi-dimensional representations are still not problem-free.
Although digitally recorded and modeled, our heritages require also more international collaboration and information sharing to make them accessible in all the possible forms and to all the possible users and clients. Nowadays, the digital documentation and 3D modeling of Cultural Heritage should always consist of [
20]:
- –
Recording and processing of a large amount of 3D (possibly 4D) multi-source, multi-resolution, and multi-content information;
- –
Management and conservation of the achieved 3D (4D) models for further applications;
- –
Visualization and presentation of the results to distribute the information to other users allowing data retrieval through the Internet or advanced online databases;
- –
Digital inventories and sharing for education, research, conservation, entertainment, walkthrough, or tourism purposes.
In the following sections, optical sensors for reality-based recording and modeling of large sites and complex objects are reported. The actual problems and open issues in the entire 3D modeling pipeline are also summarized. Since a large body of work on 3D recording and modeling with photogrammetry and 3D scanning exists, the paper mainly focuses on the most accepted and practically tested sensors, recording and 3D modeling approaches. Despite the fact that sensor’s technology is developing very fast and that very few standards are available for the sensor specifications, some summarizing tables of the existing active and passive sensors are also reported with their main performance parameters.
2. Recording Optical Sensors and Platforms
Today a large number of remote sensing sensors and data are available for mapping purposes and digital recording of visual Cultural Heritage. Generally non-invasive optical recording sensors are divided in passive and active systems. Passive sensors (e.g., digital cameras) deliver image data which are then processed with some mathematical formulations to infer 3D information from the 2D image measurements. On the other hand, active sensors (e.g., laser scanner or radar) can provide data directly for 3D information or ranges. Terrestrial active and passive sensors employed to derive 3D shapes are often referred to 3D imaging techniques [
21].
Synthetic Aperture Radar (SAR) systems (
Table 1) are not considered as optical sensors, although their use for mapping and monitoring purposes is increasing in recent years with really impressive and interesting results [
22,
23,
24]. Radar sensors are weather independent although the interpretation of radar images is more complicated if compared to optical images.
Reality-based 3D surveying and modeling is meant as the digital recording and 3D reconstruction of visual and existing scenes using active sensors and range data (
Section 2.1), passive sensors and image data (
Section 2.2), classical surveying (e.g., total stations or GNSS), 2D maps [
25] or an integration of the aforementioned methods (
Section 2.3). The choice or integration depends on the required accuracy, object dimensions, location constraints, instrument’s portability and usability, surface characteristics, working team experience, project budget, final goal of the survey, and so on. On the other hand, non-real 3D modeling approaches are based on computer graphics software (e.g., 3D Studio Max, Maya, Sketchup, Blender,
etc.) or procedural modeling approaches [
26,
27,
28] allowing the generation of really remarkable 3D data without any particular survey or knowledge of a site and with generally no metrical results.
2.1. Active Optical Sensors
Optical range sensors [
29,
30,
31] like pulsed (Time-of-Flight), phase-shift and triangulation-based (light sheet or pattern projection) instruments have received much attention in recent years, also from non-experts, for 3D surveying and modeling purposes. Range sensors directly record the 3D geometry of surfaces, producing quantitative 3D digital representations (point clouds or range maps) in a given field of view with a defined measurement uncertainty. Range sensors are getting quite common in the mapping community and heritage field, despite their high costs, weight and the usual lack of good texture. Interferometry-based systems (not covered here) can also be used to capture accurate high resolution 3D data of Cultural Heritage [
32,
33,
34].
Terrestrial range sensors (
Table 2 and
Table 3) work from very short ranges (few centimeters up to a few kilometers) in accordance with surface proprieties and environment characteristics, delivering 3D data with accuracy from some microns up to some millimeters.
Table 1.
SAR missions and sensors (VV = Vertical transmit and Vertical receive polarizations; HH = Horizontal transmit and Horizontal receive; HV = Horizontal transmit and Vertical receive).
Table 1.
SAR missions and sensors (VV = Vertical transmit and Vertical receive polarizations; HH = Horizontal transmit and Horizontal receive; HV = Horizontal transmit and Vertical receive).
| Mission/Sensor | Agency | Frequency | Polarization | Ground resol. (m) | Acquisition mode | Swath (km) | Repeated cycle |
|---|
| ERS-1/-2 | ESA | C-band | VV | 25 m | Stripmap | 100 | 35 days |
| JERS-1 | JAXA | L-band | HH | 20 m | Stripmap | 70 | 44 days |
| RADARSAT-1 | CSA | C-band | HH | 10–100 | Stripmap, ScanSAR | 50–100 | 24 days |
| SRTM | NASA/JPL & DARA/ASI | X-/C-band | VV | 20–30 | Stripmap | 30–350 | 11 days |
| ENVISAT ASAR | ESA | C-band | HH, VV, HH/HV, VV/VH | 15–1,000 | Stripmap, ScanSAR, AP | 100–405 | 35 days |
| ALOS PALSAR-1 | JAXA | L-band | single, dual, full pol | 7–100 | Stripmap, ScanSAR | 20–350 | 46 days |
| TerraSAR-X-1/-2 (TanDEM-X) | Astrium/Infoterra, DLR | X-band | single, dual, full pol | 1–16 | Stripmap, ScanSAR, Spotlight | 15–60 | 11 days |
| RADARSAT-2 | CSA & MDA | C-band | single, dual, full pol | 3–100 | Stripmap, ScanSAR | 50–500 | 24 days |
| COSMO Skymed-1/-2/-3/-4 | ASI | X-band | Single pol (HH or HV) | 1–15 | Stripmap, ScanSAR, Spotlight | 5–100 | 15 days |
| RISAT-1 | ISRO | C-band | Single, dual, full pol | 2–50 | Stripmap, ScanSAR, Spotlight | 10–240 | 12 days |
Table 2.
Most common close-range terrestrial range sensors (LL = Laser light; TR = Triangulation-based systems; SL = Structured light systems).
Table 2.
Most common close-range terrestrial range sensors (LL = Laser light; TR = Triangulation-based systems; SL = Structured light systems).
| | Meas. principle | Lateral res (mm) | Range (cm) | Accuracy (μm) | Camera | Weight (kg) | Acquisition |
|---|
| Breuckmann stereoSCAN | SL | 0.02–0.8 | 6–150 | 5–100 | 2 b/w or color (1.4–5 Mpx) | ~6 | ~1 s |
| Breuckmann smartSCAN3D-HE | SL | 0.01–0.8 | 3–150 | 5–120 | 2 b/w or color (1.4–5 Mpx) | ~4 | ~1 s |
| ShapeGrabber | LL-TR | 0.02 | 21, 29, 63, 120 | 28, 38, 87, 275 | 1 (1.3 Mpx) | >14 | >18K pts/s |
| Gom ATOS III | SL | 0.01–0.6 | - | - | 2 (8 Mpx) | - | - |
| Nextengine | LL-TR | - | 16–45 | 40–100 | 2 (3 Mpx) | 3.2 | 120 s |
| Creaform EXAscan | LL-TR | 0.05 | | 40 | 2 | 1.25 | 25 K pts/s |
| PolhemusFastSCAN | LL-TR | 0.5@200 mm | <75 | 130 | 1 or 2 | | |
| Kreon SOLANO | LL-TR | | >10 | 40 | 1 | <0.4 | 40 K pts/s |
| Artec MHT 3D | LL-TR | 0.5 | 40–100 | 100 | 1 (1.3 Mpx) | 1.6 | 500 K pts/s |
| Minolta Range7 | LL-TR | 0.08, 0.14, 0.16, 0.28 | 54, 97, 109, 194 | 40 | 1 (1.3 Mpx) | 6.7 | - |
| Vialux | SL | 0.1 | 30 | 40 | 1 | 2.3 | 0.04 s; 7M pts/s |
Terrestrial range sensors generally use a pre-defined wavelength although multispectral laser scanning systems would allow the identification of surface’s material, humidity, moisture,
etc. [
35].
According to [
36], the 3D scanning results are a function of:
- –
Intrinsic characteristics of the instrument (system calibration, measurement principle, etc.);
- –
Characteristics of the scanned material and scene, in terms of reflection, light diffusion and absorption (amplitude response);
- –
Characteristics of the working environment;
- –
Coherence of the backscattered light (phase randomization);
- –
Dependence from the chromatic content of the scanned material (frequency response).
Table 3.
Most common long-range terrestrial laser scanners (TOF = Time-of-Flight; PS = Phase Shift; λ = wavelength in nm; 1 80% reflectivity).
Table 3.
Most common long-range terrestrial laser scanners (TOF = Time-of-Flight; PS = Phase Shift; λ = wavelength in nm; 1 80% reflectivity).
| | Measur. principle | Sensor weight | Max FOV | Min/max range1 | Angular accuracy | Range accuracy | λ | Camera |
|---|
| Leica Scanstation2 | TOF | 18.5 kg | 270 × 360 | 0.3–300 | 0.003° | 4 mm @ 50 m | 532 | integrated, 1 Megapx |
| Leica C10 | TOF | 13 kg | 270 × 360 | 0.3–300 | 0.006° | 4 mm @ 50 m | 532 | integrated, 4 Megapx |
| Leica HDS6200 | PS | 14 kg | 310 × 360 | 0.4–79 | 0.007° | 3mm @ 50 m | 670 | add-on optional |
| Riegl VZ- 1000 | TOF | 9.8 kg | 100 × 360 | 2.5–1,350 | 0.0005° | 8 mm @ 100 m | NIR | add-on optional |
| Riegl VZ-400 | TOF | 9.8 kg | 100 × 360 | 1.5–350/600 | 0.0005° | 5 mm @ 100 m | NIR | add-on optional |
| Optech ILRIS HD-ER | TOF | 14 kg | 40 × 40(360 × 360) | 3–2,000 | 0.003° | 7 mm @ 100 m | 1535 | integrated, 3.1 Mpx |
| Optech ILRIS HD-LR | TOF | 14 kg | 40 × 40(360 × 360) | 3–3,000 | 0.004° | 7 mm @ 100 m | 1064 | integrated, 3.1 Mpx |
| Topcon GLS-1500 | TOF | 17.6 kg | 360 × 70 | 1–330 | 0.006° | 4 mm @ 150 m | NIR | integrated, 2 Mpx |
| Maptek I-Site 8800 | TOF | 14 kg | 360 × 80 | 2.5–1,400 | 0.01° | 10 mm | NIR | integrated, 70 Mpx |
| Trimble GX 3D | TOF | 13 kg | 360 × 60 | <350 | - | 7 mm @ 100 m | 532 | integrated videocam |
| Trimble CX | TOF & PS | 12 kg | 360 × 300 | 1–80 | 0.004° | 2 mm @ 30 m | 660 | integrated |
| Faro Photon 120 | PS | 14.5 kg | 320 × 360 | 0.6–120 | - | 2 mm @ 10 m | 785 | integrated |
| Faro Focus3D | PS | 5 kg | 305 × 360 | 0.6–20/120 | - | 0.6 mm @ 10 m, 0.95 mm @ 25 m | 905 | integrated, 70 Mpx |
| Z+F IMAGER 5006 | PS | 13.2 kg | 310 × 360 | 0.4–79 | - | 0.7 mm @ 25 m | VIS | add-on optional |
| Basis Surphaser 25HSX | PS | 11 kg | 270 × 360 | 0.2–70 | 0.01° | 1 mm @ 15 m | 690 | add-on optional |
Laser scanners (only pulsed Time-of-Flight measurement systems) can also be used on airborne platforms (helicopter or fixed wing aircraft) and are generally called LiDAR but preferably Airborne Laser Scanning (ALS,
Table 4). ALS is coupled with GNSS/INS sensors to accurately measure the position and orientation of the system for Digital Surface Models (DSM) generation, city modeling, forestry applications, corridor mapping, structural monitoring and change detection, just to mention some applications. The range digitization of actual commercial airborne laser scanners is realized using the discrete echo (multiple returns) or the full waveform principle. Range acquisition from satellite platforms is also under evaluation at NASA [
37] and ESA where different mechanisms for coverage (diffractive optical elements (DOE), multiple lasers,
etc.) are investigated.
Table 4.
Most common Airborne Laser Scanners (MR = Multiple return; FW = Full waveform; λ = Wavelength in nm).
Table 4.
Most common Airborne Laser Scanners (MR = Multiple return; FW = Full waveform; λ = Wavelength in nm).
| | Range accuracy | Operating h AGL | FOV | Range digitization | λ | Beam deflection | Typical platform |
|---|
| Optech ALTM Gemini | 5–35 cm | <4,000 m | 50° | MR (up to 4) FW as opt | 1,060 nm | oscillating mirror | airplane |
| Optech ALTM Orion | 5–15 cm | <2,500 m | 50° | MR ( up to 4) | 1,064 nm | oscillating mirror | both |
| Leica ALS60 | 2 cm | <5,000 m | 75° | MR (up to 4) FW as opt | 1,064 nm | oscillating mirror | both |
| Riegl VQ580 | 2.5 cm | <750 m | 60° | FW | NIR | rotating multi-facet mirror | both |
| Riegl LMS-Q680i | 2 cm | <1,600 m | 60° | FW | NIR | rotating multi-facet mirror | both |
| Riegl LMS-Q240i | 2 cm | <350 m | 80° | MR (up to 4) | NIR | rotating multi-facet mirror | helicopter |
| IGI LM6800 | 2 cm | <2,000 m | - | FW | 1,550 nm | rotating polygon mirror | both |
| Toposys FalconIII | 1 cm | <2,500 m | 28° | MR (up to 9) FW as opt | 1,550 nm | fiber optics | both |
| Fugro FLI-MAP 400 | 1 cm | <400 m | 60° | MR (up to 4) | 1,550 nm | rotating mirror | helicopter |
| Blom/TopEye MkII | 3.5 cm | <750 m | 20° | FW | 1,064 nm | palmer scanning | helicopter |
Airborne and terrestrial laser scanning are generally treated separately as they differ in terms of employed sensors (the former on a moving platform, the latter at fixed positions, thus influencing the initial processing of the delivered range data), project sizes, scanning mechanisms and achievable accuracy or resolutions. Due to the more frequent use of mobile platforms (see
Section 2.3) on the ground (e.g., van, ships,
etc.) another coherent distinction could be dynamic
vs. static scanning [
38].
Range sensors are nowadays employed for large area topographic mapping, DSM/DTM generation (
Figure 1), heritage documentation (
Figure 2), modeling fluvial environments and geological structures [
39], studies on biomass and vegetation information [
40,
41,
42], archaeological applications [
43], landslide and glacier monitoring, power line and corridor mapping, detection and vectorialization of man-made structures [
44,
45,
46,
47] just to mention few possible applications.
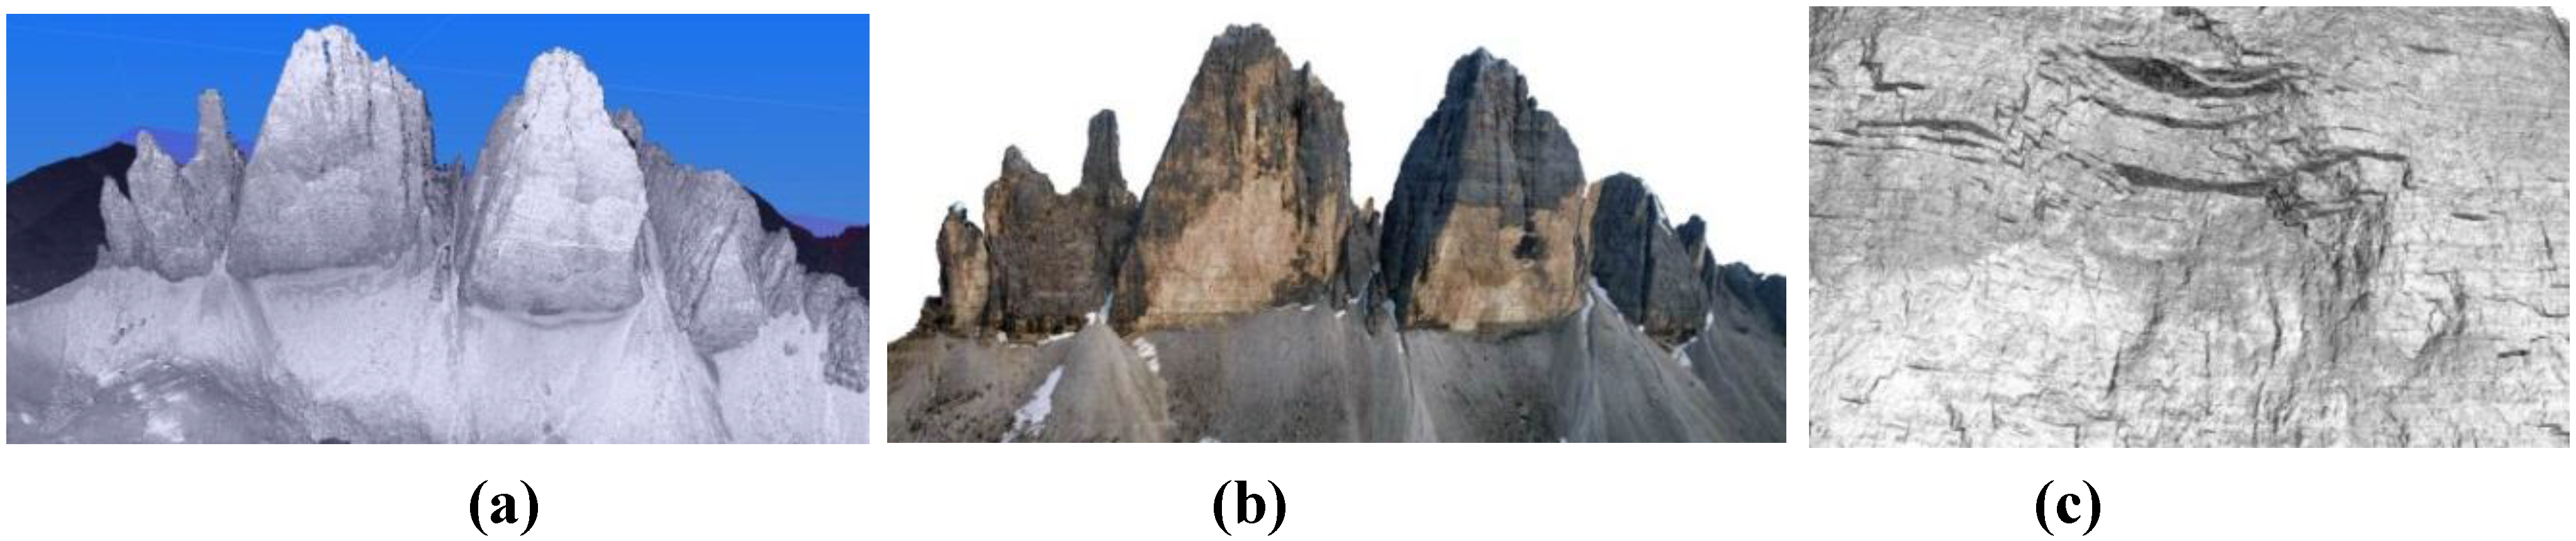
Figure 1.
3D surveying and modeling of the Three Peaks in the Dolomites area, Italy (
ca. 2 × 0.8 km), based on oblique airborne laser scanning [
47]. The acquired point cloud
(a) is rendered in a photo-realistic mode
(b) using terrestrial images projected onto the acquired 3D data.
(c) A closer view of the 3D geometric model with an average resolution of 5 cm.
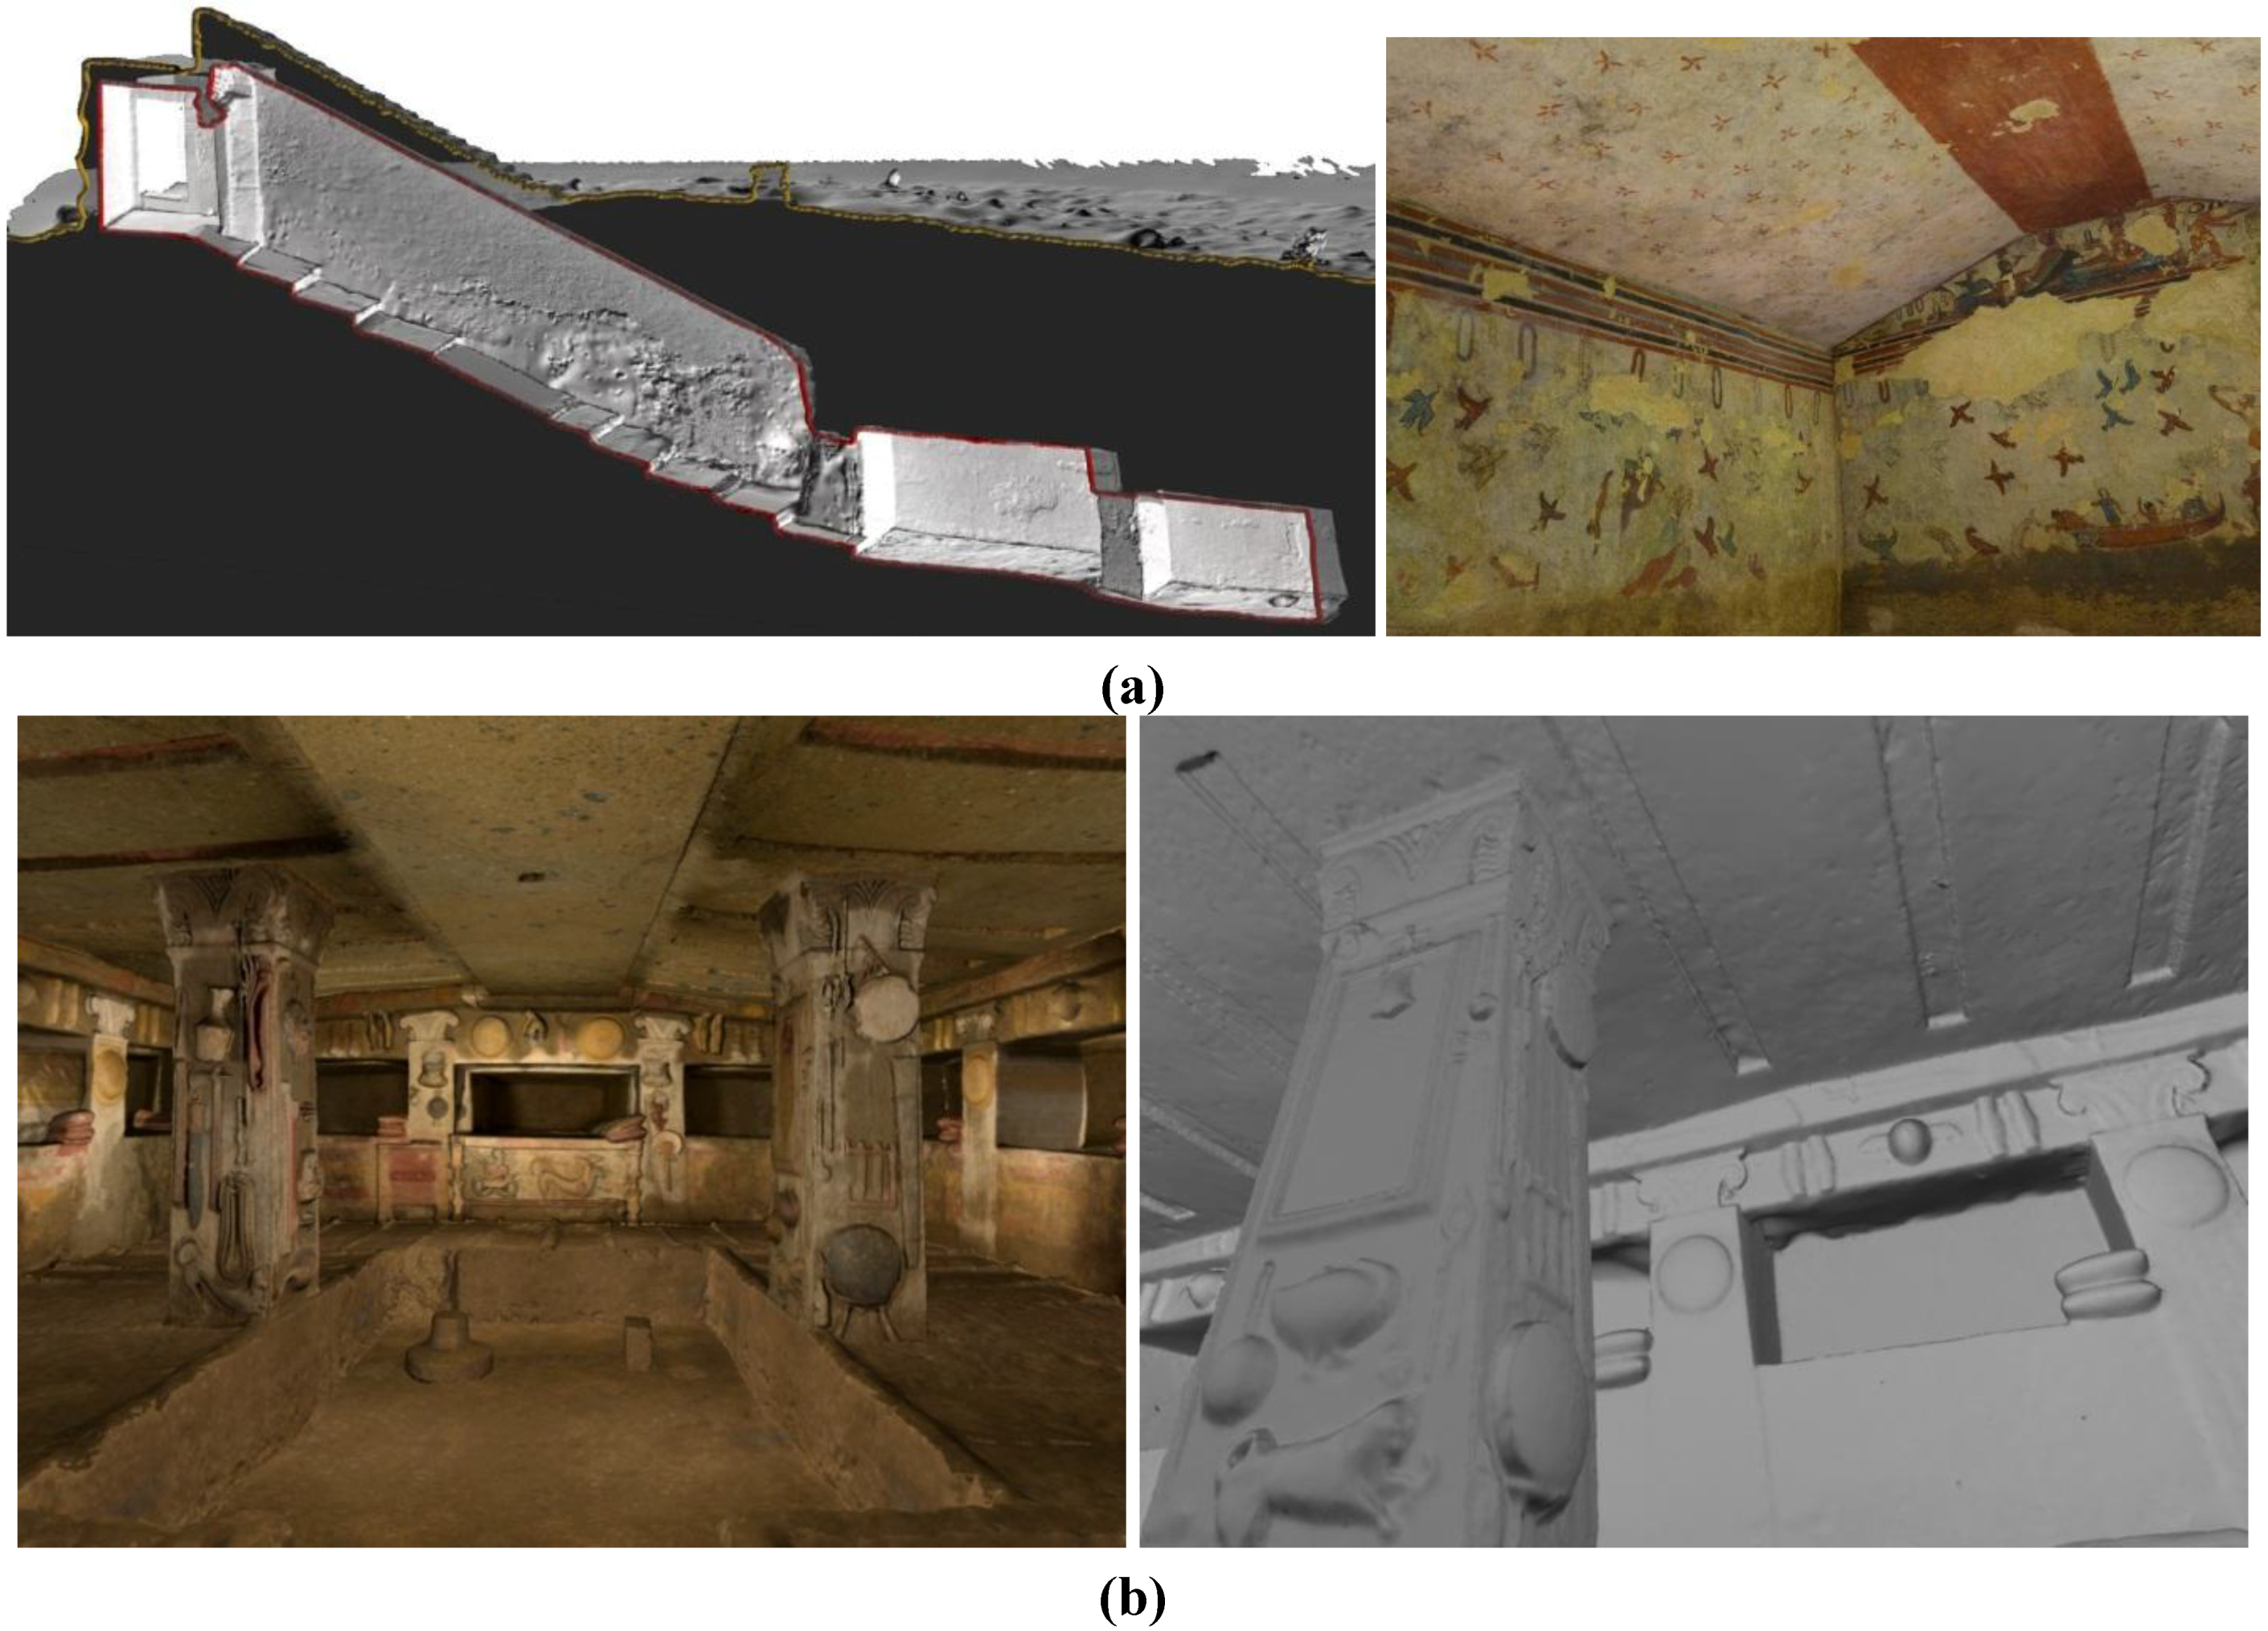
Figure 2.
3D surveying and modeling of frescoed underground Etruscan tombs for documentation, conservation, fruition and valorization purposes. (a) The “Hanting and Fish” tomb in Tarquinia, Italy. (b) The “Relief” tomb in Cerveteri, Italy.
Figure 2.
3D surveying and modeling of frescoed underground Etruscan tombs for documentation, conservation, fruition and valorization purposes. (a) The “Hanting and Fish” tomb in Tarquinia, Italy. (b) The “Relief” tomb in Cerveteri, Italy.
2.2. Imaging Sensors
Image data require a mathematical formulation to transform the 2D image measurements into 3D information. Normally at least two images are required and 3D data can be derived using perspective or projective geometry formulations [
48,
49]. Image-based modeling techniques [
50], mainly photogrammetry and computer vision, are generally preferred in case of lost objects, monuments or simple architectures with regular geometric shapes, small objects with free-form shape, point-based deformation analyses, low budget terrestrial projects, good experience of the working team and time or location constraints for the data acquisition.
Photogrammetry [
51,
52] is considered the best technique for the processing of image data, being able to deliver at any scale of application accurate, metric and detailed 3D information with estimates of precision and reliability of the unknown parameters from the measured image correspondences (tie points). Images can be acquired using satellite, aerial or terrestrial sensors (
Table 5,
Table 6 and
Table 7) and then processed following the typical photogrammetric pipeline based on sensor calibration, image orientation, surface measurement, feature extraction and orthophoto generation. Photogrammetry finds its primary fields of applications in cartography and mapping, precise 3D documentation of Cultural Heritage [
5,
12], reverse engineering, monitoring and deformation analyses of structures [
53], human movement analyses [
54], industrial measurements [
55], urban planning, forensic [
56], navigation, heating dispersion, telecommunications,
etc. With respect to range sensors, the photogrammetric processing might be still seen as tedious and not appropriate or reserved only to expert users although for different applications both recording methods are able to deliver the same 3D geometric results. There is awareness of the potential of the image-based approach with its automated and dense image matching methods [
57,
58,
59] (
Figure 3), but beside a lack of reliable commercial packages, its application by non-experts is not often an easy task and the reliability of the optical active sensor workflow (with related range-based modeling software) is still much higher for many practical projects, although time consuming and expensive.
Beside photogrammetry, computer vision is receiving great interest for 3D reconstruction applications and is having an increasing influence, especially in automatic object recognition and extraction. Even if accuracy is not the primary goal, computer vision approaches are retrieving interesting results for visualization, object-based navigation, location based services, robot control, shape recognition, augmented reality, annotation transfer or image browsing purposes.
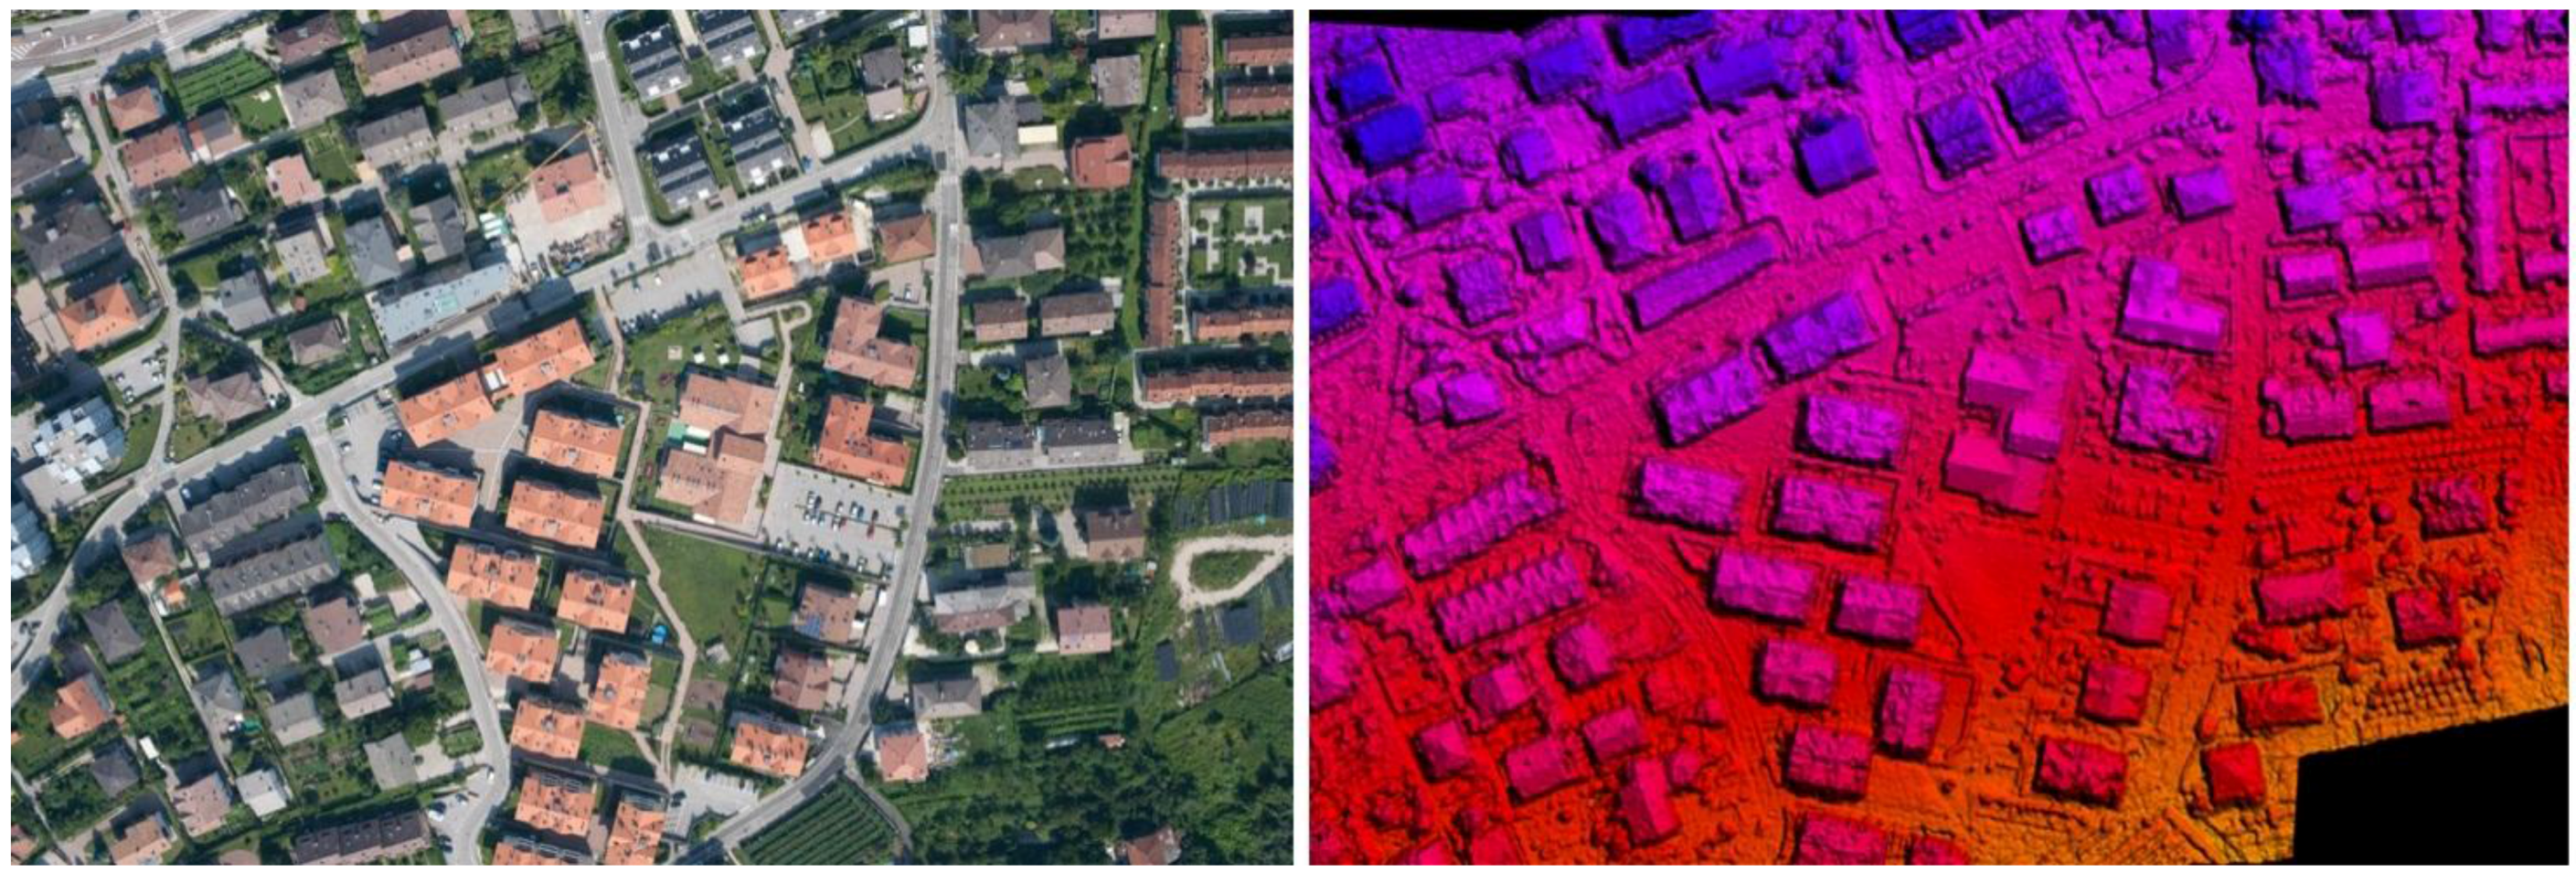
Figure 3.
Automated DSM generation (25 cm geometric resolution) from aerial images acquired with a SLR camera from a helicopter (10 cm GSC).
Figure 3.
Automated DSM generation (25 cm geometric resolution) from aerial images acquired with a SLR camera from a helicopter (10 cm GSC).
Terrestrial digital cameras (
Table 5) come in many different forms and format: single CCD/CMOS sensor, frame, linear, multiple heads, SLR-type, industrial, off-the-shelf, high-speed, panoramic head, still-video,
etc. [
60]. Common terrestrial cameras have at least 10–12 Megapixels at very low price while high-end digital back cameras feature more than 40 Megapixel sensors. Mobile phone cameras have up to 5 Megapixels and they could be even used for photogrammetric purposes [
61]. Panoramic linear array cameras are able to deliver very high resolution images with great metric performances [
62,
63,
64,
65]. The high cost of these sensors is limiting their market and thus panoramic images are also generated stitching together a set of partly overlapped images acquired from a unique point of view with a consumer or SLR digital camera which is rotated around its perspective centre. This easy and low-cost solution allows to acquire almost Gigapixel images with great potential not only for visual needs (e.g., Google Street View, 1001 Wonders,
etc.), but also for metric applications and 3D modeling purpose [
66,
67].
Table 5.
Most common terrestrial digital cameras (1weight without lens).
Table 5.
Most common terrestrial digital cameras (1weight without lens).
| Name | Type | Sensor type/ resolution | Sensor size [mm] | Pixel size [µm] | Weight [kg] 1 | RAW file | Frame rate | Shutter speed |
|---|
| Hasselblad H4D-60 | Medium Format DSLR | CCD / 60 Mpx | 53.7 × 40.2 | 6 | 1.8 | 16-bit | 0.7 fps | 1/800 |
| Pentax 645 D | Medium Format DSLR | CCD /40 Mpx | 44 × 33 | 6 | 1.48 | 14-bit | 1.1 fps | 1/4,000 |
| Mamiya DM33 | Medium Format DSLR | CCD / 33 Mpx | 48 × 36 | 7 | 1.63 | 16-bit | 1.1 fps | - |
| Canon EOS-1Ds Mark III | 35 mm full frame format DSLR | CMOS / 22 Mpx | 36 × 24 | 6.4 | 1.385 | 14-bit | 5 fps | 1/8,000 |
| Nikon D3X | 35 mm full frame format DSLR | CMOS / 24.5 Mpx | 35.9 × 24 | 5.95 | 1.260 | 14-bit | 5 fps | 1/8,000 |
| Sony α900 | 35 mm full frame format DSLR | CMOS/ 24.6 Mpx | 35.9 × 24 | 5.9 | 0.895 | 12-bit | 5 fps | 1/8,000 |
| Sony αNEX-5 | APS C | CMOS / 14 Mpx | 23.5 × 15.7 | 5.1 | 0.287 | 12 bit | 2.3 fps | 1/4,000 |
| Olympus E-PL2 | Micro four Thirds system | Live MOS / 12.3 Mp | 17.3 × 13 | 4.3 | 0.317 | 12-bit | 3 fps | 1/4,000 |
| Panasonic Lumix DMC-GH2 | Micro four Thirds system | Live MOS / 16.1 Mpx | 18.9 × 14.5 | 4.1 | 0.394 | 12-bit | 5 fps | 1/4,000 |
Almost ten years after the introduction into the market of the first digital large format aerial camera, nowadays we have a great variety of aerial digital sensors (
Table 6) which are generally classified as small, medium and large format cameras [
68]. The different systems feature frame sensors or pushbroom line scanners (linear arrays), achieving color images with the Bayer filter option or using multiple cameras/lines, each recording a single spectral band and then registering and superimposing the separated images (generally RGB + NIR). Between the available aerial acquisition platforms, particular interest has been devoted to the UAVs, (Unmanned Aerial Vehicles) like low-altitude model helicopters which can fly in an autonomous mode, using integrated GNSS/INS, stabilizer platform and digital cameras (or even a small laser scanner) and which can be used to get data from otherwise hardly accessible areas [
69]. In particular, High Altitude Long Endurance (HALE) UAV platforms are covering the gap between space and airborne systems and could be a useful geomatics platform.
Table 6.
Primary airborne digital cameras and systems.
Table 6.
Primary airborne digital cameras and systems.
| Format | System | Sensor type | No. frames/lines | Spectral Bands | Geometric resolution | Pixel size [μm] |
|---|
| SMALL FORMAT | MosaicMill / EnsoMosaic | Frame | 1 | RGB | 21 Mpx (Canon Eos 1DS Mark III) | 6.4 |
| Geoniss | Frame | 1 | RGB | 24 Mpx(Nikon D3X) | 6 |
| Vision Map A3 | Frame | 2 | PAN, RGB, NIR | 11 Mpx per frame | 9 |
| VisionMap MIST | Frame | 1 | RGB | 11 Mpx | 9 |
| Tiltan System Eng. AMU | Frame | 2 | RGB | 11 Mpx per frame | 9 |
| Track’Air MIDIS | Frame | 5, 9 | RGB | 21 Mpx per frame (Canon Eos 1DS Mark III) | 6.4 |
| MEDIUM FORMAT | Wehrli 3-DAS-1 | Linear | 3 | RGB | 8,023 px per line | 9 |
| Trimble DSS Wideangle | Frame | 1 | RGB | 6,732 × 8,924 px (60 Mpx) | 6.8 |
| Trimble DSS Dualcam | Frame | 2 | RGB, NIR | 5,412 × 7,216 px per frame | 6.8 |
| Trimble Aerial Camera | Frame | 1 | RGB, NIR | 22, 39 or 60 Mpx | 9, 6.8, 6 |
| Trimble Aerial Camera X4 | Frame | 4 | RGB | 39 or 60 Mpx per frame (135 or 210 Mpx composite) | 6.8, 6 |
| Optech / DIMAC wide | Frame | 2 | RGB | 13,000 × 8,900 px composite | 6 |
| Optech / DIMAC light | Frame | 1 | RGB | 8,984 × 6,732 px | 6 |
| IGI DigiCAM | Frame | 1, | RGB, NIR | 60, 50, 39 Mpx | 6, 6, 6.8 |
| 2, | 118, 98, 76 Mpx |
| 3, | 175, 145, 112 Mpx |
| 4, | 235, 191, 145 Mpx |
| 5, | 60, 50, 39 Mpx |
| LARGE FORMAT | Z/I Imaging DMC II 250 | Frame | 4 PAN | PAN, RGB, NIR | PAN: 250 Mpx (17,216 × 14,656 px) | 5.6 |
| 4 MS | MS: 4 × 42 Mpx (6,846 × 6,096 px) | 7.2 |
| Microsoft/Vexcel UltraCam Xp | Frame | 9 PAN | PAN, RGB, NIR | PAN: 196 Mpx (17,310 × 11,310 px) | 6 |
| 4 MS | MS: 22 Mpx (5,770 × 3,770 px) | 6 |
| Leica ADS-80 | Linear | 4 PAN | PAN, RGB, NIR | 12,000 px per line | 6.5 |
| 4 MS |
The number of existing and planned high and very high resolution imaging satellite sensors (
Table 7) is growing with very interesting prospective for the near future. Optical satellite imaging still depends on cloud coverage but large archives are available, often with stereo-pairs for geomatics applications thus bringing photogrammetric methodologies more close to traditional remote sensing.
Furthermore satellite platforms have a frequent revisit time and they can easily access remote heritage or restricted areas, constituting an interesting tool for DTM/DSM generation (
Figure 4), topographic mapping at medium and small scale or identification of archaeological sites [
70,
71,
72]. Since some years, an innovative solution and cheaper alternative to standard and large satellite systems is represented by the small satellites, lighter systems designed inside smaller volumes and generally orbiting in constellations.
Table 7.
High resolution (<15 m) optical satellite sensors (AL = along-track; AC = across-track).
Table 7.
High resolution (<15 m) optical satellite sensors (AL = along-track; AC = across-track).
| Sensor | No. sensors | Focal length [mm] | Stereo | Incidence angles (°) | Channels | Ground resolution (GSD)[m] | Swath width [km] | No. pixels/line |
|---|
| GEOEYE-1 | 1 | 13,300 | AL | up to ±60 | PAN | 0.41 | 15.2 | 30,000 |
| RGB, NIR | 1.64 |
| WORLDVIEW-1 | 1 | 8,800 | AL | up to ±45 | PAN | 0.50 | 17.6 | 35,000 |
| WORLDVIEW-2 | 1 | 13,300 | AL | up to ±45 | PAN | 0.46 | 16.4 | 31,000 |
| RGB, NIR1, NIR2, COASTAL, YELLOW, RED EDGES | 1.80 |
| QUICKBIRD-2 | 1 | 8,800 | AL | up to ±30 | PAN | 0.6 | 16.5 | 27,000 |
| RGB, NIR | 2.4 |
| IKONOS-2 | 1 | 10,000 | AL | up to ±60 | PAN | 1 | 11 | 13,500 |
| RGB, NIR | 4 |
| EROS-A1 | 1 | 3,500 | AL/AC | up to ±45 | PAN | 1.8 | 14 | 7,800 |
| CARTOSAT-2 | 2 | 1,945 | AL | 26, -5 | PAN | 2.5 | 30 | 12,288 |
| ALOS-PRISM | 3 | 2,000 | AL | 0 | PAN | 2.5 | 70 | 28,000 |
| ±24 | 35 | 14,000 |
| RAPIDEYE | 1 | 633 | AC | ±25 | 4 VIS, NIR | 6.5 | 78 | 12,000 |
| SPOT-5/HRG | 2 | 1,082 | AC | up to ±27 | PAN | 5 (2.5) | 60 | 24,000 |
| RG, NIR | 10 | 6,000 |
| SPOT-5/HRS | 2 | 580 | AL | ±20 | PAN | 10 | 120 | 12,000 |
| ASTER-VNIR | 2 | 329 | AL | 0 | RG | 15 | 60 | 5,000 |
| 0, −27 | NIR |
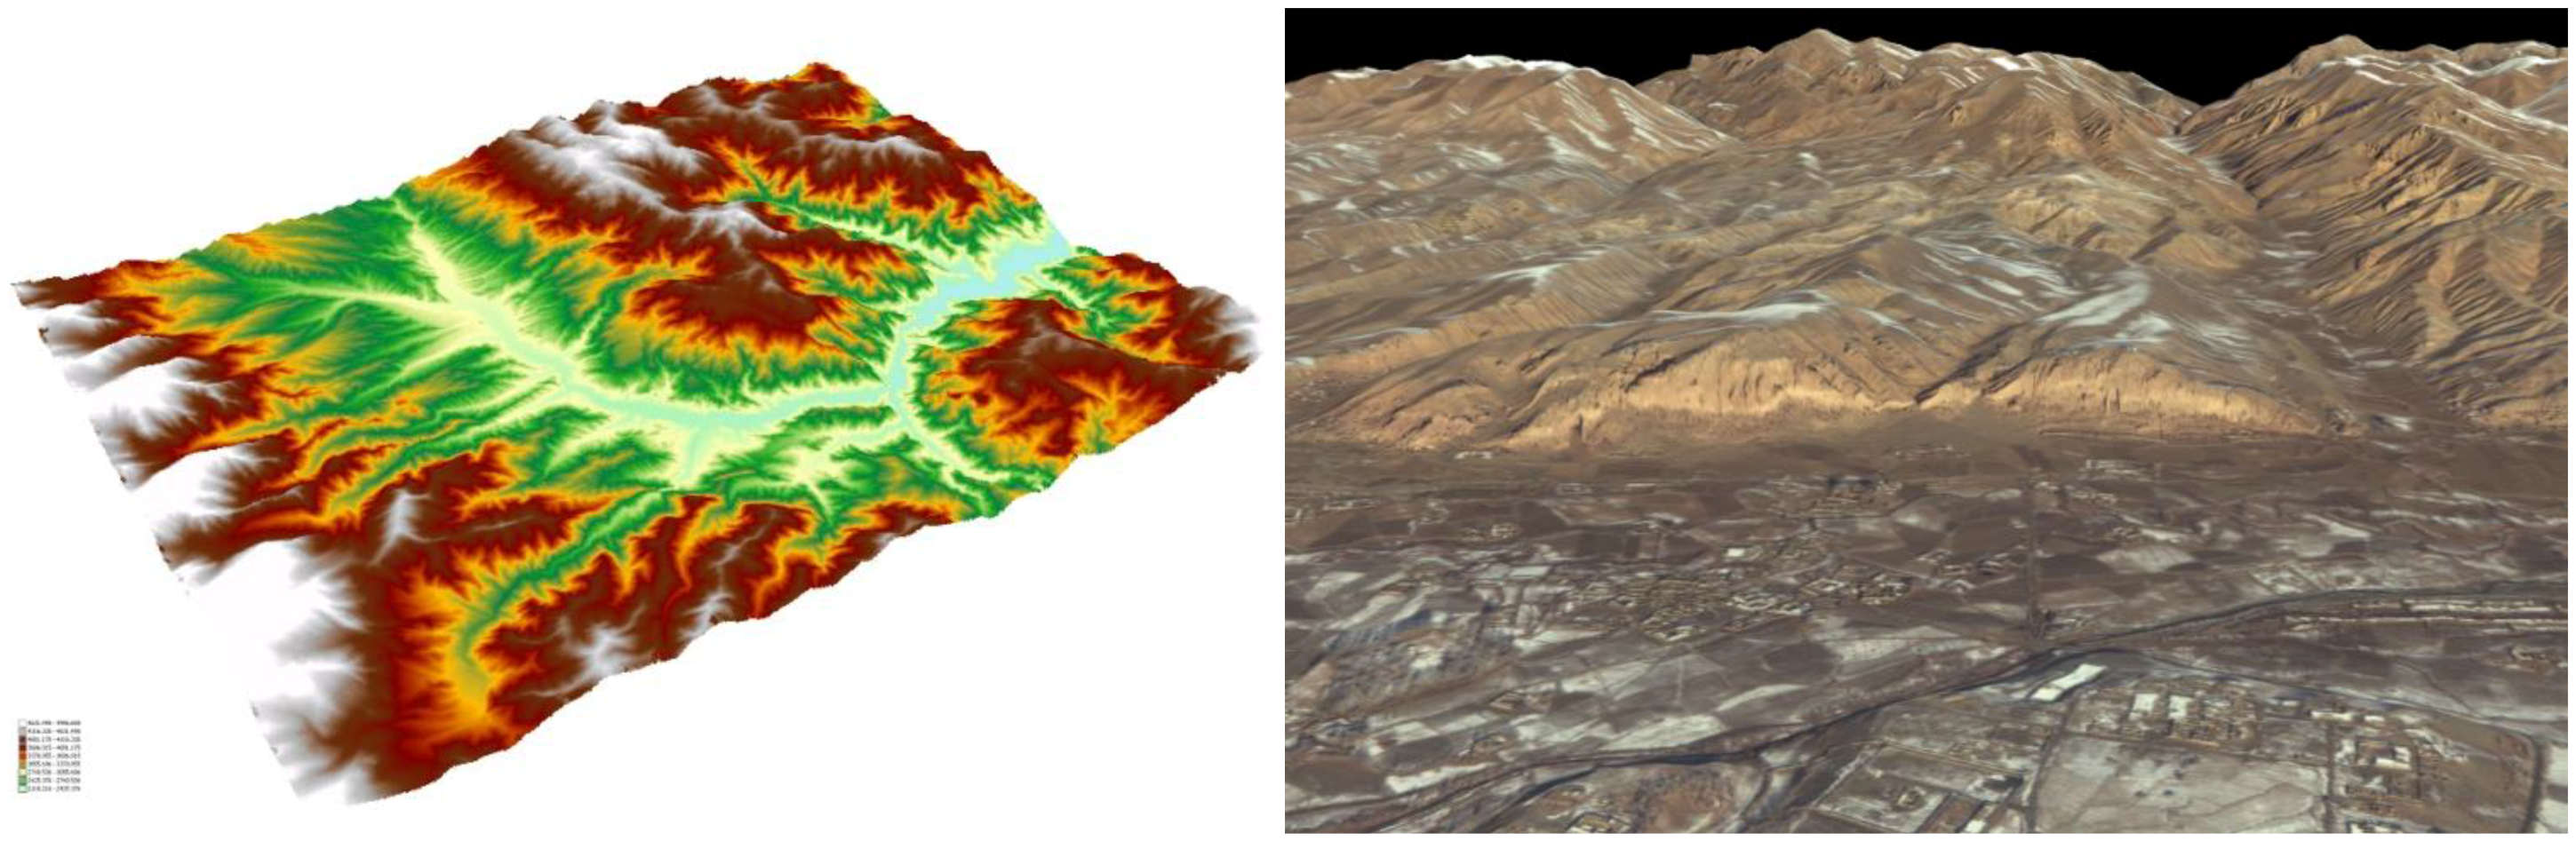
Figure 4.
DSM generation from SPOT-5 HRG (left) and textured digital model with a PAN IKONOS image mosaic (right) over the Bamiyan area, Afghanistan [
70].
Figure 4.
DSM generation from SPOT-5 HRG (left) and textured digital model with a PAN IKONOS image mosaic (right) over the Bamiyan area, Afghanistan [
70].
2.3. Sensors and Data Integration
Nowadays there is still great discussion on which 3D recording and measurement approach or technique is better in which surveying situation. So far the best answer to this question is given by the market which is generally more in favor of range sensors, in particular for heritage sites. However, in many research projects the combination and integration of different sensors and techniques is the ideal solution, in particular to survey large and complex sites and improve the extraction of features [
73,
74,
75,
76,
77,
78,
79,
80].
Indeed the generation of digital 3D models of large sites for documentation and conservation purposes requires a technique with the following properties:
- –
accuracy: precision and reliability are two important factors of the surveying work, unless the work is done for simple and quick visualization;
- –
portability: a technique, in particular for terrestrial acquisitions, should be portable due to issues of accessibility for many heritage sites, absence of electricity, location constraints, etc.;
- –
low cost: most archaeological and documentation missions have limited budgets and cannot afford expensive surveying instruments;
- –
fast acquisition: most sites and excavation areas have limited time for documentation so as not to disturb works or visitors;
- –
flexibility: due to the great variety and dimensions of sites and objects, the surveying technique should allow for different scales and it should be applicable in any possible condition.
As all these properties are not often found in a single technique, most of the surveying projects related to large and complex sites integrate and combine multiple sensors and techniques in order to achieve more accurate and complete 3D surveying and modeling results (
Figure 5).
The integration is generally done at sensor or data level. Data fusion is a standard framework for combining data coming from different sources. Examples are given by optical satellite data combined with radar images, panchromatic with multi-spectral images, aerial images with LiDAR data or terrestrial scanning with photogrammetric data. On the other hand, Mobile Mapping (MM) systems are the best example of sensor integration and cost-effective acquisition of geo-referenced spatial data, with a combination of digital imaging devices, long-range laser scanners and GNSS/IMU positioning sensors [
81]. MM systems (
Table 8) have developed from a typical academic research to commercially operating systems used for topographic surveying, 3D mapping of traffic arteries, city planning, visual street-level image and vector data acquisitions, visualization,
etc. The accuracy requirements for the data that has to be acquired is substantially different in each application, with cartographic mapping and road or rail infrastructure surveying being much more demanding in this particular respect.
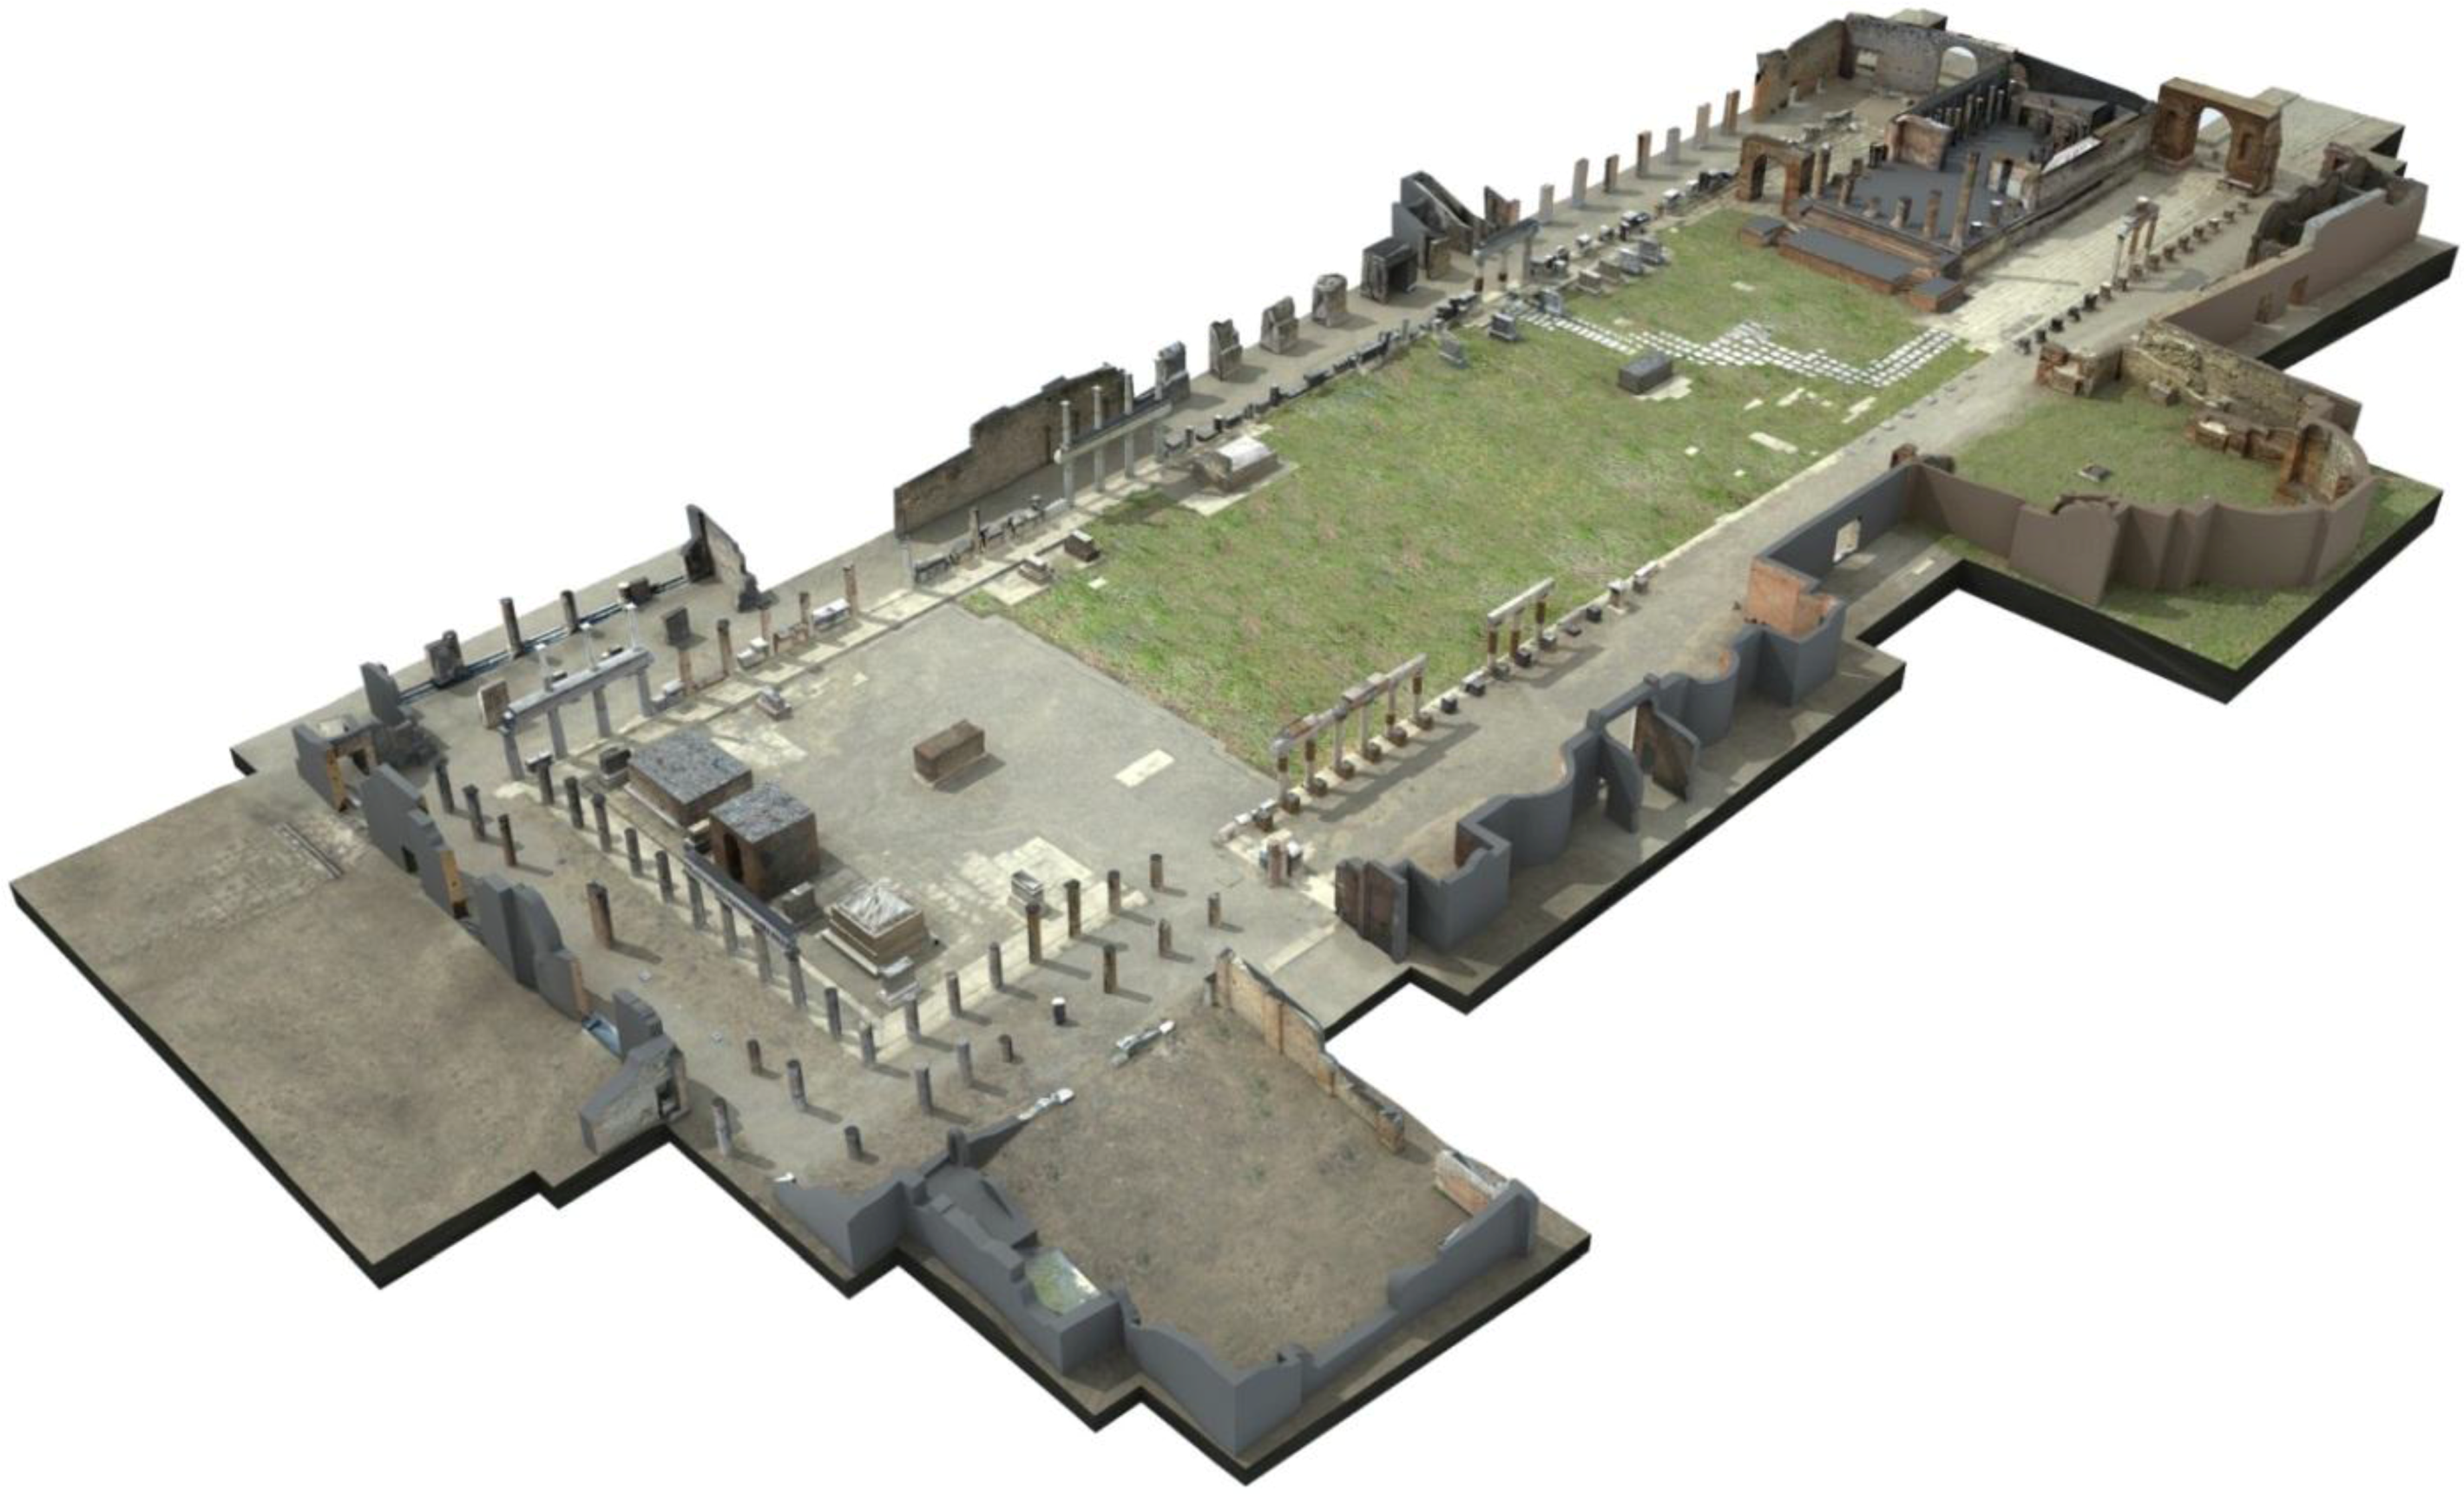
Figure 5.
3D modeling results of the complex archaeological site of the forum in Pompeii (Italy) performed integrating terrestrial images, long-range TOF scanning and aerial images [
79].
Figure 5.
3D modeling results of the complex archaeological site of the forum in Pompeii (Italy) performed integrating terrestrial images, long-range TOF scanning and aerial images [
79].
Table 8.
Most common Mobile Mapping system suppliers and related components (1 Reflectivity of 80%; 2 Vehicle positional accuracy).
Table 8.
Most common Mobile Mapping system suppliers and related components (1 Reflectivity of 80%; 2 Vehicle positional accuracy).
| Supplier | Name | Scanner(s) | Range1 | Frequency | Abs. acc. | Pos. acc. 2 | Camera(s) |
|---|
| TOPCON | IP-S2 | 3 | <80 m | - | <10 cm | - | Optional (360 spherical) |
| RIEGL | VMX-250 | 2 | <300 m | <300 K pts/s | ±1 cm | - | optional |
| 3D Laser Mapping | StreetMapper | 2-4 | <300 m | <300 K pts/s | ±2 cm | <2 cm | 2 (12 Mpx each) |
| OPTECH | Lynx | 2 | <200 m | <400 K pts/s | | | 2 |
| MITSUBISHI | MMS-X640 | 4 | <300 m | - | <10 cm | <6 cm | 6 (5 Mpx each) |
| MDL | Dynascan | 1,2,3 heads | <500 m | <36 K pts/s/head | ±5 cm | - | - |
| TRIMBLE | Cougar | 2 | <150 m | <10 K pts/s | - | - | 2 |
Another interesting sensor fusion and integration is given by the Range Imaging (RIM) cameras (
Table 9), which integrate distance measurements and imaging aspects. RIM sensors consist of an illumination unit (pulsed, modulated or structured light), an optics, an image sensor (CCD, CMOS or APD), some driver electronics and a computation unit. The distance measurement (and so the 3D shape of the scene) is based on:
- –
the estimation of the travel time of the electromagnetic wave sent to the scene by the illumination unit and reflected back. The time estimation is performed by:
- (i)
the indirect time measurement using the phase-shift principle;
- (ii)
the direct time measurement using a laser pulse;
- –
the triangulation measurement principle.
Beside the generally short ranges, the actual main problems in the RIM cameras are related to systematic and non-systematic errors (low signal-to-noise ratio, scattering and reflections, thermal effects, motion artefact, lens distortion,
etc.) which should be compensated with accurate calibration procedures [
82,
83,
84].
Table 9.
Most common commercial Range Imaging (RIM) cameras (PS = Phase-Shift; DTOF = Direct Time-of-Flight; Triang. = Triangulation; λ = wavelength in nm).
Table 9.
Most common commercial Range Imaging (RIM) cameras (PS = Phase-Shift; DTOF = Direct Time-of-Flight; Triang. = Triangulation; λ = wavelength in nm).
| | Name | Meas. princ. | Sensor resol. [px] | Max range [m] | Max framerate | Mod. freq. | λ | Accuracy / repeatability |
|---|
| 3DV System | ZCamII | DTOF | 320 × 240 | 10 | - | - | - | - |
| ASC Inc. | DragonEye | DTOF | 128 × 128 | 1500 | 10 fps | - | 1,570 | ±15 cm |
| CANESTA/Microsoft | Cobra | - | 320 × 200 | - | - | - | - | millimetric |
| FOTONIC | B70 | PS | 160 × 120 | 7.0 | 75 fps | 44 | 808 | ±1.5 cm at 3–7 m (accuracy); ±3 cm at 3–7 m (uncertainty) |
| MESA | SR-400 | PS | 176 × 144 | 5–10 | 54 fps | 30–15 MHz | 850 | ±1–1.5 cm |
| OPTRIMA | DS10K-A | PS | 120 × 90 | 10.0 | 50 fps | - | 870 | noise level < 3 cm at 3.5 m |
| PANASONIC | D-Imager | PS | 160 × 120 | 9.0 | 30 fps | - | 870 | ±4 cm |
| PMD Tech. | CamCube | PS | 200 × 200 | 7.5 | 15 fps | 21 | 870 | ±3 cm |
| STANLEY El. | P-300 | PS | 128 × 128 | 15 | 30 fps | 10 | 850 | repeatability 1% of the range (at 3 m) |
| PrimeSense / Microsoft | Kinect | Triang. | 640 × 480 | 5 | 30 fps | - | IR | ±2 mm horiz. |
3. Actual Problems and Bottlenecks in the 3D Modeling Pipeline
The actual problems and main challenges in 3D surveying and modeling of large sites or complex objects arise in every phase, from the data acquisition to the visualization of the achieved 3D results.
3D modeling should be intended as the generation of structured 3D data from the surveyed unstructured data and it consists of geometric and appearance modeling. Geometric modeling deals with the data registration and processing (editing, cleaning, meshing), while appearance modeling deals with texturing, blending, rendering simplification and LOD. The entire 3D modeling pipeline is generally a chain of lossy procedures and data transformations performed to derive new products thus the operator and employed algorithms must assure the lossy procedure is as late as possible in the processing chain.
The term “3D modeling” is more common in case of terrestrial applications while in the aerial domain it is more frequently used the term “mapping”. As nowadays there is a clear convergence of photogrammetric methodologies into the typical remote sensing domain and the new data processing algorithms are delivering really remarkable 3D models, the “3D mapping” concept should also stressed in order to move from the traditional 2D and 2.5D mapping to fully 3D products even at topographic and urban level. The BIM (Building Information Modeling) concept is going in this direction trying to manage building data integrating geometries, spatial relationships, geographic information, quantities and further geometric or semantic properties [
85].
Despite all the available remote sensing technologies and potentialities, the 3D modeling pipeline has still some problems and challenges in:
- (i)
selecting the appropriate methodology (sensor, hardware, software) and data processing procedure;
- (ii)
designing the proper production workflow, guaranteeing that the final result is in accordance with all the given technical specifications;
- (iii)
speeding up the data processing time with as much automation as possible but always with the accuracy as primary goal;
- (iv)
being able to fluently display and interact with the achieved 3D model.
3.1. Data Acquisition
3.1.1. Digital Images
Optical remote sensing images have a limited availability given by weather conditions and, specifically for aerial images, restrictions on flights. The satellite imaging quality is often affected by sensor viewing angle, sun acquisition angles, atmospheric conditions, saturation problems and other anomalies (
Figure 6). The image acquisition geometry is not very flexible and the radiometric resolution is generally too low. These issues can be slightly corrected with some radiometric analyses, filtering and masking but they can significantly affect the performances of automated feature extraction algorithms [
86]. Last but not least, although they have a larger terrain coverage, the costs of satellite imagery are often too high when compared to aerial images. So the large variety and number of frame or pushbroom aerial sensors is still very attractive with a wide variety of possible geometric resolutions, very flexible acquisition geometries and camera configurations. The announced new satellite missions with 0.3 m or even less GSD (Cartosat-3, GeoEye-2,
etc.) and better radiometric properties will in any case bring the two technologies closer, in particular for mapping applications and the selection decision between them will probably be based only on economic aspects and availability of images. Optical space sensors acquiring across-track stereo images have a reduced imaging capacity and a lesser image quality while along-track acquisitions might produce scale differences (
Figure 6(c)). For all these reasons, only a limited number of high-resolution stereo images are available in provider archives for fully automated and accurate DSM generation or feature extraction.
In terrestrial acquisitions, occlusions given by natural and man-made structures can cause a delay in the data capturing or missing details and can force acquisitions with unfavorable baselines and network geometry.
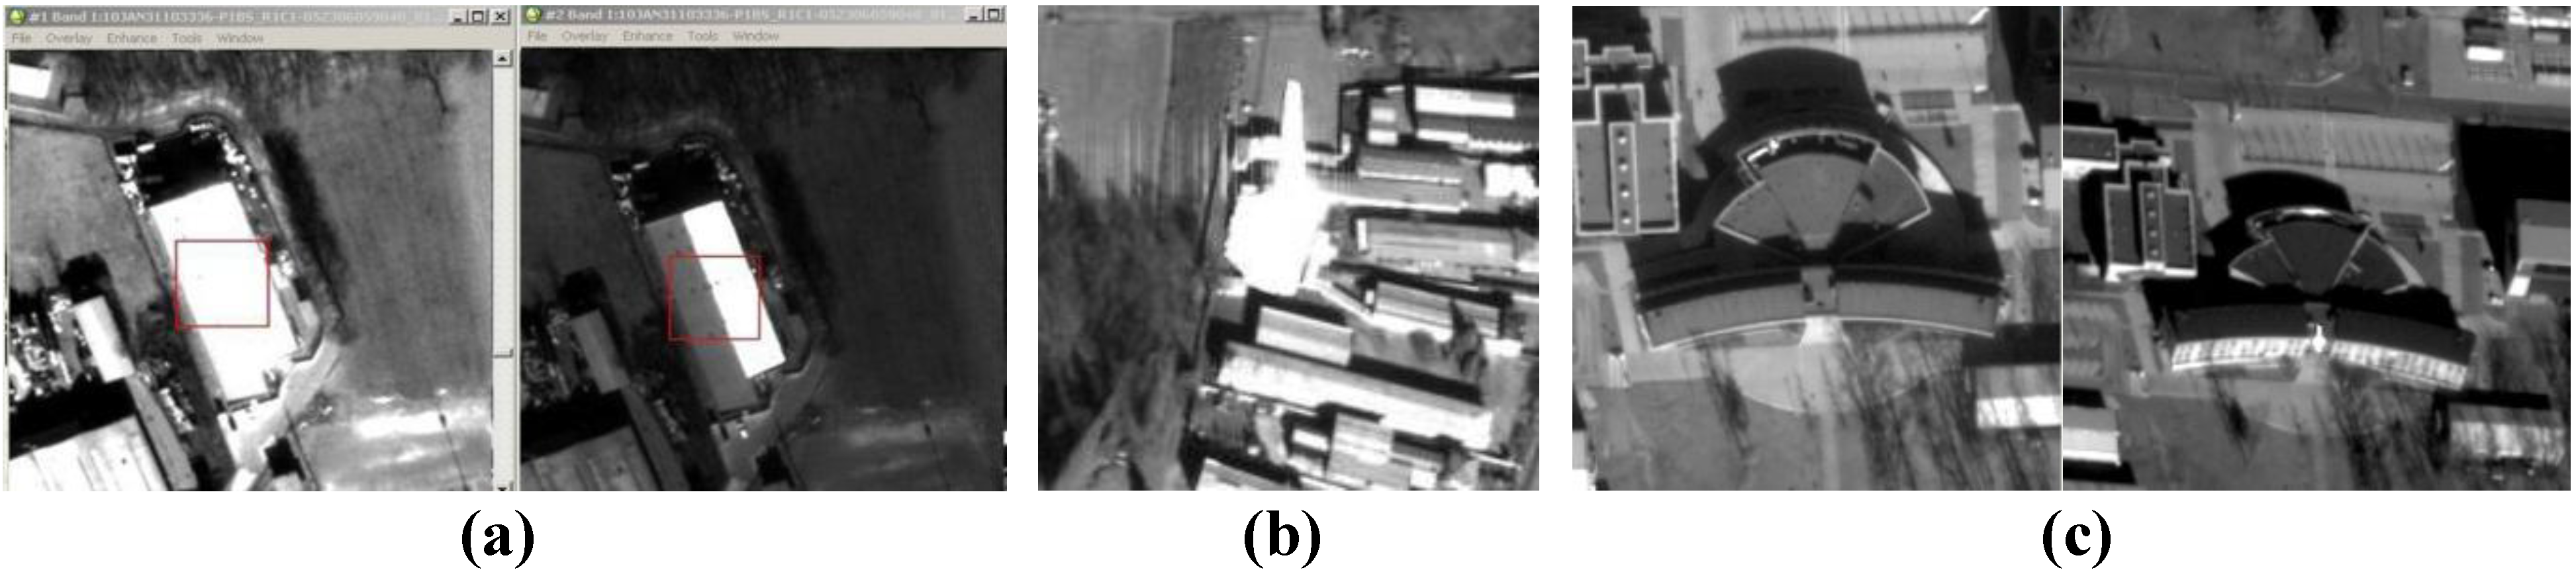
Figure 6.
Typical artefacts and problems in satellite imagery (here a WorldView-2 stereo-pair): saturation (a), spilling (b) and scale (c).
Figure 6.
Typical artefacts and problems in satellite imagery (here a WorldView-2 stereo-pair): saturation (a), spilling (b) and scale (c).
3.1.2. Range Data
Airborne laser scanning (ALS) is composed of different components which contribute to the final accuracy of the range data. All the components should be accurately calibrated and integrated. Discrete echo laser scanners, using analogue detectors, record in real time a significant trigger signal for the multiple echoes. On the other hand full-waveform scanners digitize the time-dependent variation of the received echo for each emitted laser pulse. Thus they have both advantages and disadvantages and they are suited for different applications. ALS acquisitions are partly weather-dependent (fog, wetness, etc.) but they can also be done at night.
In terrestrial scanning, the size and location and the surface (geometry and material) of the surveyed object can create several problems. Furthermore obstructions, rough or sloped surfaces, unfavorable weather conditions, excessive ambient light,
etc. can cause wrong measurements, acquisition delays or enforce acquisitions from inadequate positions. The complexity of some parts can create self-occlusions or holes in the surveying coverage, in addition to the occlusions from plants, trees, restoration scaffolds or tourists. The absence of high platforms for a higher location of the data acquisition might cause missing parts, e.g., for the roofs or upper parts of a monument. The object’s material (e.g., marble) has often an important influence on the acquired range data since it can cause penetration [
87,
88,
89] or bad reflection effects. Moreover, transportability and usability problems arise in certain field campaigns located in remote areas. Scene discontinuities and surface edges can also create artefacts and blunders when surveyed with TOF laser scanners.
In order to compensate for any systematic errors, terrestrial range sensors need to be accurately calibrated [
90,
91,
92] following acceptance procedures for testing the accuracy and repeatability of the measuring systems.
For both aerial and terrestrial acquisitions, the used sampled distance in scanning is rarely optimal for the entire site or object, producing under sampled regions where edges and high curvature surfaces are present and over-sampled regions where flat areas are. These problems affect the successive modeling phase and the quality of the final 3D results.
3.2. Data Processing, Feature Extraction and Point Cloud Generation
3.2.1. Digital Images
The sensor’s geometry of aerial and satellite imagery are generally recovered using the calibration protocols, GNSS/INS observations or the Rational Polynomial Coefficients (RPCs). RPCs usually provide for good relative orientation, while the absolute orientation has generally some systematic errors represented by a shift in coordinates which need to be corrected. The collinearity model is valid for frame cameras while for linear array sensors a different mathematical formulation should be employed. Empirical models based on affine, projective or DLT transformation were proposed, finding their main application in the processing of high resolution satellite imagery [
93,
94]. Using the RPCs or precise GNSS/INS data, the sensor orientation and image triangulation can be done in a fully automated way (direct geo-referencing). A bottleneck is the requirement and measurement of Ground Control Points (GCPs) in order to increase the absolute geo-referencing accuracy.
As far as terrestrial images is concerning, digital cameras must be accurately calibrated, preferably in a controlled lab environment, with a 3D testfield and a bundle adjustment solution with additional parameters to fully compensate for systematic errors [
95]. Generally a target-based approach is used, in order to automatically identify and precisely measure the homologues points.
The image orientation phase in terrestrial applications is still highly interactive if targets cannot be used as no commercial procedure is actually available for automated markerless tie point extraction from convergent images. Recent developments in markerless automated orientation are promising with reliable and precise results (
Figure 7) from different kind of block configurations [
96,
97,
98,
99].
Figure 7.
Automated recovery of camera poses and sparse point cloud for a long terrestrial image sequence [
97].
Figure 7.
Automated recovery of camera poses and sparse point cloud for a long terrestrial image sequence [
97].
For complex architectural scenes, man-made objects, detailed city modeling and cartographic applications at large scale, surface measurement and feature extraction are mainly based on manual or semi-automated approaches as still much more reliable and precise (
Figure 8). On the other hand, small free-form objects, ornaments rich of details or small/medium scale DSM can be automatically reconstructed (
Figure 9) using area- or feature-based matching techniques to produce dense 3D point clouds [
58,
100,
101,
102,
103]. Recently, semi global matching approaches demonstrated their high versatility and potentialities in the generation of high quality DSM of complex scenes [
57,
59,
104,
105]. Fully automated methods based on “structure from motion” approaches [
106,
107,
108] are getting quite common in the 3D heritage community, although mainly useful for visualization, object-based navigation, annotation transfer or image browsing purposes as not suitable for metric and accurate 3D reconstructions and documentations. In all 3D reconstruction applications based on dense image matching, it is always better to separate the calibration, orientation and dense matching steps. Commercial image matching procedures are generally tailored for vertical acquisitions therefore convergent terrestrial images with large scale difference are still problematic.
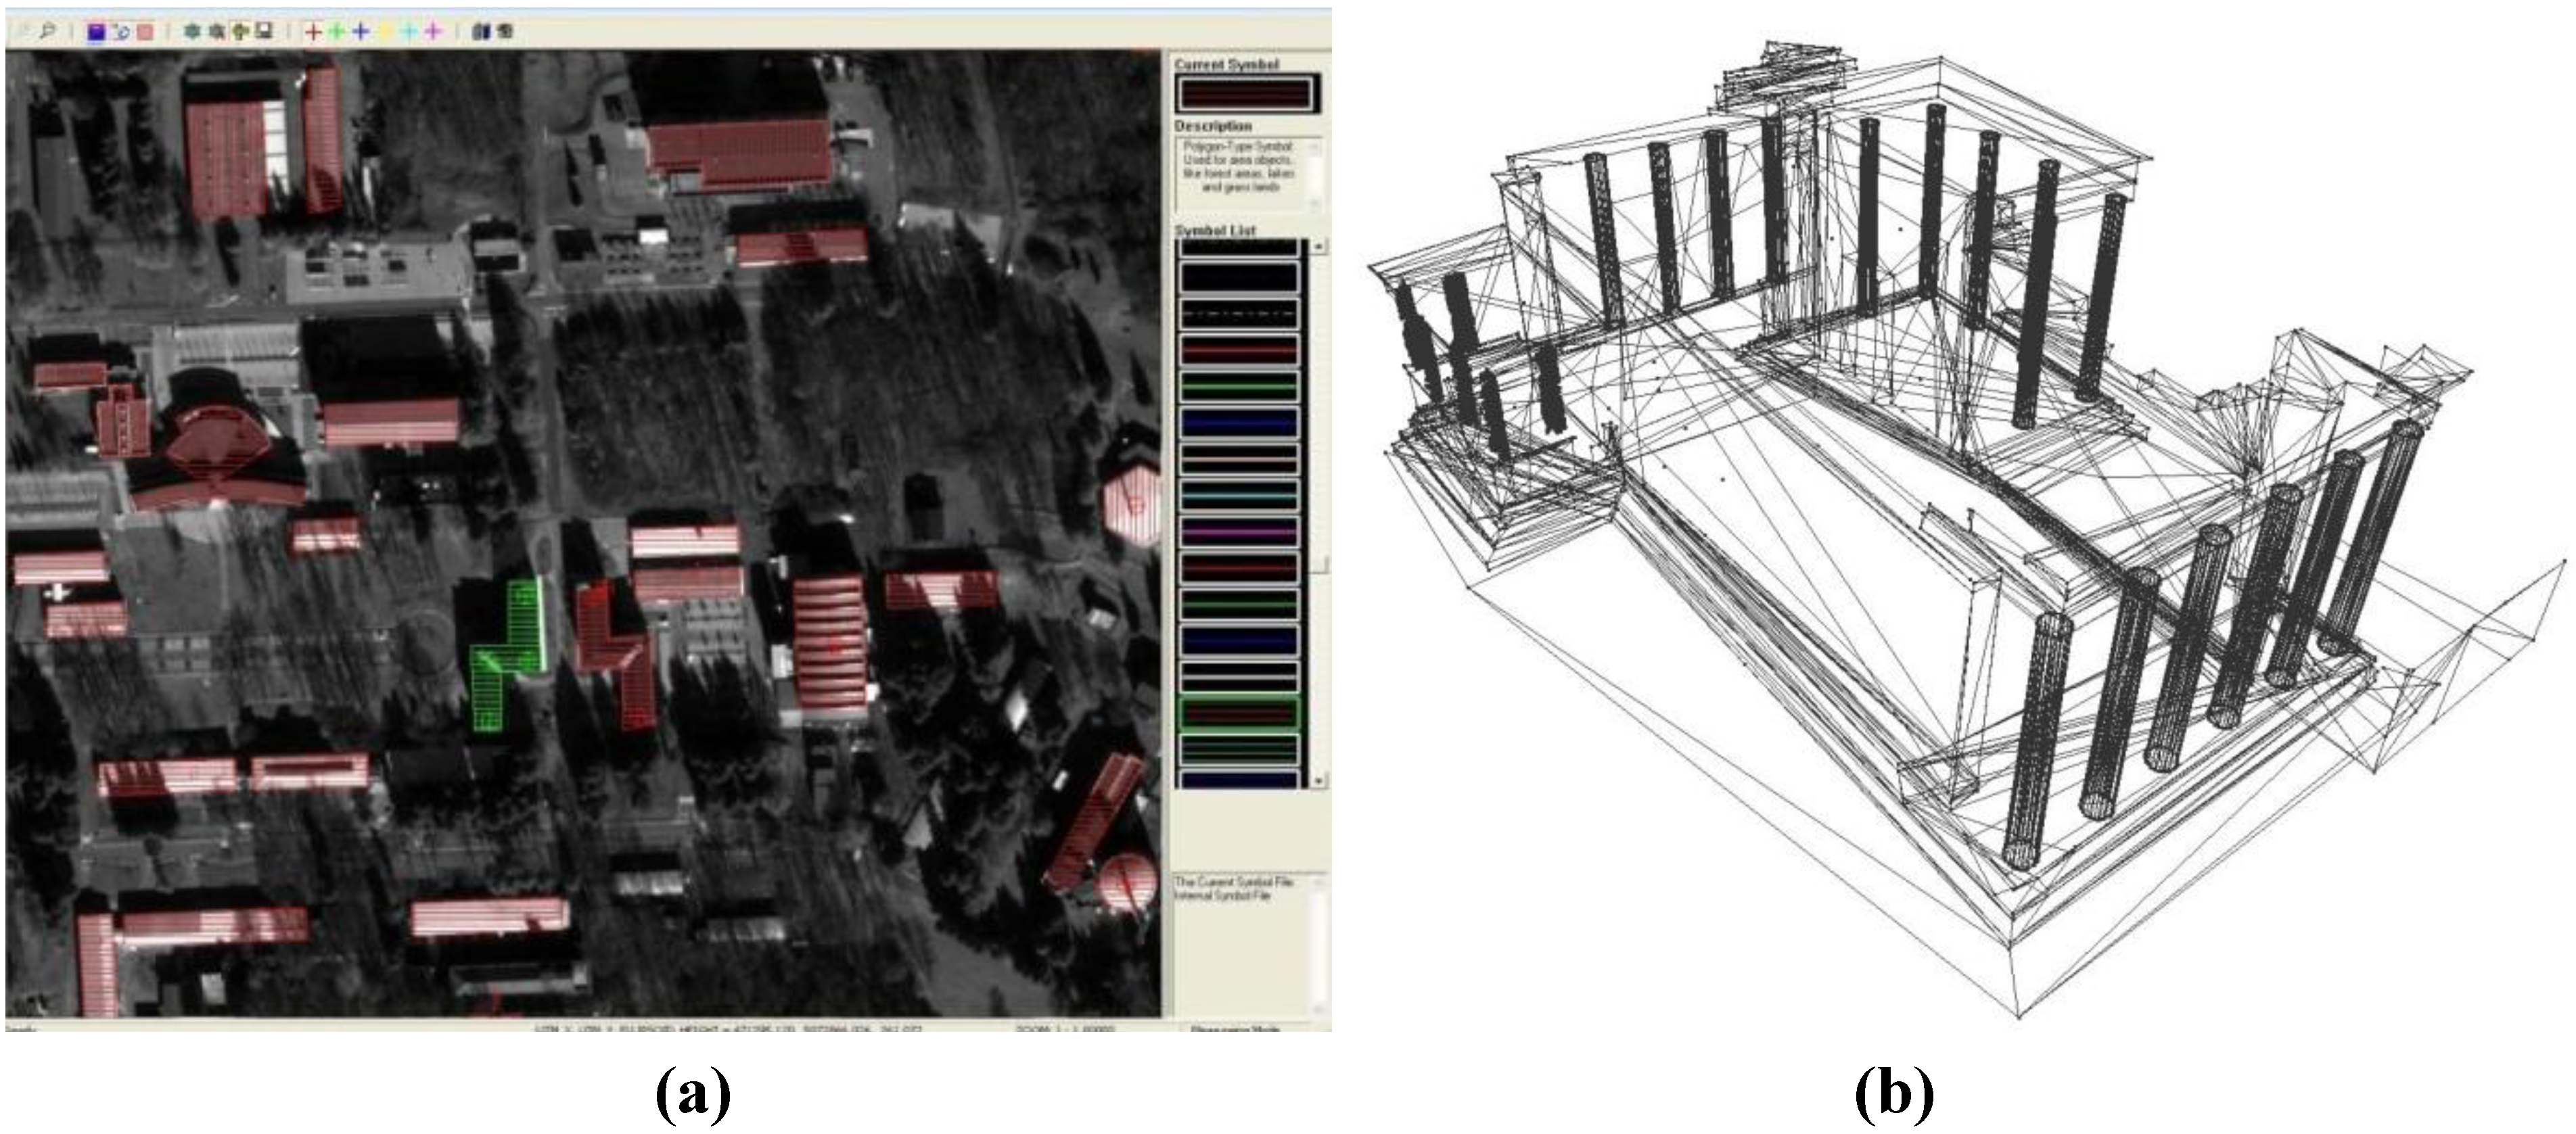
Figure 8.
Extraction of man-made structures from satellite images (a) and reconstruction of complex architectural objects from terrestrial images (b) using interactive measurements in order to achieve accurate and detailed results.
Figure 8.
Extraction of man-made structures from satellite images (a) and reconstruction of complex architectural objects from terrestrial images (b) using interactive measurements in order to achieve accurate and detailed results.
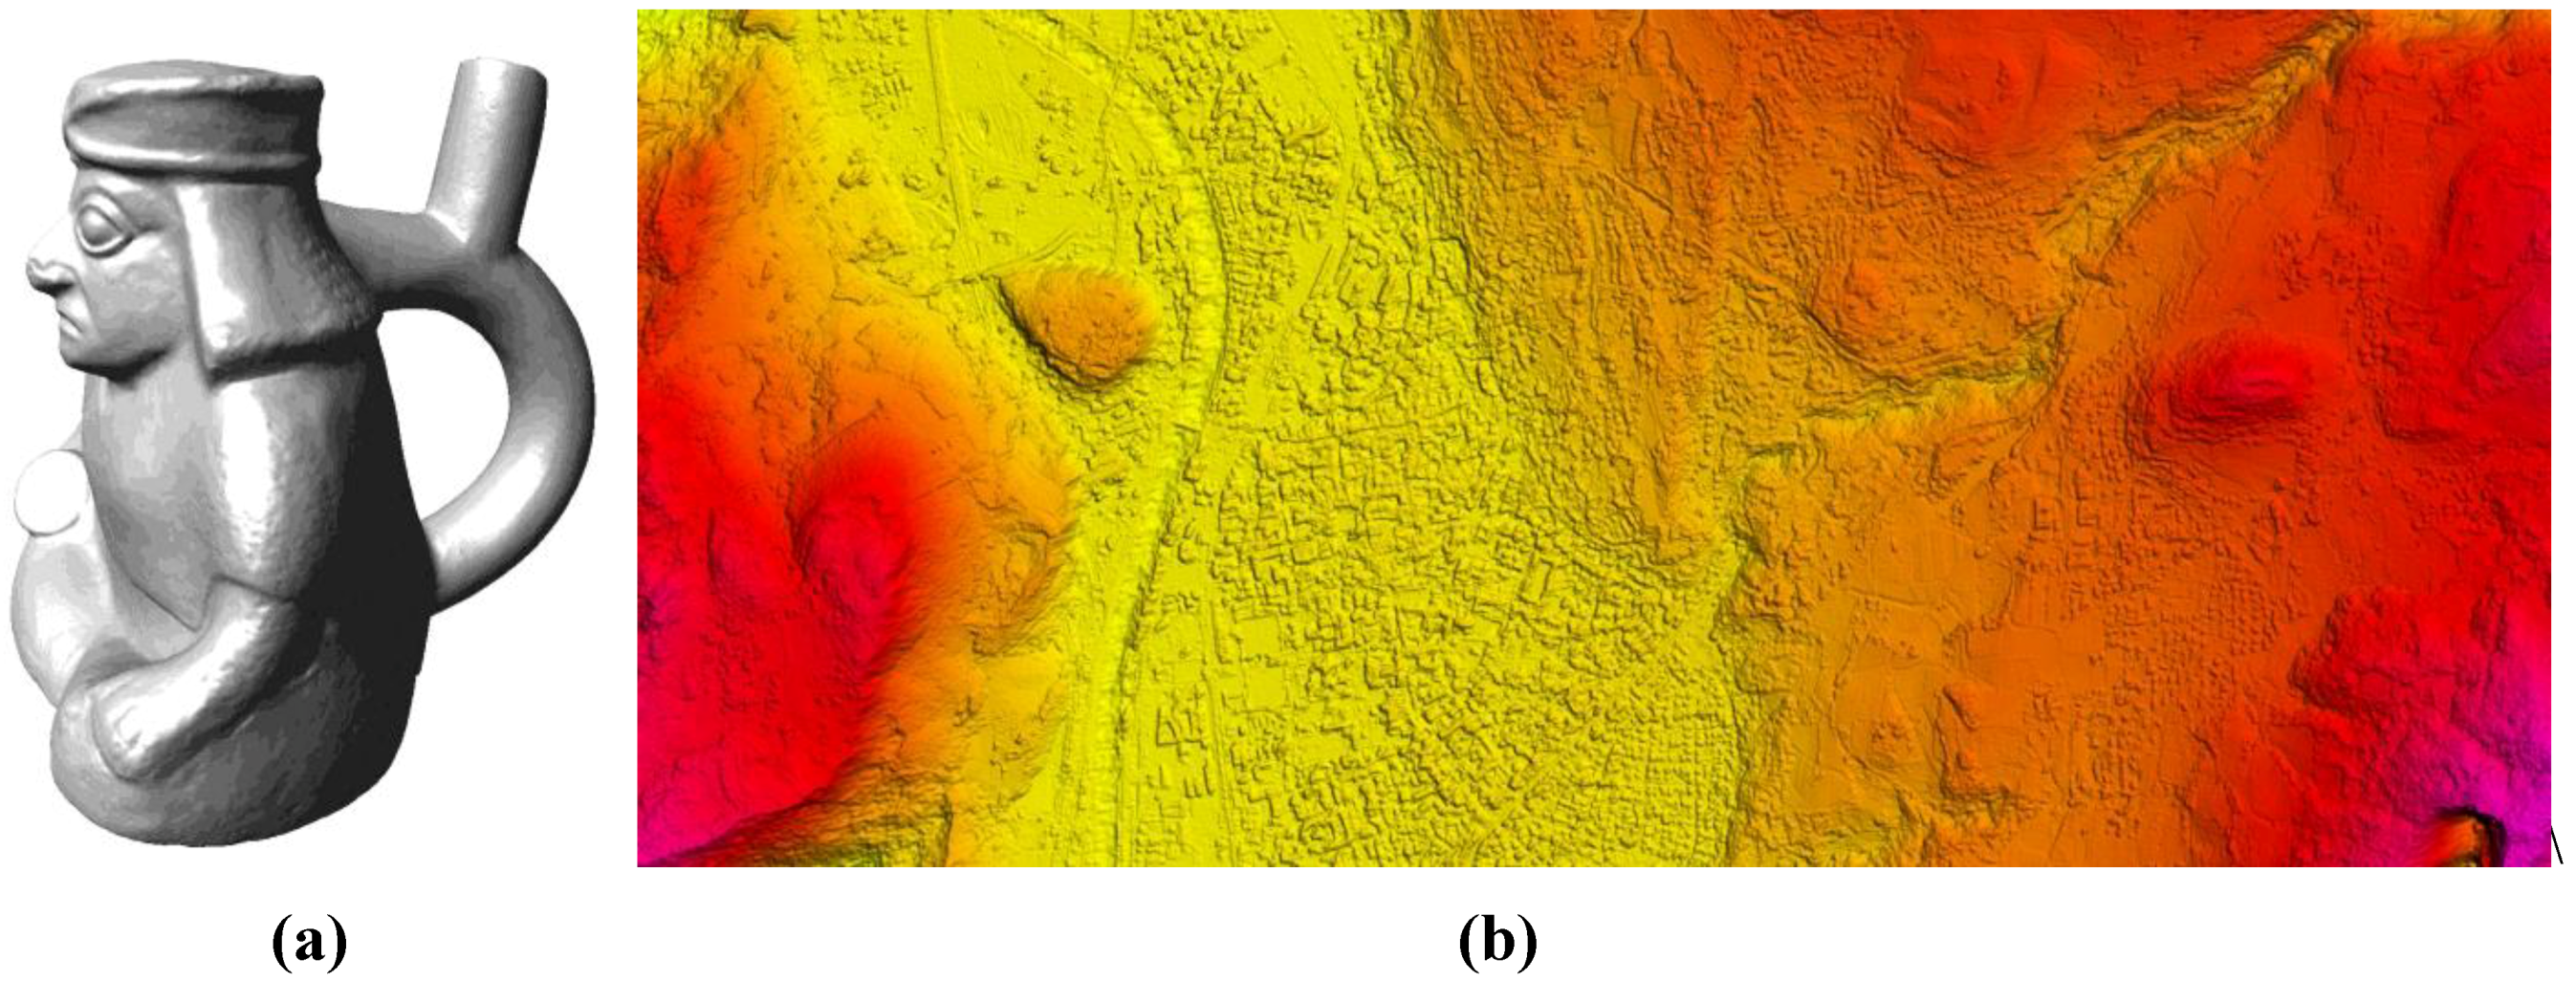
Figure 9.
Automated 3D reconstruction with dense image matching: a small free-form object modeled from terrestrial images (a) and a landscape modeled using a WorldView-2 stereo-pair (b).
Figure 9.
Automated 3D reconstruction with dense image matching: a small free-form object modeled from terrestrial images (a) and a landscape modeled using a WorldView-2 stereo-pair (b).
3.2.2. Range Data
ALS is based on direct geo-referencing [
109] but due to system dynamics, errors and instabilities a strip adjustment similar to the photogrammetric bundle block adjustment is needed, possibly using GCPs. Different approaches are available [
110,
111] in order to achieve an accuracy of the final point cloud in the order of the ranging precision of the scanning sensor.
Terrestrial laser scanning instruments should be placed in different locations or the object needs to be moved in a way that the instrument can see it under different viewpoints. Successively an alignment or registration of the data into a unique reference system is required in order to produce a single point cloud of the surveyed scene or object (
Figure 10). The scans registration is generally done in two steps: (a) a pair-wise manual or automatic coarse alignment using targets or few homologues features and (b) final global alignment based on iterative closest points [
112] or least squares method procedures [
113]. The automated pair-wise coarse registration is normally performed using feature-based approaches [
114,
115,
116,
117] but in practical projects involving large and complex datasets, the coarse registration is still a manually driven procedure. After the global alignment, redundant points and possible blunders should be removed. The aligned point cloud can be directly used for orthophoto generation or map production (
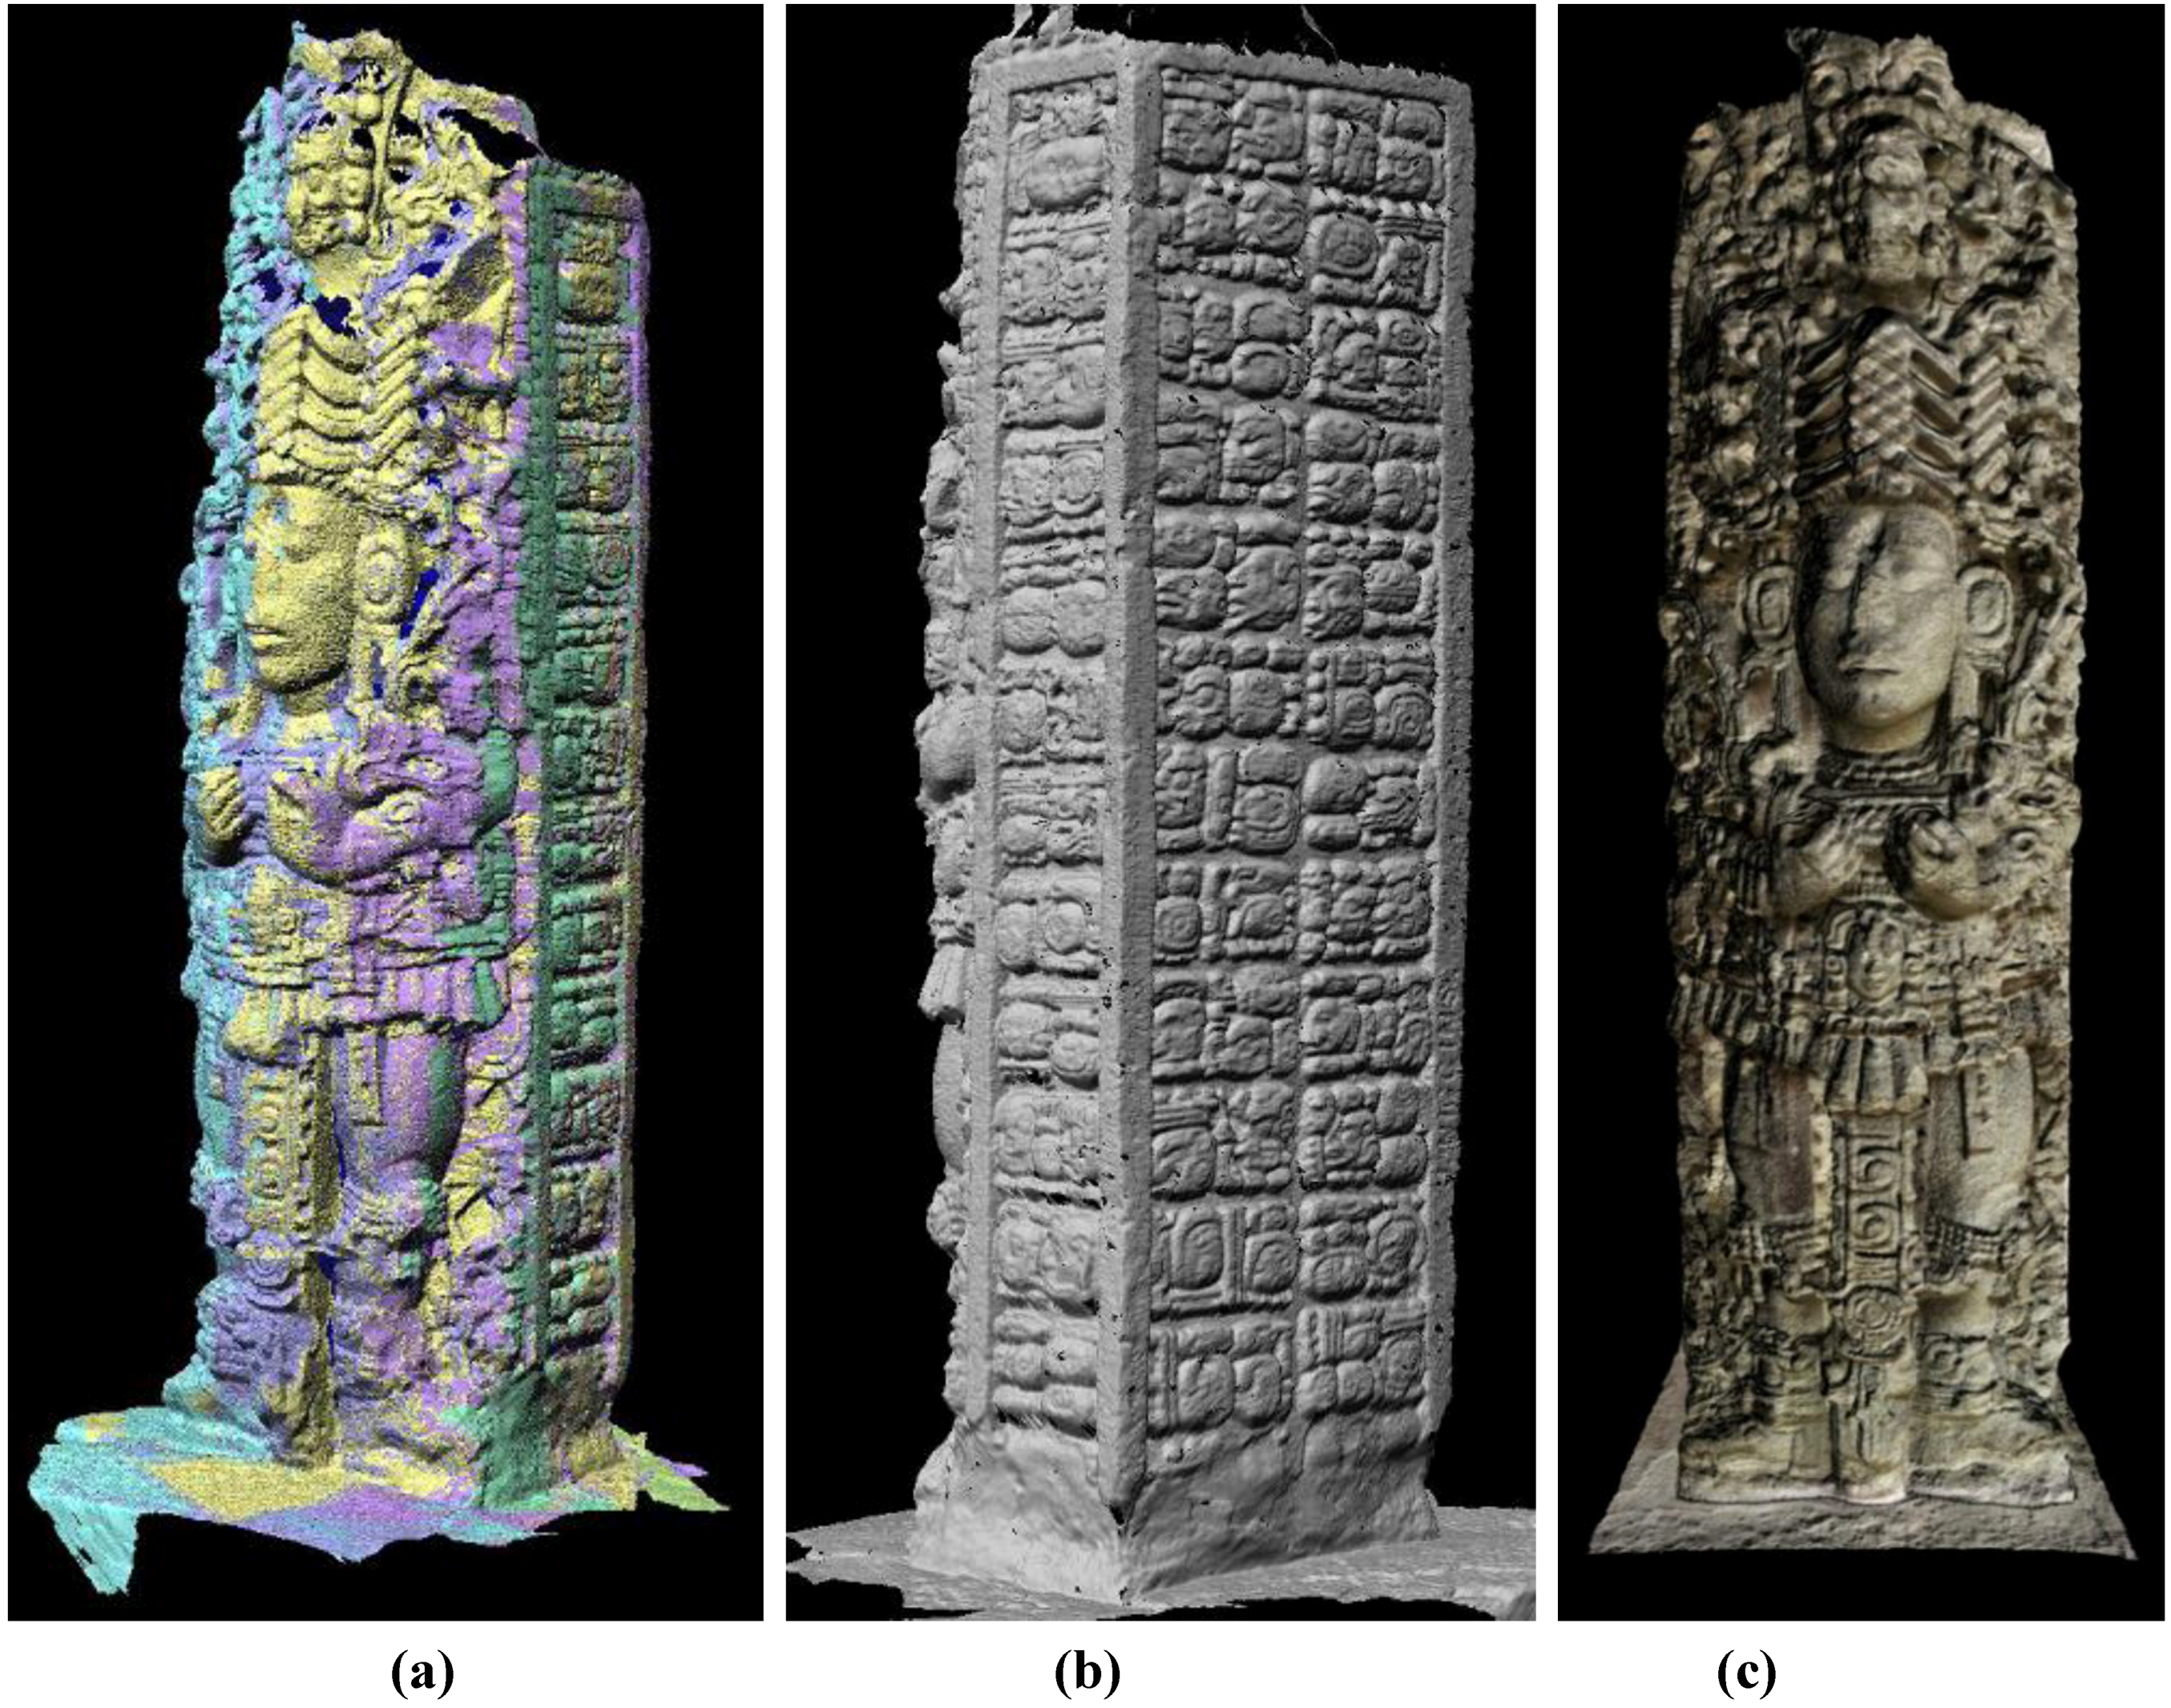
Figure 11).
Figure 10.
Different point clouds, acquired with a TOF laser scanner, are aligned (a), converted into a polygonal mesh (b) and textured (c) for photo-realistic visualizations.
Figure 10.
Different point clouds, acquired with a TOF laser scanner, are aligned (a), converted into a polygonal mesh (b) and textured (c) for photo-realistic visualizations.
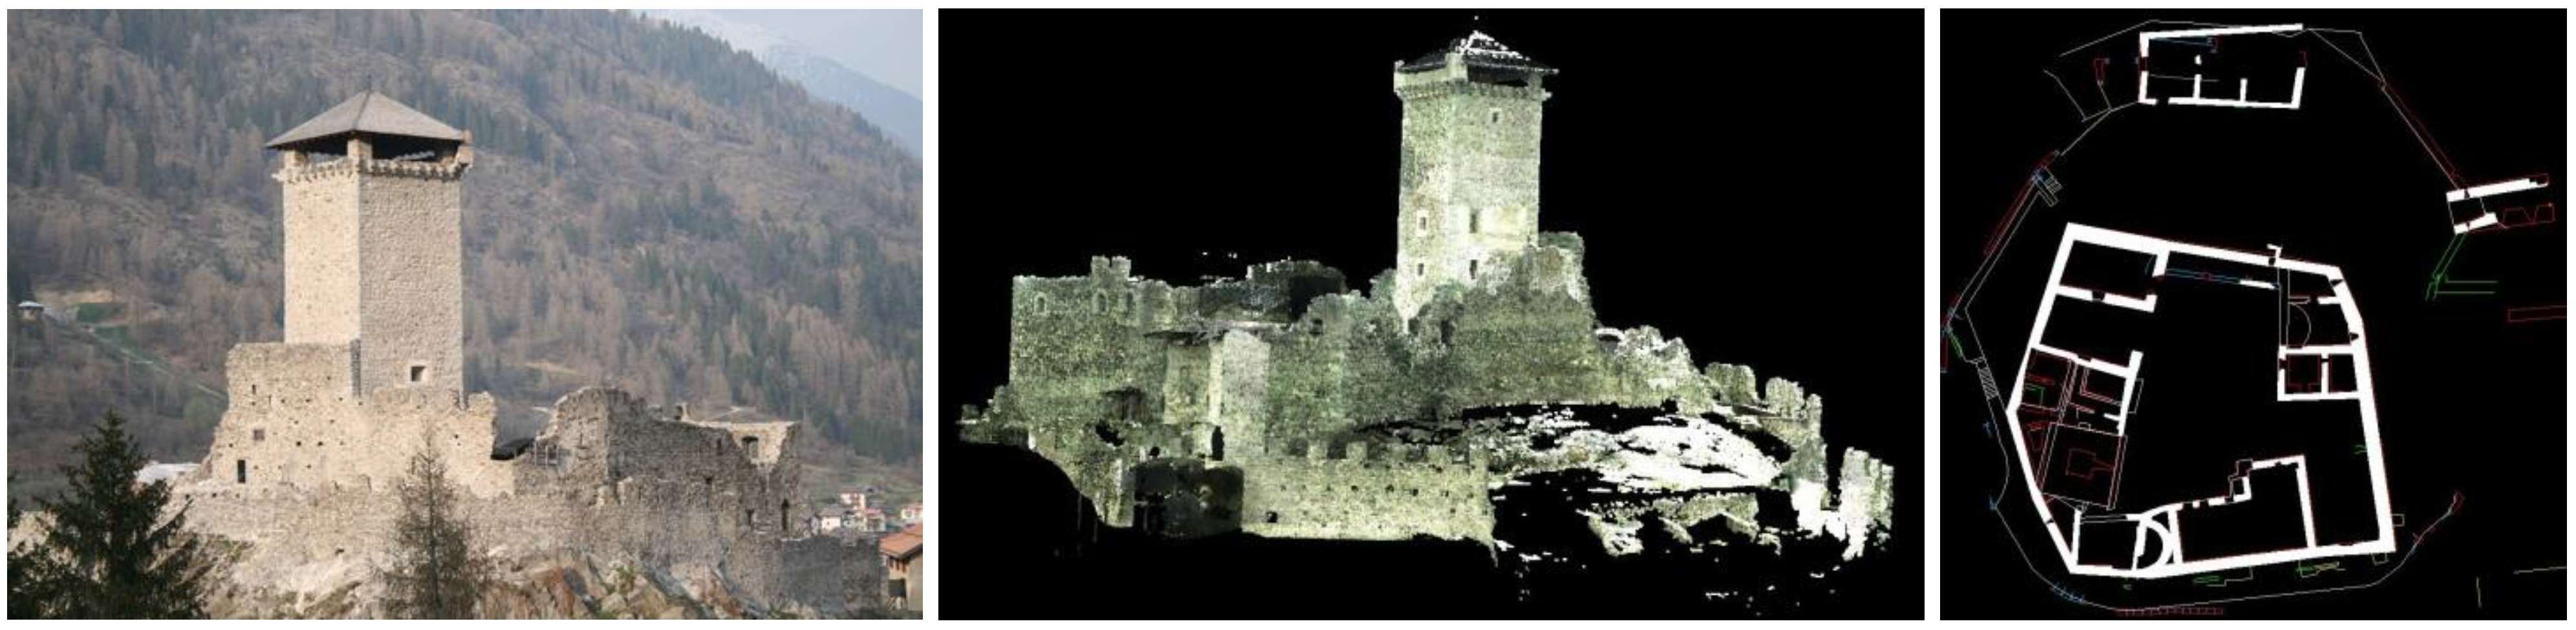
Figure 11.
Range-based surveying of a medieval castle with TOF terrestrial laser scanning for detailed map production.
Figure 11.
Range-based surveying of a medieval castle with TOF terrestrial laser scanning for detailed map production.
3.3. 3D Modeling and Texture Mapping
Once a point cloud (
i.e., unstructured data) is available, a polygonal model (
i.e., structured data) is normally generated [
118] in order to produce the best digital representation of the surveyed object or scene and for applications like physical replicas, conservation, virtual restoration, rendering,
etc. (
Figure 12).
For architectural scenes and structures generally described with sparse point clouds and polylines, a segmentation and structuring phase is necessary before producing a surface model. On the other hand, dense point clouds derived with automated image matching methods or captured with range sensors can be directly converted into polygonal model, after some possible editing and cleaning. The produced polygonal model (mesh or TIN) demands often some time-consuming repairing to close holes, fix incorrect faces or non-manifold parts. Those errors, visually unpleasant, might cause lighting blemishes due to the incorrect normal and the 3D computer model will also be unsuitable for reverse engineering, photo-realistic visualization or physical replicas. Moreover, over-sampled areas should be simplified while under-sampled regions should be subdivided. All these procedures are still manually driven as fully automated editing procedures are not yet reliable, in particular for complex terrestrial 3D models.
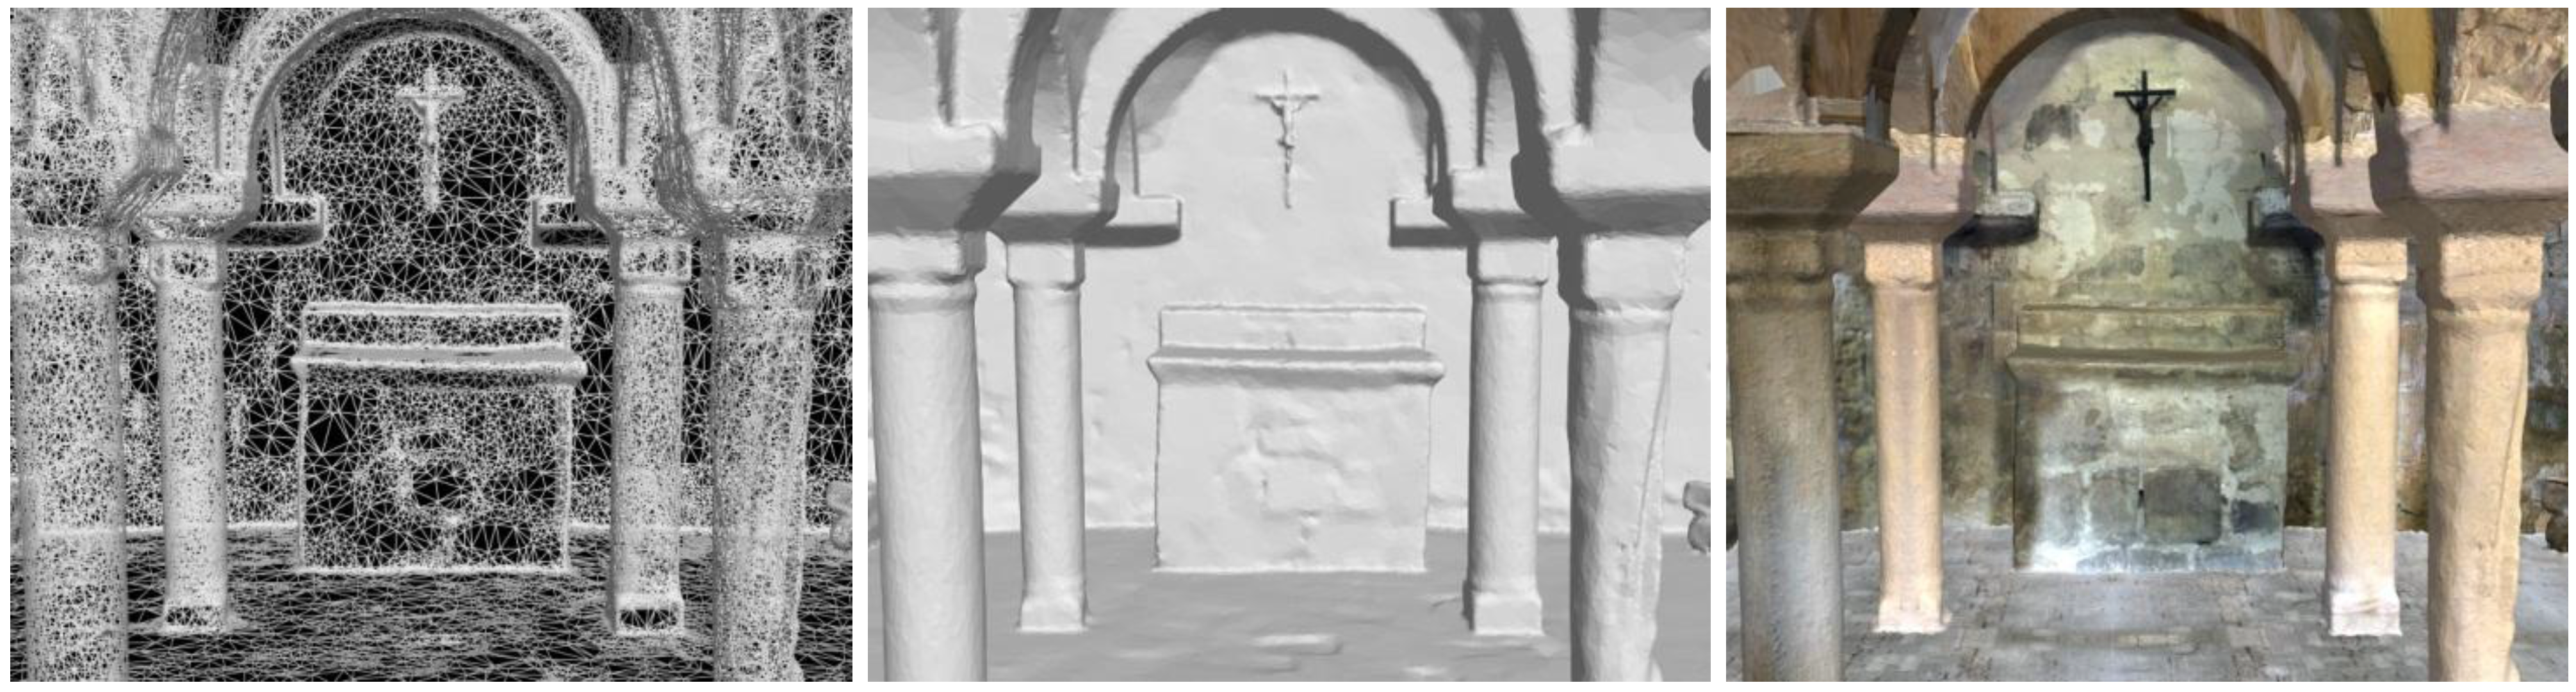
Figure 12.
Different renderings (wireframe, shaded and textured mode) of a surveyed and modeled underground church.
Figure 12.
Different renderings (wireframe, shaded and textured mode) of a surveyed and modeled underground church.
Finally, photo-realism, defined as having no difference between a view rendered from the model and a photograph taken from the same viewpoint, is generally required and achieved with the texture mapping phase, e.g., projecting one or more images (or orthophotos) onto the 3D geometry. In this phase, problems might rise from the time-consuming image-to-geometry registration (in particular for range data) or because of occlusions, surface specularity, variations in lighting and camera settings. Indeed images are often exposed with the illumination at imaging time, but it may need to be replaced by illumination consistent with the rendering point of view and the reflectance properties (bidirectional reflectance distribution function) of the object [
119]. High dynamic range (HDR) images might also be acquired to recover all scene details [
120] while color discontinuities and aliasing effects must be removed [
121]. Methods for occlusions removal are primarily based on background learning and subtraction, visibility analyses, image rectification and estimation of not-occluded pixels or manual retouch [
122,
123,
124,
125].
For mapping application, the texture mapping phase is limited to an orthophoto creation, using the DTM or DSM (true-orthophoto). The generation of orthophotos is at the end of the entire surveying and mapping chain, therefore its quality is strictly related to the quality of the previous procedures.
3.4. Realistic Visualization and 3D Repositories
The ability to easily interact with a huge 3D model is a continuing and increasing problem, in particular with the new demand of sharing and offering online reality-based 3D contents with real-time visualizations. Indeed, model sizes (both in geometry and texture) are increasing at faster rate than computer hardware and software advances and this limits the possibilities for interactive and real-time visualization of detailed reality-based 3D results, possibly online. Due to the generally large amount of data and its complexity, the rendering of large 3D models is done with a multi-resolution approach, displaying large textured meshes with different levels of detail and simplification approaches [
126,
127].
Nowadays there is also a growing need of using reality-based 3D models as graphical interfaces or containers for different kinds of information, usually organized and collected in 2D databases. For such applications, 3D models need to be semantically segmented in order to assign to each sub-element some characteristics or information which need to be represented, organized, managed, visualized and queried using advanced repository of geometric and appearance components. These would be the typical functions of GIS packages which are no more sufficient when dealing with detailed and complex 3D data. To be considered a “3D repository”, a system must be capable of:
- –
handle geographical features (e.g., landscapes) as well as data more complex than a 2.5D surface (e.g., architectural or archaeological 3D models);
- –
allow queries and spatial data analyses, possibly via web;
- –
support multi-users access and interaction, multi-resolution data (LOD) and multi-representation.
Despite the immense research work in this sector [
128,
129,
130,
131,
132,
133,
134,
135], no powerful, reliable and flexible commercial package with all the aforementioned capabilities is nowadays available. Geospatial web-services (e.g., Google Earth, MS Bing, NASA World Wind—
Figure 13) are going in this direction but with very limited capabilities in handling complex 3D data. In the video-games domain some development tools are present and adaptable to 3D geo-data, query functionalities and web-based applications (Unity3D, OSG, OGRE3D, OpenSG, 3DVIA Virtools,
etc.) but with limited capabilities in loading and displaying large geometric 3D models.
Figure 13.
A geo-browser tool for landscape visualization and data queries [
19].
Figure 13.
A geo-browser tool for landscape visualization and data queries [
19].
In the context of 3D city models, the City Geography Markup Language (CityGML), a concept for the modeling, visualization and exchange of 3D city and landscape models, has become a common geo-information language and it has been quickly adopted on an international level [
136]. Nowadays various cities and communities use 3D city models as valuable source and instrument for a sustainable management, planning and conservation of rural and urban resources [
137]. Unfortunately CityGML seems to be at the moment unable to support high-resolution architectural and archaeological 3D models as the supported geometric entities are still limited to more simple and standard representations but some Application Domain Extensions (ADE) are available or under development.
3.5. Standards
The tables reported in the previous sections with the sensor characteristics are probably incomplete and soon out-of-date. However, the main problem when collecting and searching for this information is the lack of standards and a common terminology, in particular in the range sensors community. Many new users are approaching these methodologies while other not really familiar with them require clear statements and information about an optical 3D measurement system before investing. Thus technical standards, like those available for the traditional surveying or CMM field, must be created and adopted, in particular by all vendors. Indeed most of the specifications of commercial sensors contain parameters internally defined by the companies. Apart from standards, comparative data and best practices are also needed, to show not only advantages but also limitations of systems and software.
All the optical 3D measuring systems need to be independently certified using acceptance procedures for testing the accuracy and repeatability of the acquisition and measuring systems. Standard quality parameters like flatness measurement error, sphere diameter, spacing error, traceability of data products, etc. should be used to verify whether or not a measuring system complies with the required technical specifications.
The ISO/TC 211 “Geographic information/Geomatics” has launched the project ISO 19159 “Calibration and Validation of remote sensing imagery sensors and data” [
138].
The German VDI/VDE 2634 contains acceptance testing and monitoring procedures for evaluating the accuracy of close-range optical 3D measuring systems. The American Society for Testing and Materials (ASTM) with its E57 standards committee has also developed standards for 3D imaging systems for applications like surveying, preservation, construction, etc.
4. Main Research Issues
Despite the great availability of active and passive remote sensing sensors and the large use in the daily 3D documentation and mapping work, many key issues and challenges arise from:
– New sensors and platforms: new digital sensors and technologies are frequently coming on the market but the software to process the acquired data is generally coming much later. Furthermore there are very few packages able to simultaneously deal with different sensors (and data). The development and use of new sensors requires the study and test of innovative sensor models and the investigation of the related network structures and accuracy performance. UAV platforms need some improvements for more reliable and fast acquisition procedures.
– Integration of sensors and data: there is an increasing use of hybrid sensors and platforms, in order to collect as many different features as possible. The combination of different data sources allows the creation of different geometric levels of detail (LoD) and the exploitation of the intrinsic advantages of each sensor. The integration so far is mainly done at model-level (i.e., at the end of the modeling pipeline) while it should be exploited also at data-level to overcome the weakness of each data source.
– Automated processing: automation in 3D data processing is one of the most important issues when it comes to efficiency or costs at production level. At the moment, different research solution and commercial packages have turned towards semi-automated approaches, where the human capacity in data interpretation is paired with the speed and precision of computer algorithms. Indeed the success of fully automation in image understanding or point clouds processing depends on many factors and is still a hot topic of research. The progress is promising but the acceptance of fully automated procedures, judged in terms of handled datasets and accuracy of the final 3D results, depends on the quality specifications of the user and final use of the produced 3D model.
– On-line and real-time processing: in some applications there is a need for very fast processing thus requiring new algorithmic implementation, sequential estimation, GPU and multi-core processing. Internet is also helping a great deal in this sector and web-based processing tools for image analysis and 3D model generation are available although limited to specific tasks and not ideal to collect CAD data, metric information and accurate 3D models.
– Feature extraction: the extraction and derivation of geometric structures and semantic information is a fundamental task in geomatics. The existing procedures require some improvements in order to speed up the entire 3D restitution pipeline from images or range data. Images theoretically allow an easier interpretation and extraction with respect to range data. An ideal solution should be able to produce truly 3D geometries with attributes and topologies and it should have an internal quality control procedure. A true sensor and data integration at an earlier point of the processing chain would help the information extraction to be more reliable, precise and effective. However, it is not only software that is missing, but also algorithms and methodologies.
– Improvement of geospatial data and content: users are more and more demanding data completeness (in terms of coverage, quality, etc.) and a better accessibility (search, acquisition information, metadata, etc.).
– Developments of new tools for non-expert users: although heritage 3D recording and documentation should be an interdisciplinary task, clear protocols and user-friendly packages should be released to facilitate the use of data processing techniques to non-technical users.
– Increase adoption of standard for data storage and exchange as well as sensor characterization.
5. Conclusions
This article affords an overview of the actual optical 3D measurements sensors and techniques used for surveying, mapping, digital documentation and 3D modeling applications in the heritage field. The actual problems in the reality-based 3D modeling pipeline as well as the main research issues in photogrammetry and laser scanning were also reported. Examples, primarily from heritage sites and objects, were also presented.
The continuous development of new sensors, data capture methodologies, multi-resolution 3D representations and the improvement of existing 3D recording methods significantly contribute to the documentation, conservation and presentation of heritage information and to the growth of research in the heritage field. In case of heritage sites and objects, photogrammetry provides accurate 3D reconstructions at different scales and for hybrid 3D models (e.g., terrain model plus archaeological or building structures). 3D scanners have become a standard source for 3D data in many application areas and are often preferred, although not optimal. Originally developed as a major source of elevation data, they are nowadays a very powerful source of 3D information and features. However, for large sites’ 3D modeling, the best solution is the integration of image and range data.
Despite the fact that the 3D documentation is not yet the state-of-the-art in the heritage field, the reported examples show the potentialities of the modern surveying technologies to digitally document and preserve our landscape and heritage as well as share and manage them. Beside heritage documentation, remote sensing technologies play a very important role for urban planning and 3D city modeling, topographic mapping, natural hazard monitoring and analyses, geo-data visualization, car navigation, virtual tourism, location-based services, industrial inspections, etc.
It is clear that the image-based 3D documentation approach, together with range sensors, geo-spatial information systems, 3D modeling procedures, visualization and animation software are always in a dynamic state of development, with even better application prospects for the near future. There is certainly a geospatial convergence of technologies and needs with the availability and request of geospatial contents in a large variety of formats and accessible through open development standards and tools. The wider access to remote sensing and geospatial contents is creating a breed of non-expert consumers who are using geospatial data in their daily life and for more effective decisions. The same should apply for the entire heritage community who approach these technologies more frequently in order to access a wider spectrum of applications and resources.
Conscious that new hardware and algorithm improvements are coming in the short period, the impacts of all the reported developments and potentialities anyway pose some questions:
– How do we handle the increasing availability of images and range data? From a research point of view this can only be seen as positive in photogrammetry and 3D scanning.
– How do we store and preserve geomatics data for the future? Existing data storage could be unreadable in some years. Certainly some new technologies are being developed to accomplish higher capacities per disk and higher data transfer rates.
– How do we share 3D information with non-expert communities demanding geomatics data? Lack of appropriate software and education is often the source of misunderstandings and incorrect use of sensors and 3D data thus the users’ needs (in particular archaeologists, conservators, heritage managers, etc.) should always be taken into consideration.
– How do we store and share 3D models? The new development of web protocols, communication systems and data sharing techniques are promising, but regulation and specifications are still missing.
– How do we critically compare optical 3D measurement techniques without a common terminology for the sensors specifications?
– How do we cope with the competition from neighboring disciplines and communities which are not really dealing with metrology and reality-based surveying? Hopefully our skills, flexibilities and attitudes will help geomatics to survive and continue to be a beacon for many reality-based surveying and 3D modeling issues.


