
DCAT: Dual Cross-Attention-Based Transformer for Change Detection


1
School of Artificial Intelligence, University of Chinese Academy of Sciences, Beijing 101408, China
2
National Laboratory of Pattern Recognition, Institute of Automation, Chinese Academy of Sciences, Beijing 100190, China
3
School of Automation and Electrical Engineering, University of Science and Technology Beijing, Beijing 100083, China
4
School of Computer and Information Engineering, Nanning Normal University, Nanning 530001, China
*
Author to whom correspondence should be addressed.
Remote Sens. 2023, 15(9), 2395; https://doi.org/10.3390/rs15092395
Submission received: 11 March 2023
/
Revised: 28 April 2023
/
Accepted: 28 April 2023
/
Published: 3 May 2023
(This article belongs to the Special Issue Pattern Recognition in Remote Sensing)
Abstract
:Several transformer-based methods for change detection (CD) in remote sensing images have been proposed, with Siamese-based methods showing promising results due to their two-stream feature extraction structure. However, these methods ignore the potential of the cross-attention mechanism to improve change feature discrimination and thus, may limit the final performance. Additionally, using either high-frequency-like fast change or low-frequency-like slow change alone may not effectively represent complex bi-temporal features. Given these limitations, we have developed a new approach that utilizes the dual cross-attention-transformer (DCAT) method. This method mimics the visual change observation procedure of human beings and interacts with and merges bi-temporal features. Unlike traditional Siamese-based CD frameworks, the proposed method extracts multi-scale features and models patch-wise change relationships by connecting a series of hierarchically structured dual cross-attention blocks (DCAB). DCAB is based on a hybrid dual branch mixer that combines convolution and transformer to extract and fuse local and global features. It calculates two types of cross-attention features to effectively learn comprehensive cues with both low- and high-frequency information input from paired CD images. This helps enhance discrimination between the changed and unchanged regions during feature extraction. The feature pyramid fusion network is more lightweight than the encoder and produces powerful multi-scale change representations by aggregating features from different layers. Experiments on four CD datasets demonstrate the advantages of DCAT architecture over other state-of-the-art methods.
1. Introduction
Change detection (CD) is a critical task that aims to identify changes between images captured at different times and it has numerous applications in fields such as land cover change analysis, ecosystem monitoring, city management, and damage assessment [1,2,3,4,5,6]. In recent years, the rapid development of imaging equipment has led to the acquisition of very-high-resolution (VHR) remote sensing images and aerial images with ease. Xing et al. [7] proposed a spectrally enhanced multi-feature fusion method with change magnitude map integration for effective CD. Du et al. [8] proposed a novel tri-temporal logic-verified change vector analysis approach which can identify the errors of change vector analysis through logical reasoning and judgment with an additional temporal image assistance. Lv et al. [9] utilized a multi-feature probabilistic ensemble conditional random field model to perform the task of CD for VHR remote sensing imagery. However, traditional CD methods face challenges in effectively extracting features and learning high-level information, limiting their practical applications.
Nowadays, deep learning-based methods have achieved remarkable success and become the de facto standard of VHR image change detection [10]. In the literature, a large number of attempts have been made to solve CD problems using deep learning techniques [11,12,13,14]. Among these, convolutional neural network (CNN) has emerged as the most commonly used architecture due to its ability to preserve fine detail. To extract discriminative features, many CNN-based methods [15,16,17] use Siamese architecture [18] and it is often accompanied by stacked convolution layers [10,19], dilated convolutions [19], spatial pyramid pooling layers, and various attention mechanisms (e.g., channel and spatial attention) [20,21,22,23] are utilized to increase the receptive field, which is essential to capture long-range contextual information within the spatial and temporal scope. This type of approach is straightforward, and the introduction of an attention-based mechanism is effective in capturing global details. However, these methods use attention to re-weigh the bi-temporal features from Siamese-based CNN architecture to relate long-range spatio-temporal information [21,22,23,24], where more attention is paid to balance and integrate high-level semantic features, and the interactions between low-level details are usually ignored. The tremendous advancements and successes of transformers in natural language processing (NLP) [25] have led to their widespread adoption and development for use in vision tasks, such as ViT [26], Swin Transformer [27] and SETR [28].
The self-attention mechanism is an important component of transformers, which explicitly models the interactions between all entities of a sequence. It capture the interaction among n entities by encoding each one with global contextual information. In detail, by using learnable weight matrics , , and , the input X is first projected onto three weight matrices to get , , and , respectively. Then, attention scores are obtained by computing the dot-product of the queries with all keys, which can be seen as a query-matching process with all values. Due to the token structure, ViT and its variants have a larger receptive field and capture low frequencies, mainly about the global shape and structure. In contrast, CNN extracts features by pixel-wise convolution, and it has a smaller receptive field and captures high frequencies (such as local details and textures). According to the findings presented in [29], the multi-head self-attentions (MSAs) utilized in ViT and CNN exhibit contrasting behaviors. Specifically, while MSAs function as low-pass filters, CNN are more akin to high-pass filters. This is because self-attention is a global operation that exchanges information between patch tokens, and it is better at capturing global information (low frequencies) than local information (high frequencies). Therefore, high-frequency information by CNN should be combined with low-frequency information by ViT, which is especially important for pixel-level segmentation task, e.g., (fine-grained) change detection. However, most methods focus on image classification [26,30,31], object detection [32,33], semantic segmentation [28,31], and very few works on transformers for CD have been reported in the literature [34,35,36].
We note that traditional Siamese-based CD methods split two-stream branches to separately extract features and they ignore information fusion between bi-temporal images. Transformers utilize queries and keys to calculate self-attention weights, which contains the routine of comparing and querying implicitly. In terms of CD, it is natural to utilize the mechanism based on a transformer to extract change features and enhance the information interaction between bi-temporal images along the spatio-temporal dimension. In fact, global information, such as smooth regions, mainly contains low-frequency components, while high-frequency components contain local detail information such as object boundaries [37]. The human visual system, from different frequencies, realizes the classification and identification of object semantics by extracting these visual features’ representation. Some scholars have been trying to explore the high-frequency and low-frequency information extraction capabilities of the network from the perspective of frequency and combine them, and they have achieved competitive results in various visual tasks [38,39]. Therefore, the development and application of a new vision architecture are imperative to capture the semantic change information in pairs of CD images from high-frequency and low-frequency perspectives. In light of these requirements, a specially well-designed, novel cross-attention-based transformer framework is proposed for CD, which is efficient, accurate, and robust. We base our approach on the intuition that CD is an alternative process of comparing image patches, which is similar to visual change observation of human beings with respect to patch-scanning and comparison [40,41]. Traditional Siamese-based CD methods, which extract features separately from each stream, fail to incorporate information fusion between bi-temporal images. In contrast, joint information fusion and feature extraction at different scales are more intuitive as they better capture the complex bi-temporal features of interest. More importantly, transformer and CNN are complementary in feature representation with respect to high-frequency-like fast change and low-frequency-like slow change [29], and the pure usage of either type may be limited in representing complex bi-temporal features [39]. To this end, a new dual cross-attention mechanism block is proposed to combine CNN’s outstanding high-frequency capture ability with transformer’s global attention on low frequencies. Our proposed framework is not only efficient and accurate, but also robust to changes in remote sensing imagery. The key novelties of our work lie in the following aspects:
- A novel dual cross-attention-based module is introduced into the transformer encoder block. This module features a dual branch structure that enables the extraction of high- and low-frequency information, resulting in a more powerful semantic association modeling between bi-temporal patches;
- A hierarchical transformer encoder is presented to extract and merge multi-scale features simultaneously, and a feature pyramid fusion network decoder is aimed to yield discriminable feature difference representation that alleviates the problems caused by naive context aggregation;
- Extensive experiments on four CD datasets demonstrate that our proposed method outperforms previous state-of-the-art methods in terms of accuracy and robustness.
The structure of this paper is as follows: Section 2 provides a review on deep-learning-based CD methods. In Section 3, we present our proposed methodology in detail, outlining the advantages of the dual cross-attention-based transformer (DCAT) framework. Section 4 presents comprehensive comparisons between DCAT and other SOTA methods, providing a thorough evaluation of its effectiveness in Section 5. Finally, Section 6 concludes the paper, summarizing the contributions of our work and discussing future directions for research in the field of CD.
2. Related Work
In recent years, the literature has seen a growing number of deep-learning-based change detection approaches due to their powerful multi-level feature representation ability and effective end-to-end feature learning [1,10]. This section presents a comprehensive review of deep-learning-based CD methods, categorized into two main groups for ease of analysis. By surveying the current deep-learning-based CD methods, we aim to provide researchers with a thorough understanding of the latest advancements and foster further research in this important area of remote sensing.
2.1. CNN-Based Change Detection
CNN-based change detection approaches learn the mapping from bi-temporal images to a change probability map [42]. Assigning a change score to each pixel in an image is a common approach for detecting changes in remote sensing CD tasks. In this method, each pixel is assigned a score based on the magnitude of change observed between the two input images. Higher scores indicate more significant changes, while lower scores indicate regions where no or minimal changes have occurred. Peng et al. [43] proposed an effective encoder-decoder CD architecture, where an improved UNet++ [44] is utilized for semantic segmentation. To generate the change mask, the architecture employs a multilateral fusion strategy. Daudt et al. [15] explored three different U-Net-based variants, namely, FC-EF, FC-Siam-Conc, and FC-Siam-Diff, by comparing two CNN architectures: early fusion (EF) and Siamese (Siam). In addition, two Siamese extensions, concatenation and difference, are also explored. Chen et al. [45] proposed CDNet which utilizes a deep Siamese FCN to extract rich semantic features and a shallow FCN to classify feature differences. Due to the exceptional feature extraction capabilities of CNNs, many CD methods have been developed that incorporate some advanced techniques, such as atrous spatial pyramid pooling [46], depth-wise convolution [47], and attention mechanisms (including channel and spatial attention) [20]. However, these methods are the extensions of the semantic segmentation task without considering the essence of CD difficulties.
Considering the low overall discrimination between change features, metric learning is used to learn a parameterized embedding space, which is usually implemented by Siamese, and symmetric Siamese architecture are often utilized by most CD approaches [24,48,49]. Siamese FCN contains two identical networks, which share the same weights. Shi et al. [50] introduced a metric module for the deeply supervised attention metric-based network (DSAMNet) to enable change map learning through deep metric learning. The spatio-temporal attention-based network (STANet) [17] utilizes a spatial and temporal attention mechanism to learn spatial and temporal features for CD. By employing metric learning, the network obtains change maps. Bai et al. [16] proposed an edge-guided recurrent convolutional neural network (EGRCNN) that utilizes prior knowledge, such as edge structure information. EGRCNN integrates discriminative information and edge structure priors into a single framework to enhance change detection performance, with a particular focus on generating more precise building boundaries. Liu et al. [20] introduced a dual-task constrained deep Siamese convolutional network (DTCDSCN) with a dual attention module that consists of three subnetworks: a change detection network and two semantic segmentation networks. By performing CD and semantic segmentation tasks simultaneously, DTCDSCN can learn more discriminative object-level features and produce a more informative change detection map. Chen et al. [51] presented a dual attentive fully convolutional Siamese network (DASNet) along with a weighted double-margin contrastive loss to enhance the robustness against pseudo-changes. Zheng et al. [52] suggested a single-temporal supervised object change detection approach to address the challenge of obtaining paired labeled images. By utilizing object change between unpaired images as supervisory signals, this approach fundamentally mitigates the difficulties of collecting paired labeled images. Several loss functions have been investigated to restrict the data representations. For instance, Zhang et al. introduced an enhanced triplet loss function [19], while Zhan et al. suggested a weighted contrastive loss function [53] for cross-domain optical and aerial images.
While the aforementioned methods have contributed to improving the performance of CD, they are limited by the inherent locality of convolution operations in CNN-based methods. Specifically, these methods have difficulties in effectively extracting long-term global features and exploiting the inner relationships between bi-temporal image inputs, thus limiting the ability of the CD network. As a result, there is a need for a more effective change representation mechanism that can provide more robust CD results. Such a mechanism should be able to capture long-term dependencies and contextual information across the bi-temporal inputs, allowing for a more comprehensive and informative feature representation. By addressing these limitations, it may be possible to further enhance the accuracy and robustness of CD models, thereby enabling their deployment in a wider range of real-world applications.
2.2. Transformer-Based Change Detection
The impressive performance of transformers in natural language processing (NLP) [54] has inspired researchers to utilize transformers in different computer vision tasks. ViT [26] treats each image as a sequence of tokens for image classification. PVT, as introduced in [55], was the first work to incorporate a pyramid structure into a transformer, showcasing the capabilities of a transformer-based backbone for dense prediction tasks. SETR [28], proposed by Zheng et al., utilizes ViT as a backbone to extract features for semantic segmentation. Xie et al. introduce SegFormer [56], a highly effective and straightforward semantic segmentation framework that unifies transformer with lightweight multilayer perceptron decoders. SegFormer features a hierarchically structured encoder for multiscale feature extraction while avoiding the need for complex decoders. Given the powerful representational capabilities of transformer-based models, their performance has shown promise across various tasks, including object detection [32,33], super-resolution [57], and image generation [58].
Recently, researchers attempted to adapt transformer for remote sensing CD. To this end, BIT [34] is proposed that effectively models contexts within the spatial-temporal domain and employs a Siamese tokenizer that extracts compact semantic tokens from feature maps obtained from a CNN backbone. Despite the promising improvements by transformer, it extracts features by a Siamese CNN backbone before transformer blocks, and the CD performance depends heavily on the feature extraction ability of CNN. Li et al. [35] proposed TransUNetCD, a hybrid encoding–decoding transformer model for CD that combines the strengths of both transformer and UNet. Zhang et al. [36] designed a pure transformer architecture with a Siamese U-shaped structure. In addition, Wang et al. [59] investigated the impact of remote sensing pretraining on downstream tasks and utilized ViTAE for higher performance improvement. However, these methods overlook the significance of integrating and comparing joint information during feature extraction, leading to the loss of critical semantic details. In other words, compared with the improvements by transformer in NLP, more efforts should be focused on mining transformers and cross-attention mechanisms specific to CD problem.
Based on the aforementioned analysis, it is evident that traditional approaches tend to emphasize either CNN or transformer features independently. Nonetheless, the significance of complementary feature combinations is often overlooked. To address this issue, a dual-branch frequency mixer is proposed, which synergistically integrates the CNN’s robust capacity for extracting high-frequency representations with the transformer’s strengths. Furthermore, to cater to the diverse scale of objects across various regions, a hierarchical architecture is adopted, deviating from a pure Siamese structure.
3. Materials and Methods
In this section, the overall architecture of DCAT is briefly described, and key components of the proposed approach are then elaborated, including overlap patch embedding module (OPEM) and dual cross-attention block (DCAB). Next, the feature pyramid fusion network and loss function are introduced.
3.1. Overall Architecture
The general process of our CD model based on DCAT is presented in Figure 1a. Our model comprises two main modules: a hierarchical encoder and a feature pyramid fusion network (FPFN). The hierarchical encoder is designed to capture fine-grained features that preserve high-resolution remote sensing image details, making it an essential component for CD tasks. By leveraging a hierarchical feature encoder, the network can effectively capture semantic details at different scales, allowing for a more comprehensive and informative feature representation. In addition, our proposed method employs a pyramid decoder to gradually aggregate multi-scale features, thereby obtaining more reliable CD maps. This approach enhances the network’s ability to capture and exploit multi-scale information, leading to more accurate and robust change detection results. Overall, our DCAT-based CD model offers a promising solution for the challenging task of CD in remote sensing imagery. Code and models can be found at https://github.com/zhouyy314/DCAT, accessed on 24 March 2023.
Each stage of the model includes an overlapping patch embedding layer that downsamples the feature maps, as well as a set of dual cross-attention blocks that leverage both transformer and convolutional operations in parallel. The last block of each stage is the DCAB, which contains a low- and high-frequency cross-attention mixer. It is worth noting that local contextual change features captured by a cross-attention mechanism help avoid the split in the two-stream network. Furthermore, low- and high-frequency information communication of bi-temporal patches within each window are achieved by cross-attention, and it behaves like the process of information query and comparison. The low- and high-frequency mixers employ dual cross-attention mechanisms twice to enhance the interaction between bi-temporal feature tokens. Moreover, the joint feature fusion and comparison are implemented at all stages, rather than sequential comparison after feature extraction. To elaborate, pairs of patches are input into the hierarchical encoder, which gradually reduces the spatial resolution and doubles the channel dimension at each stage. After that, multi-level feature maps and with resolutions , , and of the original bi-temporal images are obtained, respectively. Finally, four-level features with different resolutions are fed into the FPFN to obtain the final CD mask with the size of .
The central idea behind DCAT is to leverage dual cross-attention to effectively capture and incorporate the global context that accounts for multi-level semantic differences. By combining the exceptional local modeling capability of CNN with the powerful global dependency perception of transformer, high- and low-frequency information can be extracted, respectively. These two branches correspond to the mixer, as detailed in Section 3.3. For ease of reference in the following section, we use the terms “high-frequency features” and “low-frequency features” to refer to the CNN features and transformer features, respectively.
3.2. Overlapped Patch Embedding Module
In visual tasks, multi-level and multi-scale feature representation is helpful to aggregate semantic context information and spatial details [27,55,60]. In consequence, to improve the dense-pixel-prediction performance, it is important to introduce a hierarchical structure which is adequate in mixing low- and high-level features.
An overlapping patch merging process is used to preserve the local continuity and make full use of the local context information around small-size patches, OPEM shrinks hierarchical feature from the i-th stage of resolution to the -th stage of resolution by convolution, where . As the network goes deeper, the number of tokens is reduced and the receptive field is increased thanks to the progressive downsampling applied by the model.
3.3. Dual Cross-Attention Transformer Block
Vision Transformers (ViTs) are widely used in visual tasks, in which many change detection approaches use the classic idea of self-attention. The vanilla vision transformer consists of a multi-head self-attention (MSA) module and a feed-forward network (FFN). However, MSA computes dependencies between all patch tokens, resulting in a strong emphasis on aggregating global information across all layers. This approach inevitably leads to a significant increase in computational complexity, which scales quadratically with the number of input tokens.
Although certain approaches such as PVT [55] and SegFormer [56] attempt to decrease the spatial scale of keys and values prior to the self-attention operation, using a single branch such as convolution can lead to the loss of small object details and the degradation of high-frequency information (e.g., local textures). As a result, the ViTs’ modeling capability can be weakened. That is to say, high-frequency details are easily ignored by ViTs, yet CNN has outstanding local modeling ability. In fact, in visual tasks, high-frequency information is very important. Therefore, we propose a low- and high-frequency cross-attention mixer to aggregate global and local information, respectively.
As shown in Figure 1b, the mixer consists of two sub-mixer, the low-frequency mixer and the high-frequency mixer, both of which employ a cross-attention mechanism to interact with features from another phase. For simplicity, the residual connection and FFN are omitted. It is worth noting that we transplanted the effective high-frequency representation extraction ability of CNNs to transformer block and adopted a multi-branch structure in high-frequency mixer, which was inspired by Inception [61]. Rather than directly inputting image tokens into the low- and high-frequency mixer, the mixer introduced in this study separates the input feature along the channel dimension using a pre-defined ramp division strategy. The separated components are subsequently fed into the high- and low-frequency mixer, respectively. In contrast to the conventional self-attention mixer, our novel mixer employs a hybrid architecture that integrates the strengths of CNN and transformer models. The novelty of our approach lies in its ability to perform attention calculation twice while maintaining a smaller number of parameters.
Specifically, the input feature map is first partitioned into two components along the channel dimension: and , where . Then, and are fed into low-frequency mixer (LFM) and high-frequency mixer (HFM) to compute the cross-attention feature and , respectively. Finally, and are concatenated together, and the final feature output is obtained through a convolutional layer with the kernel size . It can be defined as:
where LN is layer normalization, [;] denotes concatenation.
In many transformer-based methods [26,27,54,56], a traditional self-attention mechanism is only applicable to a single input sequence. The attention function maps a query and a set of key-value pairs to an output that is a weighted sum of values. In order to adapt to the dual input situation in CD, a novel cross-attention is presented to model the inner connection and information interaction between token pairs. To compute the cross-attention scores between queries and keys and obtain the weighted sum of values, we first compute the dot product of each query with all keys that belong to another token. As is done in many transformer-based methods, we divide the dot products by before applying the SoftMax function to obtain the weights on the values . For computational convenience, we pack the queries, keys, and values into matrices , , and , respectively. Taking the cross-attention in the high-frequency mixer as an example, the above calculation process is described by the following formulas
where and denote cross-attention feature maps for bi-temporal tokens at the i-th () stage in the high-frequency mixer. The cross-attention calculation process in the low-frequency mixer is similar.
Finally, our DCAT is also equipped with a feed-forward network (FFN), and the difference is that it incorporates the above LFM and HFM; LayerNorm (LN) and residual concatenation are also applied. Therefore, the proposed DCAT is formally defined as
3.3.1. High-Frequency Cross-Attention Mixer
Considering the sensitivity of the convolution operation to high-frequency detail information and the parameter optimization, we adopt three different parallel branches to capture high-frequency components and depth convolution for spatial reduction before cross-attention operation.
In detail, is convolved twice in the first branch, using a depth-wise convolution (DWConv) with kernel size and then . Similarly, the second branch utilizes a DWConv operation with the kernel size of . Here, R is a reduction ratio and maintains different reduction ratios at different stages, which is achieved by convolution with a step size of R. The third branch utilizes max pool operation before DWConv. After the previous operation, three feature maps after space reduction are concatenated together as the input of cross-attention. It can be formulated as:
where denote the outputs of three branches, respectively, is depth-wise convolution with the kernel size . Then, are concatenated together and flattened following layer normalization to obtain .
Obviously, the obtained token sequence is shorter than the flattened input feature . Referring to the Q, , and design in the vanilla self-attention mechanism, we obtain new , , in the high-frequency mixer by: , , and . Here, , , and are learnable matrices to generate query, key, and value, respectively. Then, according to the definition of Equations (4) and (5), the cross-attention feature map of bi-temporal tokens input in the high-frequency mixer is obtained, respectively.
3.3.2. Low-Frequency Cross-Attention Mixer
We use cross-attention again in thte low-frequency mixer to communicate semantic information between tokens from different phases. Although the attention mechanism has a stronger ability to learn global representation, it also inevitably introduces a significant computational burden, particularly for shallow layers of the network when the feature resolution is relatively large. To address this issue, we adopt a simple approach of using an average pooling (AvePool) layer to reduce the feature resolution of before the cross-attention operation. Then, an upsample operation is utilized to recover spatial resolution. The low-frequency mixer can be defined as:
where is the cross-attention operation and is the output in LFM, respectively. In this way, the computational overhead of the low-frequency branch is reduced, meanwhile, global information embedding and communicating are enhanced.
3.3.3. Frequency Ramp Structure
From the perspective of signal processing, the high-frequency component corresponds to the part of the image that changes violently, that is, the edge (contour) or noise of the image, while the low-frequency component represents the area in the image where the brightness or gray value changes slowly, describes the main part of the image, and is a comprehensive measure of the entire image strength. Therefore, in many visual frameworks, bottom layers play more roles in capturing high-frequency details while deep layers do so more in modeling low-frequency global information. By capturing the details in high-frequency components, lower layers can capture visual elementary features, and also gradually gather local information to achieve a global understanding of the input. We designed a frequency ramp structure which gradually splits more channel dimensions from lower to higher layers to a low-frequency mixer and thus leaves fewer channel dimensions to the high-frequency mixer. In many visual frameworks, the lower layers are typically responsible for capturing high-frequency details, while the deeper layers are more focused on modeling low-frequency global information. This is because the lower layers are better suited for capturing visual elementary features and gradually gathering local information to achieve a global understanding of the input. To take advantage of this characteristic, we propose a frequency ramp structure that gradually splits more channel dimensions to the higher layers. Specifically, more channel dimensions are allocated to the high-frequency mixer in the lower layers while fewer channel dimensions are allocated to that in the higher layers. This approach enables our network to effectively capture both high-frequency details and low-frequency global information and facilitates the efficient processing of visual inputs across different frequencies.
Figure 1 illustrates our proposed DCAT architecture, which comprises four stages with varying feature sizes and channel dimensions. For each DCAB, we pre-define a simple channel split strategy to divide low- and high-frequency mix with and channels, respectively. Assuming that the total channel number of the input feature map is C and , gradually decreases from shallow to deep layers, while reverses. By employing the ramp division strategy, DCAT is able to effectively balance high- and low-frequency components across all layers. Different channel division methods will be discussed in the ablation study.
In short, the advantages of the proposed dual cross-attention block lie in the following aspects:
- (1)
- We introduce a high- and low-frequency mixer that combines the strengths of convolution and transformer to enhance the perception capability of cross-attention from frequency viewpoint. By capturing both high- and low-frequency information from bi-temporal inputs, the mixer aims to improve the modeling ability of the network for high-frequency information while leveraging the sensitivity of transformer to low-frequency information. This approach enhances the richness and diversity of feature representation, leading to more accurate and robust change detection results;
- (2)
- The cross-attention mechanism is utilized twice to query and compare semantic information between bi-temporal features. This enables the network to capture more complex and subtle changes between the input images, leading to a more comprehensive and informative feature representation.
3.4. Feature Pyramid Fusion Network
The feature pyramid fusion network (FPFN) aims to aggregate multi-scale bi-temporal feature input and predict distinguishable change maps. Our proposed FPFN restores the original resolution by the progressive up-sampling and merging the early-stage information.
As shown in Figure 2, the proposed FPFN consists of four layers. We get bi-temporal feature maps and () from encoder, then a bi-temporal feature fusion module (BFF) is applied to merge different temporal features to obtain fused feature , followed by upsampling and concatenation layers, which aggregates both shallow and deep context information. The BFF fuses semantic change information by further enhancing the difference and consistency of bi-temporal features which correspond to the difference enhancement module (DEM) and the consistency selection module (CSM), respectively. Finally, the representation is fused and restored through a linear layer and two deconvolution layers. The final per-pixel change result is obtained by a convolutional layer.
The above procedure can be formalized as:
Here, BFF is the bi-temporal feature fusion module. In Equation (13), , is obtained by convolution operation on . It is worth noting that before concatenation in Equation (15), () are upsampled to maintain the same resolution with .
Generally, the fusion of bi-temporal features in CD task can be accomplished through direct subtraction followed by the calculation of the absolute value or by concatenating the features in the channel dimension. However, these simple extraction schemes fail to distinguish between the changed and unchanged classes during the feature extraction process, and they have limited effectiveness in mining and combining mixed features. To overcome this limitation, we emphasize the difference and consistency between different temporal features to further explore and enhance the fusion feature representation.
As shown in Figure 3, and are added separately to obtain the input features of the next stage after parallel DEM and CSM. When extracting cross-temporal features, the model learns not only the differences between changed and unchanged regions but also their consistency. In other words, the most effective and important channel features from different phases are extracted by the common feature, which may mean unchanged regions or ground objects because they have similar texture patterns. Whereas, difference features are obtained by DEM, which corresponds to the changed regions. In this way, differences and consistencies between bi-temporal features have been further enhanced and distinguished, while the information useful for change detection is separated from the mixed features. After the refinement, a more informative and robust feature map is generated, then a change map is obtained by fusing gradually layer by layer.
3.4.1. Consistency Selection Module
The goal of the Consistency Selection Module (CSM) is to select bi-temporal channel features in an adaptive manner, based on the common-modality feature that corresponds to regions that remain unchanged over time. Figure 3a illustrates how CSM dynamically selects features using a SoftMax attention mechanism that is guided by information from different temporal branches. Firstly, the common-attribute feature maps are extracted by directly summing input bi-temporal features and . Secondly, the feature maps and are obtained through two two-layer fully connected networks. Finally, and are obtained by multiplying the attention maps of bi-temporal features with their inputs, respectively. The above process can be formulated as:
Here, , and are three intermediate variables; is an average pooling layer; and refer to two two-layer fully connected networks while they have the same weight at the first layer to reduce parameters; and ⊗ represent the SoftMax opertation and element-wise multiplication, respectively.
3.4.2. Difference Enhancement Module
The difference enhancement module (DEM) aims at enhancing the difference of changed regions. As illustrated in Figure 3b, this module leverages the channel-wise attention weighting mechanism to enhance temporal-related difference. Firstly, we obtain the differential feature by directly substracting and . Secondly, DEM infers attention maps based on differential feature maps . The attention maps are then multiplied with each input feature map to refine the features adaptively. Finally, the refined feature maps are added to the input feature maps to obtain enhanced differential feature maps and . The above procedure can be formulated as:
Here, and refer to global max pooling and global average pooling, respectively; and are intermediate variables; MLP is a simple two-layer CNN; the element-wise multiplication operation is denoted by ⊗, and the sigmoid function is represented by .
After extracting the consistency features and difference features, interaction and aggregation of the overall information during extraction process are completed by the direct summation. It can be formulated as
where is the output feature after BFF at the i-th stage.
The proposed FPFN offers several advantages, which can be summarized in the following three aspects.
- (1)
- FPFN employs a pyramid architecture to fuse features layer by layer, incorporating both early coarse features and deep fine features. This approach enhances the network’s ability to capture complex and multi-scale information;
- (2)
- The network utilizes CSM to select similarities and takes advantage of the SoftMax function’s normalization to reassign weights to feature channels, which allows for the screening of bi-temporal unchanged features. This adaptive selection of channel features from two input features minimizes the introduction of redundant features, allowing the network to focus on the most reliable common features;
- (3)
- The proposed DEM enhances changed attributes by utilizing direct subtraction to obtain the difference representation of input features. By doing so, the network improves the feature separability between changed regions and unchanged regions, leading to more accurate change detection results.
3.5. Loss Function
The binary cross-entropy loss is a commonly used loss function for CD tasks. Since pixel-wise CD can be considered as a binary classification task, we use the following binary cross-entropy loss function as the loss function of DCAT:
where N is the number of image pixels; is the true label of the n-th pixel, represents the changed class, and represents the unchanged class; denotes the change possibility in the predicted map. Technically, four change maps with different resolutions calculate the binary cross-entropy loss with the scaled ground truth, respectively. Meanwhile, the final change map also calculates the binary cross-entropy loss with ground truth. Then, all losses are weighted and summed to get the overall loss L. It can be formulated as:
where is a trade-off parameter, is binary cross-entropy defined by Equation (30).
4. Results
In this section, we provide a comprehensive evaluation and comparison of our method with other state-of-the-art change detection methods.
4.1. Data Sets
The proposed DCAT was evaluated on the following four change detection data sets, details are described in Table 1.
- LEVIR-CD: LEVIR-CD is a building change detection data set, which consists of 637 very high-resolution image pairs with the resolution of 1024 × 1024 pixels [17]. Following the default configuration, the input images are partitioned into small patches with a size of 256 × 256 pixels. We used a total of 7120 image pairs for training, 1024 for validation, and 2048 for testing.
- LEVIR-CD+: LEVIR-CD+ is based on LEVIR-CD, which contains 985 image pairs [62]. However, the LEVIR-CD+ dataset mainly focuses on urban areas. Similar to LEVIR-CD, each image was divided into 256 × 256 pixel patches, 65% of image pairs are used for training and the remaining 35% for testing.
- WHU: The WHU building change detection data set consists of bi-temporal aerial images obtained in 2012 and 2016 [63]. The image resolution of this dataset is between 32,507 and 15,354 pixels. The large-size images are split into non-overlapping 256 × 256 slices and are randomly divided into three parts, including 6096, 762, and 762 images for training, validation, and testing, respectively.
- SYSU-CD: The SYSU-CD dataset contains 20,000 pairs of 256 × 256 aerial images patches, the images were taken over Hong Kong in 2007 and 2014 [50]. Followed by the default configuration by the authors, the sample numbers for training, validation, and test are 12,000, 4000, and 4000, respectively.
4.2. Comparative Methods
To evaluate the effectiveness of the proposed method, the following SOTA CD methods are used for comparison:
- FC-Siam-Conc: FC-Siam-Conc is a variant of the FC-EF model and it concatenates two skip connections during the decoding step, which comes from the corresponding encoding stream [15].
- FC-Siam-Diff: FC-Siam-Diff is another variant of the FC-EF model, FC-Siam-Diff uses the absolute value of the feature difference to merge the bi-temporal information [15].
- DSAMNet: DSAMNet is a deeply supervised attention metric-based network, which integrates convolutional block attention modules for extracting features along the spatial-wise and channel-wise dimension [50].
- STANet: STANet is based on Siamese spatio-temporal attention, which integrates a change detection self-attention module to enhance the spatial-temporal relationship [17].
- DTCDSCN: DTCDSCN is a multi-scale Siamese network, which utilizes channel attention and spatial attention to exploit the interdependence between channel and spatial position [20]. It is noteworthy that the original method contains a change detection network and two semantic segmentation networks, and we just use the change detection network for a fair comparison.
- BIT: BIT is a transformer-based method, and it consists of a Siamese semantic tokenizer to generate a compact set of semantic tokens from the bi-temporal input. It utilizes a Siamese transformer decoder to project the corresponding semantic tokens back into the feature maps [34].
4.3. Evaluation Metrics
For different approaches, precision, recall, and F1-score are used for performance evaluation. The above metrics are defined as follows:
where true positive (TP) is the number of changed pixels detected correctly, false positive (FP) is the number of changed pixels wrongly predicted, true negative (TN) is the number of unchanged pixels detected correctly, and false negative (FN) is the number of unchanged pixels wrongly predicted.
4.4. Experimental Settings
All experiments were conducted using the PyTorch library on two NVIDIA GeForce RTX 3090 GPUs. For other approaches, the parameters were set to the default values as described in the original papers. Our model was trained using the AdamW optimizer with an initial learning rate of 0.0004 and a weight decay of 0.05. The batch size was set to 24, the trade-off parameter was chosen to be , and the model was trained for 600 epochs.
To increase the diversity of samples, we utilized various augmentation techniques, including:
- (1)
- Image flipping: The bi-temporal image pairs were randomly flipped horizontally and vertically.
- (2)
- Image blurring: A Gaussian blur filter was applied to the bi-temporal images with a randomly chosen radius.
- (3)
- Image cropping: The bi-temporal images were randomly cropped with a scaling factor chosen from the range .
- (4)
- Color jitting: A variety of color adjustments were randomly applied to the bi-temporal images, including contrast, brightness, saturation, and hue.
4.5. Performance Comparison
The proposed approach is comprehensively compared with other CD methods on four data sets. All parameter settings of compared methods follow the original paper. If no extra specifications are described, our DCAT model is trained from scratch and does not use any external pretraining weights or other datasets. Below, performance comparisons will be described one by one.
4.5.1. LEVIR-CD
Table 2 summarizes the performances of different approaches on the LEVIR-CD dataset. As shown in the table, FC-Siam-Diff achieved the lowest recall of 76.77%, followed by FC-EF, which achieved a recall of 80.17% and the lowest F1 score of 83.40%. In contrast, FC-Siam-Conc achieved an F1 score of 86.31% and a recall score of 83.31%. These results suggest that concatenation can preserve more useful information than difference for change detection.
DTCDSCN obtains a higher F1 value and recall than FC-type methods: 87.67% and 86.83%, respectively. DSAMNet has lower precision than FC-EF and its variants, but it achieves a higher recall value of 87.79%. One possible reason for the lower performance of FC-EF compared with FC-Siam-Diff and FC-Siam-Conc is that the FC-EF network uses convolutional kernels with a smaller depth, which may not be sufficient to capture rich features. On the other hand, both FC-Siam-Diff and FC-Siam-Conc use a Siamese structure in the encoder, which helps to enhance feature separability. STANet obtains the lowest precision of 83.81% but the highest recall of 91.00%. In addition, as a transformer-based method, BIT obtains promising precision, recall, and F1, i.e., 89.24%, 89.37%, 89.31%, respectively. More than that, we also compared two advanced methods, TransUNetCD [35] and ChangeStar [52]. TransUNetCD is an end-to-end encoding–decoding hybrid transformer model for CD and is the first attempt to combine the transformer and UNet in the CD field. ChangeStar proposes single-temporal supervised learning for CD from a new perspective of exploiting object changes in unpaired images as supervisory signals. TransUNetCD further improves the performance, and the precision, recall, and F1 scores are 92.43%, 89.82%, and 91.11%, respectively. ChangeStar achieves the second-highest F1 score of 91.25%. Moreover, our method DCAT outperforms all the compared methods on the LEVIR-CD dataset and it achieves the highest precision and F1 score of 92.84% and 91.40%, respectively.
To further demonstrate the effectiveness of our proposed method, we present visual results from different approaches on four typical test areas in Figure 4. These areas include changes in isolated regions, dense regions, small objects, large objects, and complex ground objects. The results clearly show the superiority of our method over the other approaches.
Specifically, Figure 4(1,2) illustrate that our method is powerful in capturing small targets and isolated areas, especially within the angular boundaries and fine details. Compared with the ground truth of Figure 4(6), Figure 4(m6) is more consistent than Figure 4(d6,e6,f6) with respect to the large area border in complex scene. From Figure 4(2), it can be learned that some methods (e.g., FC-EF, FC-Siam-Conc, DSAMNet, and STANet) suffer from false changes, while DCAT approaches the ground truth with high confidence. Moreover, our method outperforms other approaches in detecting changes in dense areas and it can accurately identify building boundaries. As shown in Figure 4(3,4), the space gaps between adjacent buildings in DCAT are clearer than others. The above comparisons show that DCAT achieved excellent performance on the LEVIR-CD dataset, and its advantages mainly lie in clear boundaries, sharp edges and corners, and sensitivity to small targets.
4.5.2. LEVIR-CD+
Performances of different methods on LEVIR-CD+ are listed in Table 3. BIT yields precision score 82.74%, recall score 82.85%, and F1 score 82.80%, while DCAT boosts the performance to precision score 84.72% and F1 score to 84.02%, respectively, which are the highest scores among other methods. Some results are shown in Figure 5.
The first row of Figure 5 suggests that all methods except DCAT incorrectly detect changes in buildings. The reason behind this is that DCAT is capable of reducing the impact of misregistration. In reality, the corresponding buildings in the bi-temporal images are not perfectly aligned, particularly in the border regions of buildings. Figure 6 demonstrates the misregistration errors where the buildings in the image strips are not being stitched together smoothly.
For single target and dense area, our method presents better performance, and it is adaptable to the changed region size. In the third and fifth rows of Figure 5, the detection results by other methods are dilated or eroded. In contrast, the boundaries between houses obtained by DCAT are clear and sharply contoured. Furthermore, as shown in row 6 of Figure 5, our method demonstrates greater robustness to large changes in the size of regions.
4.5.3. WHU
The performances regarding the precision, recall and F1 by different methods are summarized in Table 4. As can be deduced from Table 4, the proposed method outperforms other methods on WHU, achieving the highest F1 score of 88.19% with a significant margin. Despite the highest recall of 93.15%, STANet has a very low precision score, which is similar to that in LEVIR-CD and LEVIR-CD+ data sets.
In contrast to the results on the LEVIR-CD+ dataset, the baseline method did not exhibit significant advantages. The second-ranked approach, DTCDSCN, outperformed BIT with precision, recall, and F1 scores of 89.55%, 84.10%, and 86.74%, respectively.
Figure 7 displays change maps generated by various approaches for several typical scenarios, which include changes in small areas, large areas, and areas with complex boundaries. Columns 4–6 of Figure 7 indicate that FC-based methods are less effective in identifying changes in building structures of varying sizes when compared with other approaches. In terms of CD on large-size buildings, DSAMNet, DTCDSCN, and BIT have relatively poor performance in the last row of Figure 7. DSAMNet and DTCDSCN extract small region changes at row 4 but show low separability at the boundary of dense regions. On the contrary, the proposed approach completely captured changed areas in the complex and irregular boundary scenarios (rows 2 and 3 in Figure 7) and is powerful in detecting changes of the building scale (rows 5 and 6 in Figure 7). Similar to the results of LEVIR-CD and LEVIR-CD+, DCAT achieved promising performance on WHU, especially in preserving boundary information of changed regions.
4.5.4. SYSU-CD
To further verify the effectiveness and versatility of DCAT, we conducted experiments on the SYSU-CD dataset and we present the quantitative results in Table 5. The results demonstrate that our proposed approach outperforms other methods in terms of F1 score, confirming its superior performance. DSAMNet scores 81.86% in terms of recall but has the second highest F1 score with 78.18%. FC-Siam-Conc performs better than FC-Siam-Diff, this may be attribute to the fact that feature difference excessively filtered out useful change information and many omissions were caused in relatively complex and irregular scenarios of SYSU-CD dataset. Furthermore, our method has an obvious advantage with the highest F1 score of 79.63%, followed by DSAMNet.
SYSU-CD includes complex scene changes, and three representative scenes were selected for visualization, featuring variations in buildings, boats, and bare land. As can be learned from Figure 8, DSAMNet made some false detections (rows 2, 3 and 5), which is consistent with its high recall and low precision in Table 5. In contrast, there are many omissions in the results by FC-Siam-Diff, which is consistent with its high precision and low recall. Figure 8 shows that DSAMNet produced some false detections (rows 2, 3, and 5), which is in line with its low precision and high recall values reported in Table 5. On the other hand, FC-Siam-Diff had many omissions in its results, which is consistent with its high precision and low recall. Specifically, STANet is powerful in extracting major changes in most cases but less robust to small-size changes, such as the changes in Figure 8(3). From Figure 8, CD performances of FC-EF and its variants for small objects are not satisfactory, which is similar to the conclusion from the previous data sets.
In consequence, it is evident that DCAT successfully recognizes scale-varied changes with finer boundaries and achieves excellent performance in detail preservation of small objects.
5. Discussion
To provide a detailed analysis, we present ablation experiments on the LEVIR-CD dataset in this section. By performing ablation experiments on our proposed method, we aim to identify the contribution of each component to the overall performance and provide insights into the effectiveness of our approach.
5.1. Ablation Study on Cross-Attention
Within the transformer framework, our proposed approach introduces a cross-attention mechanism, which is the core idea and key innovation of DCAT. As shown in Figure 1c, DCAB starts to compute the dot products of the query from the patch with all keys that belong to the corresponding patch on the image T2, which is consistent with human visual change observation. However, frequent cross-attention calculation during feature extraction may lead to the unnecessary feature confusion, and it will be more difficult to distinguish similarity from inconsistency. To investigate how the cross-attention mechanism works well, ablation experiments were conducted on LEVIR-CD data set.
As shown in Table 6, DCAT (with cross-attention) uses a cross-attention mechanism in backbone during feature extraction. In contrast, other variants do not use cross-attention in all transformer blocks but self-attention. In other words, DCAT (with self-attention) focuses on self-attention instead of cross-attention, i.e., dot products are performed not on and , but on and . In addition, our proposed method that utilizes cross-attention mechanism only in the last DCAB at each stage was also compared.
From Table 6, DCAT based on the self-attention mechanism achieves the lowest F1 score of 91.16%. Meanwhile, when all the DATBs adopt the cross-attention mechanism, F1 score is pushed to 91.23%. The performance differences indicate that it is the cross-attention mechanism that improves the CD performance, i.e., similarities should be measured between a query on one image and the keys on the other image. By taking advantage of the novel interactive query calculation, DCAT imitates the visual principle of the human eyes in perceiving changes. In contrast, DCAT (with self-attention) computes self-attention independently, and there is no information interaction between two independent branches. The lack of short-term memory makes the changed features extracted is less representative and fails in compensating the misregistration, and the performances are thus being degraded. Furthermore, compared with the previous two methods, our proposed DCAT only uses cross-attention mechanism in the last DCAB of each stage and self-attention mechanism in other blocks, and it further improves the F1 to 91.40%. The improvements tell us that using a separation-aggregation architecture is helpful for the model to grasp the commonness and characteristics between changed regions and unchanged regions in feature extraction. Our cross-attention mechanism aggregates and analyzes the context information at the end of each stage of backbone, which alleviates the difficulty in distinguishing mixed bi-temporal features in feature extraction and provides a reliable input for the following bi-temporal feature fusion in FPFN.
5.2. Ablation Study on Mixer
As an important component of DCAB, the mixer uses a pre-defined channel division strategy to calculate the cross-attention of high-frequency and low-frequency respectively. This strategy enhances the perception capability of the transformer in the frequency spectrum. As demonstrated in previous research [65], the lower layers of the transformer require more local information, while the higher layers require more global information. Therefore, the mixer’s channel division strategy complements the transformer’s hierarchical structure and optimizes the information flow through the network. To achieve a better trade-off between high- and low-frequency components across all layers, we pre-define a frequency ramp structure. More specifically, the frequency ramp division structure that we proposed involves reducing the dimension of the high-frequency branch and increasing the dimension from lower layers to higher layers in the low-frequency branch. This approach effectively attenuates the high-frequency noise in the input signal and emphasizes the low-frequency components, which are often more informative for various visual recognition tasks. Additionally, the division structure enables the mixer to better utilize the hierarchical feature representations in the transformer, as it corresponds to the lower layers’ preference for local details and the higher layers’ preference for global information. Therefore, this design choice in the mixer enhances the model’s ability to capture and utilize more relevant information from the input signal.
To assess the impact of the mixer’s components, we analyze the effects of the channel division ratio ( and ) in Table 7. The experimental results presented in Table 7 indicate that the model with an increased channel division ratio () and a decreased channel division ratio () outperforms the other four mixer structures evaluated in this study, which is consistent with prior research. Specifically, the frequency ramp division structure enables the mixer to effectively balance the representation of high-frequency and low-frequency components across all layers of the network, which facilitates the learning of more discriminative visual features. Therefore, our findings suggest that the frequency ramp division structure is a promising method for enhancing the performance of dual cross-attention mixer.
5.3. Ablation Study on BFF
Change detection is a challenging visual task that involves processing bi-temporal image inputs. Integrating features from different temporal phases is a crucial aspect of this task. In the ablation study, we compared the impact of different strategies for combining DEM and CSM features in BFF on change detection performance. Our study considered both parallel and sequential arrangements for integrating DEM and CSM features, as illustrated in Figure 9. In the sequential arrangement, we evaluated two orders: DEM-first and CSM-first. The parallel arrangement, in this context, was found to yield better performance than the sequential arrangement.
In addition to comparing different integration strategies, we also examined two common fusion methods: absolute value subtraction and direct concatenation. Absolute value subtraction involves subtracting the absolute difference of corresponding pixel in the two feature maps, while direct concatenation involves concatenating the two maps along the channel dimension. The results in Table 8 demonstrate that the performance of the two feature combination methods mentioned is significantly lower than that achieved by parallel or sequential approaches.
Overall, our study highlights the importance of selecting appropriate integration strategies and fusion methods in BFF for effective change detection. This indicates that incorporating both DEM and CSM features is valuable for CD and using the parallel arrangement strategy further improves performance.
5.4. Ablation Study on FPFN
Benefiting from hierarchical structure design, our encoder can extract features at different scales from shallow to deep level. Therefore, the way in which semantic features at different levels are mixed is crucial for the CD performance. Usually, most deep neural networks utilize the extracted deepest features for information aggregation. FPFN fully incorporates different layers of feature representations to enhance the change feature separability. To verify the effectiveness of layer-by-layer feature fusion, we conducted comparative experiments on the fusion strategy of FPFN. In detail, starting from the deepest features , we respectively take different combinations to merge previous feature maps (, , and ).
The quantitative performances are presented in Table 9. denotes the model only mixing the deepest features and at stage 4 to obtain change maps, while stands for the bi-temporal features extracted at stages 3 and 4 for decoder, the rest is the same. Obviously, the decoder incorporating multi-layer features has significant improvements, which also illustrates that the hierarchical encoder is effective at extracting features of different scales and adaptable to the multi-layer decoder. In Table 9, the more early features fused by the decoder, the better the performance of CD. Our proposed multi-layer feature fusion network, , achieves the highest values of precision, recall, and F1, respectively.
We visualized attention maps after feature fusion and corresponding prediction maps to visually evaluate performance differences with different fusion methods. Observing the results in the third column of Figure 10, we can see that the decoder that uses only features at stage 4 suffers from significant adhesion and misjudgment. With the integration of lower-level features, although and also have the adhesion phenomenon, they achieved higher improvements. The necessity of fusing early features can also be clarified by the fact that with the deepening of fusion layer, the attention maps gradually highlight the changed area, and it is clear and less noisy. In terms of building edge recognition, the detection results by merging multi-layer features have more sharp edges. In short, the above comparisons of FPFN with different structures justify that the proposed fusion network merging multi-layer features is superior to the decoder that only partially fuses deep features in discriminating changed regions.
5.5. Ablation on Robustness
In the LEVIR-CD+ experiment, some misregistered samples were observed, as shown in Figure 6. To further evaluate the generalization and robustness of DCAT against object shifts, we conducted ablation experiments on the synthetic images and real season-varying remote sensing images change detection dataset (SVCD) [66]. SVCD includes a sub-dataset of synthetic images with object shifts. These shifts are in the range [−5, 5] pixels in horizontal and vertical directions without intersections with the other objects and image boundaries. The results presented in Table 10 demonstrate that our approach outperforms other methods on the SVCD test set by a significant margin. This may be attributed to the ability of our method, DCAT, to model context within a global, highly abstract, spatio-temporal scope. Additionally, our method utilizes cross-attention for contrastive queries, which enhances the feature representation and spatial tolerance of the model.
Some visualization results are presented in Figure 11. It can be seen intuitively that the proposed approach outperformed the other methods, achieving more accurate detection boundaries. Our model is able to better avoid false positives that may result from the similar appearance of objects in the scene, which is a common challenge in CD tasks. For instance, in Figure 11(1), we can observe that the FC-EF method incorrectly recognizes a small circle as a changed target, even though there was no actual change in the corresponding position. This is likely due to the high color similarity between the small circle and the background, which makes it difficult for the model to distinguish between them. In contrast, our proposed approach is able to better avoid false positives in such scenarios. By utilizing a more comprehensive feature representation and a dual cross-attention mechanism, our model is able to capture more contextual information and make more informed predictions. As a result, our approach achieves more accurate and reliable CD results, even in challenging scenarios where false positives are common.
Moreover, our DCAT approach demonstrates remarkable ability in handling small gaps caused by close proximity. An instance of close adjacent shapes in Figure 11(3) highlights the accuracy of our method. DCAT learns effective context within the spatio-temporal domain, which enables it to better represent real semantic changes and obtain non-adhesive, separable boundaries. This ability to effectively capture context and enhance feature representation is one of the key factors contributing to the superior performance of our approach in CD tasks. In consequence, the proposed method is qualified for the CD task of small object shifts, which means good robustness and generalization.
5.6. Ablation Study on Pretraining
In recent years, researchers have increasingly focused on remote sensing pretraining, leading to impressive breakthroughs in the CD field. We also explore the potential of pretraining with DCAT in this section, Table 11 presents the performance results of several typical pretraining methods on the LEVIR-CD test set.
SwinSUNet [36] utilizes a pure transformer network with a Siamese U-shaped structure for change detection. The method is initialized with a Swin transformer model pretrained on the ImageNet dataset. It achieves a significant improvement in the F1 score, achieving a score of 90.14%. ViTAEv2-s [59] proposes an advanced ViTAE transformers-based model pretrained on ImageNet data set, which achieves F1 score 91.26%. Nevertheless, it is also pretrained on a large-scale remote sensing data set MillionAID [67], which obtains F1 score of 90.93%. The training set of MillionAID contains 10,000 images for classification, we pretrain DCAT encoder on this set as done in most segmentation methods. The pretraining of the DCAT encoder leads to a improvement of 0.11% in terms of F1 score for the proposed approach. We note that our method outperforms those pretrained models even without using any pretraining weights or training on other large-scale datasets. This suggests that pretraining helps learn extra information to improve change feature discrimination.
5.7. Visualization of the Encoder
Our dual cross-attention transformer block plays a crucial role in capturing the semantic change differences between bi-temporal features at each layer. To gain a better understanding of the dual cross-attention transformer block, we visualize the attention maps at different stages. By examining the attention maps, we can observe that our transformer block is capable of identifying regions with significant change in the feature maps. In addition, the attention maps reveal that the dual cross-attention transformer block can effectively capture both high-level and low-level semantic concepts. At the earlier stages, the attention maps are focused on capturing low-level features, while at the later stages, the attention maps become more focused on high-level features such as objects and scenes.
Figure 12 shows the visualization results by fusing the bi-temporal attention maps and at the i-th stage from the LEVIR-CD datasets. We select several typical change scenarios, including changes in isolated small areas and dense areas. Based on the visualization of the attention maps, it can be seen that the features extracted by the encoder are mainly concentrated in the regions corresponding to semantic concepts with varying interests. Specifically, the attention maps highlight the changed areas in red, indicating higher attention values, while the unchanged areas are marked in blue, indicating lower attention values.
At the first stage, the encoder pays little attention to the pixels about buildings. At the second and third stages, our proposed encoder is able to identify the changed regions of interest. At the fourth stage, this phenomenon is more obvious. Interestingly, from Figure 12f,g, our encoder is effective in highlighting the pixels surrounding the buildings (e.g., shadows and trees) and larger areas have higher values of attention in Figure 12g. The shift of learned attention towards the changed regions related to buildings with the increase of network depth can be attributed to two main reasons. Firstly, the encoder of our model has the ability to capture long-range spatio-temporal dependencies, which helps it to extract more comprehensive features that are sensitive to changes in the environment. Secondly, the semantic context surrounding buildings plays a crucial role in object recognition, making it an essential cue for identifying ground objects. As a result, the attention of the dual cross-attention transformer block gradually shifts towards the changed regions related to buildings with an increase in network depth. This observation indicates that our model is capable of learning complex representations that are highly informative and sensitive to the context of the environment. Therefore, the attention maps become more focused on the changed regions related to buildings in deeper layers, indicating that the proposed dual cross-attention transformer block can effectively capture the semantic differences between bi-temporal features and extract informative features for change detection. The visualization results indicate that our model is powerful in capturing semantic differences from coarse to fine and implicitly learning some extra concepts to promote change detection.
6. Conclusions
In this paper, we present a novel approach called DCAT that leverages the power of dual cross-attention transformers for accurate change detection in remote sensing imagery. Inspired by the visual change observation of human eyes, where changes are detected by alternative comparisons from left to right and successive matching from back to forth [68], we introduce a dual cross-attention mechanism that combines the transformer’s query, key, and value to achieve alternative attention. This approach enables the capture of change-specific feature salience and compensation for change features impacted by misregistration.
Based on dual cross-attention, we present a mixer that combines high- and low-frequency information, replacing the traditional self-attention mixer. Two branches of cross-attention are calculated to obtain feature representations under high- and low-frequency mixers, respectively. DCAT utilizes a channel ramp splitting method to couple convolution-based CNN and cross-attention-based transformer, which enables the model to expand its perception capability and capture more diverse features from the input paired data. The CNN and transformer modules are fused in a parallel and hierarchical manner, enabling the efficient combination of local and global features, resulting in improved performance in remote sensing CD tasks.
Furthermore, the encoder of DCAT has a hierarchical structure to adapt to changed objects of various sizes. Hierarchical features extracted at different stages effectively capture changed objects of small sizes and reduce missed alarms. In addition to the powerful dual cross-attention-based transformer encoder, we adopt a feature pyramid fusion network to aggregate multi-scale dual-input features. The parallel structure of BFF effectively enhances the differences between bi-temporal features and uses consistent features to select similarity.
Extensive experiments demonstrate that DCAT has significant advantages over other self-attention transformers, indicating its potential as a general-purpose backbone for change detection.
Limitation
During the ablation study, we noticed that incorporating a pretraining dataset of 10,000 images only resulted in a slight improvement in DCAT’s performance. We infer that this could be attributed to the limited size of the pretraining dataset and the inherent differences between the pretraining method (which involves classifying two images simultaneously) and the image pairs used for change detection. Consequently, there is still a hot topic to explore and develop large-scale pretrained models in the field of remote sensing.
Another limitation of DCAT architecture is the manual definition of the channel numbers in the frequency ramp structure, namely, and for the low- and high-frequency mixer, respectively. This requires a significant amount of experience for better performance. To address this limitation, we plan to consider using neural architecture search to adapt the number of allocated high-frequency and low-frequency channels.
Despite the novelty of our proposed DCAT, future work will focus on its extension to other object types, such as roads, street views, and vegetation. We also plan to explore the use of DCAT for multi-class semantic change type identification and for pretraining models in remote sensing, which will be our future research direction.
Author Contributions
Conceptualization, Y.Z. and C.H.; methodology, Y.Z.; investigation, Y.Z. and L.H.; visualization, Y.Z. and J.Z.; writing—original draft preparation, Y.Z.; data curation, Y.Z. and J.Z.; writing—review and editing, Y.Z. and C.H.; supervision, C.H. and C.P.; funding acquisition, C.H. All authors have read and agreed to the published version of the manuscript.
Funding
This research is supported by National Natural Science Foundation of China (Grant No. 62071466), Guangxi Natural Science Foundation (Grant No. 2018GXNSFBA281086) and Fund of National Key Laboratory of Science and Technology on Remote Sensing Information and Imagery Analysis, Beijing Research Institute of Uranium Geology (Grant No. 6142A010402).
Data Availability Statement
(1) LEVIR-CD: https://justchenhao.github.io/LEVIR/; (2) LEVIR-CD+: https://github.com/S2Looking/Dataset; (3) WHU: http://gpcv.whu.edu.cn/data/; (4) SYSU-CD: https://github.com/liumency/SYSU-CD; (5) SVCD: https://drive.google.com/file/d/1GX656JqqOyBi_Ef0w65kDGVto-nHrNs9; (6) Million-AID: https://captain-whu.github.io/DiRS/. All accessed on 24 March 2023.
Conflicts of Interest
The authors declare no conflict of interest.
References
- Shi, W.; Zhang, M.; Zhang, R.; Chen, S.; Zhan, Z. Change detection based on artificial intelligence: State-of-the-art and challenges. Remote Sens. 2020, 12, 1688. [Google Scholar] [CrossRef]
- Sefrin, O.; Riese, F.M.; Keller, S. Deep learning for land cover change detection. Remote Sens. 2021, 13, 78. [Google Scholar] [CrossRef]
- Caye Daudt, R.; Le Saux, B.; Boulch, A.; Gousseau, Y. Urban Change Detection for Multispectral Earth Observation Using Convolutional Neural Networks. In Proceedings of the IEEE International Geoscience and Remote Sensing Symposium (IGARSS), Valencia, Spain, 22–27 July 2018. [Google Scholar]
- Mahdavi, S.; Salehi, B.; Huang, W.; Amani, M.; Brisco, B. A PolSAR change detection index based on neighborhood information for flood mapping. Remote Sens. 2019, 11, 1854. [Google Scholar] [CrossRef]
- Fujita, A.; Sakurada, K.; Imaizumi, T.; Ito, R.; Hikosaka, S.; Nakamura, R. Damage detection from aerial images via convolutional neural networks. In Proceedings of the 2017 Fifteenth IAPR International Conference on Machine Vision Applications (MVA), Nagoya, Japan, 8–12 May 2017; pp. 5–8. [Google Scholar] [CrossRef]
- Xiang, J.; Xing, Y.; Wei, W.; Yan, E.; Jiang, J.; Mo, D. Dynamic Detection of Forest Change in Hunan Province Based on Sentinel-2 Images and Deep Learning. Remote Sens. 2023, 15, 628. [Google Scholar] [CrossRef]
- Xing, H.; Zhu, L.; Hou, D.; Zhang, T. Integrating change magnitude maps of spectrally enhanced multi-features for land cover change detection. Int. J. Remote Sens. 2021, 42, 4284–4308. [Google Scholar] [CrossRef]
- Du, P.; Wang, X.; Chen, D.; Liu, S.; Lin, C.; Meng, Y. An improved change detection approach using tri-temporal logic-verified change vector analysis. ISPRS J. Photogramm. Remote Sens. 2020, 161, 278–293. [Google Scholar] [CrossRef]
- Lv, P.; Zhong, Y.; Zhao, J.; Jiao, H.; Zhang, L. Change Detection Based on a Multifeature Probabilistic Ensemble Conditional Random Field Model for High Spatial Resolution Remote Sensing Imagery. IEEE Geosci. Remote Sens. Lett. 2016, 13, 1965–1969. [Google Scholar] [CrossRef]
- Khelifi, L.; Mignotte, M. Deep Learning for Change Detection in Remote Sensing Images: Comprehensive Review and Meta-Analysis. IEEE Access 2020, 8, 126385–126400. [Google Scholar] [CrossRef]
- Zou, Y.; Shen, T.; Chen, Z.; Chen, P.; Yang, X.; Zan, L. A Transformer-Based Neural Network with Improved Pyramid Pooling Module for Change Detection in Ecological Redline Monitoring. Remote Sens. 2023, 15, 588. [Google Scholar] [CrossRef]
- Xia, Y.; Xu, X.; Pu, F. PCBA-Net: Pyramidal Convolutional Block Attention Network for Synthetic Aperture Radar Image Change Detection. Remote Sens. 2022, 14, 5762. [Google Scholar] [CrossRef]
- Ling, J.; Hu, L.; Cheng, L.; Chen, M.; Yang, X. IRA-MRSNet: A Network Model for Change Detection in High-Resolution Remote Sensing Images. Remote Sens. 2022, 14, 5598. [Google Scholar] [CrossRef]
- He, C.; Zhao, Y.; Dong, J.; Xiang, Y. Use of GAN to Help Networks to Detect Urban Change Accurately. Remote Sens. 2022, 14, 5448. [Google Scholar] [CrossRef]
- Caye Daudt, R.; Le Saux, B.; Boulch, A. Fully Convolutional Siamese Networks for Change Detection. In Proceedings of the 2018 25th IEEE International Conference on Image Processing (ICIP), Athens, Greece, 7–10 October 2018; pp. 4063–4067. [Google Scholar] [CrossRef]
- Bai, B.; Fu, W.; Lu, T.; Li, S. Edge-Guided Recurrent Convolutional Neural Network for Multitemporal Remote Sensing Image Building Change Detection. IEEE Trans. Geosci. Remote. Sens. 2022, 60, 1–13. [Google Scholar] [CrossRef]
- Chen, H.; Shi, Z. A spatial-temporal attention-based method and a new dataset for remote sensing image change detection. Remote Sens. 2020, 12, 1662. [Google Scholar] [CrossRef]
- Bromley, J.; Guyon, I.; LeCun, Y.; Säckinger, E.; Shah, R. Signature verification using a “siamese” time delay neural network. In Proceedings of the Advances in Neural Information Processing Systems, Denver, CO, USA, 29 November–2 December 1993; Volume 6. [Google Scholar]
- Zhang, M.; Xu, G.; Chen, K.; Yan, M.; Sun, X. Triplet-Based Semantic Relation Learning for Aerial Remote Sensing Image Change Detection. IEEE Geosci. Remote Sens. Lett. 2019, 16, 266–270. [Google Scholar] [CrossRef]
- Liu, Y.; Pang, C.; Zhan, Z.; Zhang, X.; Yang, X. Building Change Detection for Remote Sensing Images Using a Dual-Task Constrained Deep Siamese Convolutional Network Model. IEEE Geosci. Remote Sens. Lett. 2021, 18, 811–815. [Google Scholar] [CrossRef]
- Zhang, C.; Yue, P.; Tapete, D.; Jiang, L.; Shangguan, B.; Huang, L.; Liu, G. A deeply supervised image fusion network for change detection in high resolution bi-temporal remote sensing images. ISPRS J. Photogramm. Remote Sens. 2020, 166, 183–200. [Google Scholar] [CrossRef]
- Peng, X.; Zhong, R.; Li, Z.; Li, Q. Optical Remote Sensing Image Change Detection Based on Attention Mechanism and Image Difference. IEEE Trans. Geosci. Remote Sens. 2021, 59, 7296–7307. [Google Scholar] [CrossRef]
- Jiang, H.; Hu, X.; Li, K.; Zhang, J.; Gong, J.; Zhang, M. PGA-SiamNet: Pyramid feature-based attention-guided siamese network for remote sensing orthoimagery building change detection. Remote Sens. 2020, 12, 484. [Google Scholar] [CrossRef]
- Fang, S.; Li, K.; Shao, J.; Li, Z. SNUNet-CD: A Densely Connected Siamese Network for Change Detection of VHR Images. IEEE Geosci. Remote Sens. Lett. 2022, 19, 1–5. [Google Scholar] [CrossRef]
- Devlin, J.; Chang, M.W.; Lee, K.; Toutanova, K. Bert: Pre-training of deep bidirectional transformers for language understanding. arXiv 2018, arXiv:1810.04805. [Google Scholar]
- Dosovitskiy, A.; Beyer, L.; Kolesnikov, A.; Weissenborn, D.; Zhai, X.; Unterthiner, T.; Dehghani, M.; Minderer, M.; Heigold, G.; Gelly, S.; et al. An image is worth 16x16 words: Transformers for image recognition at scale. arXiv 2020, arXiv:2010.11929. [Google Scholar]
- Liu, Z.; Lin, Y.; Cao, Y.; Hu, H.; Wei, Y.; Zhang, Z.; Lin, S.; Guo, B. Swin Transformer: Hierarchical Vision Transformer Using Shifted Windows. In Proceedings of the IEEE/CVF International Conference on Computer Vision (ICCV), Montreal, QC, Canada, 10–17 October 2021; pp. 10012–10022. [Google Scholar]
- Zheng, S.; Lu, J.; Zhao, H.; Zhu, X.; Luo, Z.; Wang, Y.; Fu, Y.; Feng, J.; Xiang, T.; Torr, P.H.; et al. Rethinking semantic segmentation from a sequence-to-sequence perspective with transformers. In Proceedings of the IEEE/CVF Conference on Computer Vision and Pattern Recognition, Nashville, TN, USA, 20–25 June 2021; pp. 6881–6890. [Google Scholar]
- Park, N.; Kim, S. How Do Vision Transformers Work? In Proceedings of the International Conference on Learning Representations, Online, 25–29 April 2022. [Google Scholar]
- Touvron, H.; Cord, M.; Douze, M.; Massa, F.; Sablayrolles, A.; Jégou, H. Training data-efficient image transformers & distillation through attention. In Proceedings of the International Conference on Machine Learning, Online, 1–3 December 2021; pp. 10347–10357. [Google Scholar]
- Wu, B.; Xu, C.; Dai, X.; Wan, A.; Zhang, P.; Yan, Z.; Tomizuka, M.; Gonzalez, J.; Keutzer, K.; Vajda, P. Visual transformers: Token-based image representation and processing for computer vision. arXiv 2020, arXiv:2006.03677. [Google Scholar]
- Zhang, D.; Zhang, H.; Tang, J.; Wang, M.; Hua, X.; Sun, Q. Feature pyramid transformer. In Proceedings of the European Conference on Computer Vision, Glasgow, UK, 23–28 August 2020; pp. 323–339. [Google Scholar]
- Carion, N.; Massa, F.; Synnaeve, G.; Usunier, N.; Kirillov, A.; Zagoruyko, S. End-to-end object detection with transformers. In Proceedings of the European Conference on Computer Vision, Glasgow, UK, 23–28 August 2020; pp. 213–229. [Google Scholar]
- Chen, H.; Qi, Z.; Shi, Z. Remote sensing image change detection with transformers. IEEE Trans. Geosci. Remote Sens. 2022, 60, 1–14. [Google Scholar] [CrossRef]
- Li, Q.; Zhong, R.; Du, X.; Du, Y. TransUNetCD: A Hybrid Transformer Network for Change Detection in Optical Remote-Sensing Images. IEEE Trans. Geosci. Remote Sens. 2022, 60, 1–19. [Google Scholar] [CrossRef]
- Zhang, C.; Wang, L.; Cheng, S.; Li, Y. SwinSUNet: Pure Transformer Network for Remote Sensing Image Change Detection. IEEE Trans. Geosci. Remote Sens. 2022, 60, 1–13. [Google Scholar] [CrossRef]
- Kauffmann, L.; Ramanoël, S.; Peyrin, C. The neural bases of spatial frequency processing during scene perception. Front. Integr. Neurosci. 2014, 8, 37. [Google Scholar] [CrossRef] [PubMed]
- Fu, L.; Tian, H.; Zhai, X.B.; Gao, P.; Peng, X. IncepFormer: Efficient Inception Transformer with Pyramid Pooling for Semantic Segmentation. arXiv 2022, arXiv:2212.03035. [Google Scholar]
- Si, C.; Yu, W.; Zhou, P.; Zhou, Y.; Wang, X.; Yan, S. Inception transformer. arXiv 2022, arXiv:2205.12956. [Google Scholar]
- Hollingworth, A.; Schrock, G.; Henderson, J.M. Change detection in the flicker paradigm: The role of fixation position within the scene. Mem. Cogn. 2001, 29, 296–304. [Google Scholar] [CrossRef]
- Rensink, R.A. Visual Search for Change: A Probe into the Nature of Attentional Processing. Vis. Cogn. 2000, 7, 345–376. [Google Scholar] [CrossRef]
- Chen, P.; Li, C.; Zhang, B.; Chen, Z.; Yang, X.; Lu, K.; Zhuang, L. A Region-Based Feature Fusion Network for VHR Image Change Detection. Remote Sens. 2022, 14, 5577. [Google Scholar] [CrossRef]
- Peng, D.; Zhang, Y.; Guan, H. End-to-End Change Detection for High Resolution Satellite Images Using Improved UNet++. Remote Sens. 2019, 11, 1382. [Google Scholar] [CrossRef]
- Zhou, Z.; Rahman Siddiquee, M.M.; Tajbakhsh, N.; Liang, J. UNet++: Redesigning Skip Connections to Exploit Multiscale Features in Image Segmentation. IEEE Trans. Med Imaging 2020, 39, 1856–1867. [Google Scholar] [CrossRef]
- Chen, H.; Li, W.; Shi, Z. Adversarial Instance Augmentation for Building Change Detection in Remote Sensing Images. IEEE Trans. Geosci. Remote Sens. 2022, 60, 1–16. [Google Scholar] [CrossRef]
- Ding, Q.; Shao, Z.; Huang, X.; Altan, O. DSA-Net: A novel deeply supervised attention-guided network for building change detection in high-resolution remote sensing images. Int. J. Appl. Earth Obs. Geoinf. 2021, 105, 102591. [Google Scholar] [CrossRef]
- Chen, H.; Wu, C.; Du, B. Towards Deep and Efficient: A Deep Siamese Self-Attention Fully Efficient Convolutional Network for Change Detection in VHR Images. arXiv 2021, arXiv:2108.08157. [Google Scholar]
- Song, L.; Xia, M.; Jin, J.; Qian, M.; Zhang, Y. SUACDNet: Attentional change detection network based on siamese U-shaped structure. Int. J. Appl. Earth Obs. Geoinf. 2021, 105, 102597. [Google Scholar] [CrossRef]
- Ding, L.; Guo, H.; Liu, S.; Mou, L.; Zhang, J.; Bruzzone, L. Bi-Temporal Semantic Reasoning for the Semantic Change Detection in HR Remote Sensing Images. arXiv 2021, arXiv:2108.06103. [Google Scholar] [CrossRef]
- Shi, Q.; Liu, M.; Li, S.; Liu, X.; Wang, F.; Zhang, L. A Deeply Supervised Attention Metric-Based Network and an Open Aerial Image Dataset for Remote Sensing Change Detection. IEEE Trans. Geosci. Remote Sens. 2022, 60, 1–16. [Google Scholar] [CrossRef]
- Chen, J.; Yuan, Z.; Peng, J.; Chen, L.; Huang, H.; Zhu, J.; Liu, Y.; Li, H. DASNet: Dual Attentive Fully Convolutional Siamese Networks for Change Detection in High-Resolution Satellite Images. IEEE J. Sel. Top. Appl. Earth Obs. Remote. Sens. 2021, 14, 1194–1206. [Google Scholar] [CrossRef]
- Zheng, Z.; Ma, A.; Zhang, L.; Zhong, Y. Change is Everywhere: Single-Temporal Supervised Object Change Detection in Remote Sensing Imagery. In Proceedings of the IEEE/CVF International Conference on Computer Vision, Montreal, QC, Canada, 10–17 October 2021; pp. 15193–15202. [Google Scholar]
- Zhan, Y.; Fu, K.; Yan, M.; Sun, X.; Wang, H.; Qiu, X. Change Detection Based on Deep Siamese Convolutional Network for Optical Aerial Images. IEEE Geosci. Remote Sens. Lett. 2017, 14, 1845–1849. [Google Scholar] [CrossRef]
- Vaswani, A.; Shazeer, N.; Parmar, N.; Uszkoreit, J.; Jones, L.; Gomez, A.N.; Kaiser, Ł.; Polosukhin, I. Attention is all you need. In Proceedings of the Advances in Neural Information Processing Systems, Long Beach, CA, USA, 4–9 December 2017; Volume 30. [Google Scholar]
- Wang, W.; Xie, E.; Li, X.; Fan, D.P.; Song, K.; Liang, D.; Lu, T.; Luo, P.; Shao, L. Pyramid vision transformer: A versatile backbone for dense prediction without convolutions. In Proceedings of the IEEE/CVF International Conference on Computer Vision, Montreal, QC, Canada, 10–17 October 2021; pp. 568–578. [Google Scholar]
- Xie, E.; Wang, W.; Yu, Z.; Anandkumar, A.; Alvarez, J.M.; Luo, P. SegFormer: Simple and efficient design for semantic segmentation with transformers. In Proceedings of the Advances in Neural Information Processing Systems, Online, 6–14 December 2021; Volume 34. [Google Scholar]
- Yang, F.; Yang, H.; Fu, J.; Lu, H.; Guo, B. Learning texture transformer network for image super-resolution. In Proceedings of the IEEE/CVF Conference on Computer Vision and Pattern Recognition, Seattle, WA, USA, 13–19 June 2020; pp. 5791–5800. [Google Scholar]
- Esser, P.; Rombach, R.; Ommer, B. Taming transformers for high-resolution image synthesis. In Proceedings of the IEEE/CVF Conference on Computer Vision and Pattern Recognition, Nashville, TN, USA, 20–25 June 2021; pp. 12873–12883. [Google Scholar]
- Wang, D.; Zhang, J.; Du, B.; Xia, G.S.; Tao, D. An Empirical Study of Remote Sensing Pretraining. IEEE Trans. Geosci. Remote. Sens. 2022, 1–20. [Google Scholar] [CrossRef]
- Zhao, H.; Shi, J.; Qi, X.; Wang, X.; Jia, J. Pyramid scene parsing network. In Proceedings of the IEEE Conference on Computer Vision and Pattern Recognition, Honolulu, HI, USA, 21–26 July 2017; pp. 2881–2890. [Google Scholar]
- Szegedy, C.; Ioffe, S.; Vanhoucke, V.; Alemi, A.A. Inception-v4, inception-resnet and the impact of residual connections on learning. In Proceedings of the Thirty-First AAAI Conference on Artificial Intelligence, San Francisco, CA, USA, 4–9 February 2017. [Google Scholar]
- Shen, L.; Lu, Y.; Chen, H.; Wei, H.; Xie, D.; Yue, J.; Chen, R.; Lv, S.; Jiang, B. S2Looking: A Satellite Side-Looking Dataset for Building Change Detection. Remote Sens. 2021, 13, 5094. [Google Scholar] [CrossRef]
- Ji, S.; Wei, S.; Lu, M. Fully Convolutional Networks for Multisource Building Extraction From an Open Aerial and Satellite Imagery Data Set. IEEE Trans. Geosci. Remote. Sens. 2019, 57, 574–586. [Google Scholar] [CrossRef]
- Ronneberger, O.; Fischer, P.; Brox, T. U-net: Convolutional networks for biomedical image segmentation. In Proceedings of the International Conference on Medical Image Computing and Computer-Assisted Intervention, Munich, Germany, 5–9 October 2015; pp. 234–241. [Google Scholar]
- Raghu, M.; Unterthiner, T.; Kornblith, S.; Zhang, C.; Dosovitskiy, A. Do vision transformers see like convolutional neural networks? Adv. Neural Inf. Process. Syst. 2021, 34, 12116–12128. [Google Scholar]
- Lebedev, M.; Vizilter, Y.V.; Vygolov, O.; Knyaz, V.; Rubis, A.Y. Change detection in remote sensing images using conditional adversarial networks. In Proceedings of the International Archives of the Photogrammetry, Remote Sensing and Spatial Information Sciences, Riva del Garda, Italy, 4–7 June 2018; Volume 42. [Google Scholar]
- Long, Y.; Xia, G.S.; Li, S.; Yang, W.; Yang, M.Y.; Zhu, X.X.; Zhang, L.; Li, D. On Creating Benchmark Dataset for Aerial Image Interpretation: Reviews, Guidances, and Million-AID. IEEE J. Sel. Top. Appl. Earth Obs. Remote. Sens. 2021, 14, 4205–4230. [Google Scholar] [CrossRef]
- Simons, D.J.; Rensink, R.A. Change blindness: Past, present, and future. Trends Cogn. Sci. 2005, 9, 16–20. [Google Scholar] [CrossRef]
Figure 1.
The overall architecture of DCAT-based CD framework. (a) The pipeline of DCAT; (b) Dual cross-attention mixer; (c) Cross-attention mechanism. DCAT is divided into two main components: an encoder and a decoder. The encoder is the dual cross-attention mixer, which extracts hierarchical features using a combination of CNN and transformer. The decoder is the feature pyramid fusion network, which progressively merges multi-level features to generate the semantic change segmentation map. The novelty and rationale of DCAT lie in dual cross-attention, cross-attention aims at enhancing change features by interactive attention between bi-temporal images, and the dual structure is able to combine complementary high-frequency features by CNN and low-frequency features by transformer. To the best of our knowledge, there are no other methods in the literature that explore dual cross-attention for change detection tasks.

Figure 2.
Illustration of feature pyramid fusion network.

Figure 3.
Illustration of bi-temporal feature fusion module (BFF). (a) Consistency selection module (CSM); (b) Difference enhancement module (DEM).
Figure 3.
Illustration of bi-temporal feature fusion module (BFF). (a) Consistency selection module (CSM); (b) Difference enhancement module (DEM).

Figure 4.
Results comparison on LEVIR-CD. (1–6): Different image pairs; (a) Image T1; (b) Image T2; (c) Ground truth; (d) FC-EF; (e) FC-Siam-Conc; (f) FC-Siam-Diff; (g) DSAMNet; (h) STANet; (i) DTCDSCN; (j) BIT; (k) TransUNetCD; (l) ChangeStar; (m) DCAT.
Figure 4.
Results comparison on LEVIR-CD. (1–6): Different image pairs; (a) Image T1; (b) Image T2; (c) Ground truth; (d) FC-EF; (e) FC-Siam-Conc; (f) FC-Siam-Diff; (g) DSAMNet; (h) STANet; (i) DTCDSCN; (j) BIT; (k) TransUNetCD; (l) ChangeStar; (m) DCAT.

Figure 5.
Results comparison on LEVIR-CD+. (1–6): Different image pairs; (a) Image T1; (b) Image T2; (c) Ground truth; (d) FC-EF; (e) FC-Siam-Conc; (f) FC-Siam-Diff; (g) DSAMNet; (h) STANet; (i) DTCDSCN; (j) BIT; (k) DCAT.
Figure 5.
Results comparison on LEVIR-CD+. (1–6): Different image pairs; (a) Image T1; (b) Image T2; (c) Ground truth; (d) FC-EF; (e) FC-Siam-Conc; (f) FC-Siam-Diff; (g) DSAMNet; (h) STANet; (i) DTCDSCN; (j) BIT; (k) DCAT.

Figure 6.
Illustration of registration error on LEVIR-CD+. To illustrate the registration error on LEVIR-CD+, we have stitched together two images to better visualize the misregistration. Misregistration areas are highlighted using red circles.
Figure 6.
Illustration of registration error on LEVIR-CD+. To illustrate the registration error on LEVIR-CD+, we have stitched together two images to better visualize the misregistration. Misregistration areas are highlighted using red circles.

Figure 7.
Results comparison on WHU. (1–6): Different image pairs; (a) Image T1; (b) Image T2; (c) Ground truth; (d) FC-EF; (e) FC-Siam-Conc; (f) FC-Siam-Diff; (g) DSAMNet; (h) STANet; (i) DTCDSCN; (j) BIT; (k) DCAT.
Figure 7.
Results comparison on WHU. (1–6): Different image pairs; (a) Image T1; (b) Image T2; (c) Ground truth; (d) FC-EF; (e) FC-Siam-Conc; (f) FC-Siam-Diff; (g) DSAMNet; (h) STANet; (i) DTCDSCN; (j) BIT; (k) DCAT.

Figure 8.
Results comparison on SYSU-CD. (1–6): Different image pairs; (a) Image T1; (b) Image T2; (c) Ground truth; (d) FC-EF; (e) FC-Siam-Conc; (f) FC-Siam-Diff; (g) DSAMNet; (h) STANet; (i) DTCDSCN; (j) BIT; (k) DCAT.
Figure 8.
Results comparison on SYSU-CD. (1–6): Different image pairs; (a) Image T1; (b) Image T2; (c) Ground truth; (d) FC-EF; (e) FC-Siam-Conc; (f) FC-Siam-Diff; (g) DSAMNet; (h) STANet; (i) DTCDSCN; (j) BIT; (k) DCAT.

Figure 9.
Three arrangements of CSM and DEM modules. (a) CSM-first sequential manner; (b) DEM-first sequential manner; (c) Parallel manner.
Figure 9.
Three arrangements of CSM and DEM modules. (a) CSM-first sequential manner; (b) DEM-first sequential manner; (c) Parallel manner.

Figure 10.
Visualization of bi-temporal difference feature maps with different decoding schemes on LEVIR-CD. (1–3): Different image pairs; (a) Image T1 and T2; (b) Ground truth; (c–f) Attention maps (top) and prediction maps (bottom) with different fusion strategies after a linear layer. From columns (c–f), the fusion strategies are , , and , respectively.

Figure 11.
Results comparison on SVCD. (1–4): Different image pairs; (a) Image T1; (b) Image T2; (c) Ground truth; (d) FC-EF; (e) FC-Siam-Conc; (f) FC-Siam-Diff; (g) DSAMNet; (h) STANet; (i) DTCDSCN; (j) BIT; (k) DCAT.
Figure 11.
Results comparison on SVCD. (1–4): Different image pairs; (a) Image T1; (b) Image T2; (c) Ground truth; (d) FC-EF; (e) FC-Siam-Conc; (f) FC-Siam-Diff; (g) DSAMNet; (h) STANet; (i) DTCDSCN; (j) BIT; (k) DCAT.

Figure 12.
Visualization of attention maps at different encoding stages on LEVIR-CD. (1–4): Different image pairs; (a) Image T1; (b) Image T2; (c) Ground truth; (d–g) Attention maps at Stage 1–4. Red denotes higher attention values and blue denotes lower values in the changed area.
Figure 12.
Visualization of attention maps at different encoding stages on LEVIR-CD. (1–4): Different image pairs; (a) Image T1; (b) Image T2; (c) Ground truth; (d–g) Attention maps at Stage 1–4. Red denotes higher attention values and blue denotes lower values in the changed area.


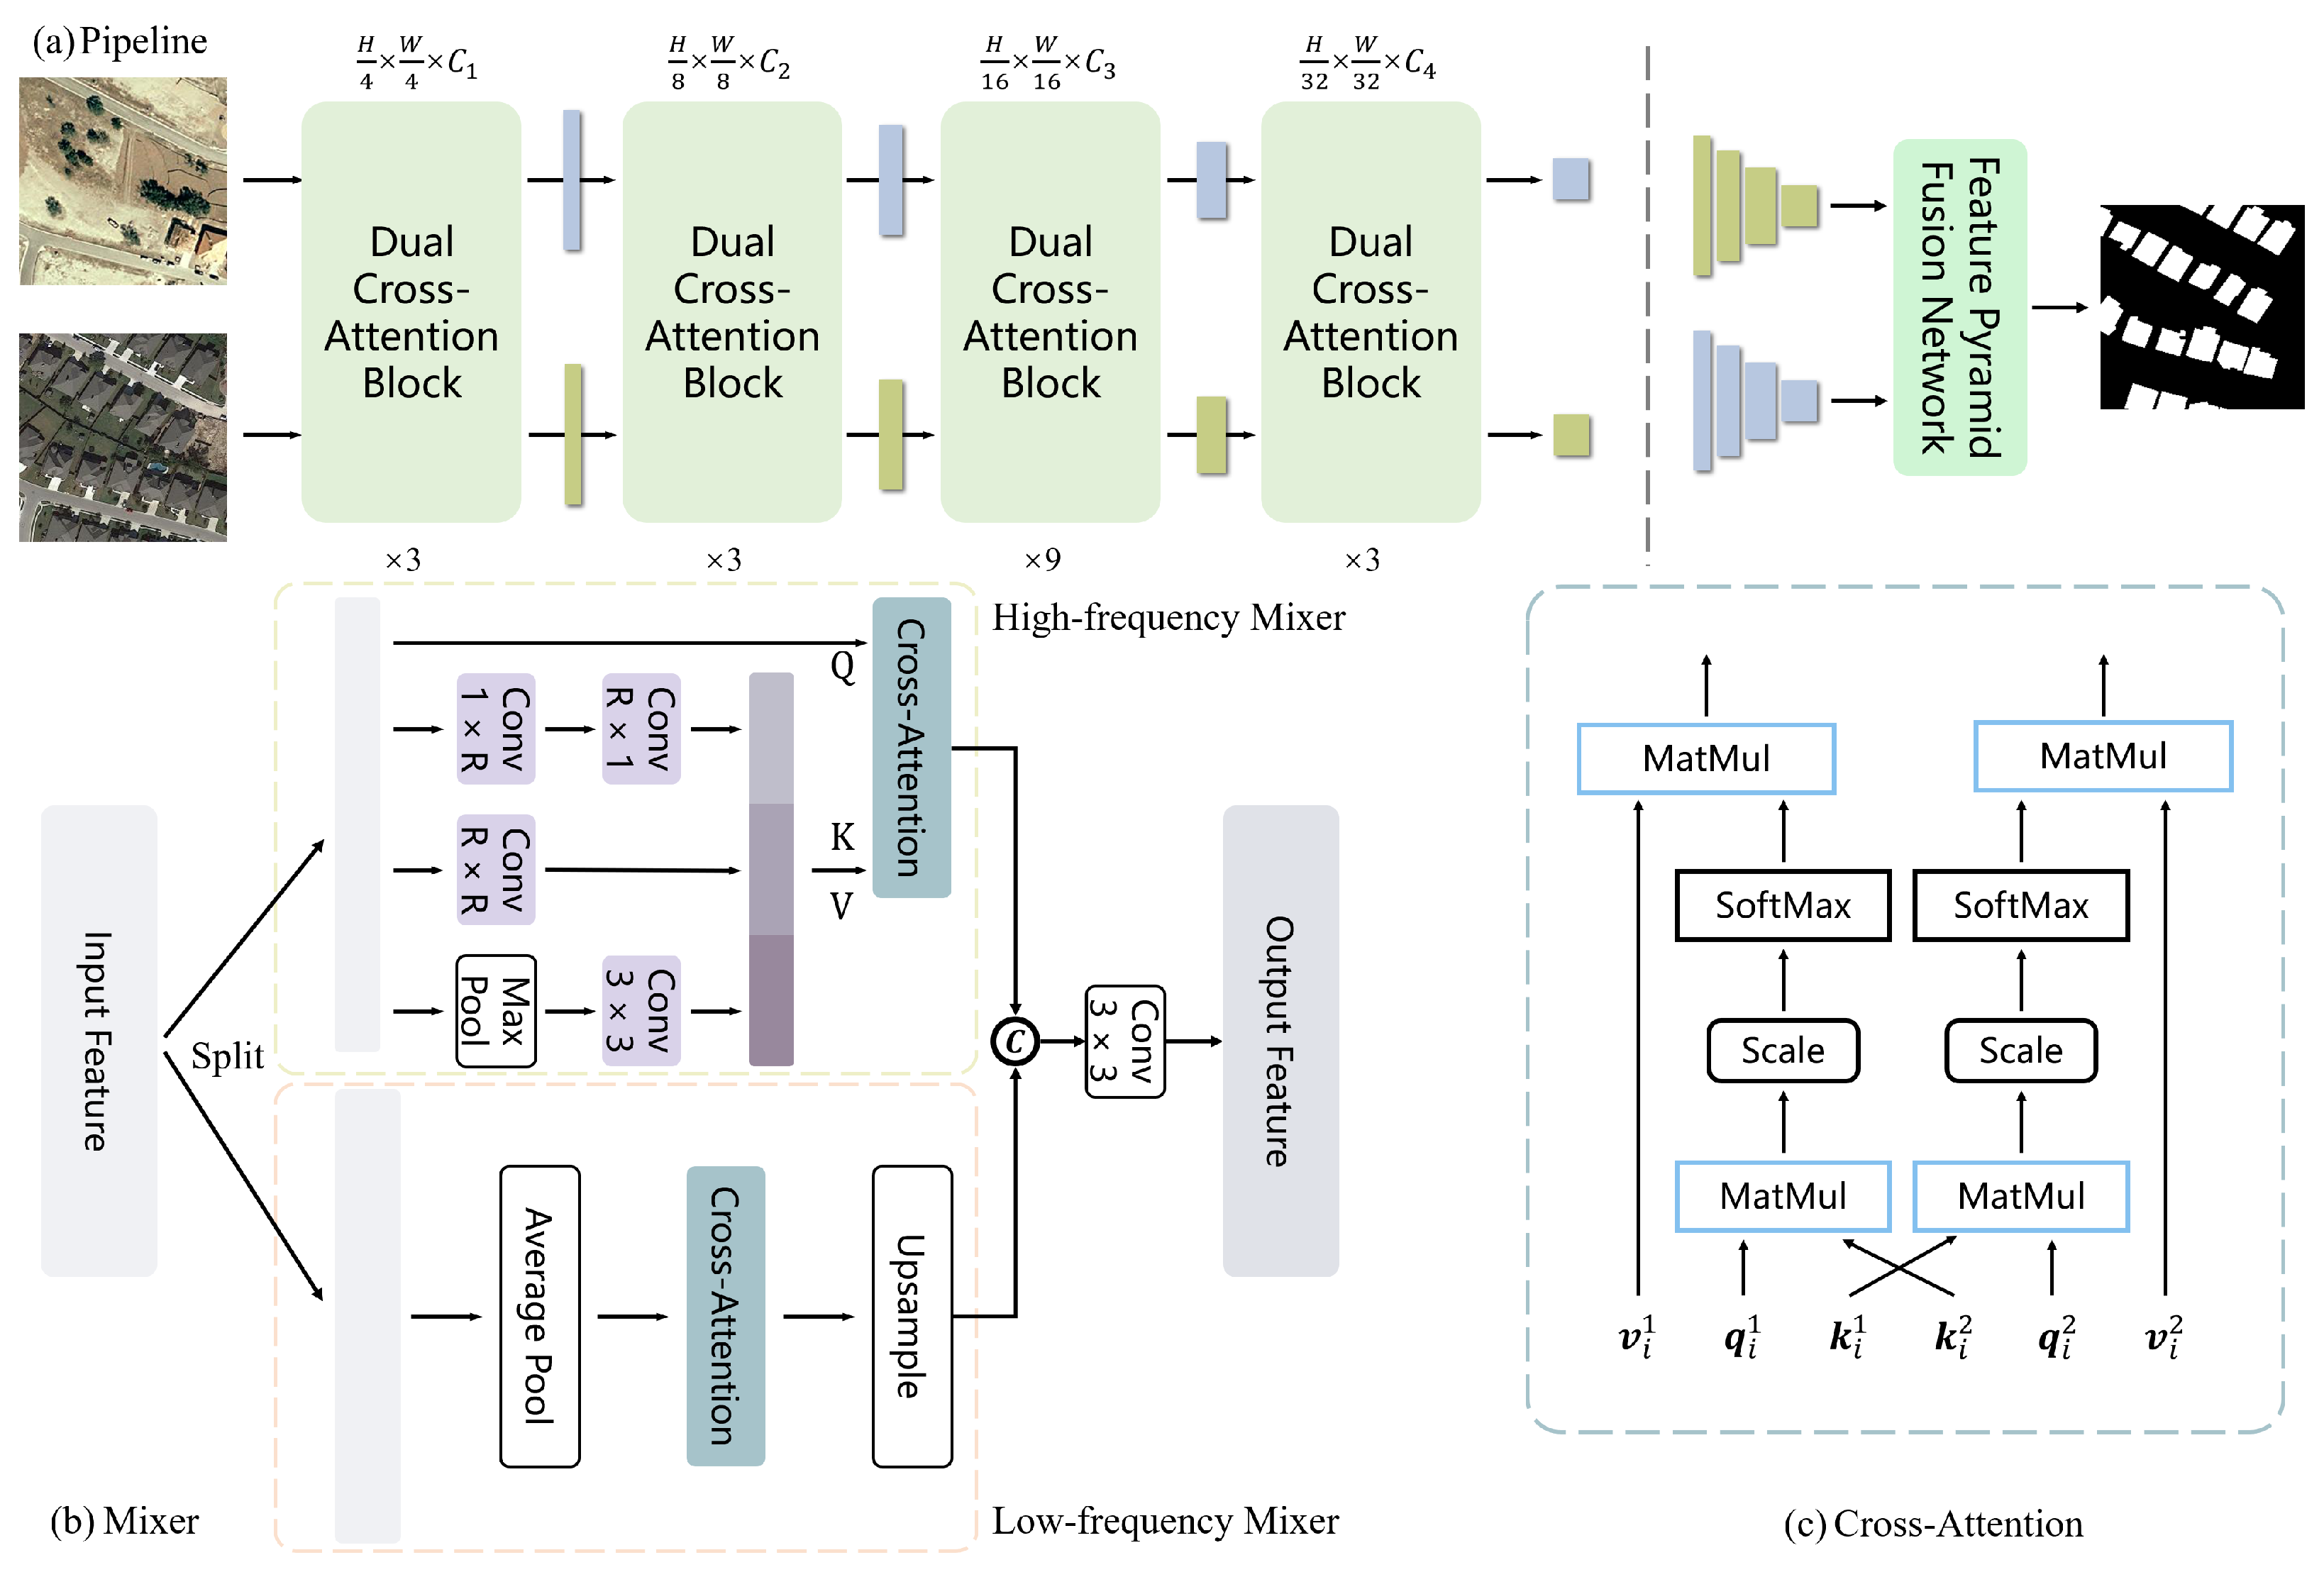
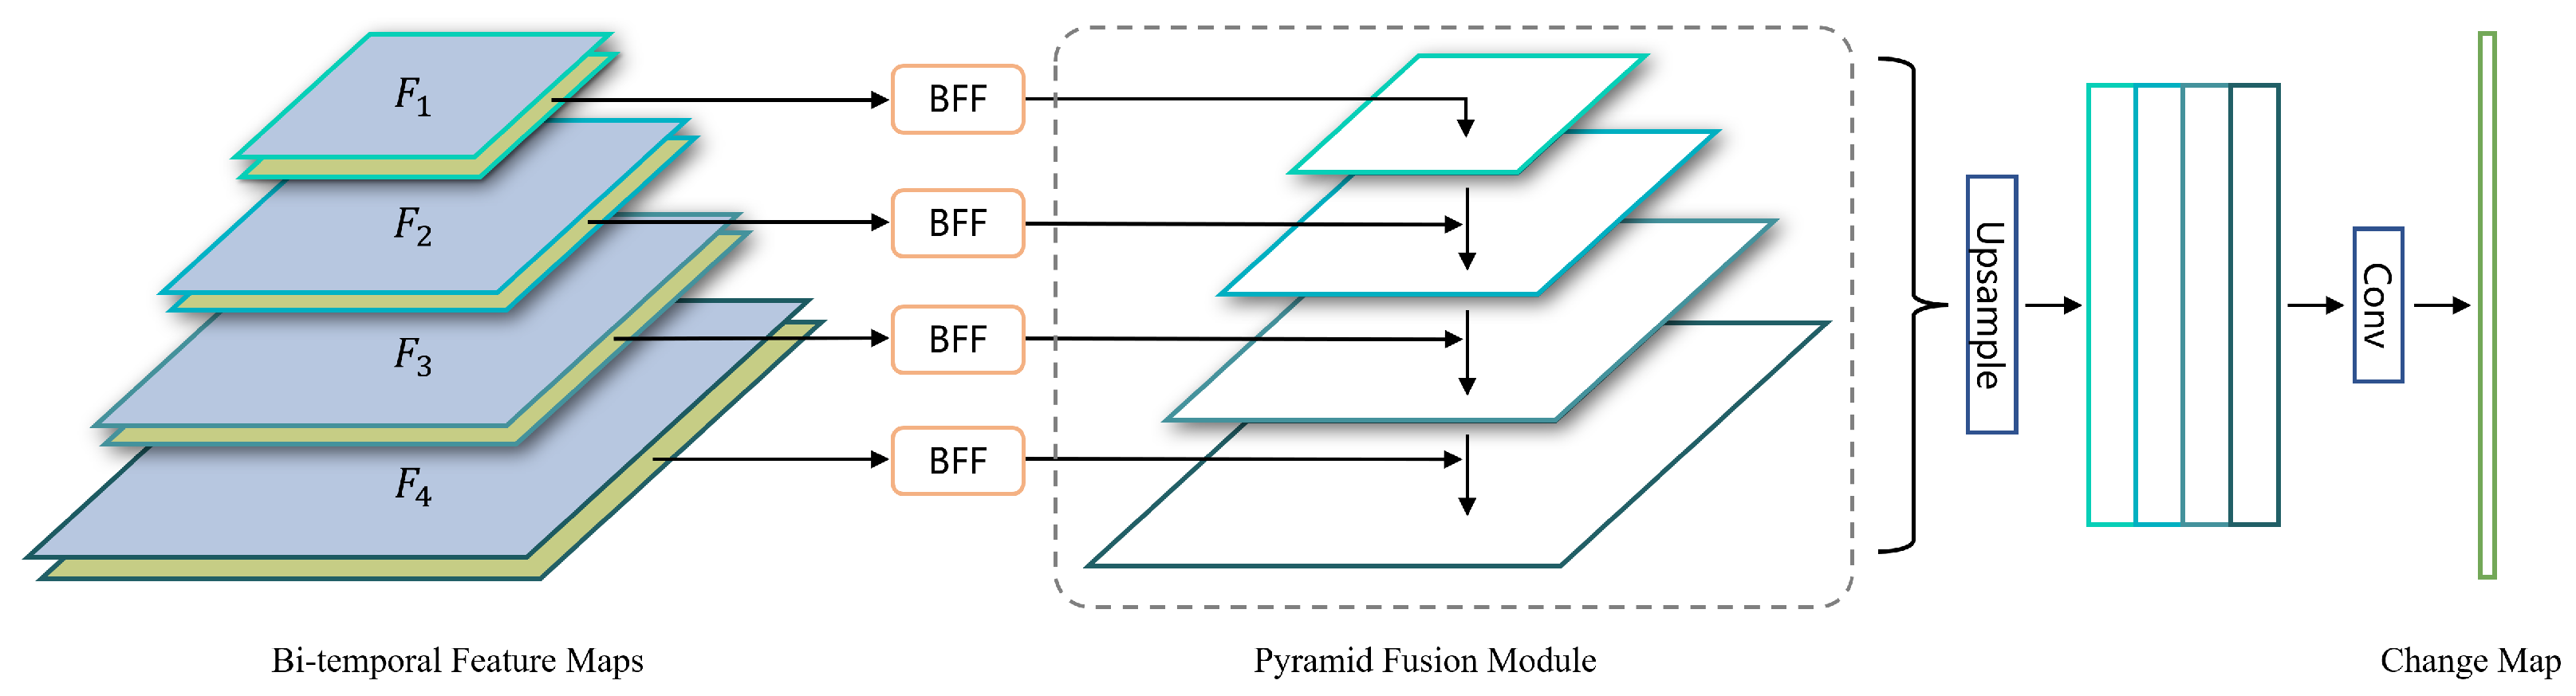
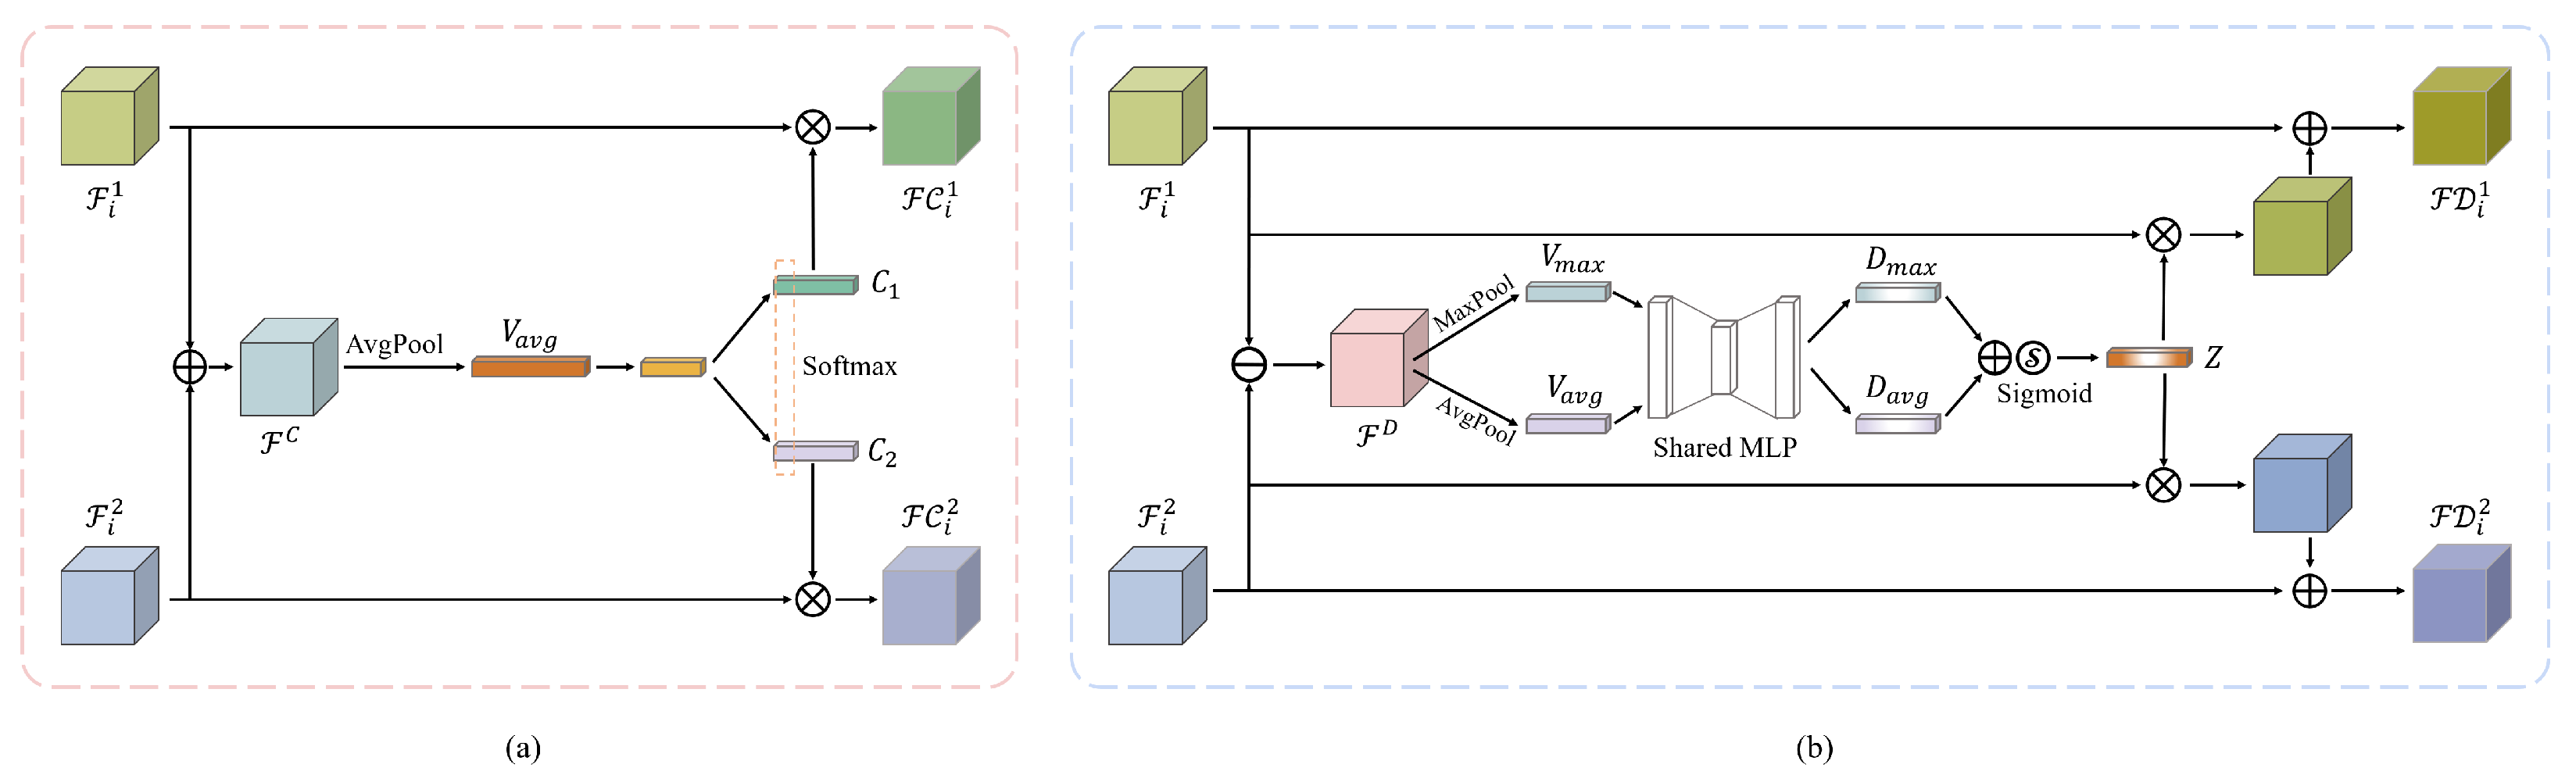
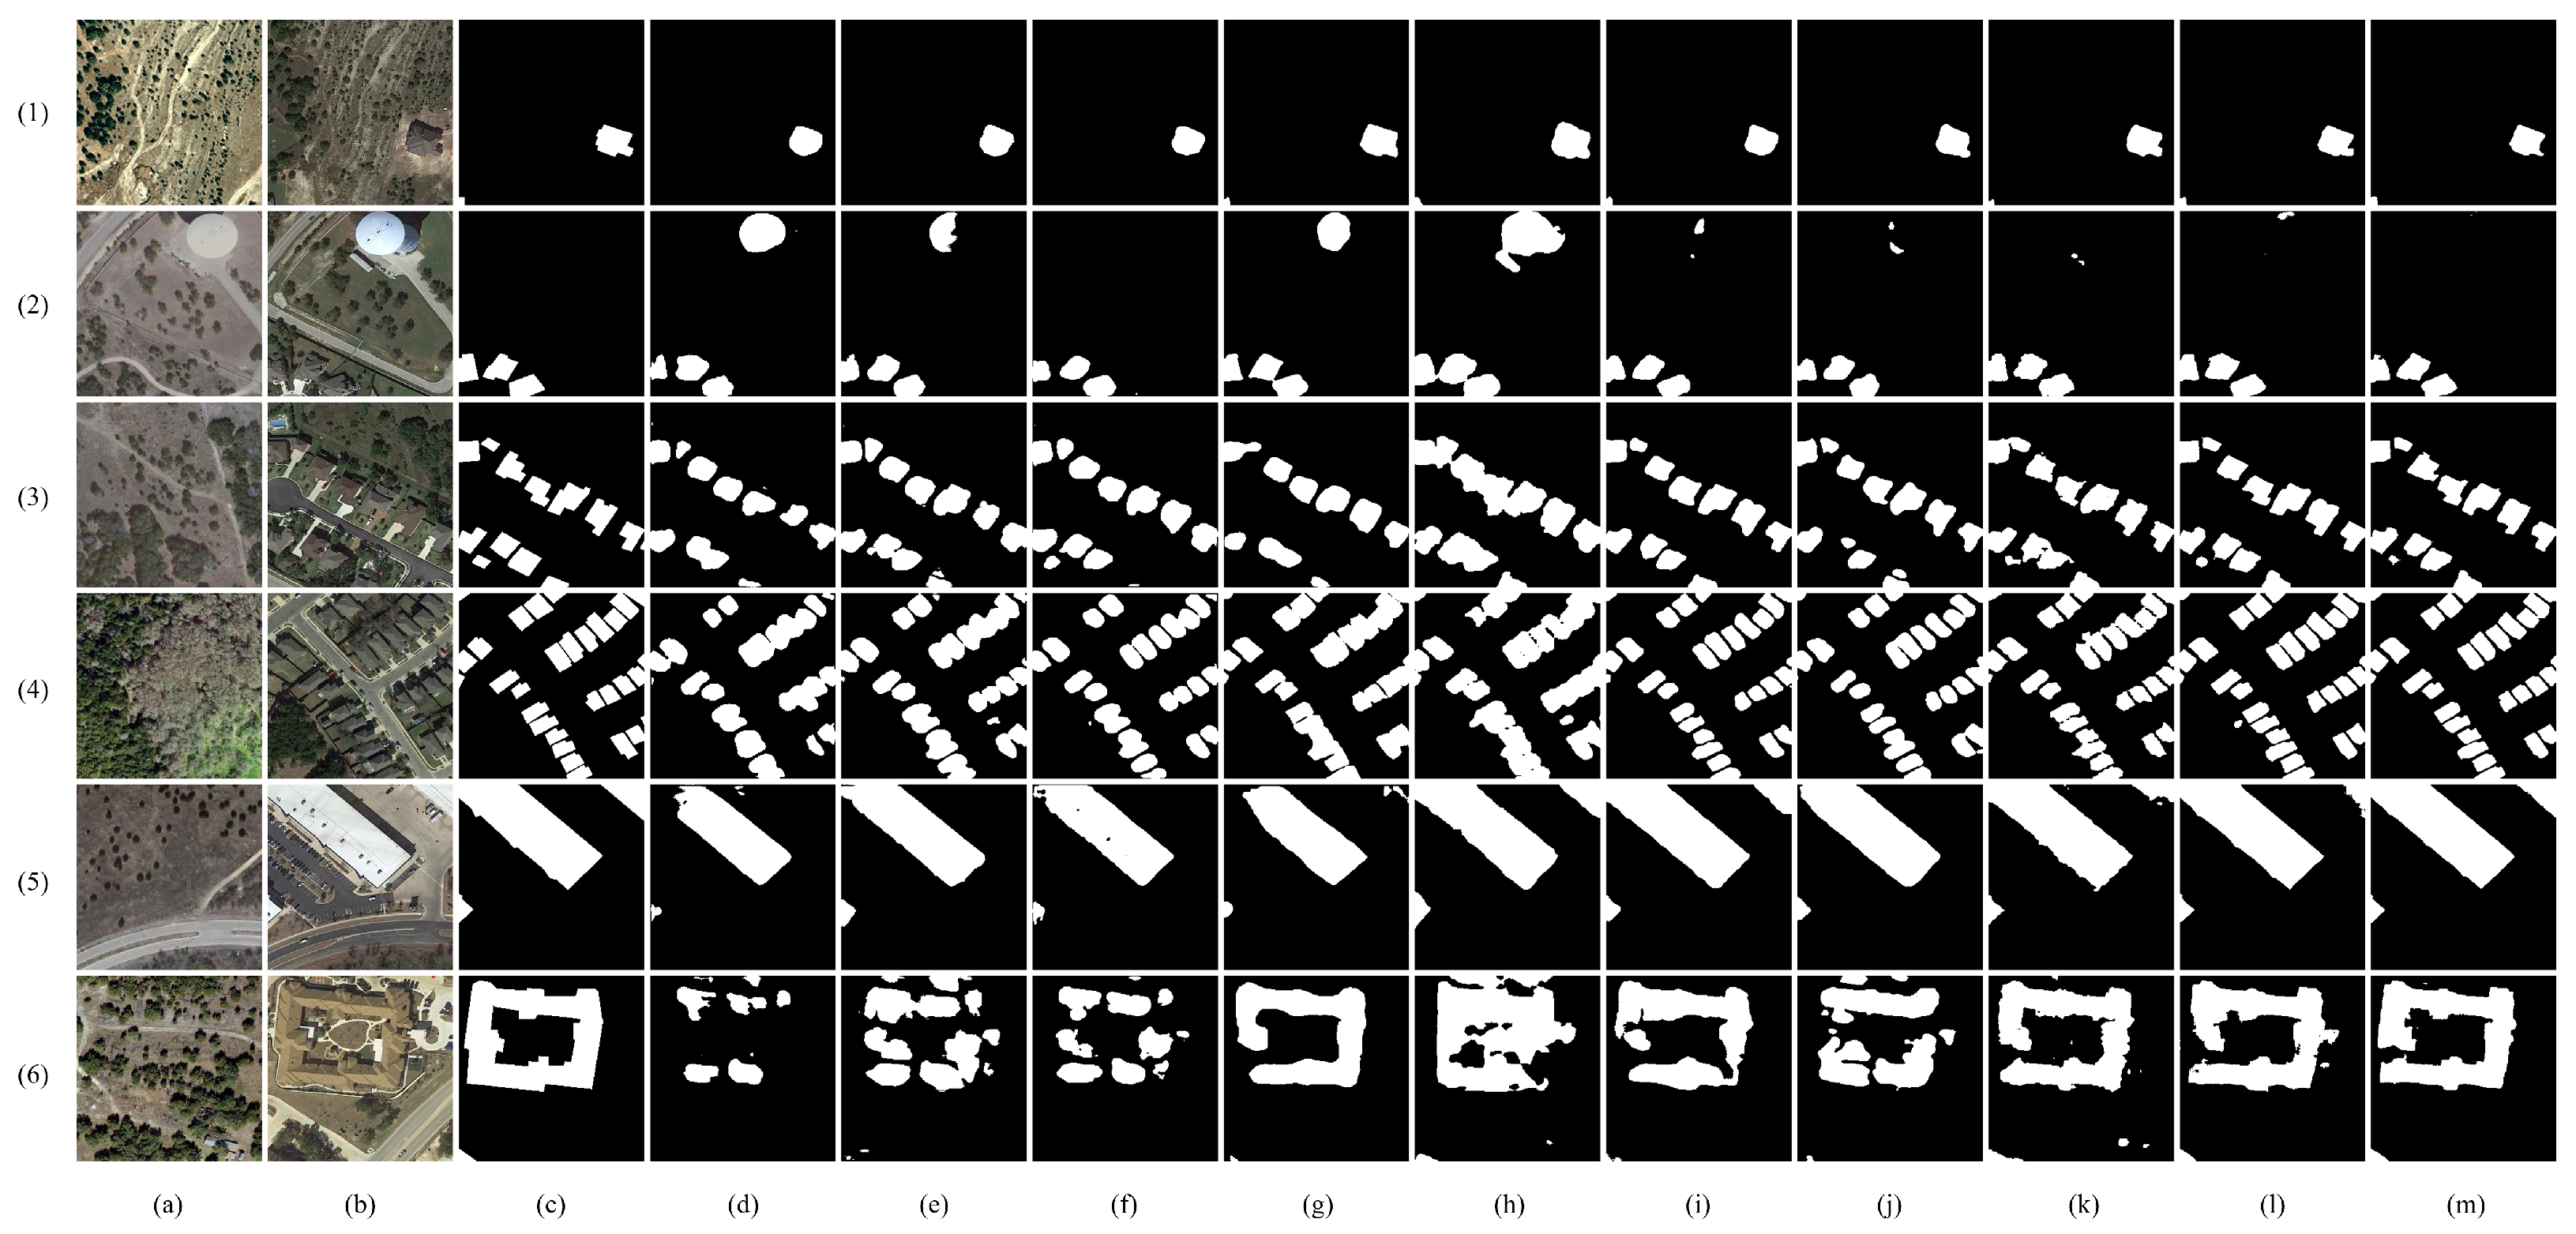
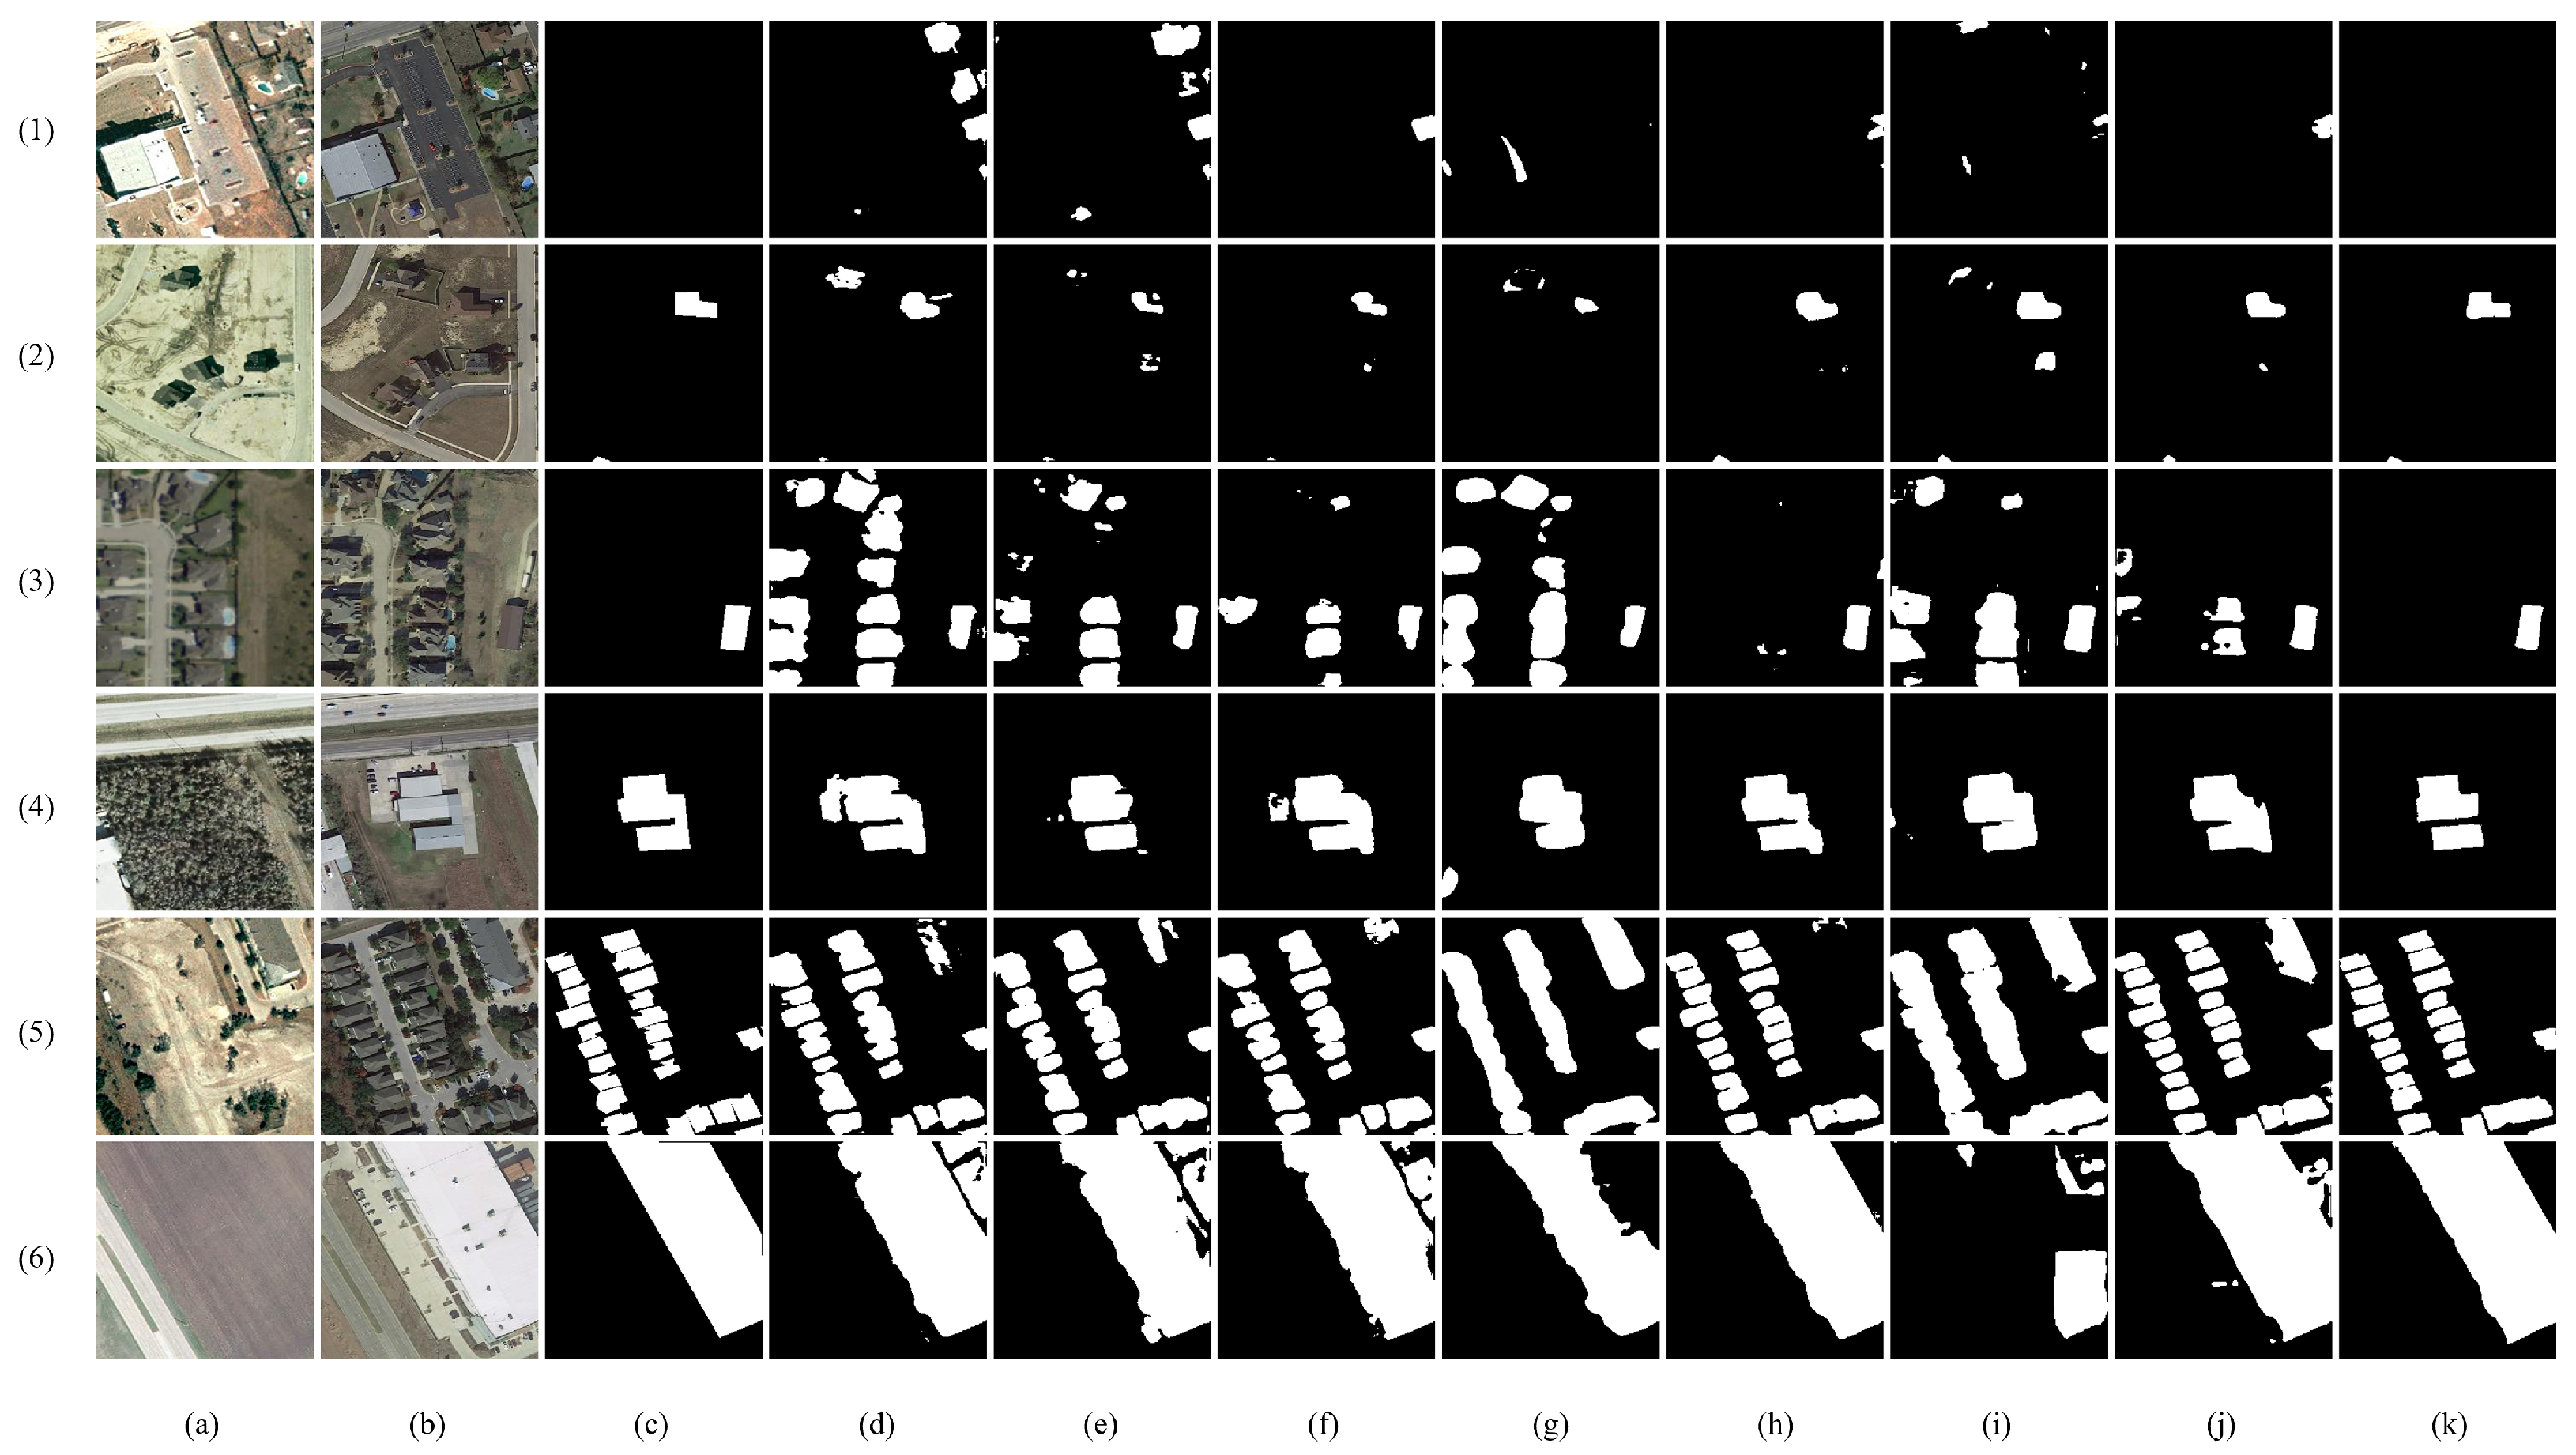
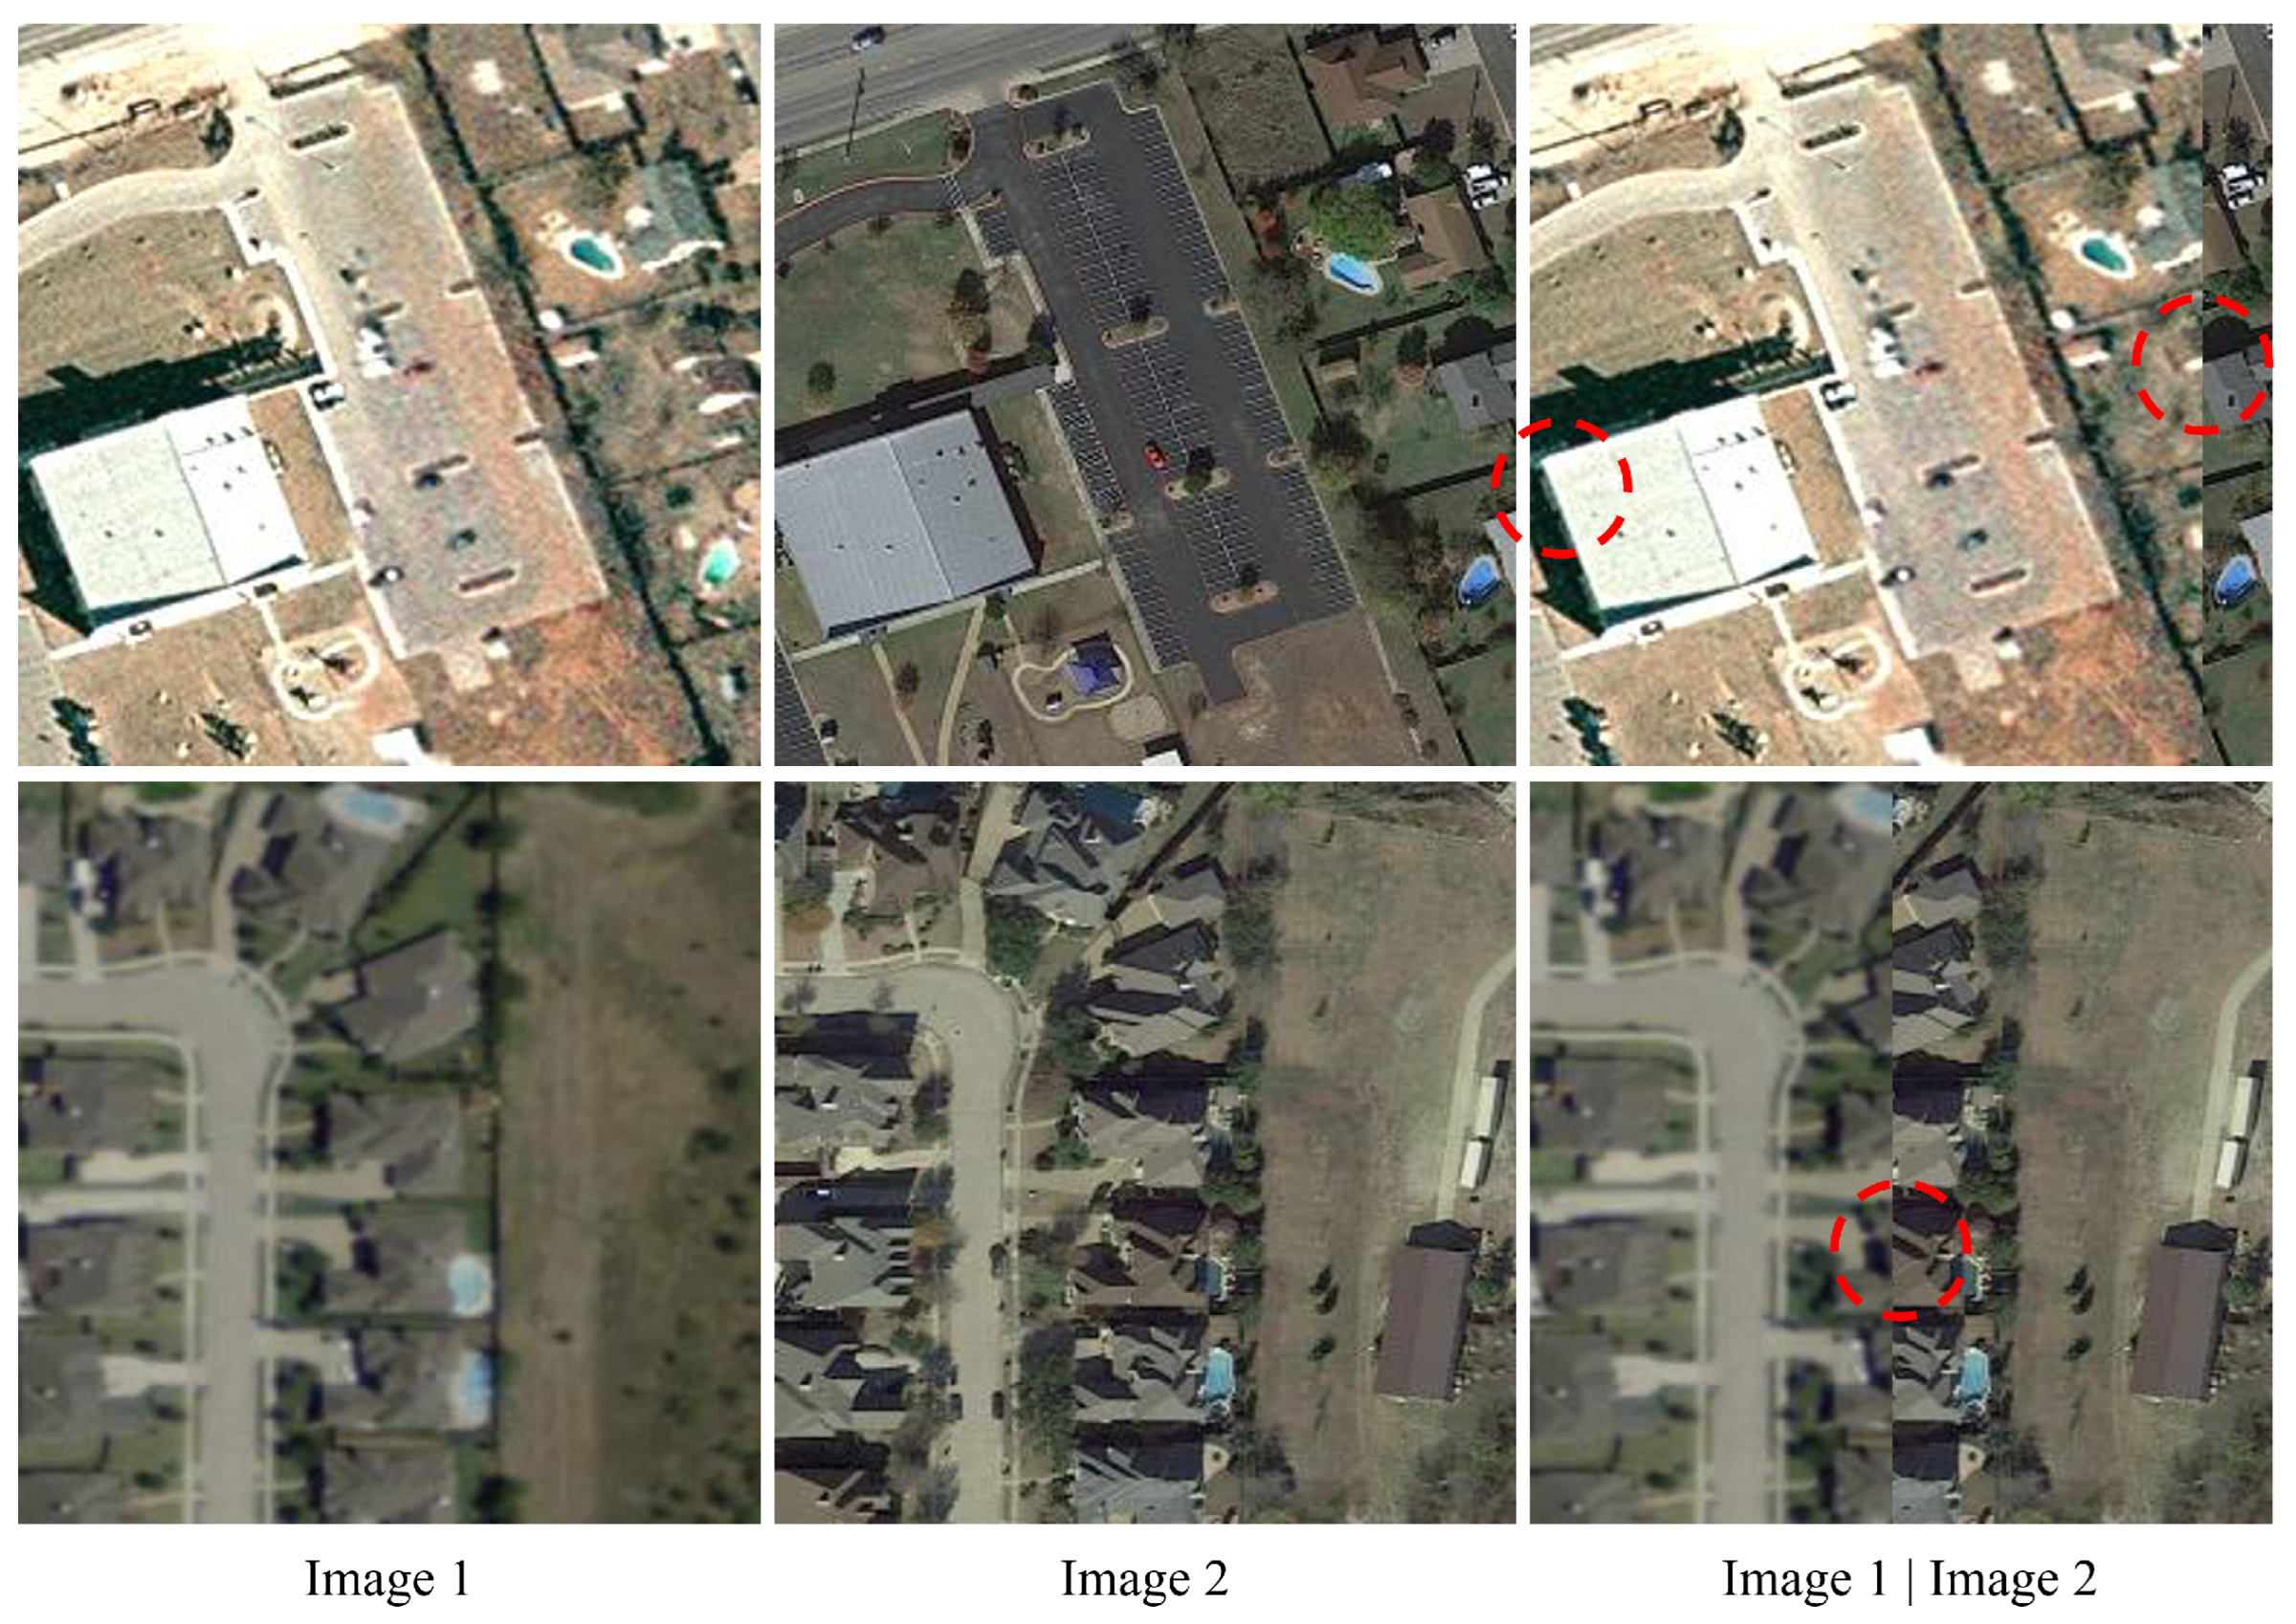
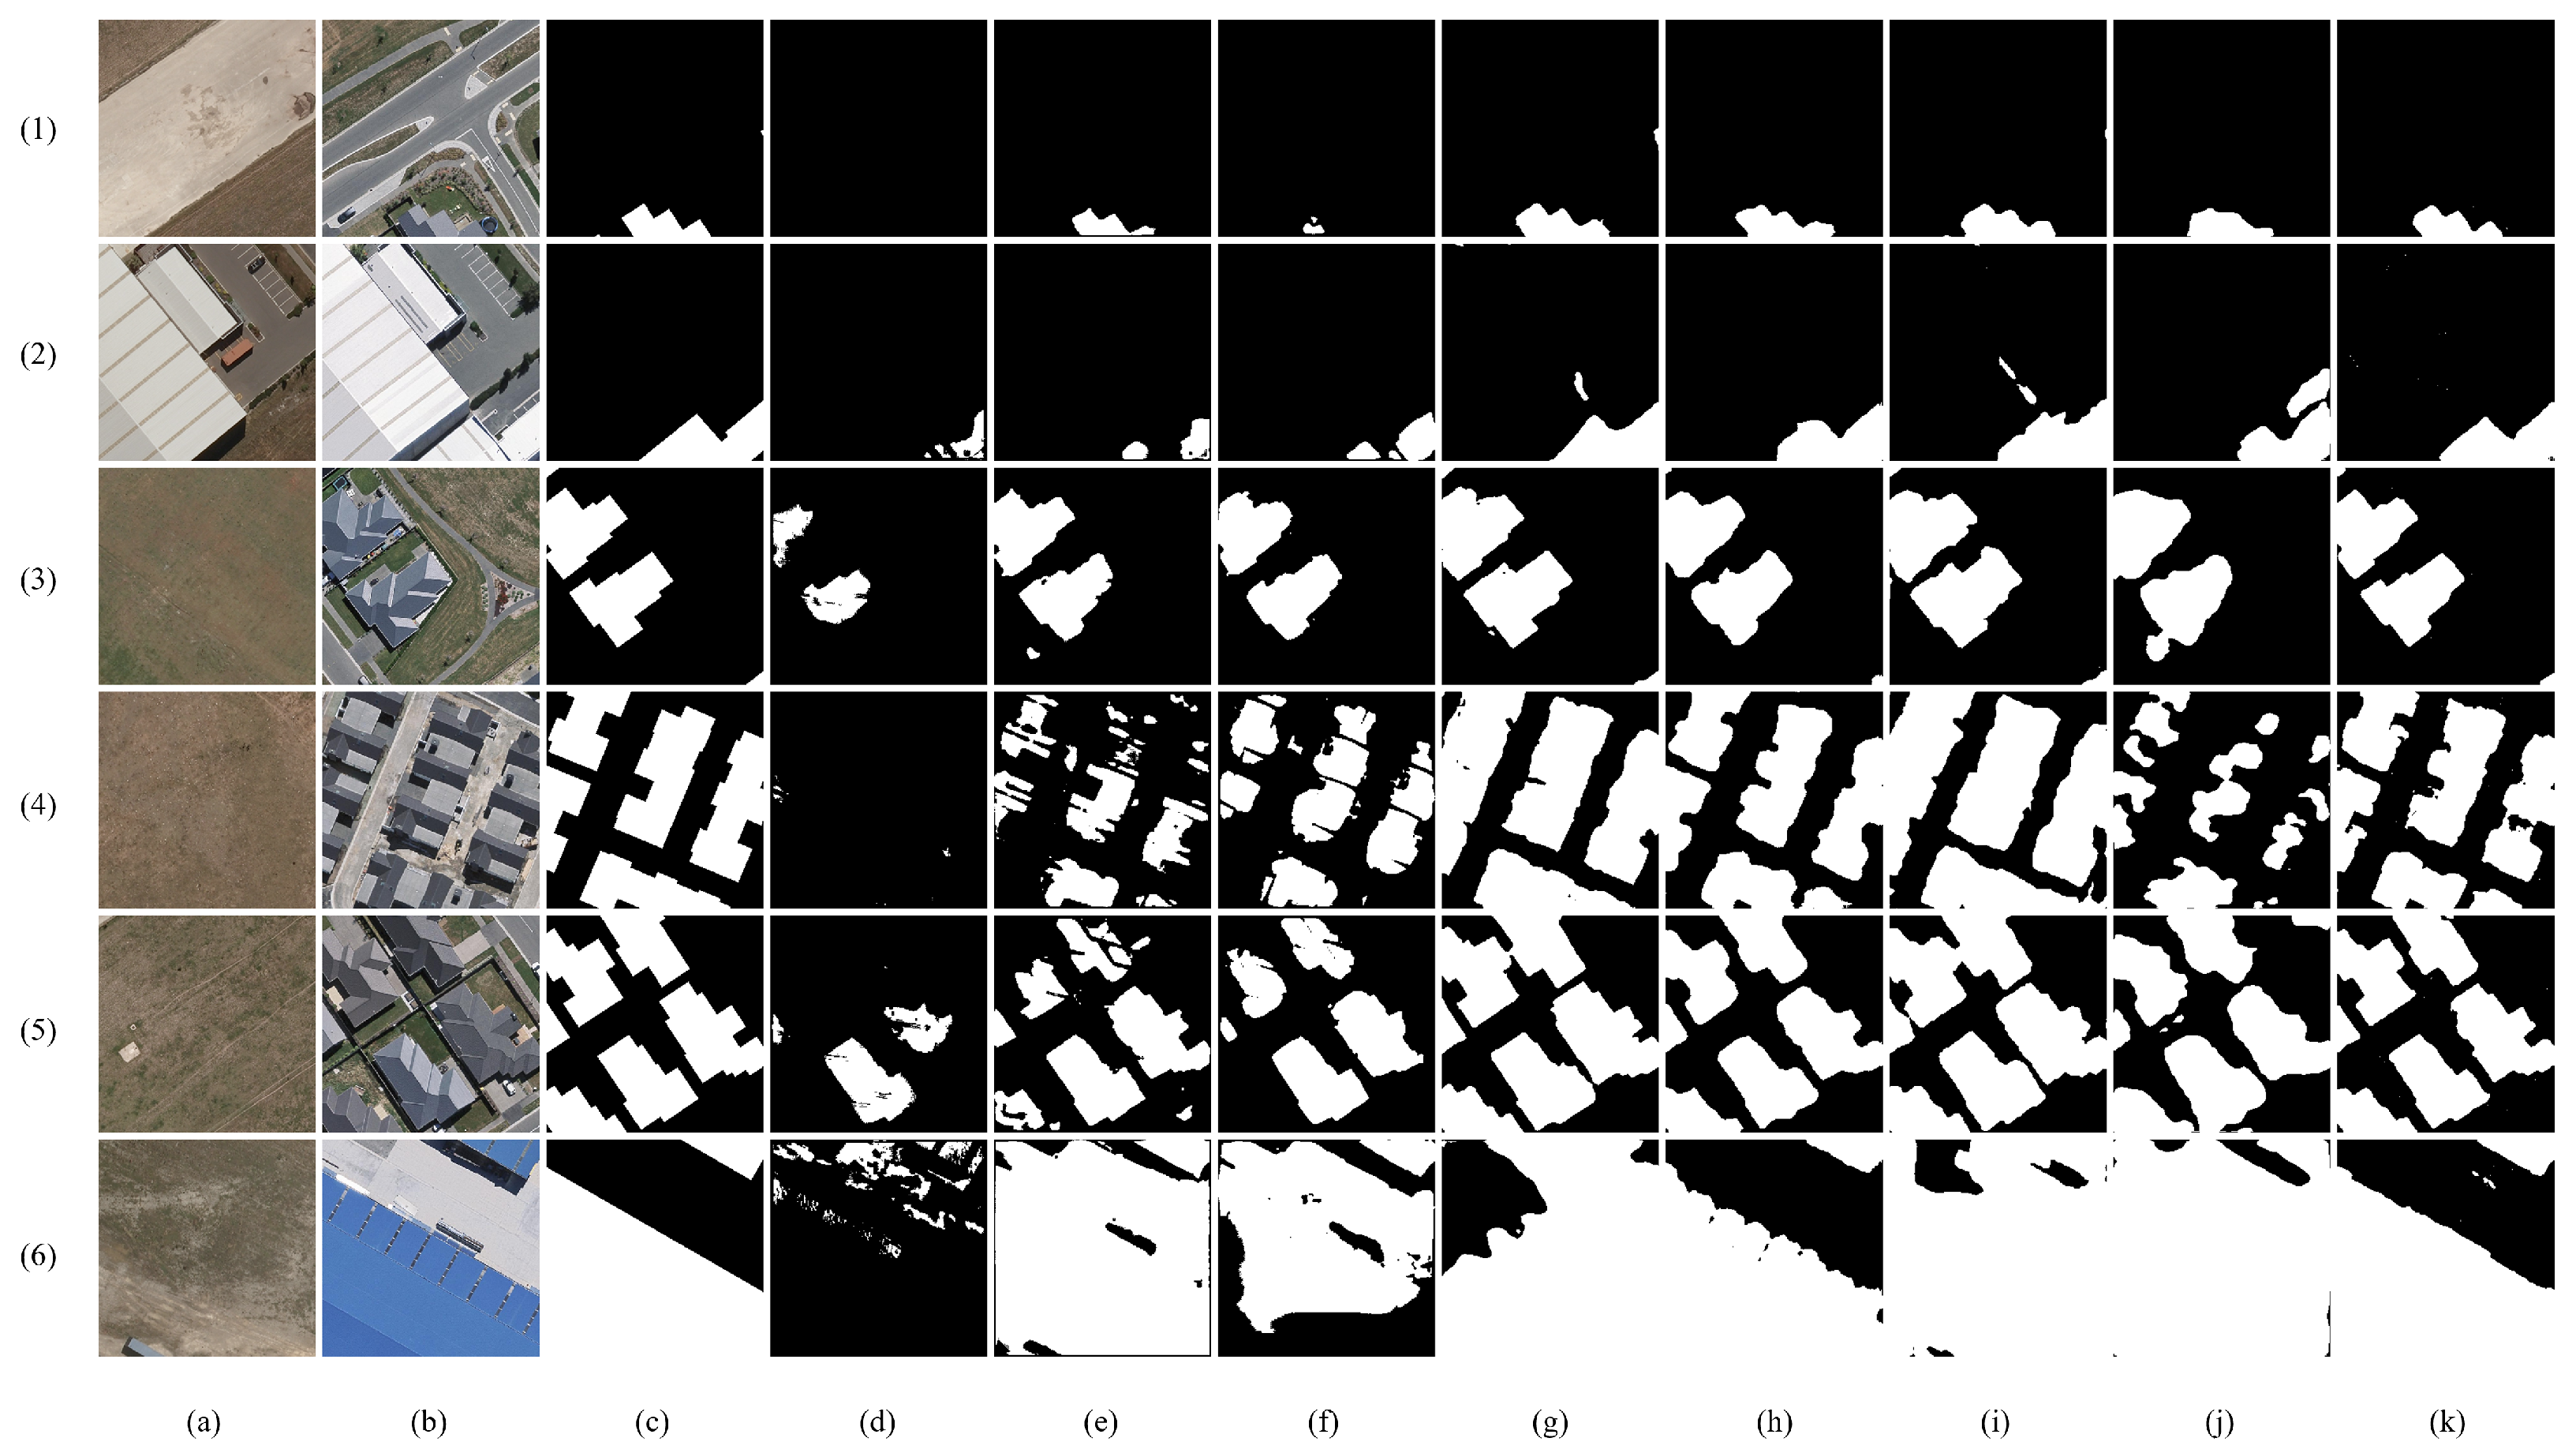
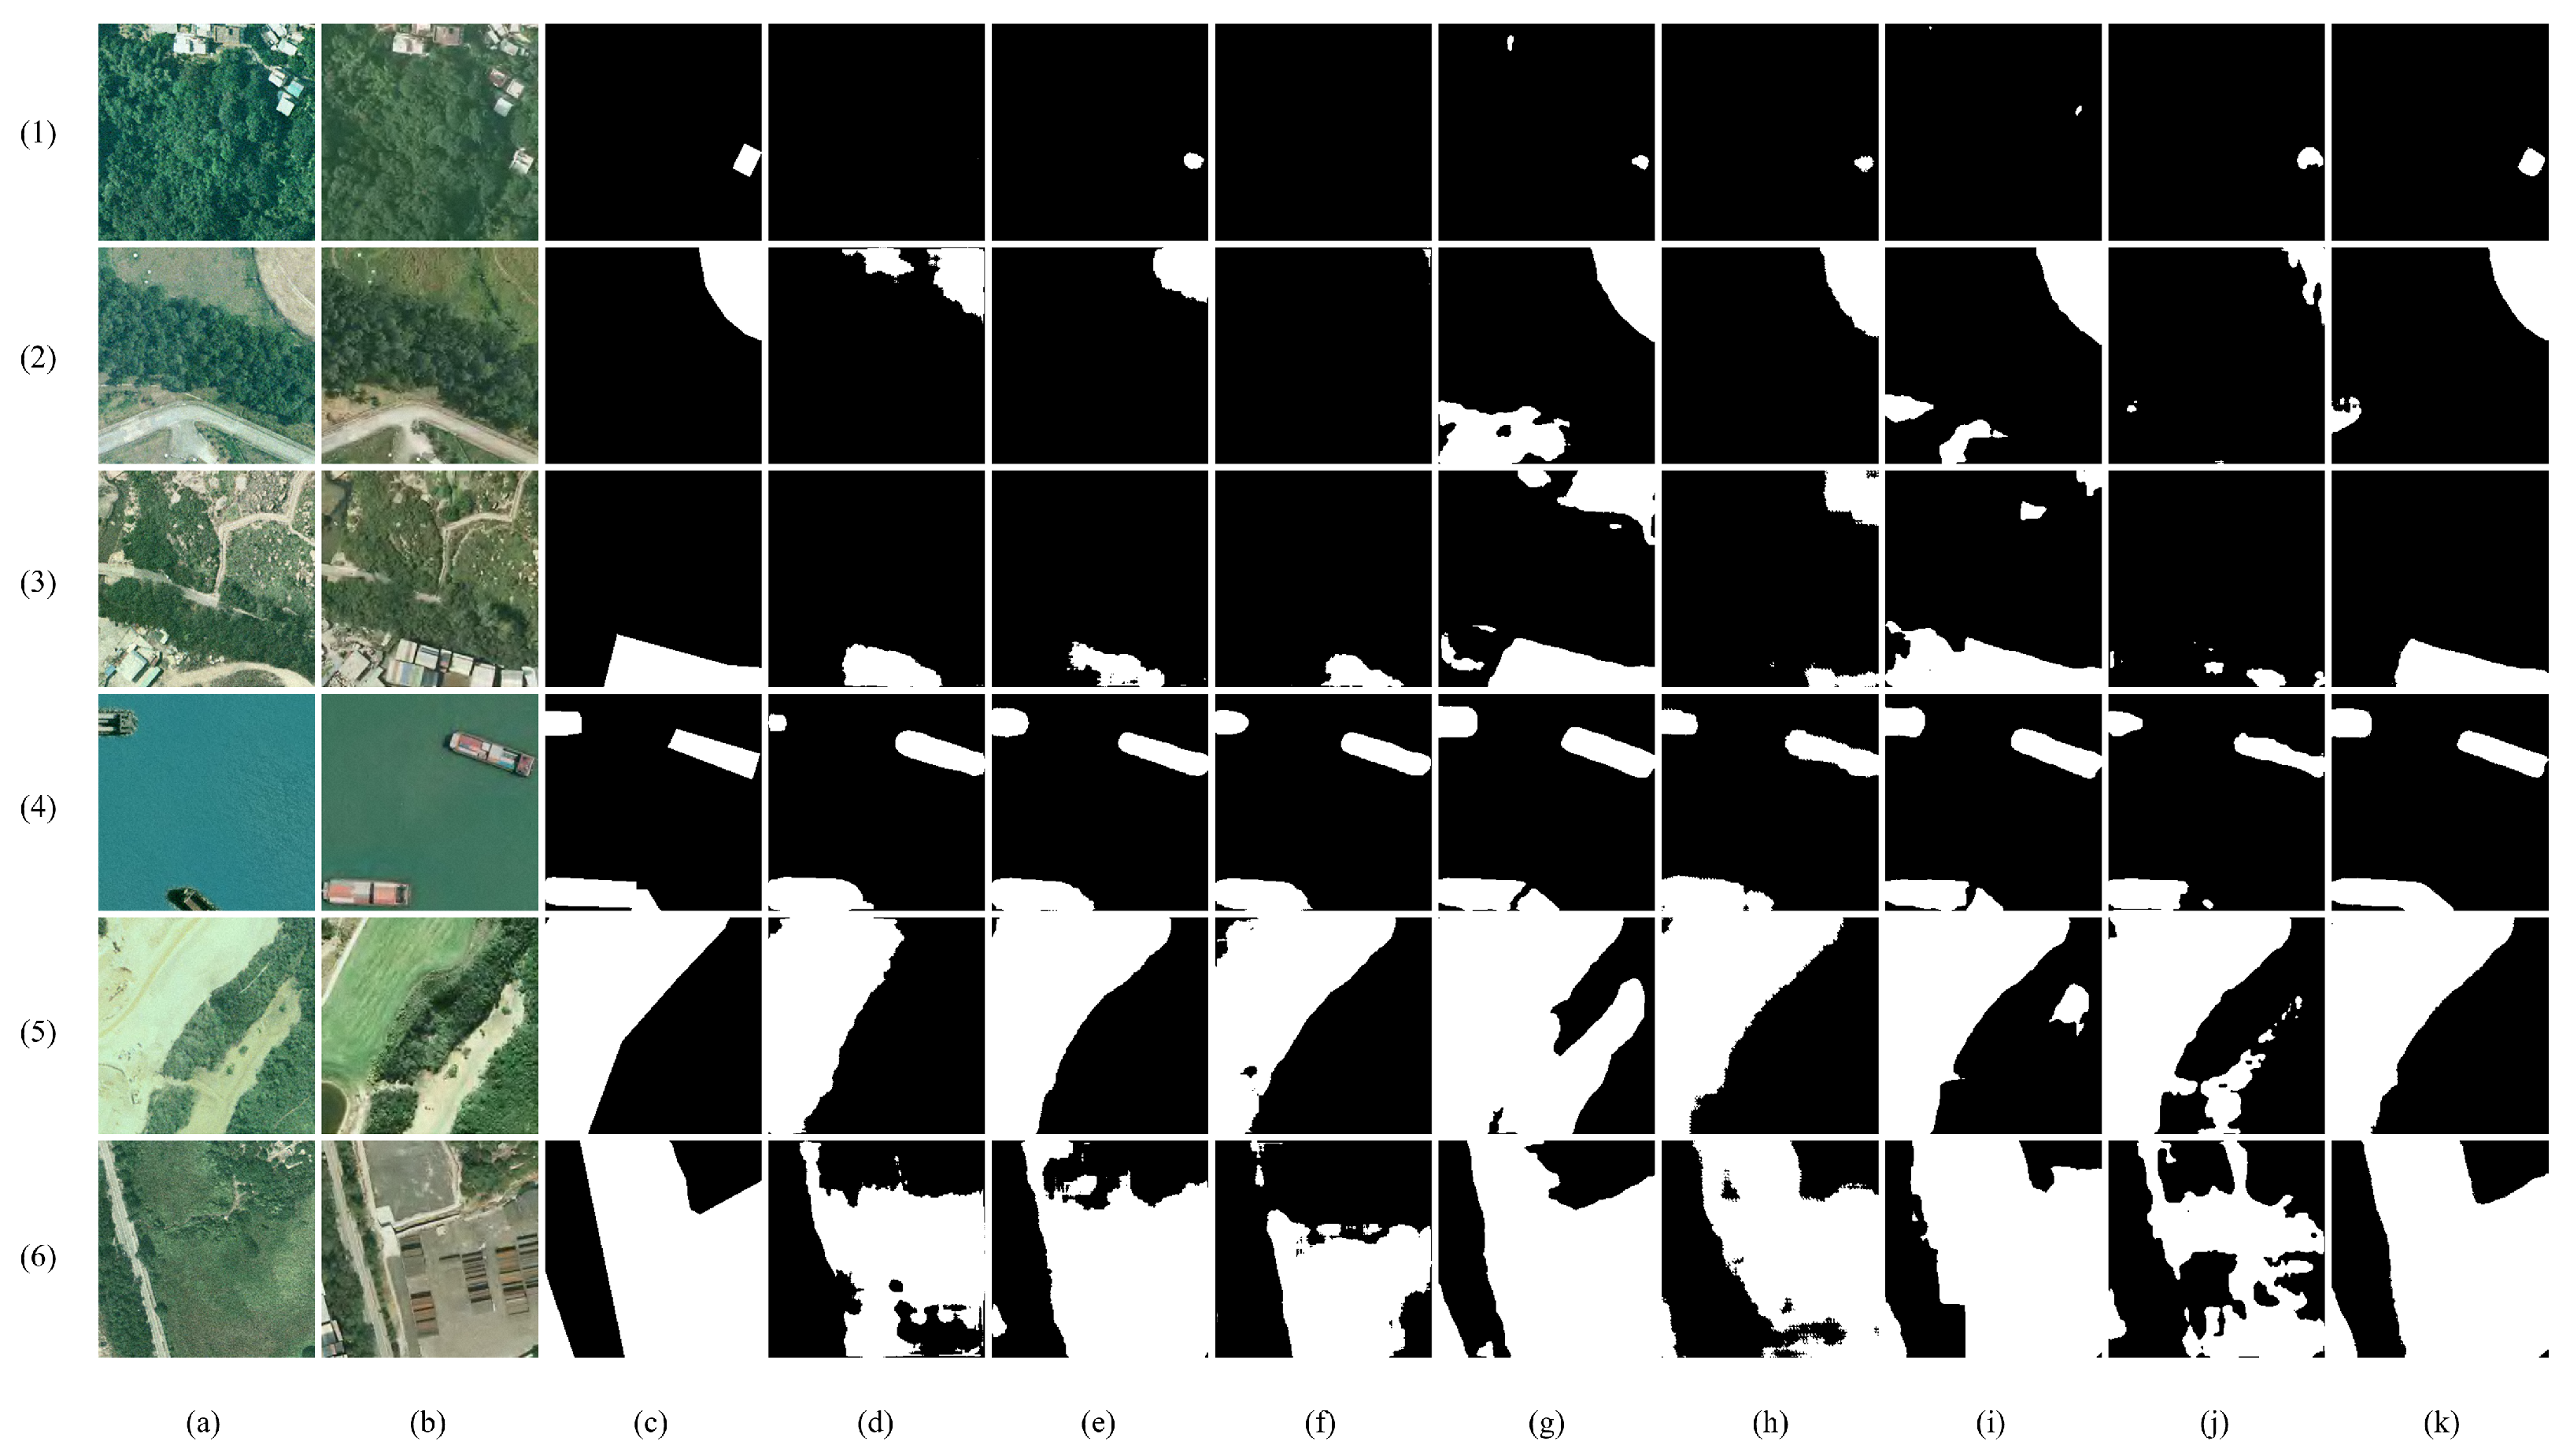
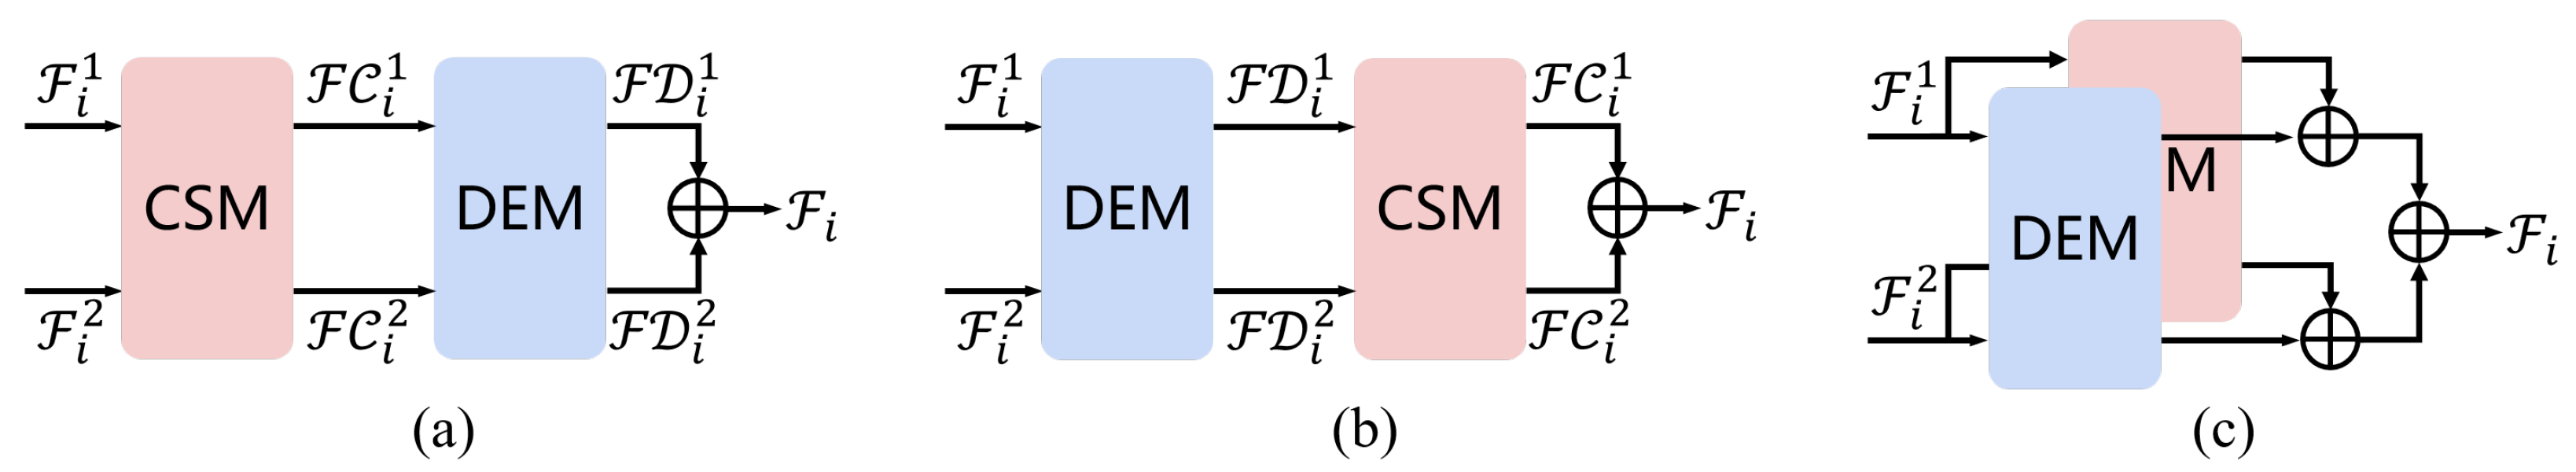
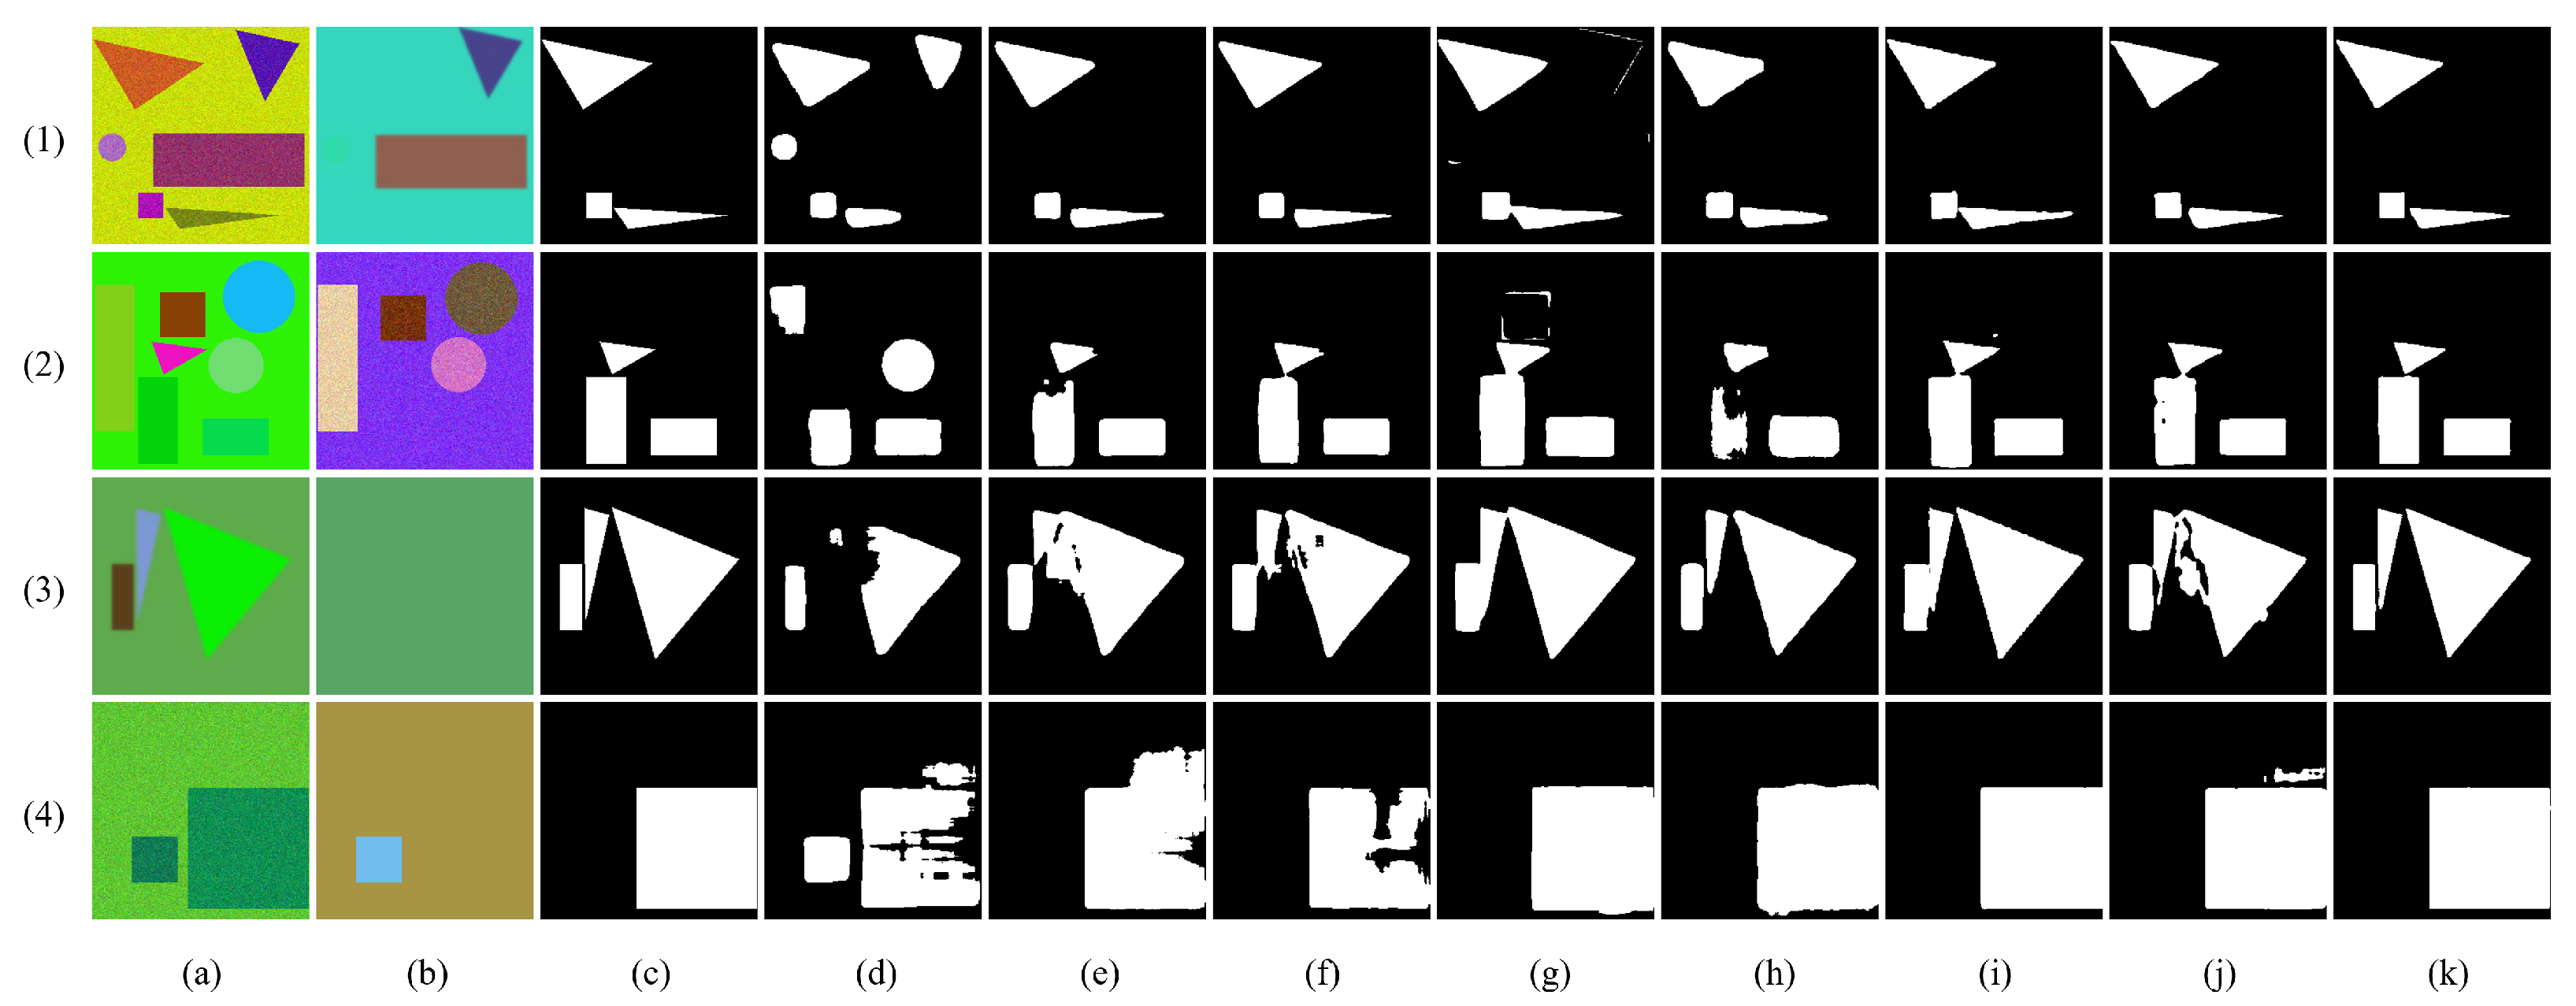
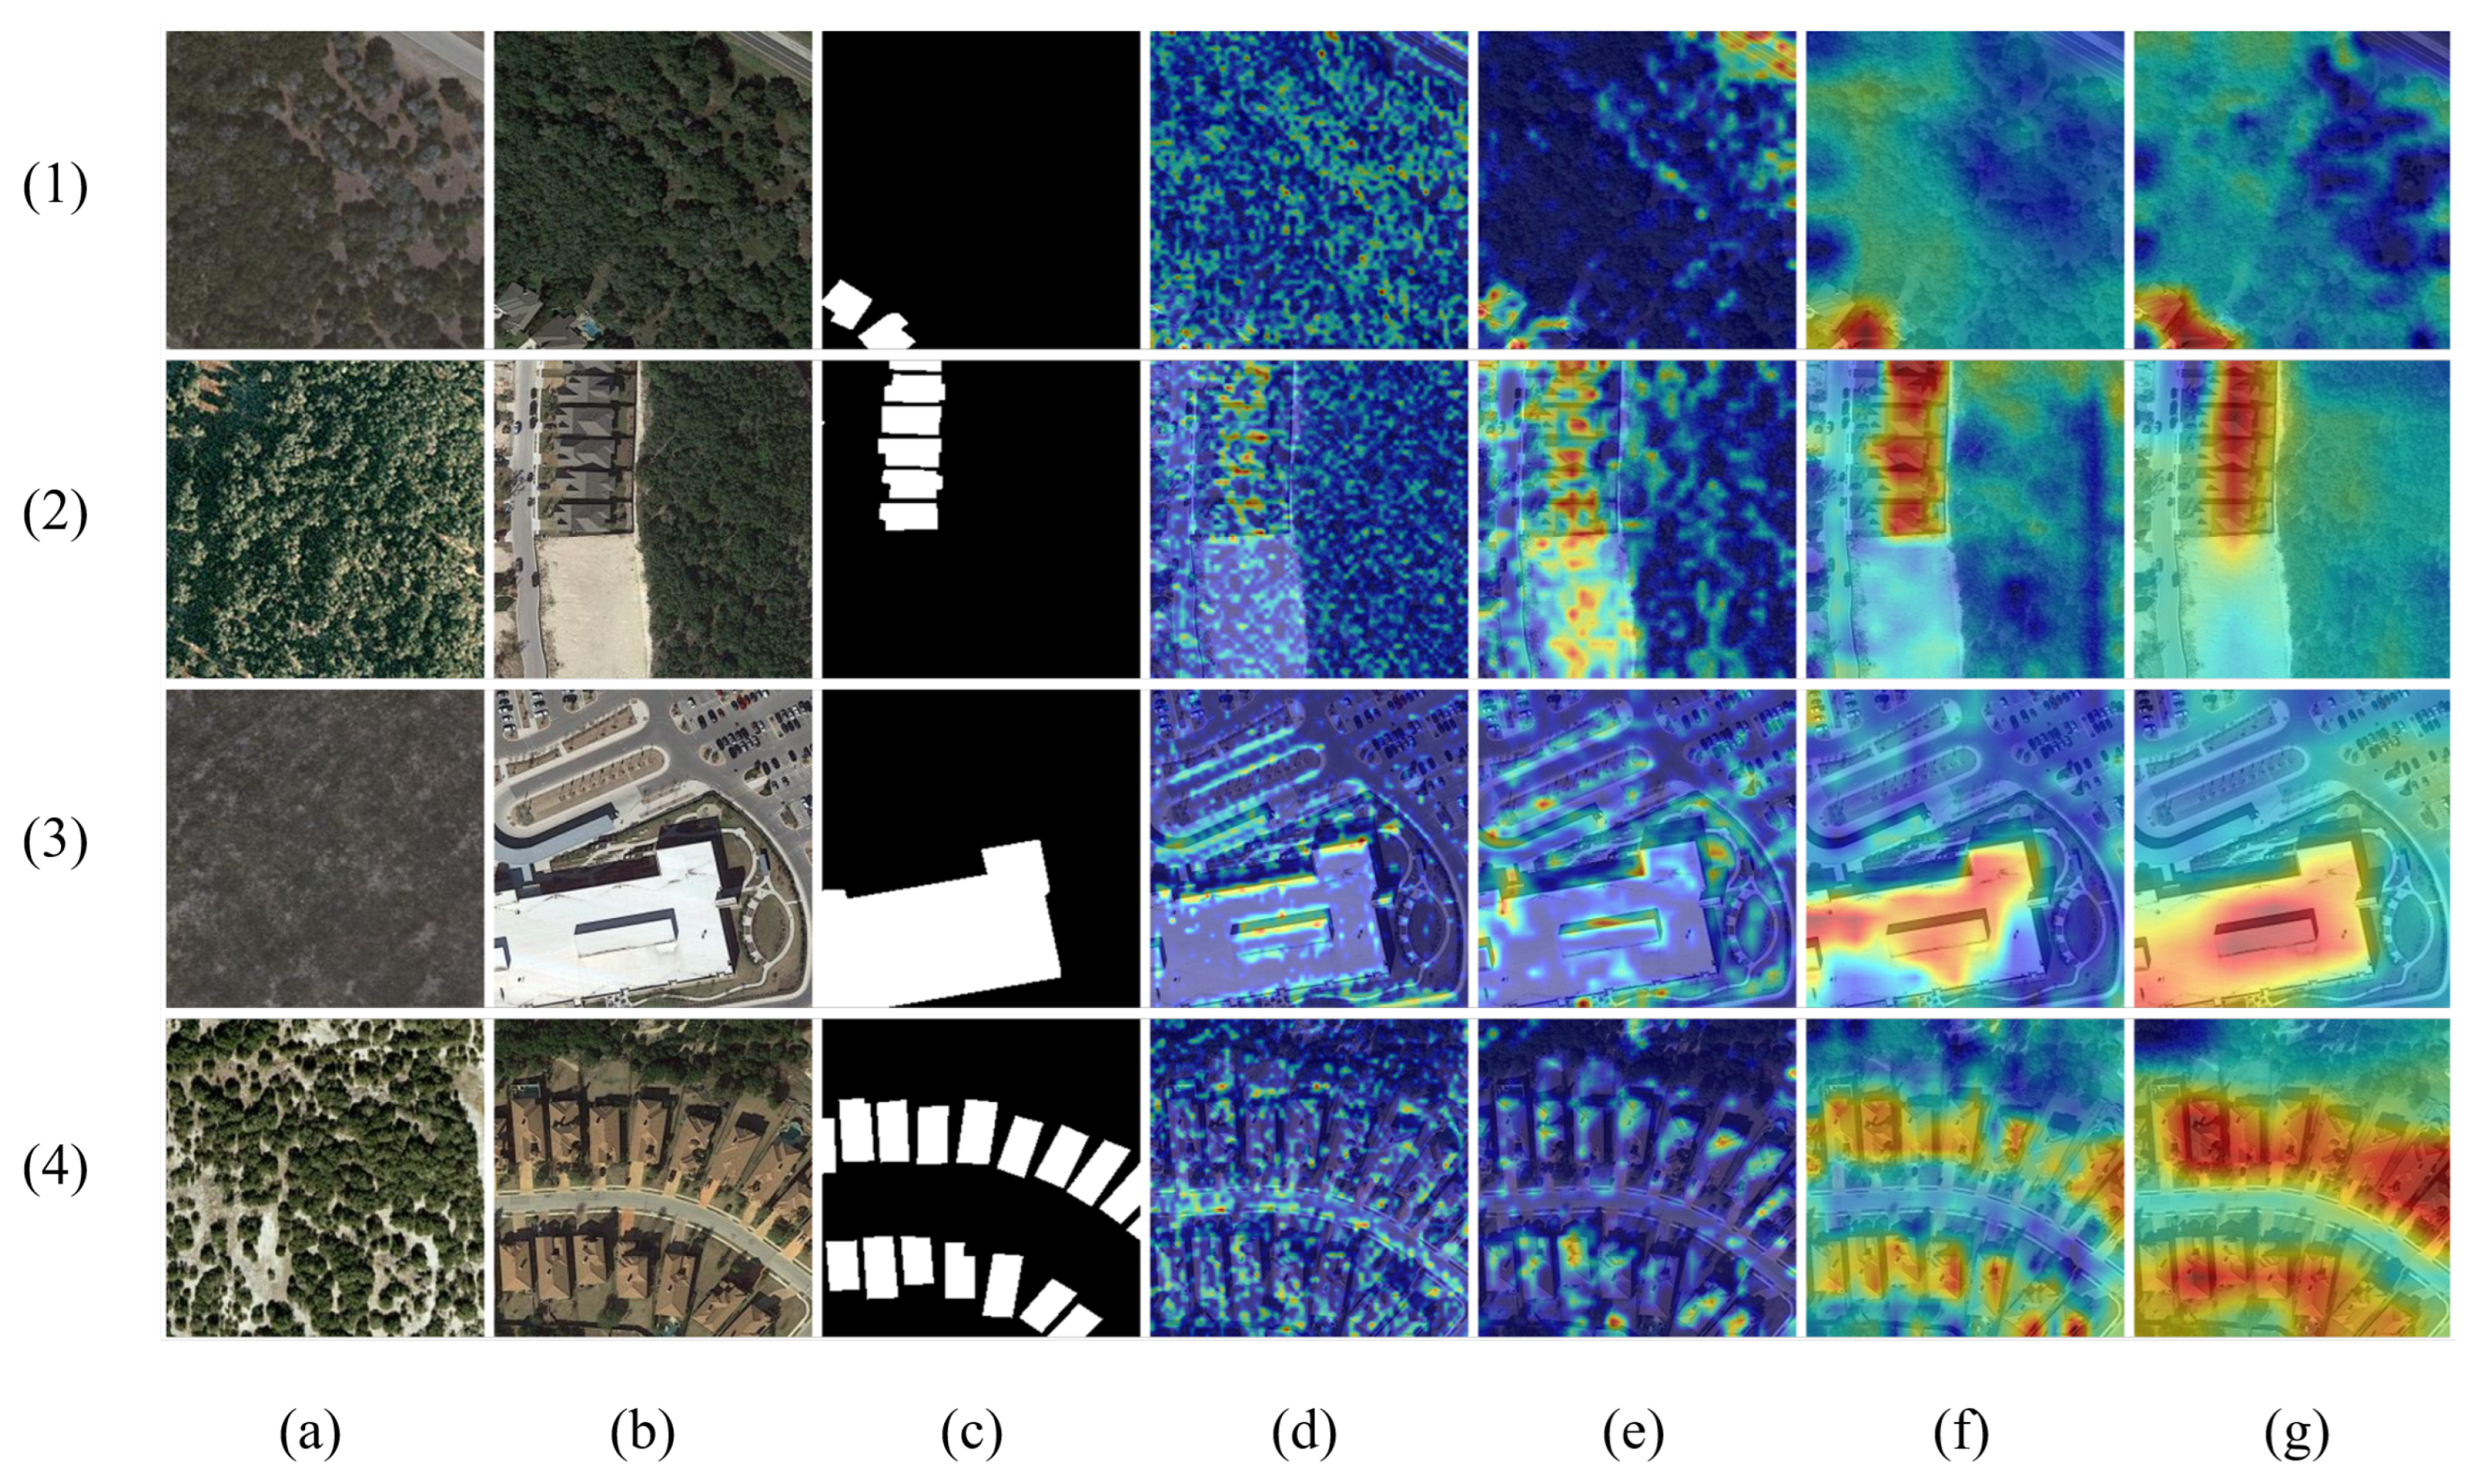
Table 1.
Description of change detection datesets.
| Dataset | Pairs | Image Size | Resolution (m/pixel) | Training Set | Validation Set | Test Set |
|---|---|---|---|---|---|---|
| LEVIR-CD | 637 | 1024 × 1024 | 0.3 | 7120 | 1024 | 2048 |
| LEVIR-CD+ | 985 | 1024 × 1024 | 0.5 | 10,192 | - | 5568 |
| WHU | 1 | 32,507 × 15,354 | 0.2 | 6096 | 762 | 762 |
| SYSU-CD | 20,000 | 256 × 256 | 0.5 | 12,000 | 4000 | 4000 |
Table 2.
Performance comparison on LEVIR-CD.
| Method | Precision | Recall | F1 | Params (M) | FLOPs (G) | FPS |
|---|---|---|---|---|---|---|
| FC-EF | 86.91 | 80.17 | 83.40 | 1.4 | 3.6 | 57.9 |
| FC-Siam-Conc | 89.53 | 83.31 | 86.31 | 1.6 | 5.3 | 59.2 |
| FC-Siam-Diff | 91.99 | 76.77 | 83.69 | 1.4 | 4.7 | 62.8 |
| DTCDSCN | 88.53 | 86.83 | 87.67 | 31.3 | 13.2 | 57.6 |
| BIT | 89.24 | 89.37 | 89.31 | 3.6 | 4.4 | 55.0 |
| DSAMNet | 84.27 | 87.79 | 86.00 | 17.0 | 75.4 | 29.5 |
| STANet | 83.81 | 91.00 | 87.26 | 13.2 | 16.9 | 4.7 |
| TransUNetCD | 92.43 | 89.82 | 91.11 | 95.5 | 27.2 | - |
| ChangeStar | - | - | 91.25 | 52.6 | 39.5 | - |
| DCAT | 92.84 | 90.00 | 91.40 | 23.3 | 24.6 | 49.2 |
Table 3.
Performance comparison on LEVIR-CD+.
| Method | Precision | Recall | F1 | Params (M) | FLOPs (G) | FPS |
|---|---|---|---|---|---|---|
| FC-EF | 61.30 | 72.61 | 66.48 | 1.4 | 3.6 | 57.9 |
| FC-Siam-Conc | 66.24 | 81.22 | 72.97 | 1.6 | 5.3 | 59.2 |
| FC-Siam-Diff | 74.97 | 72.04 | 73.48 | 1.4 | 4.7 | 62.8 |
| DTCDSCN | 80.36 | 75.03 | 77.60 | 31.3 | 13.2 | 57.6 |
| BIT | 82.74 | 82.85 | 82.80 | 3.6 | 4.4 | 55.0 |
| DSAMNet | 69.76 | 80.31 | 74.66 | 17.0 | 75.4 | 29.5 |
| STANet | 74.62 | 84.54 | 79.31 | 13.2 | 16.9 | 4.7 |
| DCAT | 84.72 | 83.34 | 84.02 | 23.3 | 24.6 | 49.2 |
Table 4.
Performance comparison on WHU.
| Method | Precision | Recall | F1 | Params (M) | FLOPs (G) | FPS |
|---|---|---|---|---|---|---|
| FC-EF | 90.76 | 29.13 | 44.10 | 1.4 | 3.6 | 57.9 |
| FC-Siam-Conc | 74.62 | 55.17 | 63.44 | 1.6 | 5.3 | 59.2 |
| FC-Siam-Diff | 70.26 | 52.47 | 60.08 | 1.4 | 4.7 | 62.8 |
| DTCDSCN | 89.55 | 84.10 | 86.74 | 31.3 | 13.2 | 57.6 |
| BIT | 79.08 | 72.44 | 75.61 | 3.6 | 4.4 | 55.0 |
| DSAMNet | 67.04 | 92.91 | 77.89 | 17.0 | 75.4 | 29.5 |
| STANet | 68.84 | 93.15 | 79.17 | 13.2 | 16.9 | 4.7 |
| DCAT | 91.53 | 85.09 | 88.19 | 23.3 | 24.6 | 49.2 |
Table 5.
Performance comparison on SYSU-CD.
| Method | Precision | Recall | F1 | Params (M) | FLOPs (G) | FPS |
|---|---|---|---|---|---|---|
| FC-EF | 77.29 | 67.84 | 72.26 | 1.4 | 3.6 | 57.9 |
| FC-Siam-Conc | 83.02 | 70.41 | 76.19 | 1.6 | 5.3 | 59.2 |
| FC-Siam-Diff | 89.13 | 61.21 | 72.57 | 1.4 | 4.7 | 62.8 |
| DTCDSCN | 81.08 | 69.86 | 75.06 | 31.3 | 13.2 | 57.6 |
| BIT | 78.94 | 64.50 | 70.99 | 3.6 | 4.4 | 55.0 |
| DSAMNet | 74.81 | 81.86 | 78.18 | 17.0 | 75.4 | 29.5 |
| STANet | 74.28 | 81.13 | 77.56 | 13.2 | 16.9 | 4.7 |
| DCAT | 87.00 | 73.41 | 79.63 | 23.3 | 24.6 | 49.2 |
Table 6.
Performance comparison with different attention mechanisms on LEVIR-CD.
| Model | Precision (%) | Recall (%) | F1 (%) |
|---|---|---|---|
| DCAT (w/self-attention) | 93.40 | 89.02 | 91.16 |
| DCAT (w/cross-attention) | 93.08 | 89.46 | 91.23 |
| DCAT (Ours) | 92.84 | 90.00 | 91.40 |
Table 7.
Performance comparison of the different channel ramp division ratios of mixer on LEVIR-CD.
| Division Strategy | Precision (%) | Recall (%) | F1 (%) | |
|---|---|---|---|---|
| Structure | 92.85 | 89.03 | 90.90 | |
| 91.95 | 90.12 | 91.03 | ||
| 93.27 | 89.21 | 91.19 | ||
| 92.29 | 89.65 | 90.95 | ||
| * | 92.84 | 90.00 | 91.40 |
* We use as default division strategy in DCAT.
Table 8.
Performance comparison of different BFF structures on LEVIR-CD.
| Method | Precision (%) | Recall (%) | F1 (%) |
|---|---|---|---|
| DEM first | 93.09 | 89.14 | 91.07 |
| CSM first | 93.05 | 89.19 | 91.08 |
| Subtraction | 93.95 | 84.23 | 88.82 |
| Concatenation | 92.31 | 88.48 | 90.35 |
| Parallel (Ours) | 92.84 | 90.00 | 91.40 |
Table 9.
Performance comparison of different feature map fusion methods on LEVIR-CD.
| Fusion Strategy | Precision (%) | Recall (%) | F1 (%) |
|---|---|---|---|
| 84.43 | 83.01 | 83.71 | |
| 91.03 | 82.10 | 86.34 | |
| 91.86 | 86.68 | 89.20 | |
| (Ours) | 92.84 | 90.00 | 91.40 |
Table 10.
Performance comparison on SVCD.
| Method | Precision (%) | Recall (%) | F1 (%) |
|---|---|---|---|
| FC-EF | 94.28 | 83.80 | 88.73 |
| FC-Siam-Conc | 95.26 | 97.63 | 96.43 |
| FC-Siam-Diff | 98.32 | 96.89 | 97.60 |
| DTCDSCN | 97.59 | 97.10 | 97.35 |
| BIT | 98.50 | 99.04 | 98.77 |
| DSAMNet | 92.78 | 98.06 | 95.35 |
| STANet | 96.08 | 99.87 | 97.94 |
| DCAT | 98.97 | 99.59 | 99.28 |
Table 11.
Performance comparison on the effect of pretraining on LEVIR-CD.
| Method | Precision | Recall | F1 | Params (M) | FLOPs (G) | FPS |
|---|---|---|---|---|---|---|
| SwinSUNet | 90.75 | 89.54 | 90.14 | 56.9 | 21.7 | 43.7 |
| ViTAEv2-S | - | - | 91.26 | 19.6 | 16.1 | 61.4 |
| DCAT | 92.84 | 90.00 | 91.40 | 23.3 | 24.6 | 49.2 |
| DCAT † | 92.86 | 90.20 | 91.51 | 23.3 | 24.6 | 49.2 |
† Results with pretraining.
Disclaimer/Publisher’s Note: The statements, opinions and data contained in all publications are solely those of the individual author(s) and contributor(s) and not of MDPI and/or the editor(s). MDPI and/or the editor(s) disclaim responsibility for any injury to people or property resulting from any ideas, methods, instructions or products referred to in the content. |
© 2023 by the authors. Licensee MDPI, Basel, Switzerland. This article is an open access article distributed under the terms and conditions of the Creative Commons Attribution (CC BY) license (https://creativecommons.org/licenses/by/4.0/).
Share and Cite
MDPI and ACS Style
Zhou, Y.; Huo, C.; Zhu, J.; Huo, L.; Pan, C. DCAT: Dual Cross-Attention-Based Transformer for Change Detection. Remote Sens. 2023, 15, 2395. https://doi.org/10.3390/rs15092395
AMA Style
Zhou Y, Huo C, Zhu J, Huo L, Pan C. DCAT: Dual Cross-Attention-Based Transformer for Change Detection. Remote Sensing. 2023; 15(9):2395. https://doi.org/10.3390/rs15092395
Chicago/Turabian StyleZhou, Yuan, Chunlei Huo, Jiahang Zhu, Leigang Huo, and Chunhong Pan. 2023. "DCAT: Dual Cross-Attention-Based Transformer for Change Detection" Remote Sensing 15, no. 9: 2395. https://doi.org/10.3390/rs15092395
Note that from the first issue of 2016, this journal uses article numbers instead of page numbers. See further details here.