Article

Accurate Retrieval of the Whole Flood Process from Occurrence to Recession Based on GPS Original CNR, Fitted CNR, and Seamless CNR Series

1
Communication Engineering School, Hangzhou Dianzi University, Hangzhou 310005, China
2
School of Electronic Information Engineering, Beihang University, Beijing 100191, China
3
School of Geodesy and Geomatics, Wuhan University, Wuhan 430072, China
*
Author to whom correspondence should be addressed.
Remote Sens. 2023, 15(9), 2316; https://doi.org/10.3390/rs15092316
Submission received: 9 April 2023 / Revised: 24 April 2023 / Accepted: 26 April 2023 / Published: 27 April 2023

Abstract

:
The CNR (Carrier-to-Noise Ratio) of GPS (Global Positioning System) satellites is highly relevant to the multipath error. The multipath error is more serious in the flood environment since the reflection and diffraction coefficients of water are much higher compared to dry soil. Thus, the amplitude of CNR will decrease in the flood environment. In this study, the relationship between multipath error, flooding, and CNR is introduced in theory. Then, by using the characteristic of the orbital repetition period, the stability of CNR between 2 adjacent days in a static observation environment is demonstrated by 32 MGEX (Multi-GNSS Experiment) stations in different latitude and longitude regions of the world. The results show that the average RMS of different CNRs between two adjacent days is only about 0.62 dB-Hz. In addition, the correlation coefficient of CNRs between two adjacent days is analyzed. The correlation coefficient of the original signal CNR is 0.997. Moreover, after mitigating the influence of random noise and lower CNR, the correlation coefficients of the fitted CNRs larger than 40 dB-Hz can reach 0.999. Thus, based on the fluctuation in original CNR, fitted CNR, and seamless series characteristics of CNR, the whole flood process from occurrence to recession can be retrieved. A flood that occurred in Zhengzhou City, China, from DOY 200 to DOY 202, 2021 is used to demonstrate the process of retrieval. The experimental results indicate that the flood appeared at about 15:30 pm on DOY 200, reached a peak at approximately 8:30 am on DOY 202, and totally subsided at about 10:00 am on DOY 202. In conclusion, the CNR can be effectively used to retrieve the whole process of the flood, which lays a foundation for researching flood detection and warning based on GPS satellites.

1. Introduction

With global warming, floods and urban water-logging caused by extreme weather have been more frequent in recent years, which dramatically affects the safety of human lives and properties. Thus, many flood detection and prediction methods have been developed to reduce the effect of flooding in recent years [1,2]. Basically, these methods can be divided into three categories: hydrological model [3,4,5,6], numerical model [7,8], and SAR (Synthetic Aperture Radar) satellite technique [9,10]. However, whether the GPS (Global Positioning System) can be used to retrieve or detect the flood has not been investigated, and this is a very interesting research topic.
The multipath error is mainly caused by the signal from a satellite arriving at the receiver via different paths due to the reflection and scattering of the signal [11]. Thus, multipath error is relevant to the environment of the receiver antenna. Considering that the environment of the observation station will be changed during the flood, the multipath error under the environment of the flood is obviously different from the environment without the flood [12]. Cai et al. [13] analyzed the effect of the surrounding environment on GPS and BDS (BeiDou System) satellites; the results show that pseudorange multipath error is largely increased in the environment with water compared with the open sky. In addition, Michael [11] demonstrated that multipath error is relevant to the environment, especially the reflection coefficient of the surface of the object. Experimental results show that the multipath error induced by dry soil is much lower compared to the water. Thus, it can be inferred that multipath error is more serious in the environment of the flood compared to a normal environment without flooding.
CNR observation is mainly used to reflect the quality of the GPS signal. Considering that the quality of the GPS signal is related to the multipath effect, the multipath effect can be further reflected in CNR observation. Based on this principle, Axelrad et al. [14] developed a new method to detect the multipath error for GPS satellites by using the CNR observation. To mitigate the influence of random noise, Benton and Mitchell [15] proposed using a filter to extract the multipath error from CNR observation. By using the difference between different frequencies, Strode and Groves [16] presented a new method to mitigate the pseudorange multipath error of GPS satellites based on three frequencies. Zhang et al. [17] demonstrated an improved method to mitigate the influence of carrier phase multipath error based on CNR statistical strategies. In addition, Su et al. [18] indicated that the multipath error of carrier phase observation is strongly related to the CNR, and there is an inverse relation between them. Tian et al. [19] investigated the influence of marine environments on BDS satellites, and experimental results show that the CNR of BDS satellites collected in a marine environment is lower than in a land environment. In addition, Su et al. [20] analyzed the influence of flood on GPS satellites, and results demonstrate that the CNR collected during the flood performs worse than in an environment without flooding. Moreover, by utilizing the technique of GNSS-IR (Global Navigation Satellite System Interferometric Reflectometry), the CNR can also be used to retrieve the soil water variation [21], snow depth [22], and sea level [23]. Thus, all of the above literature indicates that the multipath error is strongly relevant to CNR observation.
Based on the above discussion, it can be inferred that the multipath error will increase in the environment of the flood, and the increased multipath error can further induce the CNR observation fluctuation in GPS satellites. Thus, taking advantage of the fluctuation in CNR observation, the whole flood process from occurrence to recession can be accurately retrieved. The concrete theory and proposed method are provided in the following sections.

2. Related Model and Methods

Before introducing the method to retrieve the whole process of the flood, some related theories and models are first provided. The theory of the multipath effect is presented, which can demonstrate why the flood will induce multipath error. By analyzing the relationship between multipath error and CNR, the main reason that the amplitude of CNR will be influenced by the multipath error is demonstrated. Moreover, the orbital repetition period of satellites on the ground is presented, which is mainly used to illustrate how to determine the selected satellites.

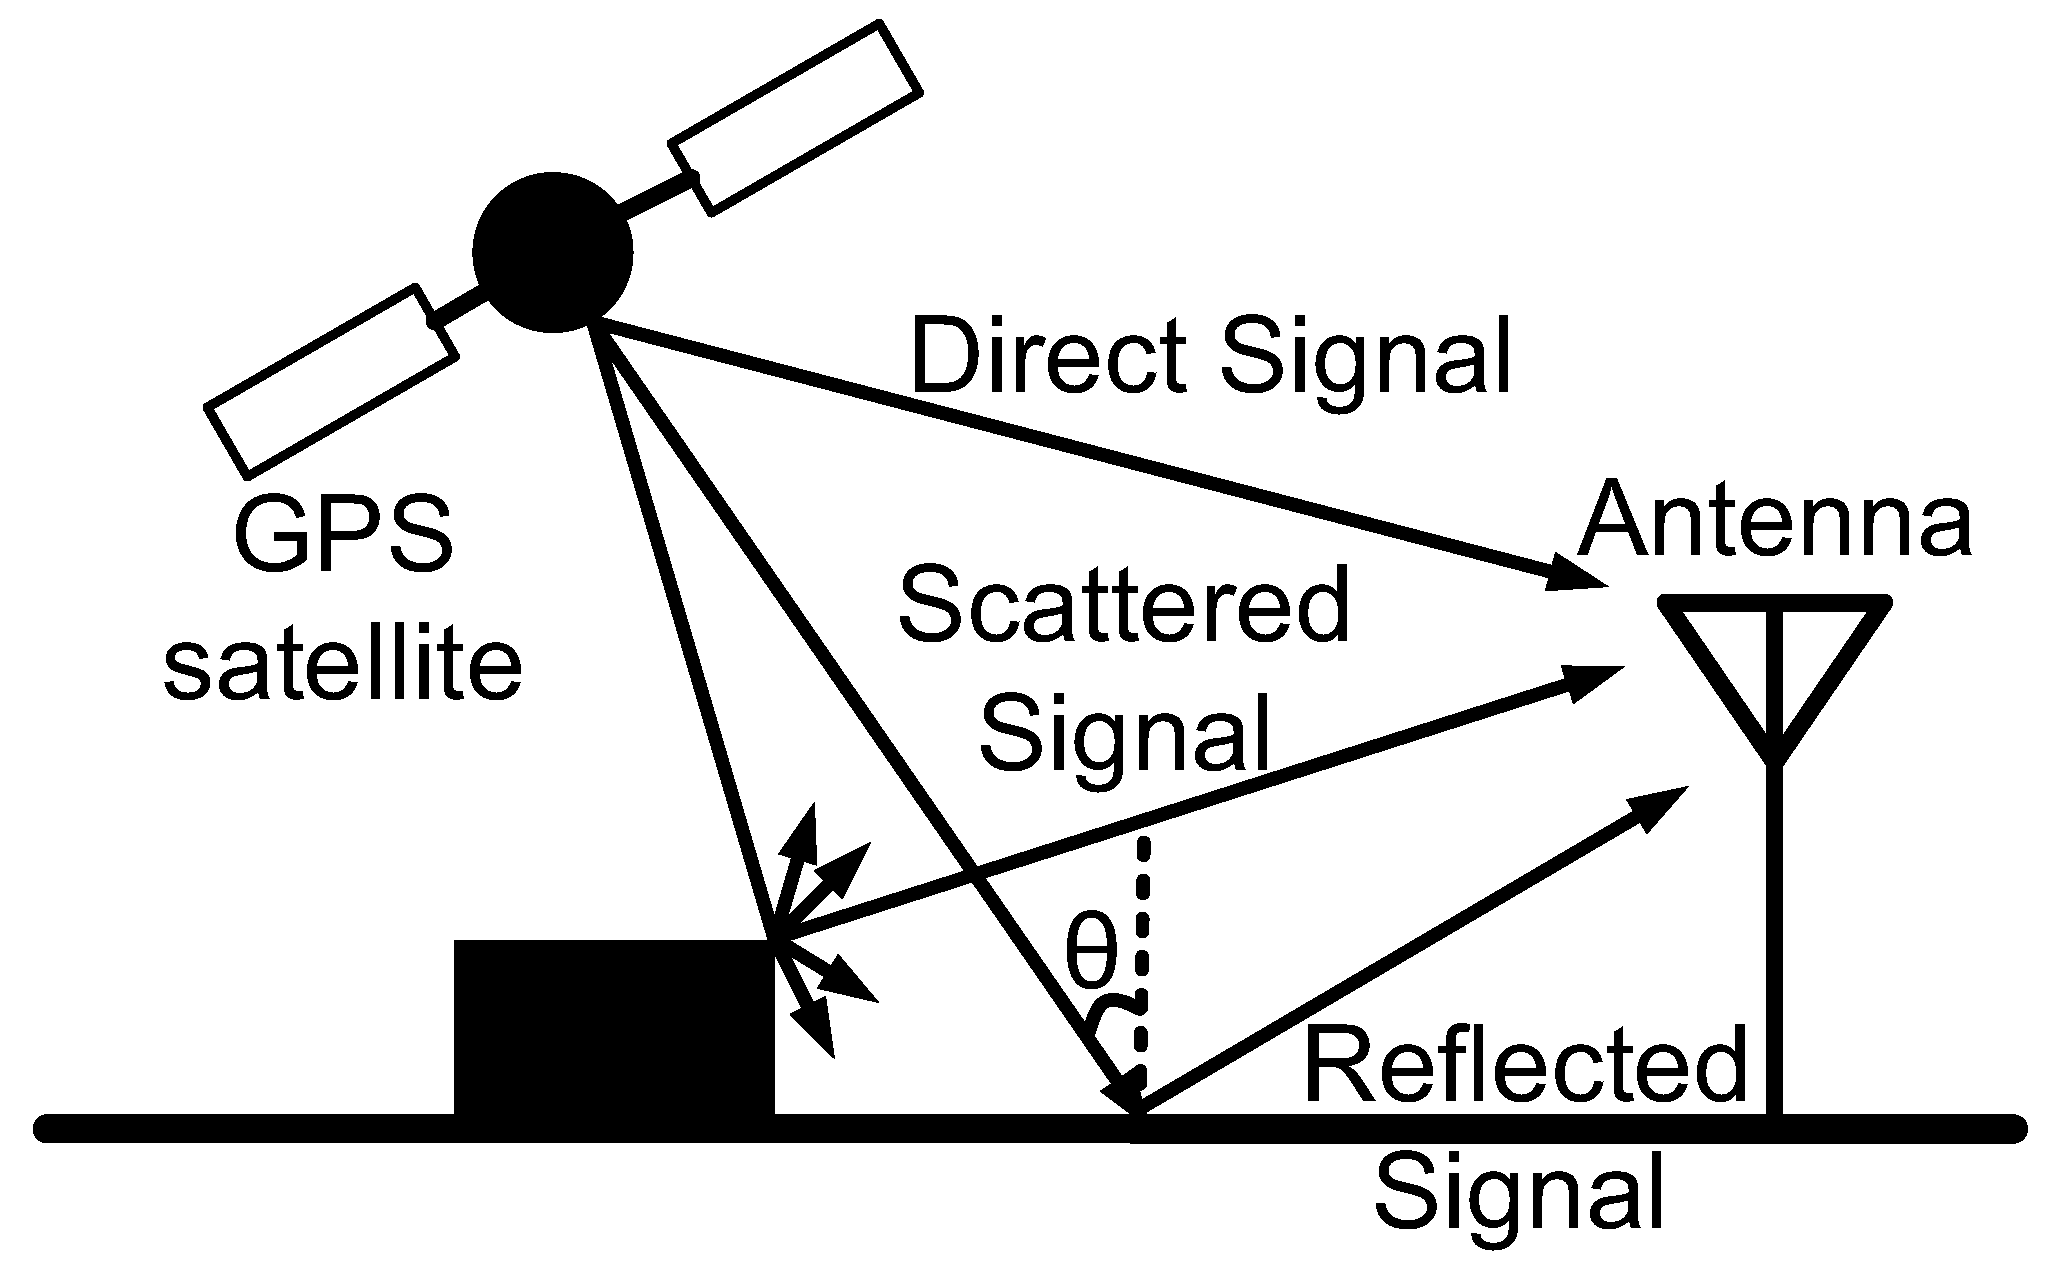
2.1. Theory of the Multipath Error

Multipath error is mainly induced by the reflection and diffraction of a signal; these non-direct signals can be received by a GPS receiver, which further distorts the received signal and causes errors in carrier phase and pseudorange observations. Since the physical surrounding environment of the receiver dictates the multipath effect, the multipath is significantly different for land, water, glass, concrete, etc. The general multipath effect environment is demonstrated in Figure 1.
From Figure 1, it can be seen that all multipath signals (including the reflected signal and scattered signal) pass a longer distance compared to the direct signal. Therefore, the direct signal will be received first by the receiver antenna, compared with other multipath signals. The relative delay of multipath signals can be determined based on electromagnetic theory. In terms of the relative amplitude of the multipath signal, it is mainly dependent on the shape, size, and reflection coefficient of the object’s surface. For example, the reflection coefficient of dry soil and grassy field are 0.27 and 0.33, respectively. However, the reflection coefficient of fresh water and sea water are 0.80 and 0.81, which are about three times that of dry soil. Thus, the amplitude of multipath error induced by the water is larger than the dry soil and grassy field. Moreover, the reflection coefficient is also relevant to the incidence angle of the signal. Thus, the amplitude of attenuation decreases with the decreasing satellite elevation angle. For more information, refer to Michael [11]. In conclusion, the multipath error is more serious during a flood compared to in a normal environment without flooding.

2.2. Relationship between Multipath and CNR

The signal received by GPS receiver antenna not only includes the direct signal from satellite but also includes the reflect and diffract signals from the multipath inducing surface. Thus, the received GPS signal can be modeled as follows [24]:
S m t = A d cos ( φ t ) + A i cos ( φ t + Δ φ )
where Ad and Ai denote the amplitude of the direct signal and the indirect signal; The indirect signal means the multipath signal, which mainly consists of the reflection and diffraction signals; φ is the phase of the direct signal; Δφ represents the phase shift of the indirect component signal.
Furthermore, based on the relationship between the CNR, direct signal, and indirect signal, the amplitude of the received signal can be reflected in the CNR. Considering that the CNR is positively related to the amplitude of the signal, the received GPS signal can be further modeled as follows [18]:
Δ φ m = arctan A i sin Δ φ A d + A i cos Δ φ A m 2 = C N R 2 A d 2 + A i 2 + 2 A d A i cos Δ φ
where Am is the amplitude of the received signal; Ad, Ai, and Δφ are same as the Equation (1). Thus, from the above analysis, it is clear that the CNR is strongly related to the multipath effect. Then, the relationship between flooding and the CNR can be established by the multipath, and this indicates that it is feasible to retrieve the flood by using CNR.

2.3. Orbital Repetition Period of GPS Satellite
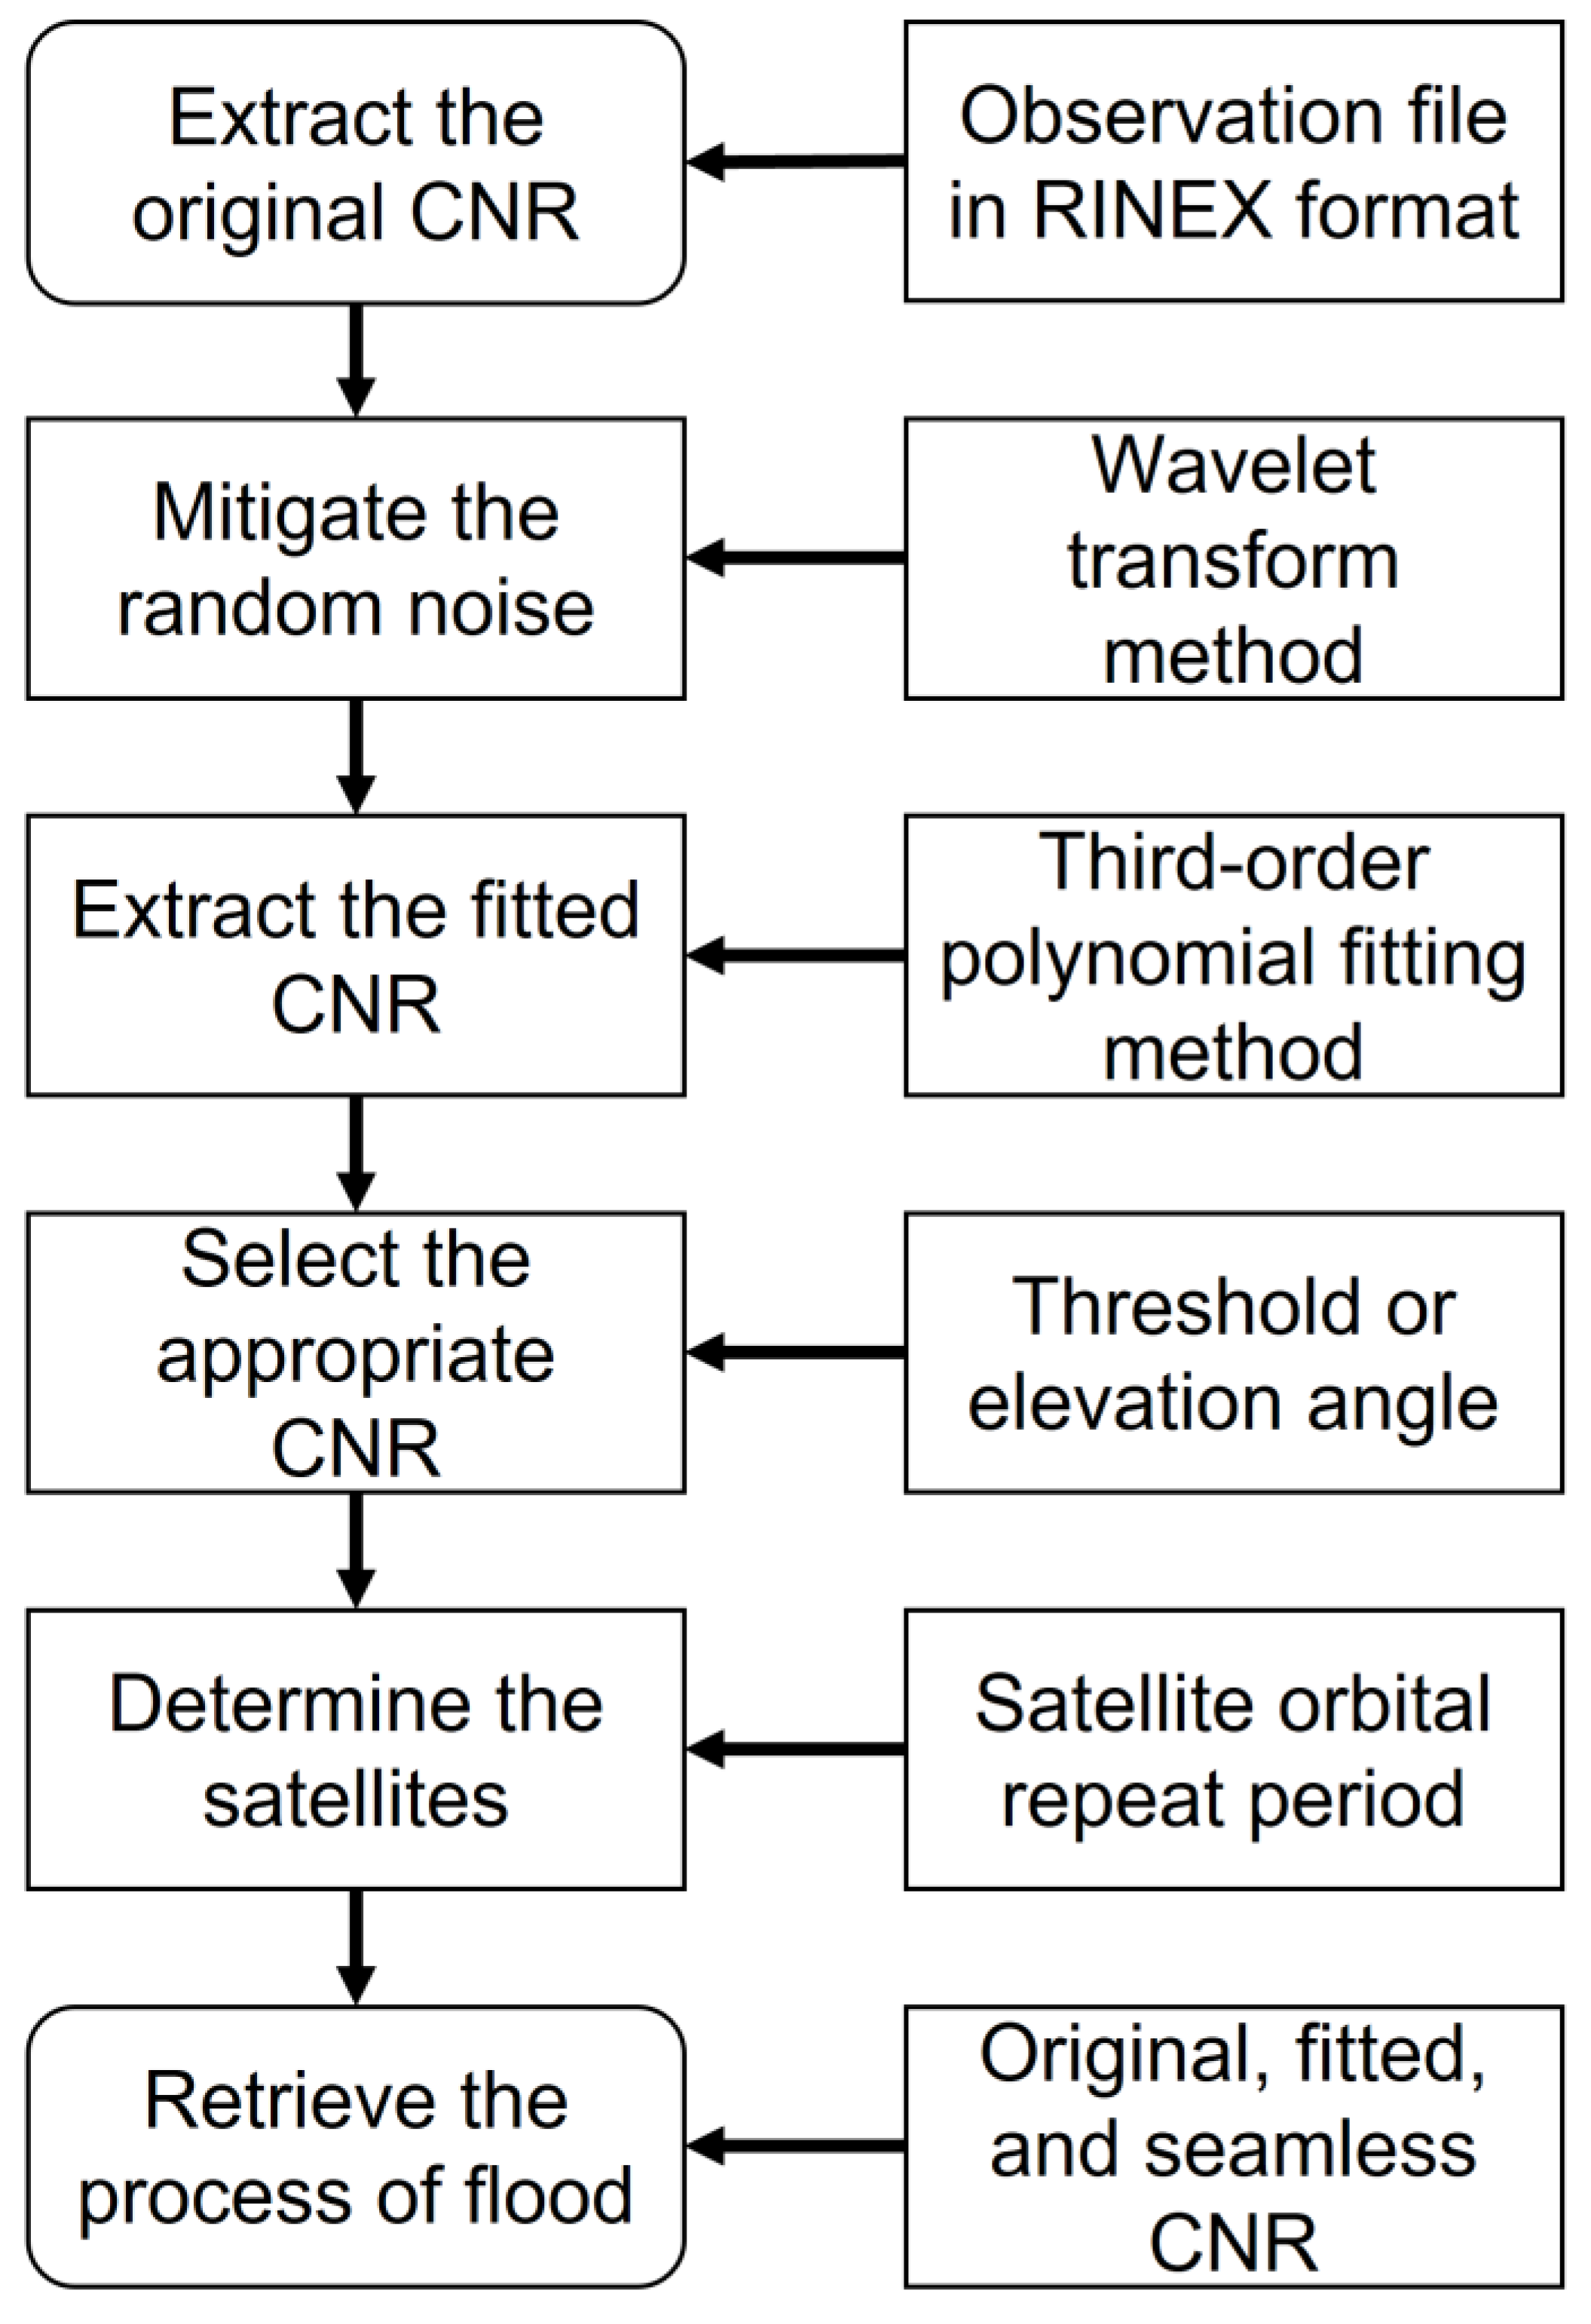
In order to demonstrate the fluctuation in CNR for the same satellite, the orbital repetition period of GPS satellite should be determined first. By using Kepler’s third law, the orbital repetition period of GPS satellites can be estimated based on the broadcast ephemeris [25]. Firstly, the mean motion of a satellite can be calculated by:
n = ( G M / a 3 ) 1 / 2 + Δ n
where n denotes the mean motion of a satellite; G M is the Earth’s universal gravitational constant, which is 3.986005 × 10¹⁴ m3s−2; a means the semi-major axis of the orbit ellipse; Δn is the correction to the mean motion; and both a and Δn can be directly obtained from the broadcast ephemeris. Secondly, considering that the GPS satellite runs two cycles around the earth every solar day, the orbital repetition period of GPS satellite is estimated by:
T = 2 × 2 π / n
where n is the mean motion which is obtained by Equation (3).
Based on Equations (3) and (4), the orbital repetition period of the GPS satellite is obtained, which is approximately a sidereal day. Furthermore, the accurate shift time between two adjacent days can be calculated by 86,400-T [26]. Thus, to analyze the fluctuation in CNR during the flood, the shift time of the satellite should be considered.

3. Proposed Method

To retrieve the whole flood process by GPS CNR and seamless series analysis, two points should first be determined. The first one is that the CNR must remain consistent on adjacent days, at the same elevation and azimuth, when the observation station is static. The second one is that the CNR must vary with the flood, which means that the influence of flooding on CNR must be significant. Based on these two points, the feasibility to retrieve the flood by CNR is demonstrated. Then, the proposed method is summarized.

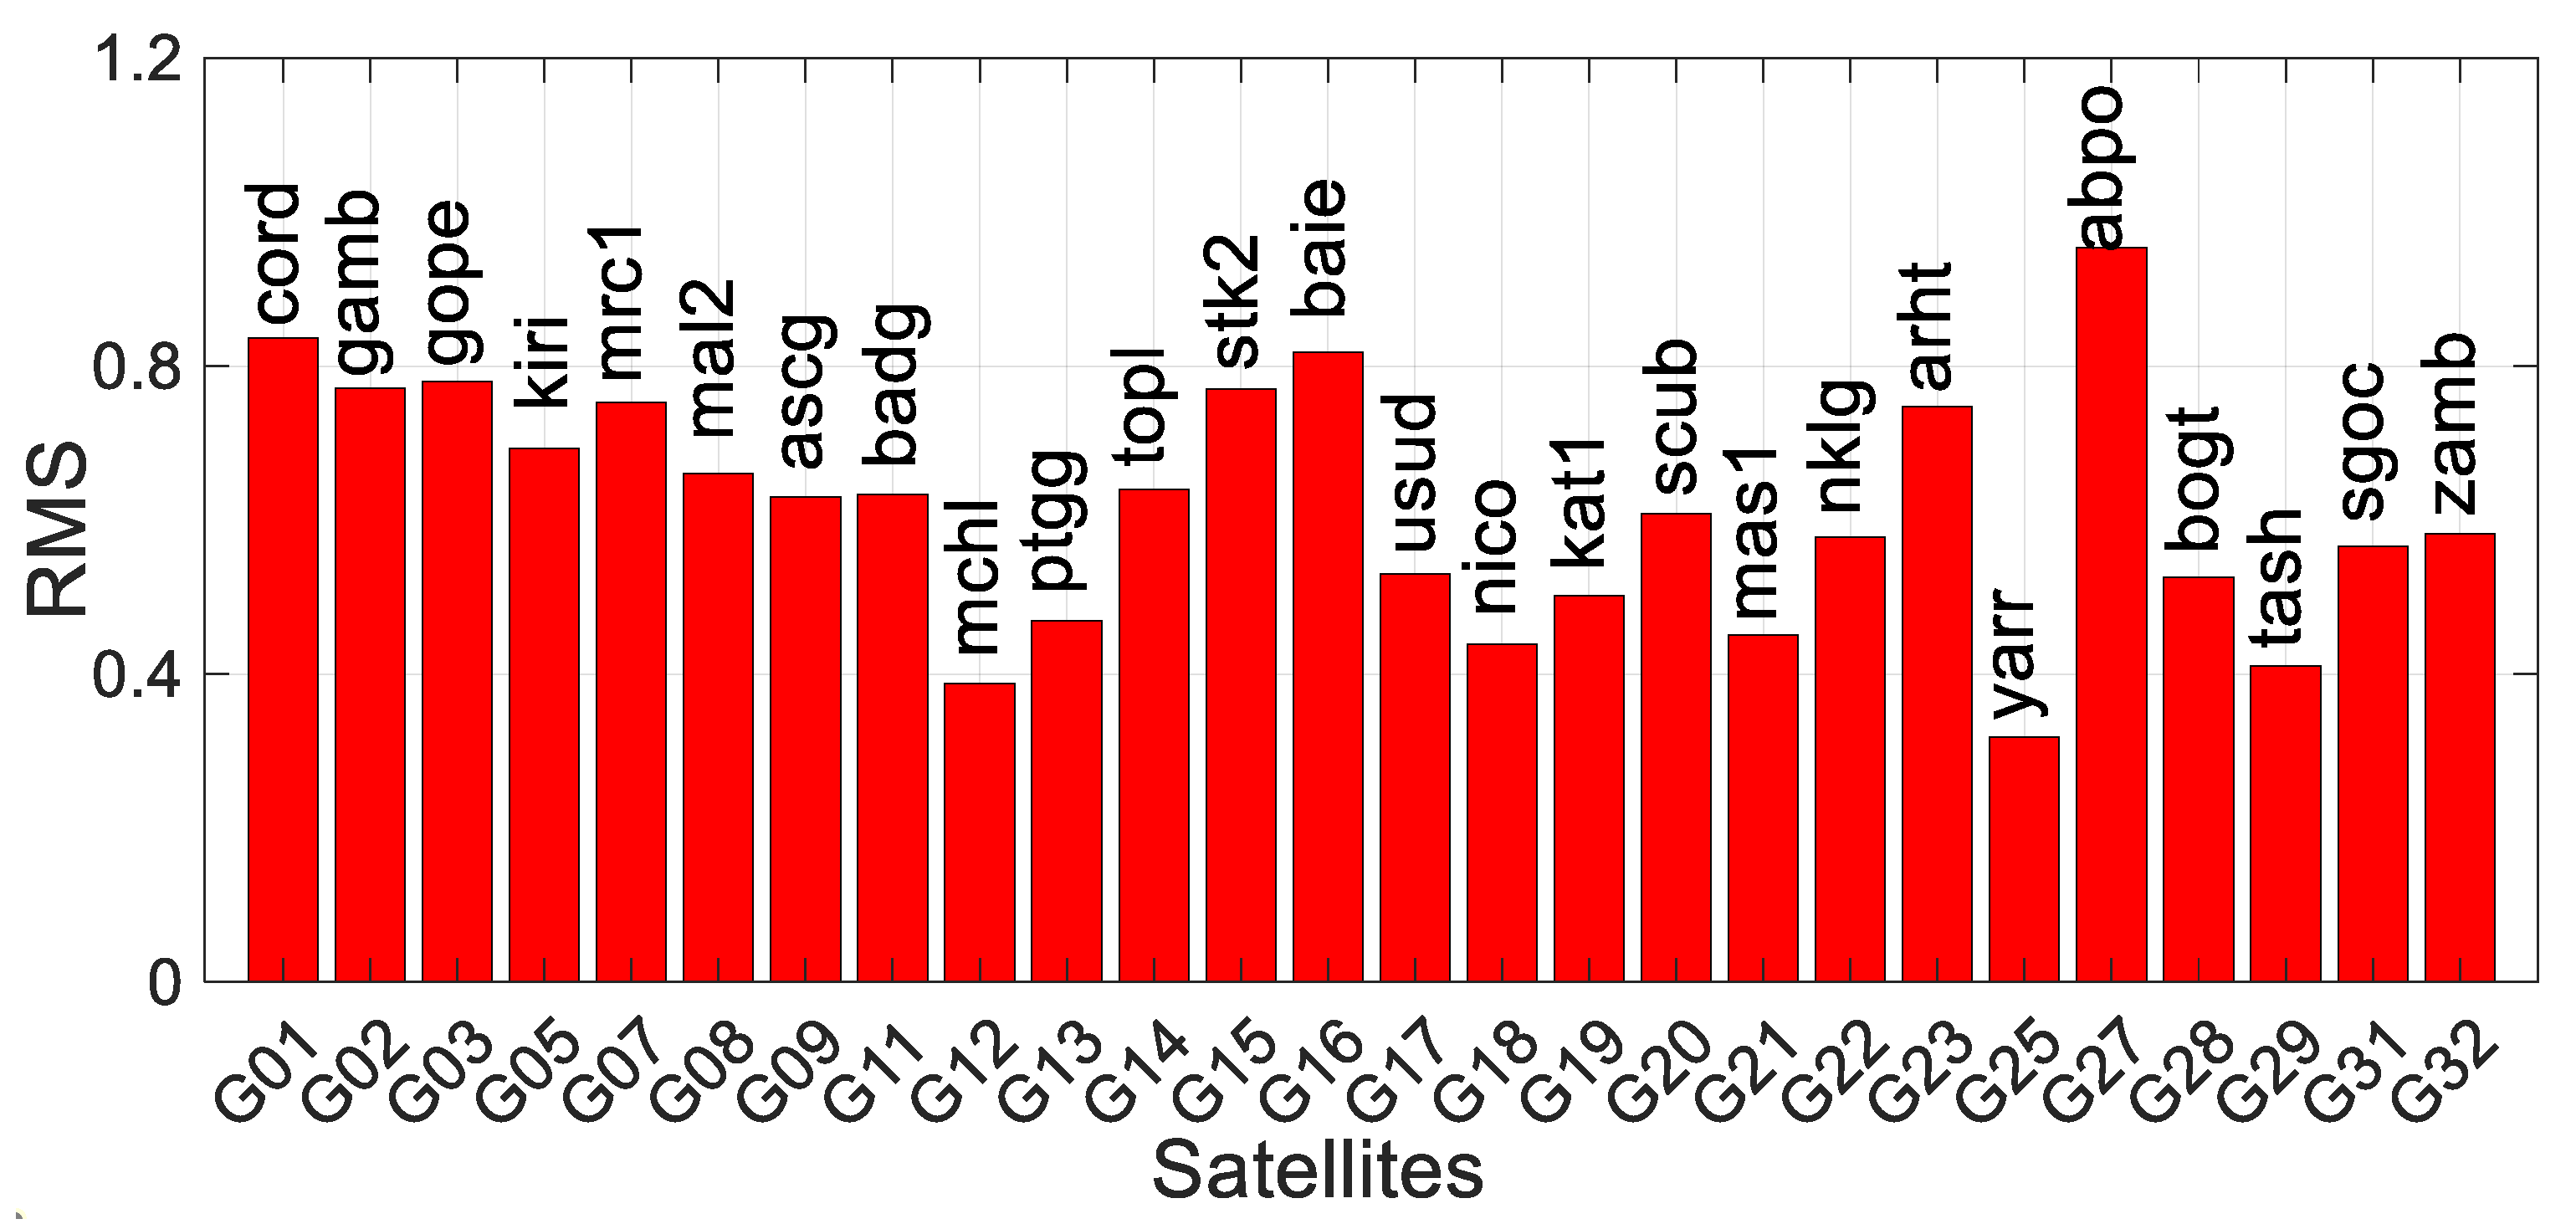
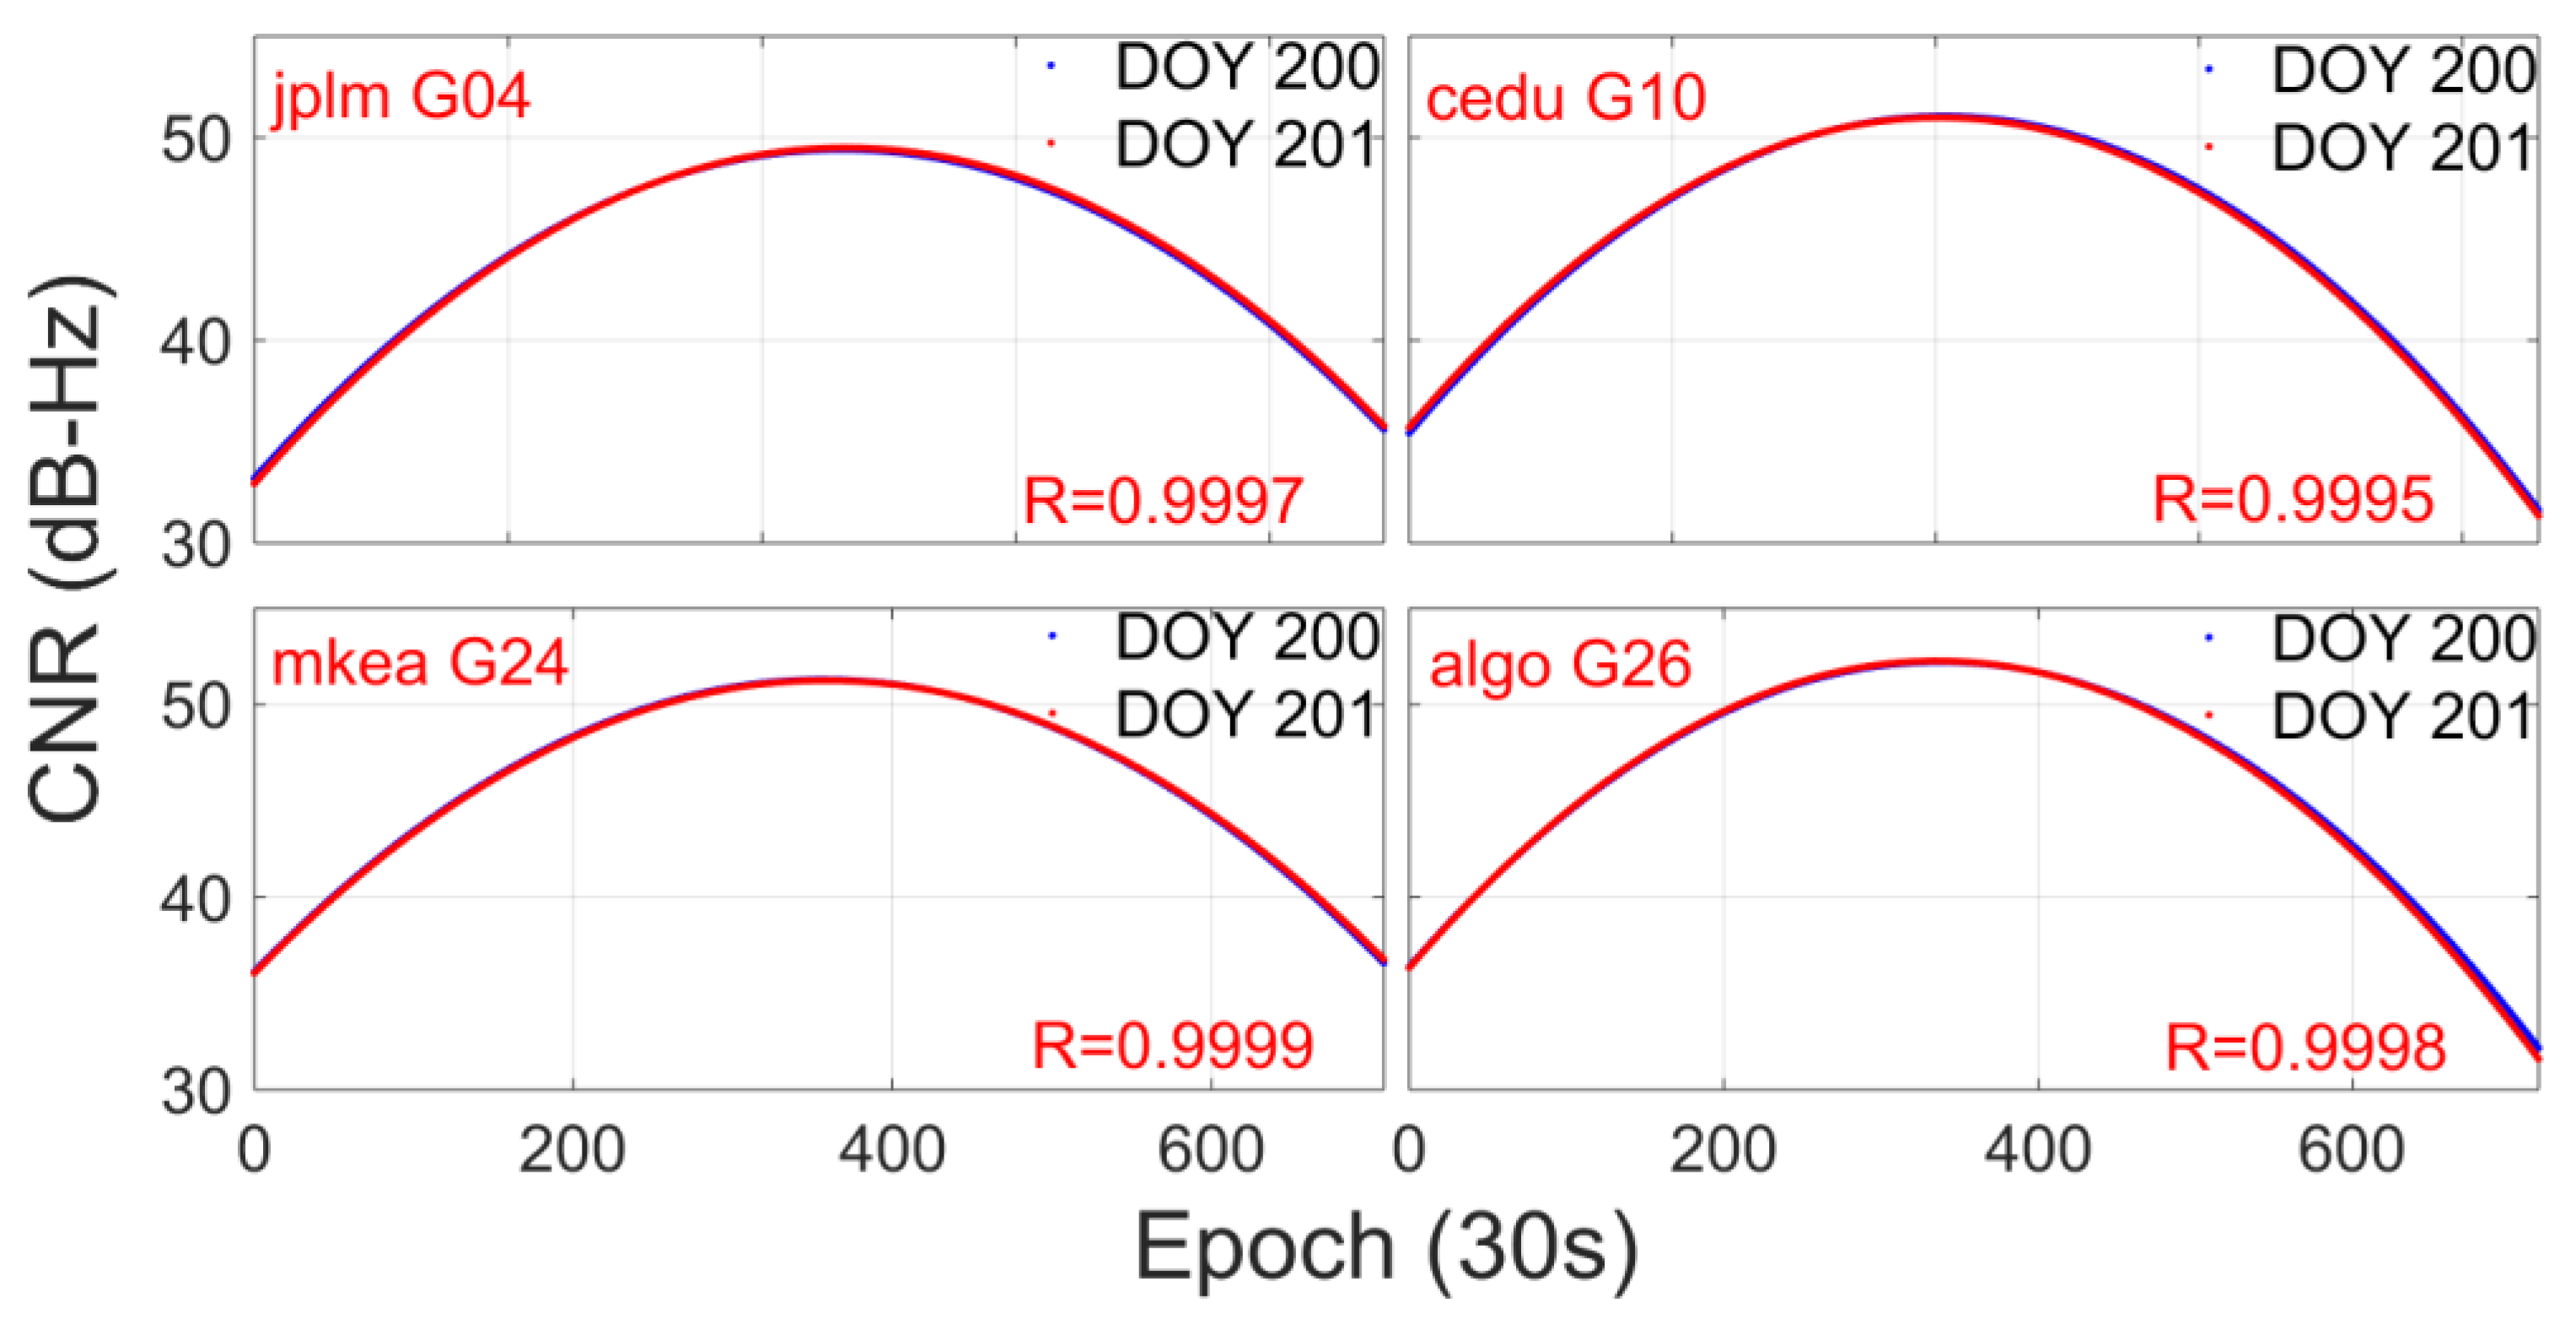
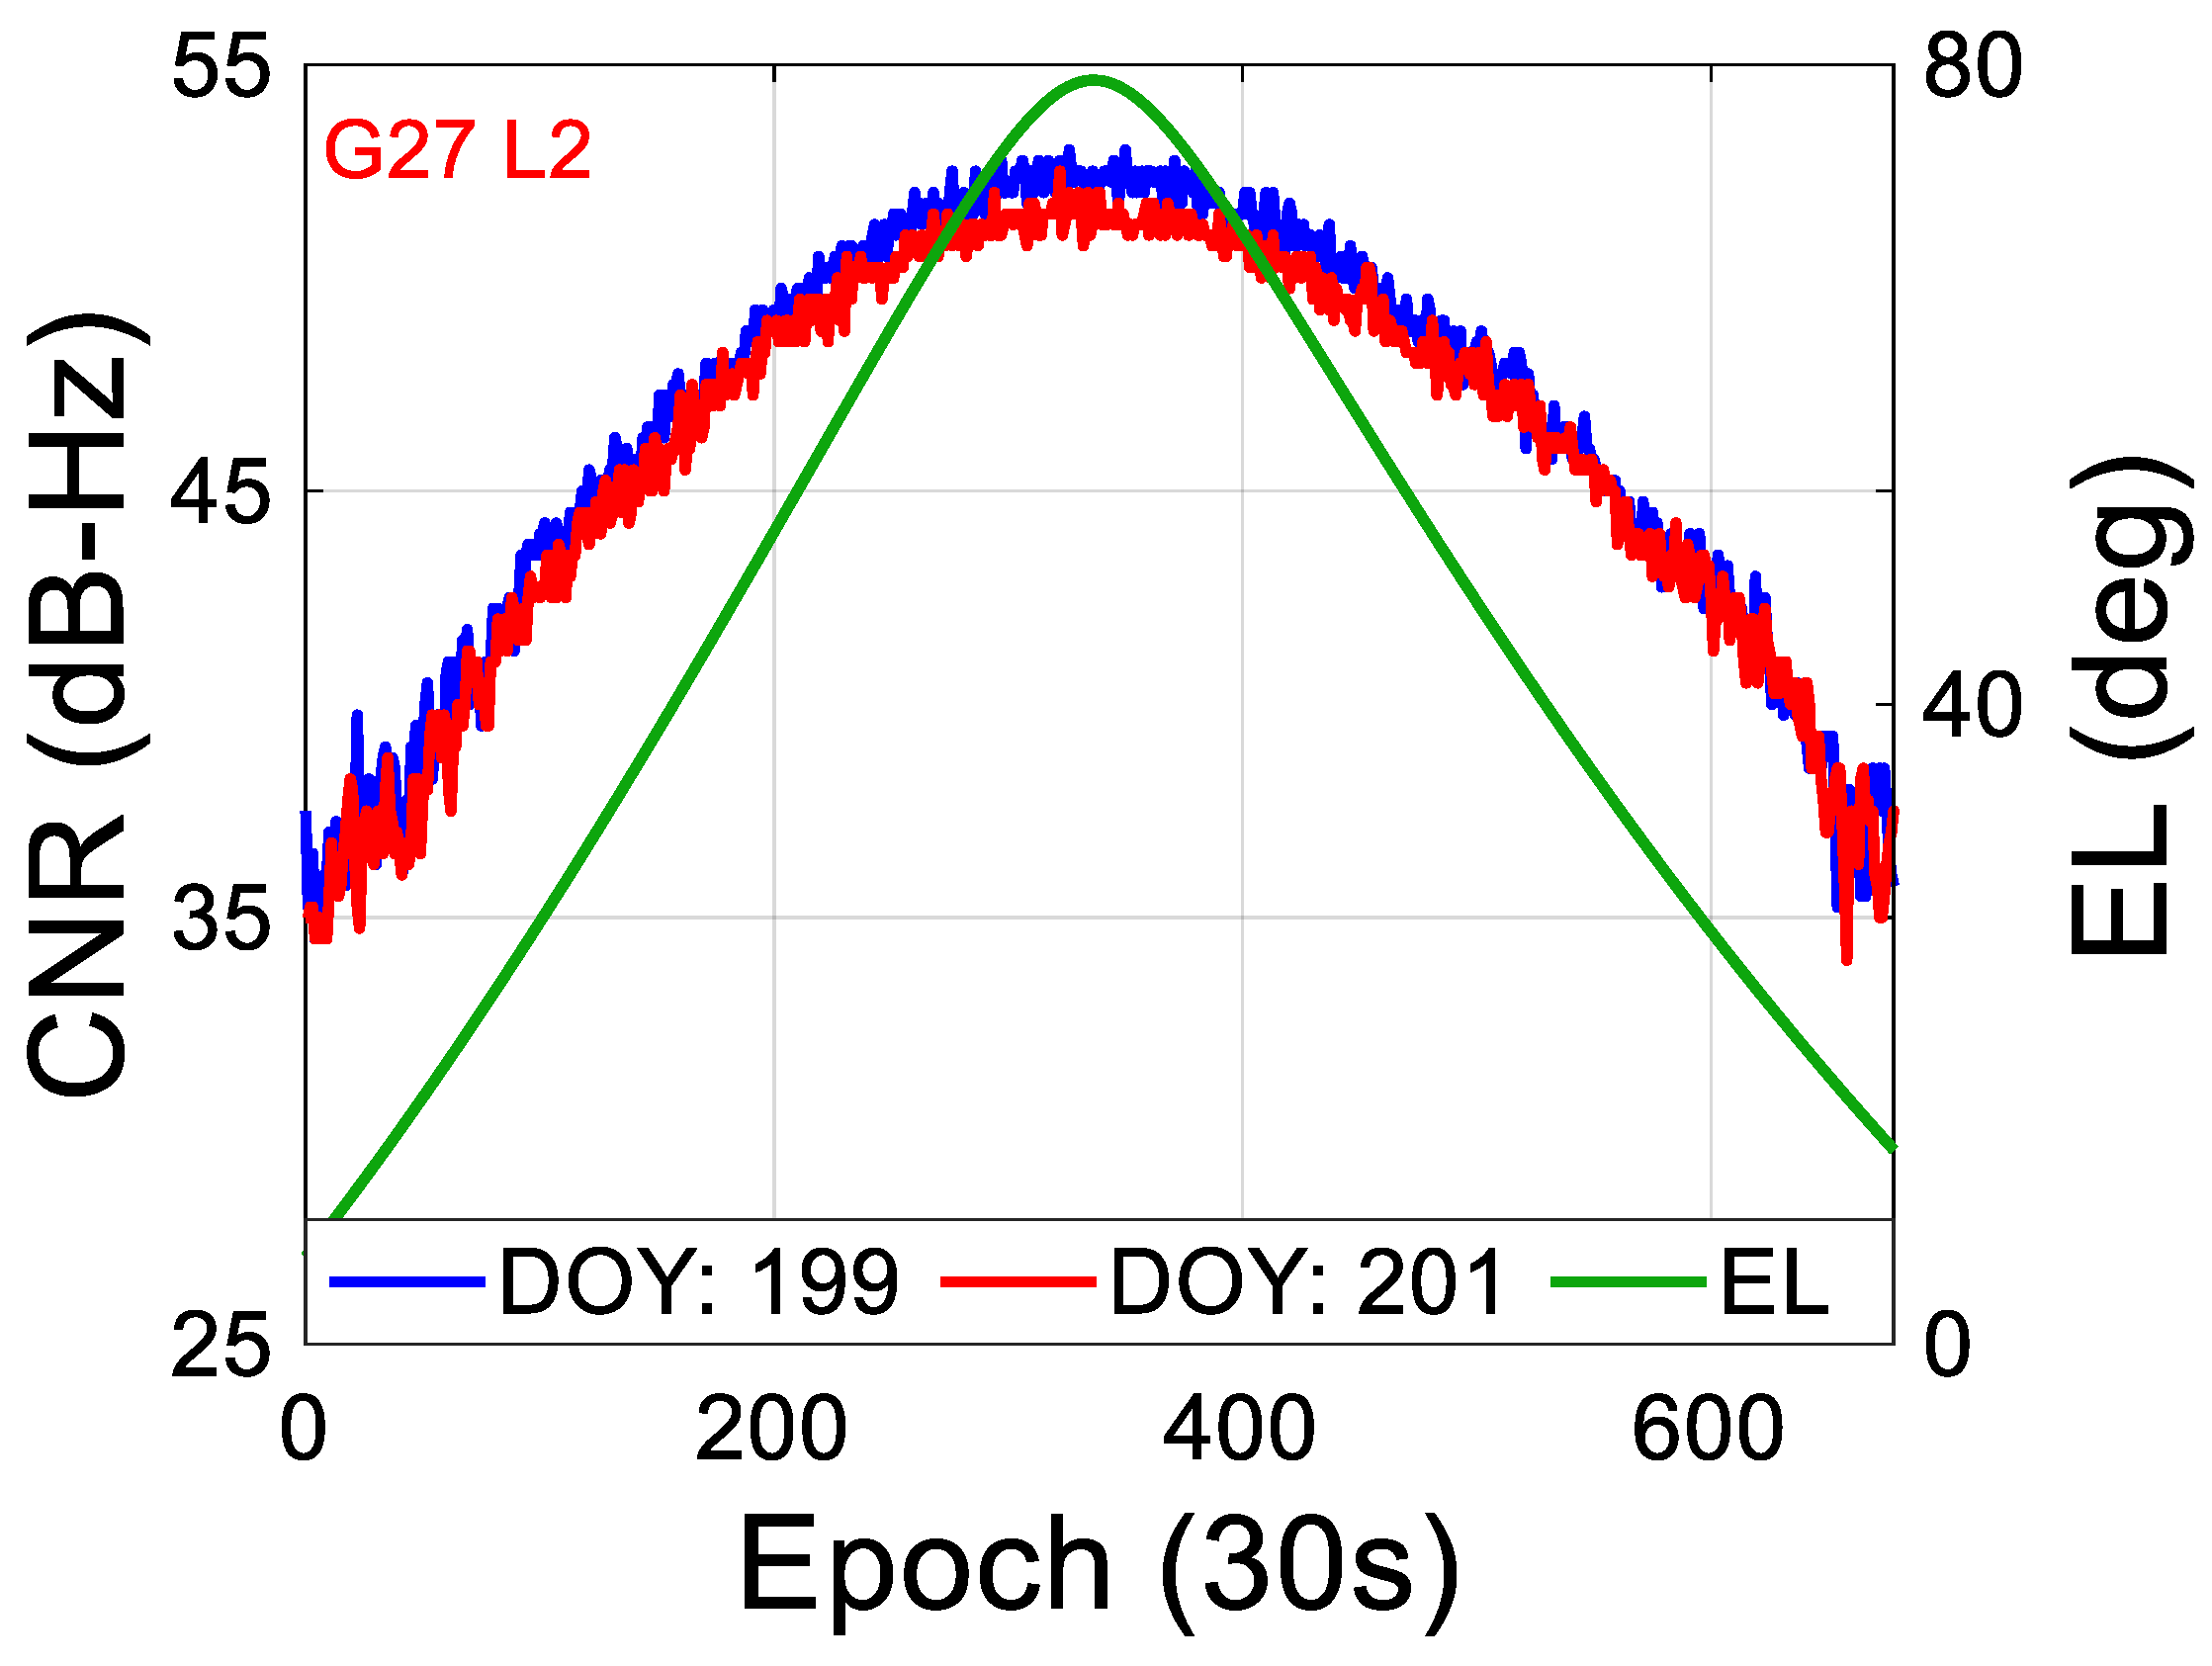
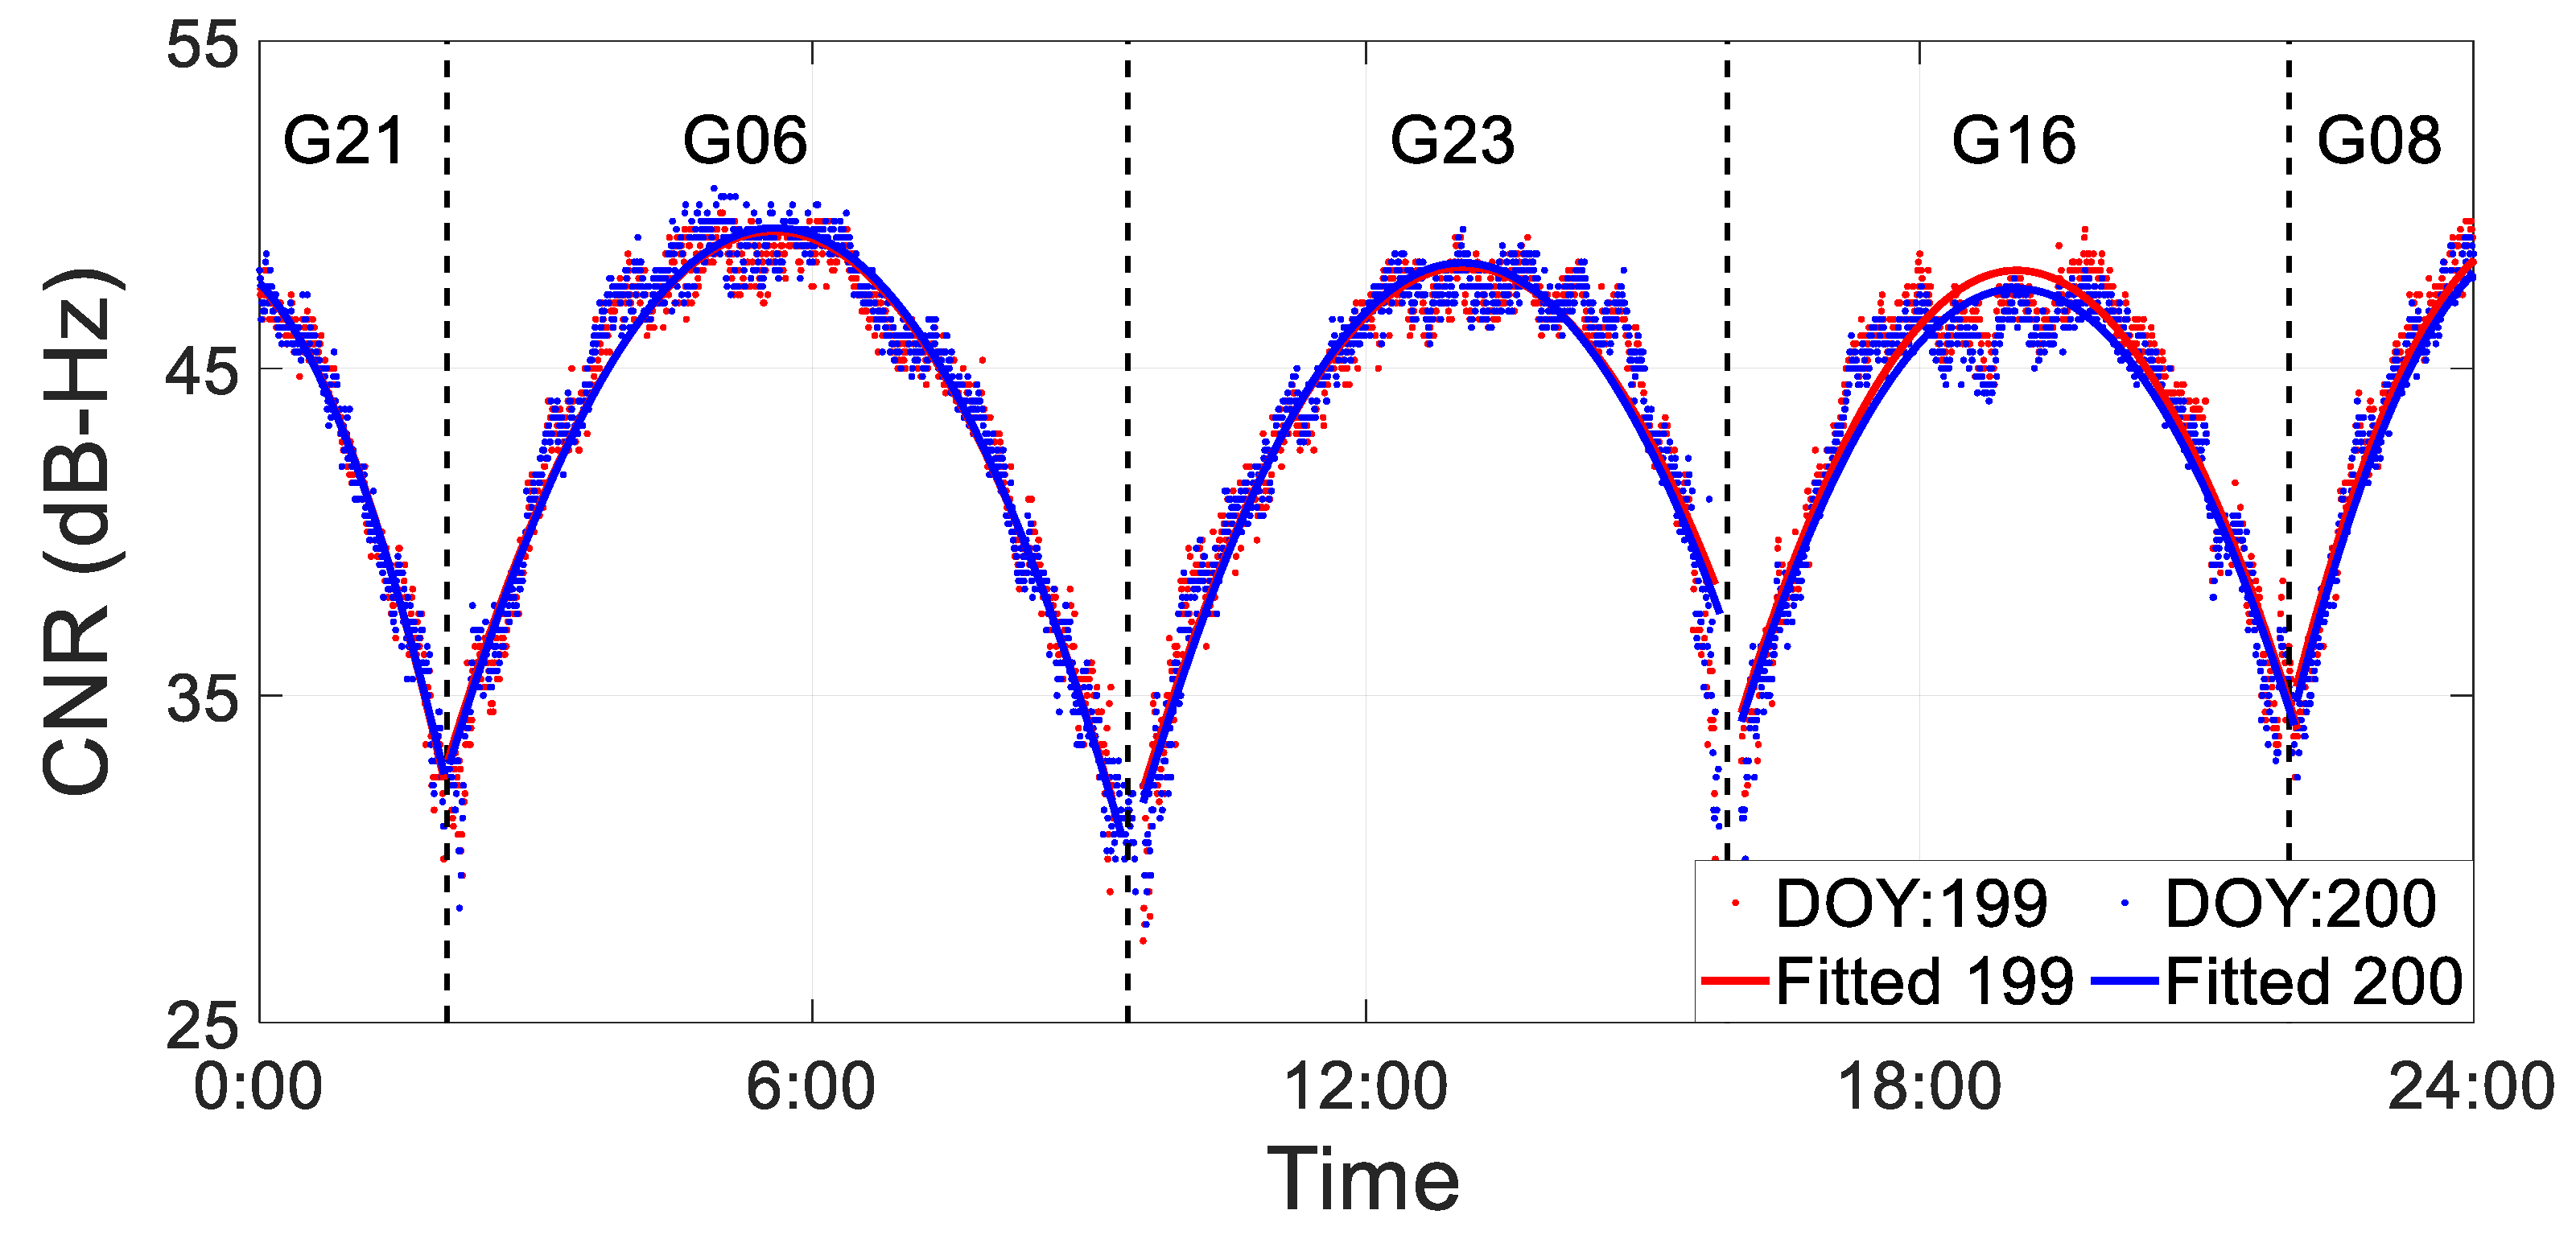
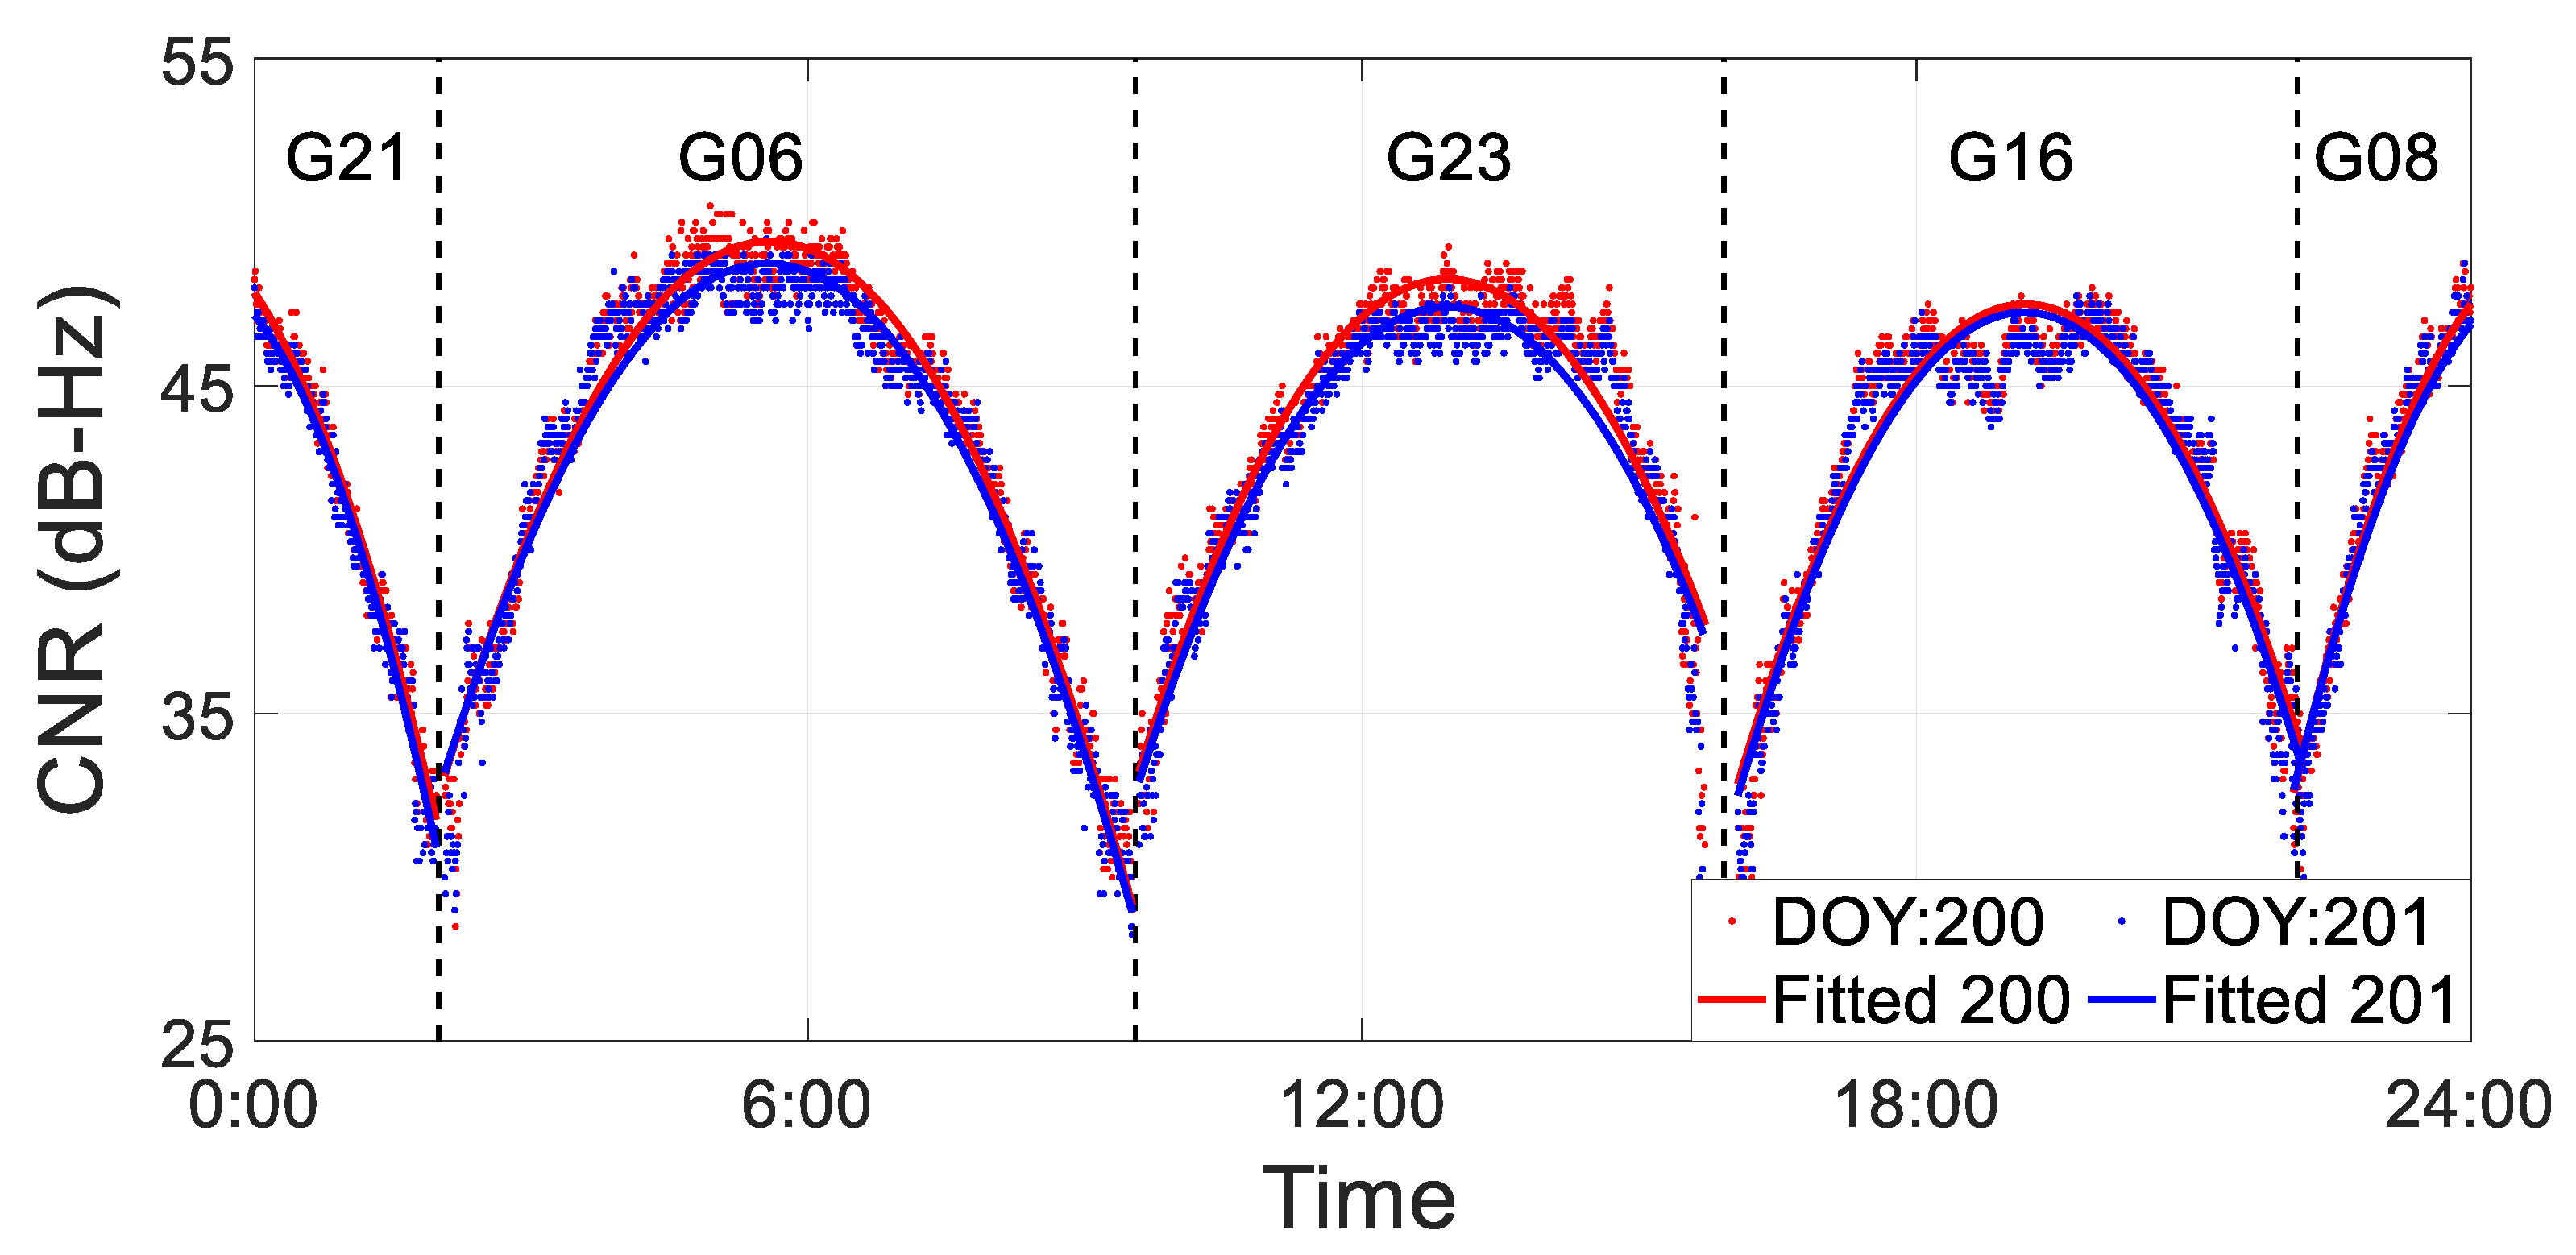
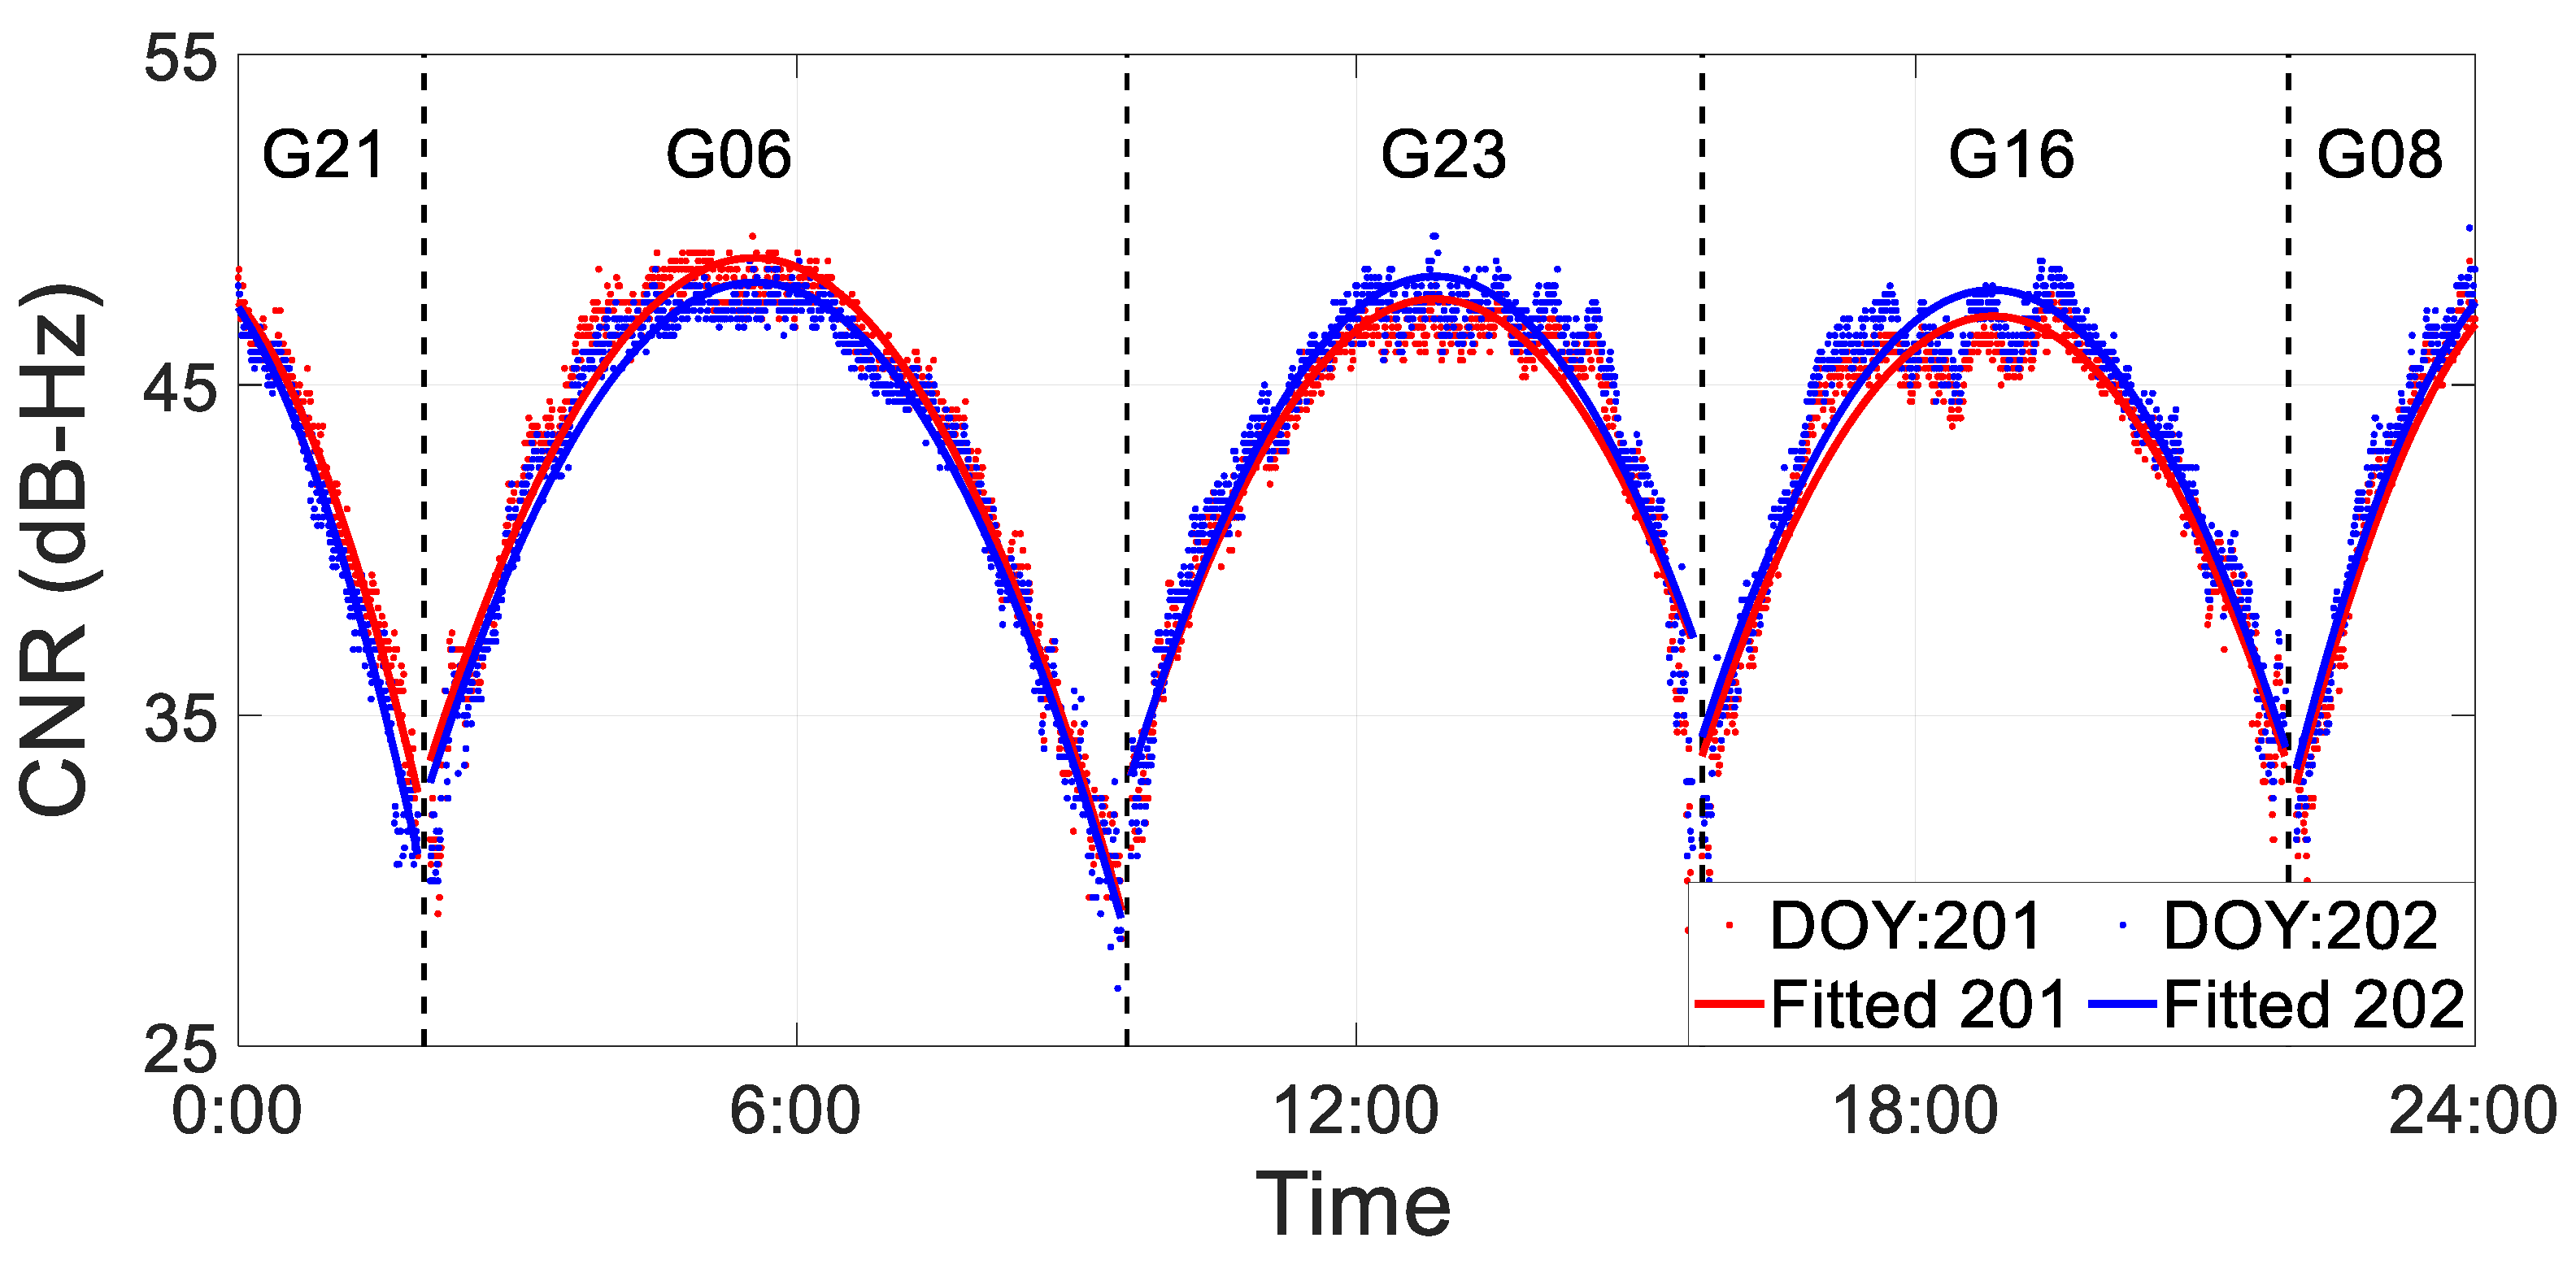
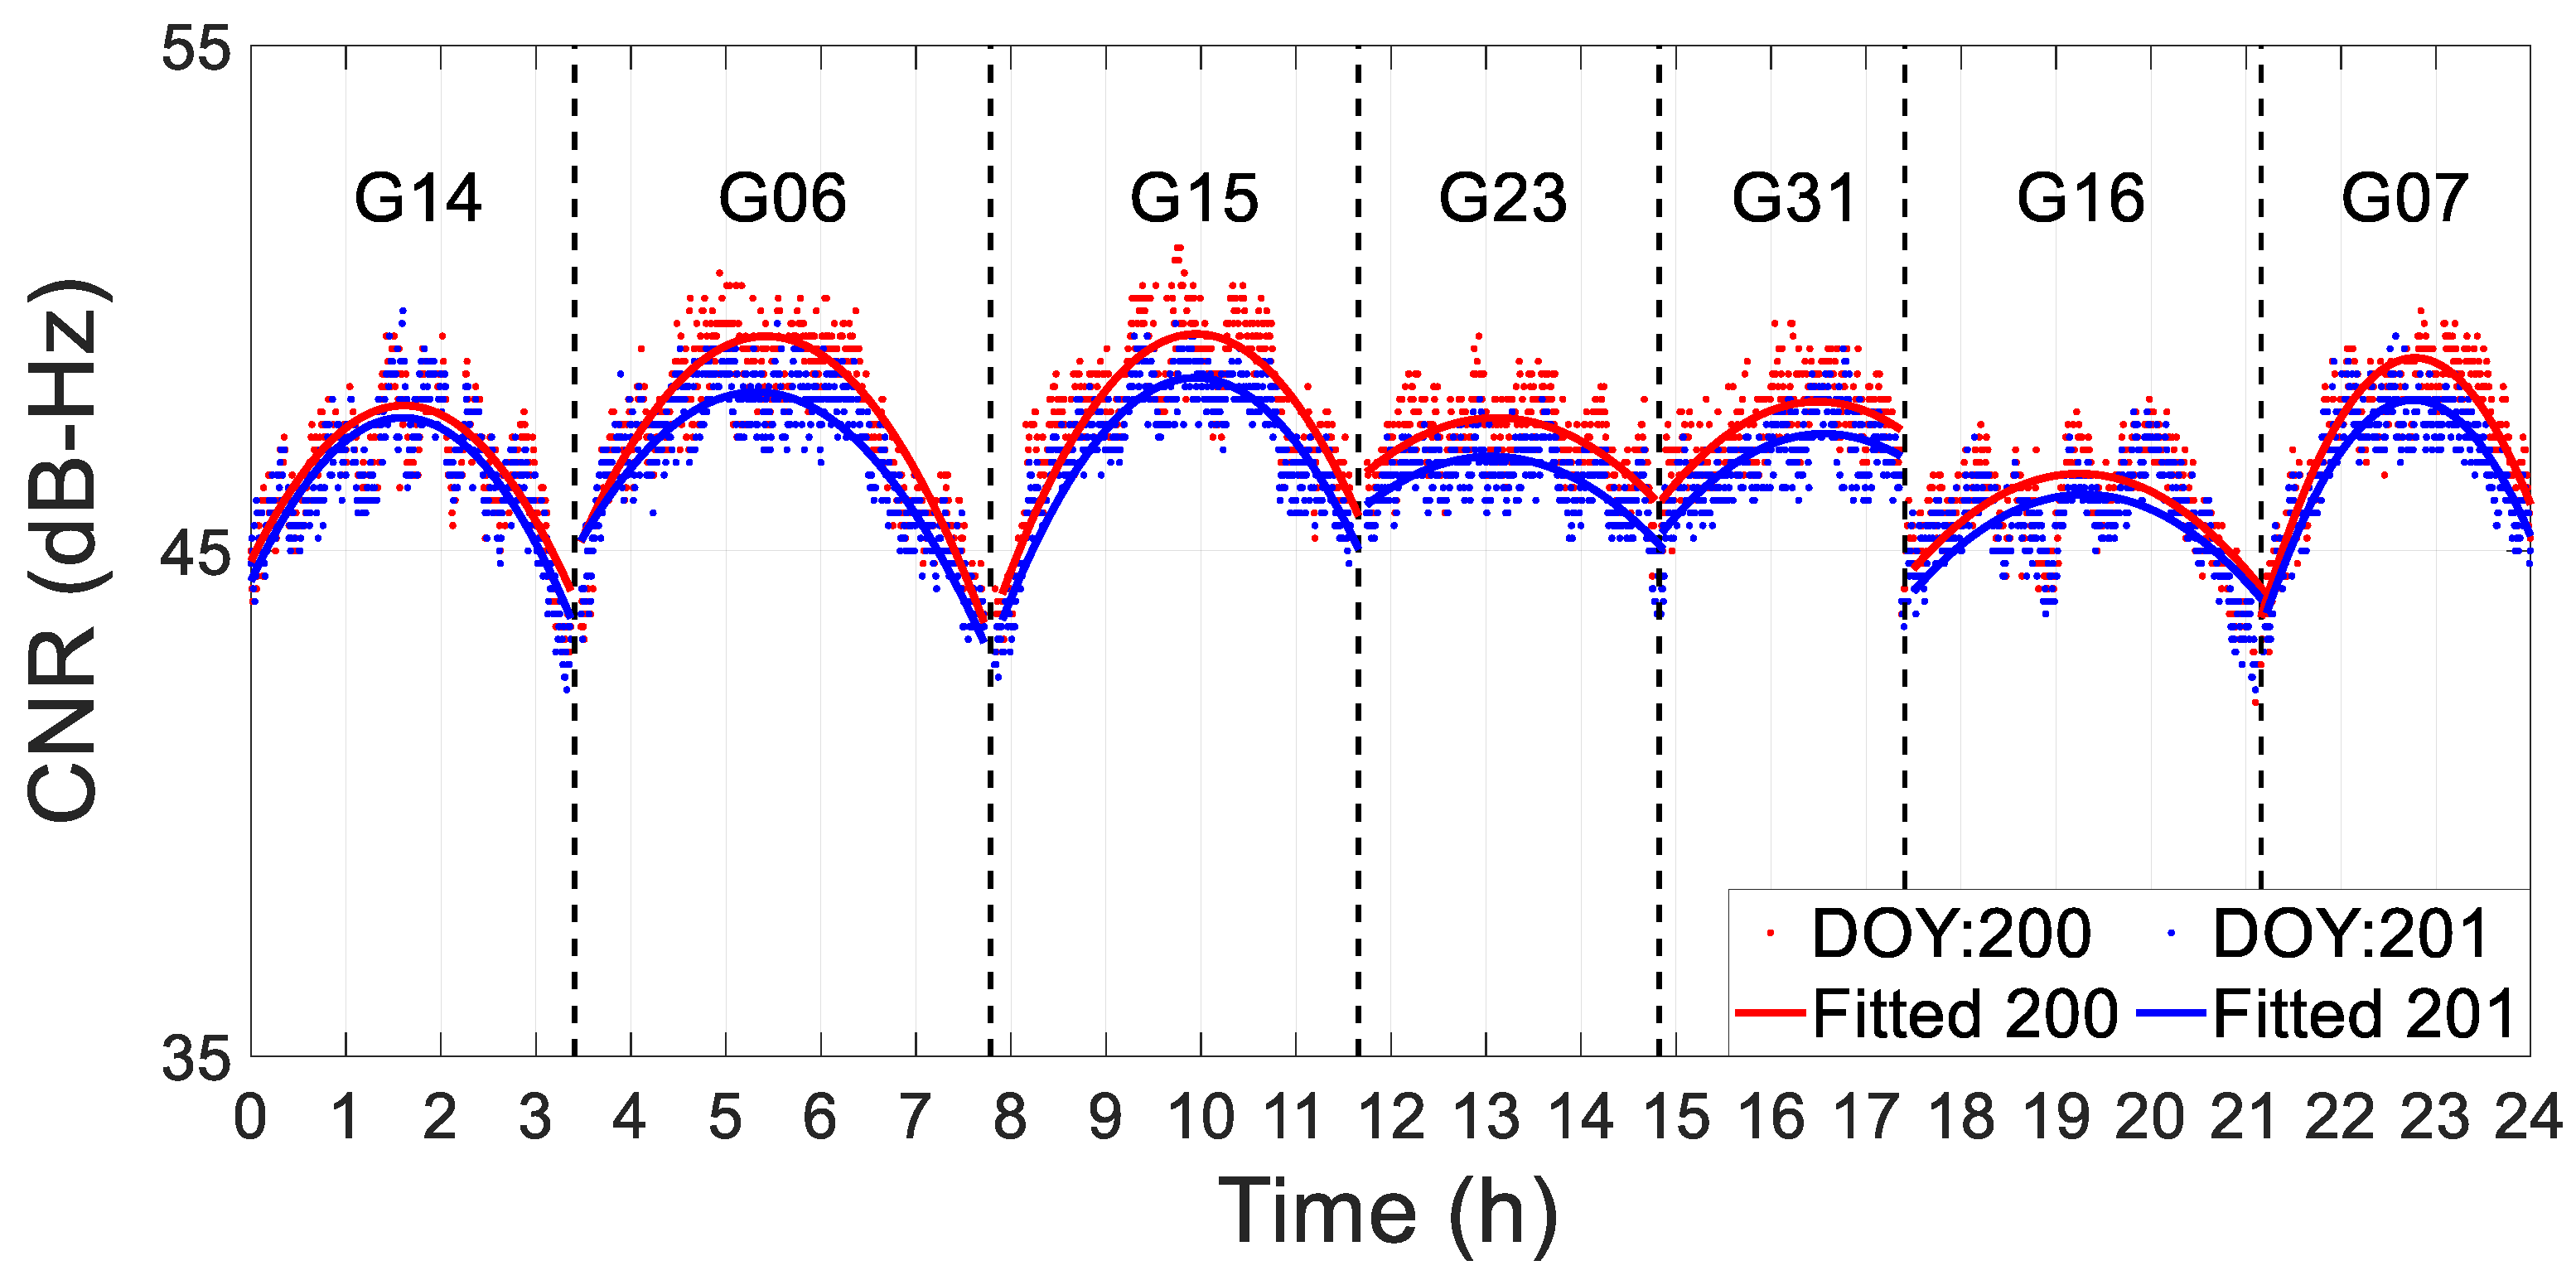
3.1. Stability Analysis of Satellite Ground Repeat Period and Original CNR

In order to demonstrate that the characteristic of the CNR of GPS satellites performs almost consistently on adjacent days for static observation stations, real data sets collected from 32 globally distributed MGEX stations were used. The sample interval of data sets was 30 s, and the elevation cut-off sets were 5 deg. There were nine types of geodetic receivers, which include the Trimble, Leica, etc. It should be pointed out that the stations used were randomly determined and we tried to cover as many latitudes and longitudes as possible. The used MGEX stations are shown in Figure 2.
Six satellites, which were randomly selected from thirty-two MGEX stations, were used to analyze the orbital repetition period for GPS satellites, and the results of the skyplot are presented in Figure 3. The blue line means the results of GPS satellites on DOY 200, 2021. The pink line denotes the results of GPS satellites on DOY 201, 2021. It is clear that the elevation (denoted vertically) and the azimuth (denoted by the circle) of these six GPS satellites remain the same as each other between these two adjacent days. This phenomenon can not only be observed in satellites with continuous observation arcs, such as G04 and G06 satellites, but can also be observed in discontinuous observation arcs, such as those of the G10 and G30 satellites. The above results further show that the orbital repetition period of the GPS satellite is nearly a sidereal day. Thus, the CNR of GPS satellites should remain consistent between two adjacent days for static observation stations if there is no change in the surrounding environment.
The CNR on two adjacent days for some GPS satellites and stations is presented in Figure 4. The blue dots mean the CNR of DOY 200, 2021. The red dots mean the CNR of DOY 201, 2021. The CNR of these satellites on DOY 200 and DOY 201 are almost identical to each other since the blue dots significantly overlap the red dots. Even though there will be obvious fluctuations at the low elevation angle (both ends of the sequence), the trend of these two CNR series means they perform consistently with each other as a whole. In addition, to further demonstrate this phenomenon, the difference between these two CNR series is presented by the pink line. It is obvious that most of the differences are lower than 1 dB-Hz, and this decreases as the elevation angle or amplitude of CNR increases. Furthermore, the RMS of the difference is presented in each subplot. The maximum RMS is only approximately 0.56, which appeared on G06 at abmf station. This indicates that the difference between them is very small.
In Figure 5, the RMS of the CNR difference between these two days on other satellites and stations is presented. It is obvious that almost all RMS values are rather small. Concretely, the average RMS is approximately 0.62. Among them, the minimum RMS is from the G25 satellite, which is merely approximately 0.32. Even for the G27 satellite, which has the highest RMS, it is still only approximately 0.95. Thus, on the basis of the above results, we found that the CNR remains almost consistent on two adjacent days at the same elevation and azimuth levels when the observation station is static.
Considering that the flood usually lasts several days, the CNR on several adjacent days was compared by using the data set collected from jplm station from DOY 196 to DOY 200, 2021. The comparison results are demonstrated in Figure 6. From Figure 6, it can be found that the CNRs of other adjacent days remain unchanged for the same satellite. This phenomenon can be found in the color bar—the more yellow the color, the more similar it is. In addition, R denotes the correlation coefficient between the CNRs, which is presented in each subplot. It is obvious that all of the coefficients perform very well and are larger than 0.997. Although the coefficient decreases as the time interval increases, it can still reach approximately 0.997. Thus, the above results indicate that the CNR maintains consistency on consecutive adjacent days.
However, it should be noted that there are some epochs that have larger bias (blue color), but all of them concentrate on CNRs lower than 40 dB-Hz. As is well known, these epochs are at low elevation angles and are mainly affected by random noise. Thus, to mitigate the influence of this bias, random noise and the CNR should be considered at low elevation angles.

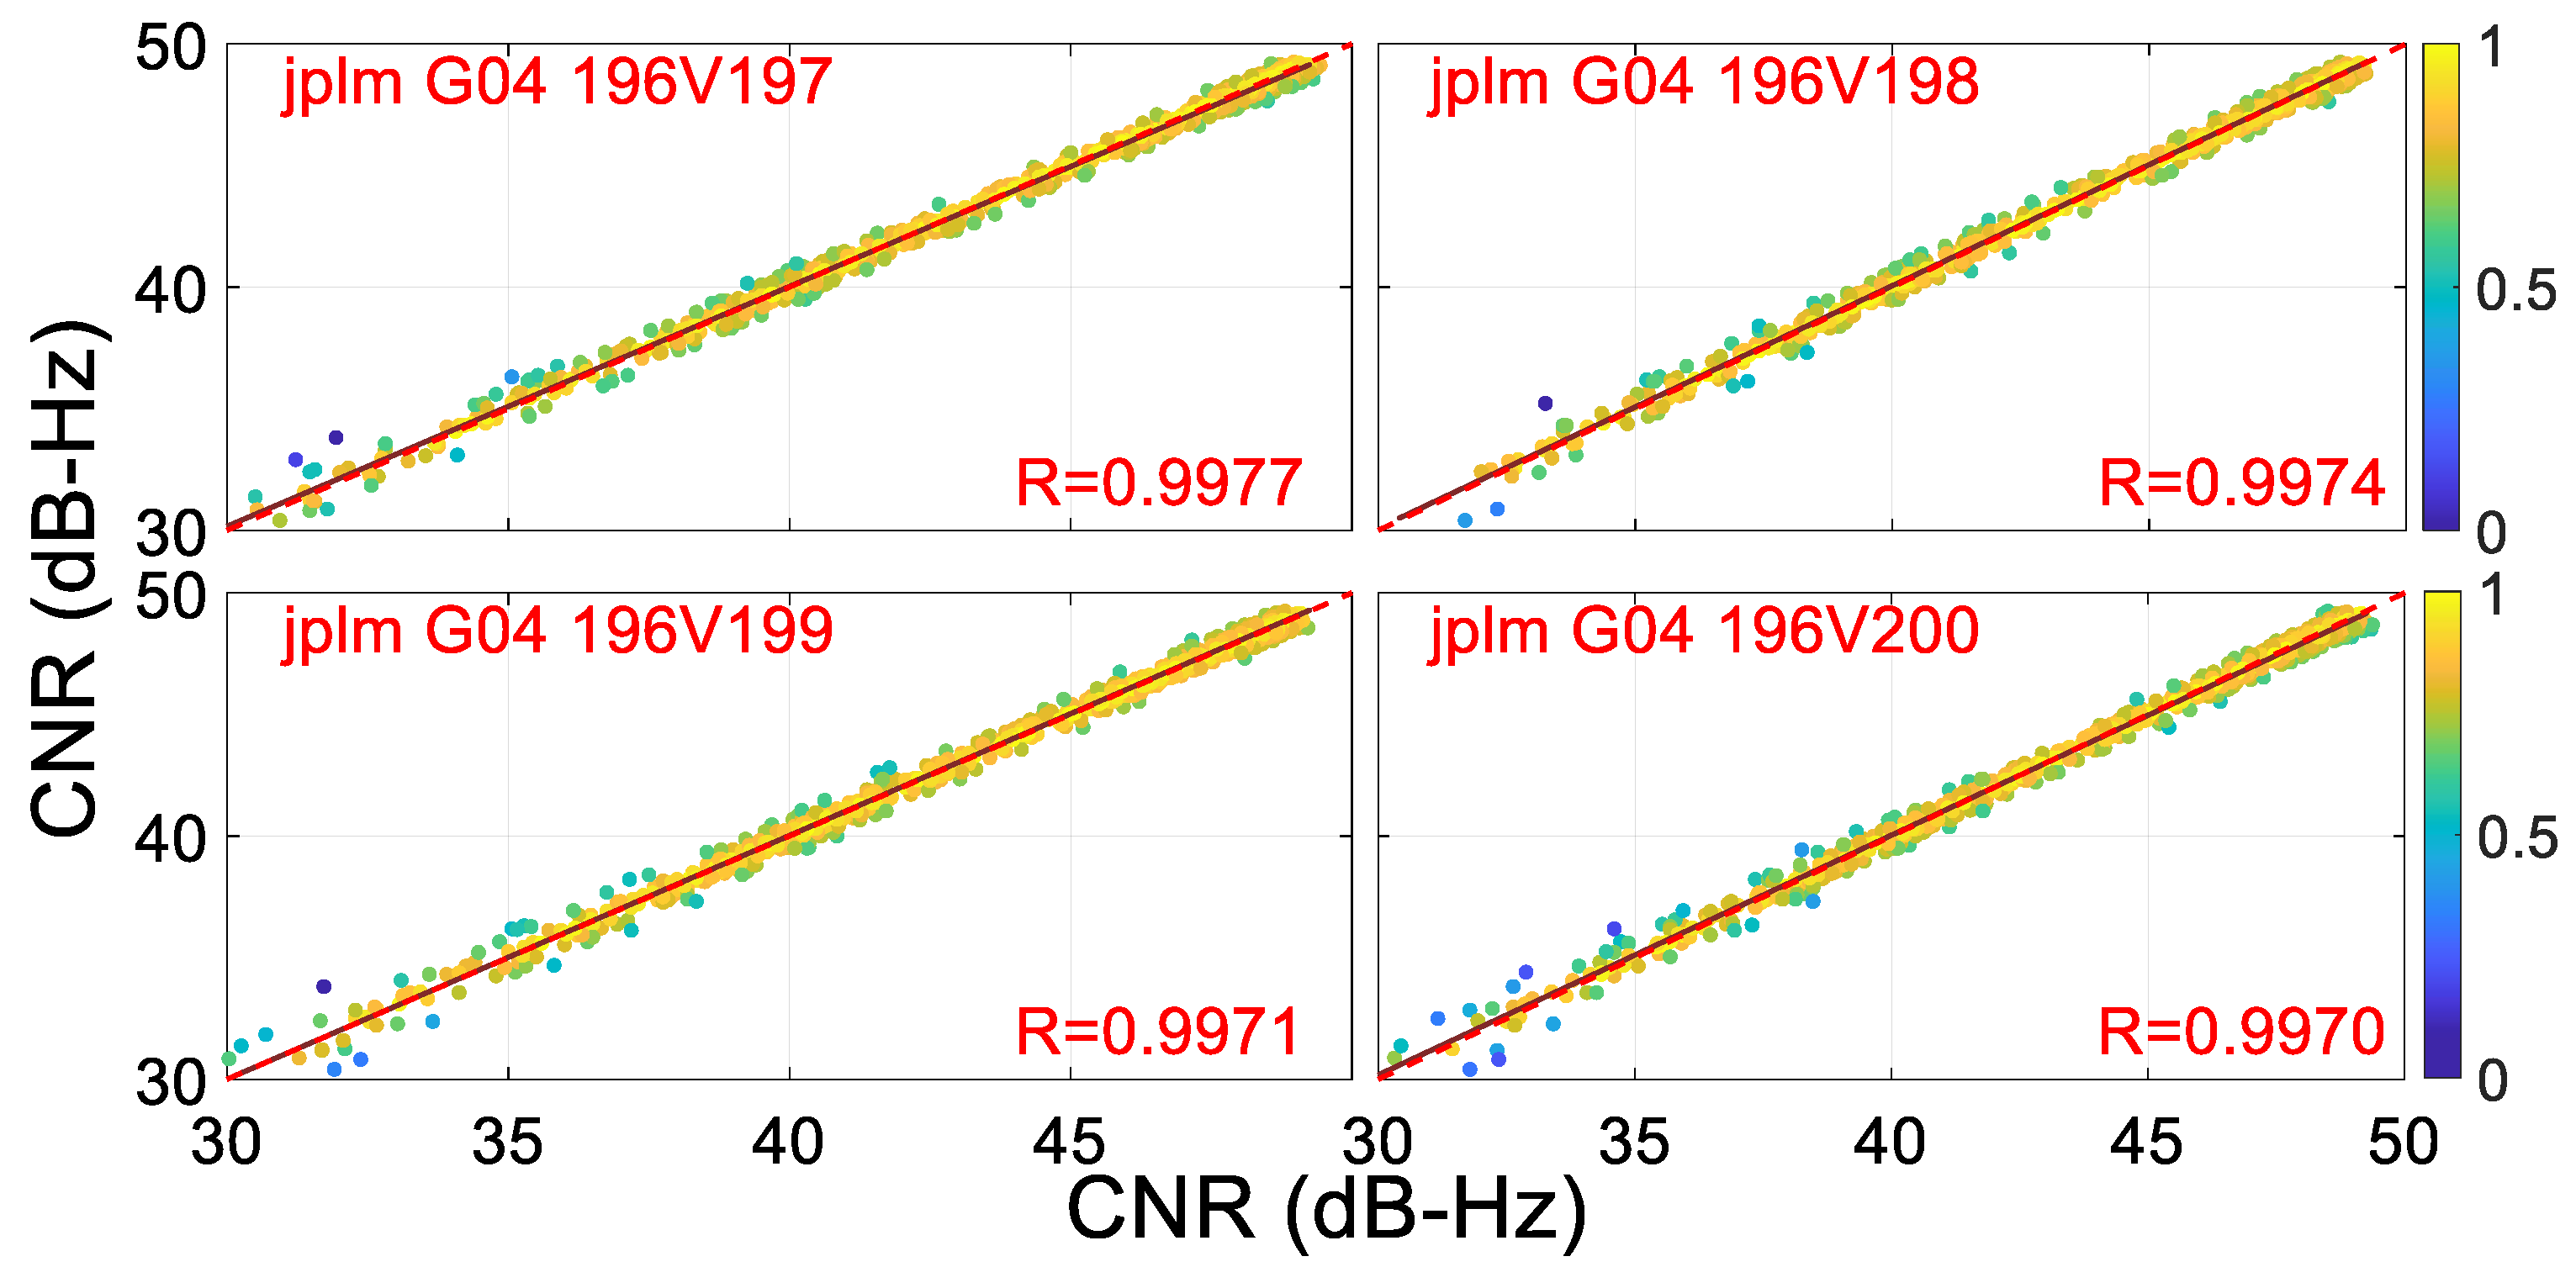
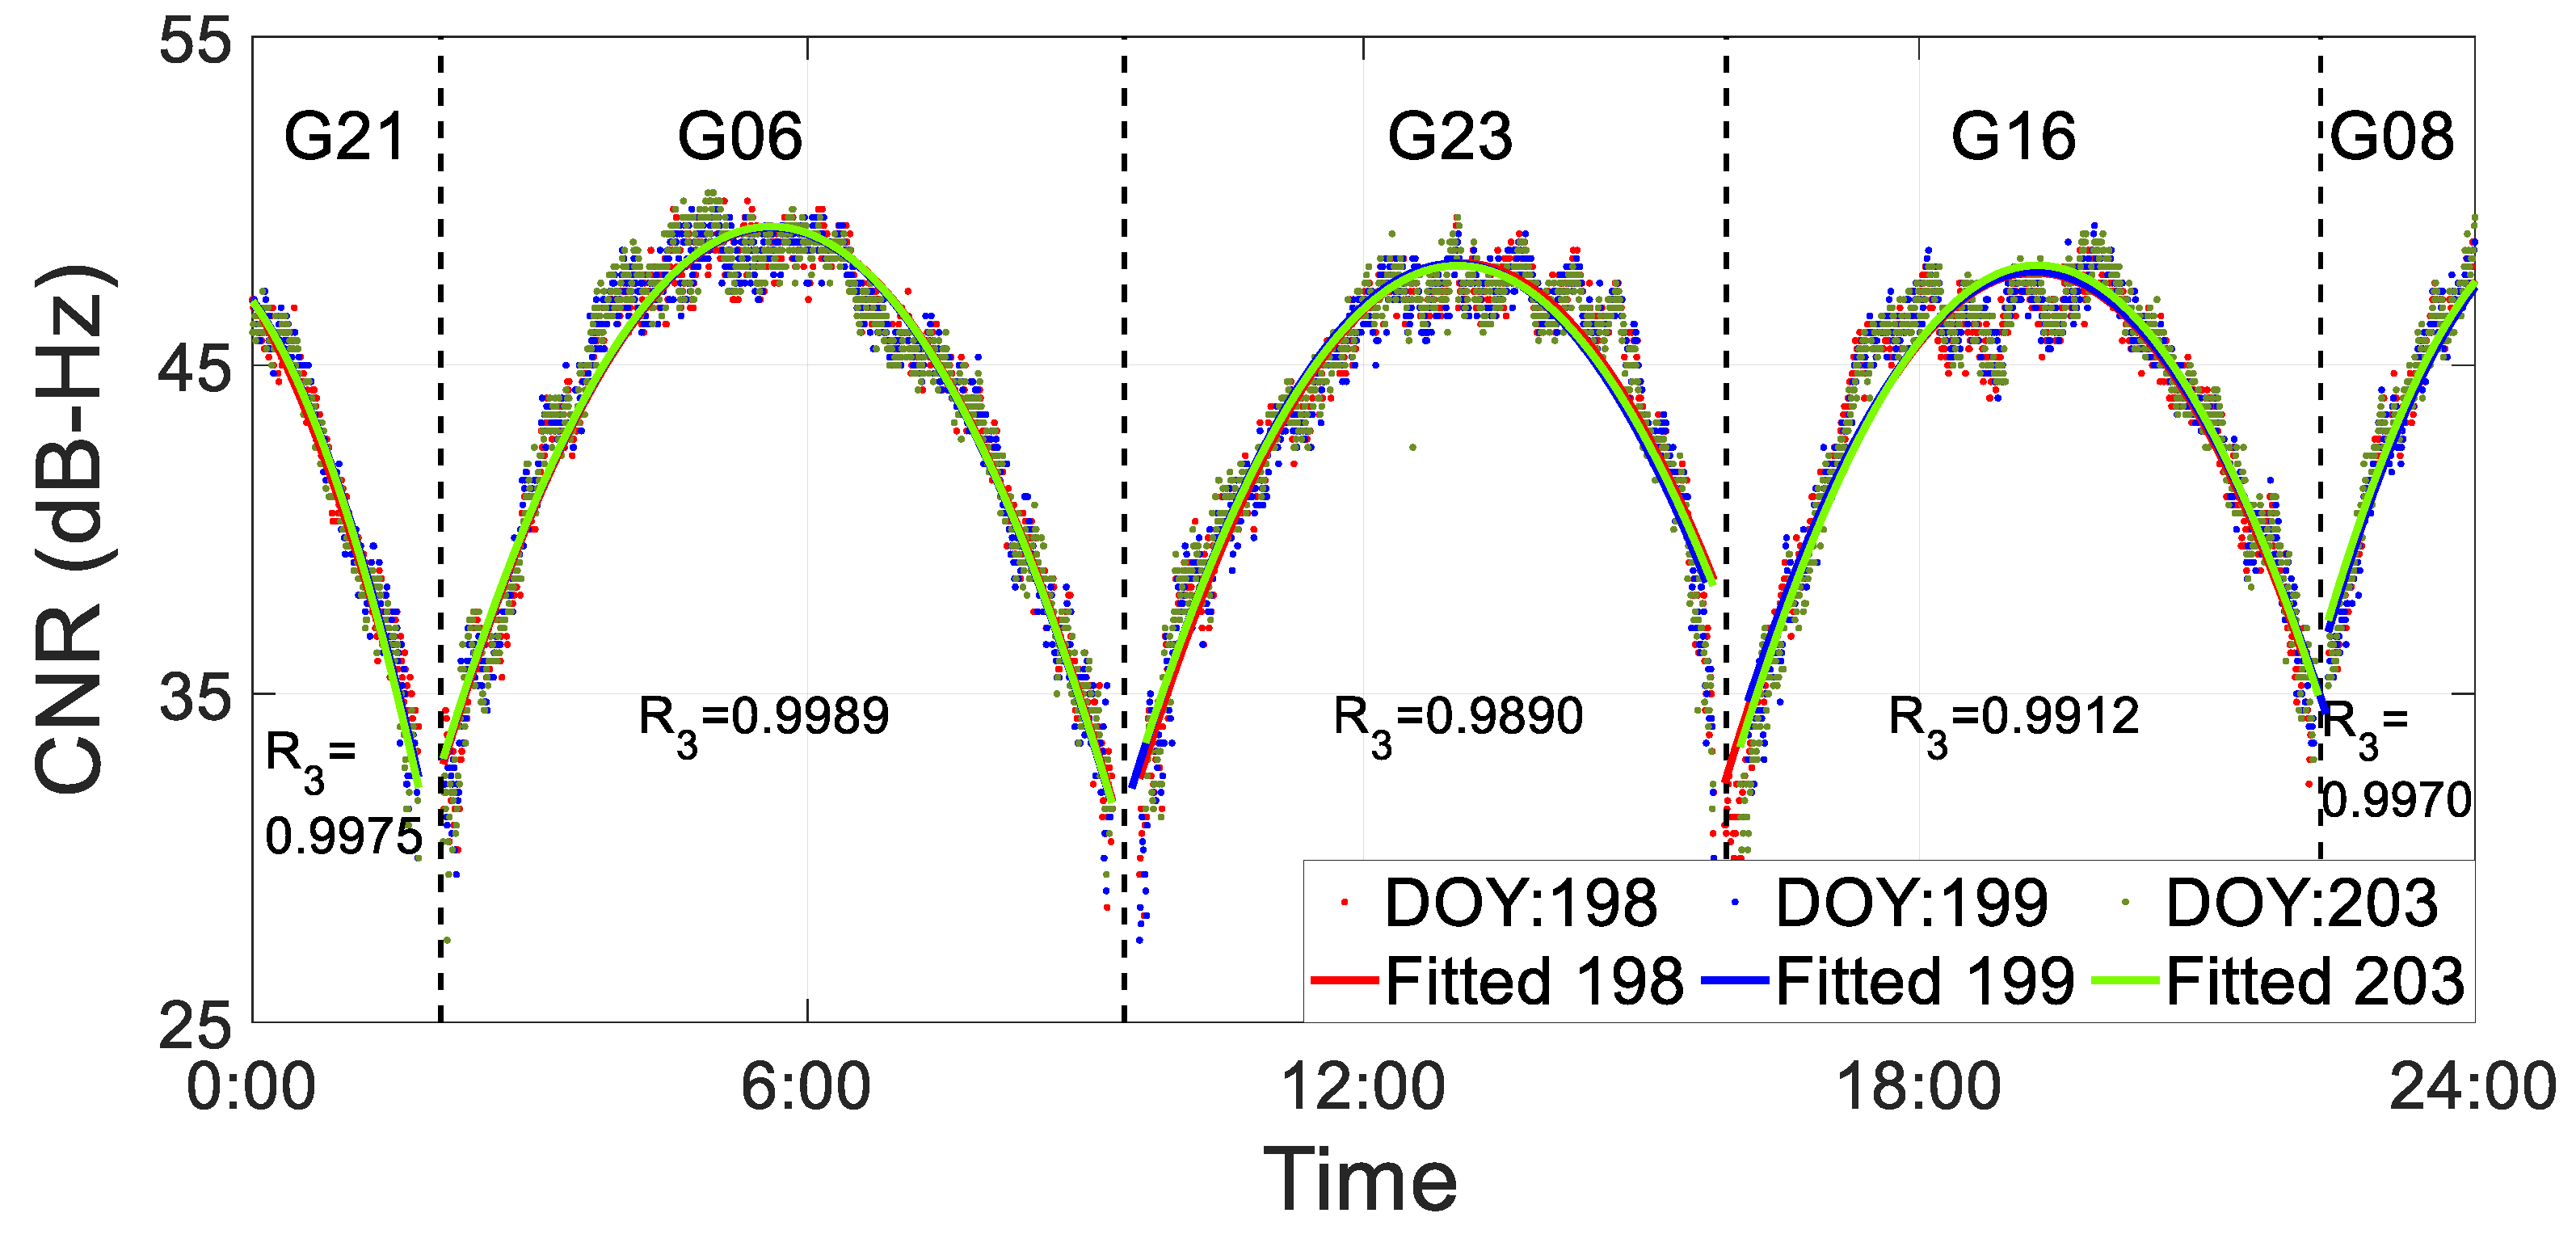
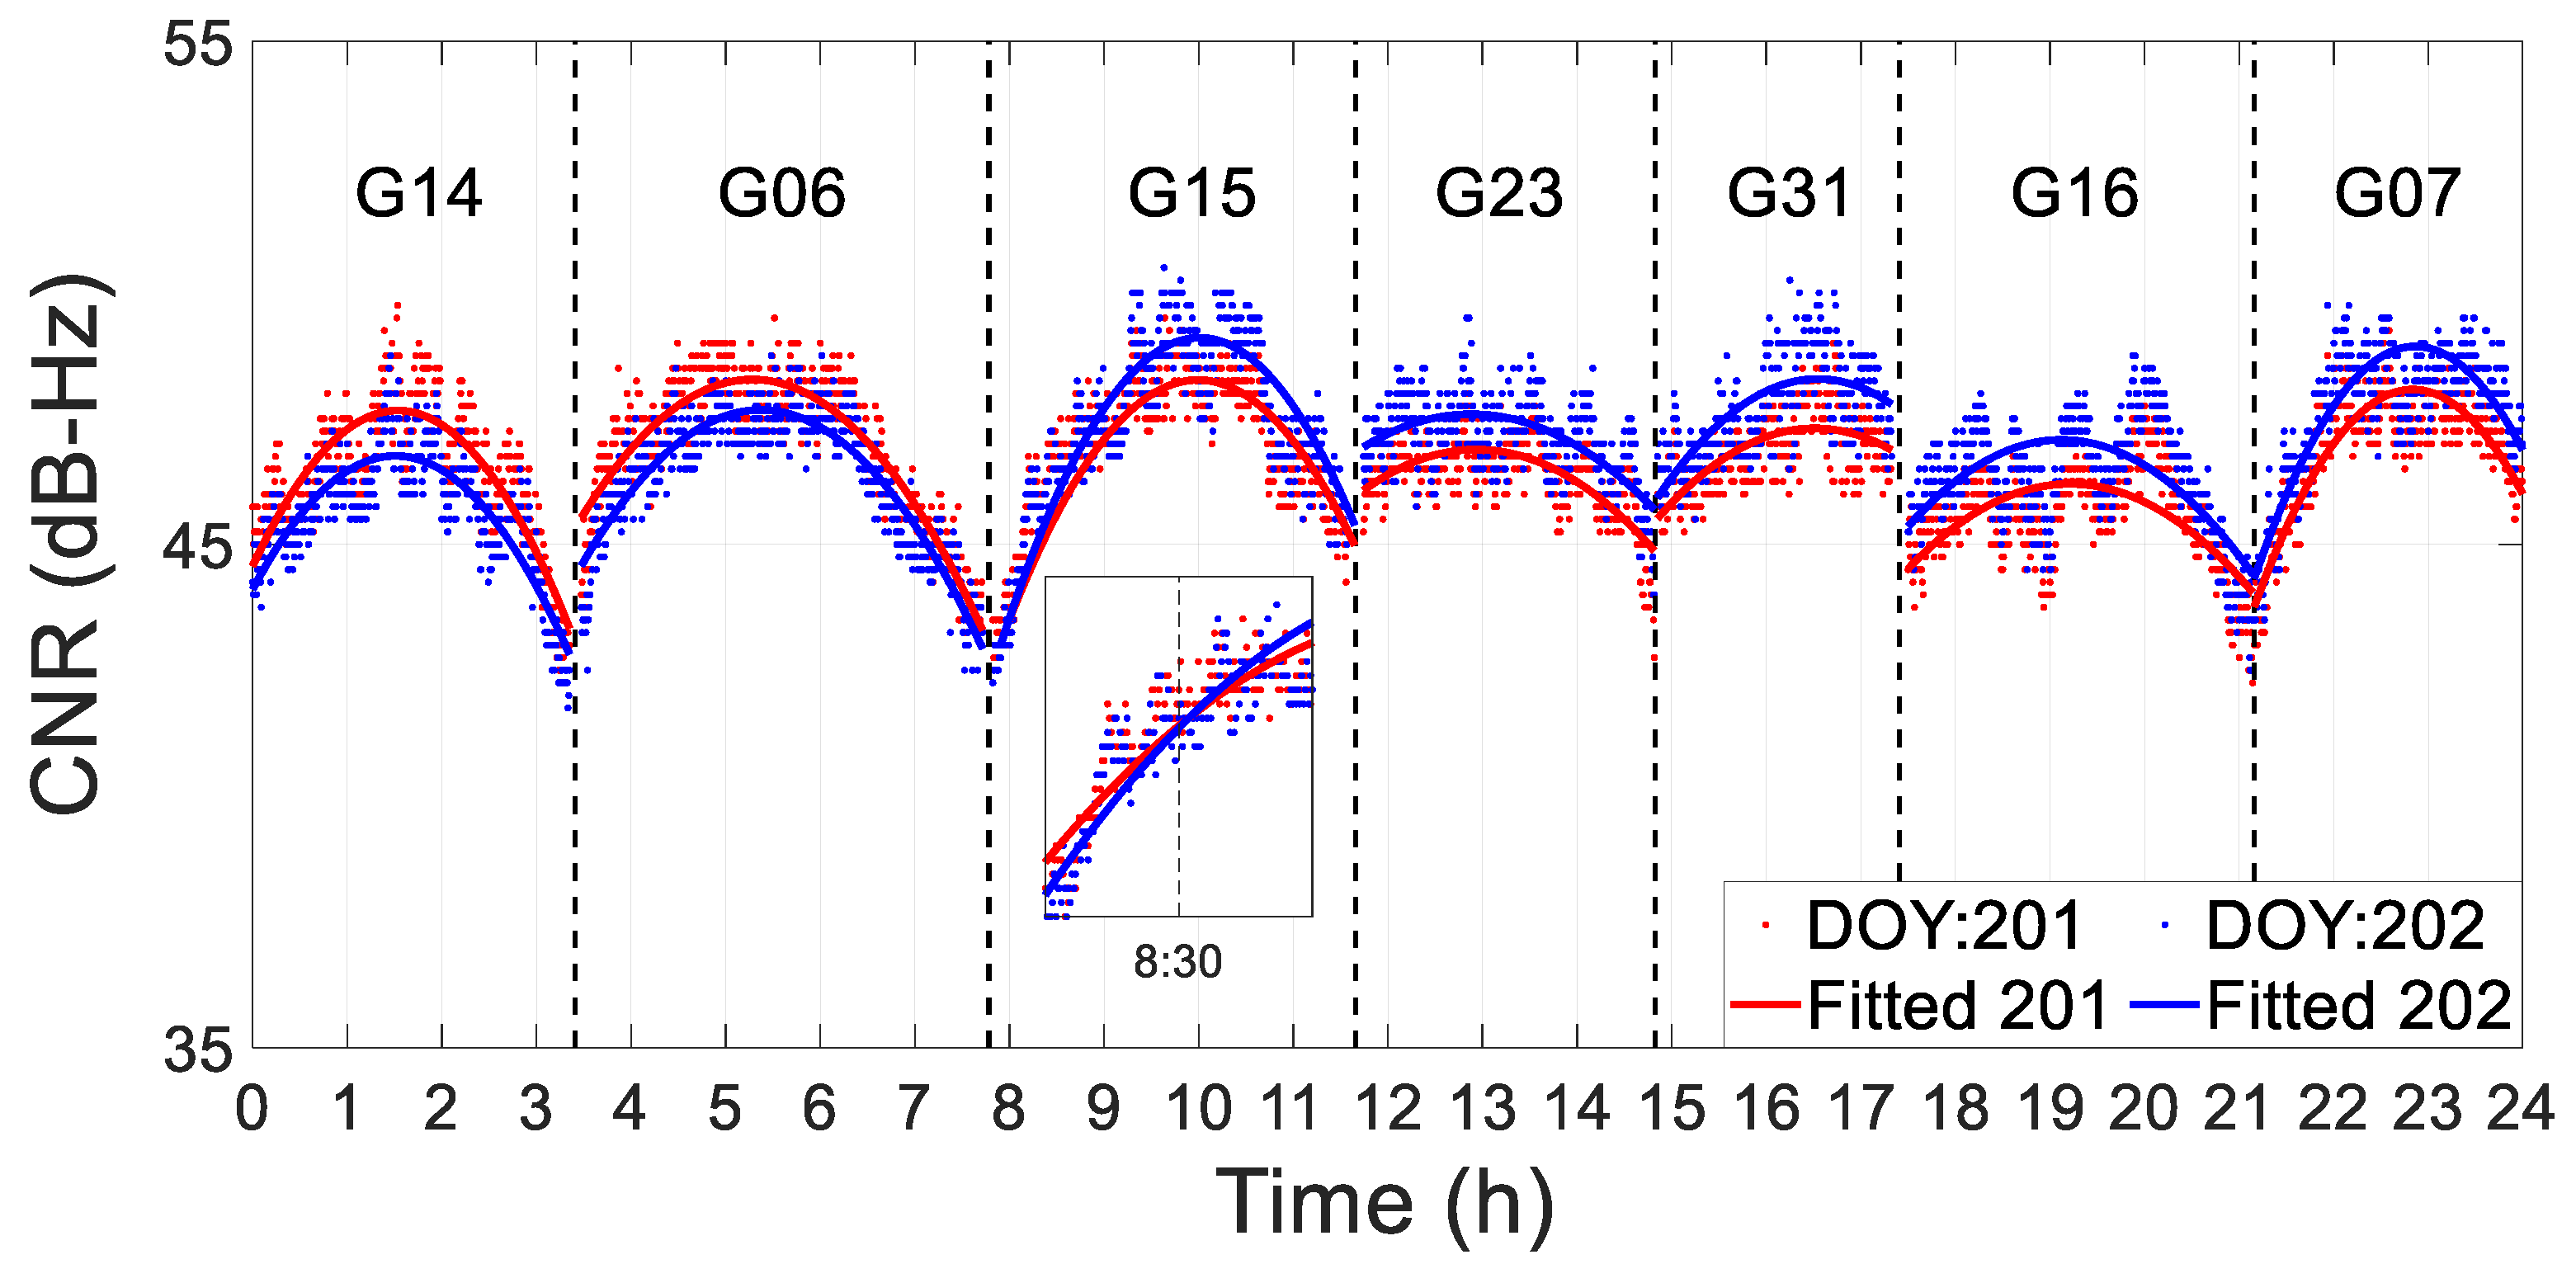
3.2. Stability Analysis of Fitted CNR

Although the original CNR exhibits stability on adjacent days, it is still affected by random noise, especially at the low satellite elevation angle. Thus, the fitted CNR was extracted by adopting a third-order polynomial fitting method to improve the stability of CNR. In addition, in order to evaluate the stability of the fitted CNR with a direct signal, the data sets presented in the above section were still used.
In Figure 7, the results of fitted CNRs at different stations and satellites on DOY 200 (blue dots) and DOY 201 (red dots), 2021 are demonstrated. From Figure 7, it is obvious that the fitted CNR with a direct signal performs much more consistently than the original CNR. The blue and red lines are almost exactly overlapping each other. The correlation coefficient of the CNRs between them is presented by R. It is obvious that all of the coefficients can reach approximately 0.99, which is a slightly better performance than the original CNR. However, it is worth noting that the bias between them can also be observed, especially for the CNRs for which amplitude was lower than 40 dB-Hz. This phenomenon is similar to Figure 6. Thus, to mitigate the influence of this bias, only the CNR with an amplitude greater than 40 dB-Hz was used to retrieve the whole process of the flood.

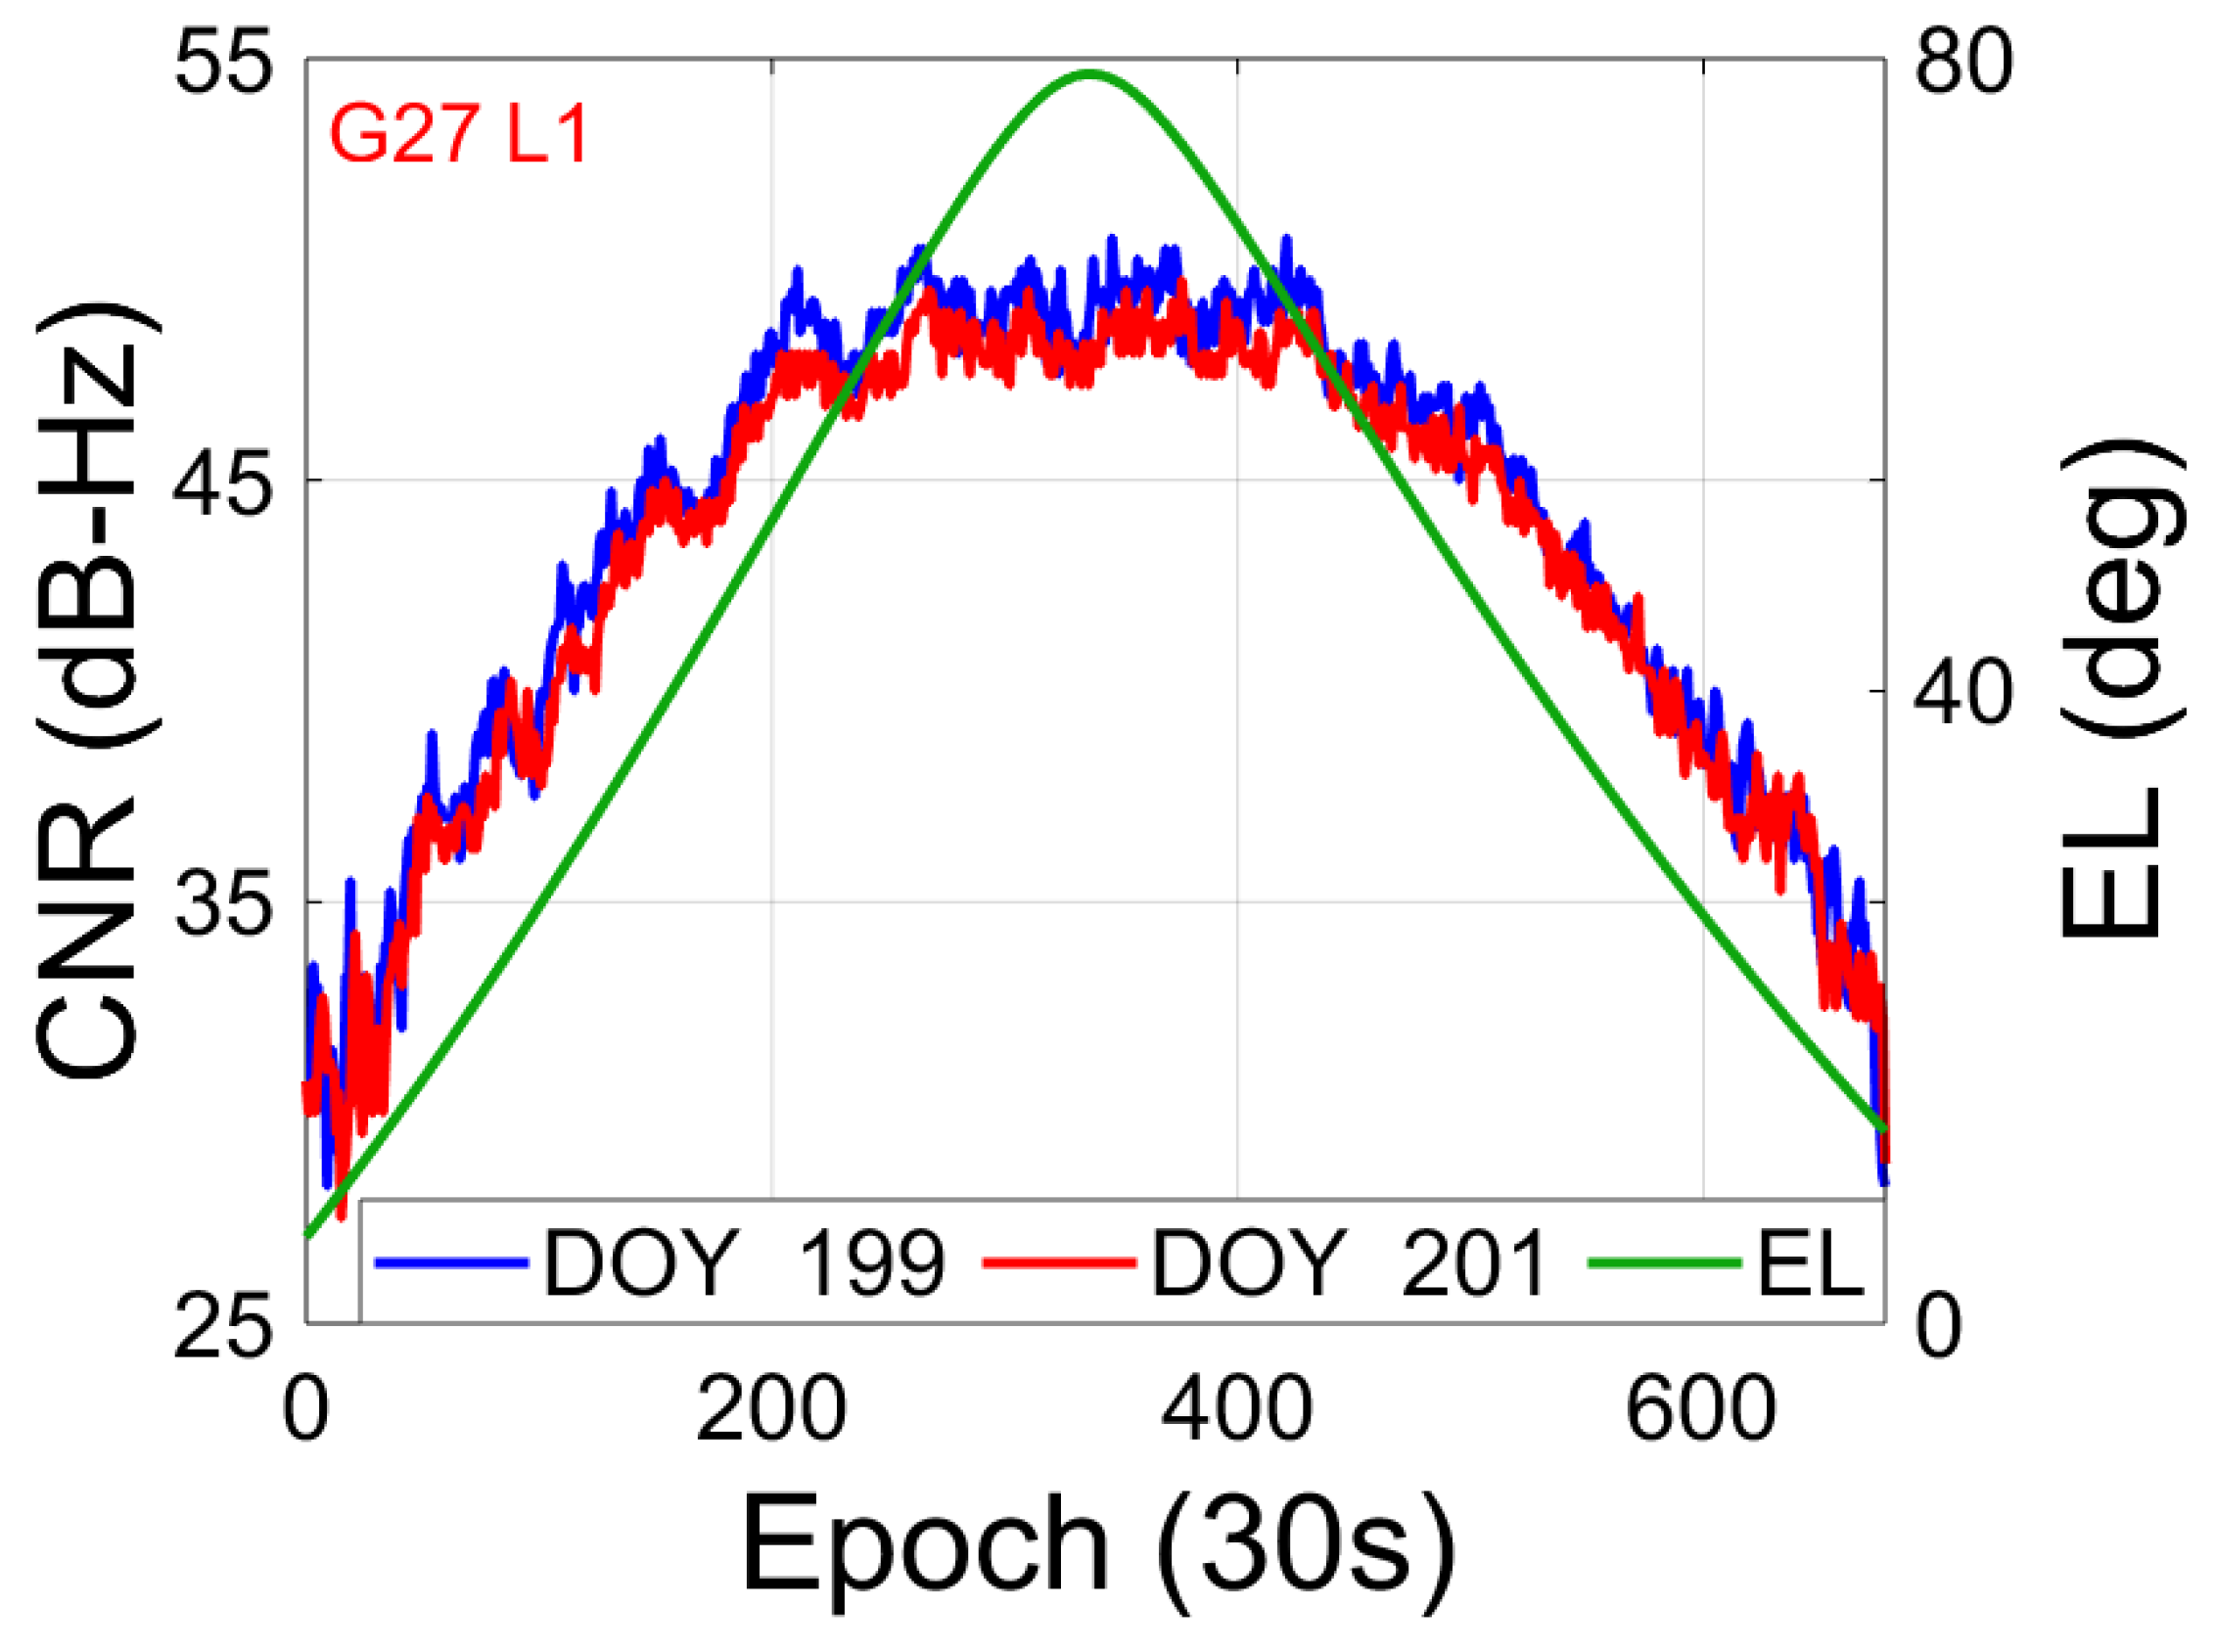
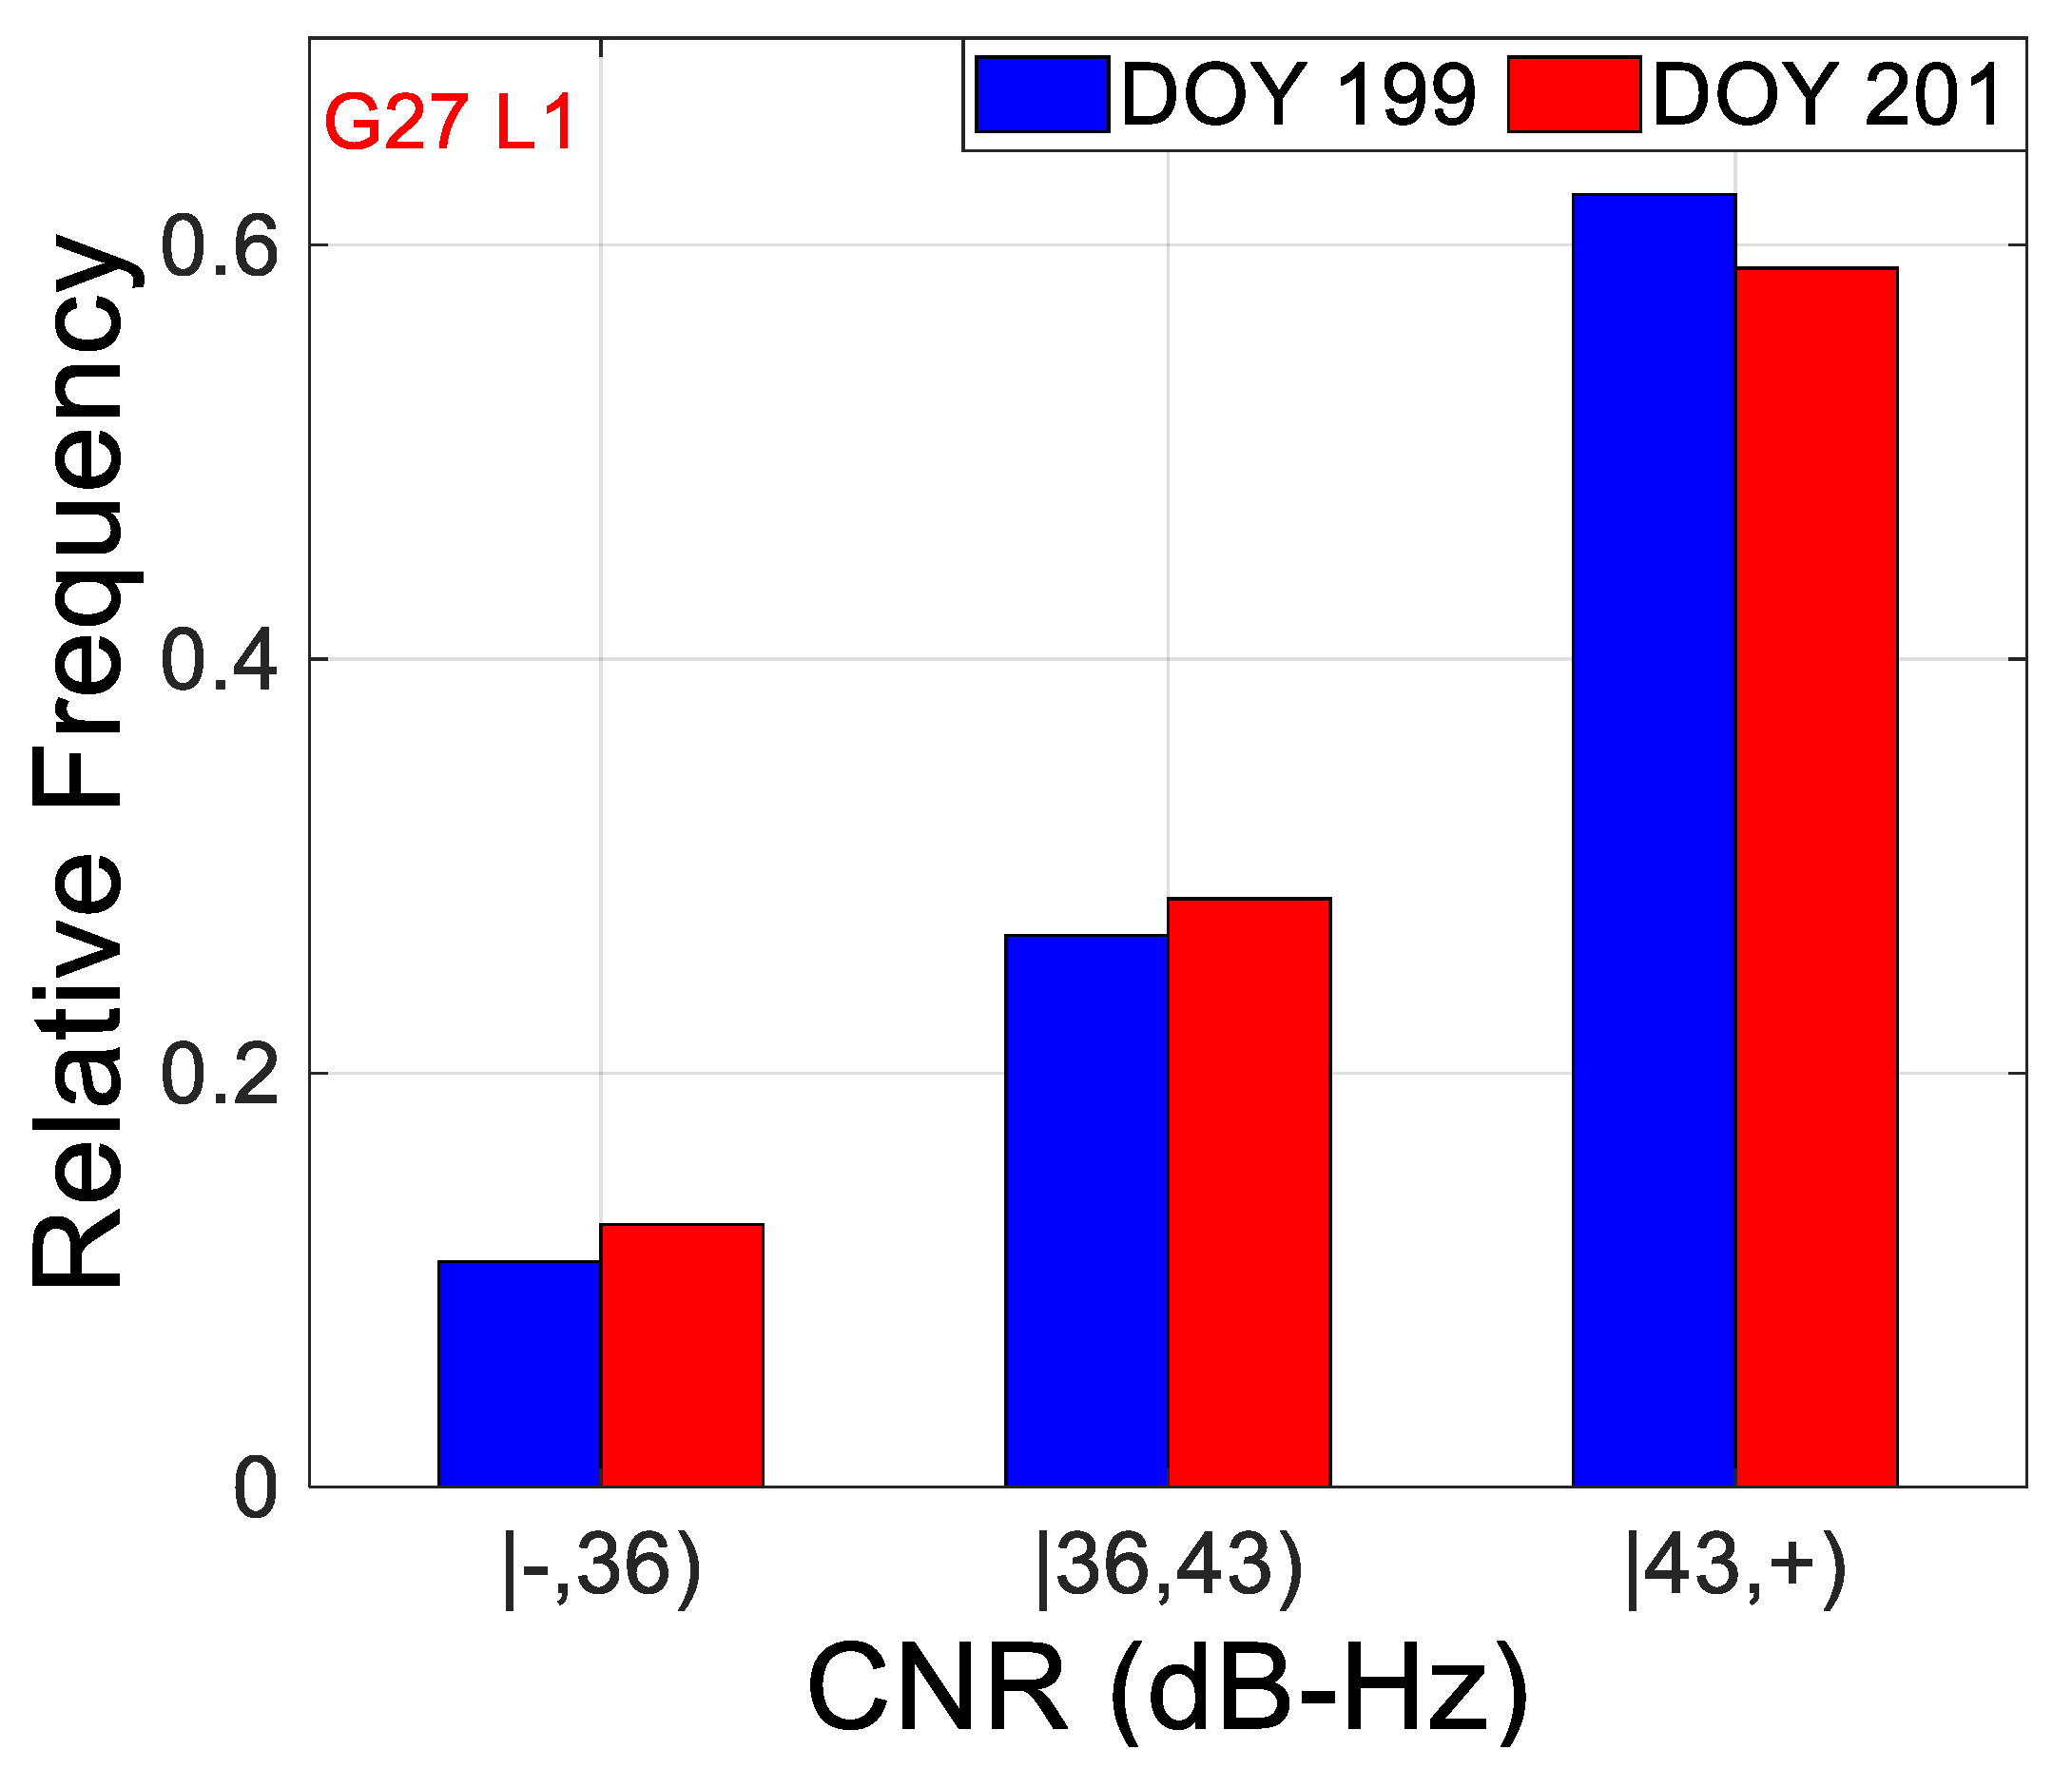
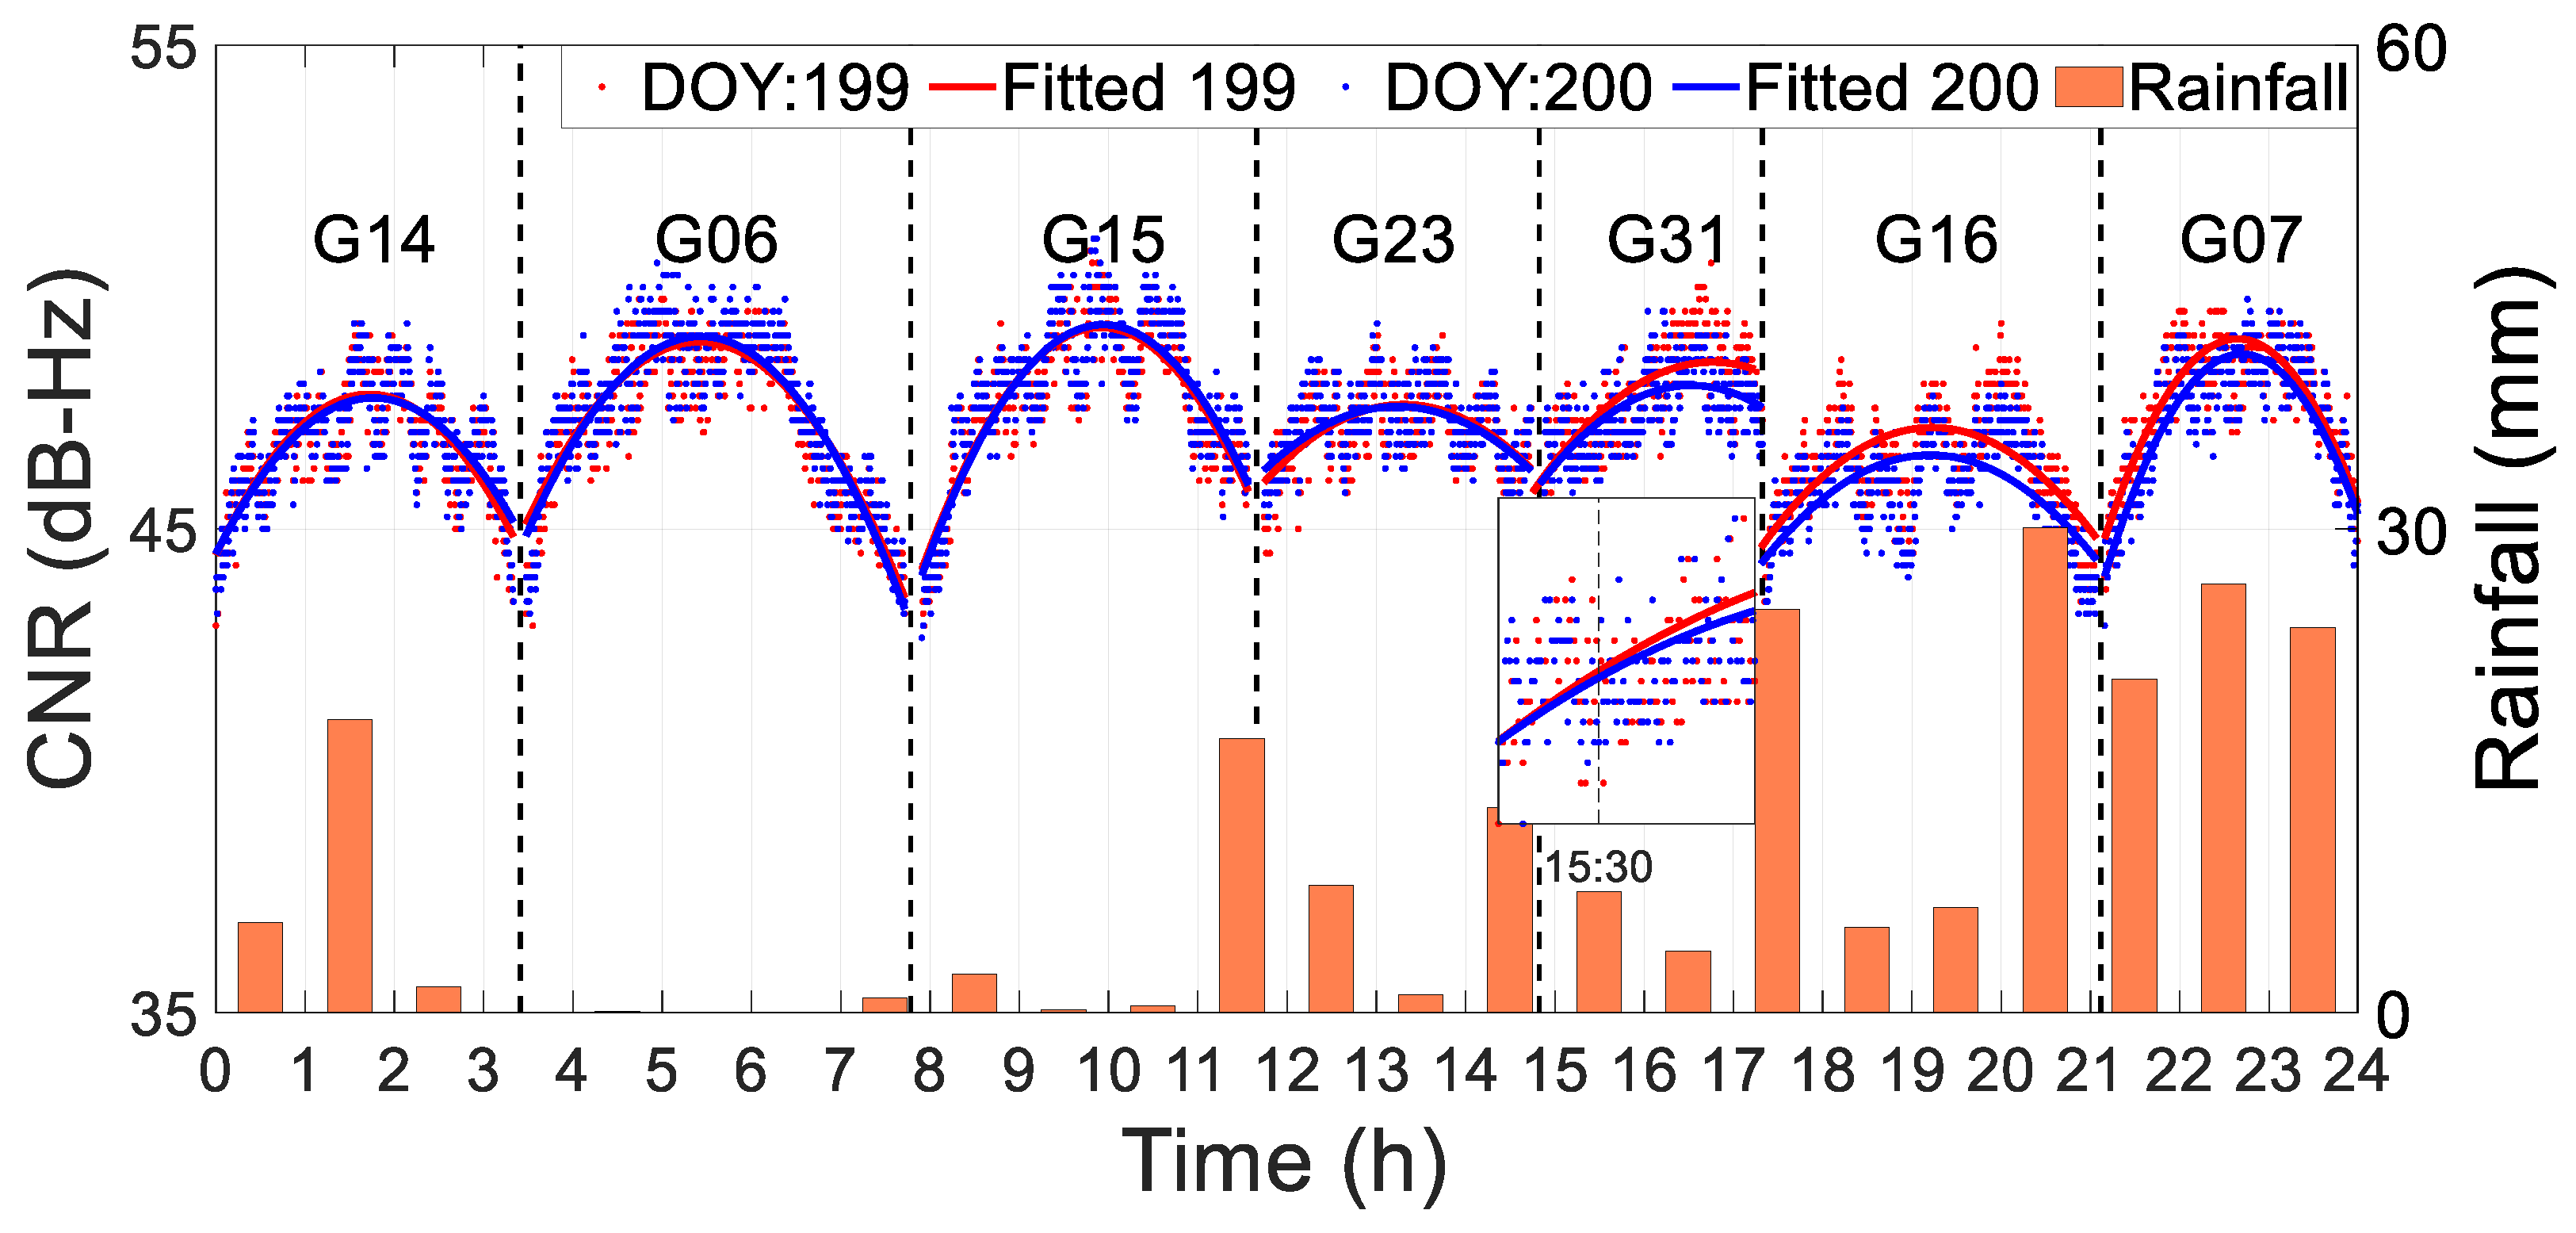
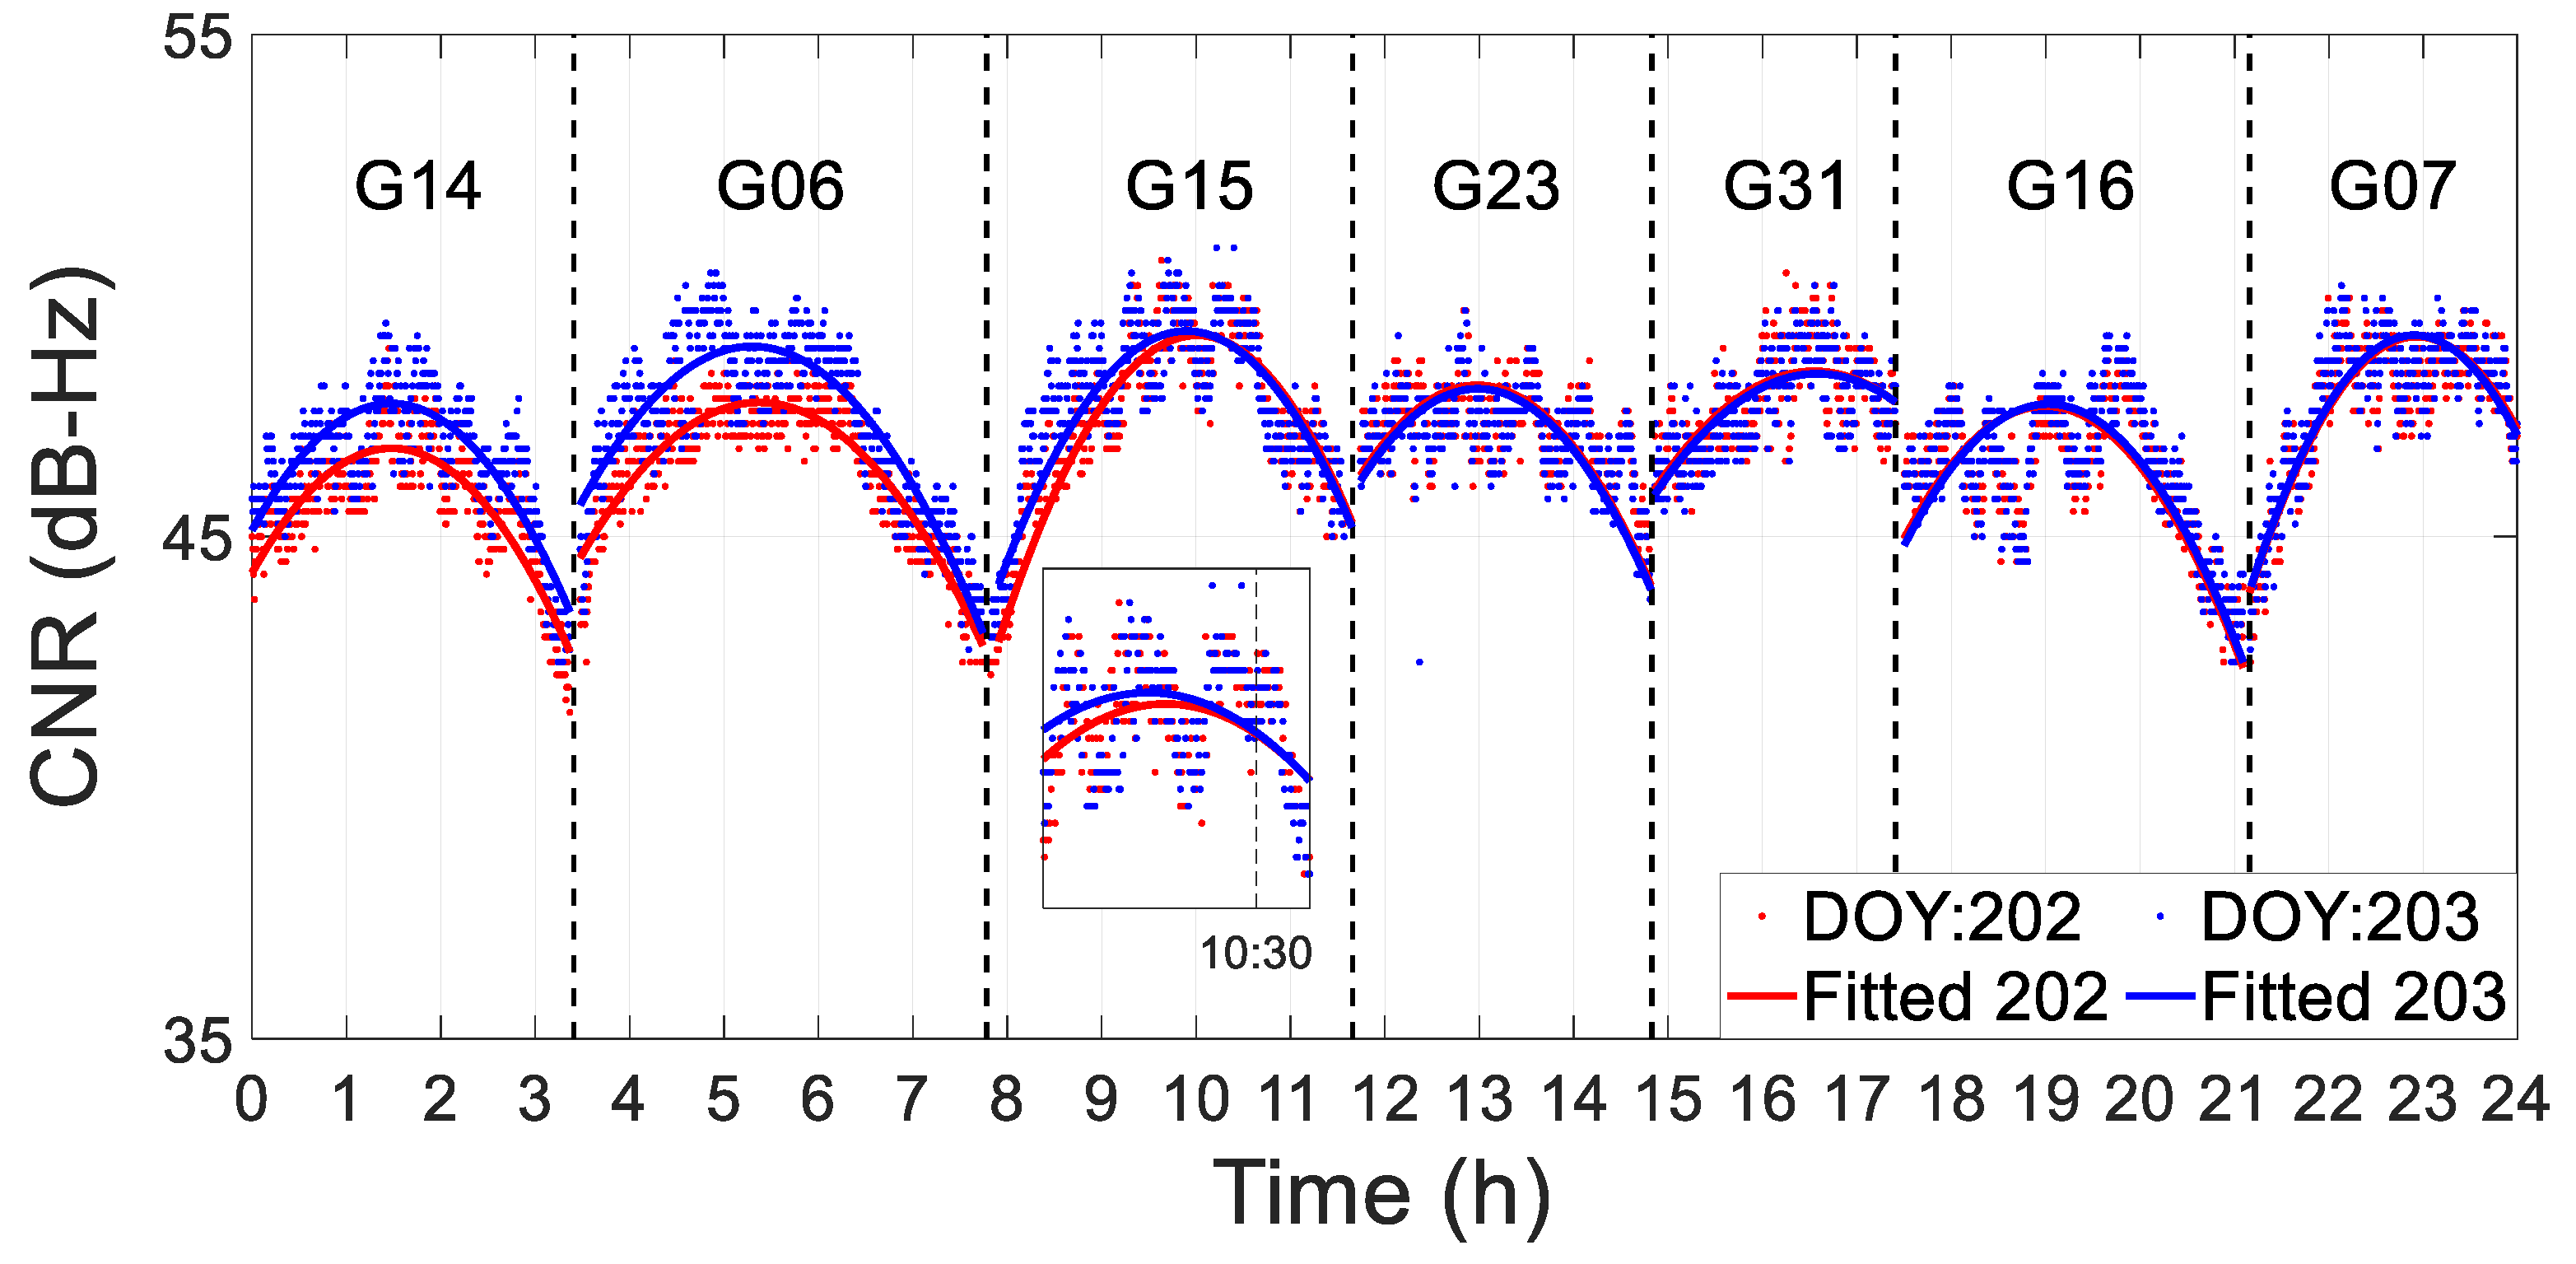
3.3. Influence Analysis of Flooding on CNR

In order to demonstrate the effect of flooding on the CNR of GPS satellites, the data sets collected on DOY 199 and DOY 201, 2021 from ZHNZ station were used. ZHNZ station is located in Zhengzhou City, China. It was influenced by a flood from DOY 200 to DOY 202, 2021. The sample interval was 30 s. The elevation cut-off angle was 5 deg. Concrete information about the flood is available in Su et al. [20].
The CNR of the GPS G27 satellite at L1 and L2 frequency is presented in Figure 8 and Figure 9, respectively. The blue line means the CNR of DOY 199, 2021, and there is no flood on this day. The red line denotes the CNR of DOY 201, 2021, and there is a flood on this day. The green line denotes the elevation angle. From Figure 8 and Figure 9, it is obvious that the CNR of DOY 201 performs significantly worse than the CNR of DOY 199, 2021, and the decrease increases as the satellite elevation angle increases. Thus, the CNR of the G27 satellite at the low satellite elevation angle is hardly affected. The reason for this phenomenon is that the multipath error at the low satellite elevation angle is larger than that at the high satellite elevation angle in the normal environment; thus, it is relatively less affected during the flood.
Moreover, the histogram of CNR and relative frequency of G27 satellite on L1 frequency is demonstrated in Figure 10. Based on the range of CNR values, three categories are used to divide the CNR. From Figure 10, it can be found that the CNR lower than 43 dB-Hz on DOY 199 is more less compared to DOY 201, 2021. On the contrary, the CNR larger than 43 dB-Hz on DOY 199 is more than that of DOY 201. This phenomenon indicates that the CNR of DOY 201 performs decrease during the flood. Thus, based on the results of Figure 10, it can be concluded that the CNR of GPS satellite will decrease under the influence of flood.
In addition, it should be pointed out that the above phenomenon not only appeared for the GPS G27 satellite at L1 frequency but can also be observed in other satellites and frequencies. In addition, the CNR of other GNSS satellites, such as GLONASS satellites, is also seriously affected during flooding [27]. Moreover, the decrease in the CNR during the flood is not caused by other aspects, such as rain, receiver hardware, satellite malfunction, etc. The above conclusions have been investigated in depth by Su et al. [20]. In conclusion, the effect of flooding on the CNR of the GPS signal is significant. Thus, it is feasible to retrieve the whole flood process by using the fluctuation in CNR.

3.4. Summary of the Proposed Method

From the above analysis, we can conclude that the CNR is consistent in the normal environment, but it will decrease during flooding. Thus, the whole flood process can be retrieved by using the fluctuation in CNR and the seamless series analysis method.
The process steps of the proposed method can be concluded as follows: (1) Extract the original CNR, which was collected during the flood, from the observation file in RINEX format. (2) Mitigate the random noise by using the wavelet transform denoise method (for the concrete method, refer to Su et al. [26]). (3) Extract the fitted CNR from the denoised original CNR by applying a third-order polynomial fitting method (for the method, refer to Su et al. [18]). (4) Select the appropriate original denoised and fitted CNR by threshold or elevation angle. For example, only a CNR larger than 40 dB-Hz or a satellite elevation angle larger than 45 deg can be used. (5) Determine the satellites used to retrieve the flood by the satellite ground track repeat period; the satellites should cover whole days as much as possible. (6) Retrieve the rough process of the flood based on all CNRs and seamless series characteristics. (7) Retrieve the accurate whole flood process based on the fitting of selected CNRs and the seamless series analysis method. The flowchart of the proposed method is presented in Figure 11.

4. Experiment Results and Analysis

The data sets collected at ZHNZ station from DOY 198 to DOY 203, 2021 are used to evaluate the proposed method. During these days, a flood occurred from DOY 200 to DOY 202. The GPS observation station (34.5°N, 113.1°E), which is located in Zhengzhou City in Henan Province, was affected during the flood. The sample interval of the data set is 30 s. The elevation cut-off angle is 10 deg. The GNSS receiver is set on an observation pier above 3 m of the ground, thus the receiver is not affected by the flood. Information about the flood can be found on the following website by searching the keywords: https://view.inews.qq.com/k/20210721A07DRD00?web_channel=wap&openApp=false&autoopenapp=ampzkqw&pgv_ref=amp (accessed on 20 July 2021).

4.1. Retrieve the Rough Process of the Flood by Using All Original CNRs

In order to demonstrate that the original and fitted CNRs are consistent before and after the flood, the original and fitted CNRs on DOY 198 (blue), DOY 199 (red), and DOY 203 (green) are presented in Figure 12. The original and fitted CNRs are denoted by dots and lines, and this convention applies to all the following figures. Five satellites are selected to cover the whole day. It can be seen that the trends of the original and fitted CNRs on these three days are almost the same as each other. Although some epochs are different from each other at low elevation angles, this is mainly caused by random noise. The average correlation coefficient of fitted CNRs between these three days is also demonstrated, which is denoted by R3. It can be found that the R3 of all these satellites is nearly 0.99, which further verifies the consistency. In conclusion, the surrounding environment of the observation station is similar and stable for these three days. Thus, it can be used as a reference since all of these three days are not affected by the flood.
In Figure 13, the results of the original and fitted CNRs on DOY 199 and DOY 200, 2021 are demonstrated. The red dots and blue dots mean the original signal CNR of DOY 199 and DOY 200, 2021. The red line and blue line denote the fitted CNR of DOY 199 and DOY 200, 2021. Five satellites cover the whole day. Based on the fitted CNR, it is obvious that the CNR decreases after 16:00 pm on DOY 200. Prior to this time, the original and fitted CNRs on the G21, G06, and G23 satellites are almost the same as each other. Thus, it can be retrieved that the flood first occurred in the afternoon of the DOY 200, 2021. This conclusion can be verified in Figure 14, which demonstrates the results of a consistency analysis of the CNRs of the original and direct signals on DOY 200 and DOY 201, 2021. In addition, it is obvious that the CNRs of G21, G06, and G23 on DOY 200 are larger than on DOY 201, 2021. However, the CNRs of G16 and G08 are almost the same as each other. Therefore, the above results demonstrate that the flood occurred on DOY 200 and extended to DOY 201.
Figure 15 demonstrates the original and fitted CNRs of DOY 201 and DOY 202, 2021. Since it is confirmed that there exists a flood on DOY 201, the subsequent fluctuation in the flood can be directly obtained by comparing DOY 201 with DOY 202. From Figure 15, it is clear that the CNR of DOY 201 on the G06 satellite is larger compared to DOY 202, 2021. This indicates that the effect of flooding on the CNR for DOY 202 is larger than that for DOY 201, and this means that the flood on DOY 202 is more serious than on DOY 201 at this stage. In addition, it can also be found that the CNR of DOY 201 on the G23, G16, and G08 satellites is lower compared to on DOY 202, 2021. This phenomenon shows that the flood begins to subside compared with the morning on DOY 202. Thus, it can be concluded that the flood peak appeared on the morning of DOY 202.
It is worth noting that the above analysis can only retrieve a rough trend of the flood since all of the CNRs are used in the process of retrieval. As is well known, the CNR at low elevation angles is largely affected by random noise, and this will reduce the sensitivity of CNR to the change in the surrounding environment.

4.2. Retrieve the Accurate Process of Flood by Selected CNR

To mitigate the effect of the lower CNR and the high-frequency random noise, only CNRs larger than 40 dB-Hz or elevation angles larger than 45 deg are used to accurately retrieve the whole flood process. The original and fitted CNRs of DOY 199 and DOY 200, 2021 are presented in Figure 16. In Figure 16, the difference in CNRs between DOY 199 (red line and dots) and DOY 200 (blue line and dots) shows that they are almost the same as each other in the early stage, including for G14, G15, and G23. However, this situation changed on the G31 satellite, in which the CNR on DOY 199 is much larger than that on DOY 200 between 15:00 and 16:00. The accurate time can be clearly observed in the enlarged rectangular view in Figure 16, which is 15:30 pm on DOY 200. After that, this bias remained in the subsequent satellites, such as G16 and G07. This phenomenon indicates that the flood occurred approximately at 15:30 pm on DOY 200. In addition, the rainfall of DOY 200 is presented in Figure 16, which is denoted by the orange bar. It can be found that there is heavy rainfall before the flood. The total rainfall before the flood is approximately 76 mm, which directly leads to the flood. Therefore, the accurate time of the flood is retrieved by using the selected CNR of the direct signal.
To further track the situation of the flood, the results of the consistency analysis on the original and fitted CNRs on DOY 200 (red line and dots) and DOY 201 (blue line and dots), 2021 are demonstrated in Figure 17. The satellites used in Figure 17 are the same as in Figure 16. From Figure 16, it can be observed that the fitted CNR on DOY 201 is significantly lower than that on DOY 200. This phenomenon indicates that there are floods during the whole day of DOY 201. It should be pointed out that, by comparing the CNRs of the G16 and G07 satellites on DOY 201 and DOY 200, the flood on DOY 201 is more serious than that on the afternoon of DOY 200. However, these results cannot be observed in Figure 14 since the fitted result of all CNRs will be influenced by the lower CNR. Thus, this phenomenon indicates that it is necessary to use the larger CNR to accurately retrieve the flood.
The results of the original CNR on DOY 201 and DOY 202, 2021 are presented in Figure 18. It can be found that the fitted CNR of G14 and G06 on DOY 201 is larger than on DOY 202, but there is an inversion on G15. This phenomenon can be clearly observed in the enlarged rectangular view in Figure 18. Furthermore, this trend continued for the subsequent satellites, such as G23, G31, and G07. These results indicate that the flood reached a crest, compared with DOY 201, and the time was approximately 8:30 am on DOY 202. In addition, by combining Figure 18 and Figure 19, it can be found that the flood disappeared at 10:00 am on DOY 202. Since Figure 12 demonstrates that there is no flood on DOY 203, when the CNR of DOY 202 performs consistently with DOY 203, it means the flood has disappeared.
It should be pointed out that the critical point at which the CNR will be influenced by flooding has still not been determined, thus the time resolution of this method can only persist for about half an hour. In addition, the flood disappearance retrieved by this method only means that the water on the ground will not influence the CNR, but it does not mean that there is no water on the ground.

5. Conclusions

Taking advantage of the influence of flooding on GPS CNR, a new method to retrieve the whole flood process is proposed. The theory of the multipath effect and satellite ground track repeat period is presented, and the relationship between the multipath error and the CNR is introduced. In order to evaluate the feasibility and rationality of the developed method, real data sets collected from 32 MGEX stations distributed around the world are used. The orbital repetition period of the GPS on ground satellites is analyzed by skyplot. The stability of original GPS and fitted signal CNR is demonstrated. The results show that the average RMS of the original CNR difference between two adjacent days is approximately 0.62. In terms of fitted CNR, the coefficients between two adjacent days can reach approximately 0.99. Thus, the flood can be retrieved by using the fluctuation in CNR between two adjacent days.
Real data sets collected during the flood in Zhengzhou City, China, were adopted to evaluate the performance of the developed method. Experimental results indicate that the rough flood process can be effectively retrieved by using all original and fitted CNRs. The flood appeared on DOY 200 and reach a peak on DOY 202. However, the accuracy of retrieval is influenced by CNR at a low elevation angle since the random noise is more serious at a low satellite elevation angle. Thus, to retrieve the accurate process of the flood, only CNRs larger than 40 dB-HZ or elevation angles larger than 45 deg were used. By comparing the fitted CNRs of two adjacent days, it can be found that the flood started at 15:30 pm on DOY 202 and reached a crest at approximately 8:30 am on DOY 202. After that, the flood disappeared at 10:00 am on DOY 202. However, how to find the critical point at which the CNR will be influenced by flooding, and improve the time resolution of the retrieval, should be further studied.

Author Contributions

Z.T. worked out technical details. M.S. proposed the idea and wrote the main manuscript. J.S. designed the experiments. J.W. and X.S. drew the figure. X.C. and F.Z. provided the data set. All authors have read and agreed to the published version of the manuscript.

Funding

This research was supported by Zhejiang Provincial Natural Science Foundation of China. The founder is Mingkun Su. The funding number is No. LQ22D040001.

Data Availability Statement

The data set used in this study is collected from the Infrastructure of National Earthquake Data Center, China. Readers in China can apply for the data set from the agency of Crustal Movement Observation Network of China on their own, and the website is: http://data.earthquake.cn, (accessed on 20 July 2021).

Acknowledgments

I (Mingkun Su) appreciated the author Zheng Fu for providing the data sets, and hope he can get married and settle down in the near future. Thanks to the author Zhifeng Tong, Juntao Wu, and Xiaoliang Shen for working out technical details and drawing the figure and hope they can pass the exam of postgraduate. I also want to appreciate my wife Yanxi Yang. Our wedding was postponed due to this flood, and thanks for her understanding and support. Finally, thanks to everyone who fights for the flood, and may there is no more floods in the world.

Conflicts of Interest

The authors declare no conflict of interest.

References

  1. Huang, M.; Jin, S. Rapid Flood Mapping and Evaluation with a Supervised Classifier and Change Detection in Shouguang Using Sentinel-1 SAR and Sentinel-2 Optical Data. Remote Sens. 2020, 12, 2073. [Google Scholar] [CrossRef]
  2. Zhang, H.; Qi, Z.; Li, X.; Chen, Y.; Wang, X.; He, Y. An Urban Flooding Index for Unsupervised Inundated Urban Area Detection Using Sentinel-1 Polarimetric SAR Images. Remote Sens. 2021, 13, 4511. [Google Scholar] [CrossRef]
  3. Alfieri, L.; Thielen, J. European precipitation index for extreme rain-storm and flash flood early warning. Met. Apps. 2015, 2, 3–13. [Google Scholar] [CrossRef]
  4. Ran, Y.; Li, X.; Jin, R.; Kang, J.; Michael, H. Strengths and weaknesses of temporal stability analysis for monitoring and estimating grid-mean soil moisture in a high-intensity irrigated agricultural landscape. Water Resour. Res. 2017, 53, 283–301. [Google Scholar] [CrossRef]
  5. Ge, Y.; Cao, X.; Lyu, D.; He, Z.; Ye, F.; Xiao, G.; Shen, F. An investigation of PPP time transfer via BDS-3 PPP-B2b service. GPS Solut. 2023, 27, 61. [Google Scholar] [CrossRef]
  6. Hu, Q.; Yang, D.; Li, Z.; Mishra, A.; Wang, Y.; Yang, H. Multi-scale evaluation of six high-resolution satellite monthly rainfall estimates over a humid region in China with dense rain gauges. Int. J. Remote Sens. 2014, 3, 1272–1294. [Google Scholar] [CrossRef]
  7. Tripathi, S.; Venkata, S.; Nanjundiah, R. Downscaling of Precipitation for Climate Change Scenarios: A Support Vector Machine Approach. J. Hydrol. 2006, 330, 621–640. [Google Scholar] [CrossRef]
  8. Pan, B.; Hsu, K.; AghaKouchak, A.; Sorooshian, S. Improving Precipitation Estimation Using Convolutional Neural Network. Water Resour. Res. 2019, 5, 2301–2321. [Google Scholar] [CrossRef]
  9. Giustarini, L.; Hostache, R.; Matgen, P.; Schumann, G.; Bates, P.; Mason, D. A Change Detection Approach to Flood Mapping in Urban Areas Using TerraSAR-X. IEEE Trans. Geosci. Remote Sens. 2013, 51, 2417–2430. [Google Scholar] [CrossRef]
  10. Grimaldi, S.; Xu, J.; Li, Y.; Pauwels, V.; Walker, J. Flood mapping under vegetation using single SAR acquisitions. Remote Sens. Environ. 2020, 237, 111582. [Google Scholar] [CrossRef]
  11. Michael, S. Multipath. Springer Handbook of Global Navigation Satellite Systems; Teunissen, P., Montenbruck, O., Eds.; Springer: New York, NY, USA, 2017; pp. 443–468. [Google Scholar] [CrossRef]
  12. Su, M.; Yang, Y.; Qiao, L.; Ma, H.; Feng, W.; Qiu, Z.; Zheng, J. Multipath extraction and mitigation for static relative postitioning based on adaptive layer wavelet packets, bootstrapped searches, and CNR constraints. GPS Solut. 2021, 25, 123. [Google Scholar] [CrossRef]
  13. Cai, C.; Gao, Y.; Pan, L.; Dai, W. An analysis on combined GPS/COMPASS data quality and its effect on single point positioning accuracy under different observing conditions. Adv. Space Res. 2014, 5, 818–829. [Google Scholar] [CrossRef]
  14. Axelrad, P.; Comp, C.; Macdoran, P. SNR based multipath error correction for GPS differential phase. IEEE Trans. Aerosp. Electron. Syst. 1996, 32, 650–660. [Google Scholar] [CrossRef]
  15. Benton, C.; Mitchell, C. Isolating the multipath component in GNSS signal-to-noise data and locating refecting objects. Radio Sci. 2011, 46, RS6002. [Google Scholar] [CrossRef]
  16. Strode, R.; Groves, P. GNSS multipath detection using three-frequency signal-to-noise measurements. GPS Solut. 2016, 20, 399–412. [Google Scholar] [CrossRef]
  17. Zhang, Z.; Li, B.; Gao, Y.; Shen, Y. Real-time carrier phase multipath detection based on dual-frequency C/N0 data. GPS Solut. 2019, 23, 7. [Google Scholar] [CrossRef]
  18. Su, M.; Yang, Y.; Qiao, L.; Teng, X.; Song, H. Enhanced multipath mitigation method based on multi-resolution CNR model and adaptive statistical test strategy for real-time kinematic PPP. Adv. Space Res. 2020, 67, 868–882. [Google Scholar] [CrossRef]
  19. Tian, X.; Chai, H.; Xiang, M.; Yin, X.; Wang, M. The analysis and evaluation of the multipath error of the BDS marine measurement. Adv. Space Res. 2022, 71, 496–509. [Google Scholar] [CrossRef]
  20. Su, M.; Zheng, F.; Shang, J.; Qiao, L.; Qiu, Z.; Zhang, H.; Zheng, J. Influence of flood on GPS carrier-to-noise ratio and water content variation analysis: A case study in Zhengzhou, China. GPS Solut. 2023, 27, 21. [Google Scholar] [CrossRef]
  21. Larson, K.; Small, E.; Gutmann, E.; Bilich, A.; Axelrad, P.; Braun, J. Using GPS multipath to measure soil moisture fluctuations: Initial results. GPS Solut. 2008, 12, 173–177. [Google Scholar] [CrossRef]
  22. Larson, K.; Gutmann, E.; Zavorotny, V.; Braun, J.; Williams, M.; Nievinski, F. Can we measure snow depth with GPS receivers? Geophys. Res. Lett. 2009, 36, 1–5. [Google Scholar] [CrossRef]
  23. Larson, K.; Loefgren, J.; Haas, R. Coastal Sea level measurements using a single geodetic GPS receiver. Adv. Space Res. 2009, 51, 1301–1310. [Google Scholar] [CrossRef]
  24. Rost, C.; Wanninger, L. Carrier phase multipath mitigation based on GNSS signal quality measurements. J. Appl. Geod. 2009, 3, 81–87. [Google Scholar] [CrossRef]
  25. Agnew, D.; Larson, K. Finding the repeat times of the GPS constellation. GPS Solut. 2007, 11, 71–76. [Google Scholar] [CrossRef]
  26. Su, M.; Zheng, J.; Yang, Y.; Wu, Q. A new multipath mitigation method based on adaptive thresholding wavelet denoising and double reference shift strategy. GPS Solut. 2018, 22, 40. [Google Scholar] [CrossRef]
  27. Su, M.; Xin Chang Zheng, F.; Shang, J.; Qiao, L.; Teng, X.; Sun, M. Theory and Experiment Analysis on the Influence of Floods on a GNSS Pseudo-Range Multipath and CNR Signal Based on Two Cases Study in China. Remote Sens. 2022, 14, 5874. [Google Scholar] [CrossRef]
Figure 1. Geometric relationship between GPS satellite, receiver antenna, and surface of object for the multipath effect scenario.
Remotesensing 15 02316 g001
Figure 2. Distribution of 32 MGEX stations (red dots) used in this experiment.
Remotesensing 15 02316 g002
Figure 3. Results of ground track of 6 GPS satellites randomly selected from 32 MGEX observation stations. The blue and pink lines denote the DOY 200 and DOY 201, 2021, respectively.
Remotesensing 15 02316 g003
Figure 4. CNR of GPS satellites on two consecutive adjacent days at L1 frequency. The pink line is the difference in CNRs between these two days. The blue dots mean the CNR of DOY 200, 2021. The red dots mean the CNR of DOY 201, 2021.
Remotesensing 15 02316 g004
Figure 5. RMS of the CNR difference between two consecutive adjacent days for other satellites and stations at L1 frequency.
Remotesensing 15 02316 g005
Figure 6. Results of consistency analysis on CNR of jplm G04 satellite on several adjacent days. The R denotes the correlation coefficient of CNRs between the different days.
Remotesensing 15 02316 g006
Figure 7. Results of consistency analysis of fitted CNR of different stations and satellites on DOY 200 (blue dots) and DOY 201 (red dots), 2021. R is the correlation coefficient of CNRs between these two days.
Remotesensing 15 02316 g007
Figure 8. Results of the CNR of G27 satellite at L1 frequency on DOY 199 (blue line, no flood) and DOY 201 (red line, with the flood), 2021. The green line denotes the satellite elevation angle.
Remotesensing 15 02316 g008
Figure 9. Results of the CNR of G27 satellite at L2 frequency on DOY 199 (blue line, no flood) and DOY 201 (red line, with the flood), 2021. The green line denotes the satellite elevation angle.
Remotesensing 15 02316 g009
Figure 10. Histogram of the CNR and relative frequency for G27 satellite L1 frequency.
Remotesensing 15 02316 g010
Figure 11. Flowchart of the proposed method.
Remotesensing 15 02316 g011
Figure 12. Results of consistency analysis on original and fitted CNRs on DOY 198, DOY 199, and DOY 203, 2021. The R3 denotes the average correlation coefficient of CNRs between these three days.
Remotesensing 15 02316 g012
Figure 13. Results of consistency analysis on original and fitted CNRs on DOY 199 and DOY 200, 2021.
Remotesensing 15 02316 g013
Figure 14. Results of consistency analysis of the CNRs of the original and direct signals on DOY 200 (red line and dots) and DOY 201 (blue line and dots), 2021.
Remotesensing 15 02316 g014
Figure 15. Results of consistency analysis of the original and fitted CNRs on DOY 201 (red line and dots) and DOY 202 (blue line and dots), 2021.
Remotesensing 15 02316 g015
Figure 16. Results of consistency analysis on original and fitted by selected CNRs on DOY 199 and DOY 200, 2021.
Remotesensing 15 02316 g016
Figure 17. Results of consistency analysis on the original and fitted by selected CNRs on DOY 200 (red line and dots) and DOY 201 (blue line and dots), 2021.
Remotesensing 15 02316 g017
Figure 18. Results of consistency analysis on original and fitted by selected CNRs on DOY 201 and DOY 202, 2021. The subplot denotes the enlarged view of the critical point.
Remotesensing 15 02316 g018
Figure 19. Results of consistency analysis on original and fitted by selected CNRs on DOY 202 and DOY 203, 2021. The subplot denotes the enlarged view of the critical point.
Remotesensing 15 02316 g019
Disclaimer/Publisher’s Note: The statements, opinions and data contained in all publications are solely those of the individual author(s) and contributor(s) and not of MDPI and/or the editor(s). MDPI and/or the editor(s) disclaim responsibility for any injury to people or property resulting from any ideas, methods, instructions or products referred to in the content.

