
Study on Factors Affecting Remote Sensing Ecological Quality Combined with Sentinel-2
Abstract
:1. Introduction
2. Data and Methods
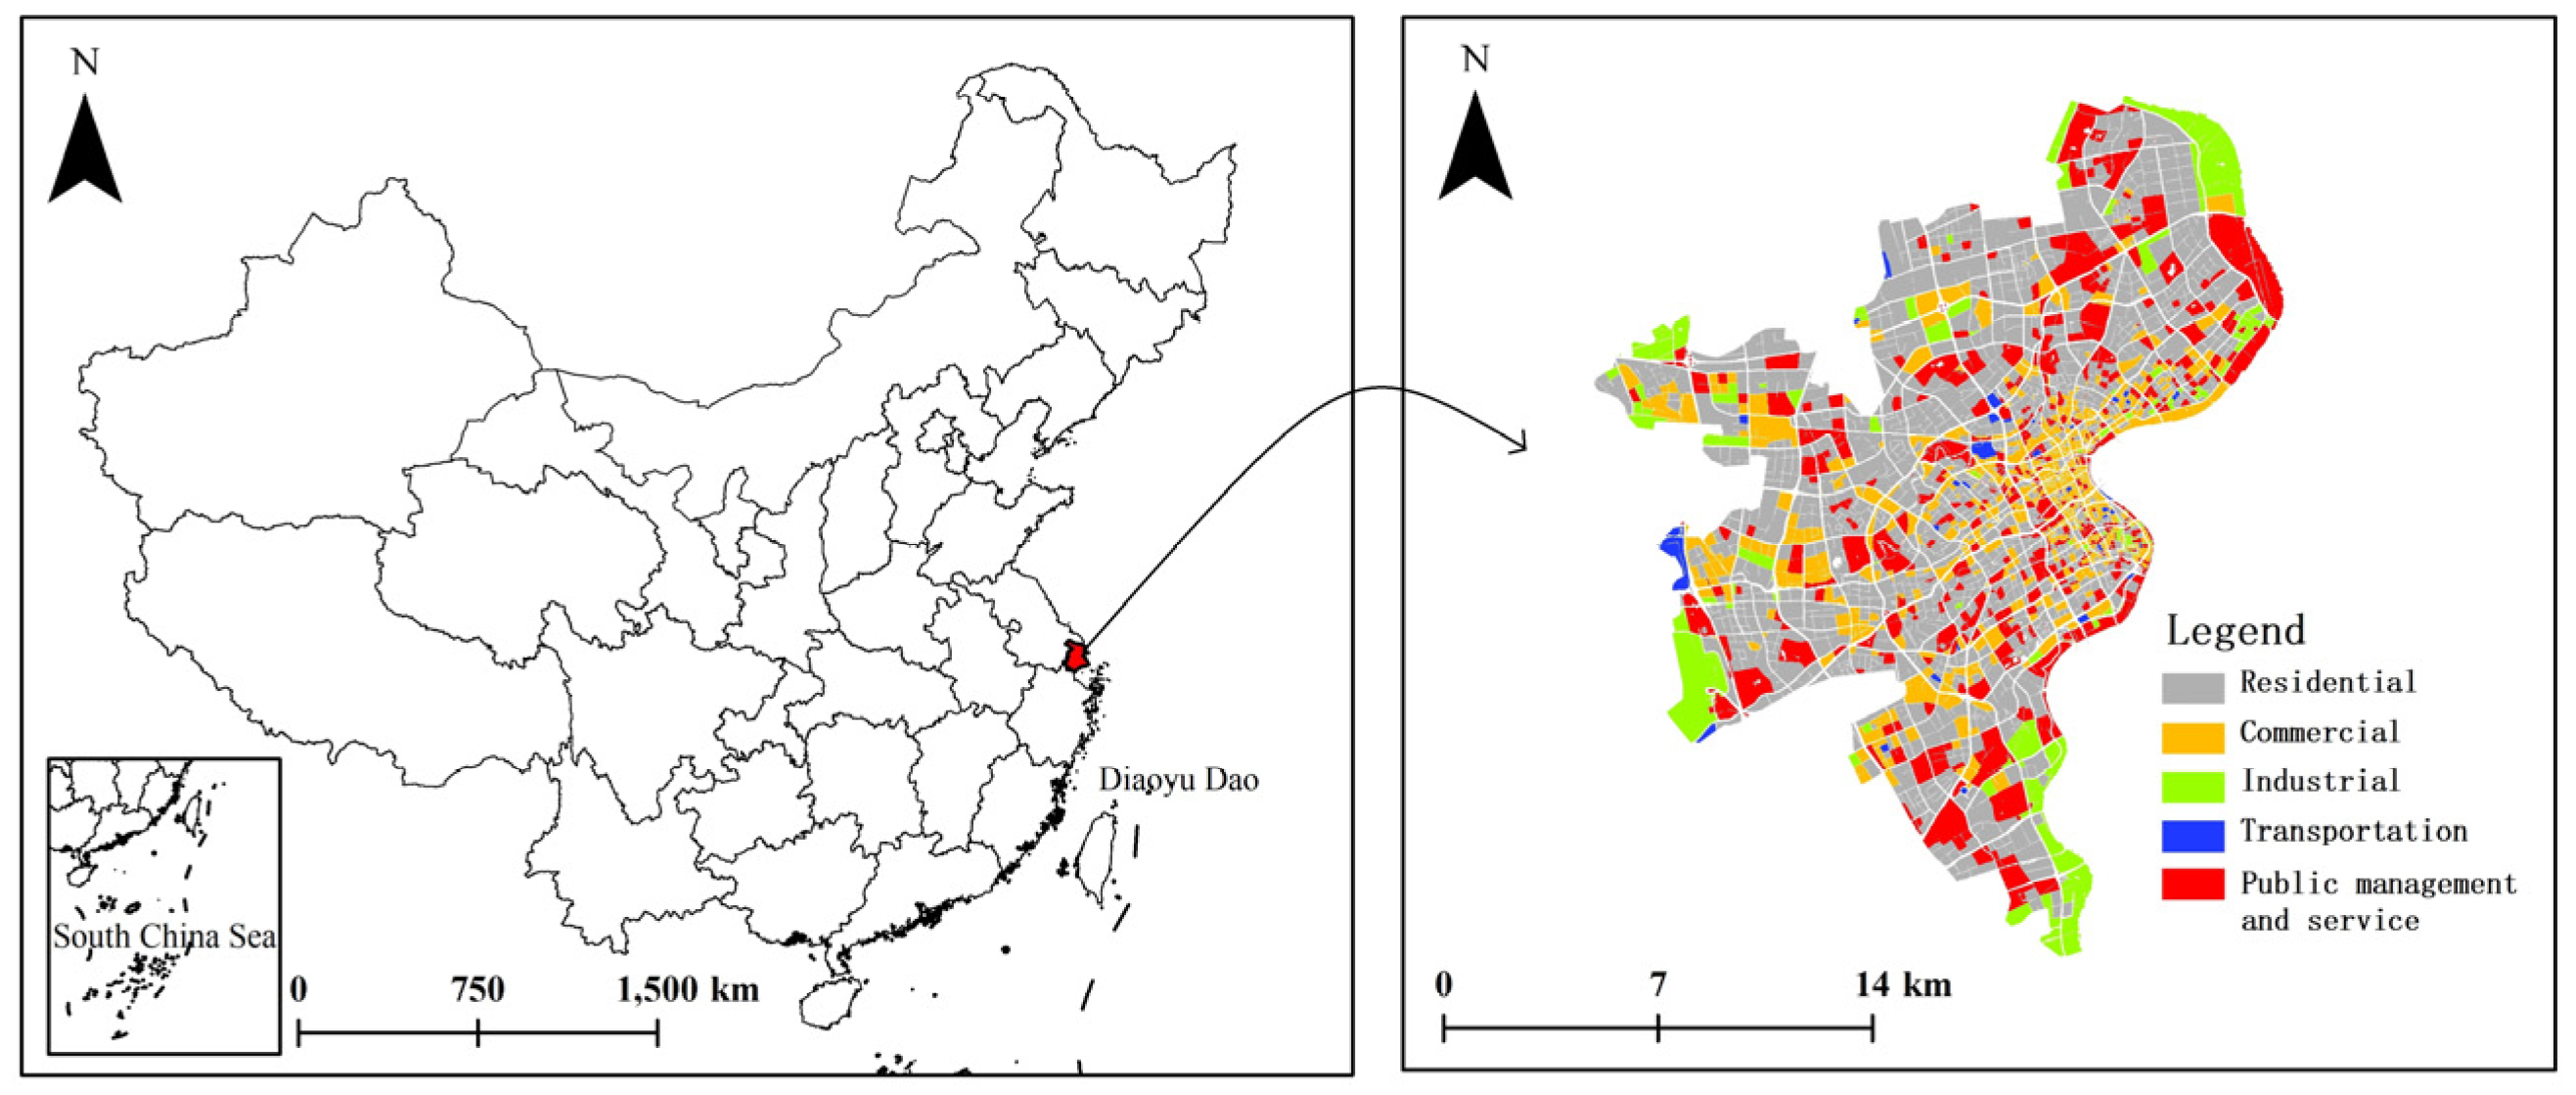
2.1. Research Area
2.2. Research Data
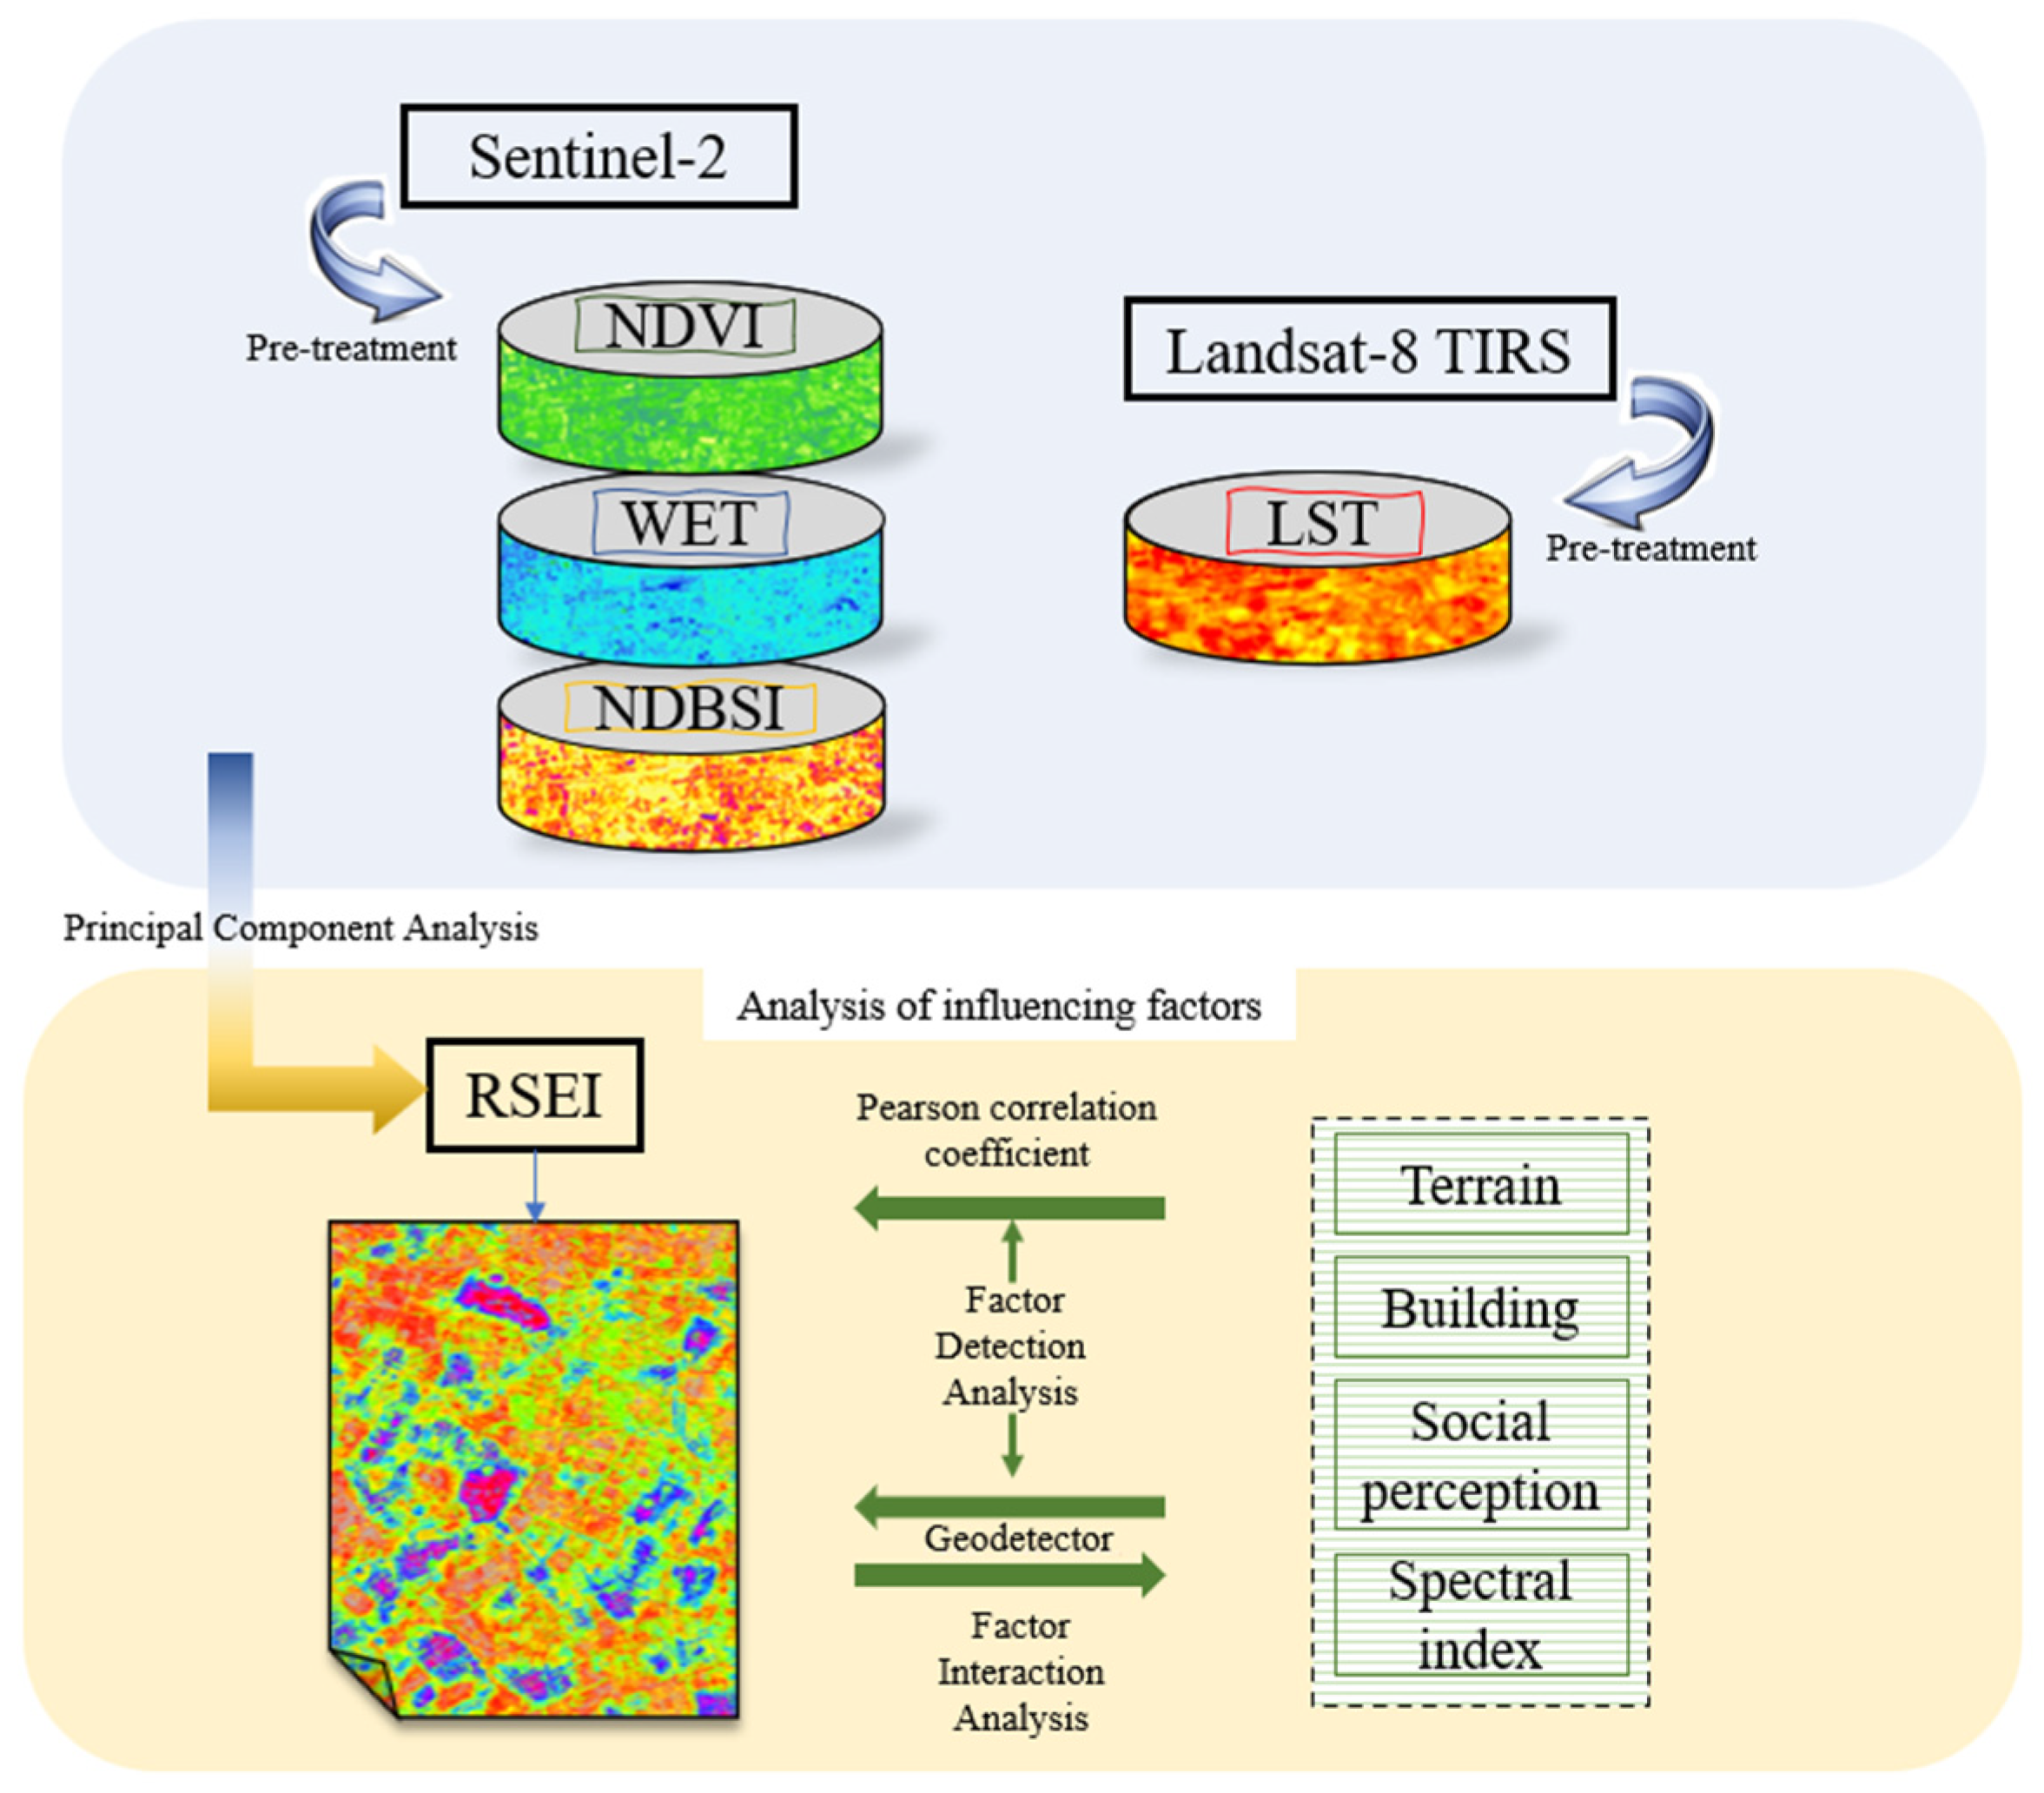
2.3. Research Methods
2.3.1. Remote Sensing Ecological Quality
2.3.2. Pearson Correlation Coefficient
2.3.3. GEO-Detector
3. Results and Analysis
3.1. Spatial Distribution of Remote Sensing Ecological Quality
3.2. Factors Influencing Remote Sensing Ecological Quality
3.2.1. Factor Detection Analysis
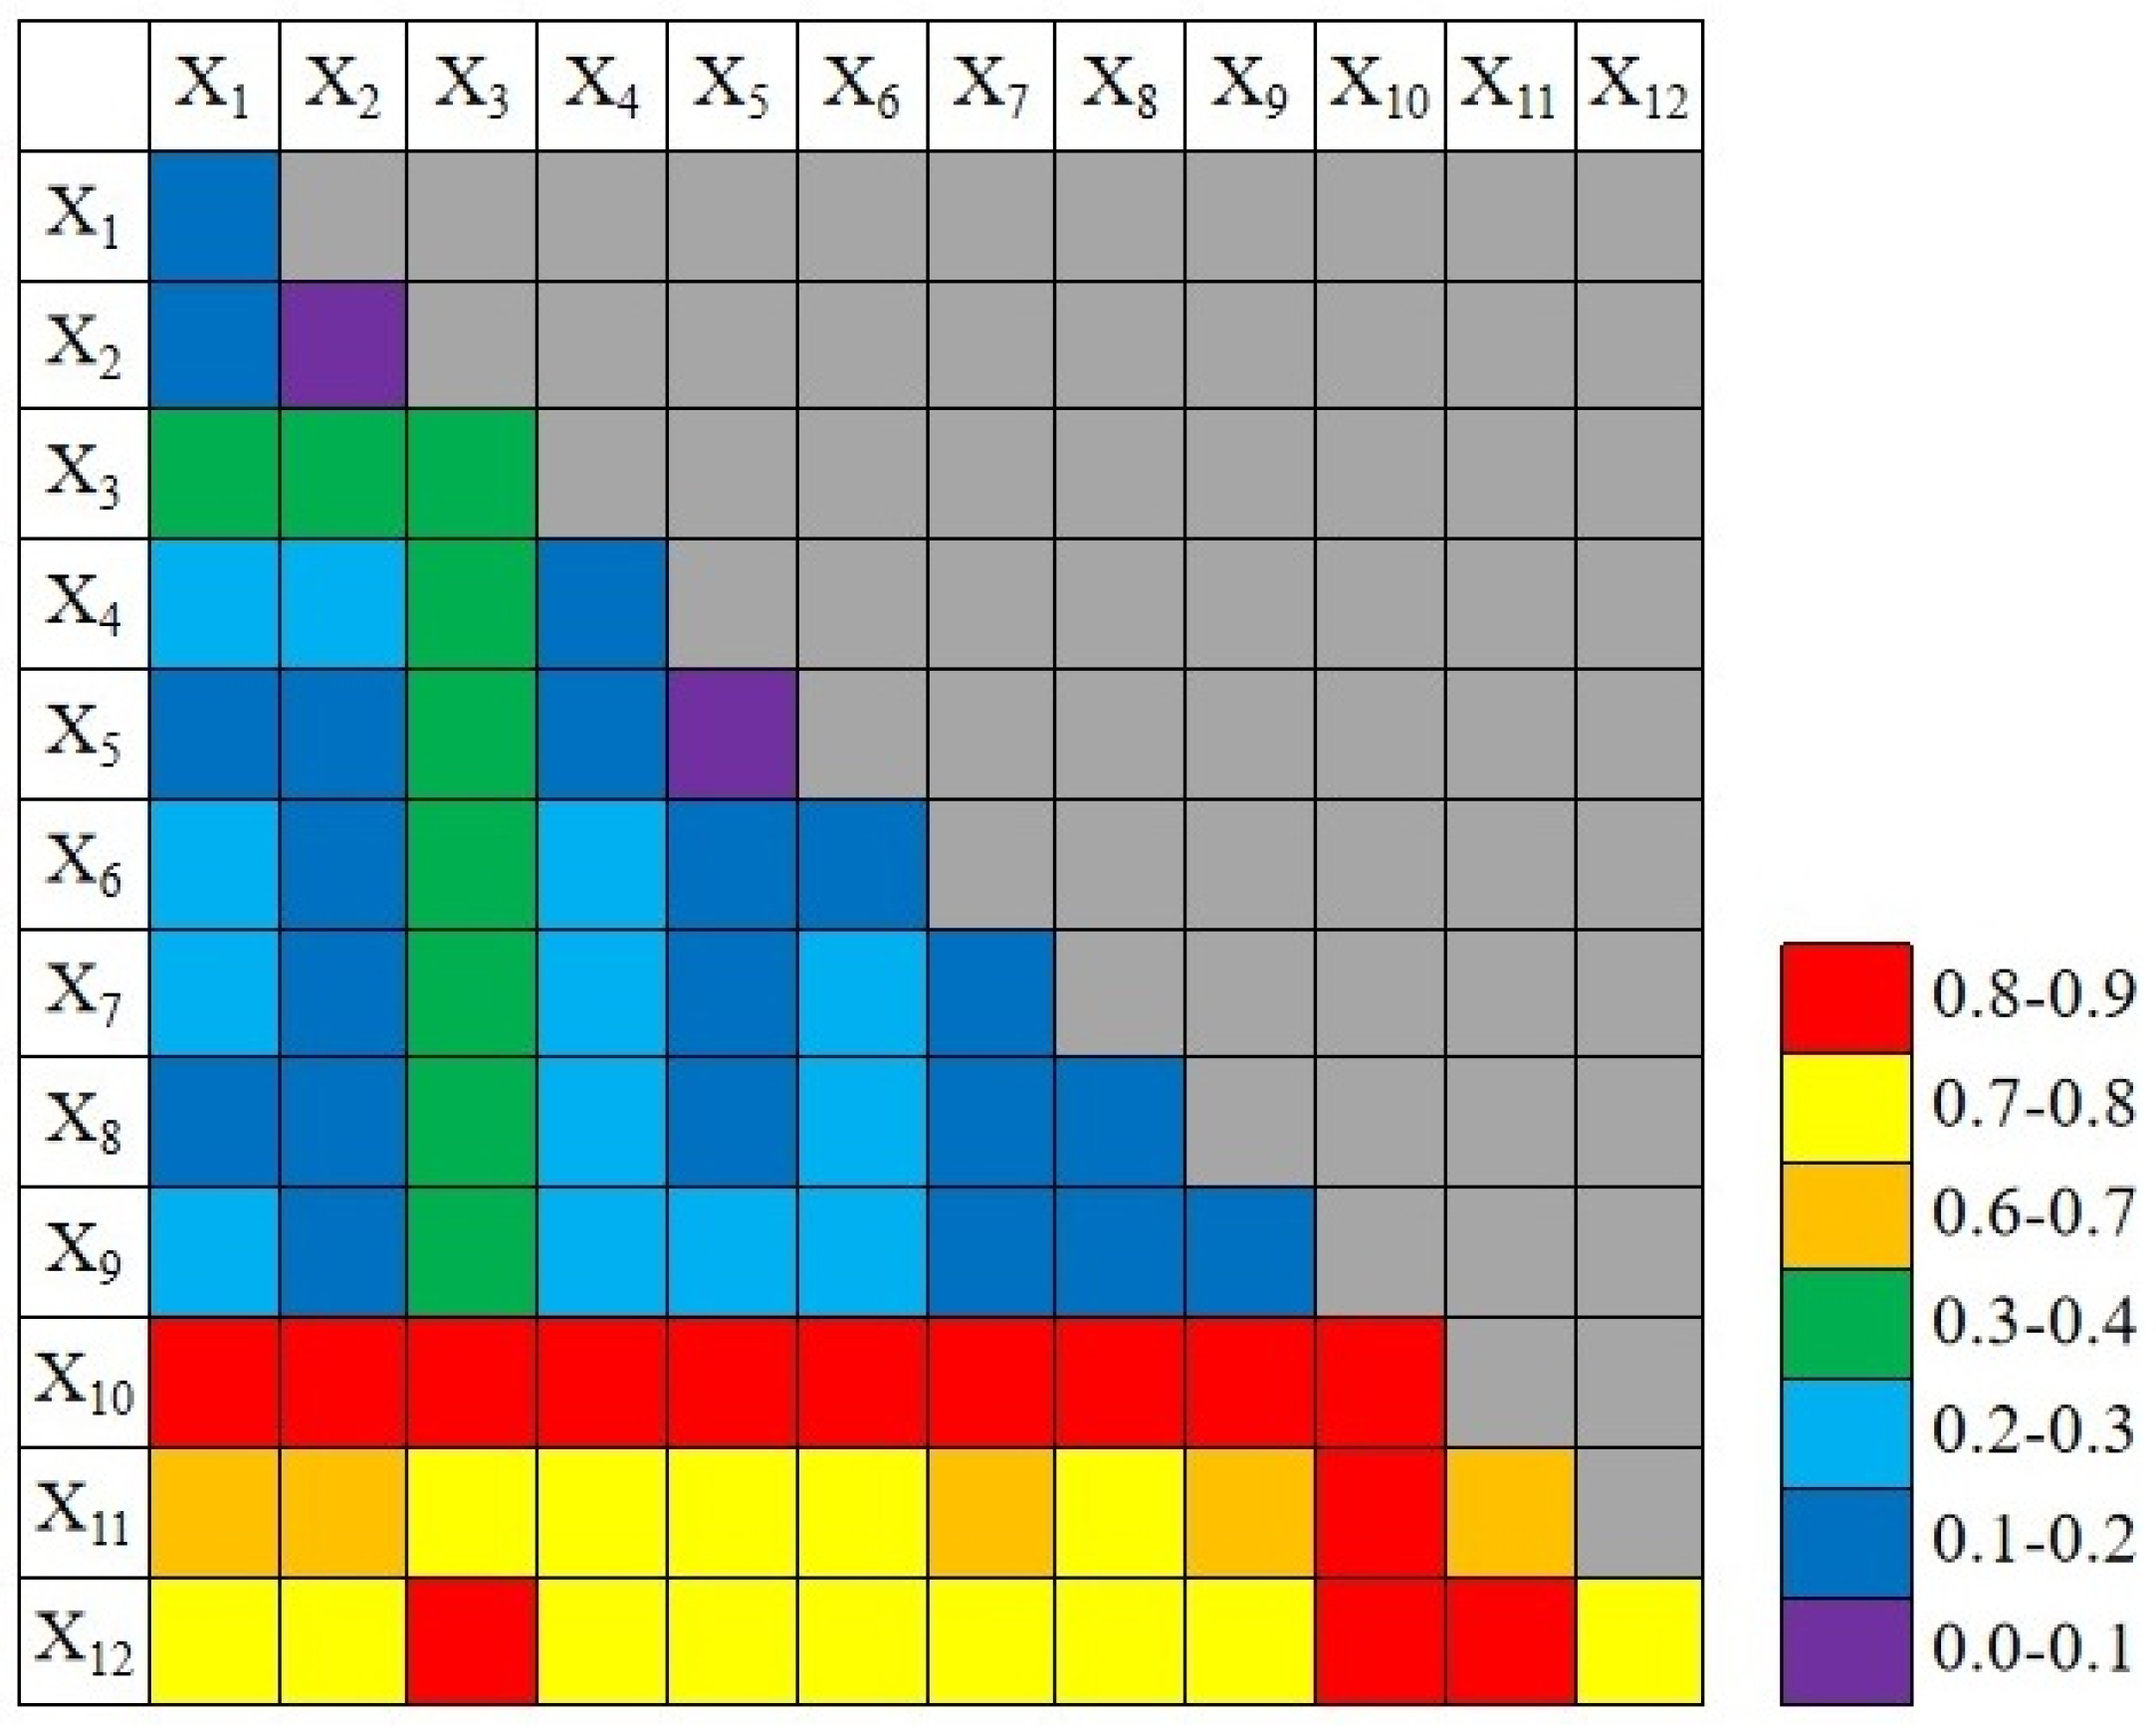
3.2.2. Factor Interaction Analysis
4. Discussion
4.1. Optimizing Urban RSEI
4.2. Limitations
5. Conclusions
- (1)
- Owing to data resolution advantages, the RSEI spatial distribution data represented by Sentinel-2 are more detailed than those from the Landsat data, which is of more practical significance for the study of ecological quality in small areas.
- (2)
- The four factors selected in the study influenced the RSEI in the order of spectral index factor > building factor > social perception factor > terrain factor. The SAVI had the greatest influence and a significant positive correlation with the RSEI (R = 0.970), whereas the average building height had the least influence and a significant positive correlation (R = 0.103).
- (3)
- In the factor interaction analysis, only double factor enhancement and nonlinear enhancement existed among the selected factors. Most of the factor combinations exhibited two-factor enhancement; only six factor combinations exhibited nonlinear enhancement and five were related to the average building height. The interaction between the SAVI and each factor was strong, with the SAVI∩MNDWI and SAVI∩NDBI combinations having strong interactions with the RSEI. Furthermore, the SAVI∩average building height and SAVI∩space congestion exhibited strong interactions.
Author Contributions
Funding
Institutional Review Board Statement
Informed Consent Statement
Data Availability Statement
Conflicts of Interest
References
- McDonnell, M.J.; MacGregor-Fors, I. The ecological future of cities. Science 2016, 352, 936–938. [Google Scholar] [CrossRef] [PubMed]
- Van Dijk, M.P.; Mingshun, Z. Sustainability indices as a tool for urban managers, evidence from four medium-sized Chinese cities. Environ. Impact Asses. 2005, 25, 667–688. [Google Scholar] [CrossRef]
- Manes, F.; Marando, F.; Capotorti, G.; Blasi, C.; Salvatori, E.; Fusaro, L.; Ciancarella, L.; Mircea, M.; Marchetti, M.; Chirici, G. Regulating ecosystem services of forests in ten Italian metropolitan cities: Air quality improvement by PM10 and O3 removal. Ecol. Indic. 2016, 67, 425–440. [Google Scholar] [CrossRef]
- Zhao, Z.; Sharifi, A.; Dong, X.; Shen, L.; He, B. Spatial variability and temporal heterogeneity of surface urban heat island patterns and the suitability of local climate zones for land surface temperature characterization. Remote Sens. 2021, 13, 4338. [Google Scholar] [CrossRef]
- Chen, Y.; Yang, J.; Yu, W.; Ren, J.; Xiao, X.; Xia, J. Relationship between urban spatial form and seasonal land surface temperature under different grid scales. Sustain. Cities Soc. 2023, 89, 104374. [Google Scholar] [CrossRef]
- McKinley, D.C.; Miller-Rushing, A.J.; Ballard, H.L.; Bonney, R.; Brown, H.; Cook-Patton, S.C.; Evans, D.M.; French, R.A.; Parrish, J.K.; Phillips, T.B. Citizen science can improve conservation science, natural resource management, and environmental protection. Biol. Conserv. 2017, 208, 15–28. [Google Scholar] [CrossRef]
- Lihua, W.; Tianshu, M.; Yuanchao, B.; Sijia, L.; Zhaoqiang, Y. Improvement of regional environmental quality: Government environmental governance and public participation. Sci. Total. Environ. 2020, 717, 137265. [Google Scholar]
- Guo, B.; Fang, Y.; Jin, X. Monitoring the effects of land consolidation on the ecological environmental quality based on remote sensing: A case study of Chaohu Lake Basin, China. Land Use Policy 2020, 95, 104569. [Google Scholar] [CrossRef]
- Van Kamp, I.; Leidelmeijer, K.; Marsman, G.; De Hollander, A. Urban environmental quality and human well-being: Towards a conceptual framework and demarcation of concepts; a literature study. Landsc. Urban. Plan. 2003, 65, 5–18. [Google Scholar] [CrossRef]
- Muthu, S.S.; Li, Y.; Hu, J.; Mok, P.Y. Quantification of environmental impact and ecological sustainability for textile fibres. Ecol. Indic. 2012, 13, 66–74. [Google Scholar] [CrossRef]
- Zhu, C.; Zhang, X.; Zhou, M.; He, S.; Gan, M.; Yang, L.; Wang, K. Impacts of urbanization and landscape pattern on habitat quality using OLS and GWR models in Hangzhou, China. Ecol. Indic. 2020, 117, 106654. [Google Scholar] [CrossRef]
- Xu, H. A remote sensing index for assessment of regional ecological changes. China Environ. Sci. 2013, 33, 889–897. [Google Scholar]
- Zhang, Y.; She, J.; Long, X.; Zhang, M. Spatio-temporal evolution and driving factors of eco-environmental quality based on RSEI in Chang-Zhu-Tan metropolitan circle, central China. Ecol. Indic. 2022, 144, 109436. [Google Scholar] [CrossRef]
- Yuan, B.; Fu, L.; Zou, Y.; Zhang, S.; Chen, X.; Li, F.; Deng, Z.; Xie, Y. Spatiotemporal change detection of ecological quality and the associated affecting factors in Dongting Lake Basin, based on RSEI. J. Clean. Prod. 2021, 302, 126995. [Google Scholar] [CrossRef]
- Geng, J.; Yu, K.; Xie, Z.; Zhao, G.; Ai, J.; Yang, L.; Yang, H.; Liu, J. Analysis of spatiotemporal variation and drivers of ecological quality in Fuzhou based on RSEI. Remote Sens. 2022, 14, 4900. [Google Scholar] [CrossRef]
- An, M.; Xie, P.; He, W.; Wang, B.; Huang, J.; Khanal, R. Spatiotemporal change of ecologic environment quality and human interaction factors in three gorges ecologic economic corridor, based on RSEI. Ecol. Indic. 2022, 141, 109090. [Google Scholar] [CrossRef]
- Xu, H.; Wang, Y.; Guan, H.; Shi, T.; Hu, X. Detecting ecological changes with a remote sensing based ecological index (RSEI) produced time series and change vector analysis. Remote Sens. 2019, 11, 2345. [Google Scholar] [CrossRef]
- Chen, Y.; Yang, J.; Yang, R.; Xiao, X.; Xia, J.C. Contribution of urban functional zones to the spatial distribution of urban thermal environment. Build. Environ. 2022, 216, 109000. [Google Scholar] [CrossRef]
- Yao, L.; Wei, W.; Yu, Y.; Xiao, J.; Chen, L. Rainfall-runoff risk characteristics of urban function zones in Beijing using the SCS-CN model. J. Geogr. Sci. 2018, 28, 656–668. [Google Scholar] [CrossRef]
- Zheng, Y.; Du, S.; Zhang, X.; Bai, L.; Wang, H. Estimating carbon emissions in urban functional zones using multi-source data: A case study in Beijing. Build. Environ. 2022, 212, 108804. [Google Scholar] [CrossRef]
- Guo, S.; Li, Y.; He, P.; Chen, H.; Meng, J. Embodied energy use of China’s megacities: A comparative study of Beijing and Shanghai. Energy Policy 2021, 155, 112243. [Google Scholar] [CrossRef]
- Cao, J.; Law, S.H.; Samad, A.R.B.A.; Mohamad, W.N.B.W.; Wang, J.; Yang, X. Effect of financial development and technological innovation on green growth—Analysis based on spatial Durbin model. J. Clean. Prod. 2022, 365, 132865. [Google Scholar] [CrossRef]
- Gong, P.; Chen, B.; Li, X.; Liu, H.; Wang, J.; Bai, Y.; Chen, J.; Chen, X.; Fang, L.; Feng, S.; et al. Mapping essential urban land use categories in China (EULUC-China): Preliminary results for 2018. Sci. Bull. 2020, 65, 182–187. [Google Scholar] [CrossRef] [PubMed]
- Chen, Z.; Chen, J.; Zhou, C.; Li, Y. An ecological assessment process based on integrated remote sensing model: A case from Kaikukang-Walagan District, Greater Khingan Range, China. Ecol. Inform. 2022, 70, 101699. [Google Scholar] [CrossRef]
- Nedkov, R. Orthogonal transformation of segmented images from the satellite Sentinel-2. Cr. Acad. Bulg. Sci. 2017, 70, 687–692. [Google Scholar]
- Peng, X.; Wu, W.; Zheng, Y.; Sun, J.; Hu, T.; Wang, P. Correlation analysis of land surface temperature and topographic elements in Hangzhou, China. Sci. Rep. 2020, 10, 10451. [Google Scholar] [CrossRef]
- Wu, P.; Zhong, K.; Wang, L.; Xu, J.; Liang, Y.; Hu, H.; Wang, Y.; Le, J. Influence of underlying surface change caused by urban renewal on land surface temperatures in Central Guangzhou. Build. Environ. 2022, 215, 108985. [Google Scholar] [CrossRef]
- Zhou, S.; Liu, D.; Zhu, M.; Tang, W.; Chi, Q.; Ye, S.; Xu, S.; Cui, Y. Temporal and Spatial Variation of Land Surface Temperature and Its Driving Factors in Zhengzhou City in China from 2005 to 2020. Remote Sens. 2022, 14, 4281. [Google Scholar] [CrossRef]
- Song, C.; Yang, J.; Wu, F.; Xiao, X.; Xia, J.; Li, X. Response characteristics and influencing factors of carbon emissions and land surface temperature in Guangdong Province, China. Urban. Clim. 2022, 46, 101330. [Google Scholar] [CrossRef]
- Liu, W.; Meng, Q.; Allam, M.; Zhang, L.; Hu, D.; Menenti, M. Driving factors of land surface temperature in urban agglomerations: A case study in the pearl river delta, china. Remote Sens. 2021, 13, 2858. [Google Scholar] [CrossRef]
- Wang, J.; Xu, C. Geodetector: Principle and prospective. Acta Geographica Sinica 2017, 72, 116–134. [Google Scholar]
- Wang, J.; Hu, Y. Environmental health risk detection with GeogDetector. Environ. Modell. Softw. 2012, 33, 114–115. [Google Scholar] [CrossRef]
- Luo, X.; Yang, J.; Sun, W.; He, B. Suitability of human settlements in mountainous areas from the perspective of ventilation: A case study of the main urban area of Chongqing. J. Clean. Prod. 2021, 310, 127467. [Google Scholar] [CrossRef]
- Zhao, Z.; He, B.; Li, L.; Wang, H.; Darko, A. Profile and concentric zonal analysis of relationships between land use/land cover and land surface temperature: Case study of Shenyang, China. Energy Build. 2017, 155, 282–295. [Google Scholar] [CrossRef]
- Ren, J.; Yang, J.; Wu, F.; Sun, W.; Xiao, X.; Xia, J. Regional thermal environment changes: Integration of satellite data and land use/land cover. iScience 2023, 26, 105820. [Google Scholar] [CrossRef]
- Yang, J.; Xin, J.; Zhang, Y.; Xiao, X.; Xia, J. Contributions of sea–land breeze and local climate zones to daytime and nighttime heat island intensity. NPJ Urban Sustain. 2022, 2, 12. [Google Scholar] [CrossRef]
- Yang, J.; Wang, Y.; Xue, B.; Li, Y.; Xiao, X.; Xia, J.; He, B. Contribution of urban ventilation to the thermal environment and urban energy demand: Different climate background perspectives. Sci. Total Environ. 2021, 795, 148791. [Google Scholar] [CrossRef] [PubMed]
- Cui, R.; Han, J.; Hu, Z. Assessment of Spatial Temporal Changes of Ecological Environment Quality: A Case Study in Huaibei City, China. Land 2022, 11, 944. [Google Scholar] [CrossRef]
- Ji, J.; Wang, S.; Zhou, Y.; Liu, W.; Wang, L. Spatiotemporal change and landscape pattern variation of eco-environmental quality in Jing-Jin-Ji urban agglomeration from 2001 to 2015. IEEE Access. 2020, 8, 125534–125548. [Google Scholar] [CrossRef]
- Zhang, J.; Yang, G.; Yang, L.; Li, Z.; Gao, M.; Yu, C.; Gong, E.; Long, H.; Hu, H. Dynamic Monitoring of Environmental Quality in the Loess Plateau from 2000 to 2020 Using the Google Earth Engine Platform and the Remote Sensing Ecological Index. Remote Sens. 2022, 14, 5094. [Google Scholar] [CrossRef]
- Huang, H.; Chen, W.; Zhang, Y.; Qiao, L.; Du, Y. Analysis of ecological quality in Lhasa Metropolitan Area during 1990–2017 based on remote sensing and Google Earth Engine platform. J. Geog. Sci. 2021, 31, 265–280. [Google Scholar] [CrossRef]
- Aizizi, Y.; Kasimu, A.; Liang, H.; Zhang, X.; Zhao, Y.; Wei, B. Evaluation of ecological space and ecological quality changes in urban agglomeration on the northern slope of the Tianshan Mountains. Ecol. Indic. 2023, 146, 109896. [Google Scholar] [CrossRef]


| Administrative Division | LST (°C) | NDBSI | NDVI | WET | RSEI |
|---|---|---|---|---|---|
| Huangpu | 39.327 | 0.036 | 0.210 | −0.025 | 0.522 |
| Xuhui | 39.223 | −0.010 | 0.309 | −0.033 | 0.514 |
| Changning | 39.520 | −0.023 | 0.357 | −0.043 | 0.530 |
| Jingan | 40.623 | 0.018 | 0.273 | −0.036 | 0.580 |
| Putuo | 39.795 | −0.012 | 0.324 | −0.039 | 0.535 |
| Hongkou | 40.136 | 0.010 | 0.274 | −0.031 | 0.559 |
| Yangpu | 39.455 | −0.001 | 0.287 | −0.033 | 0.532 |
| Factor Type | Code | Factor |
|---|---|---|
| Terrain factors | X1 | DEM |
| X2 | Slope | |
| Building factors | X3 | Building coverage |
| X4 | Density of building patches | |
| X5 | Average building height | |
| X6 | Space congestion | |
| Social perception factors | X7 | Dining distribution density |
| X8 | Distribution density of public land | |
| X9 | Shopping distribution density | |
| Spectral index factors | X10 | SAVI |
| X11 | NDBI | |
| X12 | MNDWI |
| Factor | X1 | X2 | X3 | X4 | X5 | X6 |
| q | 0.124 | 0.057 | 0.304 | 0.148 | 0.033 | 0.150 |
| p Value | <0.001 | <0.001 | <0.001 | <0.001 | <0.001 | <0.001 |
| Factor | X7 | X8 | X9 | X10 | X11 | X12 |
| q | 0.128 | 0.130 | 0.133 | 0.881 | 0.690 | 0.758 |
| p Value | <0.001 | <0.001 | <0.001 | <0.001 | <0.001 | <0.001 |
Disclaimer/Publisher’s Note: The statements, opinions and data contained in all publications are solely those of the individual author(s) and contributor(s) and not of MDPI and/or the editor(s). MDPI and/or the editor(s) disclaim responsibility for any injury to people or property resulting from any ideas, methods, instructions or products referred to in the content. |
© 2023 by the authors. Licensee MDPI, Basel, Switzerland. This article is an open access article distributed under the terms and conditions of the Creative Commons Attribution (CC BY) license (https://creativecommons.org/licenses/by/4.0/).
Share and Cite
Fan, Q.; Shi, Y.; Song, X.; Cong, N. Study on Factors Affecting Remote Sensing Ecological Quality Combined with Sentinel-2. Remote Sens. 2023, 15, 2156. https://doi.org/10.3390/rs15082156
Fan Q, Shi Y, Song X, Cong N. Study on Factors Affecting Remote Sensing Ecological Quality Combined with Sentinel-2. Remote Sensing. 2023; 15(8):2156. https://doi.org/10.3390/rs15082156
Chicago/Turabian StyleFan, Qiang, Yue Shi, Xiaonan Song, and Nan Cong. 2023. "Study on Factors Affecting Remote Sensing Ecological Quality Combined with Sentinel-2" Remote Sensing 15, no. 8: 2156. https://doi.org/10.3390/rs15082156