Review

A Comprehensive Review of Geospatial Technology Applications in Earthquake Preparedness, Emergency Management, and Damage Assessment

1
Department of Geodesy, Kandilli Observatory and Earthquake Research Institute, Bogazici University, Istanbul 34680, Turkey
2
Department of Geomatics Engineering, Graduate School, Ayazaga Campus, Istanbul Technical University, Istanbul 34469, Turkey
3
Department of Biological and Environmental Sciences, College of Arts and Sciences, Qatar University, Doha P.O. Box 2713, Qatar
4
Centre for Advanced Modelling and Geospatial Information Systems (CAMGIS), School of Civil and Environmental, Engineering, Faculty of Engineering and IT, University of Technology Sydney, Ultimo, NSW 2007, Australia
5
Earth Observation Centre, Institute of Climate Change, Universiti Kebangsaan Malaysia, Bangi 43600, Malaysia
6
Disaster Resilience Science Team, Goal-Oriented Technology Research Group, RIKEN Center for Advanced Intelligence Project, Tokyo 103-0027, Japan
*
Author to whom correspondence should be addressed.
Remote Sens. 2023, 15(7), 1939; https://doi.org/10.3390/rs15071939
Submission received: 23 January 2023 / Revised: 14 March 2023 / Accepted: 3 April 2023 / Published: 5 April 2023

Abstract

:
The level of destruction caused by an earthquake depends on a variety of factors, such as magnitude, duration, intensity, time of occurrence, and underlying geological features, which may be mitigated and reduced by the level of preparedness of risk management measures. Geospatial technologies offer a means by which earthquake occurrence can be predicted or foreshadowed; managed in terms of levels of preparation related to land use planning; availability of emergency shelters, medical resources, and food supplies; and assessment of damage and remedial priorities. This literature review paper surveys the geospatial technologies employed in earthquake research and disaster management. The objectives of this review paper are to assess: (1) the role of the range of geospatial data types; (2) the application of geospatial technologies to the stages of an earthquake; (3) the geospatial techniques used in earthquake hazard, vulnerability, and risk analysis; and (4) to discuss the role of geospatial techniques in earthquakes and related disasters. The review covers past, current, and potential earthquake-related applications of geospatial technology, together with the challenges that limit the extent of usefulness and effectiveness. While the focus is mainly on geospatial technology applied to earthquake research and management in practice, it also has validity as a framework for natural disaster risk assessments, emergency management, mitigation, and remediation, in general.

1. Introduction

Multifaceted research on earthquakes, which rank among the most devastating natural disasters [1,2,3], is of vital importance in mitigating the damage to human settlements and minimizing loss of life and severe injuries. One of the earliest applications of satellite data in earthquake exploration occurred in the 1970s [4], with the first mapping of active faults using satellite images [5]. More recent developments in space-based seismological research have made it possible to study a range of related phenomena, including earthquake-induced deformations [6], pre-earthquake conditions, such as surface thermal variations [7], gaseous and aerosol emissions [5], and electromagnetic disturbances in the ionosphere [8]. Similarly, technological developments have increased our capacity to cope with earthquakes through occurrence prediction [9], prevention assessments [10], identification of vulnerabilities [11,12], risk reduction [13], and disaster preparedness [14]. Further areas of related academic activity and disaster management are the stages of mitigation [15], which include post-earthquake adaptation [16], responses [17], recovery [18], and social and economic sustainability [19]. Although each constitutes a separate field of research and expertise, the objective of our research was to categorize these fields in terms of the related novel and available technologies, to create a set of comprehensive guidelines for researchers. Our study considered modern geospatial technologies and their use in the study of earthquakes. Although previous reviews of these technologies exist, they have generally focused on a single geospatial application related to earthquakes; for example, [20] focused on earthquake-induced building damage. Our review aims to provide a comprehensive review of existing geospatial applications of relevance in the domain. The following flowchart (Figure 1) represents the structural parameters of our research, sub-divided into the major contributory areas of coverage.
Branch 1 of the flowchart (Figure 1) outlines the research coverage of the various geospatial data types commonly used in seismology, namely Geographic Information System (GIS), optical Remote Sensing (RS), thermal, radar, and Light Detection and Ranging (LiDAR), as well as combinations of these data types, referred to as fusion data. Combining observations with data of various scales of resolution can often provide a more comprehensive assessment of the mechanisms of potential destruction and the extent of consequences of an earthquake. Moreover, RS data can be combined with GIS and other data categories, including geological, topographic, and ground motion shake maps, to provide more detailed links between earthquake damage and its control and specific ground conditions [21,22]. Such integration can be easily achieved by spatial referencing of the geospatial data using standard map projections [23]. Branch 2 outlines the stages (pre-, inter-, and post-occurrence) for which we assessed applications of geospatial technology in our research. Branch 3 outlines the impact analysis categories applied to earthquakes in our research—“risk analysis”, in the context of our research, refers to the integration of hazard and vulnerability analyses [24,25]. Through each stage, valuable information can be obtained for better management strategies. Branch 4 outlines the potential natural disasters that may be triggered as ripple effects of an earthquake, for example, tsunamis, fires, and landslides.

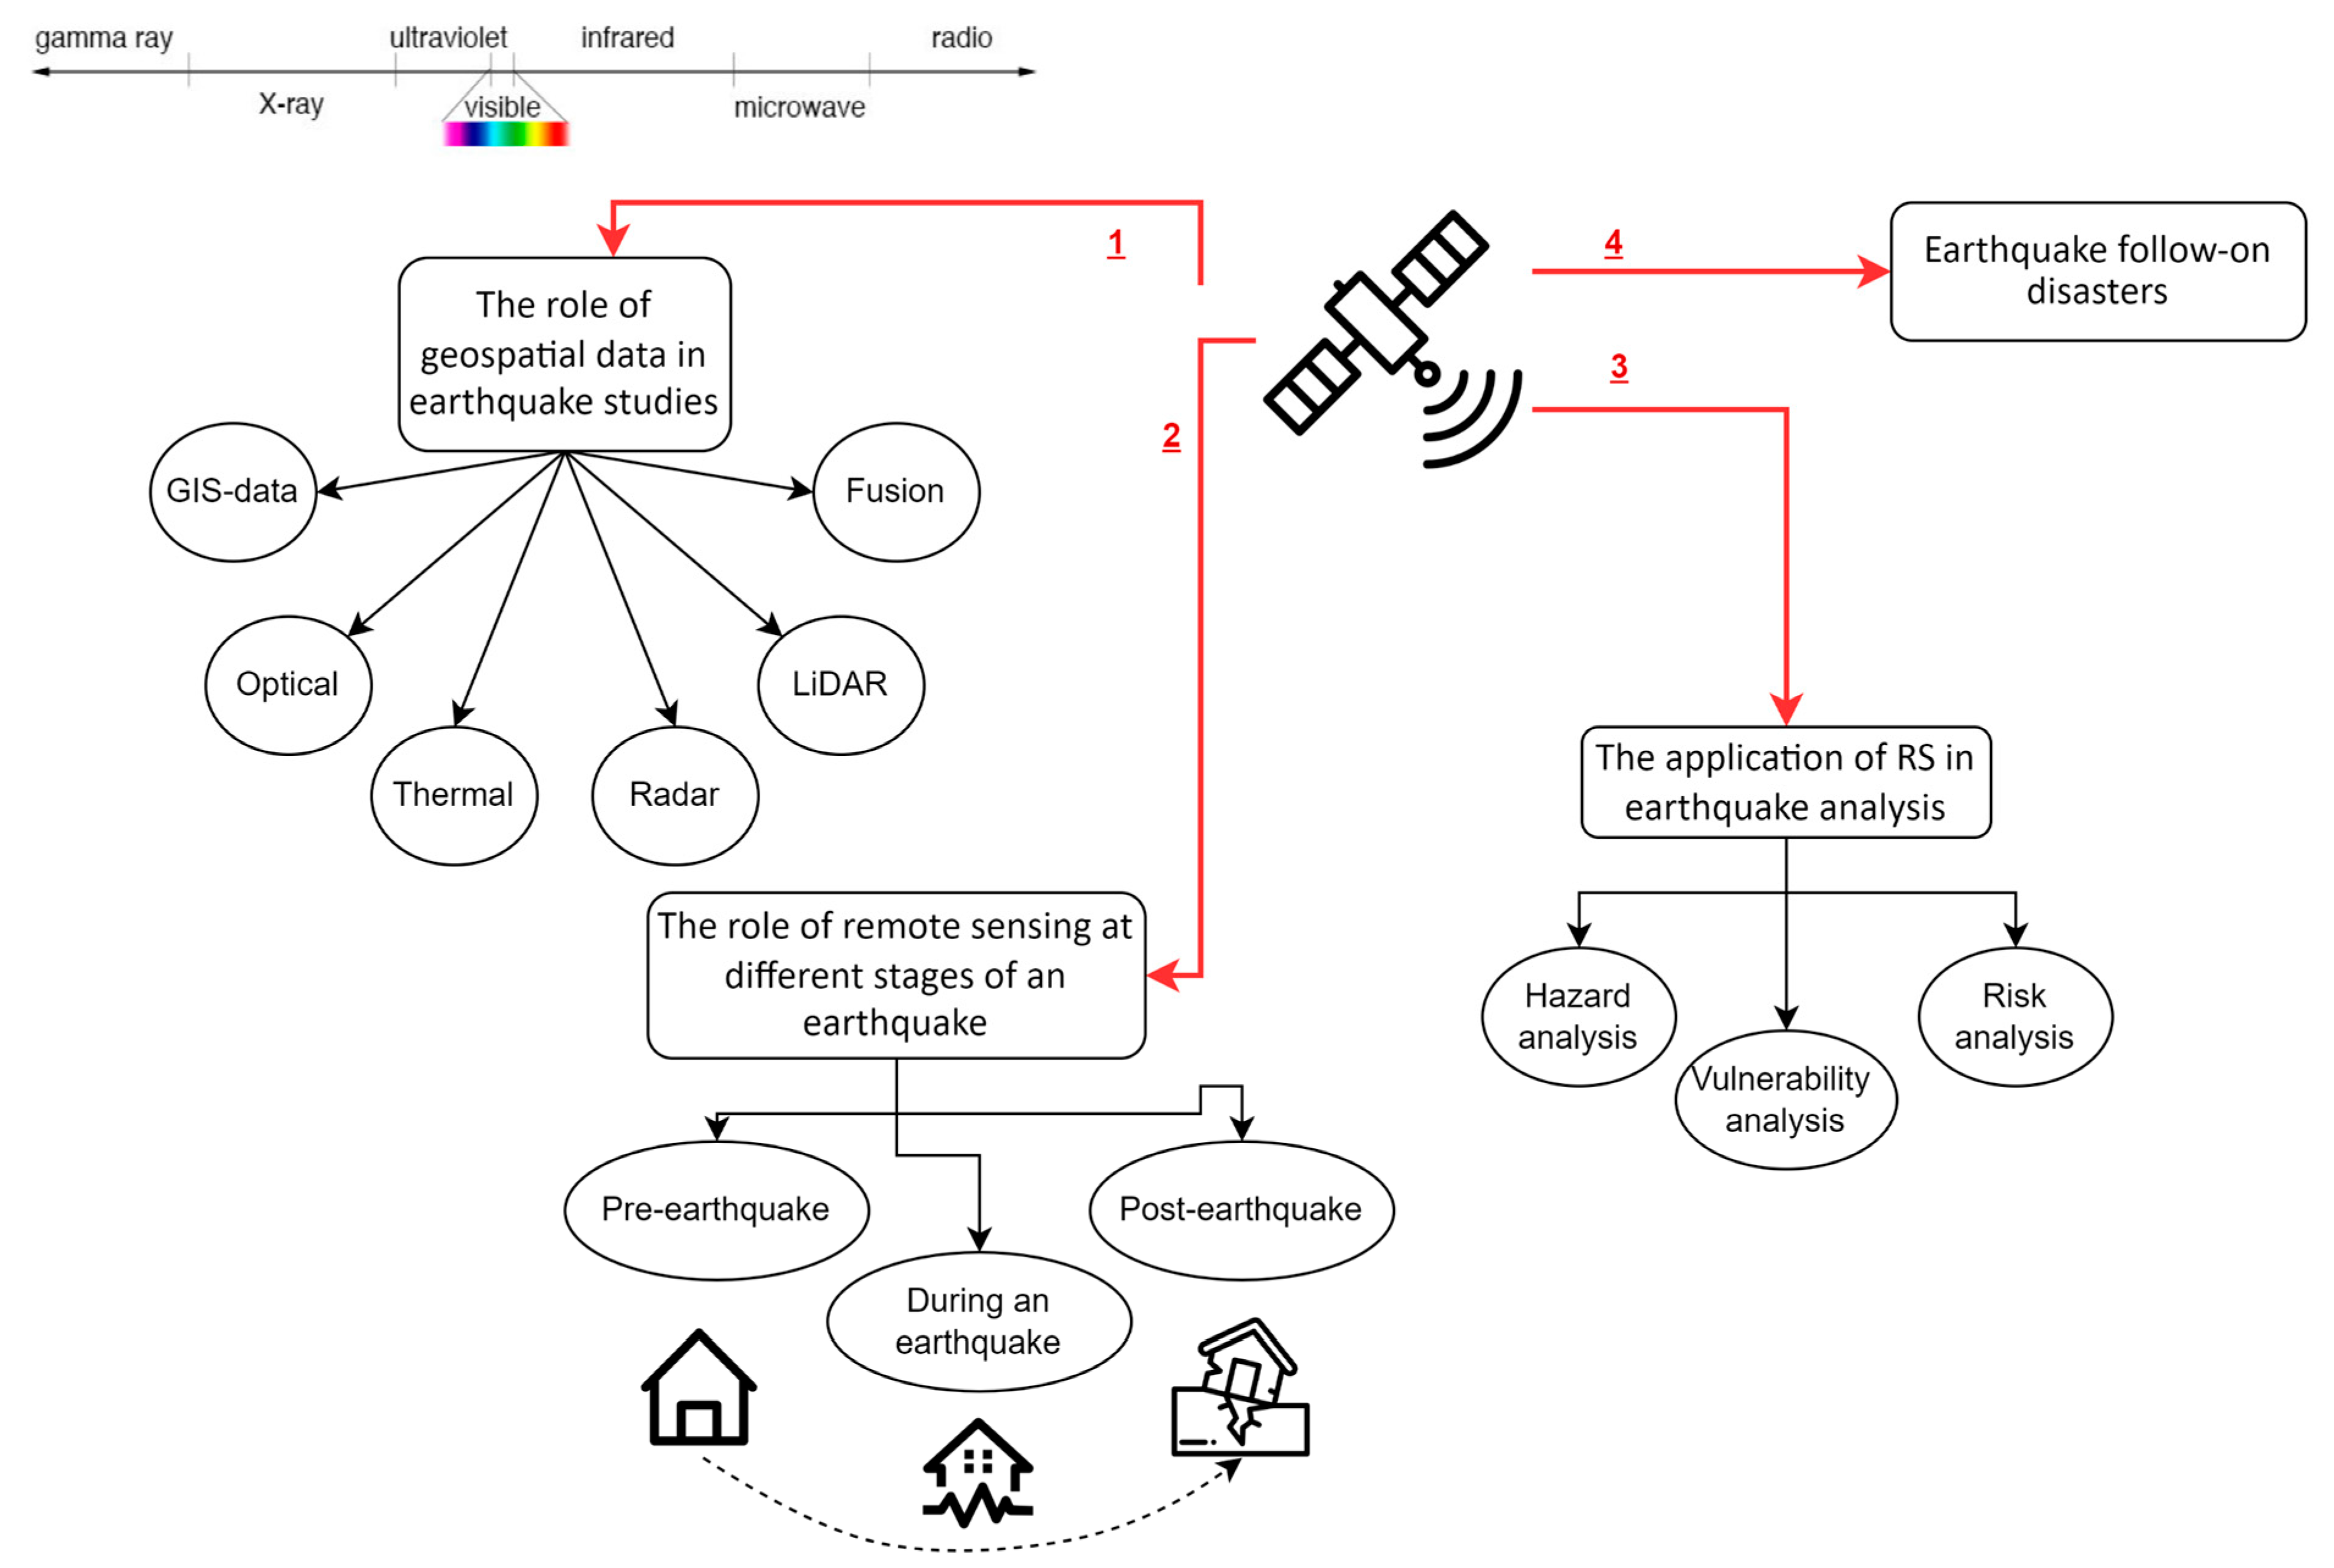
2. The Role of Geospatial Data in Earthquake Studies

This section addresses geospatial data types and associated developmental trends in this form of data up to 2022. It includes discussion on the advantages and limitations of each data type and the image processing techniques used to map and monitor earthquakes. In general, geospatial data provide locational information connected to a category of dataset defined as a GIS, RS, global navigation satellite system (GNSS), information technology, or field sensor.
The use of satellite data in seismological applications began in the 1970s with the mapping of geological faults [5]. Through technological advances in satellite remote sensing, a wide range of techniques are available to conduct seismological [26] and geophysical research [27]. Some RS satellites were launched for specific missions and limited time frames. The DEMETER (Detection of Electromagnetic Emissions Transmitted from Earthquake Regions) mission, withdrawn in December 2010 after over six years in orbit [28], is an example, which was dedicated to the study of ionospheric perturbations resulting from seismic activity [29].

2.1. GIS Data

GIS supports a large variety of data with different formats, in an easy-to-use modelling environment. The mapping and modelling as well as the associated analyses have assisted governments to make well-informed decisions for the development of emergency response strategies by [30]. GIS-based modeling is mainly used in emergency management [31], hazard analysis [32,33], vulnerability analysis [34], risk analysis [35], damage assessment [36], change detection analysis, etc. [37], evaluating areas of risk and hazards with respect to communities, real estate and land property, as well as natural resources.
GIS is invaluable in the following aspects of earthquake disaster management:
  • Evaluating short- and long-term reconstruction and recovery processes.
  • Ranking the stages of search-and-rescue operations.
  • Determining the post-disaster assembly areas, emergency management operations centers, and other incidental services aimed at minimizing the disastrous consequences.
  • Analyzing service area of hospitals and fire stations, which play a key role in providing the quickest response.
  • Preparing the strategic databases for pharmacies and medical supplies.
  • Predicting the aftermath of earthquakes, such as tsunamis and fires, which helps to recognize the possible affected areas via buffer analysis.
  • Utilizing ArcView 3D Analyst, which can be used to prepare a 3D view of the buildings. Earthquake-vulnerable buildings will be defined (based on a specific number of floors, materials, commercial or residential use, etc.).
In risk and hazard management, GIS has proven to be one of the simplest methods of assembling information. Many researchers and scholars rely on Web GIS seismic risk assessment [38,39]. In Japan, after the Niigata Chuetsu Earthquake, a special GIS-based portal was developed in order to assist damage assessment management [40]. A similar portal was created by using ArcObjects, which are the components of COM-based ArcGIS software [41]. Ref. [42] covered the sharing of disaster information via GIS, as established in the Japanese national “Chuetsu Earthquake Restoration and Revival Support GIS Project” that followed the Mw 6.8 Chuetsu Niigata Earthquake of 2004. The damage caused by the massive earthquake recorded by many organizations was tracked and unified in GIS and broadcast in real time, greatly simplifying post-disaster management. The completeness of the shared GIS data from Chuetsu 2004, thus, constituted a basis for future risk management information, which has undoubtedly played an important role in developing an understanding of earthquake risks.
GIS was used as an effective and useful tool for risk assessment purposes in the Pendik urban region, which has a population of 389,000 and forms a gateway to Istanbul, Turkey. Here, the ArcView tool, supported by MsAccess data based on a Pendik Urban Inventory, was used to make detailed risk maps accompanied by analytical reports. Hospitals and clinics, educational institutions, and police and governmental buildings located on the underlying deformation, unstable land, and alluvial ground were identified along with gas hazard zones, plants that produce hazardous materials, and buildings under high-voltage power lines [43]. Ref. [44] developed a Web-based GIS system including two main components: (1) an online database of earthquakes recorded by the Vietnam National Seismic Network and (2) a rapid seismic hazard assessment toolkit. Using an online earthquake database, it became possible to create a shake map caused by the previously recorded earthquake. Ref. [45] studied the Kalachori Accelerometric Network, comprising seven stations, installed in suburban areas west of Thessaloniki, Greece. These stations documented geotechnical data from 78 earthquakes that occurred in the region between 2014 and 2016. An online Web-GIS platform compiled and unified the data. Ref. [46] introduced the Beijing Earthquake Disaster Prevention System as a GIS and online portal. This system totally integrates disaster data and is accessible by non-professionals due to its user-friendly interface. A distinctive feature of this platform is that it allows data from different sources to be mixed and processed in a uniform manner to serve as the basis for various spatial analysis. Ref. [47] reported a noticeable gap in web-based GIS applications by neglecting the potential to combine earthquake and hurricane data into a single dynamic interface. The author devised an improved methodology to extend a previously developed online GIS application, making it possible to examine the relationships between earthquake and tropical storm events over the last 30 years, as well as analyzing the trends and intensities of those events. These examples clearly demonstrate the relevance of GIS for timely responses to emergencies and highlighted the need for improved technologies for integrated data assessment. The web-based GIS platform called PREVIEW [48] provides access to interactive digital content designed for free and continuous access to global records on hurricanes, storms, floods, landslides, droughts, earthquakes, tsunamis, volcanic eruptions, and wildfires.

2.2. Optical Data

Optical satellite imagery provides post-earthquake images of the affected area, potentially within a few hours of the event. Ref. [49] implemented damage detection based on multitemporal coherence map clustering and a similarity analysis from Sentinel-1 image datasets for a Mw 7.4 strength earthquake that occurred in Kermanshah, Iran, in 2017, another application of optical RS is in the mapping of the deformations that follow an earthquake [50]. However, more advanced RS techniques for representing and measuring deformation will be introduced in the section “Active Microwave” (Section 2.4.2). To detect deformations using optical imagery, a sub-pixel correlation technique can be used, in which deformation locations are represented by mismatched pixels. Notwithstanding the more advanced forms of RS data, optical sensing is still a common method used to detect surface changes following an earthquake. Ref. [51] measured vertical surface deformations associated with the Mw 6.0 Petermann Ranges earthquake in Australia in 2016. The authors quantified the vertical deformation using high-resolution optical WorldView satellite imagery and validated the result with radar and field-based data. Pre- and post-earthquake Digital Elevation Models (DEMs) were generated from in-track stereo optical satellite images. The results showed that differenced DEMs are useful for constraining vertical deformation arising from surface rupture earthquakes that cause only moderate (<1 m) vertical movement. The researchers concluded that optical imagery remains useful when radar data are not available. Another disadvantage of optical RS is its limitations in the representation of reverse fault earthquakes, including large oversteps and combinations of discrete and distributed deformation. Reverse faults pose a severe threat to several highly populous megalopolises, including Los Angeles, Taipei, and Teheran, and greater research will have great relevance for planners and engineers in these vast urban landscapes.

2.3. Thermal Infrared (TIR) Data

Geodynamic activity may produce mounting tectonic pressure in crustal layers, which manifests in changes to the thermal regime prior to an earthquake. Refs. [7,52,53] all confirm escalations in temperature a few hours prior to an earthquake, by as much as 10 degrees around the epicenter. Some authors have also suggested that similar anomalous tectonic activity can last up to several weeks after the main shock and may be identified by thermal measurements. If these changes are possible to identify, they will enable us to determine future likely earthquake activities and give key information on earthquake risk. The monitoring of seismic activity via thermal remote sensing has become a standard technique. The capacity to measure the surface emissivity of regions with high seismic activity on a regular or even continuous basis offers the potential for a standardized approach for analyzing pre-earthquake geodynamic activity and monitor risk [7]. Land surface temperatures (LSTs) can be determined by a range of thermal sensors that include the Advanced Very-High-Resolution Radiometer (AVHRR) aboard the National Oceanic and Atmospheric Administration (NOAA), the Multi-spectral Visible and Infrared Scan Radiometer (MVISR) on the Feng Yun (FY) Chinese series of satellites, the Moderate-Resolution Imaging Spectroradiometer (MODIS) onboard the Terra and Aqua satellites, and the Advanced Spaceborne Thermal Emission and Reflection Radiometer (ASTER) also aboard the Terra. The first detection of enhanced TIR anomalies preceding an earthquake occurred in the 1980s [54,55]. Paralleling the increasing usage of thermal monitoring of geodynamic activities and subsequent anomalies, an extensive literature on the use of various machine learning techniques and methods for processing thermal remote sensing data has appeared. Ref. [56] assessed the capability of thermal remote sensing to determine active geological faults. Refs. [57,58] trained a time series of surface temperatures in an artificial neural network, while [59] reviewed significant LST precursory remote sensing studies published between 2000 and 2015.

2.4. Optical Data

2.4.1. Passive Microwave

Energy values registered by passive microwave sensors are (1) atmospheric emissions (2), surface emissions (3), surface-reflected, or (4) subsurface-transmitted. Compared to the wavelengths of other parts of the electromagnetic spectrum, the length of microwaves is exceeded only by the length of radio waves and, therefore, the energy they release is relatively small [60,61]. As described in the “Thermal infrared” section, while TIR has been used extensively in measuring temperature variations, recently, with the advent of various passive microwave remote sensing satellites, microwave brightness temperature (MBT) images have also been used successfully to detect seismic anomalies [61,62]. The implication is that an additional range of electromagnetic frequencies has been harnessed to measure temperature, and both infrared and passive microwave remote sensing is capable of detecting temperature anomalies. For example, [63,64] proposed an anomaly index algorithm based on a conceptual approach for determining temperature differences between adjacent pixels. The performance of the algorithm in monitoring seismic anomalies was tested and validated for several events, including the 2004 Morocco earthquake and the 2008 Wenchuan earthquake, using 18.7 GHz MBT data obtained with the Advanced Microwave Scanning Radiometer for EOS (AMSR-E), and both studies showed significant anomalies near the epicenters.
Standard variations in the force of the gravitational field impacting the Earth’s surface are primarily due to the fact that the constituency of the mass of the planet is neither homogenous nor evenly distributed. Inversely, the slightest localized fluctuations in the tectonic plates and internal density produce measurable changes in the gravitational forces that act on the surface. During an earthquake, major movements of rock, kilometers below the surface, can be similarly measured on the surface. Measuring the changes in gravity supports predicting earthquake occurrences and will be described in greater detail in the “pre-earthquake” section. Recently, “gravity satellites”, such as the Challenging Mini-Satellite Payload (CHAMP) launched by Germany in 2000, the Gravity Recovery and Climate Experiment (GRACE) launched in 2002 as a joint US–German project, and the Gravity Field and Steady-State Ocean Circulation Explorer (GOCE) introduced by the European Space Agency in 2009, provided the first means of measuring changes in global mass based on changes in gravity data, which have been employed in earthquake prediction research. This was accomplished through measuring changes in the distances between the satellites and their velocities using the K-band microwave ranging (KBR) system integral to each satellite. Minor variations in the distances and velocities reflect the changes in Earth’s gravitational field [65].

2.4.2. Active Microwave

RADAR Data

Several studies examined the use of Radio Detection and Ranging (RADAR) data in the detection of active geological faults. An early application of radar images for this purpose was the study by [66]. Studies by [67,68] emphasized the successful implementation of Synthetic Aperture Radar (SAR) data for the spotting of lineament lines, namely landscape features that reflect underlying faults and fractures. Ground movement, for example, is also one of the key topics in earthquake studies and may be due to pre-seismic, coseismic, and post-seismic deformations [69]. Earthquake geophysical parameters, such as the location of the main shock, seismic moment, geometry of the fault, ground deformations, and aseismic slip, also known as fault or surface creep [70], are important for reliable seismic hazard assessment and large-scale tectonic studies. All these parameters can be measured accurately using the Interferometric Synthetic Aperture Radar (InSAR) technique. InSAR uses two images taken at different times for a particular locality and interprets them through output maps called interferograms that show the ground surface displacement during the time period.
Since InSAR was initially applied to measure the coseismic strain after the 1992 California earthquake [71], the use of the technique in earthquake-related studies has increased significantly [72]. InSAR data can provide very-high-spatial-resolution (up to 10 m) measurements of coseismic ground displacements in the Earth’s crust (less than 50 km) of moderate magnitude (Mw 5+), just limiting observations of the largest subduction zone events that usually lead to significant (more than 1 cm) deformations of the coastline. The parameters of amplitude and phase are fundamental to the InSAR technique. The major physical terrain parameters, such as slope and surface roughness, are computed and integrated through the amplitude images, while the phase images record data relating to the distance between the satellite and the surface site. Due to its high sensitivity to heterogeneity in phase measurements, InSAR data can map the smallest displacements along geological faults [73] and, thus, identify previously unmapped fault sites caused by earthquakes [74].
Since 2000, Differential Interferometric Synthetic Aperture Radar (D-InSAR) has been used to monitor deformations with centimeter accuracy [75]. However, despite the successful use of D-InSAR in many scientific seismological applications, it has limitations related to geometrical and temporal decorrelation, as well as atmospheric interferences [76]. The above-mentioned issues can be solved by using Persistent Scatterer Interferometry (PSI), a tool for analyzing high-quality phase information of coherent targets, in conjunction with InSAR analysis [77]. Persistent Scatterer Synthetic Aperture Radar Interferometry (PS-InSAR) is an applied time-series technique for monitoring coseismic deformations with millimeter measurement accuracy, offsetting the limitations of D-InSAR [10]. Field studies using multiple data sources, including InSAR, GNSS, and field-observed seismological measurements, revealed the multilevel geological features of the Mw 7.8 Kaikōura earthquake that occurred on the South Island of New Zealand in 2016. The analysis, which involved the use of both Sentinel and ALOS-2, confirmed that the earthquake was the most complex ever studied, with 25 known faults rupturing in a single earthquake event [78]. The output coherence losses showed large phase gradients in the nearfield, major landslides, and land surface changes.

LiDAR Data

Light Detection and Ranging uses pulsed-laser light emissions to measure distances to Earth. Three-dimensional LiDAR data provided can be used in earthquake vulnerability or damage assessments and, hence, play a role in earthquake disaster management. Through scientific management techniques, including fault detection and the mapping of tectonic features, the significant costs of post-earthquake repair and redevelopment can be most effectively apportioned. Ref. [79] used LiDAR data recorded before and after the Mw 6.9 Chuetsu-oki earthquake in Nigata, Japan, in 2007, to acquire detailed information about building damage by overlapping images and comparing the heights of buildings in pre- and post-disaster phases. Ref. [80] showed the effectiveness of airborne LiDAR DEM in mapping and differentiating aspects of the complex tectonic geomorphology of the Meilongshan Fault in the densely forested areas of southern Taiwan. Ref. [81] used terrestrial LiDAR DEM to construct a post-disaster building damage model using data from the Yushu, China, and Port-au-Prince, Haiti, earthquakes that both occurred in 2010. Ref. [82] combined DInSAR and LiDAR to create a robust 3D coseismic displacement map for the Mw 6.9 earthquake that occurred in Fukushima, Japan in 2011. Liquefaction takes place when soil under earthquake conditions loses its properties of traction and behaves as a liquid. LiDAR is also widely used for liquefaction analysis. Ref. [83] utilized LiDAR data to extract the surface deformations and then detected the subsidence due to liquefaction by subtracting vertical displacements for the Christchurch sequence of seismic events in 2010 and 2011. Ref. [84] applied LiDAR data to derive the subsidence-related numerical information caused by the Mw 9.0 Tohoku-Oki earthquake in Urasayu, Japan, in 2011 and its impact on the sewerage system pipelines.

2.5. GNSS

GNSS technology is used in seismology for ionosphere sounding studies [85,86] and for ground motion detection. Earth movements cause waves to travel through the atmospheric layers right up to the ionosphere where they can be detected as disturbances by global navigation systems such as GNSS. High-frequency GNSS data were first used in seismological monitoring in 1994, when the Japanese Geological Survey Institute introduced an array of 949 observation points to analyze crustal deformations and coseismic land movements [87]. GNSS technology was later successfully applied for monitoring deformation in other earthquakes, such as the Izmit earthquake in Turkey [88]; L’Aquila in Italy [89]; Garhwal-Kumaun earthquakes in the Himalayas [90]. Ref. [91] showed that the larger the number of monitoring satellites, the more accurately the locality of a coseismic ionospheric disturbance can be identified. Researchers also established that GNSS signals in combination with seismogram data can significantly enhance the quality and completeness of deformation monitoring data [92,93].

2.6. Data Fusion

Typically, remote sensing technology can only provide observations of the Earth’s surface from one side. For a more detailed description, observations from different sources can be combined using a Data Fusion (DF) technique [94]. Thus, using several remote sensing sources simultaneously and combining the outputs are key aspects in a detailed and accurate description of the Earth. The complementary nature of optical/SAR/LiDAR measurements can lead to a more complete description of the measured object (ground surface) when these data are considered together. Ref. [95] covered the feature fusion methods for characterizing an urban area offered by remote sensing data sources and listed these as: (1) multi-sensor (2) multi-temporal (3) multi-resolution (4) multi-angular, and (5) model-based feature fusion. Ref. [96] provides a good example of primary data fusion studies to demonstrate that a combination of optical imaging and SAR data significantly improved the classification of earthquake damage. The authors also showed that complex coherence provides higher classification accuracy when integrated with optical imaging. The single drawback noted is that the increased sensitivity to the spatial base of the interferometric pair has less effect on the correlation of SAR intensities. The fusion of radar and optical remote sensing was examined by [97]. The authors combined radar and optical observations of seismological and field survey data to study focal parameters, coseismic slope failures, and secondary faults associated with the 7.3 magnitude earthquake in Sarpol-e Zahab, Iran, in 2017. As a research method, additional analysis of radar and optical data makes it possible to obtain a more accurate picture of coseismic ground changes occurring at different spatial scales and improve the spatial characterization of coseismically activated geological structures.
Ref. [98] provided a framework for disaster relief and necessary reconstruction using a combination of multi-sensor, multi-temporal, and multi-resolution observational data as well as multi-scale DEMs. The aim of the research was to develop a system that would focus on monitoring and analysis during the earthquake and include rescue and insurance activities, in order to provide immediate emergency responses. Ref. [99] investigated the fusion of multi-geometric radar data. They studied the data fusion of line of sight (LOS) InSAR measurements from different geometrical viewpoints to detect land deformations. They used Envisat SAR data from the east coast of Australia between June 2006 and September 2010. This database is useful for merging data with several geometrical features, as many images were recorded in particular areas. The results showed that data fusion of LOS InSAR measurements from different multiple geometric data provides reliable estimates of horizontal and vertical movements. Ref. [100] presented an analysis of earthquake-induced building damage detection by using multi-source data fusion and ensemble learning algorithms for rapid damage mapping. SAR images obtained with ALOS-2 PALSAR-2, Sentinel-1, Sentinel-2, and PlanetScope sensors were used in this study. The area of multi-sensor and multi-temporal data fusion for remote sensing images is extremely wide, which makes it difficult to cover it completely in one literature review.

2.7. Time-Series Data

To understand any former changes to the Earth’s surface and to be able to predict potential change, continuous monitoring is essential. For this purpose, pre- and post-earthquake time series data provide valuable information. Time-series data analyses were once the domain of experts in specific fields. However, the availability of open source tools, algorithms and programming languages and the rapid changes to our planetary land surface usage particularly in the realm of climate change has resulted in the rapid development of new forms of time series analyses of observed surface changes in terms of magnitude, energy release, shaking intensity and earthquake prediction [101]. Further, time series assist in long-term thermal imaging analysis used for earthquake hazard monitoring [102], of pre-earthquake anomalies, identifying the post-earthquake ionospheric disturbances and earthquake-induced deformations.
Ref. [103] stated that while InSAR data contain valuable ground displacement information, they include several unwanted signals, including noise related to ionospheric and atmospheric delays, orbital tilts, and topographic phase errors. These errors can be resolved up to a point by applying time series to the InSAR data. This statement has been confirmed by other researchers such as [104]. It has been established that reconstructed coseismic fields provide greater comprehensive and seismologically consistent results in earthquake modeling compared to single coseismic interferograms. Thus, it is fair to summarize that time-series methods provide an additional dimension of precision in monitoring over a longer-term event in order to gain greater understanding and control of the nature of earthquakes.
According to the USGS, China is the most earthquake-prone country in the world. Between 1900 and 2020, more than 800 seismic events (magnitude of Mw 6 or higher) were recorded there. Indonesia is ranked as the second-most seismically active country. Since 1900, Indonesia has experienced more than 150 events between magnitudes Mw 7 and 8 and 11 earthquakes of a magnitude exceeding Mw 8. Annually, Iran is exposed to about 250 events of Mw 4.0 to 4.9 magnitude, 25 earthquakes between Mw 5.0 and 5.9, and up to 3 with magnitude Mw 7.0 to 7.9, placing the country in third place globally. Japan, Chile, Mexico, India, Italy, Turkey, and Greece form the remainder of the top ten countries most prone to seismic activity, having all experienced at least a dozen major earthquakes since 1900. Hence, in this paper, the literature reviewed mainly considered these ten countries. Studies were selected by examining peer-reviewed journals and conference proceedings between 2000 and 2021.
Many techniques and methods have been used to study earthquake phenomena. Through the development of modern techniques, there has been increasing interest in earthquakes over the last decade. Figure 2 illustrates the number of earthquake-related studies conducted in the period of 2010–2021. Firstly, all earthquake-related studies were found on Scopus and Web of Science databases and included coverage of the geodetic techniques for earthquake study, such as GNSS, seismological methods, including borehole and ground geophysics, geological approaches considering geomorphology and structural geology, and all techniques related to remote sensing. The final stage of selection included only those that incorporated remote sensing technologies.
Japan and China are among the major nations that, in addition to geodetic, seismological, and geological techniques, have paid increased attention to remote sensing in earthquake studies. On average, remote sensing accounts for about ten percent of the total techniques used. However, the analysis of annual publications (Figure 3) revealed the growing linear trend for all countries in using remote sensing, underlining its potential for the future.

3. The Role of Remote Sensing at Different Stages of an Earthquake

This section discusses the application of geospatial approaches before and after an earthquake. Specific events occur during the different phases of an earthquake. For example, surface deformations are usually divided into three stages—pre-seismic, coseismic, and post-seismic—in the seismic cycle. Coseismic movements occur up to tens of meters from the fault line while pre-seismic motion appears in the order of centimeters. Crustal deformations in the post-seismic stage are commonly measured in centimeters, though earthquake-induced landslides can be detected up to a few meters. Different geospatial techniques are used to measure each of these stages.

3.1. Pre-Earthquake Studies

Although intensive research and interdisciplinary efforts have been applied to earthquake prediction, the accuracy of early warning systems is still limited [105]. A series of studies indicated that the actual earthquake is usually accompanied by various anomalies, including stress; seismic activity [106]; crustal deformations; thermal changes in land surfaces [107]; air temperature variations [108]; electric [109] and magnetic field disturbances [110]; changes in underground water levels [111]; unusual animal behavior [112]; ionospheric signals [113]; and emissions of gas [114], such as radon (Rn) and carbon dioxide (CO2). These anomalies are deemed earthquake precursors. An earthquake can be predicted by monitoring, tracking, and observing several precursors [115]. According to the International Association of Seismology and Physics of the Earth’s Interior (IASPEI), earthquake precursors constitute measurable changes in the properties or characteristics of phenomena observed in the environment before the main seismic event [116].
The formation of an earthquake starts with strain accumulation in the rocks, followed by the concentration of stress, rock mass fracture, and, finally, the occurrence of the earthquake itself [117], implying that strain and stress are key fundamental precursors of earthquakes. This approach was applied in predicting the 1975 Haicheng, China, earthquake [118]. Since the 1960s, numerous countries have established dedicated earthquake precursor networks, for example, groundwater observation networks, crustal deformation monitoring networks, as well as geoelectric, geomagnetic, and gravity observation monitoring systems. However, due to the complex distribution of stresses and the dynamic movement of energy in the Earth’s crust, the existing methods of RS do not yet extend to the determination of the time, location, and magnitude of an earthquake [119].
Geospatial technologies have been increasingly used in predicting earthquakes. Due to possibilities of longer-term observations, a broad range of energy sources, as well as various types of signals, remote sensing techniques, facilitate the acquiring of accurate spatial and temporal information about changes associated with an earthquake. RS can also effectively manage the limitations of fixed stations. These capacities provide insights into the patterns of occurrence and dynamical development of an earthquake. All pre-earthquake indicators can be easily measured by RS, and these indicators include crustal deformation monitoring and measurements of surface temperature variations [59], gas (CH4, CO, CO2, HCl, H2S, O3, SO2,) and aerosol exhalations, ionospheric electromagnetic disturbances [102], as well as electromagnetic, hydrodynamic, and gravitational fields preceding the earthquake. RS-based pre-earthquake predictions can be classified and conveniently classified according to the anomaly or precursor monitored [105], including: (1) thermal anomaly, (2) electromagnetic signal anomaly, (3) gravitational anomaly, and (4) continuous crustal deformations.

3.1.1. Thermal Anomaly Studies

Overall, studies have reported increases in land surface temperature (LST) in a range of 3–5 °C and 1–30 days prior to the earthquake [102]. In regions indicating LST anomalies, both the coverage zone and the rise in temperature are positively correlated with the magnitude of an earthquake. Outgoing longwave radiation (OLR) anomalies can usually be observed 1–3 months prior to an earthquake above the geological fault locality. The surface latent heat flux (SLHF) reflects the heat transfer from the ground to the atmosphere, typically occurring 2–14 days prior to an earthquake. In addition, it has been observed that SLHF anomalies are more prominent during coastal earthquakes. Since RS techniques are frequently combined with GIS in climate change studies, GIS can also be adapted for LST detection [120]. The radiometric surface temperature can be determined from satellite measurements on the infrared spectrum or microwave wavelengths on the electromagnetic spectrum. Due to the greater range of surface emissivity alterations, uncertainties in microwave recovery can be higher compared to thermal infrared (TIR) recoveries of LST, which manifest a stronger correlation between radiance and temperature. However, TIR measurements demonstrate greater sensitivity to cloud contamination than microwave measurements. Hence, the need for cloud detection may restrict the spatial and temporal sampling of TIR observations. Comparisons of TIR and microwave temperature measurements are not possible, irrespective of whether they have the same spatial coverage. The reason for this is because TIR LST is derived from a thin upper layer of a few micrometers (up to 50 μm) on the surface, while microwave radiation derives from deeper layers (1 mm) and is dependent on soil moisture. Applying TIR to measure temperature was briefly explained in the “Thermal infrared data” section, and the most popular TIR sensors, such as NOAA and MODIS, were introduced. It should be noted that the passive microwave radiometer, Special Sensor Microwave Imager (SSM/I), aboard the United States Defense Meteorological Satellite Program (DMSP) is cloud-penetrated and, thus, can be used under all weather conditions for detecting thermal emissions.
LST can be detected with thermal sensors and by using various algorithms, such as split-window (SW), dual-angle (DA), or single-channel (SC). The most significant anomaly was observed during the Mw 7.2 Gazli, Uzbekistan, earthquake in 1984. Ref. [121] examined outgoing long-wave radiation (OLR), LST, and air temperature (AT) data taken from thermal remote sensing images to study temporal variations in LST before and after three strong earthquakes in the Vrancea, Romania, region area (Mw = 7.4, 1977; Mw = 7.1, 1986; Mw = 6.9, 30 May 1990) and a moderate earthquake Mw = 5.9, 2004. The researchers assigned the spatio-temporal anomalies to the mechanism of energy exchange in the preparatory events preceding an earthquake. Ref. [122] applied different statistical techniques to thermal data and calculated the thresholds of surface latent heat flux for several earthquakes in a number of regions that exhibited different tectonic settings. Ref. [123] implemented the Robust Satellite Technique (RST) to determine thermal anomalies over a 10-year period using satellite data obtained from MODIS-Aqua.
The temperature curves obtained from the wave of earthquakes recorded in Iran from February to March 2005 showed clear fluctuations just before an earthquake and disappeared after it. Ref. [124] studied satellite-based surface temperature variations in the Mw 7.6 Kashmir, Mw 6.4 Ziarat, and Mw 7.2 Dalbandin earthquakes. Calculated LST showed major temperature changes in ranges of 6.5–7.9 °C, 8.0–8.1 °C, and 2.7–5.4 °C, for each event, respectively.

3.1.2. Electromagnetic Signal Anomaly Studies

The electromagnetic field is closely related to earthquakes [125]. Time series conducted over years at Lake Baikal, Siberia, indicates that Earth’s pulse electromagnetic fields (EPEMFs) are mainly terrestrial in origin. Since anomalies of this order of electromagnetic wave can be detected several days before an earthquake, this method is suitable for short-term earthquake prediction studies. During this period, the number of pulses tends to increase sharply and then subsequently decrease [126]. The number of pulses shows positive correlations with the time of year, magnitude of the earthquake, and frequency of its occurrence. The seismic magnetic and electric field anomalies preceding major earthquakes have been confirmed by many historical earthquakes and detected by both ground and satellite methods [127]. As an example, China maintains a unique database with nearly 50 years of continuous electromagnetic observations of value to a wide range of geoscientists [128]. A remote electromagnetic network was established in China due to its importance in earthquake prediction studies.
The Mw 9.2 Great Alaskan earthquake of 1964 remains the second most powerful in recorded history and set up a massive series of ionospheric disturbances [129]. Since then, non-standard electromagnetic fluctuations have been associated with earthquakes. The Russian Interkosmos-19 satellite recorded abnormal very-low-frequency (VLF) (3–30 kHz) electromagnetic signal measurements just hours before an Mw 5.7 earthquake occurred in Jiangsu province on 9 July 1979. This qualifies as the first monitoring of earthquake seismic signals using remote sensing [130]. In a study of the Mw 6.8 Spitak earthquake that occurred in Armenia in 1988, leaving at least 25,000 dead and 130,000 injured, [131] reported that the Cosmos-1809 satellite detected electromagnetic radiations with a frequency below 450 Hz. Ref. [132] found that low-frequency (LF) (0.1–16 kHz) radio wave emissions increase in intensity when the satellite moves closer to the epicenter of the seismic region, while a significant increase in ELF and VLF emissions occurred at frequencies of 800 and 4650 Hz in the interval from 8 to 3 h after each event. According to [133], the National Space Development Agency of Japan (NASDA) and the associated natural sciences research institute (RIKEN) researched the effectiveness of using electromagnetic phenomena in short-term earthquake prediction. Their five-year study showed that seismic features are manifested not only in the lithosphere but also in the atmosphere and ionosphere. At present, ionospheric electromagnetic studies related to earthquakes are used extensively. Stable statistical estimates of the ionosphere–lithosphere relationship have been established, and several new ionospheric satellites have recently been launched. Ref. [134] summarized the main research findings from measurements of ultra-low-frequency plasma measured by DEMETER prior to the Wenchuan earthquake. As mentioned earlier, DEMETER was the first space-based platform to study ionospheric perturbations caused by earthquakes [29].
The Swarm mission, launched in 2013, was a combination of three similar satellites: Alpha (A), Bravo (B), and Charlie (C) [135]. These satellites include special magnetic and plasma sensors to measure the strength, intensity, and direction of the magnetic field. To date, several scientific studies [136,137,138,139] have investigated plasma and magnetic field parameters associated with the time and location of large seismic events using Swarm data, thus providing strong evidence for a correlation between ionospheric disturbances and earthquake occurrence. One of the challenges relates to the requirement of algorithms and methods that can evaluate the anomalies. For instance, the forecasting patterns of Earth electromagnetic signal before a strong earthquake were studied by [140]. The authors proposed a successful model for predicting the main intensity trend from the signal of Earth’s electromagnetic field. That was a recent achievement, which effectively reduced the forecasting error compared to the traditional models and became a hope for further electromagnetic anomaly monitoring prior to the earthquake.

3.1.3. Crustal Deformation Studies

Tectonic plates are always in continuous movement, and this slow relative motion causes such deformations of the earth’s crust as subsidence, crustal creeping, uplifts, etc. [141]. Tectonic-related ground and crustal deformations can be accurately documented by various geodetic tools, including leveling or laser ranging [127]. However, these traditional ground-based measuring instruments are both time- and labor-resource-consuming, and they are not always suitable for large-area and repeated observations. In contrast, such modern space technologies as SAR and GNSS make it possible to determine horizontal and vertical changes simultaneously and produce measurements in a range of minutes to several days.
The millimeter accuracy of measurements made by SAR systems as well as multi-time analysis techniques have provided excellent images of pre-seismic surface displacements [142]. SAR has been widely used in earthquake prediction research since the 1990s. Prior to this, coseismic deformations were determined by comparing and analyzing high-precision DEM data from two separate InSAR images taken before and after an earthquake [71]. However, the regular use of InSAR is limited due to temporal and geometrical decorrelation, as well as due to atmospheric disturbances [143]. Nevertheless, the latest developments in InSAR technology have brought new insights to the study of earthquakes. Ref. [142] applied the multi-temporal PS-InSAR technique to detect pre-seismic ground movements in the region of the Mw 6.3 L’Aquila, Italy, earthquake in 2009. They used ERS and ENVISAT PS datasets spanning 20 years and confirmed the presence of a 5-year coseismic uplift followed by subsidence in the study area, which is a precursor signal for an earthquake.
Like SAR, the Global Positioning System (GPS) has also been widely used for deformation measurements for many years. Since 2004, this observation technology has greatly assisted many seismic exploration activities [144]. GPS takes precedence over other surveying methods in terms of high accuracy of measurements, continuous data collection capability, and weather independence, providing new technical means to monitor surface deformations. Ref. [145] used GPS to determine the pre-seismic deformation model in Taiwan. Their study showed that short-term crustal displacements can be used as an indicator of pre-seismic displacements. Current GPS uses a 30 s data acquisition frequency to resolve single-day coordinates, which provide a means for describing the advancing movement of crustal deformations prior to an earthquake. With the developments in satellite hardware technology, the accuracy of high-frequency GPS has been greatly improved. Refs. [92,93] demonstrated that the use of GPS technology for earthquake prediction yields good results and can be expanded through a combination with other methods.

3.1.4. Gravity Anomaly Studies

Abnormal gravitational field behavior in the form of alternating changes in positive and negative gravity can be detected as much as 2 years prior to the commencement of seismic activity. During the active seismic phase, the internal stresses and strains exerted on the crust impact measurably on the gravitational field. Hence, changes arising from gravitational monitoring of the field can be effectively used to describe the underlying tectonic setting and define potentially hazardous seismic zones, as well as providing a basis for longer-term earthquake predictions [65]. However, predictions in this case are often limited by the irregularity in the distribution of satellite observation stations, relative length of the data acquisition period, and the slow-moving process of database updating [105]. The modern equipment of gravity satellites makes it possible to obtain global coverage data, high precision, and resolution of measurements, providing new opportunities for monitoring gravity field anomalies. The Gravity Recovery and Climate Experiment (GRACE) twin satellites launched in 2002 provide global gravity data updates every 7 to 30 days [146]. GRACE data were applied by [147] in measurements of pre-seismic gravitational changes associated with the Mw 9.1 Sumatra–Andaman, Indonesia, earthquake and associated tsunami of 26 December 2004 that cost almost a quarter of a million lives.
Ref. [65] presented time-series studies of three massive earthquakes, namely, Chile (27 February 2010), Tohuku-Oki (11 March 2011), and Indian Ocean (11 April 2012), that weekly gravity solutions from GRACE satellite data produced striking anomalies near the epicenter of each of these earthquakes several weeks before their occurrence. Other studies have confirmed the value of the GRACE time-series data in the Mw 8.8 Chilean earthquake of 2010 [148] and the 2004 Sumatra–Andaman and 2011 Tohoku-Oki earthquakes [147,149]. Ref. [150] adopted GRACE gravity data to determine the seismic changes at a higher level of spatial resolution using a Gaussian filter algorithm to separate signals from noise and applying a differential method to calculate spatial distributions of gravitational variations.
The summary and the main findings of this section are:
  • Thermal remote sensing is one of the most frequently used techniques in pre-seismic monitoring;
  • Remote sensing of electromagnetic pulse and variations in their patterns requires a complex mechanism with high-precision control performance;
  • InSAR and GNSS enable the measurement of pre-seismic movements of deformation, producing meaningful results;
  • Remote sensing of gravitational field anomalies remains a lesser-used tool due to the difficulties in detecting and isolating gravitational field anomalies.

3.2. Post-Earthquake Studies

Geospatial technologies also have several applications and offer advantages after the earthquake. Recent advances in geoinformatics offer new possibilities for earthquake emergency management [31]. Post-earthquake matters require significant attention to be paid to rescue and relief activities, damage assessments, land deformations, etc.
In the previous sections, the most up-to-date techniques for detecting land deformations, such as InSAR and GNSS, were discussed. Horizontal and vertical deformations ranging from tens of centimeters to several meters can be reliably detected after the impact. In addition to the techniques mentioned, Web GIS platforms now play a key role in real-time deformation mapping. For example, [151] integrated coseismic deformation data accessed from the United States Geological Survey National Earthquake Information Center (USGS-NEIC) into a Web GIS platform, called QuickDeform, and applied it to several large-magnitude earthquakes. Their study has shown that the framework works robustly and automatically generates the seismic deformation map within several minutes after the occurrence of an earthquake, thus providing an immediate basis for a reconstruction plan.
The following sections are assigned to rescue action and damage assessment based on geospatial techniques.

3.2.1. Post-Earthquake Rescue and Relief Activities

InSAR is invaluable not only for deformation monitoring but also to provide more accurate information regarding the trail of destruction of major earthquakes, in comparison with more easily accessible geodetic methods, thus providing a more refined and acute response to emergency situations [152]. Together with detailed demographic spatial information, InSAR satellite data can provide critical assistance to search-and-rescue teams and their respective management. Until 2014, the foremost limitation in converting geodetic data into an operative earthquake response was the low frequency of SAR data collection. In addition to frequency issues, another disadvantage of SAR was its revision period—post-seismic imaging could take up to weeks after an earthquake. Hence, SAR made a limited contribution to seismic response; however, since the most recent generation of SAR satellites, this has changed. The research of [152] is regarded as having contributed in advancing the use of SAR in earthquake emergency operations through their development of the Sentinel-1 SAR-Based Coseismic Deformation Monitoring Service to support relief in near real time.
Web-based geospatial platforms play a vital role in disaster relief efforts. This online GIS technology allows one to access geospatial information through web browsers [153]. It assists not only in rescue operations but also in the risk assessment and decision-making phases. Ref. [154] created an online GIS decision support platform to help experts evaluate and select from alternative risk management strategies. Ref. [155] demonstrated the role of Web GIS in developing an appropriate disaster management strategy. Using online-GIS platforms, geospatial information on the location of buildings, hospitals, fire stations, shelters, road grids, and population data can be displayed in real time, which was not possible prior to the advent of these technologies.
Returning to the formulation of rescue strategies, when an earthquake occurs in an urban area, decision makers and rescuers should draw the right conclusions within the first hours or even minutes. For this, the QuickDeform platform, which was specially developed for immediate detection of post-earthquake deformations, can also be used as a volunteered geographic information base for crowdsourcing disaster data, providing support for rescue and model validation. Immediate and open access to location information and the spatial details of natural disasters emphasize the importance of volunteered geographic information (VGI) in all stages of disaster management, including mitigation, preparation, response, and recovery. Thus, the practice of civil participation in the generation of online geospatial data points to new horizons in the development of disaster-related data. It also allows for the rapid exchange of geographic information at minimal cost compared to other traditional data collection methods, although this will provide additional data assembly and management challenges [156].
Earthquakes and related events, such as tsunamis, fires, oil liquefaction, flooding, and landslides, pose serious risks to road infrastructure. Recently, [157] proposed a Web GIS Decision Support System called CIPCast DSS, which supports the management of highway networks affected by earthquake damage in Italy and other European nations. Their goal was to establish the fastest response to such damaged areas.

3.2.2. Damage Assessment

The earthquake response stage consists of activities carried out during or immediately after the event to provide emergency assistance to victims [38]. In urban planning, the effective support of disaster risk management, mitigation, and reduction requires the use of a wealth of geospatial information, the handling of which has become one of the main challenges in this field [155]. Nevertheless, geospatial technology is certain to become an integral part of the earthquake response phase and rescue operations. In the Mw 6.6 Niigata Chuetsu-Oki earthquake in Japan in 2007, the high-resolution satellite imagery taken after the event was successfully overlaid onto Google Earth images. It is expected that this program and potential successors will play an important role in post-earthquake activities in the future [23]. The trend toward open access satellite data and freely accessible geodetic platforms facilitates the use of the imagery in seismic responses almost immediately after an earthquake [158].
Remote sensing data found its wide application in monitoring and earthquake-induced damage assessment studies. Building damage is considered to be one of the most destructive occasions caused by an earthquake. Visual interpretation of very-high-resolution images has been addressed since the first images were made available [159]. One of the first examples is related to the 2003 Boumerdes earthquake that occurred in Algeria [160], where several researchers argued about the use of the EMS damage scale to address the damage detection.
Ref. [159] summarized the methods of establishing earthquake damage as follows:
  • An interpretation technique applied to a dataset after an earthquake;
  • Change detection using pre- and post-earthquake images with the same sensor type and measurement geometry;
  • A change detection method using pre- and post-seismic data from different sensor types;
  • Data fusion with already-existing pre-seismic GIS layers and new in situ information (e.g., from seismic sensors).
Radar remote sensing data are extensively used in building damage applications. Ref. [161] compared PALSAR and TerraSAR-X observations for structural damage assessment in urban areas after an earthquake. PALSAR was found to be efficient for secondary geological disaster detection, while TerraSAR-X was shown to be better suited to building damage estimation in urban areas due to its higher-resolution imaging. Ref. [162] used SAR and optical imagery to assess and monitor damaged urban areas in the aftermath of the Mw 8.0 Great Wenchuan earthquake of 2008. Ref. [96] applied a fusion of optical and radar data to the Mw 7.6 Izmit, Turkey, earthquake of 1999 and Mw 6.6 Bam, Iran, earthquake of 2003, and concluded that SAR alone generated 70% optical imagery alone 82%, and their fusion generated 89% correct classifications.
Optical imagery can also be used to assess individual building damage. Refs. [163,164] used high-resolution optical images for building damage recognition following the Mw 6.3 L’Aquilla earthquake in Italy in 2009. Deep Learning (DL) is a machine learning method that supports the automatic extraction and precise computation of feature representations [165]. Refs. [166,167] used DL with pairs of high-resolution pre- and post-earthquake optical images to identify building damage. However, as [168,169] demonstrated, it is possible to use only one post-event image and extract the damage in DL.
The use of LiDAR to recognize damage to buildings has been studied by several researchers. Ref. [170] proposed an automatic building damage detection system based on LiDAR data. Research by [171] introduced an algorithm that enables the use of only post-earthquake LiDAR data to derive the degree of damage. Ref. [172] proposed a methodology for building damage assessment based on machine learning techniques combined with high-resolution satellite imagery and LiDAR measurements. Ref. [173] used a combination of LiDAR with satellite images to detect building damage in the post-seismic stage, while [174] combined LiDAR with VHR, and [175] used both LiDAR and SAR for building damage estimation.
Certain techniques and methods for extracting information from satellite images play a significant role. Data analysis (pixel-based or object-based approaches) is usually carried out using preprocessed and geometrically adjusted data and comprises classification, segmentation, geometric, and spectral information extraction, data selection, and aggregation [159]. Feature extraction techniques include spatial analysis, detection of changes, and the fusion of multiple data sources with GIS layers.
Ref. [176] demonstrated a segmentation technique in which the main goal was to locate and extract the damage to specific buildings that followed an earthquake from VHR aerial photographs, with an assumption that their shape and dimension were already saved as a GIS layer. A comparison of the original and detected post-event shapes produced a reliable classification between the seismically affected and undamaged structures. This process differs from other building damage studies in that it extracts information on damage by inference, in contrast with extracting damage by direct classification.
Ref. [177] created a post-earthquake map, following the Mw 7.4 Palu City, Indonesia, earthquake of 2018, which caused the loss of 2100 lives and damage to 70,000 buildings, using Artificial Neural Networks (ANNs) and Support Vector Machine (SVM), together with Landsat-8 and Sentinel-2 satellite image data. While the ANN and SVM methods yielded very similar results, the Landsat images produced 86% conformity and Sentinel only 64%. Several further methods of improving damage detection from satellite images were covered in the literature. Ref. [81] proposed a novel method based on multiscale adaptive feature fusion, which detects damage using textual heterogeneity. Ref. [178] refined the existing You Only Look Once, version 3 (YOLOv3) object detection method and was successfully applied to collapsed building detection.
Several recent studies implemented a combination of the multiscale segmentation method with a class of neural network called Convolutional Neural Networks (e.g., [179]), some explored segment-by-segment comparison techniques (e.g., [180]), some dealt with DL (e.g., [181]), some studies showed the integration of super-pixel segmentation based on deep learning techniques (e.g., [182]), some used automatic detection (e.g., [183]), and some used machine learning techniques [184]. Ref. [49] proposed a multitemporal coherence analysis and [100] examined ensemble learning classifiers.
In addition to damaged residential dwellings, historical buildings are also very significant. Numerous contributions have been made on the monitoring of heritage buildings and monuments. Ref. [185] used terrestrial LiDAR to assess the amount of deformation endangering the Walls of Istanbul (constructed ca. 413 AD) in Turkey. A similar study was conducted by [186], in which terrestrial laser scanning images were used to identify cracks caused by an earthquake. In [187], in situ measurements were combined with InSAR data for the monitoring of historical monuments in Italy.

4. The Application of RS in Earthquake Analysis

To ensure seismic resistance in urban settlements, two key issues need to be addressed: firstly, there is a need to develop a pre-seismic hazard mitigation program, and secondly, it is necessary to form plans on post-seismic event decision making, both of which are aimed at a reduction in potential economic losses [188]. This section qualifies as both pre- and post-earthquake activities, typically covering modelling pre-event loss forecasts for various urban areas, which are used in emergency planning.
Earthquake modelling and analysis include many techniques. The primary focus of this review section is to explain hazard, vulnerability, and risk assessment implementation geospatially. Earthquake hazard can be defined as the probability of a potentially destructive earthquake, characterized as an unavoidable event beyond human control, occurring at a given geographic location over a specific period of time [189,190]. Earthquake vulnerability is the amount of damage that could result from an earthquake of a given intensity [191]. Hazard and vulnerability serve as prerequisites for risk analysis and mapping [192]. Earthquake risk corresponds to the combination of potential social, economic, and cultural consequences in the built environment and people due to earthquakes. Hence, in a place where there are no people or values that can be affected by a natural event, there is no risk [25]. Although it is not possible to prevent earthquakes and the consequential disaster, there are preparatory processes that can minimize damage (less vulnerability) to human-populated localities [193,194].
Given the time efficiency and the accuracy of the data, RS is used as a benchmark for precise and rapid earthquake hazard assessments, as it takes only a brief time to make a correct decision shortly after a disaster. Earthquake-prone areas can be easily analyzed using RS methods and technological advances such as GeoEye-1 to ensure reliable operation and maximum uptime in earthquake risk and damage assessment [195]. Depending on the purpose of the analysis, the scale, and the required accuracy, geospatial data can provide the proper input for modelling. Since many satellites and data sources that can be used to collect earthquake data have already been discussed, some of the most reliable methods used in the literature are presented below. In general, these methods can be categorized as follows:
  • Experimental or numerical approaches, such as the Analytic Hierarchy Process (AHP) and the Analytical Network Process (ANP);
  • Individual analytical techniques, such as Artificial Neural Networks (ANNs), Multiple Logistic Regression (LR), Support Vector Machine (SVM), Ordered Weight Averaging (OWA), and Random Forest (RF);
  • Hybrid approaches, such as the Adaptive Neuro-fuzzy Inference System (ANFIS).

5. Earthquake Follow-on Disasters

This section focuses on potential natural disasters following an earthquake and the role of geospatial technology in detecting and recognizing these events. Several studies in the literature were aimed at the identification and recognition of the secondary effects of earthquakes through different satellite imagery and interpretation methods. Table 1 lists some examples of natural disasters triggered by an earthquake.
Among the major environmental impacts of earthquakes, landslides and subsidence of the Earth’s crust are covered by numerous studies. Ref. [225] explored the land subsidence caused by the 2015 Gorkha earthquake using the SBAS-DInSAR technique applied to pre-seismic PALSAR images and post-seismic Sentinel-1 A/B SAR images to calculate the spatiotemporal displacement before and after the event.
Two earthquakes of Mw 8.1 and Mw 7.1. that occurred in 2017 in the southwest area of Mexico caused significant subsidence and morphological change [226]. To study the effects of this subsidence, [227] used four interferometric pairs obtained from the Sentinel-1 radar satellite in IW (Interferometric Wide Swath), TOPS (Terrain Observation by Progressive Scan), SLC (Single Look Complex) mode. Refs. [228,229] undertook landslide vulnerability mapping using optical remote sensing combined with SAR/InSAR. Ref. [230] used a combination of three different satellite images to study the degree of subsidence caused by an earthquake. Ref. [231] determined the amount of vertical uplift by merging seismological data with DInSAR measurements. Ref. [232] examined rates of spatial and temporal distribution of strain due to earthquake sequences. Recently, novel advanced approaches have been proposed for the detection of landslides caused by earthquakes. Ref. [233] suggested a new method that facilitates the automatic identification of landslides, providing fast and efficient information for disaster mitigation. Ref. [234] conducted an experimental analysis using different machine learning techniques to map landslide susceptibility accurately. Ref. [235] used GIS-integrated remote sensing data to map landslide susceptibility by applying frequency ratio and logistic regression methods.
Ref. [234] studied the Ms 7.0 earthquake that struck China on 8 August 2017, triggering several landslides. The authors compared the performance of three computational models, namely, random forest (RF), logistic regression (LR), and support vector machine (SVM), to explore the qualitative characteristics of the distributions of propensity to landslides caused by an earthquake. Floods and tsunamis are other destructive secondary events following an earthquake. Ref. [217] identified flooded areas caused by the Tohoku 2011 earthquake by calculating the backscattering coefficients from TerraSAR-X intensity images.
Ref. [167] also studied the secondary effects of Tohoku 2011, using a U-Net Neural Network based on the Deep Learning technique to produce an earthquake–tsunami damage map. Refs. [219,220] combined remote sensing data with conventional surveying of inundation depths to classify building damage caused by the great Chilean tsunami. Tsunami fragility curves were used to classify the degree of damage to buildings and calculated using IKONOS images derived before and after the great Indian Ocean tsunami.

6. Limitations and Challenges

Although there are many possible uses for geospatial data in earthquake science and engineering, several challenges limit their wider usage. A review by [159] summarized the key limitations of using RS for earthquake damage assessment into three categories: the class of sensor and its orientation according to the area of interest; the capability of spatial resolution, which determines the size and level of detail of a target that can be detected by a sensor, both in terms of the degree of damage and in terms of the spatial or geographical feature; and temporal resolution, since the amount of time needed to revisit the area of interest provides the level and quantity of information on changes that have occurred.
Other challenges are described in this section. According to the literature, there are some limitations of geaospatial technology in data capturing. For instance, monitoring of the lithosphere using geospatial technologies has some limitations. It is still difficult to observe the tectonic movement and energy changes in the lithosphere directly, due to the impossibility of reaching such a depth. For this, the use of special equipment makes sense, such as the Kola Super-Deep Borehole (KSBD), which is the deepest penetration (more than 10,000 km depth) into the Earth’s crust and is located on the Kola Peninsula [236]. Another limitation is related to capturing weak gravity anomalies. Gravity anomalies, as another pre-earthquake indicator, can also be influenced by the environment. Gravity anomalies may have consequences of non-seismic changes, such as after structural construction or extreme temperatures changes [237]. In addition, recent studies have shown that major changes in the gravitational field observed from satellites are directly related to large seismic events [105]. Hence, small seismic events cannot be predicted. GNSS measurements, as another example of geospatial data capturing difficulties, are usually influenced by satellite and receiver clock errors, multipath errors, measurement noise, and satellite ephemeris errors. In earthquake prediction studies, a high-density GNSS network is required to obtain accurate data; therefore, this variable could reduce the reliability of the outcomes [238].
Geospatial data capturing challenges can also be seen in seismic damage assessments. The structural format of sensors and data collection tools limits the application of satellite data in capturing the full spectrum of damage associated with earthquakes. There are plenty of data acquisition techniques and methods, such as nadir-looking, side-looking, and sensor data collection, that directly measure the third dimension, just as LiDAR does. Aerial and spaceborne nadir-looking sensors (e.g., very-high-resolution optical sensors) can collect data on the structural state of building roofs and levels of debris in the vicinity but cannot display damage on the outer walls of the building. Side-view sensors (e.g., optical oblique photography) are capable of collecting more information and are more suitable for assessing levels of damage, but they might create difficulties when comparing acquired data with the ground. In addition, they are also less available, as the only broadly accessible side-looking spaceborne sensors rely on radar, whose effectiveness in metropolitan areas is severely hampered by multipath issues.
Environmental and meteorological factors are a further challenge. These adversely affect the accuracy and validity of geospatial data—inclement weather conditions, hilly terrain, and dense vegetation substantially reduce the accuracy of data acquired before and after an earthquake. For example, as mentioned in the pre-earthquake section (Section 3.1), it is possible to capture electromagnetic anomalies 3–6 days prior to an earthquake. However, in addition to the fact that electromagnetic fields in the ionosphere are vulnerable to environmental conditions, waves are also emitted from ground-based VLF, ULF, and ELF transmitters, radio stations, and also harmonic emissions from power lines. This phenomenon results in particle perturbation in the ionosphere and emission bands, thus causing false assumptions about the detection of earthquakes. The troposphere and ionosphere might also cause delays in GNSS measurement and affect the accuracy of high frequencies.
The current inherent characteristics of geospatial technology are another topic. Some limitations and challenges are related to the nature of geospatial technologies. The issue of obtaining data in the shortest time and challenges of providing a reliable product to emergency responders are some of the obvious weaknesses [239]. Distortions in satellite images (Sun–Earth–Sensor geometry) and their calibration also have an impact on satellite observations. Each sensor has a different spatial resolution, which also affects the data content in each image. Some of these issues may be addressed in the future through innovation and improvements in this area.
Another challenge is related to inherent characteristics of the precursor. Some of these characteristics provide additional difficulties in terms of detection and interpretation. For instance, concerning predictions, the only method is observing temperature changes prior to the event. However, thermal remote sensing data can also be affected by environmental and meteorological factors, such as thick cloud cover, snowstorms, heavy precipitation, vegetation layers, landform types, and altitude [56]. As an example, the outgoing longwave radiation (OLR) from the crust can be used as an earthquake precursor. However, this radiation is very sensitive to the meteorological parameters of temperature and humidity. Another earthquake precursor is surface latent heat flux (SLHF), which is strongly affected by water vapor molecules and the ion composition of the atmospheric aerosol [240].
An example of having both inherent limitations of RS and problems caused by nature can be seen in monitoring the linear infrastructure deformation [241]. First, when a linear infrastructure is located in a vegetation coverage area, it is difficult to use the InSAR to effectively measure its displacement owing to the temporal decorrelation effect. Another difficulty is that it is challenging to obtain the monitoring deformation of ultra-long-distance linear infrastructure. The simultaneous meeting of both high-resolution and large-area deformation measurement requirements is a critical problem.
Our current knowledge of the modeling and simulation techniques is considered as a limiting factor. The reason is that when predicting earthquakes, the weaknesses in applied models can cause problems. Once the precursors have been measured, it is necessary to create an integrated predictive model, which may already incorporate several abnormalities or precursors. To date, in the literature, most prediction models have been based on a single component with a very limited set of remote sensing data. Satellite and terrestrial observations are usually not considered in the latest forecasting models. The CQuake system was developed for coastal earthquakes and its data are limited to SLHF, weather and atmospheric factors, and previous seismic records. The Lithosphere–Cover–Atmosphere (LCA) model is another example that analyzes the parameters of several thermal anomalies in its predictions [242]. Another area of testing is related to the limitations in algorithms and methods used for extracting information from satellite images. The use of extraction algorithms impacts the data output of data [7,243].
According to our review, SAR and its related technologies (InSAR, D-InSAR, etc.) are a vast area of research. This paragraph summarizes the current issues with these technologies. The major limitation of InSAR technology in earthquake applications is that it is sensitive to one-dimensional motion along the line of sight (LOS) [10], while ground deformation is generally characterized using three-dimensional data [244]. To determine three-dimensional deformations with InSAR requires a satellite with both left and right viewing capability in a non-polar orbit. Another weakness of InSAR technology is that the maximum recoverable displacement of InSAR depends on the band wavelength. Diversified terrain and slope topography also hamper the visibility of SAR sensors. Thus, selection of the appropriate orbit and SAR data type is crucial. Furthermore, each InSAR technique is applicable to specific research objectives. The study of crustal deformations is limited to landslides [141]. The major drawbacks of D-InSAR technology include poor temporal resolution [69], spatial-temporal decorrelation [245], tropospheric and ionospheric signal noise [246], and its limited output capacity of one-dimensional measurements in the line of sight (LOS) [247].
In some cases, complexity could be considered as a limitation. For instance, the technical part of InSAR processing is sometimes equivocal and difficult to understand [248]. Cost and data accessibility can be considered as other challenges, for instance, PS-InSAR with a millimeter accuracy, which is a promising technique for earthquake deformation monitoring, though it is not easily accessible. Another example is about LiDAR data, which are very accurate data with a variety of applications in earthquake studies; however, they entail higher data acquisition costs and greater processing time [79]. Although LiDAR is a great source for many accurate measurements, it is not without weak points. For example, LiDAR can detect partial or complete collapse more effectively than optical or radar data but offers no advantage in terms of side damage detection.
Despite the many limitations of geospatial techniques in earthquake studies, the advantages are innumerable. Earth observation data are the basis for disaster monitoring because of their wide-scale coverage, rapid processing capability, and the high impact of observed phenomena in terms of both human and economic losses. Thereby, geospatial is an ongoing technology, which will always be in demand. The future of geospatial technology in the domain of natural hazards, based on its history of constant advances and the harnessing of global forces to counter the growing threat of climate change, is certain to produce novel techniques that overcome many of the limitations encountered in this review of earthquake research and technology.

7. Conclusions

With the rapid development of spatial information and computer sciences, GIS and remote sensing are now more widely used in relation to earthquakes and seismology. This review paper summarized the most recent and commonly used geospatial products, techniques, and applications in terms of the range of pre- and post-earthquake activities. Information was grouped into four categories: (1) the role of geospatial data in earthquake studies; (2) the role of remote sensing at different stages of an earthquake; (3) the application of RS in earthquake analysis; (4) earthquake follow-on disasters.
Despite numerous achievements in seismic science and earthquake engineering over the last few years, geospatial technology remains invaluable in minimizing the damage caused by earthquakes. For instance, inadequate knowledge about the spatial distributions of debris makes accessing locations for earthquake emergency responses far more difficult. In addition, the rapid assessment of the after-effects of an earthquake using geospatial technologies can significantly improve emergency response time, reduce the risk, and minimize human causalities during an earthquake. Geospatial data compensate for the shortage of spatial data concerning damage distribution and location, and this information can be used to validate and improve the analytical models used to predict earthquake damage. Subsequently, improving these models will enhance earthquake-resistant design methods, which, in turn, will result in less damage from future earthquakes. GIS technology also facilitates the rapid processing of complex information, which supports the development of special strategies to mitigate the effects of natural disasters.
Several studies have confirmed that the SAR technique is a powerful tool for detecting slow movement of the Earth’s crust at a variety of scales. SAR has also revealed fundamental limitations in modeling earthquake focal mechanisms. The method has proven its suitability in detecting the ground deformations that may precede seismic events and, therefore, is critically important in predicting strategies that advance the quest to uncover the diagnostic precursors of large earthquakes.
Regarding earthquake prediction, no operational methods have, to date, been considered successful in accurately predicting earthquake occurrence. Our study confirms that this necessitates establishing comprehensive multiparameter analytical systems.
In conclusion, the study evidenced that geospatial techniques are predominantly employed in the post-earthquake phases. Efforts to strengthen the application of geospatial technology in the field of earthquake and seismic research, improving capacity in the collection of spatial data collection of seismic events, to enhance the social value and impact of earthquake-related information, demand further research. There is no phase, before, during, or after the earthquake event, in which some form of RS should not be incorporated. Based on the ongoing progress in the technology and the regular launching of new satellites with improved sensor refinement, much more can be expected from remote sensing.

Author Contributions

Conceptualization, M.S., M.B., F.S., H.Ö.; methodology, M.S., M.B., F.S.; investigation, M.S., M.B., F.S., B.P., B.K., H.Ö.; writing—original draft preparation, M.S., M.B., F.S., B.P., B.K., H.Ö.; writing—review and editing, M.S., M.B., F.S., B.P., B.K., H.Ö.; visualization, M.S., M.B., F.S.; supervision, M.S., M.B., F.S., B.P., B.K., H.Ö.; funding acquisition, M.S., H.Ö. All authors have read and agreed to the published version of the manuscript.

Funding

The publication fees has been paid by BAP Project (No. 18881) entitled “Developing an easy-to-use national InSAR web service that will automatically process InSAR data and complement existing seismology data: A Case Study for 2020 Elazığ Earthquake”.

Data Availability Statement

Not applicable.

Acknowledgments

We would like to thank Scientific Research Projects (BAP) (No. 18881), Bogazi-ci University, for supporting this research.

Conflicts of Interest

The author declares no conflict of interest.

References

  1. Baize, S.; Nurminen, F.; Sarmiento, A.; Dawson, T.; Takao, M.; Scotti, O.; Azuma, T.; Boncio, P.; Champenois, J.; Cinti, F.R. A worldwide and unified database of surface ruptures (SURE) for fault displacement hazard analyses. Seismol. Res. Lett. 2020, 91, 499–520. [Google Scholar] [CrossRef] [Green Version]
  2. Massonnet, D.; Feigl, K.; Rossi, M.; Adragna, F. Radar interferometric mapping of deformation in the year after the Landers earthquake. Nature 1994, 369, 227–230. [Google Scholar] [CrossRef]
  3. Parisi, F.; Augenti, N. Earthquake damages to cultural heritage constructions and simplified assessment of artworks. Eng. Fail. Anal. 2013, 34, 735–760. [Google Scholar] [CrossRef]
  4. Kader, M.A.; Jahan, I. A review of the application of remote sensing technologies in earthquake disaster management: Potentialities and challenges. In Proceedings of the International Conference on Disaster Risk Management, Dhaka, Bangladesh, 12–14 January 2019; 2019; pp. 12–14. [Google Scholar]
  5. Tronin, A.A. Satellite remote sensing in seismology. A review. Remote Sens. 2010, 2, 124–150. [Google Scholar] [CrossRef] [Green Version]
  6. Lu, C.-H.; Ni, C.-F.; Chang, C.-P.; Yen, J.-Y.; Chuang, R.Y. Coherence difference analysis of sentinel-1 SAR interferogram to identify earthquake-induced disasters in urban areas. Remote Sens. 2018, 10, 1318. [Google Scholar] [CrossRef] [Green Version]
  7. Saraf, A.K.; Choudhury, S. Thermal remote sensing technique in the study of pre-earthquake thermal anomalies. J. Ind. Geophys. Union 2005, 9, 197–207. [Google Scholar]
  8. Ahmedov, B.J.; Mirzaev, B.S.; Mamatov, F.M.; Khodzhaev, D.A.; Julliev, M.K. Integrating of gis and gps for ionospheric perturbations in d-And f-layers using vlf receiver. InterCarto InterGIS 2020, 26, 547–560. [Google Scholar] [CrossRef]
  9. Hayakawa, M.; Molchanov, O. Achievements of NASDA’s earthquake remote sensing frontier project. Terr. Atmos. Ocean. Sci. 2004, 15, 311–327. [Google Scholar] [CrossRef] [Green Version]
  10. Shen, X.; Zhang, X.; Hong, S.; Jing, F.; Zhao, S. Progress and development on multi-parameters remote sensing application in earthquake monitoring in China. Earthq. Sci. 2013, 26, 427–437. [Google Scholar] [CrossRef] [Green Version]
  11. Rashed, T.; Weeks, J. Assessing vulnerability to earthquake hazards through spatial multicriteria analysis of urban areas. Int. J. Geogr. Inf. Sci. 2003, 17, 547–576. [Google Scholar] [CrossRef]
  12. Duzgun, H.; Yucemen, M.; Kalaycioglu, H.; Celik, K.; Kemec, S.; Ertugay, K.; Deniz, A. An integrated earthquake vulnerability assessment framework for urban areas. Nat. Hazards 2011, 59, 917–947. [Google Scholar] [CrossRef]
  13. Hosseini, K.A.; Hosseini, M.; Izadkhah, Y.O.; Mansouri, B.; Shaw, T. Main challenges on community-based approaches in earthquake risk reduction: Case study of Tehran, Iran. Int. J. Disaster Risk Reduct. 2014, 8, 114–124. [Google Scholar] [CrossRef]
  14. Singh, D.; Pandey, D.; Mina, U. Earthquake—A natural disaster, prediction, mitigation, laws and government policies, impact on biogeochemistry of earth crust, role of remote sensing and GIS in management in india—An overview. J. Geosci 2019, 7, 88–96. [Google Scholar]
  15. Mück, M.; Taubenböck, H.; Post, J.; Wegscheider, S.; Strunz, G.; Sumaryono, S.; Ismail, F. Assessing building vulnerability to earthquake and tsunami hazard using remotely sensed data. Nat. Hazards 2013, 68, 97–114. [Google Scholar] [CrossRef]
  16. McKibbin, D.J.; Blake, D.M.; Wilson, T.M.; Wotherspoon, L.; Hughes, M.W. A geospatial assessment of critical infrastructure impacts and adaptations in small rural towns following the 14 November 2016 (Kaikōura) earthquake, New Zealand. Jpn. Geotech. Soc. Spec. Publ. 2019, 6, 19–29. [Google Scholar] [CrossRef] [Green Version]
  17. Bengtsson, L.; Lu, X.; Thorson, A.; Garfield, R.; Von Schreeb, J. Improved response to disasters and outbreaks by tracking population movements with mobile phone network data: A post-earthquake geospatial study in Haiti. PLoS Med. 2011, 8, e1001083. [Google Scholar] [CrossRef] [PubMed] [Green Version]
  18. Deelstra, A.; Bristow, D. Characterizing Uncertainty in City-Wide Disaster Recovery through Geospatial Multi-Lifeline Restoration Modeling of Earthquake Impact in the District of North Vancouver. Int. J. Disaster Risk Sci. 2020, 11, 807–820. [Google Scholar] [CrossRef]
  19. Pirasteh, S.; Shamsipour, G.; Liu, G.; Hajibagheri, R.; Ghasemzadeh, A.; Jokar, M.; Zarbakhsh, H.; Behnamfar, F.; Li, J. Cloud-based geospatial platform in support of sustainable development goals 2030: How to be prepared for earthquake disasters? Int. Arch. Photogramm. Remote Sens. Spat. Inf. Sci. 2020, 43, 1705–1708. [Google Scholar] [CrossRef]
  20. Dong, L.; Shan, J. A comprehensive review of earthquake-induced building damage detection with remote sensing techniques. ISPRS J. Photogramm. Remote Sens. 2013, 84, 85–99. [Google Scholar] [CrossRef]
  21. Booth, E.; Saito, K.; Spence, R.; Madabhushi, G.; Eguchi, R.T. Validating assessments of seismic damage made from remote sensing. Earthq. Spectra 2011, 27 (Suppl. S1), 157–177. [Google Scholar] [CrossRef]
  22. Yamazaki, F. Applications of remote sensing and GIS for damage assessment. Struct. Saf. Reliab. 2001, 1, 12. [Google Scholar]
  23. Rathje, E.M.; Adams, B.J. The role of remote sensing in earthquake science and engineering: Opportunities and challenges. Earthq. Spectra 2008, 24, 471–492. [Google Scholar] [CrossRef]
  24. Armaş, I. Earthquake risk perception in Bucharest, Romania. Risk Anal. 2006, 26, 1223–1234. [Google Scholar] [CrossRef]
  25. Kron, W. Flood risk= hazard. Values. Vulnerability. Water Int. 2005, 30, 58–68. [Google Scholar] [CrossRef]
  26. Govorčin, M.; Herak, M.; Matoš, B.; Pribičević, B.; Vlahović, I. Constraints on Complex Faulting during the 1996 Ston–Slano (Croatia) earthquake inferred from the DInSAR, seismological, and geological observations. Remote Sens. 2020, 12, 1157. [Google Scholar] [CrossRef] [Green Version]
  27. Verrelst, J.; Camps-Valls, G.; Muñoz-Marí, J.; Rivera, J.P.; Veroustraete, F.; Clevers, J.G.; Moreno, J. Optical remote sensing and the retrieval of terrestrial vegetation bio-geophysical properties—A review. ISPRS J. Photogramm. Remote Sens. 2015, 108, 273–290. [Google Scholar] [CrossRef]
  28. Martynski, K.; Blecki, J.; Wronowski, R.; Kulak, A.; Mlynarczyk, J.; Iwanski, R. In Mesoscale convective systems as a source of electromagnetic signals registered by ground-based system and DEMETER (Detection of Electro-Magnetic Emissions Transmitted from Earthquake Regions) satellite. Ann. Geophys. 2021, 39, 321–326. [Google Scholar] [CrossRef]
  29. Zhima, Z.; Hu, Y.; Piersanti, M.; Shen, X.; De Santis, A.; Yan, R.; Yang, Y.; Zhao, S.; Zhang, Z.; Wang, Q. The seismic electromagnetic emissions during the 2010 Mw 7.8 Northern Sumatra Earthquake revealed by DEMETER satellite. Front. Earth Sci. 2020, 8, 572393. [Google Scholar] [CrossRef]
  30. Thach, N.N.; Ngo, D.B.-T.; Xuan-Canh, P.; Hong-Thi, N.; Thi, B.H.; Nhat-Duc, H.; Dieu, T.B. Spatial pattern assessment of tropical forest fire danger at Thuan Chau area (Vietnam) using GIS-based advanced machine learning algorithms: A comparative study. Ecol. Inform. 2018, 46, 74–85. [Google Scholar] [CrossRef]
  31. Pollino, M.; Fattoruso, G.; Rocca, A.B.D.; Porta, L.L.; Curzio, S.L.; Arolchi, A.; James, V.; Pascale, C. An open source GIS system for earthquake early warning and post-event emergency management. In Proceedings of the International Conference on Computational Science and Its Applications, Santander, Spain, 20–23 June 2011; Springer: Berlin/Heidelberg, Germany, 2011; pp. 376–391. [Google Scholar]
  32. Frigerio, I.; Ventura, S.; Strigaro, D.; Mattavelli, M.; De Amicis, M.; Mugnano, S.; Boffi, M. A GIS-based approach to identify the spatial variability of social vulnerability to seismic hazard in Italy. Appl. Geogr. 2016, 74, 12–22. [Google Scholar] [CrossRef]
  33. Nyimbili, P.H.; Erden, T.; Karaman, H. Integration of GIS, AHP and TOPSIS for earthquake hazard analysis. Nat. Hazards 2018, 92, 1523–1546. [Google Scholar] [CrossRef]
  34. Rahman, N.; Ansary, M.A.; Islam, I. GIS based mapping of vulnerability to earthquake and fire hazard in Dhaka city, Bangladesh. Int. J. Disaster Risk Reduct. 2015, 13, 291–300. [Google Scholar] [CrossRef]
  35. Sahar, L.; Muthukumar, S.; French, S.P. Using aerial imagery and GIS in automated building footprint extraction and shape recognition for earthquake risk assessment of urban inventories. IEEE Trans. Geosci. Remote Sens. 2010, 48, 3511–3520. [Google Scholar] [CrossRef]
  36. Hashemi, M.; Alesheikh, A.A. A GIS-based earthquake damage assessment and settlement methodology. Soil Dyn. Earthq. Eng. 2011, 31, 1607–1617. [Google Scholar] [CrossRef]
  37. Emrich, C.T.; Cutter, S.L.; Weschler, P.J. GIS and emergency management. The SAGE Handbook of GIS and Society; Sage: Thousand Oaks, CA, USA, 2011; pp. 321–343. [Google Scholar]
  38. Abdalla, R.; Esmail, M. WebGIS techniques and applications. In WebGIS for Disaster Management and Emergency Response; Springer: Berlin/Heidelberg, Germany, 2019; pp. 45–55. [Google Scholar]
  39. Li, B.; Wu, J.; Pan, M.; Huang, J. Application of 3D WebGIS and real-time technique in earthquake information publishing and visualization. Earthq. Sci. 2015, 28, 223–231. [Google Scholar] [CrossRef] [Green Version]
  40. Nawa, Y.; Urakawa, G.; Ikemi, H.; Hamamoto, R.; Hayashi, H. Geography Network for Sharing Geospatial Information in Disaster Management. J. Disaster Res. 2010, 5, 108–116. [Google Scholar] [CrossRef]
  41. Jiang, Y.; Wang, C.; Zhao, X. Damage assessment of tunnels caused by the 2004 Mid Niigata Prefecture Earthquake using Hayashi’s quantification theory type II. Nat. Hazards 2010, 53, 425–441. [Google Scholar] [CrossRef] [Green Version]
  42. Sawada, M.; Yagi, H.; Hayashi, H. A study on the technique for information sharing and presentation of earthquake disasters: By the chuetsu earthquake restoration and revival support GIS project. J. Soc. Saf. Sci. 2005, 8, 97–102. [Google Scholar]
  43. Yalçıner, Ö. Urban Information Systems for Earthquake-Resistant Cities: A Case Study on Pendik, İstanbul. Ph.D. Thesis, Middle East Technical University, Ankara, Türkiye, 2002. [Google Scholar]
  44. Phuong, N.H.; Nam, N.T. Development of a Web-GIS based Decision Support System for earthquake warning service in Vietnam. Vietnam J. Earth Sci. 2018, 40, 193–206. [Google Scholar] [CrossRef] [Green Version]
  45. Rovithis, E.; Makra, K.; Kirtas, E.; Manesis, C.; Bliziotis, D.; Konstantinidou, K. Field monitoring of strong ground motion in urban areas: The Kalochori Accelerometric Network (KAN), database and Web-GIS portal. Earthq. Spectra 2018, 34, 471–501. [Google Scholar] [CrossRef]
  46. Tan, Q.; Liu, Q.; Sun, Z. Research and Application of Beijing Earthquake Disaster Prevention System Based on GIS. In Proceedings of the 2018 IEEE International Conference on Computer and Communication Engineering Technology (CCET), Beijing, China, 18–20 August 2018; IEEE: Piscataway, NY, USA, 2018; pp. 275–279. [Google Scholar]
  47. Wardle, J. Tracking Trends in Earthquakes and Tropical Storms: A Web GIS Application. Ph.D. Thesis, University of Southern California, Los Angeles, CA, USA, 2019. [Google Scholar]
  48. Giuliani, G.; Peduzzi, P. The PREVIEW Global Risk Data Platform: A geoportal to serve and share global data on risk to natural hazards. Nat. Hazards Earth Syst. Sci. 2011, 11, 53–66. [Google Scholar] [CrossRef] [Green Version]
  49. Hasanlou, M.; Shah-Hosseini, R.; Seydi, S.T.; Karimzadeh, S.; Matsuoka, M. Earthquake damage region detection by multitemporal coherence map analysis of radar and multispectral imagery. Remote Sens. 2021, 13, 1195. [Google Scholar] [CrossRef]
  50. Van Puymbroeck, N.; Michel, R.; Binet, R.; Avouac, J.-P.; Taboury, J. Measuring earthquakes from optical satellite images. Appl. Opt. 2000, 39, 3486–3494. [Google Scholar] [CrossRef]
  51. Gold, R.D.; Clark, D.; Barnhart, W.D.; King, T.; Quigley, M.; Briggs, R.W. Surface rupture and distributed deformation revealed by optical satellite imagery: The intraplate 2016 Mw 6.0 Petermann Ranges earthquake, Australia. Geophys. Res. Lett. 2019, 46, 10394–10403. [Google Scholar] [CrossRef]
  52. Akhoondzadeh, M. An Adaptive Network-based Fuzzy Inference System for the detection of thermal and TEC anomalies around the time of the Varzeghan, Iran, (Mw = 6.4) earthquake of 11 August 2012. Adv. Space Res. 2013, 52, 837–852. [Google Scholar] [CrossRef]
  53. Yao, Q.-L.; Qiang, Z.-J. The elliptic stress thermal field prior to MS 7.3 Yutian, and MS 8.0 Wenchuan earthquakes in China in 2008. Nat. Hazards 2010, 54, 307–322. [Google Scholar] [CrossRef]
  54. Gorny, V.; Salman, A.; Tronin, A.; Shilin, B. Terrestrial outgoing infrared radiation as an indicator of seismic activity. arXiv 2020, arXiv:2001.1176. [Google Scholar]
  55. Gornyi, V.I.; Sal’Man, A.G.; Tronin, A.A.; Shilin, B.V. Outgoing Infrared Radiation of the Earth as an Indicator of Seismic Activity; Akademiia Nauk SSSR Doklady: Moscow, Russia, 1988; pp. 67–69. [Google Scholar]
  56. Choudhury, S.; Dasgupta, S.; Saraf, A.K.; Panda, S. Remote sensing observations of pre-earthquake thermal anomalies in Iran. Int. J. Remote Sens. 2006, 27, 4381–4396. [Google Scholar] [CrossRef]
  57. Hafeez, A.; Ehsan, M.; Abbas, A.; Shah, M.; Shahzad, R. Machine learning-based thermal anomalies detection from MODIS LST associated with the Mw 7.7 Awaran, Pakistan earthquake. Nat. Hazards 2022, 111, 2097–2115. [Google Scholar] [CrossRef]
  58. Shah, M.; Qureshi, R.U.; Khan, N.G.; Ehsan, M.; Yan, J. Artificial Neural Network based thermal anomalies associated with earthquakes in Pakistan from MODIS LST. J. Atmos. Sol. Terr. Phys. 2021, 215, 105568. [Google Scholar] [CrossRef]
  59. Bhardwaj, A.; Singh, S.; Sam, L.; Joshi, P.; Bhardwaj, A.; Martín-Torres, F.J.; Kumar, R. A review on remotely sensed land surface temperature anomaly as an earthquake precursor. Int. J. Appl. Earth Obs. Geoinf. 2017, 63, 158–166. [Google Scholar] [CrossRef]
  60. Ghobadi-Far, K.; Han, S.-C.; Allgeyer, S.; Tregoning, P.; Sauber, J.; Behzadpour, S.; Mayer-Gürr, T.; Sneeuw, N.; Okal, E. GRACE gravitational measurements of tsunamis after the 2004, 2010, and 2011 great earthquakes. J. Geod. 2020, 94, 65. [Google Scholar] [CrossRef]
  61. Jing, F.; Singh, R.P.; Cui, Y.; Sun, K. Microwave brightness temperature characteristics of three strong earthquakes in Sichuan Province, China. IEEE J. Sel. Top. Appl. Earth Obs. Remote Sens. 2020, 13, 513–522. [Google Scholar] [CrossRef]
  62. Qi, Y.; Miao, Z.; Wu, L.; Ding, Y. Seismic microwave brightness temperature anomaly detection using multitemporal passive microwave satellite images: Ideas and limits. IEEE J. Sel. Top. Appl. Earth Obs. Remote Sens. 2021, 14, 6792–6806. [Google Scholar] [CrossRef]
  63. Maeda, T.; Takano, T. Detection of microwave signals associated with rock failures in an earthquake from satellite-borne microwave radiometer data. In Proceedings of the 2009 IEEE International Geoscience and Remote Sensing Symposium, Cape Town, South Africa, 12–17 July 2009; IEEE: Piscataway, NY, USA, 2009; p. III–61. [Google Scholar]
  64. Maeda, T.; Takano, T. Detection algorithm of earthquake-related rock failures from satellite-borne microwave radiometer data. IEEE Trans. Geosci. Remote Sens. 2009, 48, 1768–1776. [Google Scholar] [CrossRef]
  65. Shahrisvand, M.; Akhoondzadeh, M.; Sharifi, M.A. Detection of gravity changes before powerful earthquakes in GRACE satellite observations. Ann. Geophys. 2014, 57, A0543. [Google Scholar] [CrossRef]
  66. Berlin, G.L.; Schaber, G.G.; Horstman, K.C. Possible fault detection in Cottonball Basin, California: An application of radar remote sensing. Remote Sens. Environ. 1980, 10, 33–42. [Google Scholar] [CrossRef]
  67. Parcharidis, I.; Kokkalas, S.; Fountoulis, I.; Foumelis, M. Detection and monitoring of active faults in urban environments: Time series interferometry on the cities of Patras and Pyrgos (Peloponnese, Greece). Remote Sens. 2009, 1, 676–696. [Google Scholar] [CrossRef] [Green Version]
  68. Ghosh, S.; Sivasankar, T.; Anand, G. Performance evaluation of multi-parametric synthetic aperture radar data for geological lineament extraction. Int. J. Remote Sens. 2021, 42, 2574–2593. [Google Scholar] [CrossRef]
  69. Hu, J.; Li, Z.; Ding, X.; Zhu, J.; Zhang, L.; Sun, Q. Resolving three-dimensional surface displacements from InSAR measurements: A review. Earth-Sci. Rev. 2014, 133, 1–17. [Google Scholar] [CrossRef]
  70. Cetin, E.; Cakir, Z.; Meghraoui, M.; Ergintav, S.; Akoglu, A.M. Extent and distribution of aseismic slip on the Ismetpaşa segment of the North Anatolian Fault (Turkey) from Persistent Scatterer InSAR. Geochem. Geophys. Geosystems 2014, 15, 2883–2894. [Google Scholar] [CrossRef] [Green Version]
  71. Massonnet, D.; Rossi, M.; Carmona, C.; Adragna, F.; Peltzer, G.; Feigl, K.; Rabaute, T. The displacement field of the Landers earthquake mapped by radar interferometry. Nature 1993, 364, 138–142. [Google Scholar] [CrossRef]
  72. Wright, T.J.; Elliott, J.R.; Wang, H.; Ryder, I. Earthquake cycle deformation and the Moho: Implications for the rheology of continental lithosphere. Tectonophysics 2013, 609, 504–523. [Google Scholar] [CrossRef]
  73. Elliott, J.; Jolivet, R.; González, P.J.; Avouac, J.-P.; Hollingsworth, J.; Searle, M.; Stevens, V. Himalayan megathrust geometry and relation to topography revealed by the Gorkha earthquake. Nat. Geosci. 2016, 9, 174–180. [Google Scholar] [CrossRef] [Green Version]
  74. Elliott, J.; Walters, R.; Wright, T. The role of space-based observation in understanding and responding to active tectonics and earthquakes. Nat. Commun. 2016, 7, 13844. [Google Scholar] [CrossRef] [PubMed] [Green Version]
  75. Majumdar, T.; Massonnet, D. D-InSAR applications for monitoring of geological hazards with special reference to Latur earthquake 1993. Curr. Sci. 2002, 83, 502–508. [Google Scholar]
  76. Ferretti, A.; Prati, C.; Rocca, F. Permanent scatterers in SAR interferometry. IEEE Trans. Geosci. Remote Sens. 2001, 39, 8–20. [Google Scholar] [CrossRef]
  77. Maghsoudi, Y.; van der Meer, F.; Hecker, C.; Perissin, D.; Saepuloh, A. Using PS-InSAR to detect surface deformation in geothermal areas of West Java in Indonesia. Int. J. Appl. Earth Obs. Geoinf. 2018, 64, 386–396. [Google Scholar] [CrossRef]
  78. Hamling, I.J.; Hreinsdóttir, S.; Clark, K.; Elliott, J.; Liang, C.; Fielding, E.; Litchfield, N.; Villamor, P.; Wallace, L.; Wright, T.J. Complex multifault rupture during the 2016 M w 7.8 Kaikōura earthquake, New Zealand. Science 2017, 356, eaam7194. [Google Scholar] [CrossRef] [Green Version]
  79. Maruyama, Y.; Tashiro, A.; Yamazaki, F. Detection of collapsed buildings due to earthquakes using a digital surface model constructed from aerial images. J. Earthq. Tsunami 2014, 8, 1450003. [Google Scholar] [CrossRef]
  80. Chen, R.-F.; Lin, C.-W.; Chen, Y.-H.; He, T.-C.; Fei, L.-Y. Detecting and characterizing active thrust fault and deep-seated landslides in dense forest areas of southern Taiwan using airborne LiDAR DEM. Remote Sens. 2015, 7, 15443–15466. [Google Scholar] [CrossRef] [Green Version]
  81. Zhang, R.; Duan, K.; You, S.; Wang, F.; Tan, S. A novel remote sensing detection method for buildings damaged by earthquake based on multiscale adaptive multiple feature fusion. Geomat. Nat. Hazards Risk 2020, 11, 1912–1938. [Google Scholar] [CrossRef]
  82. Aoyagi, Y.; Kageshima, M.; Onuma, T.; Homma, S.; Mukoyama, S. Fault Displacement of the 2011 M w 6.6 Fukushima-ken Hamadori Earthquake Based on a 3D Crustal Deformation Model Constructed Using Differential InSAR–Lidar. Bull. Seismol. Soc. Am. 2021, 111, 2303–2316. [Google Scholar] [CrossRef]
  83. Van Ballegooy, S.; Berryman, K.; Deam, B.; Jacka, M. Repeated major episodes of tectonic deformation, lateral spread and liquefaction in Christchurch during the Canterbury Earthquake Sequence of 2010–2011. In Engineering Geology for Society and Territory-Volume 5; Springer: Berlin/Heidelberg, Germany, 2015; pp. 1043–1049. [Google Scholar]
  84. Baris, A.; Spacagna, R.L.; Paolella, L.; Koseki, J.; Modoni, G. Liquefaction fragility of sewer pipes derived from the case study of Urayasu (Japan). Bull. Earthq. Eng. 2021, 19, 3963–3986. [Google Scholar] [CrossRef]
  85. Calais, E.; Minster, J.B. GPS detection of ionospheric perturbations following the January 17, 1994, Northridge earthquake. Geophys. Res. Lett. 1995, 22, 1045–1048. [Google Scholar] [CrossRef]
  86. Pulinets, S.A.; Krankowski, A.; Hernandez-Pajares, M.; Marra, S.; Cherniak, I.; Zakharenkova, I.; Rothkaehl, H.; Kotulak, K.; Davidenko, D.; Blaszkiewicz, L. Ionosphere Sounding for Pre-seismic anomalies identification (INSPIRE): Results of the project and Perspectives for the short-term earthquake forecast. Front. Earth Sci. 2021, 9, 131. [Google Scholar] [CrossRef]
  87. Miyazaki, S. The nationwide GPS array as an earth observation system. Tech. Rep. Bull. Geogr. Surv. Inst. 1998, 44, 11–22. [Google Scholar]
  88. Burgmann, R.; Ayhan, M.E.; Fielding, E.J.; Wright, T.J.; McClusky, S.; Aktug, B.; Demir, C.; Lenk, O.; Turkezer, A. Deformation during the 12 November 1999 Duzce, Turkey, earthquake, from GPS and InSAR data. Bull. Seismol. Soc. Am. 2002, 92, 161–171. [Google Scholar] [CrossRef]
  89. Anzidei, M.; Boschi, E.; Cannelli, V.; Devoti, R.; Esposito, A.; Galvani, A.; Melini, D.; Pietrantonio, G.; Riguzzi, F.; Sepe, V. Coseismic deformation of the destructive 6 April 2009 L’Aquila earthquake (central Italy) from GPS data. Geophys. Res. Lett. 2009, 36, 39145. [Google Scholar] [CrossRef]
  90. Sharma, Y.; Pasari, S.; Dikshit, O.; Ching, K. GPS-based monitoring of crustal deformation in Garhwal-Kumaun Himalaya. In Proceedings of the ISPRS TC V Mid-term Symposium “Geospatial Technology—Pixel to People”, Dehradun, India, 20–23 November 2018; pp. 451–454. [Google Scholar]
  91. Zedek, F.; Rolland, L.M.; Mikesell, T.D.; Sladen, A.; Delouis, B.; Twardzik, C.; Coïsson, P. Locating surface deformation induced by earthquakes using GPS, GLONASS and Galileo ionospheric sounding from a single station. Adv. Space Res. 2021, 68, 3403–3416. [Google Scholar] [CrossRef]
  92. Bock, Y.; Melgar, D.; Crowell, B.W. Real-time strong-motion broadband displacements from collocated GPS and accelerometers. Bull. Seismol. Soc. Am. 2011, 101, 2904–2925. [Google Scholar] [CrossRef]
  93. Emore, G.L.; Haase, J.S.; Choi, K.; Larson, K.M.; Yamagiwa, A. Recovering seismic displacements through combined use of 1-Hz GPS and strong-motion accelerometers. Bull. Seismol. Soc. Am. 2007, 97, 357–378. [Google Scholar] [CrossRef]
  94. Dalla Mura, M.; Prasad, S.; Pacifici, F.; Gamba, P.; Chanussot, J.; Benediktsson, J.A. Challenges and opportunities of multimodality and data fusion in remote sensing. Proc. IEEE 2015, 103, 1585–1601. [Google Scholar] [CrossRef] [Green Version]
  95. Gamba, P. Image and data fusion in remote sensing of urban areas: Status issues and research trends. Int. J. Image Data Fusion 2014, 5, 2–12. [Google Scholar] [CrossRef]
  96. Stramondo, S.; Bignami, C.; Chini, M.; Pierdicca, N.; Tertulliani, A. Satellite radar and optical remote sensing for earthquake damage detection: Results from different case studies. Int. J. Remote Sens. 2006, 27, 4433–4447. [Google Scholar] [CrossRef]
  97. Motagh, M.; Vajedian, S.; Behling, R.; Haghshenas Haghighi, M.; Roessner, S.; Akbari, B.; Wetzel, H.-U.; Darabi, A. 12 November 2017 Mw 7.3 Sarpol-e Zahab, Iran, earthquake: Results from combining radar and optical remote sensing measurements with geophysical modeling and field mapping. In EGU General Assembly Conference Abstracts, Proceedings of the 20th EGU General Assembly, EGU2018, Vienna, Austria, 4–13 April 2018; EGU: Munich, Germany, 2018; p. 10528. [Google Scholar]
  98. Fan, X.; Du, X.; Tan, J.; Zhu, J. Three-dimensional visualization simulation assessment system based on multi-source data fusion for the Wenchuan earthquake. J. Appl. Remote Sens. 2009, 3, 031640. [Google Scholar] [CrossRef]
  99. Fuhrmann, T.; Garthwaite, M.C. Resolving three-dimensional surface motion with InSAR: Constraints from multi-geometry data fusion. Remote Sens. 2019, 11, 241. [Google Scholar] [CrossRef] [Green Version]
  100. Adriano, B.; Xia, J.; Baier, G.; Yokoya, N.; Koshimura, S. Multi-source data fusion based on ensemble learning for rapid building damage mapping during the 2018 sulawesi earthquake and tsunami in Palu, Indonesia. Remote Sens. 2019, 11, 886. [Google Scholar] [CrossRef] [Green Version]
  101. Kuenzer, C.; Dech, S.; Wagner, W. Remote sensing time series revealing land surface dynamics: Status quo and the pathway ahead. In Remote Sensing Time Series; Springer: Berlin/Heidelberg, Germany, 2015; pp. 1–24. [Google Scholar]
  102. Tronin, A.A. Remote sensing and earthquakes: A review. Phys. Chem. Earth Parts A/B/C 2006, 31, 138–142. [Google Scholar] [CrossRef]
  103. Daout, S.; Steinberg, A.; Isken, M.P.; Heimann, S.; Sudhaus, H. Illuminating the spatio-temporal evolution of the 2008–2009 Qaidam earthquake sequence with the joint use of InSAR time series and teleseismic data. Remote Sens. 2020, 12, 2850. [Google Scholar] [CrossRef]
  104. Liu, F.; Elliott, J.; Craig, T.; Hooper, A.; Wright, T. Improving the resolving power of InSAR for earthquakes using time series: A case study in Iran. Geophys. Res. Lett. 2021, 48, e2021GL093043. [Google Scholar] [CrossRef]
  105. Zhao, X.; Pan, S.; Sun, Z.; Guo, H.; Zhang, L.; Feng, K. Advances of satellite remote sensing technology in earthquake prediction. Nat. Hazards Rev. 2021, 22, 03120001. [Google Scholar] [CrossRef]
  106. Ihmle, P.F.; Jordan, T.H. Teleseismic search for slow precursors to large earthquakes. Science 1994, 266, 1547–1551. [Google Scholar] [CrossRef] [PubMed] [Green Version]
  107. Tramutoli, V.; Cuomo, V.; Filizzola, C.; Pergola, N.; Pietrapertosa, C. Assessing the potential of thermal infrared satellite surveys for monitoring seismically active areas: The case of Kocaeli (Izmit) earthquake, August 17, 1999. Remote Sens. Environ. 2005, 96, 409–426. [Google Scholar] [CrossRef]
  108. Alvan, H.V.; Mansor, S.; Omar, H.; Azad, F.H. Precursory signals associated with the 2010 M8. 8 Bio-Bio earthquake (Chile) and the 2010 M7. 2 Baja California earthquake (Mexico). Arab. J. Geosci. 2014, 7, 4889–4897. [Google Scholar] [CrossRef]
  109. Balasis, G.; Mandea, M. Can electromagnetic disturbances related to the recent great earthquakes be detected by satellite magnetometers? Tectonophysics 2007, 431, 173–195. [Google Scholar] [CrossRef]
  110. Dobrovolsky, I.; Gershenzon, N.I.; Gokhberg, M.B. Theory of electrokinetic effects occurring at the final stage in the preparation of a tectonic earthquake. Phys. Earth Planet. Inter. 1989, 57, 144–156. [Google Scholar] [CrossRef]
  111. Martinelli, G. Contributions to a history of earthquake prediction research. Seismol. Res. Lett. 2000, 71, 583–588. [Google Scholar] [CrossRef]
  112. Geller, R.J. Earthquake prediction: A critical review. Geophys. J. Int. 1997, 131, 425–450. [Google Scholar] [CrossRef] [Green Version]
  113. Pulinets, S. Ionospheric precursors of earthquakes; recent advances in theory and practical applications. Terr. Atmos. Ocean. Sci. 2004, 15, 413–436. [Google Scholar] [CrossRef]
  114. Guo, G.; Wang, B. Cloud anomaly before Iran earthquake. Int. J. Remote Sens. 2008, 29, 1921–1928. [Google Scholar] [CrossRef]
  115. Ingebritsen, S.E.; Manga, M. Hydrogeochemical precursors. Nat. Geosci. 2014, 7, 697–698. [Google Scholar] [CrossRef]
  116. Yoshizawa, K. International Association of Seismology and Physics of the Earth’s Interior. In Geosciences: The Future; IUGG: Potsdam, Germany, 2003; p. 11. [Google Scholar]
  117. Wang, G.; Liu, Y.; Xu, J. Short-term failure mechanism triggered by hydraulic fracturing. Energy Sci. Eng. 2020, 8, 592–601. [Google Scholar] [CrossRef]
  118. Sornette, D.; Mearns, E.; Wheatley, S. Revisiting the predictability of the Haicheng and Tangshan earthquakes. Symmetry 2021, 13, 1206. [Google Scholar] [CrossRef]
  119. Paudel, S.R.; Banjara, S.P.; Wagle, A.; Freund, F.T. Earthquake chemical precursors in groundwater: A review. J. Seismol. 2018, 22, 1293–1314. [Google Scholar] [CrossRef]
  120. Solanky, V.; Singh, S.; Katiyar, S. Land surface temperature estimation using remote sensing data. In Hydrologic Modeling; Springer: Berlin/Heidelberg, Germany, 2018; pp. 343–351. [Google Scholar]
  121. Zoran, M.A.; Savastru, R.S.; Savastru, D.M. Satellite thermal infrared anomalies associated with strong earthquakes in the Vrancea area of Romania. Open Geosci. 2015, 7, 606–617. [Google Scholar]
  122. Mahmood, I.; Iqbal, M.F.; Shahzad, M.I.; Waqas, A. Investigation of earthquake thermal precursors in active tectonic regions of the world. J. Geodyn. 2020, 141, 101785. [Google Scholar] [CrossRef]
  123. Khalili, M.; Panah, S.K.A.; Eskandar, S.S.A. Using Robust Satellite Technique (RST) to determine thermal anomalies before a strong earthquake: A case study of the Saravan earthquake (April 16th, 2013, MW = 7.8, Iran). J. Asian Earth Sci. 2019, 173, 70–78. [Google Scholar] [CrossRef]
  124. Barkat, A.; Ali, A.; Rehman, K.; Awais, M.; Riaz, M.S.; Iqbal, T. Thermal IR satellite data application for earthquake research in Pakistan. J. Geodyn. 2018, 116, 13–22. [Google Scholar] [CrossRef]
  125. Malyshkov, Y.P.; Malyshkov, S.Y. Eccentric rotation of the earth’s core and lithosphere: Origin of deformation waves and their practical application. In The Earth’s Core: Structure, Properties and Dynamics; Nova Science Publishers: Hauppauge, NY, USA, 2011; pp. 113–209. [Google Scholar]
  126. Malyshkov, Y.P.; Malyshkov, S.Y. Periodicity of geophysical fields and seismicity: Possible links with core motion. Russ. Geol. Geophys. 2009, 50, 115–130. [Google Scholar] [CrossRef]
  127. Cicerone, R.D.; Ebel, J.E.; Britton, J. A systematic compilation of earthquake precursors. Tectonophysics 2009, 476, 371–396. [Google Scholar] [CrossRef]
  128. Huang, Q.; Han, P.; Hattori, K.; Ren, H. Electromagnetic Signals Associated with Earthquakes: A Review of Observations, Data Processing, and Mechanisms in China. In Seismoelectric Exploration: Theory, Experiments, and Applications; AGU: Washington, DC, USA, 2020; pp. 415–436. [Google Scholar]
  129. Leonard, R.S.; Barnes, R., Jr. Observation of ionospheric disturbances following the Alaska earthquake. J. Geophys. Res. 1965, 70, 1250–1253. [Google Scholar] [CrossRef]
  130. Larkina, V.; Nalivayko, A.; Gershenzon, N.I.; Gokhberg, M.B.; Liperovskiy, V.; Shalimov, S. Observations of VLF emission, related with seismic activity, on the Interkosmos-19 satellite. Geomagn. Aeron. 1983, 23, 684. [Google Scholar]
  131. Serebryakova, O.; Bilichenko, S.; Chmyrev, V.; Parrot, M.; Rauch, J.-L.; Lefeuvre, F.; Pokhotelov, O. Electromagnetic ELF radiation from earthquake regions as observed by low-altitude satellites. Geophys. Res. Lett. 1992, 19, 91–94. [Google Scholar] [CrossRef]
  132. Larkina, V.; Migulin, V.; Molchanov, O.; Kharkov, I.; Inchin, A.; Schvetcova, V. Some statistical results on very low frequency radiowave emissions in the upper ionosphere over earthquake zones. Phys. Earth Planet. Inter. 1989, 57, 100–109. [Google Scholar] [CrossRef]
  133. Hayakawa, M.; Molchanov, O. Summary report of NASDA’s earthquake remote sensing frontier project. Phys. Chem. Earth Parts A/B/C 2004, 29, 617–625. [Google Scholar] [CrossRef]
  134. Walker, S.; Kadirkamanathan, V.; Pokhotelov, O. In Changes in the ultra-low frequency wave field during the precursor phase to the Sichuan earthquake: DEMETER observations. Ann. Geophys. 2013, 31, 1597–1603. [Google Scholar] [CrossRef] [Green Version]
  135. Akhoondzadeh, M.; De Santis, A.; Marchetti, D.; Wang, T. Developing a Deep Learning-Based Detector of Magnetic, Ne, Te and TEC Anomalies from Swarm Satellites: The Case of Mw 7.1 2021 Japan Earthquake. Remote Sens. 2022, 14, 1582. [Google Scholar] [CrossRef]
  136. De Santis, A.; Cianchini, G.; Marchetti, D.; Piscini, A.; Sabbagh, D.; Perrone, L.; Campuzano, S.A.; Inan, S. A Multiparametric Approach to Study the Preparation Phase of the 2019 M7. 1 Ridgecrest (California, United States) Earthquake. Front. Earth Sci. 2020, 8, 540398. [Google Scholar] [CrossRef]
  137. De Santis, A.; Marchetti, D.; Pavón-Carrasco, F.J.; Cianchini, G.; Perrone, L.; Abbattista, C.; Alfonsi, L.; Amoruso, L.; Campuzano, S.A.; Carbone, M. Precursory worldwide signatures of earthquake occurrences on Swarm satellite data. Sci. Rep. 2019, 9, 20287. [Google Scholar] [CrossRef] [PubMed] [Green Version]
  138. Marchetti, D.; De Santis, A.; D’Arcangelo, S.; Poggio, F.; Piscini, A.; Campuzano, S.A.; De Carvalho, W.V. Pre-earthquake chain processes detected from ground to satellite altitude in preparation of the 2016–2017 seismic sequence in Central Italy. Remote Sens. Environ. 2019, 229, 93–99. [Google Scholar] [CrossRef]
  139. Marchetti, D.; De Santis, A.; Shen, X.; Campuzano, S.A.; Perrone, L.; Piscini, A.; Di Giovambattista, R.; Jin, S.; Ippolito, A.; Cianchini, G. Possible Lithosphere-Atmosphere-Ionosphere Coupling effects prior to the 2018 Mw = 7.5 Indonesia earthquake from seismic, atmospheric and ionospheric data. J. Asian Earth Sci. 2020, 188, 104097. [Google Scholar] [CrossRef]
  140. Hao, G.; Guo, J.; Zhang, W.; Chen, Y.; Yuen, D.A. High-precision chaotic radial basis function neural network model: Data forecasting for the Earth electromagnetic signal before a strong earthquake. Geosci. Front. 2022, 13, 101315. [Google Scholar] [CrossRef]
  141. Yi, Z.; Xingmin, M.; Allesandro, N.; Tom, D.; Guan, C.; Colm, J.; Yuanxi, L.; Xiaojun, S. Characterization of pre-failure deformation and evolution of a large earthflow using InSAR monitoring and optical image interpretation. Landslides 2021, 19, 35–50. [Google Scholar] [CrossRef]
  142. Nardò, S.; Ascione, A.; Mazzuoli, S.; Terranova, C.; Vilardo, G. PS-InSAR data analysis: Pre-seismic ground deformation in the 2009 L’Aquila earthquake region. Boll. Di Geofis. Teor. Ed. Appl. 2020. [Google Scholar]
  143. Prati, C.; Ferretti, A.; Perissin, D. Recent advances on surface ground deformation measurement by means of repeated space-borne SAR observations. J. Geodyn. 2010, 49, 161–170. [Google Scholar] [CrossRef] [Green Version]
  144. Chen, Y. Earthquake prediction: Retrospect and prospect. Sci. China Earth Sci. 2009, 3912, 1633–1658. [Google Scholar]
  145. Chen, C.-H.; Yeh, T.-K.; Wen, S.; Meng, G.; Han, P.; Tang, C.-C.; Liu, J.-Y.; Wang, C.-H. Unique pre-earthquake deformation patterns in the spatial domains from GPS in Taiwan. Remote Sens. 2020, 12, 366. [Google Scholar] [CrossRef] [Green Version]
  146. Jiang, D.; Wang, J.; Huang, Y.; Zhou, K.; Ding, X.; Fu, J. The review of GRACE data applications in terrestrial hydrology monitoring. Adv. Meteorol. 2014, 2014, 725131. [Google Scholar] [CrossRef] [Green Version]
  147. Han, S.-C.; Shum, C.-K.; Bevis, M.; Ji, C.; Kuo, C.-Y. Crustal dilatation observed by GRACE after the 2004 Sumatra-Andaman earthquake. Science 2006, 313, 658–662. [Google Scholar] [CrossRef] [Green Version]
  148. Heki, K.; Matsuo, K. Coseismic gravity changes of the 2010 earthquake in central Chile from satellite gravimetry. Geophys. Res. Lett. 2010, 37, 45335. [Google Scholar] [CrossRef] [Green Version]
  149. ZHANG, K.-L.; MA, J.; WEI, D.-P. Detection of gravity anomalies before the 2011 Mw9. 0 Tohoku-Oki earthquake using Superconducting gravimeters. Chin. J. Geophys. 2013, 56, 2292–2302. [Google Scholar]
  150. Zhang, G.; Fu, G.; Zhou, X. The evolution process of gravitational field after the Sumatra Mw9. 3 earthquake from GRACE RL05 data. J. Geodes. Geodyn 2015, 35, 303–308. [Google Scholar]
  151. Zhao, R.; Liu, X.; Xu, W. Integration of coseismic deformation into WebGIS for near real-time disaster evaluation and emergency response. Environ. Earth Sci. 2020, 79, 414. [Google Scholar] [CrossRef]
  152. Li, Y.; Jiang, W.; Zhang, J.; Li, B.; Yan, R.; Wang, X. Sentinel-1 SAR-Based coseismic deformation monitoring service for rapid geodetic imaging of global earthquakes. Nat. Hazards Res. 2021, 1, 11–19. [Google Scholar] [CrossRef]
  153. Wu, X.; Xu, C.; Xu, X.; Chen, G.; Zhu, A.; Zhang, L.; Yu, G.; Du, K. A Web-GIS hazards information system of the 2008 Wenchuan Earthquake in China. Nat. Hazards Res. 2022, 2, 210–217. [Google Scholar] [CrossRef]
  154. Aye, Z.C.; Jaboyedoff, M.; Derron, M.-H.; Van Westen, C.J. Prototype of a web-based participative decision support platform in natural hazards and risk management. ISPRS Int. J. Geo-Inf. 2015, 4, 1201–1224. [Google Scholar] [CrossRef] [Green Version]
  155. Damalas, A.; Mettas, C.; Evagorou, E.; Giannecchini, S.; Iasio, C.; Papadopoulos, M.; Konstantinou, A.; Hadjimitsis, D. Development and Implementation of a DECATASTROPHIZE platform and tool for the management of disasters or multiple hazards. Int. J. Disaster Risk Reduct. 2018, 31, 589–601. [Google Scholar] [CrossRef]
  156. Haworth, B.; Bruce, E. A review of volunteered geographic information for disaster management. Geogr. Compass 2015, 9, 237–250. [Google Scholar] [CrossRef]
  157. Giovinazzi, S.; Pollino, M.; Rosato, V.; Clemente, P.; Buffarini, G. A decision support system for the emergency management of highways in the event of earthquakes. In A Decision Support System for the Emergency Management of Highways in the Event of Earthquakes; Pisa University Press: Pisa, Italy, 2019; pp. 101–110. [Google Scholar]
  158. Barnhart, W.D.; Hayes, G.P.; Wald, D.J. Global earthquake response with imaging geodesy: Recent examples from the USGS NEIC. Remote Sens. 2019, 11, 1357. [Google Scholar] [CrossRef] [Green Version]
  159. Dell’Acqua, F.; Gamba, P. Remote sensing and earthquake damage assessment: Experiences, limits, and perspectives. Proc. IEEE 2012, 100, 2876–2890. [Google Scholar] [CrossRef]
  160. Yamazaki, F.; Kouchi, K.i.; Kohiyama, M.; Muraoka, N.; Matsuoka, M. Earthquake damage detection using high-resolution satellite images. In IGARSS 2004, Proceedings of the 2004 IEEE International Geoscience and Remote Sensing Symposium, Anchorage, AK, USA, 20–24 September 2004; IEEE: Piscataway, NJ, USA, 2004; pp. 2280–2283. [Google Scholar]
  161. Dong, Y.; Li, Q.; Dou, A.; Wang, X. Extracting damages caused by the 2008 Ms 8.0 Wenchuan earthquake from SAR remote sensing data. J. Asian Earth Sci. 2011, 40, 907–914. [Google Scholar] [CrossRef]
  162. Guo, H.; Liu, L.; Lei, L.; Wu, Y.; Li, L.; Zhang, B.; Zuo, Z.; Li, Z. Dynamic analysis of the Wenchuan Earthquake disaster and reconstruction with 3-year remote sensing data. Int. J. Digit. Earth 2010, 3, 355–364. [Google Scholar] [CrossRef]
  163. Barazzetti, L.; Cuca, B. Identification of Buildings Damaged by Natural Hazards Using Very High-Resolution Satellite Images: The Case of Earthquake in L’Aquila, Italy. In Remote Sensing for Archaeology and Cultural Landscapes; Springer: Berlin/Heidelberg, Germany, 2020; pp. 139–151. [Google Scholar]
  164. Anniballe, R.; Noto, F.; Scalia, T.; Bignami, C.; Stramondo, S.; Chini, M.; Pierdicca, N. Earthquake damage mapping: An overall assessment of ground surveys and VHR image change detection after L’Aquila 2009 earthquake. Remote Sens. Environ. 2018, 210, 166–178. [Google Scholar] [CrossRef]
  165. Barmpoutis, P.; Papaioannou, P.; Dimitropoulos, K.; Grammalidis, N. A review on early forest fire detection systems using optical remote sensing. Sensors 2020, 20, 6442. [Google Scholar] [CrossRef]
  166. Ji, M.; Liu, L.; Du, R.; Buchroithner, M.F. A comparative study of texture and convolutional neural network features for detecting collapsed buildings after earthquakes using pre-and post-event satellite imagery. Remote Sens. 2019, 11, 1202. [Google Scholar] [CrossRef] [Green Version]
  167. Bai, Y.; Mas, E.; Koshimura, S. Towards operational satellite-based damage-mapping using u-net convolutional network: A case study of 2011 tohoku earthquake-tsunami. Remote Sens. 2018, 10, 1626. [Google Scholar] [CrossRef] [Green Version]
  168. Chen, M.; Wang, X.; Dou, A.; Wu, X. The extraction of post-earthquake building damage informatiom based on convolutional neural network. In Proceedings of the International Archives of the Photogrammetry, Remote Sensing & Spatial Information Sciences ISPRS TC III Mid-term Symposium “Developments, Technologies and Applications in Remote Sensing”, Beijing, China, 7–10 May 2018; Volume 42. [Google Scholar]
  169. Vetrivel, A.; Gerke, M.; Kerle, N.; Nex, F.; Vosselman, G. Disaster damage detection through synergistic use of deep learning and 3D point cloud features derived from very high resolution oblique aerial images, and multiple-kernel-learning. ISPRS J. Photogramm. Remote Sens. 2018, 140, 45–59. [Google Scholar] [CrossRef]
  170. Janalipour, M.; Mohammadzadeh, A. A novel and automatic framework for producing building damage map using post-event LiDAR data. Int. J. Disaster Risk Reduct. 2019, 39, 101238. [Google Scholar] [CrossRef]
  171. Aixia, D.; Zongjin, M.; Shusong, H.; Xiaoqing, W. Building damage extraction from post-earthquake airborne LiDAR data. Acta Geol. Sin. -Engl. Ed. 2016, 90, 1481–1489. [Google Scholar] [CrossRef]
  172. Eslamizade, F.; Rastiveis, H.; Zahraee, N.K.; Jouybari, A.; Shams, A. Decision-level fusion of satellite imagery and LiDAR data for post-earthquake damage map generation in Haiti. Arab. J. Geosci. 2021, 14, 1120. [Google Scholar] [CrossRef]
  173. Khodaverdi, N.; Rastiveis, H.; Jouybari, A. Combination of post-earthquake LiDAR data and satellite imagery for buildings damage detection. Earth Obs. Geomat. Eng. 2019, 3, 12–20. [Google Scholar]
  174. Wang, X.; Li, P. Extraction of urban building damage using spectral, height and corner information from VHR satellite images and airborne LiDAR data. ISPRS J. Photogramm. Remote Sens. 2020, 159, 322–336. [Google Scholar] [CrossRef]
  175. Saganeiti, L.; Amato, F.; Nolè, G.; Vona, M.; Murgante, B. Early estimation of ground displacements and building damage after seismic events using SAR and LiDAR data: The case of the Amatrice earthquake in central Italy, on 24th August 2016. Int. J. Disaster Risk Reduct. 2020, 51, 101924. [Google Scholar] [CrossRef]
  176. Turker, M.; Sumer, E. Building-based damage detection due to earthquake using the watershed segmentation of the post-event aerial images. Int. J. Remote Sens. 2008, 29, 3073–3089. [Google Scholar] [CrossRef]
  177. Syifa, M.; Kadavi, P.R.; Lee, C.-W. An artificial intelligence application for post-earthquake damage mapping in Palu, central Sulawesi, Indonesia. Sensors 2019, 19, 542. [Google Scholar] [CrossRef] [PubMed] [Green Version]
  178. Ma, H.; Liu, Y.; Ren, Y.; Yu, J. Detection of collapsed buildings in post-earthquake remote sensing images based on the improved YOLOv3. Remote Sens. 2020, 12, 44. [Google Scholar] [CrossRef] [Green Version]
  179. Huang, H.; Sun, G.; Zhang, X.; Hao, Y.; Zhang, A.; Ren, J.; Ma, H. Combined multiscale segmentation convolutional neural network for rapid damage mapping from postearthquake very high-resolution images. J. Appl. Remote Sens. 2019, 13, 022007. [Google Scholar] [CrossRef]
  180. Khodaverdizahraee, N.; Rastiveis, H.; Jouybari, A. Segment-by-segment comparison technique for earthquake-induced building damage map generation using satellite imagery. Int. J. Disaster Risk Reduct. 2020, 46, 101505. [Google Scholar] [CrossRef]
  181. Seydi, S.; Rastiveis, H. A deep learning framework for roads network damage assessment using post-earthquake lidar data. In Proceedings of the International Archives of the Photogrammetry, Remote Sensing and Spatial Information Sciences, Karaj, Iran, 12–14 October 2019. [Google Scholar]
  182. Song, D.; Tan, X.; Wang, B.; Zhang, L.; Shan, X.; Cui, J. Integration of super-pixel segmentation and deep-learning methods for evaluating earthquake-damaged buildings using single-phase remote sensing imagery. Int. J. Remote Sens. 2020, 41, 1040–1066. [Google Scholar] [CrossRef]
  183. Wang, C.; Antos, S.E.; Triveno, L.M. Automatic detection of unreinforced masonry buildings from street view images using deep learning-based image segmentation. Autom. Constr. 2021, 132, 103968. [Google Scholar] [CrossRef]
  184. Wang, Y.; Cui, L.; Zhang, C.; Chen, W.; Xu, Y.; Zhang, Q. A Two-Stage Seismic Damage Assessment Method for Small, Dense, and Imbalanced Buildings in Remote Sensing Images. Remote Sens. 2022, 14, 1012. [Google Scholar] [CrossRef]
  185. Batur, M.; Yilmaz, O.; Ozener, H. A Case Study of Deformation Measurements of Istanbul Land Walls via Terrestrial Laser Scanning. IEEE J. Sel. Top. Appl. Earth Obs. Remote Sens. 2020, 13, 6362–6371. [Google Scholar] [CrossRef]
  186. Jiang, H.; Li, Q.; Jiao, Q.; Wang, X.; Wu, L. Extraction of wall cracks on earthquake-damaged buildings based on TLS point clouds. IEEE J. Sel. Top. Appl. Earth Obs. Remote Sens. 2018, 11, 3088–3096. [Google Scholar] [CrossRef]
  187. Cavalagli, N.; Kita, A.; Falco, S.; Trillo, F.; Costantini, M.; Ubertini, F. Satellite radar interferometry and in-situ measurements for static monitoring of historical monuments: The case of Gubbio, Italy. Remote Sens. Environ. 2019, 235, 111453. [Google Scholar] [CrossRef]
  188. Kim, T.; Song, J.; Kwon, O.S. Pre-and post-earthquake regional loss assessment using deep learning. Earthq. Eng. Struct. Dyn. 2020, 49, 657–678. [Google Scholar] [CrossRef]
  189. Jena, R.; Pradhan, B.; Beydoun, G.; Sofyan, H.; Affan, M. Integrated model for earthquake risk assessment using neural network and analytic hierarchy process: Aceh province, Indonesia. Geosci. Front. 2020, 11, 613–634. [Google Scholar] [CrossRef]
  190. Preciado, A.; Ramirez-Gaytan, A.; Salido-Ruiz, R.A.; Caro-Becerra, J.L.; Lujan-Godinez, R. Earthquake risk assessment methods of unreinforced masonry structures: Hazard and vulnerability. Earthq. Struct 2015, 9, 719–733. [Google Scholar] [CrossRef]
  191. Bolin, R.; Stanford, L. The Northridge Earthquake: Vulnerability and Disaster; Routledge: London, UK, 2006. [Google Scholar]
  192. Chaulagain, H.; Rodrigues, H.; Silva, V.; Spacone, E.; Varum, H. Seismic risk assessment and hazard mapping in Nepal. Nat. Hazards 2015, 78, 583–602. [Google Scholar] [CrossRef]
  193. Hagenlocher, M.; Renaud, F.G.; Haas, S.; Sebesvari, Z. Vulnerability and risk of deltaic social-ecological systems exposed to multiple hazards. Sci. Total Environ. 2018, 631, 71–80. [Google Scholar] [CrossRef] [Green Version]
  194. McEntire, D. Understanding and reducing vulnerability: From the approach of liabilities and capabilities. Disaster Prev. Manag. Int. J. 2012, 20, 294–313. [Google Scholar] [CrossRef]
  195. Sari, A.M.; Fakhrurrozi, A. Earthquake Hazard Analysis Methods: A Review. In IOP Conference Series: Earth and Environmental Science, 2018; IOP Publishing: Bristol, UK, 2018; p. 012044. [Google Scholar]
  196. Shan, X.-J.; Zhang, G.-H.; Wang, C.-S.; Li, Y.-C.; Qu, C.-Y.; Song, X.-G.; Yu, L.; Liu, Y.-H. Joint inversion for the spatial fault slip distribution of the 2015 Nepal MW7. 9 earthquake based on InSAR and GPS observations. Chin. J. Geophys. 2015, 58, 4266–4276. [Google Scholar]
  197. Sreejith, K.; Sunil, P.; Agrawal, R.; Saji, A.P.; Ramesh, D.; Rajawat, A. Coseismic and early postseismic deformation due to the 25 April 2015, Mw 7.8 Gorkha, Nepal, earthquake from InSAR and GPS measurements. Geophys. Res. Lett. 2016, 43, 3160–3168. [Google Scholar] [CrossRef] [Green Version]
  198. Yamazaki, F.; Yano, Y.; Matsuoka, M. Visual damage interpretation of buildings in Bam city using QuickBird images following the 2003 Bam, Iran, earthquake. Earthq. Spectra 2005, 21 (Suppl. S1), 329–336. [Google Scholar] [CrossRef]
  199. Chiroiu, L. Damage assessment of the 2003 Bam, Iran, earthquake using Ikonos imagery. Earthq. Spectra 2005, 21 (Suppl. S1), 219–224. [Google Scholar] [CrossRef]
  200. Turker, M.; San, B. SPOT HRV data analysis for detecting earthquake-induced changes in Izmit, Turkey. Int. J. Remote Sens. 2003, 24, 2439–2450. [Google Scholar] [CrossRef]
  201. Park, S.-E.; Jung, Y.T. Detection of earthquake-induced building damages using polarimetric SAR data. Remote Sens. 2020, 12, 137. [Google Scholar] [CrossRef] [Green Version]
  202. Wang, Y.; Feng, W.; Chen, K.; Samsonov, S. Source characteristics of the 28 September 2018 Mw 7.4 Palu, Indonesia, earthquake derived from the advanced land observation satellite 2 data. Remote Sens. 2019, 11, 1999. [Google Scholar] [CrossRef] [Green Version]
  203. Fang, J.; Xu, C.; Wen, Y.; Wang, S.; Xu, G.; Zhao, Y.; Yi, L. The 2018 Mw 7.5 Palu earthquake: A supershear rupture event constrained by InSAR and broadband regional seismograms. Remote Sens. 2019, 11, 1330. [Google Scholar] [CrossRef] [Green Version]
  204. Chini, M.; Atzori, S.; Trasatti, E.; Bignami, C.; Kyriakopoulos, C.; Tolomei, C.; Stramondo, S. The May 12, 2008, (Mw 7.9) Sichuan earthquake (China): Multiframe ALOS-PALSAR DInSAR analysis of coseismic deformation. IEEE Geosci. Remote Sens. Lett. 2009, 7, 266–270. [Google Scholar] [CrossRef]
  205. Wang, S.; Xu, C.; Wen, Y.; Yin, Z.; Jiang, G.; Fang, L. Slip model for the 25 November 2016 Mw 6.6 Aketao earthquake, western China, revealed by Sentinel-1 and ALOS-2 observations. Remote Sens. 2017, 9, 325. [Google Scholar] [CrossRef] [Green Version]
  206. Lajoie, L.J.; Nissen, E.; Johnson, K.L.; Arrowsmith, J.R.; Glennie, C.L.; Hinojosa-Corona, A.; Oskin, M.E. Extent of low-angle normal slip in the 2010 El Mayor-Cucapah (Mexico) earthquake from differential lidar. J. Geophys. Res. Solid Earth 2019, 124, 943–956. [Google Scholar] [CrossRef] [Green Version]
  207. Sengar, S.S.; Kumar, A.; Ghosh, S.K.; Wason, H.R.; Roy, P.S. Liquefaction identification using class-based sensor independent approach based on single pixel classification after 2001 Bhuj, India earthquake. J. Appl. Remote Sens. 2012, 6, 063531. [Google Scholar]
  208. Franke, K.W.; Rollins, K.M.; Ledezma, C.; Hedengren, J.D.; Wolfe, D.; Ruggles, S.; Bender, C.; Reimschiissel, B. Reconnaissance of two liquefaction sites using small unmanned aerial vehicles and structure from motion computer vision following the April 1, 2014 Chile earthquake. J. Geotech. Geoenvironmental Eng. 2017, 143, 04016125. [Google Scholar] [CrossRef]
  209. Civico, R.; Brunori, C.A.; De Martini, P.M.; Pucci, S.; Cinti, F.R.; Pantosti, D. Liquefaction susceptibility assessment in fluvial plains using airborne lidar: The case of the 2012 Emilia earthquake sequence area (Italy). Nat. Hazards Earth Syst. Sci. 2015, 15, 2473–2483. [Google Scholar] [CrossRef] [Green Version]
  210. Ganas, A.; Elias, P.; Briole, P.; Valkaniotis, S.; Escartin, J.; Tsironi, V.; Karasante, I.; Kosma, C. Co-seismic and post-seismic deformation, field observations and fault model of the 30 October 2020 Mw= 7.0 Samos earthquake, Aegean Sea. Acta Geophys. 2021, 69, 999–1024. [Google Scholar] [CrossRef]
  211. Sato, H.P.; Hasegawa, H.; Fujiwara, S.; Tobita, M.; Koarai, M.; Une, H.; Iwahashi, J. Interpretation of landslide distribution triggered by the 2005 Northern Pakistan earthquake using SPOT 5 imagery. Landslides 2007, 4, 113–122. [Google Scholar] [CrossRef]
  212. Lodhi, M.A. Earthquake-induced landslide mapping in the western Himalayas using medium resolution ASTER imagery. Int. J. Remote Sens. 2011, 32, 5331–5346. [Google Scholar] [CrossRef]
  213. Chini, M.; Cinti, F.; Stramondo, S. Co-seismic surface effects from very high resolution panchromatic images: The case of the 2005 Kashmir (Pakistan) earthquake. Nat. Hazards Earth Syst. Sci. 2011, 11, 931–943. [Google Scholar] [CrossRef] [Green Version]
  214. Sato, H.; Harp, E. Interpretation of earthquake-induced landslides triggered by the 12 May 2008, M7. 9 Wenchuan earthquake in the Beichuan area, Sichuan Province, China using satellite imagery and Google Earth. Landslides 2009, 6, 153–159. [Google Scholar] [CrossRef]
  215. Aimaiti, Y.; Liu, W.; Yamazaki, F.; Maruyama, Y. Earthquake-induced landslide mapping for the 2018 Hokkaido Eastern Iburi earthquake using PALSAR-2 data. Remote Sens. 2019, 11, 2351. [Google Scholar] [CrossRef] [Green Version]
  216. Zhao, W.; Li, A.; Nan, X.; Zhang, Z.; Lei, G. Postearthquake landslides mapping from Landsat-8 data for the 2015 Nepal earthquake using a pixel-based change detection method. IEEE J. Sel. Top. Appl. Earth Obs. Remote Sens. 2017, 10, 1758–1768. [Google Scholar] [CrossRef]
  217. Liu, W.; Yamazaki, F.; Gokon, H.; Koshimura, S.-i. Extraction of tsunami-flooded areas and damaged buildings in the 2011 Tohoku-oki earthquake from TerraSAR-X intensity images. Earthq. Spectra 2013, 29 (Suppl. S1), 183–200. [Google Scholar] [CrossRef] [Green Version]
  218. Endo, Y.; Adriano, B.; Mas, E.; Koshimura, S. New insights into multiclass damage classification of tsunami-induced building damage from SAR images. Remote Sens. 2018, 10, 2059. [Google Scholar] [CrossRef] [Green Version]
  219. Mas, E.; Koshimura, S.; Suppasri, A.; Matsuoka, M.; Matsuyama, M.; Yoshii, T.; Jimenez, C.; Yamazaki, F.; Imamura, F. Developing Tsunami fragility curves using remote sensing and survey data of the 2010 Chilean Tsunami in Dichato. Nat. Hazards Earth Syst. Sci. 2012, 12, 2689–2697. [Google Scholar] [CrossRef] [Green Version]
  220. Suppasri, A.; Koshimura, S.; Imamura, F. Developing tsunami fragility curves based on the satellite remote sensing and the numerical modeling of the 2004 Indian Ocean tsunami in Thailand. Nat. Hazards Earth Syst. Sci. 2011, 11, 173–189. [Google Scholar] [CrossRef] [Green Version]
  221. Theilen-Willige, B.; Wenzel, H. Remote sensing and GIS contribution to a natural hazard database in western Saudi Arabia. Geosciences 2019, 9, 380. [Google Scholar] [CrossRef] [Green Version]
  222. Singh, A.; Singh, K.K. Satellite image classification using Genetic Algorithm trained radial basis function neural network, application to the detection of flooded areas. J. Vis. Commun. Image Represent. 2017, 42, 173–182. [Google Scholar] [CrossRef]
  223. Sato, M.; Chen, S.-W.; Satake, M. Polarimetric SAR analysis of tsunami damage following the March 11, 2011 East Japan earthquake. Proc. IEEE 2012, 100, 2861–2875. [Google Scholar] [CrossRef]
  224. Joyce, K.E.; Samsonov, S.; Jongens, R.; Lee, J.M.; Glassey, P.J. Using remote sensing for mapping the effects of natural hazards in New Zealand. In Proceedings of the IGARSS 2008 IEEE International Geoscience and Remote Sensing Symposium, Boston, MA, USA, 7–11 July 2008; IEEE: Piscataway, NY, USA, 2008; pp. II-1251–II-1254. [Google Scholar]
  225. PV, S.K.; Kim, D.-j.; Jung, J. Subsidence in the Kathmandu Basin, before and after the 2015 Mw 7.8 Gorkha Earthquake, Nepal revealed from small baseline subset-DInSAR analysis. GIScience Remote Sens. 2018, 55, 604–621. [Google Scholar]
  226. Fuentes, D.D.; Baquedano Julià, P.A.; D’Amato, M.; Laterza, M. Preliminary seismic damage assessment of Mexican churches after September 2017 earthquakes. Int. J. Archit. Herit. 2021, 15, 505–525. [Google Scholar] [CrossRef]
  227. Lira, J.; Nuñez, M. Subsidence and Morphologic Variations in Mexico City Generated by the Earthquakes of September 2017. Geofísica Int. 2019, 58, 211–227. [Google Scholar] [CrossRef]
  228. Kyriou, A.; Nikolakopoulos, K. Landslide mapping using optical and radar data: A case study from Aminteo, Western Macedonia Greece. Eur. J. Remote Sens. 2020, 53 (Suppl. S2), 17–27. [Google Scholar] [CrossRef] [Green Version]
  229. Xichao, H.; Meng, W.; Bing, H.; Tianbin, Y.; Yu, J. Study on Early Identification of Landslide Hazard in Mountain Valley Area based on InSAR and Optical Remote Sensing Technology. In Proceedings of the IOP Conference Series: Earth and Environmental Science, London, UK, 22–24 April 2020; IOP Publishing: Bristol, UK, 2020; p. 062047. [Google Scholar]
  230. Nguyen Hao, Q.; Takewaka, S. Shoreline Changes along Northern Ibaraki Coast after the Great East Japan Earthquake of 2011. Remote Sens. 2021, 13, 1399. [Google Scholar] [CrossRef]
  231. Valerio, E.; Tizzani, P.; Carminati, E.; Doglioni, C.; Pepe, S.; Petricca, P.; De Luca, C.; Bignami, C.; Solaro, G.; Castaldo, R. Ground deformation and source geometry of the 30 October 2016 Mw 6.5 Norcia earthquake (central Italy) investigated through seismological data, DInSAR measurements, and numerical modelling. Remote Sens. 2018, 10, 1901. [Google Scholar] [CrossRef] [Green Version]
  232. Wibowo, S.B.; Hadmoko, D.S.; Isnaeni, Y.; Farda, N.M.; Putri, A.F.S.; Nurani, I.W.; Supangkat, S.H. Spatio-Temporal Distribution of Ground Deformation Due to 2018 Lombok Earthquake Series. Remote Sens. 2021, 13, 2222. [Google Scholar] [CrossRef]
  233. Jelenek, J.; Kopačková-Strnadová, V. Synergic use of Sentinel-1 and Sentinel-2 data for automatic detection of earthquake-triggered landscape changes: A case study of the 2016 Kaikoura earthquake (Mw 7.8), New Zealand. Remote Sens. Environ. 2021, 265, 112634. [Google Scholar] [CrossRef]
  234. Liu, R.; Li, L.; Pirasteh, S.; Lai, Z.; Yang, X.; Shahabi, H. The performance quality of LR, SVM, and RF for earthquake-induced landslides susceptibility mapping incorporating remote sensing imagery. Arab. J. Geosci. 2021, 14, 259. [Google Scholar] [CrossRef]
  235. Umar, Z.; Pradhan, B.; Ahmad, A.; Jebur, M.N.; Tehrany, M.S. Earthquake induced landslide susceptibility mapping using an integrated ensemble frequency ratio and logistic regression models in West Sumatera Province, Indonesia. Catena 2014, 118, 124–135. [Google Scholar] [CrossRef]
  236. Saikia, B.J.; Parthasarathy, G.; Gorbatsevich, F.F.; Borah, R.R. Characterization of amphiboles from the Kola super-deep borehole, Russia by Raman and infrared spectroscopy. Geosci. Front. 2021, 12, 101134. [Google Scholar] [CrossRef]
  237. Zhou, Z.; Li, H.; Kang, K. Wenchuan earthquake and satellite gravity variation. Geod. Geodyn 2011, 33, 5–7. [Google Scholar]
  238. Su, L.-n.; Gan, W.-j.; Xiao, G.-r. Brief overview on high-rate GPS epoch-by-epoch precise positioning and GPS seismology. Prog. Geophys. 2018, 33, 503–510. [Google Scholar]
  239. Joyce, K.E.; Belliss, S.E.; Samsonov, S.V.; McNeill, S.J.; Glassey, P.J. A review of the status of satellite remote sensing and image processing techniques for mapping natural hazards and disasters. Prog. Phys. Geogr. 2009, 33, 183–207. [Google Scholar] [CrossRef] [Green Version]
  240. Pulinets, S.; Ouzounov, D. Lithosphere–Atmosphere–Ionosphere Coupling (LAIC) model—An unified concept for earthquake precursors validation. J. Asian Earth Sci. 2011, 41, 371–382. [Google Scholar] [CrossRef]
  241. Li, S.; Xu, W.; Li, Z. Review of the SBAS InSAR Time-series algorithms, applications, and challenges. Geod. Geodyn. 2022, 13, 114–126. [Google Scholar] [CrossRef]
  242. Wu, L.-x.; Qin, K.; Liu, S.-j. GEOSS-based thermal parameters analysis for earthquake anomaly recognition. Proc. IEEE 2012, 100, 2891–2907. [Google Scholar] [CrossRef]
  243. Ouzounov, D.; Freund, F. Mid-infrared emission prior to strong earthquakes analyzed by remote sensing data. Adv. Space Res. 2004, 33, 268–273. [Google Scholar] [CrossRef]
  244. Bechor, N.B.; Zebker, H.A. Measuring two-dimensional movements using a single InSAR pair. Geophys. Res. Lett. 2006, 33, 26883. [Google Scholar] [CrossRef] [Green Version]
  245. Zebker, H.A.; Villasenor, J. Decorrelation in Interferometric radar echoes. IEEE Trans. Geosci. Remote Sens. 1992, 30, 950. [Google Scholar] [CrossRef] [Green Version]
  246. Hanssen, R.F. Radar Interferometry: Data Interpretation and Error Analysis; Springer Science & Business Media: Berlin/Heidelberg, Germany, 2001; Volume 2. [Google Scholar]
  247. Wright, T.J.; Parsons, B.E.; Lu, Z. Toward mapping surface deformation in three dimensions using InSAR. Geophys. Res. Lett. 2004, 31. [Google Scholar] [CrossRef] [Green Version]
  248. Lu, P.; Casagli, N.; Catani, F.; Tofani, V. Slow Moving Hazard Hotspot from InSAR Data: Improving Communication with Decision Makers. In EGU General Assembly Conference Abstracts 2010, Proceedings of the EGU General Assembly 2010, Vienna, Austria, 2–7 May 2010; EGU: Munich, Germany, 2010; p. 15047.Makers. [Google Scholar]
Figure 1. Flowchart representing information flow in each section.
Remotesensing 15 01939 g001
Figure 2. Global earthquake-related studies using remote sensing, published as full research papers in peer-reviewed journals and conference proceedings. Statistical information was collected using keyword searches in the academic databases Scopus and Web of Science for articles published between 2010 and 2021.
Remotesensing 15 01939 g002
Figure 3. Timeline of earthquake-related studies using remote sensing from the top ten countries with the most seismic activity between 2010 and 2021. The Y-axis shows the number of RS-related papers and X-axis indicates years of publication.
Remotesensing 15 01939 g003
Table 1. Examples of natural disasters triggered by an earthquake.
Natural DisastersBrief Description and ConsequencesRS Data Acquisition System and Corresponding Reference
Ground shakingGround shaking is a disruptive upwards, downwards, and sideways vibration of the surface during an earthquake.
Effects: structural damage or collapse; may consequently cause other hazards such as liquefaction or landslides.
InSAR[196]
GPS[197]
QuickBird[198]
IKONOS[199]
SPOT HRV[200]
PALSAR-2[201]
Ground ruptureGround rupture can be defined as permanent deformation which occurs when sudden movement along a fault breaks the earth’s surface.
Effects: fracturing, cracking, and ground displacement due to movement of the fault.
ALOS-2 SAR[202]
ALOS-2 InSAR[203]
DInSAR[204]
Sentinel-1[205]
LiDAR[206]
LiquefactionLiquefaction is a phenomenon in which sediments at or near the ground surface lose their strength in response to ground shaking and behave like liquid.
Effects: liquefaction usually occurs under buildings and other structures and can cause severe damage during earthquakes.
Landsat-7[207]
sUAV-based optical sensor[208]
Airbone LiDAR[209]
GNSS[210]
LandslidesEarthquake-induced landslide is a down slope movement of rocks, soil, or other debris, usually caused by a strong shaking.
Effects: soil erosion, blocking of roads and railways, destruction of buildings and other structures.
SPOT-5[211]
ASTER[212]
QuickBird[213]
IKONOS[214]
PALSAR-2[215]
Landsat[216]
TsunamisEarthquake-induced tsunami manifests itself in the form of a series of high waves.
Effects: causes severe flooding coastal erosion, drowning, and property damage.
TerraSAR-X[217]
SAR [218]
Worldview-2[167]
QuickBird[219]
IKONOS [220]
FloodingAn earthquake can severely damage or break dams. The water from the river or the reservoir would then flood the area, damaging buildings, and in the worst case, may wash away or drown people.Sentinel-2[221]
Landsat-2 [222]
SAR[223]
QuickBird[224]
Disclaimer/Publisher’s Note: The statements, opinions and data contained in all publications are solely those of the individual author(s) and contributor(s) and not of MDPI and/or the editor(s). MDPI and/or the editor(s) disclaim responsibility for any injury to people or property resulting from any ideas, methods, instructions or products referred to in the content.

