Article

Data Comparison and Cross-Calibration between Level 1 Products of DPC and POSP Onboard the Chinese GaoFen-5(02) Satellite

1
School of Environmental Science and Optoelectronic Technology, University of Science and Technology of China, Hefei 230026, China
2
Anhui Institute of Optics and Fine Mechanics, Hefei Institutes of Physical Science, Chinese Academy of Sciences, Hefei 230031, China
3
Key Laboratory of Optical Calibration and Characterization, Chinese Academy of Sciences, Hefei 230031, China
4
State Environmental Protection Key Laboratory of Satellite Remote Sensing, Aerospace Information Research Institute, Chinese Academy of Sciences, Beijing 100101, China
5
Shanghai Institute of Satellite Engineering, Shanghai 201109, China
6
China Centre for Resources Satellite Data and Application, Beijing 100094, China
*
Author to whom correspondence should be addressed.
Remote Sens. 2023, 15(7), 1933; https://doi.org/10.3390/rs15071933
Submission received: 19 February 2023 / Revised: 30 March 2023 / Accepted: 1 April 2023 / Published: 4 April 2023

Abstract

:
The Polarization CrossFire (PCF) suite onboard the Chinese GaoFen-5(02) satellite has been sophisticatedly composed by the Particulate Observing Scanning Polarimeter (POSP) and the Directional Polarimetric Camera (DPC). Among them, DPC is a multi-angle sequential measurement polarization imager, while POSP is a cross-track scanning simultaneous polarimeter with corresponding radiometric and polarimetric calibrators, which can theoretically be used for cross comparison and calibration with DPC. After the data preprocessing of these two sensors, we first select local homogeneous cluster scenes by calculating the local variance-to-mean ratio in DPC’s Level 1 product projection grids to reduce the influence of scale differences and geometry misalignment between DPC and POSP. Then, taking the observation results after POSP data quality assurance as the abscissa and taking the DPC observation results under the same wavelength band and geometric conditions as the same ordinate, a two-dimensional radiation/polarization feature space is established. Results show that the normalized top of the atmosphere (TOA) radiances of DPC and POSP processed data at the nadir are linearly correlated. The normalized TOA radiance root mean square errors (RMSEs) look reasonable in all common bands. The DPC and POSP normalized radiance ratios in different viewing zenith angle ranges at different times reveal the temporal drift of the DPC relative radiation response. The RMSEs, mean absolute errors (MAEs), relative errors (REs), and scatter percentage of DPC degree of linear polarization (DoLP) falling within the expected error (EE = ±0.02) of POSP measured DoLP are better than 0.012, 0.009, 0.066, and 91%, respectively.

1. Introduction

Aerosols and clouds have a great influence on global climate and air quality through their interactions with solar radiation. Polarization detection can provide an independent information dimension for atmospheric remote sensing from space and is considered to be the observation method with the most potential to improve the detection accuracy of atmospheric aerosols and cloud parameters [1]. However, atmospheric aerosols have complex microphysical properties such as particle shapes and sizes, radiation, absorption, scattering characteristics, and different spatiotemporal or vertical distributions. Great challenges have been brought to the design of the detection scheme for designing of spaceborne aerosol remote sensing sensors. Currently, the combined use of multi-spectral, multi-angle, and polarization detection is the main application trend of aerosol passive remote sensing. Multi-angle polarization cameras like POlarization and Directionality of the Earth’s Reflectance (POLDER) [2,3,4], directional polarimetric camera (DPC) [5,6,7], Multi-view Multi-channel Multi-polarization Imaging (3MI) mission [8,9] and Hyper-Angular Rainbow Polarimeter (HARP) [10,11] are limited to carrying onboard calibrators for their ultra-wide field of view. As for polarimeters that can be easily configured with onboard calibrators like the Aerosol Polarimetry Sensor (APS) [12,13], Particulate Observing Scanning Polarimeter (POSP) [14], and the Polarized Scanning Atmospheric Corrector (PSAC) [15,16,17,18,19], etc. It is difficult to balance their detection abilities based on the scanning swath and viewing angles of one target.
The cross-calibration methods between sensors on different platforms are relatively complicated and require orbit and observation target matching [20,21], time matching and field of view matching, spectral matching, environmental factor parameter correction, etc. However, ground targets have complex geometric distribution characteristics in their polarimetric information. Additionally, the polarization measurement process is sensitive to the influence of atmospheric and surface environmental factors. Thus, the polarimetric cross-calibration parameters are more sensitive to the error of observation condition differences between sensors. The cross-calibration of sensors carried on the same platform after matching processing can effectively reduce the differences in observation conditions, thereby improving the accuracy of onboard calibration. Thus, the feasible solution to realize high accuracy onboard calibration of the polarization imaging remote sensing sensor without a calibrator is the radiometric and polarimetric cross calibration on the same platform.
According to the above-mentioned requirements and problems, cross-calibration between polarimetric sensors onboard the same platform is proposed in NASA’s Plankton, Aerosol, Cloud, and ocean Ecosystem (PACE) mission [22,23] for HARP-2 and Spectro-Polarimetric EXperiment-one (SPEXone). The Scanning Polarimeter (ScanPol) and the Multi-Spectral Imaging Polarimeter (MSIP) in the Ukrainian space project Aerosol-UA [24,25,26] also have the cross-calibration configuration. The “Polarization CrossFire” (PCF) [27,28] suite, which consists of POSP and DPC onboard the same platform, was proposed by China, while the aviation verification experiment [29] was conducted in 2019. The validity of the field of view (FOV), spectral bands, and key parameters used in the collaborative configuration between the two sensors is verified. The cross-calibration results can improve the data quality for high-precision retrieval requirements of aerosols. Although the calibration process has been conducted in the laboratory before launch, the radiation/polarization measurement accuracy is easily affected by the onboard environment factors after launch. Therefore, the onboard calibration and accuracy evaluation process are required. The onboard calibrators have been developed for POSP in the PCF suite, but it is difficult to configure onboard calibrators for DPC because of its wide FOV. If high-precision onboard calibration and accuracy validation can be performed with the POSP onboard calibrator, then the calibration accuracy can be transferred from POSP to DPC through cross-calibration. Further research based on this method will enrich and improve the onboard calibration application system.
In this study, we conduct the cross-calibration and comparison between Level 1 products of DPC and POSP onboard the Chinese GaoFen-5(02) satellite. The results are the basis of fusion retrieval, and the development of a cross-calibration method between polarization remote sensing sensors on the same platform is of great significance for further improving the in-orbit radiation/polarization calibration method system and subsequent data applications for spaceborne polarimetric sensors. The paper is structured as follows. The PCF suite is introduced in Section 2, and the data selection approach and criteria are presented in Section 3. Then the cross-calibration and comparison results and analysis are shown in Section 4. Finally, the discussion and conclusions of this study are presented in Section 5.

2. PCF Suite onboard GaoFen-5(02) Satellite

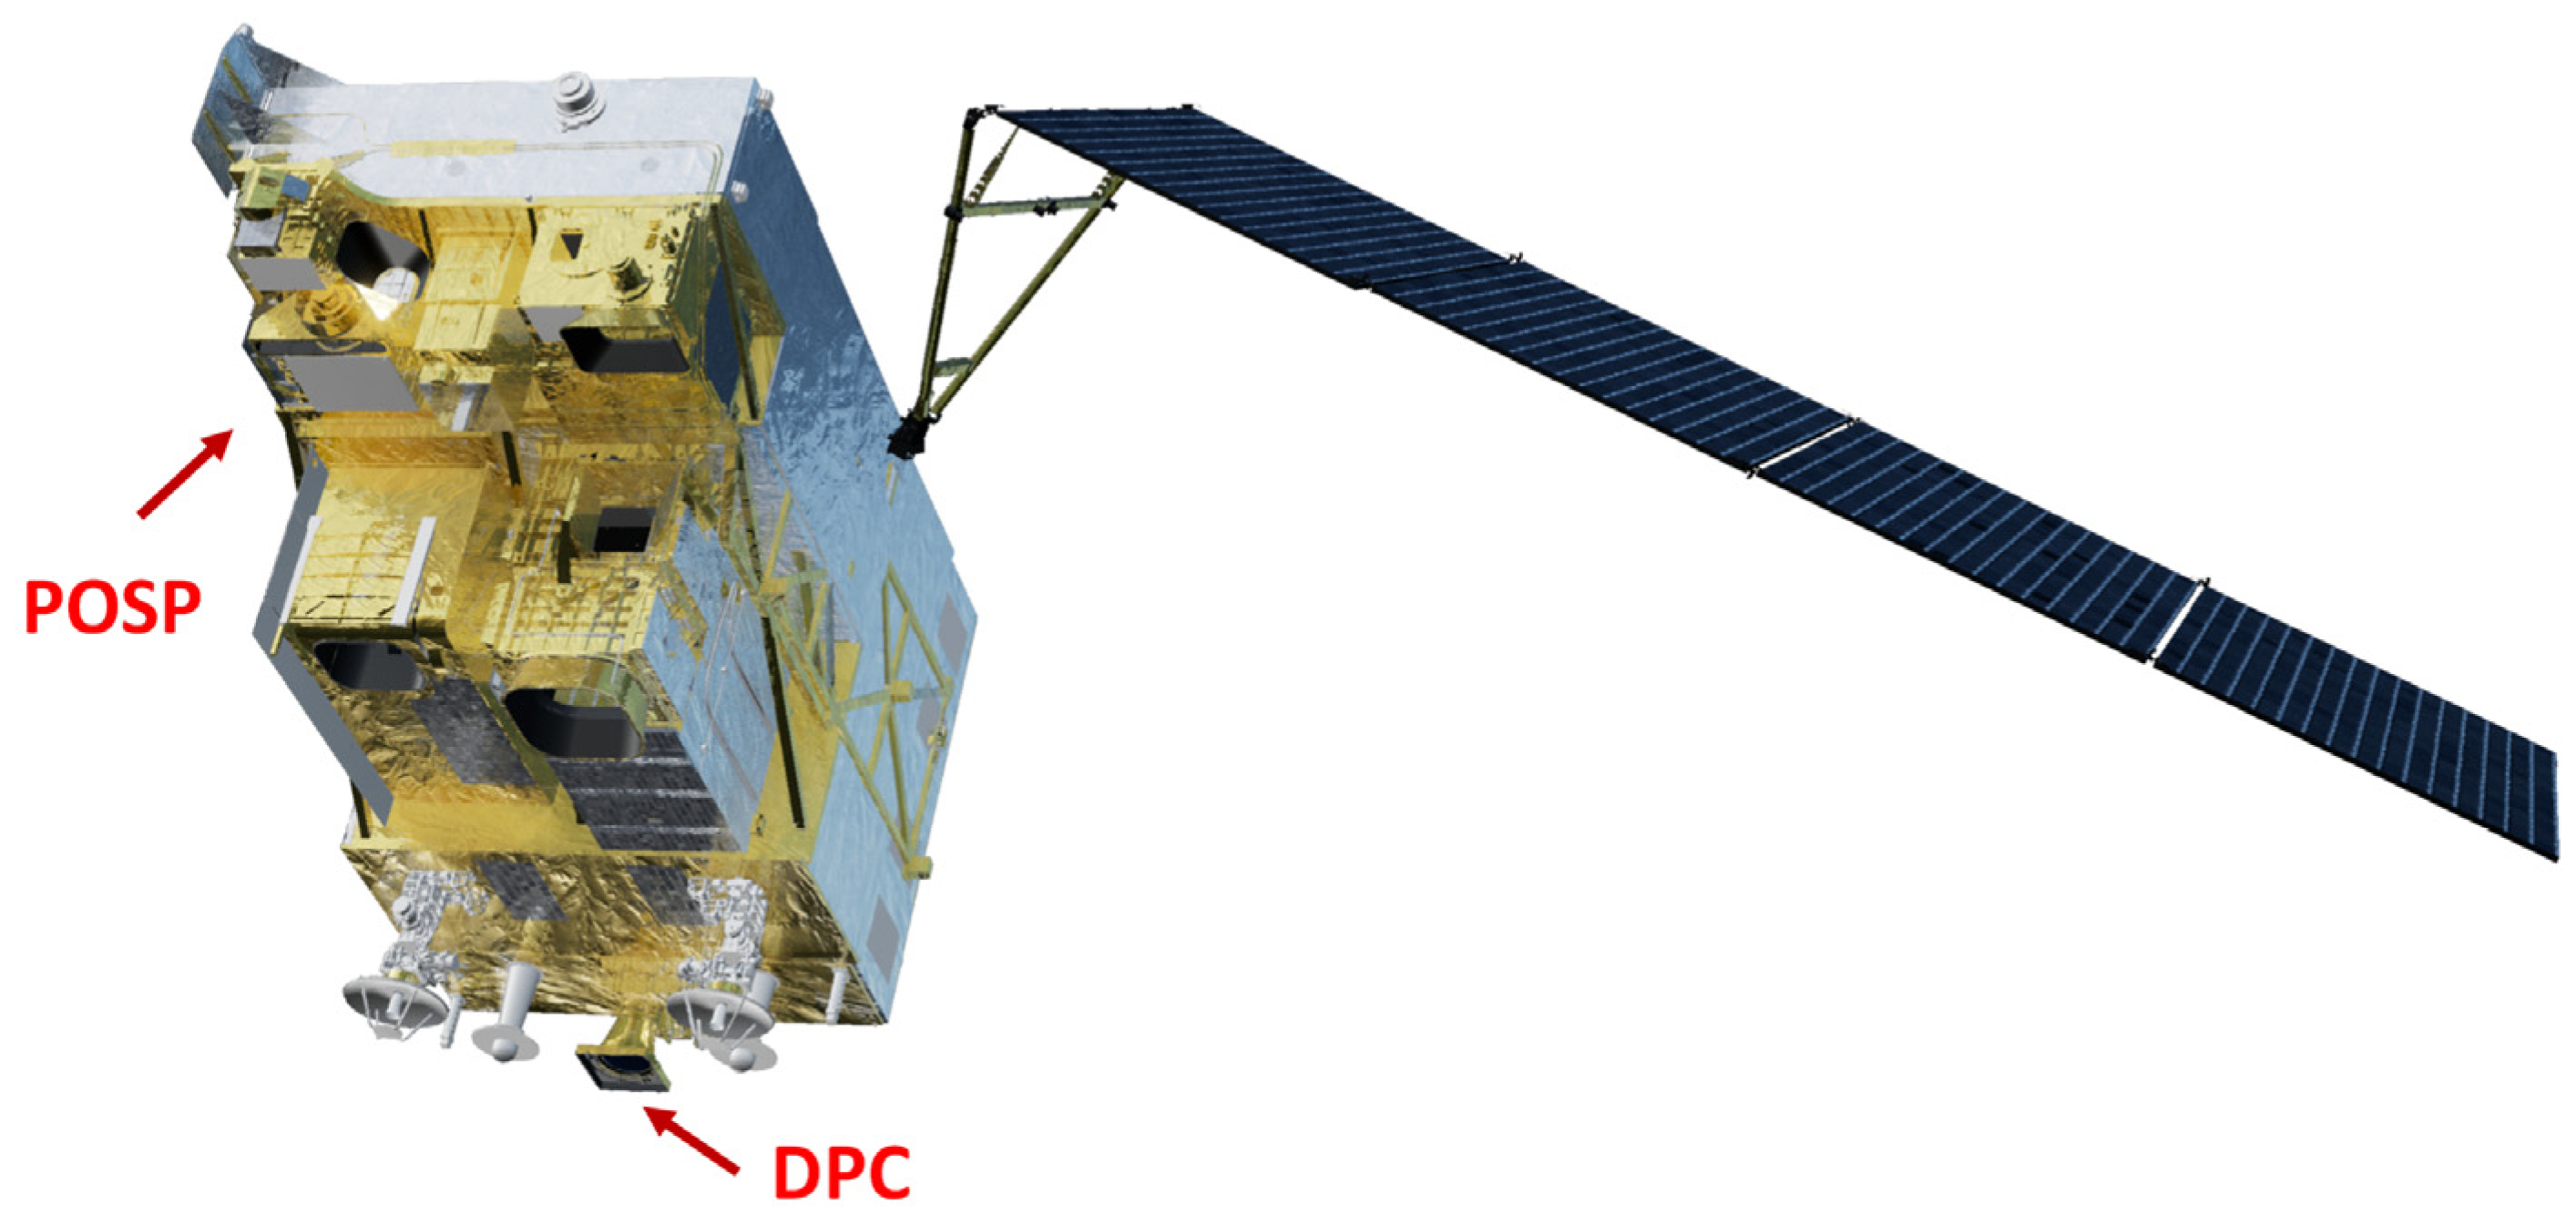
2.1. GaoFen-5(02) Satellite

The Chinese GaoFen-5(02) satellite in the Chinese High-resolution Earth Observation Program was successfully launched in Taiyuan Satellite Launch Center on 7 September 2021. The satellite will systematically improve China’s hyperspectral observation capabilities of the atmosphere, water bodies, and land, meet her urgent needs in comprehensive environmental monitoring, and provide domestic hyperspectral data support for the monitoring of the atmospheric environment, water environment, and ecological environment. There are seven sensors onboard this satellite. Among them, the Advanced HyperSpectral Imager (AHSI) [30] and the Visible and Infrared Multispectral Imager (VIMI) [31] are mainly responsible for land observation. The other five sensors are mainly used for atmospheric monitoring. DPC, POSP, and the Absorptive Aerosol Sensor (AAS) are all developed for atmospheric aerosol detection. By measuring the solar backscatter radiation, AAS can detect the absorbing aerosols. The Greenhouse-gas Monitoring Instrument (GMI) [32,33] and Environment Monitoring Instrument (EMI) [34] are in operation with hyperspectral sensors for monitoring pollution gases and greenhouse gases. With these multiple sensors on the same platform, the GaoFen-5(02) satellite can realize the fusion application of multiple observation data types such as hyperspectral, full spectrum, polarization, and multi-angle.

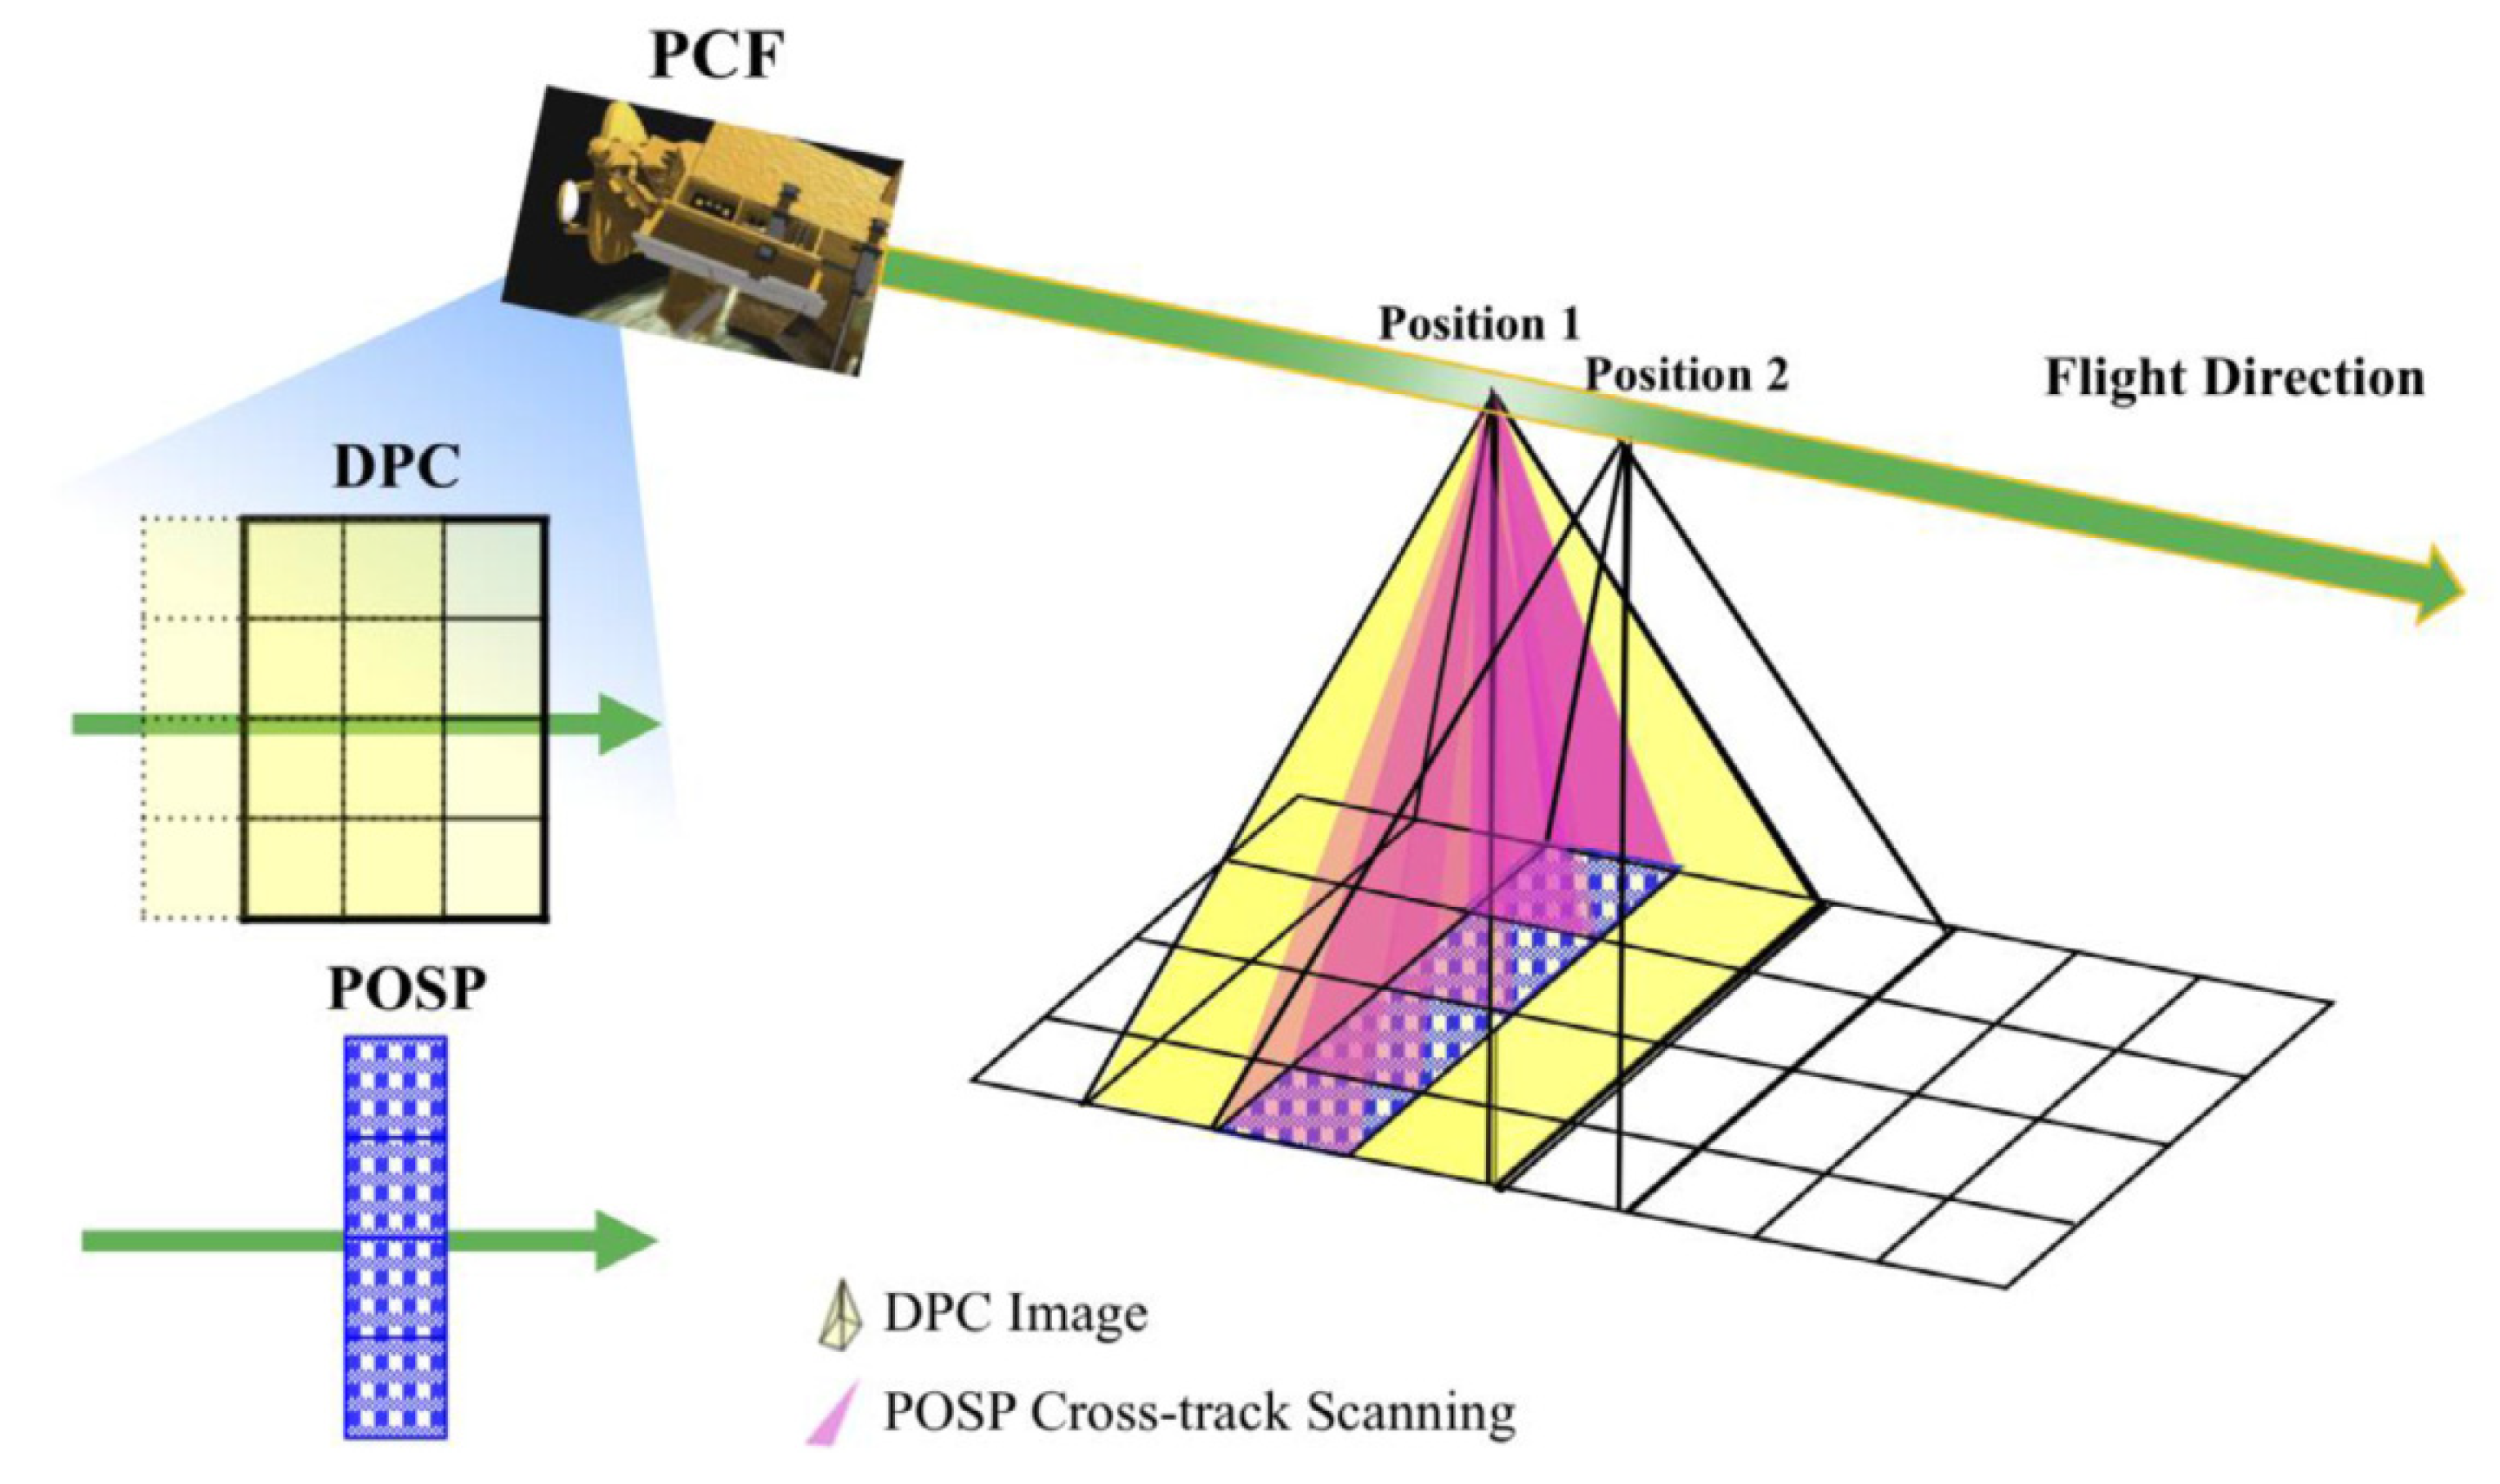
2.2. Overview of PCF

For remote sensing of PM2.5 from space, the PCF suite and the Particulate Matter Remote Sensing (PMRS) model [27] have been developed and first implemented on GaoFen-5(02) satellite. The schematic diagram of the two sensors installed on the satellite is shown in Figure 1, while the spectral parameters are provided in Table 1.
DPC is a polarimetric camera similar to the POLDER design concept. Its optical system consists mainly of an ultra-wide-angle lens, filters, and polarizers installed on the wheel. A charge-coupled device (CCD) is used as a detector for DPC, and its number of pixels is increased from 512 × 512 to 1024 × 1024 compared to DPC/GF-5 to achieve a better FOV match between DPC and POSP. Additionally, for one target region, it can be observed more than 15 times for different viewing angles by taking advantage of its wide FOV of ±50° both in the along-track and cross-track directions. According to the 705 km satellite orbit altitude, the ground sampling distance (GSD) of a DPC pixel at nadir is about 1.7 km. After sinusoidal projection and pixel combination, the grid resolution of the DPC Level 1 product is about 3.5 km. Moreover, the preprocessing processes of DPC Level 1 products include dark current correction, stray light correction, radiance, and polarization parameter extraction. The processing flow is similar to POLDER [35].
The polarimetric principle of DPC is based on Fessenkov’s method [36]. It combines three measured intensities of one detection element to calculate the polarization information. The incident light passes through linear polarizers with a relative azimuth angle of 0°, 60°, and 120° at the division of time. Additionally, the satellite movement between polarization-analyzing channels with different sampling times is compensated by the optical wedge filter. While the circular polarization component of polarized light measured by the Earth’s remote sensors is usually assumed to be very small [37]. Thus, the measurement model of DPC can be characterized with a three-dimensional Stokes–Mueller matrix that only contains linear polarization components, as shown in Equation (1):
I 0 I 60 I 120 = 1 2 1 1 0 1 1 / 2 3 / 2 1 1 / 2 3 / 2 I Q U
where the Stokes vector [ I , Q , U ] T is the linear polarization information of incident light, and I 0 , I 60 , and I 120 are the detected light intensities in different polarization analyzing channels in the same coordinate system with different relative azimuth angles. The polarization information of targets can be obtained by inversely solving this matrix equation.
For POSP, it is a scanning polarimeter adopting a simultaneous polarization measurement scheme with division of aperture to obtain the intensity information of different polarization states, which has the same measurement principle as the APS. Single-element detectors are used to receive linearly polarized light signals passing through the filters and Wollaston prisms. The single sampling results of POSP are multi-spectral and multi-polarization digital number (DN) values for one target region. Additionally, the wide FOV coverage is formed by scanning samples in the cross-track direction, which is also ±50°. Different from DPC, the Level 1 product of POSP keeps the center latitude/longitude of each measurement instead of projecting them into grids. The GSD is about 6.4 km at the nadir and larger at the FOV edge (about 20 km). The POSP data preprocessing system sequentially performs raw science data extraction, parameter quality supervision, data precorrection, polarization analysis, and geometric correction to obtain Level 1 products, which is similar to PSAC [16].
The polarization measurement principle of POSP is the same as that of APS/Glory and PSAC/HJ-2AB, which are based on the modified Pickering method [36] to measure the first three elements of the Stokes vector (I, Q, and U) by employing a pair of optical paths. The Wollaston prisms are used as the polarization analyzer for the system to realize division of amplitude measurement by decomposing the incident light into two polarized analytic beams with orthogonal vibration directions. For one optical path in the pair with polarizer orientations of 0° and 90°, I and Q parameters of the Stokes vector are measured simultaneously, while the other optical path with polarizer orientations of 45° and 135° measures I and U elements by setting up a polarization azimuth bias of 45° to the former optical path in the pair. Then the target signals are analyzed as linearly polarized light with four relative vibration direction angles of 0°, 45°, 90°, and 135° and detected by four corresponding detectors simultaneously. The measurement model of POSP in Equation (2) also neglects the circular polarization component.
I 0 I 90 I 45 I 135 = 1 2 1 1 0 0 1 1 0 0 1 1 0 0 1 0 1 0 I Q U V
The Stokes vector [ I , Q , U ] T has the same definition as the DPC mentioned above. Additionally, the relative polarization analyzing angle of detected light intensities I θ are distinguished by subscripts θ .

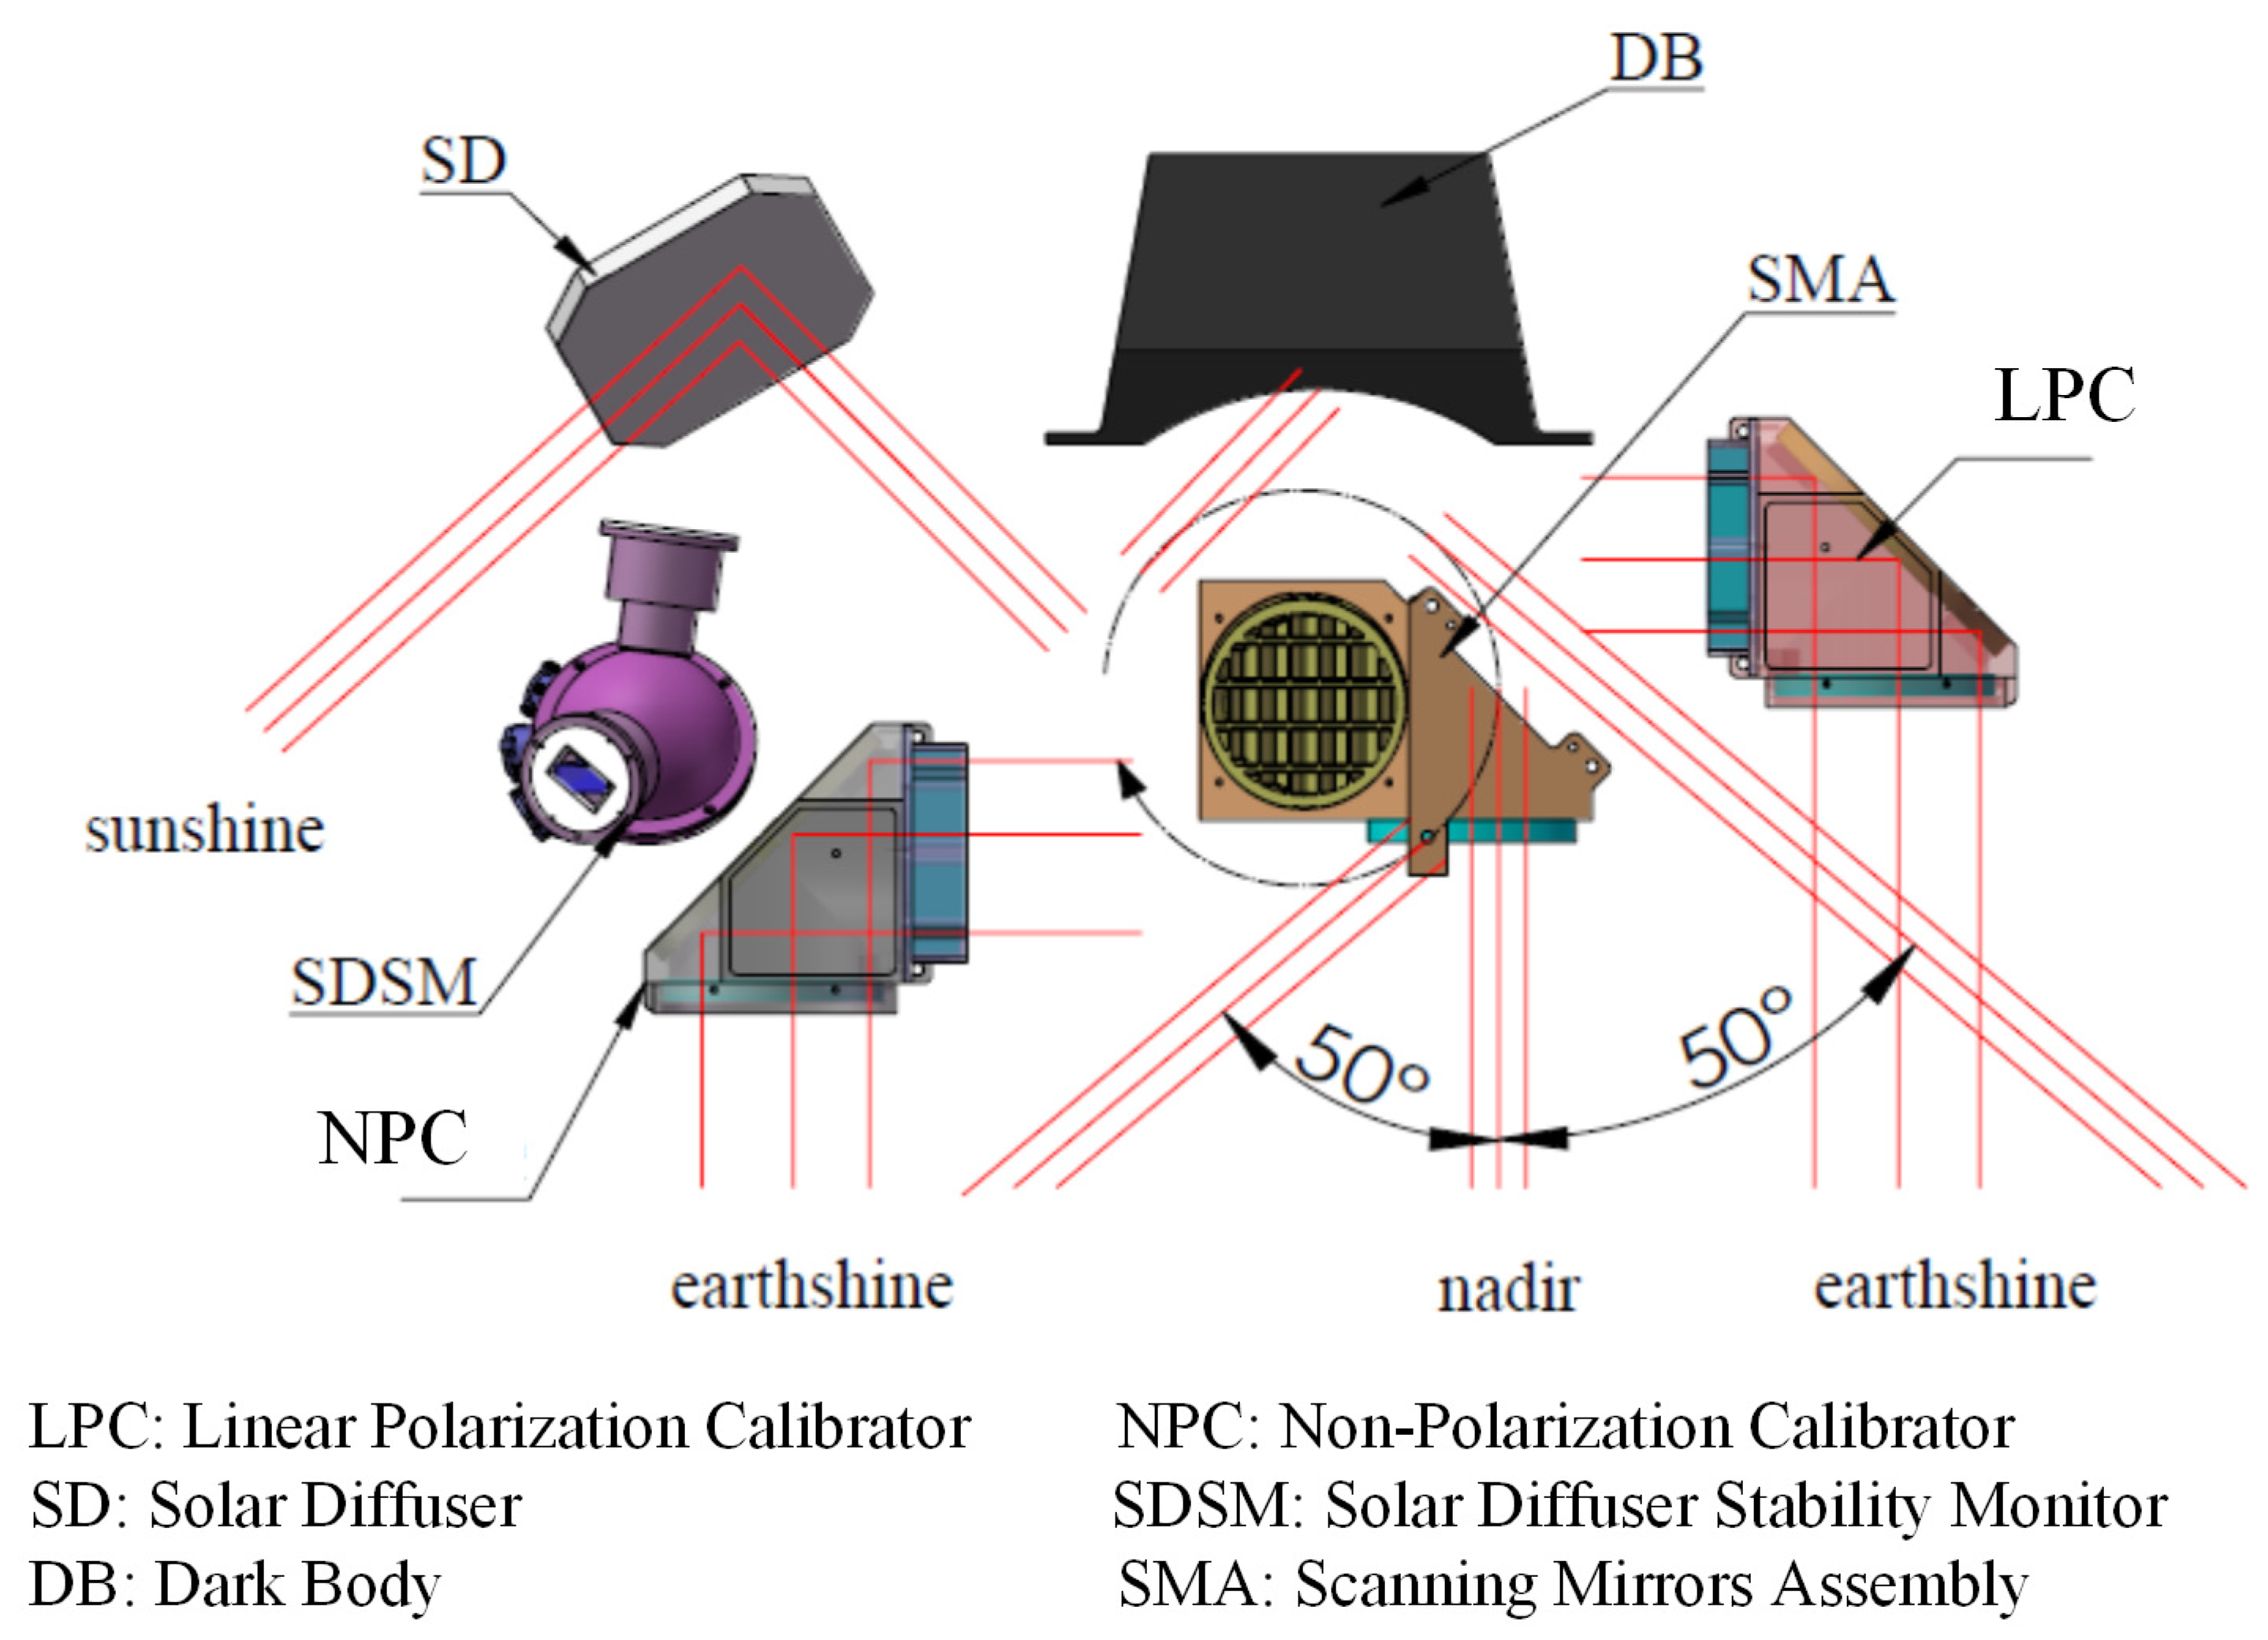
2.3. POSP onboard Calibration

The POSP onboard radiometric calibration scheme adopts the solar calibration method based on the solar diffuser. The radiance standard is established from solar to diffuser, in which the standard value is determined in real time from the solar spectral irradiance and the diffuser bidirectional reflectance distribution function (BRDF) to implement absolute calibration at the front end of the sensor optical path. However, the performance of the solar diffuser may suffer possible degradation with time. Thus, a Solar Diffuser Stability Monitor (SDSM) is used to monitor and correct the variation of the solar diffuser. The incident sunlight and the diffuser-reflected light are measured sequentially by SDSM. Then the variation coefficient of the diffuse plate can be obtained by comparing the results to the first-time onboard calibration measurements combined with the diffuse plate parameters calibrated in a laboratory to ensure the accuracy and data quality of the POSP throughout the mission, that is, 3% in the visible near-infrared (VNIR) band and 5% in the shortwave infrared (SWIR) band.
For polarization calibration, POSP uses light reflected from the earth’s surface as incident light to ensure simultaneous and dynamic range-matched measurements for calibration and observation, which is the same scheme as APS adopted. Then the incident light is modulated by a polarizer in a Linear Polarization Calibrator (LPC) or a depolarizer in a Non-Polarization Calibrator (NPC) to obtain linearly polarized light with a known polarization state, which can be used for calibrating the transmittance and relative response coefficient of different divisions of the aperture optical path to ensure onboard polarization detection accuracy that is better than 0.005 Degree of Linear Polarization (DoLP). The layout diagram of the calibrators installed on POSP is shown in Figure 2.

2.4. Key Parameters of DPC Calibration

The response model of each DPC pixel can be established with a given polarization-state light source and the corresponding response DN values of DPC during laboratory calibration. For unpolarized channels, the radiometric model can be defined as [7]:
D N i , j k = G · t · A k · g i , j k · P i , j k · I i , j k + ε i , j k · Q i , j k + C i , j k
For polarized channels, the response model can be defined in another format:
D N i , j k , a = G · t · A k · g i , j k , a · P i , j k · T k , a · P 1 i , j k , a I i , j k + P 2 i , j k , a Q i , j k + P 3 i , j k , a U i , j k + C i , j k
where i , j represent the row and column coordinates of pixels on the CCD, k represents the spectral band, a represents the polarization analyzing channel of the polarization band, G is the electronic gain, t is the integration time, I i , j k , Q i , j k and U i , j k are the Stokes parameters of the incident light of each pixel, and C i , j k is the dark current of each pixel. For parameters related to radiometric results, A k is the radiometric calibration coefficient at nadir, g i , j k and P i , j k are the relative response and transmittance difference of CCD and optical components at different pixels, and T k , a is the extinction ratio of the polarizers.
The other parameters mostly correspond to polarimetric results. P 1 i , j k , a , P 2 i , j k , a , and P 3 i , j k , a are the comprehensive polarization effects of lenses that can be specifically defined as follows:
P 1 i , j k , a = 1 + ε i , j k cos [ 2 ( α k , a ϕ ) ] P 2 i , j k , a = ε i , j k + cos [ 2 ( α k , a ϕ ) ] P 3 i , j k , a = 1 ε i , j k 2 sin [ 2 ( α k , a ϕ ) ]
where ε i , j k is the polarization rate of optical components at different pixels and α k , a is the orientation of the polarizer.
The Stokes parameters in the DPC Level 1 product are resampled to ground grids, which are difficult to associate with corresponding pixel coordinates. The overlapping area of POSP and DPC is the cross-track stripe, as shown in Figure 3. Therefore, the parameter A k can be obtained through cross-calibration between the Level 1 products of DPC and POSP by linearly fitting the radiometric results of two sensors at the nadir. The other parameters can hardly be obtained due to the lack of original pixel coordinates, except for the relative radiation response and DoLP comparison of two sensors in the overlap cross-track stripe.

3. Methods

In the process of PCF suite concept design, the bandwidth and center wavelength of the DPC and POSP common bands are set to be the same to minimize the effect of spectral matching errors. The normalized relative spectral responses of the common bands are shown in Figure 4. The scenes selected for calibration and comparison should be chosen with constrained spatial uniformity to avoid introducing non-negligible spectral gradients within the spectral response functions (SRF) and FOV matching errors between the two sensors. Thus, the adjustment of spectral differences introduced by the scenes will not be considered in the cross-calibration between Level 1 products, and the influence will be analyzed in future work. Since the two sensors are carried on the same satellite platform, massive matching scenes can be easily obtained. To facilitate accurate FOV matching between POSP and DPC, original spatial resolution and a strict synchronous acquisition strategy are specially designed [27], and a feasible FOV matching method has been validated in an aviation experiment [29]. Therefore, to carry out the cross calibration and comparison of the two sensors, the most important procedure is to perform in-orbit FOV matching and data selection in the overlapping cross-track stripe region of the two sensors.

3.1. Data Selection

FOV matching is one of the prerequisites for cross-calibration and validation [38]. Before data selection, the FOV matching method in the aviation verification experiment was used to match the FOV of DPC and POSP. The first step of data selection is the DPC scene uniformity constraint, which can help reduce the errors introduced by geometric and spectral mismatches. Since the POSP ground sample area at the edge is larger than the grid resolution of the DPC Level 1 product, the scene uniformity is constrained by the coefficient of variation of 7 × 7 neighbor grids, which is about 25 × 25 km2, which is more than enough to cover the single sampling ground projection area of the POSP at the edge FOV. The scene uniformity criteria are determined only using DPC L1 data by:
S T D I D P C m 3 , n 3 , , I D P C m + 3 , n + 3 M e a n I D P C m 3 , n 3 , , I D P C m + 3 , n + 3 < 0.01
where m , n represent the row and column coordinates of the grid, and I D P C is the normalized top of the atmosphere (TOA) radiance in the DPC Level 1 product. S T D and M e a n are standard deviation and mean value calculation functions, respectively. For the DoLP comparison, Equation (4) can be replaced as follows:
S T D P D P C m 3 , n 3 , , P D P C m + 3 , n + 3 M e a n P D P C m 3 , n 3 , , P D P C m + 3 , n + 3 < 0.01
where P D P C is the DoLP value of each grid in the DPC Level 1 product.
After that, the viewing geometry, target alignment, and matching of the two sensors are basically needed. For viewing target matching, the latitude and longitude ranges of DPC grids should be within the minimum enclosing rectangle of the POSP ground projection area. Additionally, the operation is optimized for speed using block and vector multiplication. For viewing geometry alignment, the viewing zenith angles (VZAs) and viewing azimuth angles (VAAs) differences of POSP and DPC should be restricted.
V A A D P C V A A P O S P < 1 H · ( t a n ( V Z A D P C ) t a n ( V Z A P O S P ) ) < 5
where H is the orbit height in km.
Saturation and abnormal data should also be removed. For each group of full-orbit DPC and POSP Level 1 products, the data pairs of DPC and POSP sampling at the same homogeneous area are selected. Then the selected data pairs are used for subsequent processing, and time series analysis can be performed in different operation orbits.

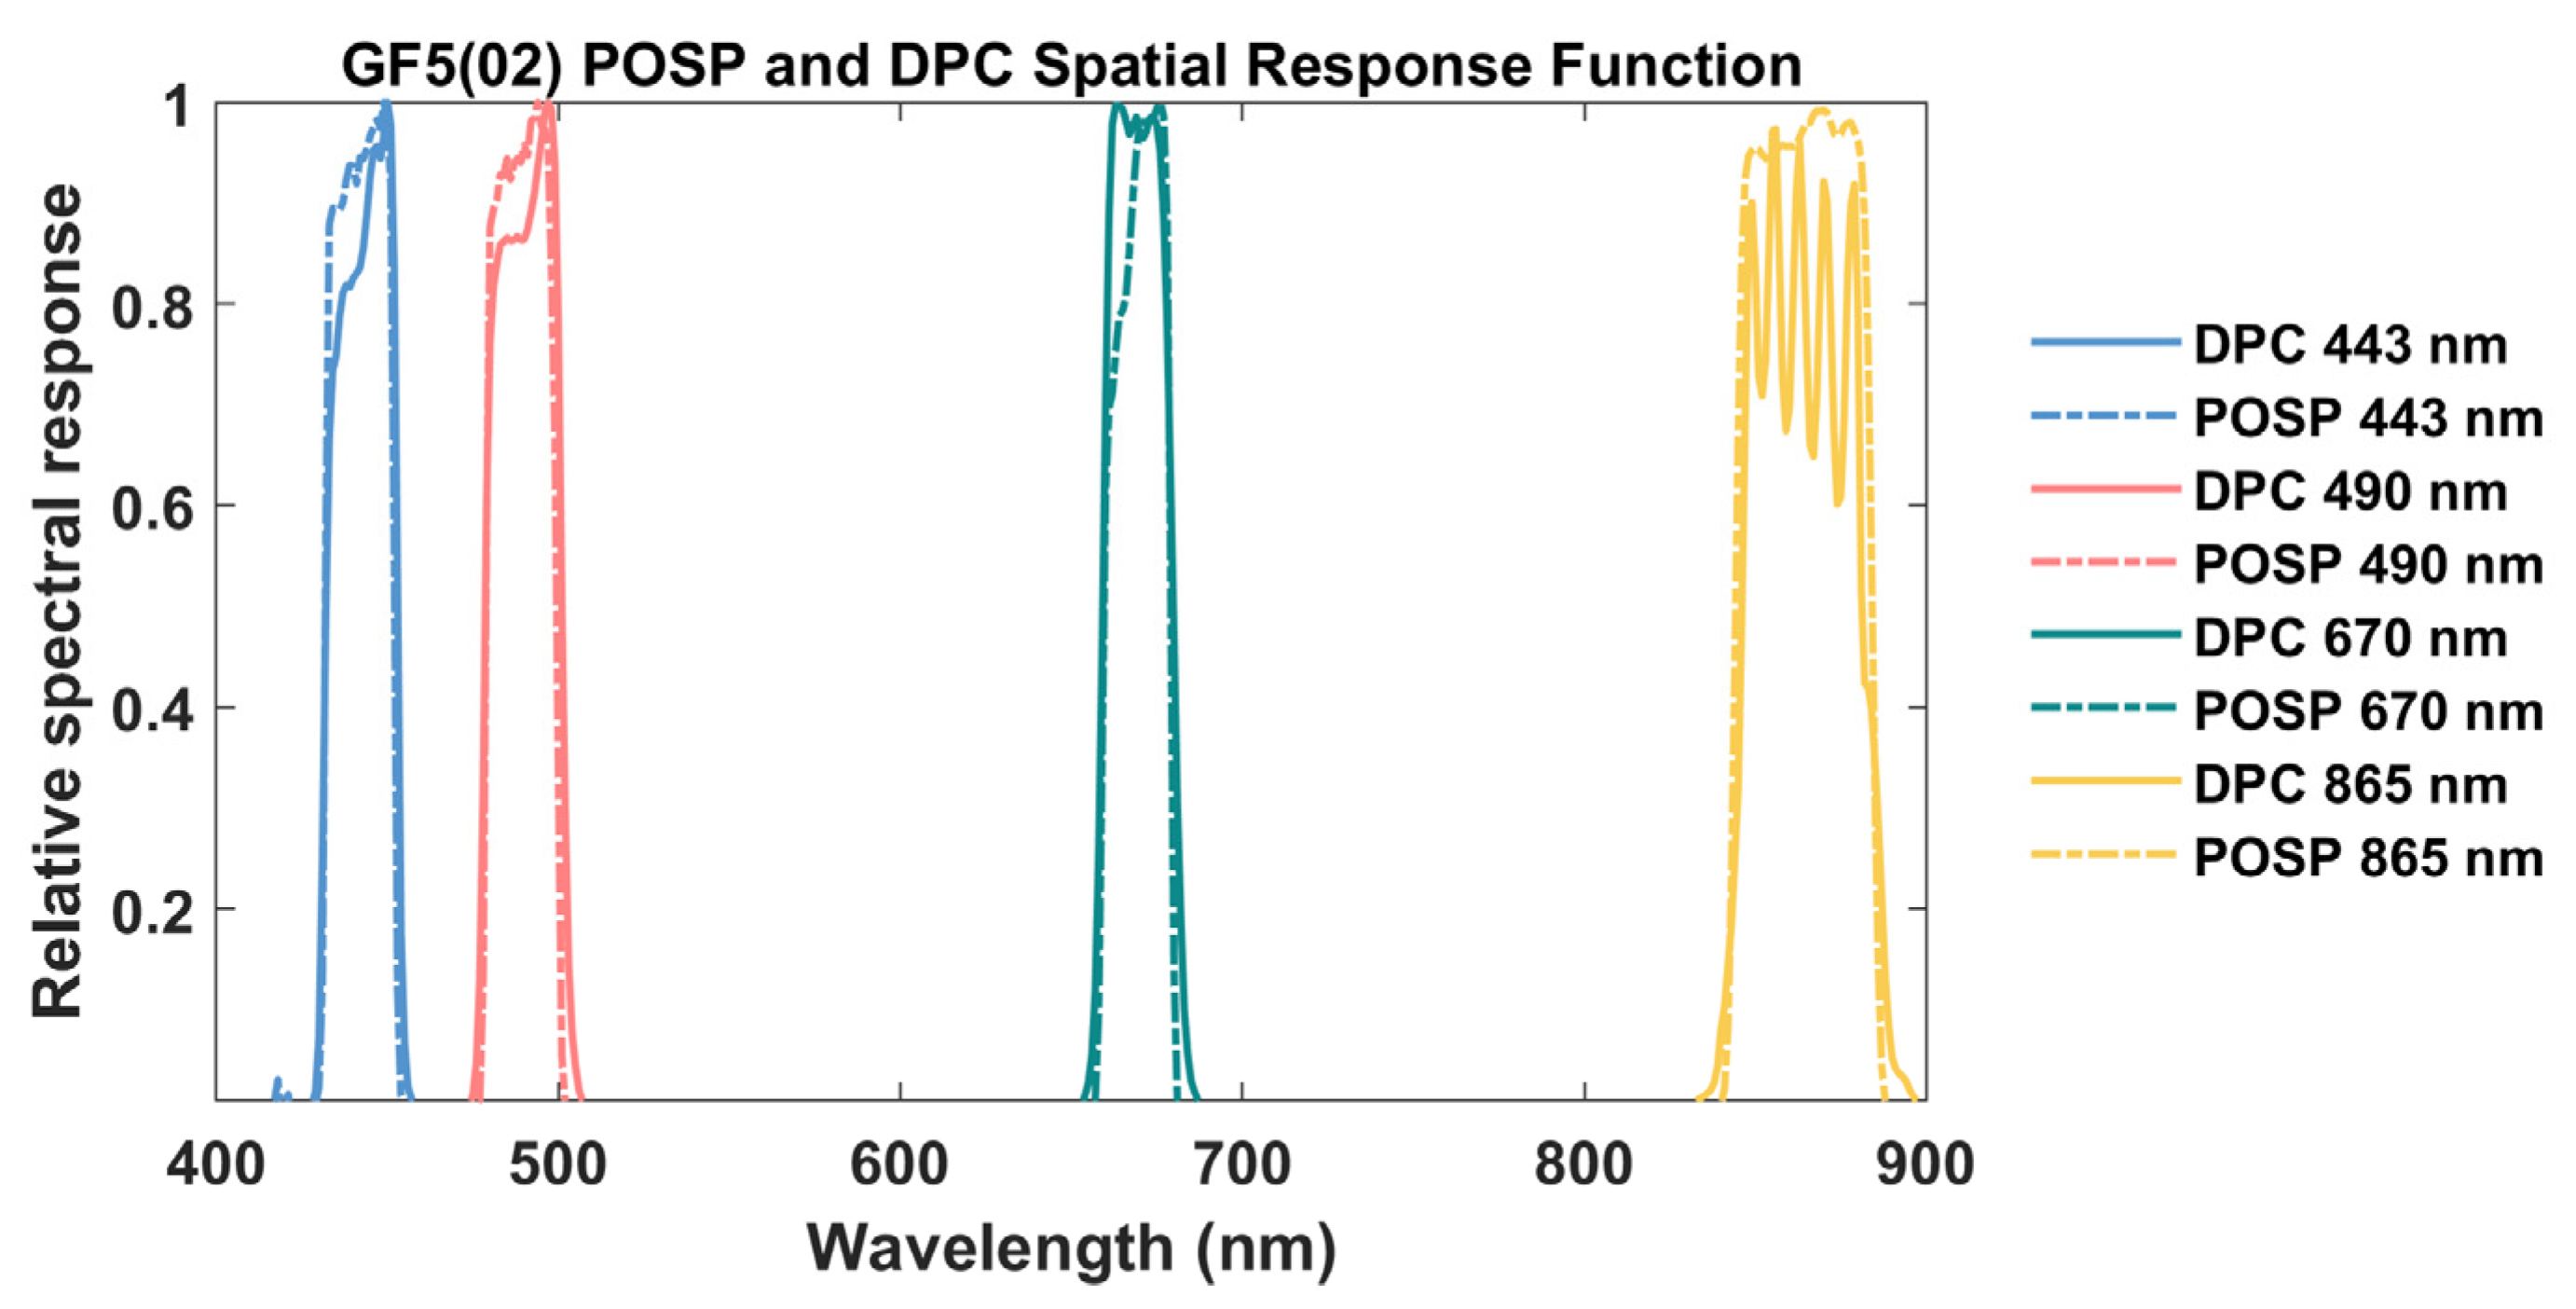
3.2. Relative Radiation Response and DoLP Comparison

Since the observation results at different positions of the DPC correspond to different detector pixels. The differences in transmittance of the optical system and response sensitivity between different pixels are the main reasons for the relative responsivity variance of DPC. For relative radiation response calibration in the laboratory, a spatially uniform source like an integrating sphere is usually used. Additionally, for onboard calibration, it is difficult to find natural targets with a large spatial region and continuous uniformity. However, POSP can obtain the results of a different FOV by rotating the scanning mirror in a cross-track direction, and there is no inconsistency in the sensitivity of the detector’s response. Thus, the relative radiation response and DoLP comparison of DPC and POSP can be conducted by directly comparing the normalized radiance and DoLP at different positions of the FOV in the overlapping cross-track stripe regions of the two sensors, which is related to the viewing geometry. Suppose the relative radiation response and DoLP are functions of VZAs [39]. Additionally, the positive and negative values of VZAs are divided by VAAs. The nadir is set as the origin, then the VZAs of the westward part (VAA < 180°) of the ground projection are negative, and vice versa.

4. Results

Two or three days of data are selected in each month of the DPC and POSP Level 1 products from October 2021 to July 2022 for cross-calibration and comparison.

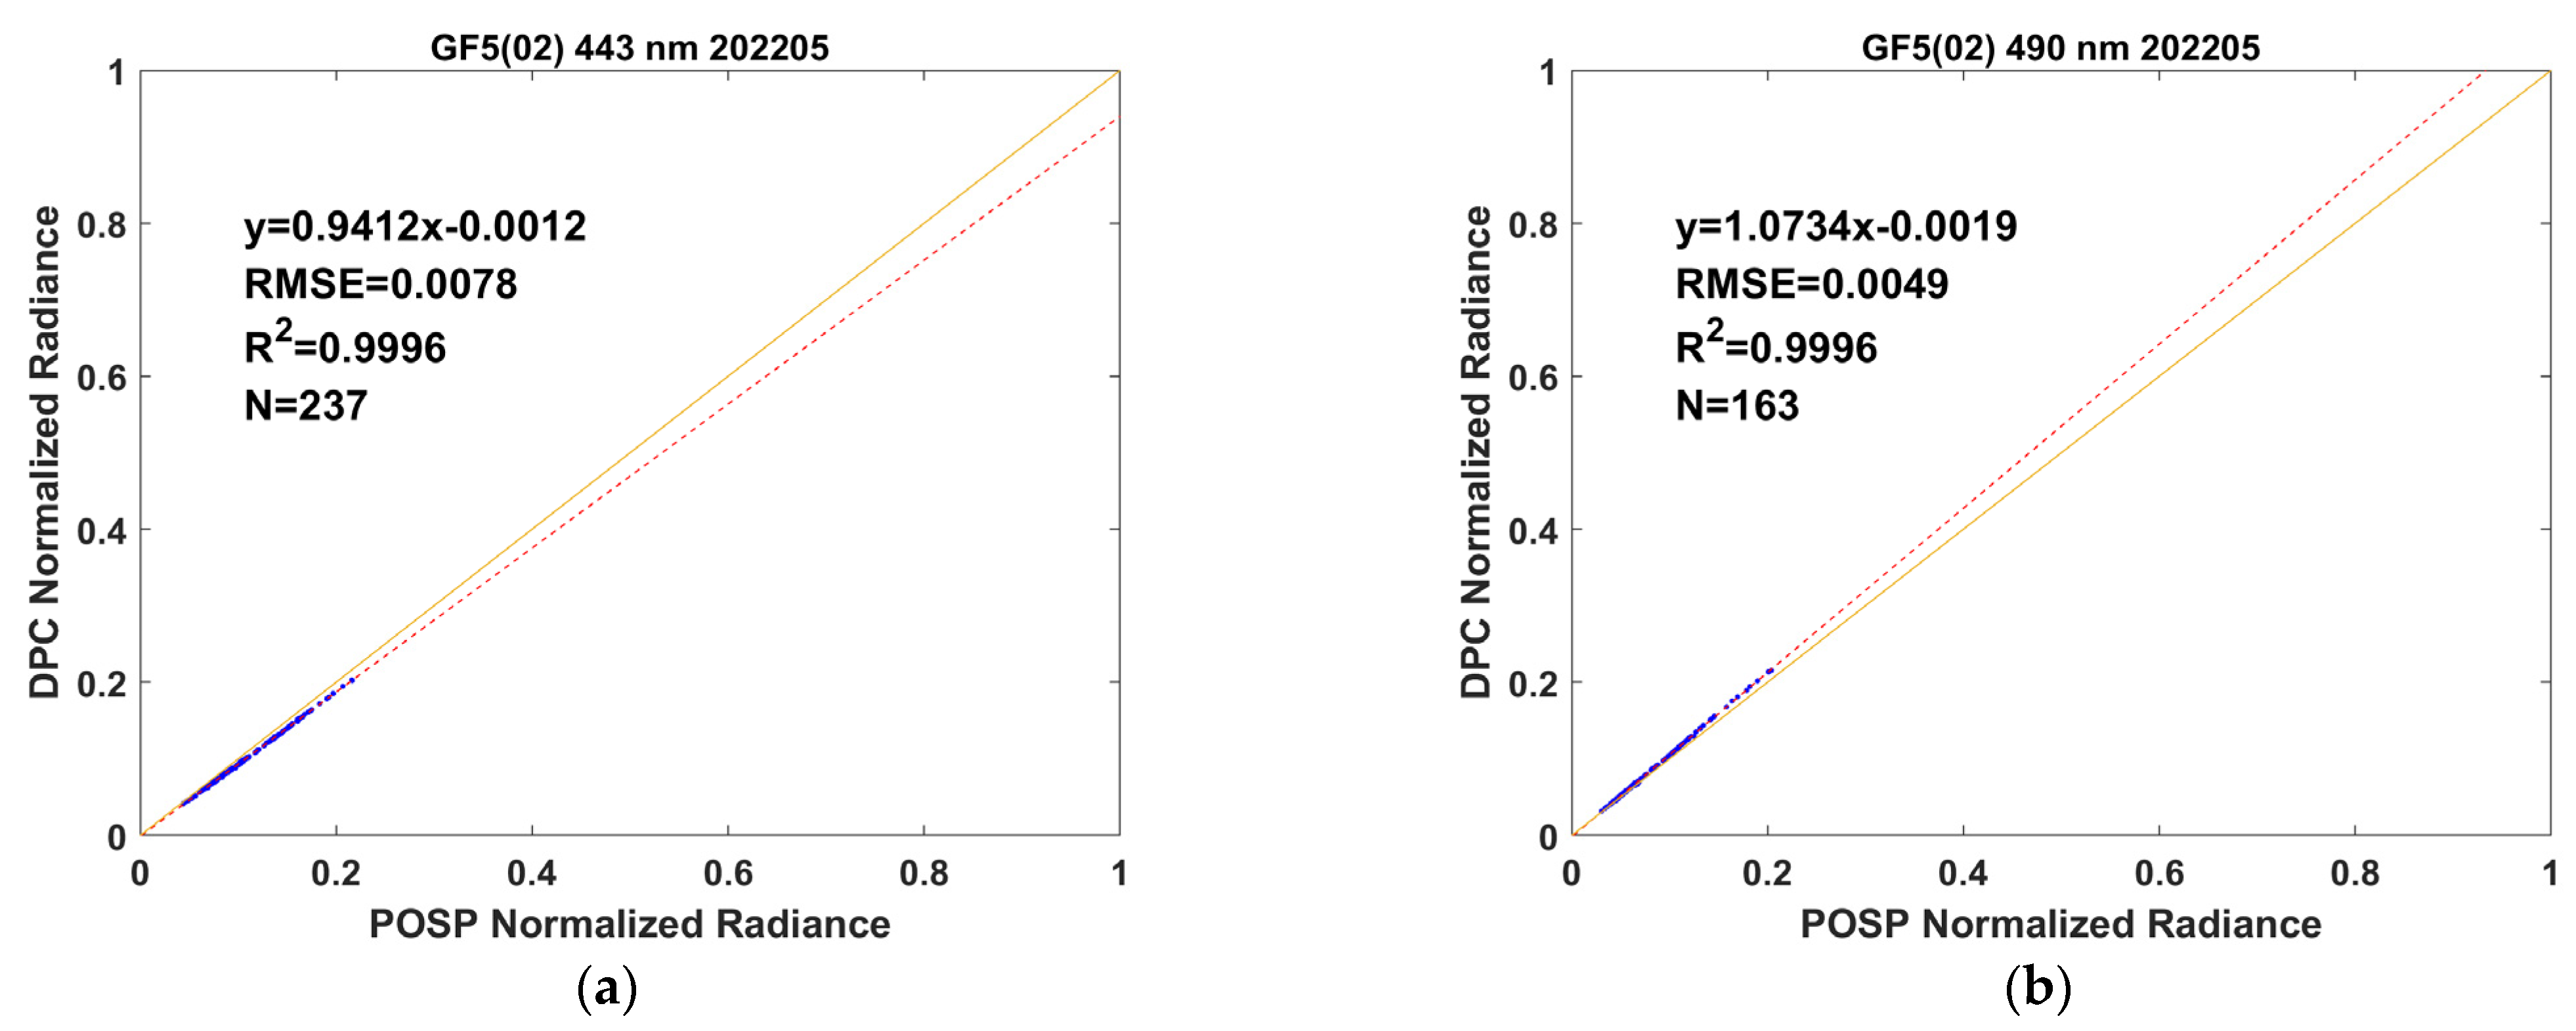
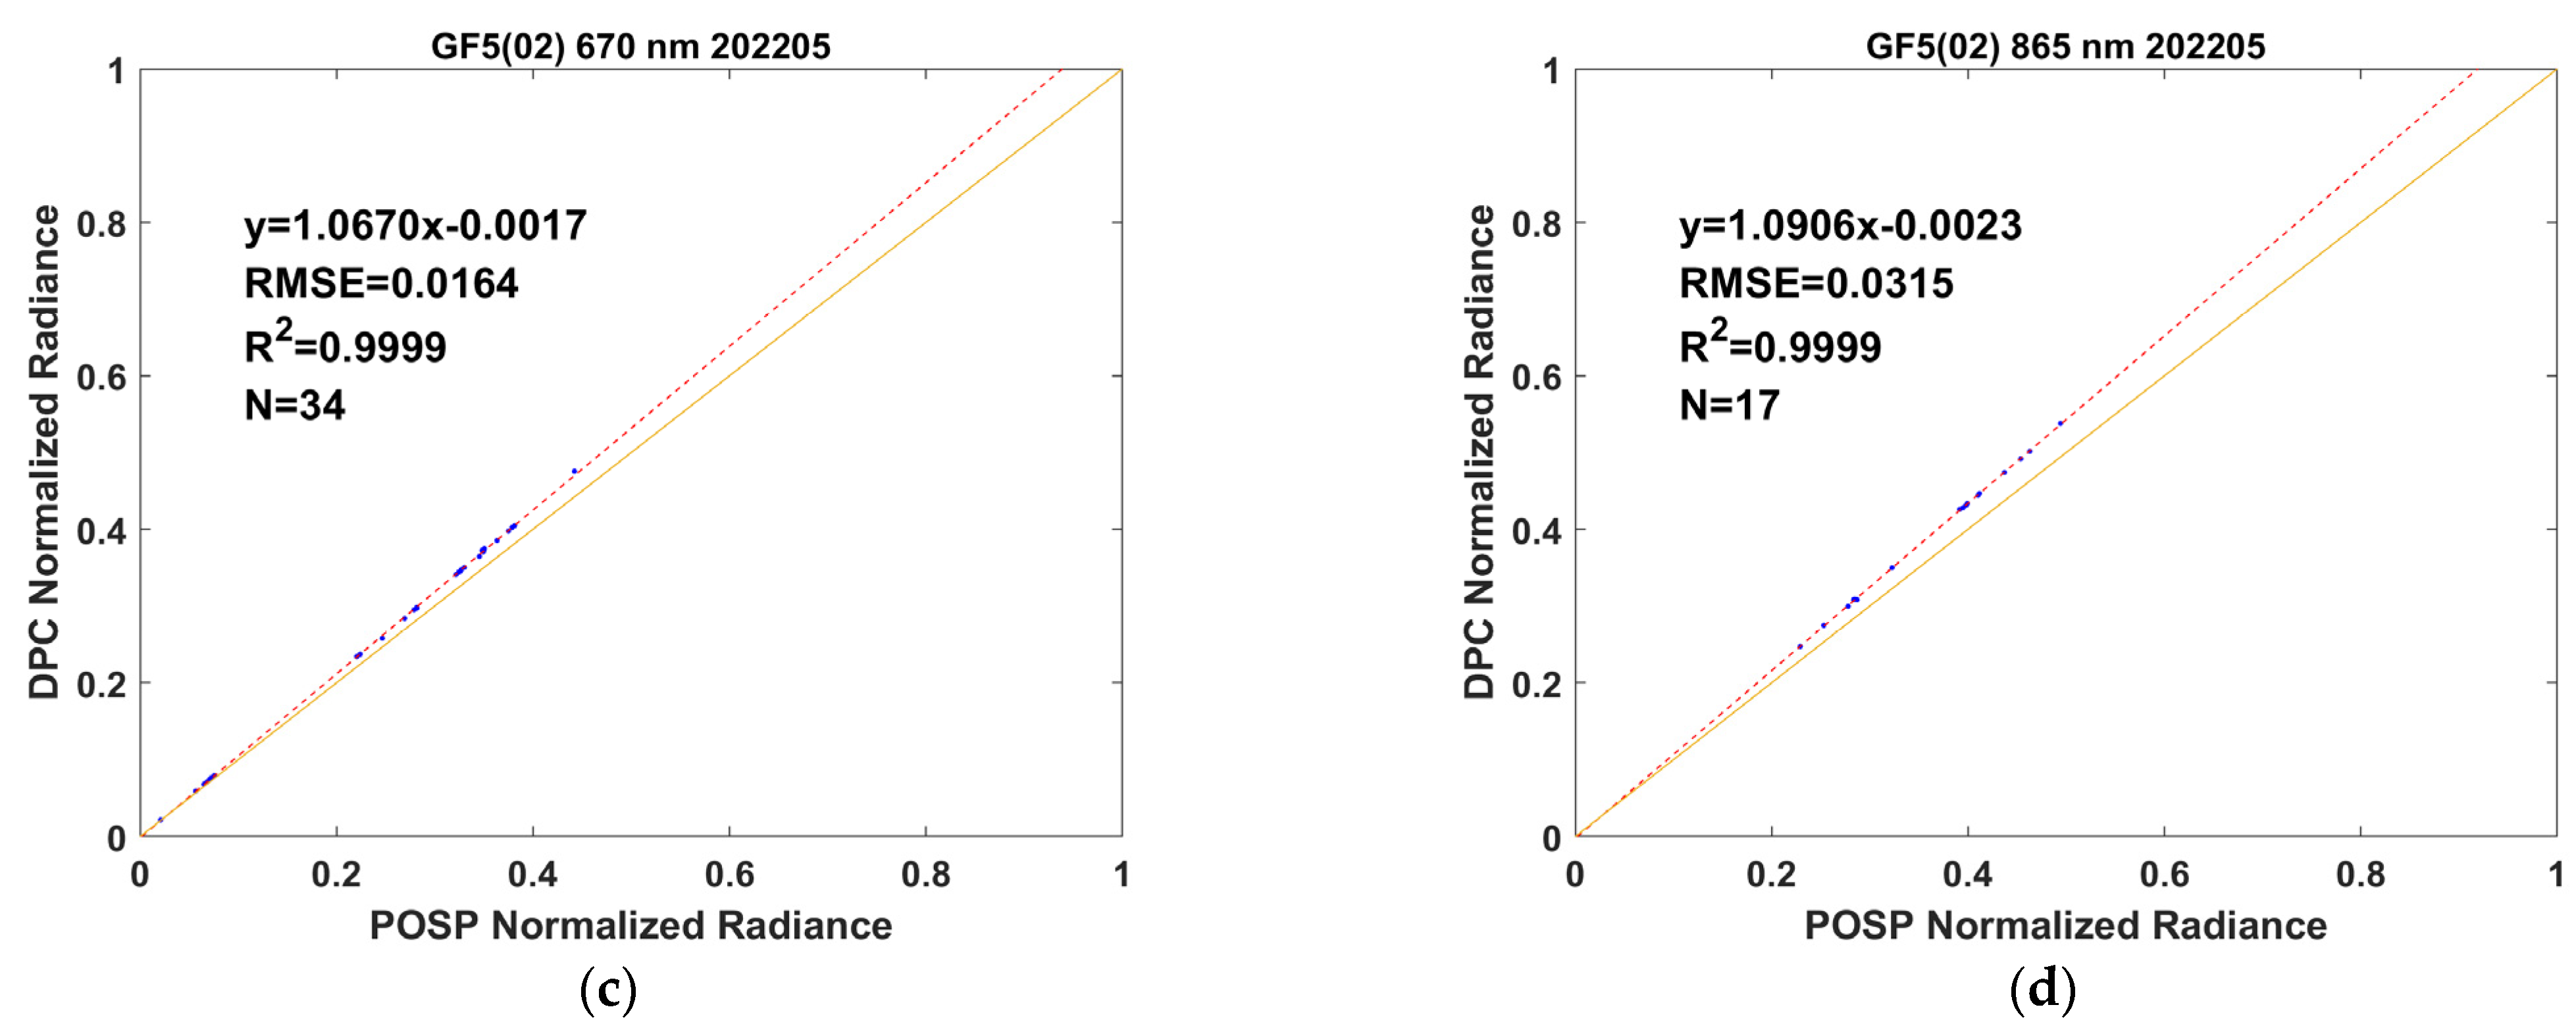
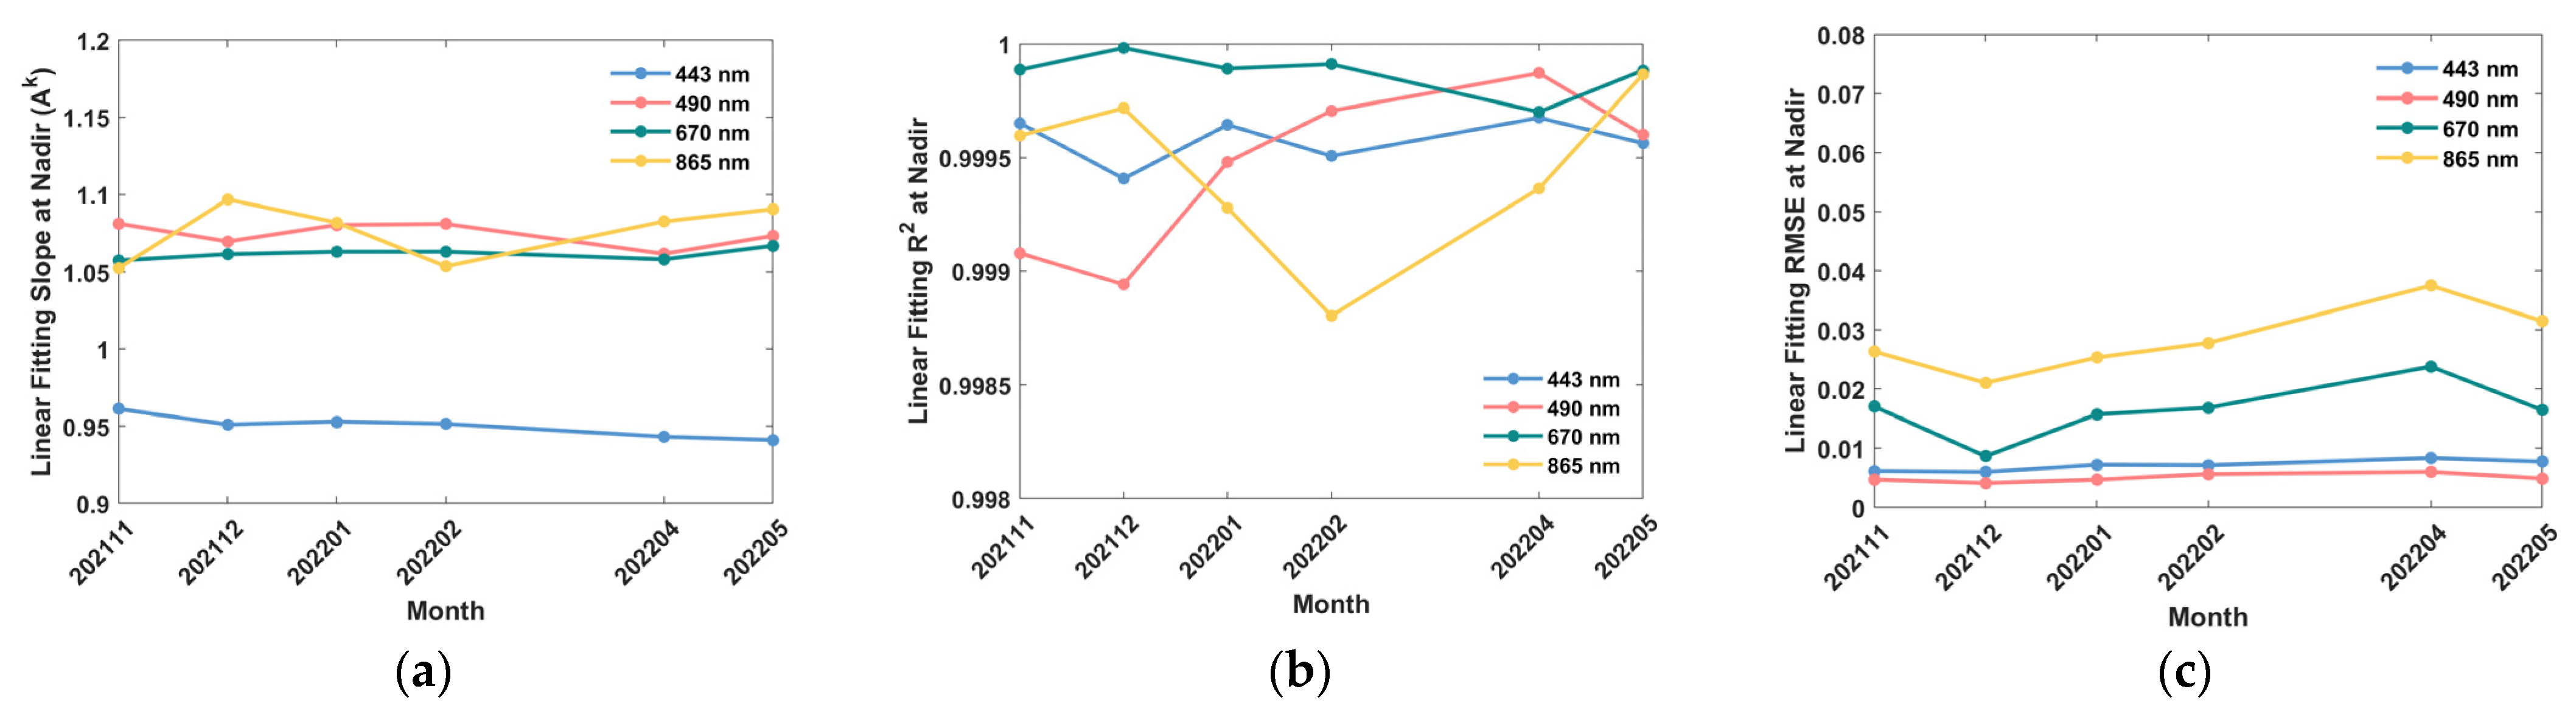
4.1. Cross-Calibration of A k

Figure 5 shows the linear fitting results of DPC and POSP L1 data at nadir after FOV matching and data selection. The fitted slope is cross-calibrated A k , and the correlation coefficient (R2) reaches 0.999; the root mean square errors (RMSEs) are less than 4%, which indicates high response linearity of the two sensors at nadir and low temporal drift of DPC A k . The calculation equation for RMSE is:
R M S E = i = 1 N ( I D P C I P O S P ) 2 / N
where N is the number of selected DPC and POSP L1 data at nadir (from −1° to 1° VZA range), and I D P C and I P O S P are the normalized TOA radiances in the Level 1 products of DPC and POSP. Figure 6 shows the temporal drift characteristics of linear fitting results. The trend of A k is relatively stable over time. The R2 and RMSEs are maintained at the original level. These results demonstrate the response stability of DPC pixels in the central FOV.
DPC radiometric cross-calibration accuracy consists of three main error contributors: radiance measurement of POSP, transfer of this radiance to DPC, and DPC errors. The POSP onboard calibration error was preliminary evaluated at about 2.64–3.03% for all common bands. DPC errors include non-linearity, non-stability, out-of-band response, etc. that can be determined through laboratory testing, which was less than 1.1%. These two errors are only relevant to the sensors themselves and can be determined independently, not to the cross-calibration transfer process. While the sources of cross-calibration uncertainty in the transfer process are mainly differences in spectral response, viewing geometry, and target matching between the two sensors [40], as shown in Table 2. The bandwidth and center wavelength of DPC and POSP are almost the same (Figure 4), but different target types can introduce spectral response uncertainty of about 0.5% based on the spectral band adjustment factor (SBAF). DPC and POSP have strict constraints on viewing geometry consistency. The differences in viewing angles may introduce response uncertainty of about 0.2% based on the bidirectional reflectance distribution functions (BRDF) model of different target types. Additionally, the target matching uncertainty is related to the scene uniformity, which is about 0.1% for all selected data. Therefore, the combination of radiometric cross-calibration transfer uncertainty is on the order of 0.55%, which can be negligible compared to the radiometric measurement uncertainty of the POSP reference sensor and the measurement errors of DPC.

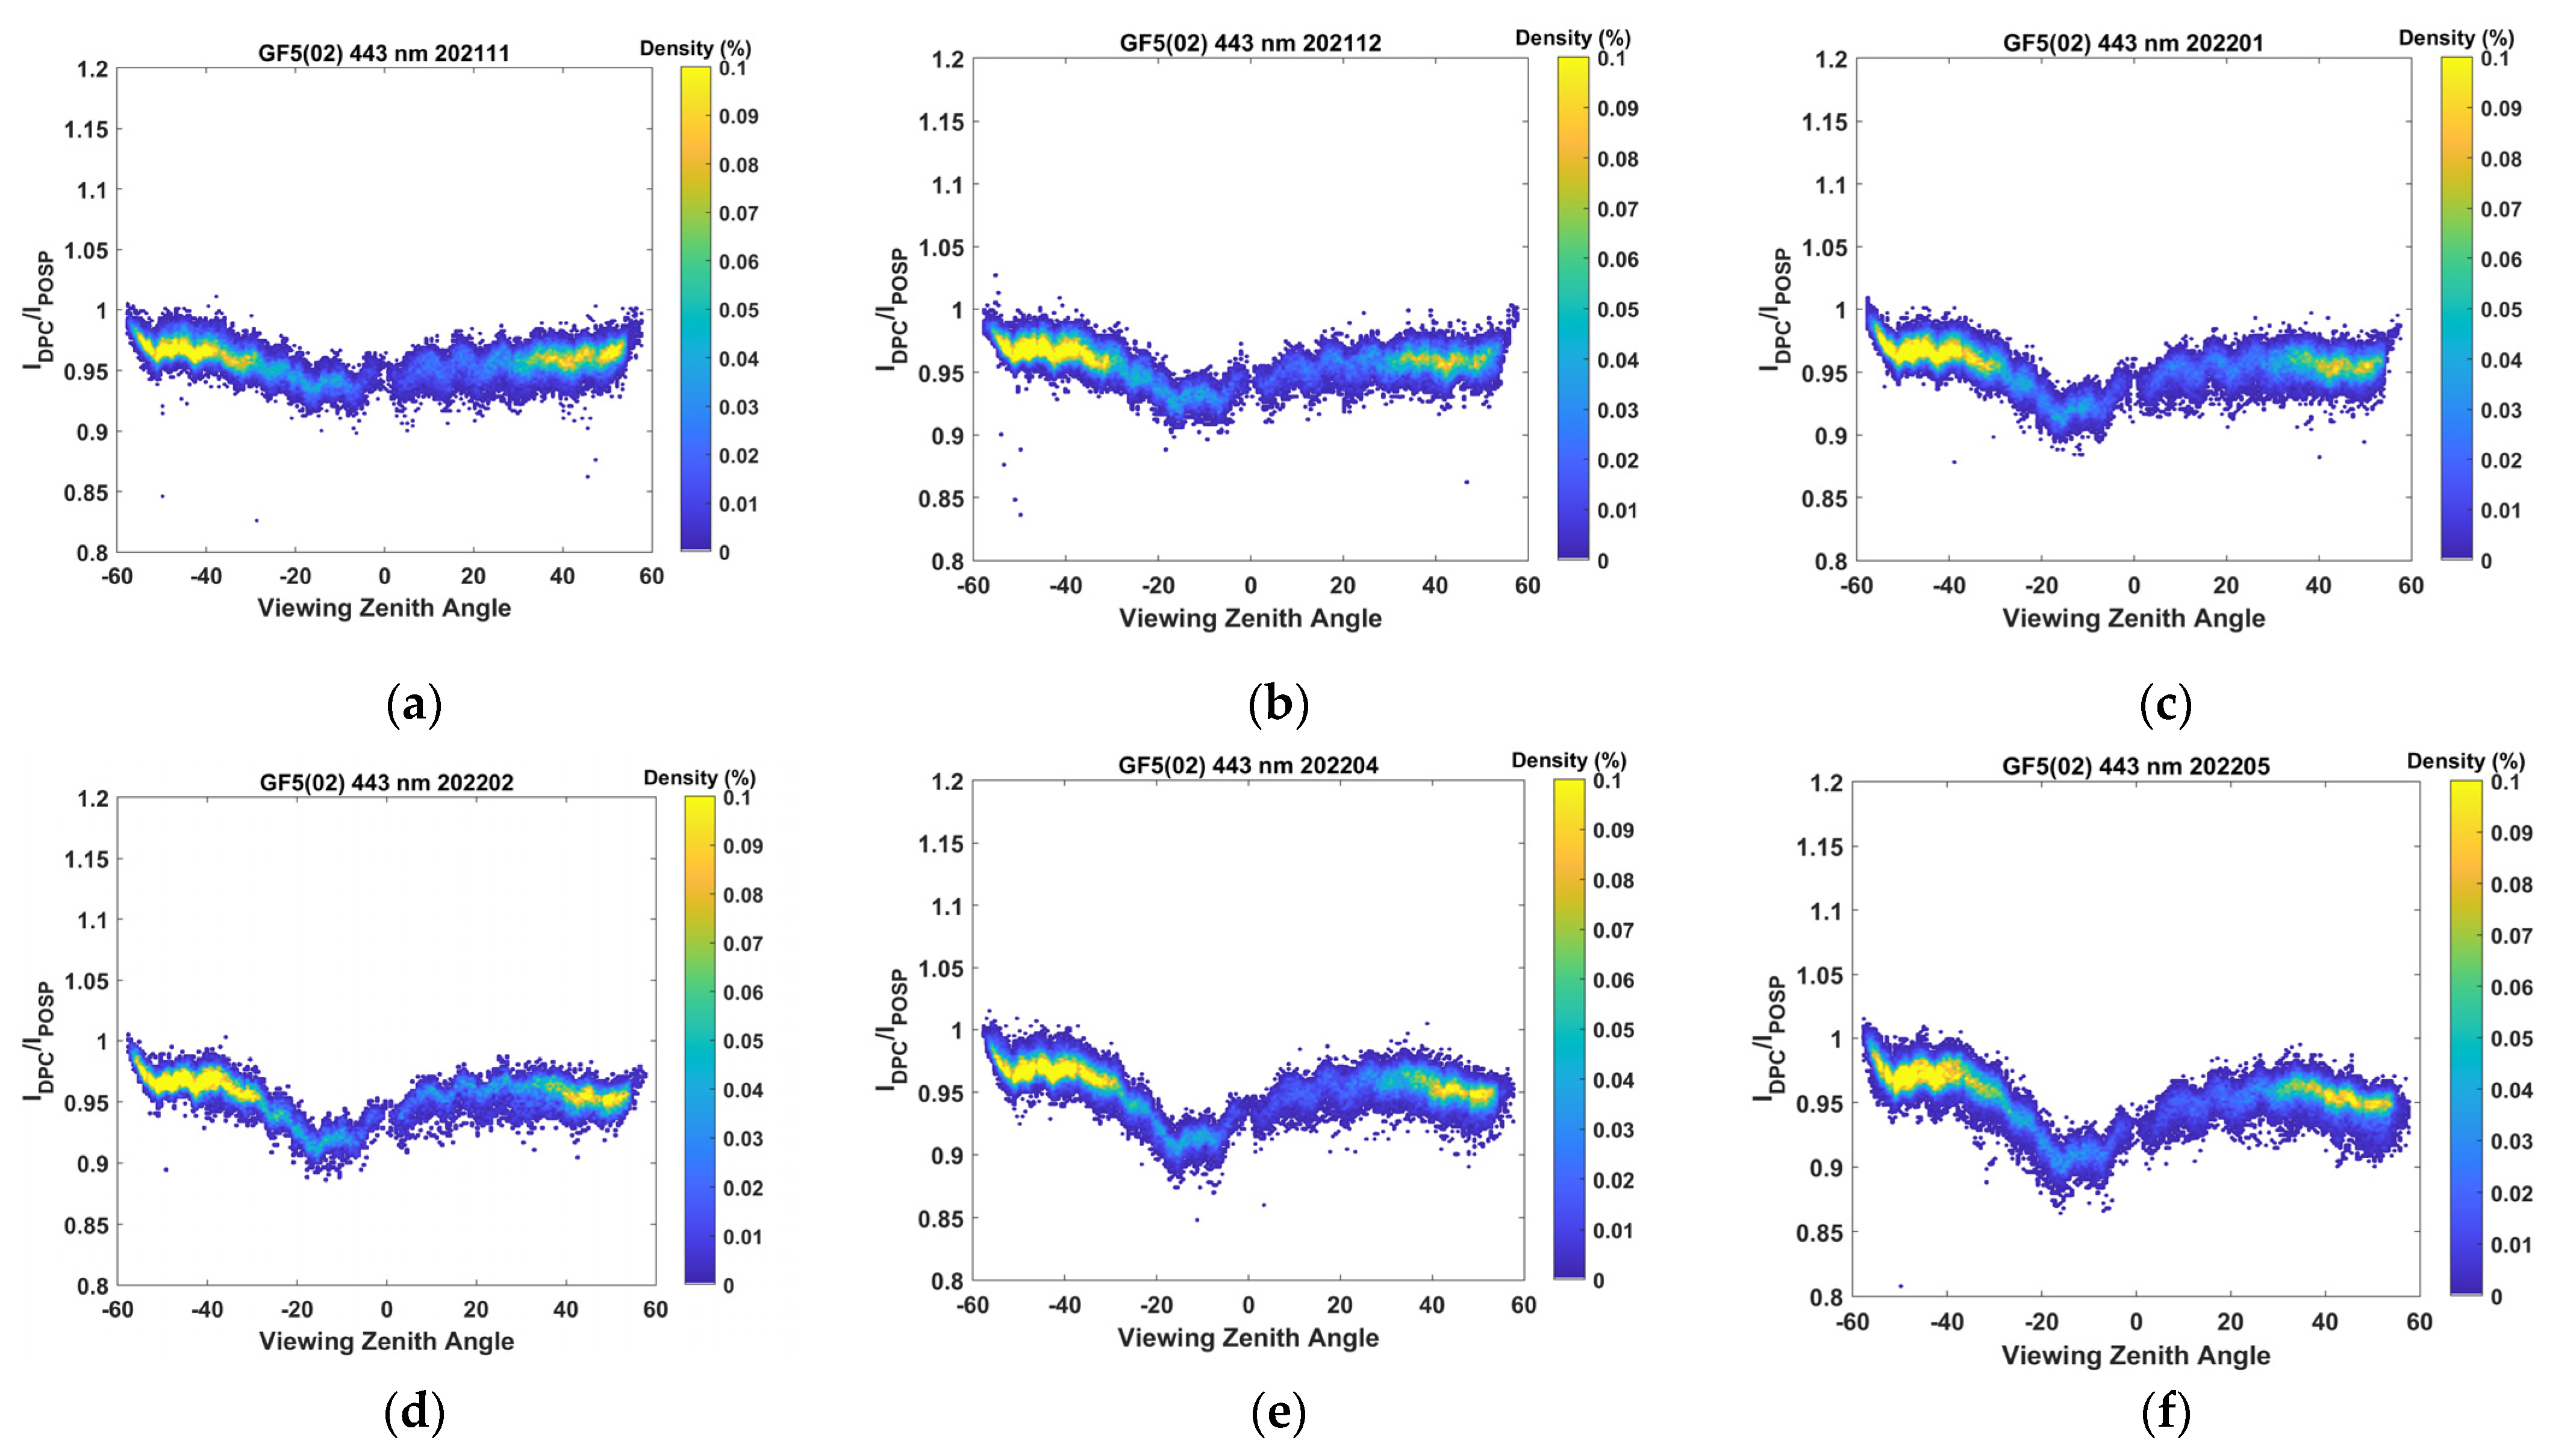
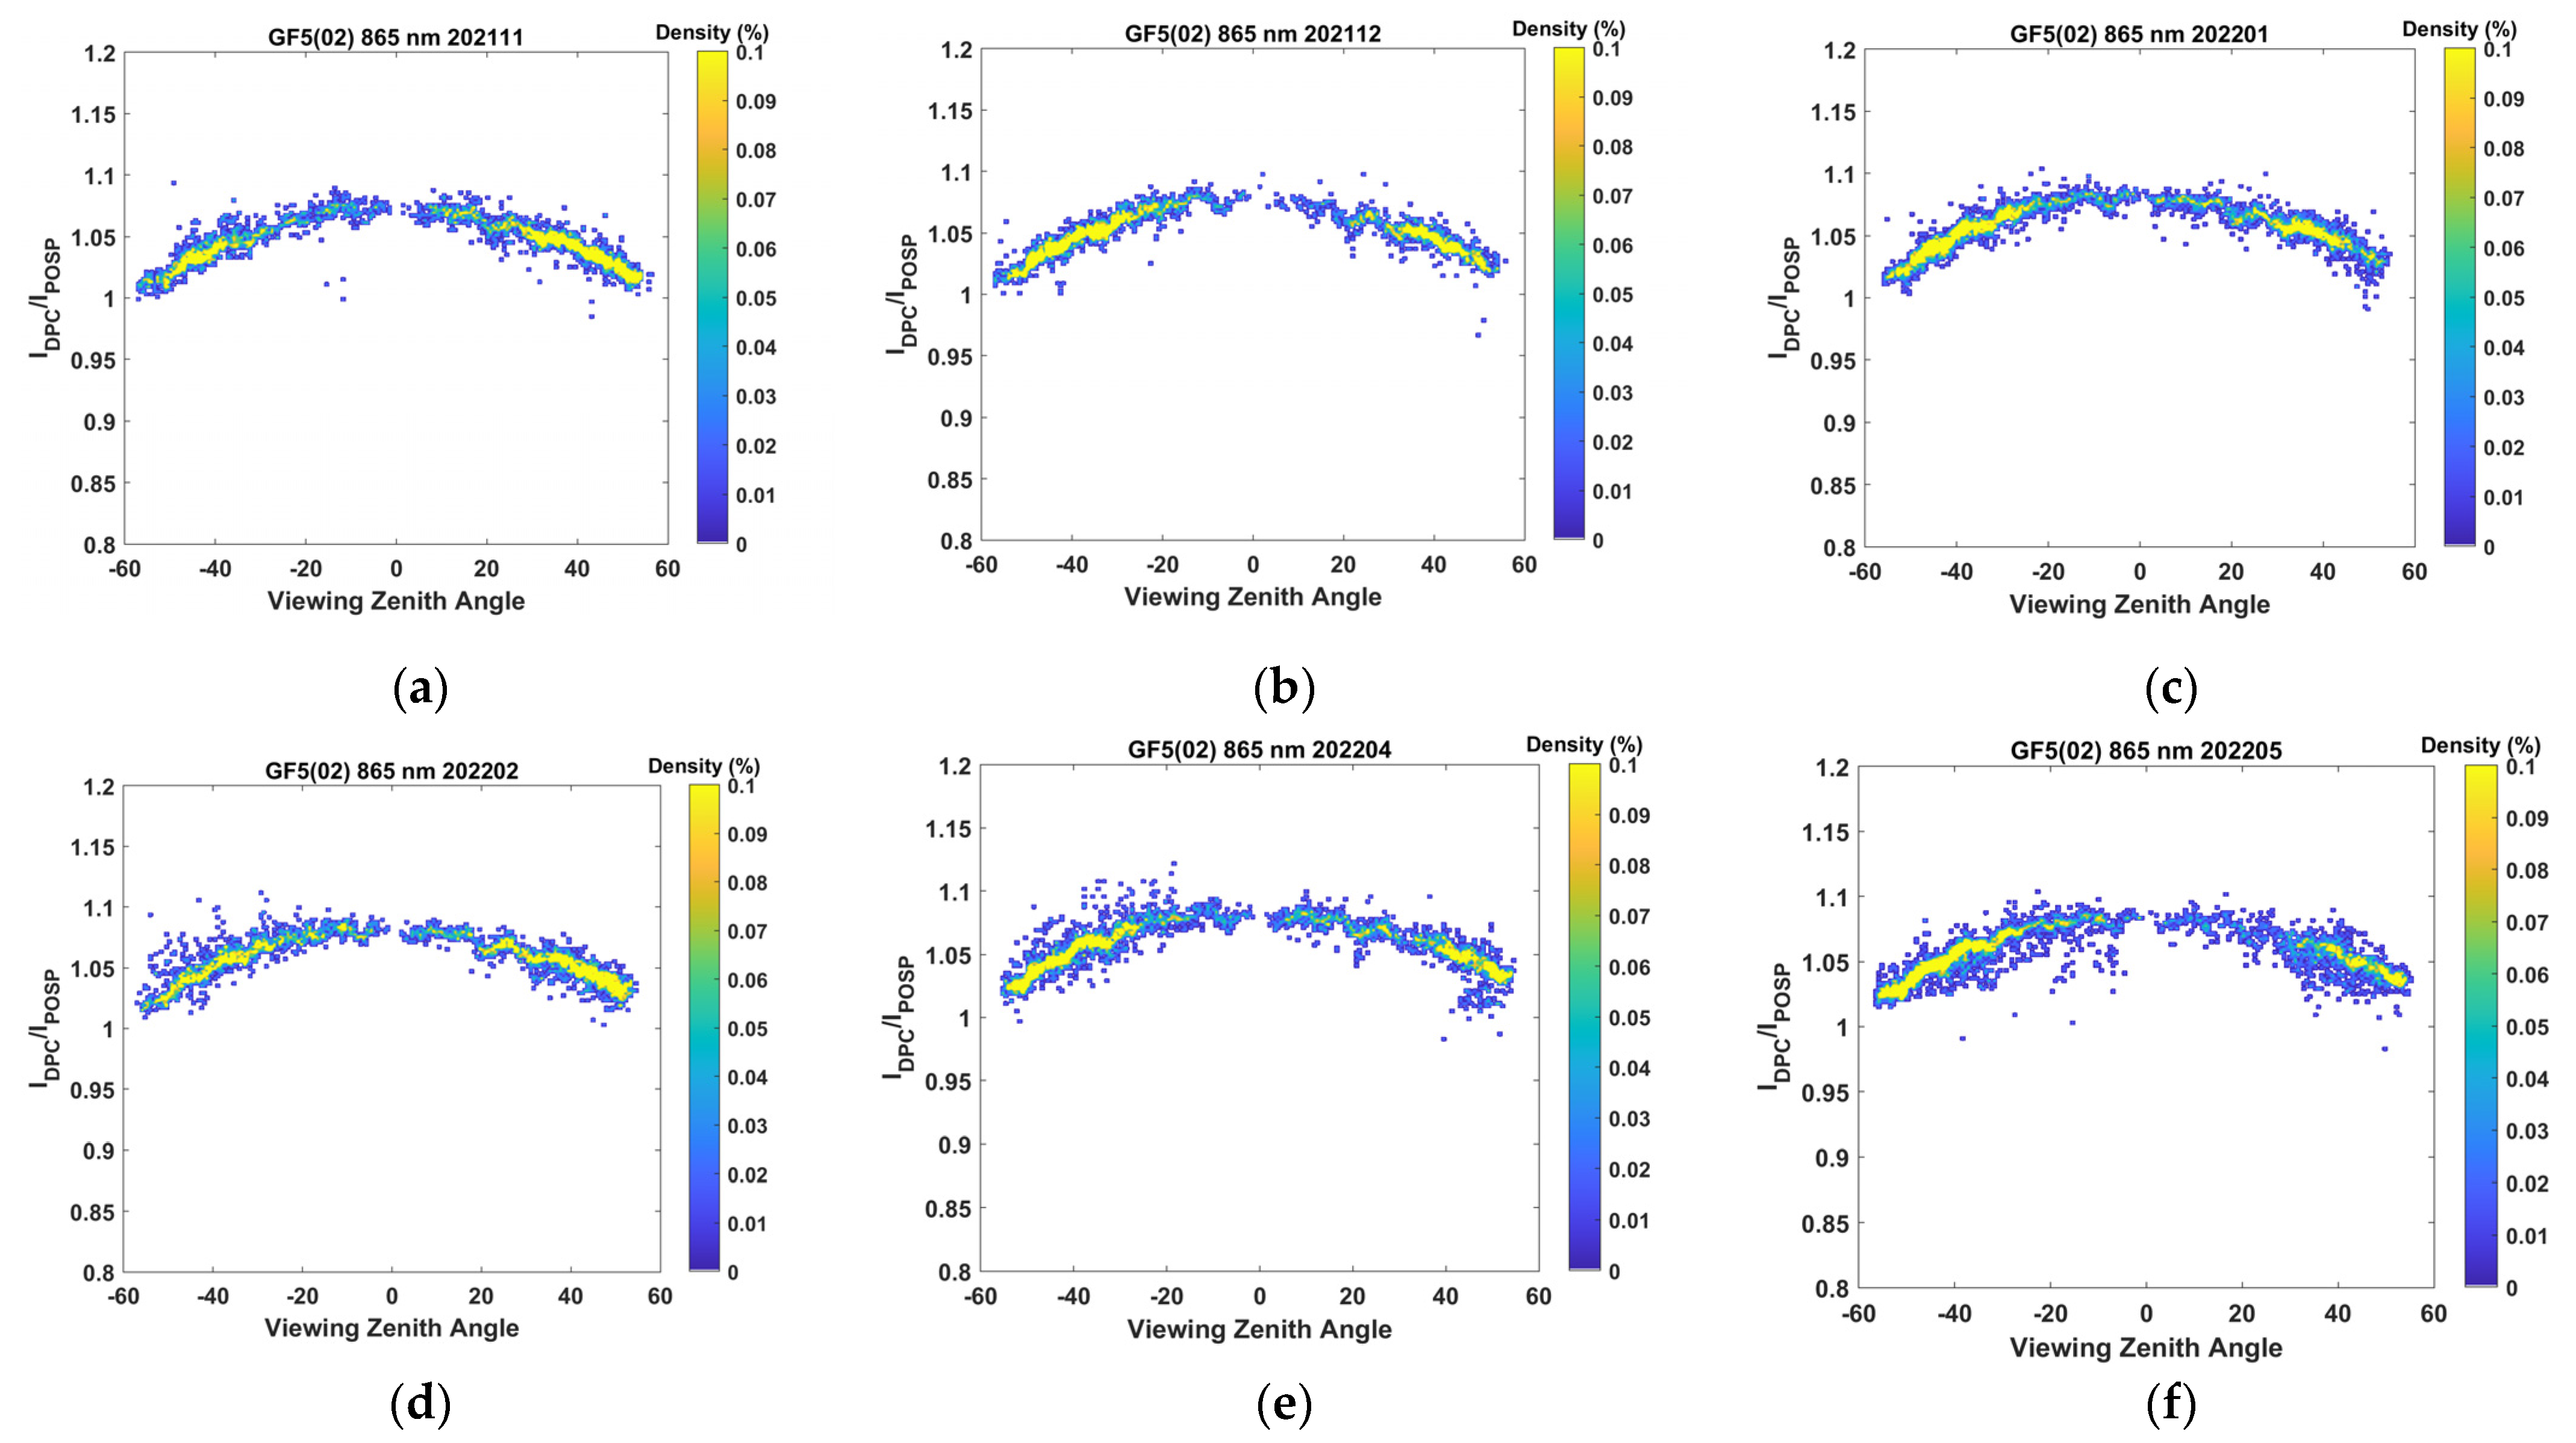
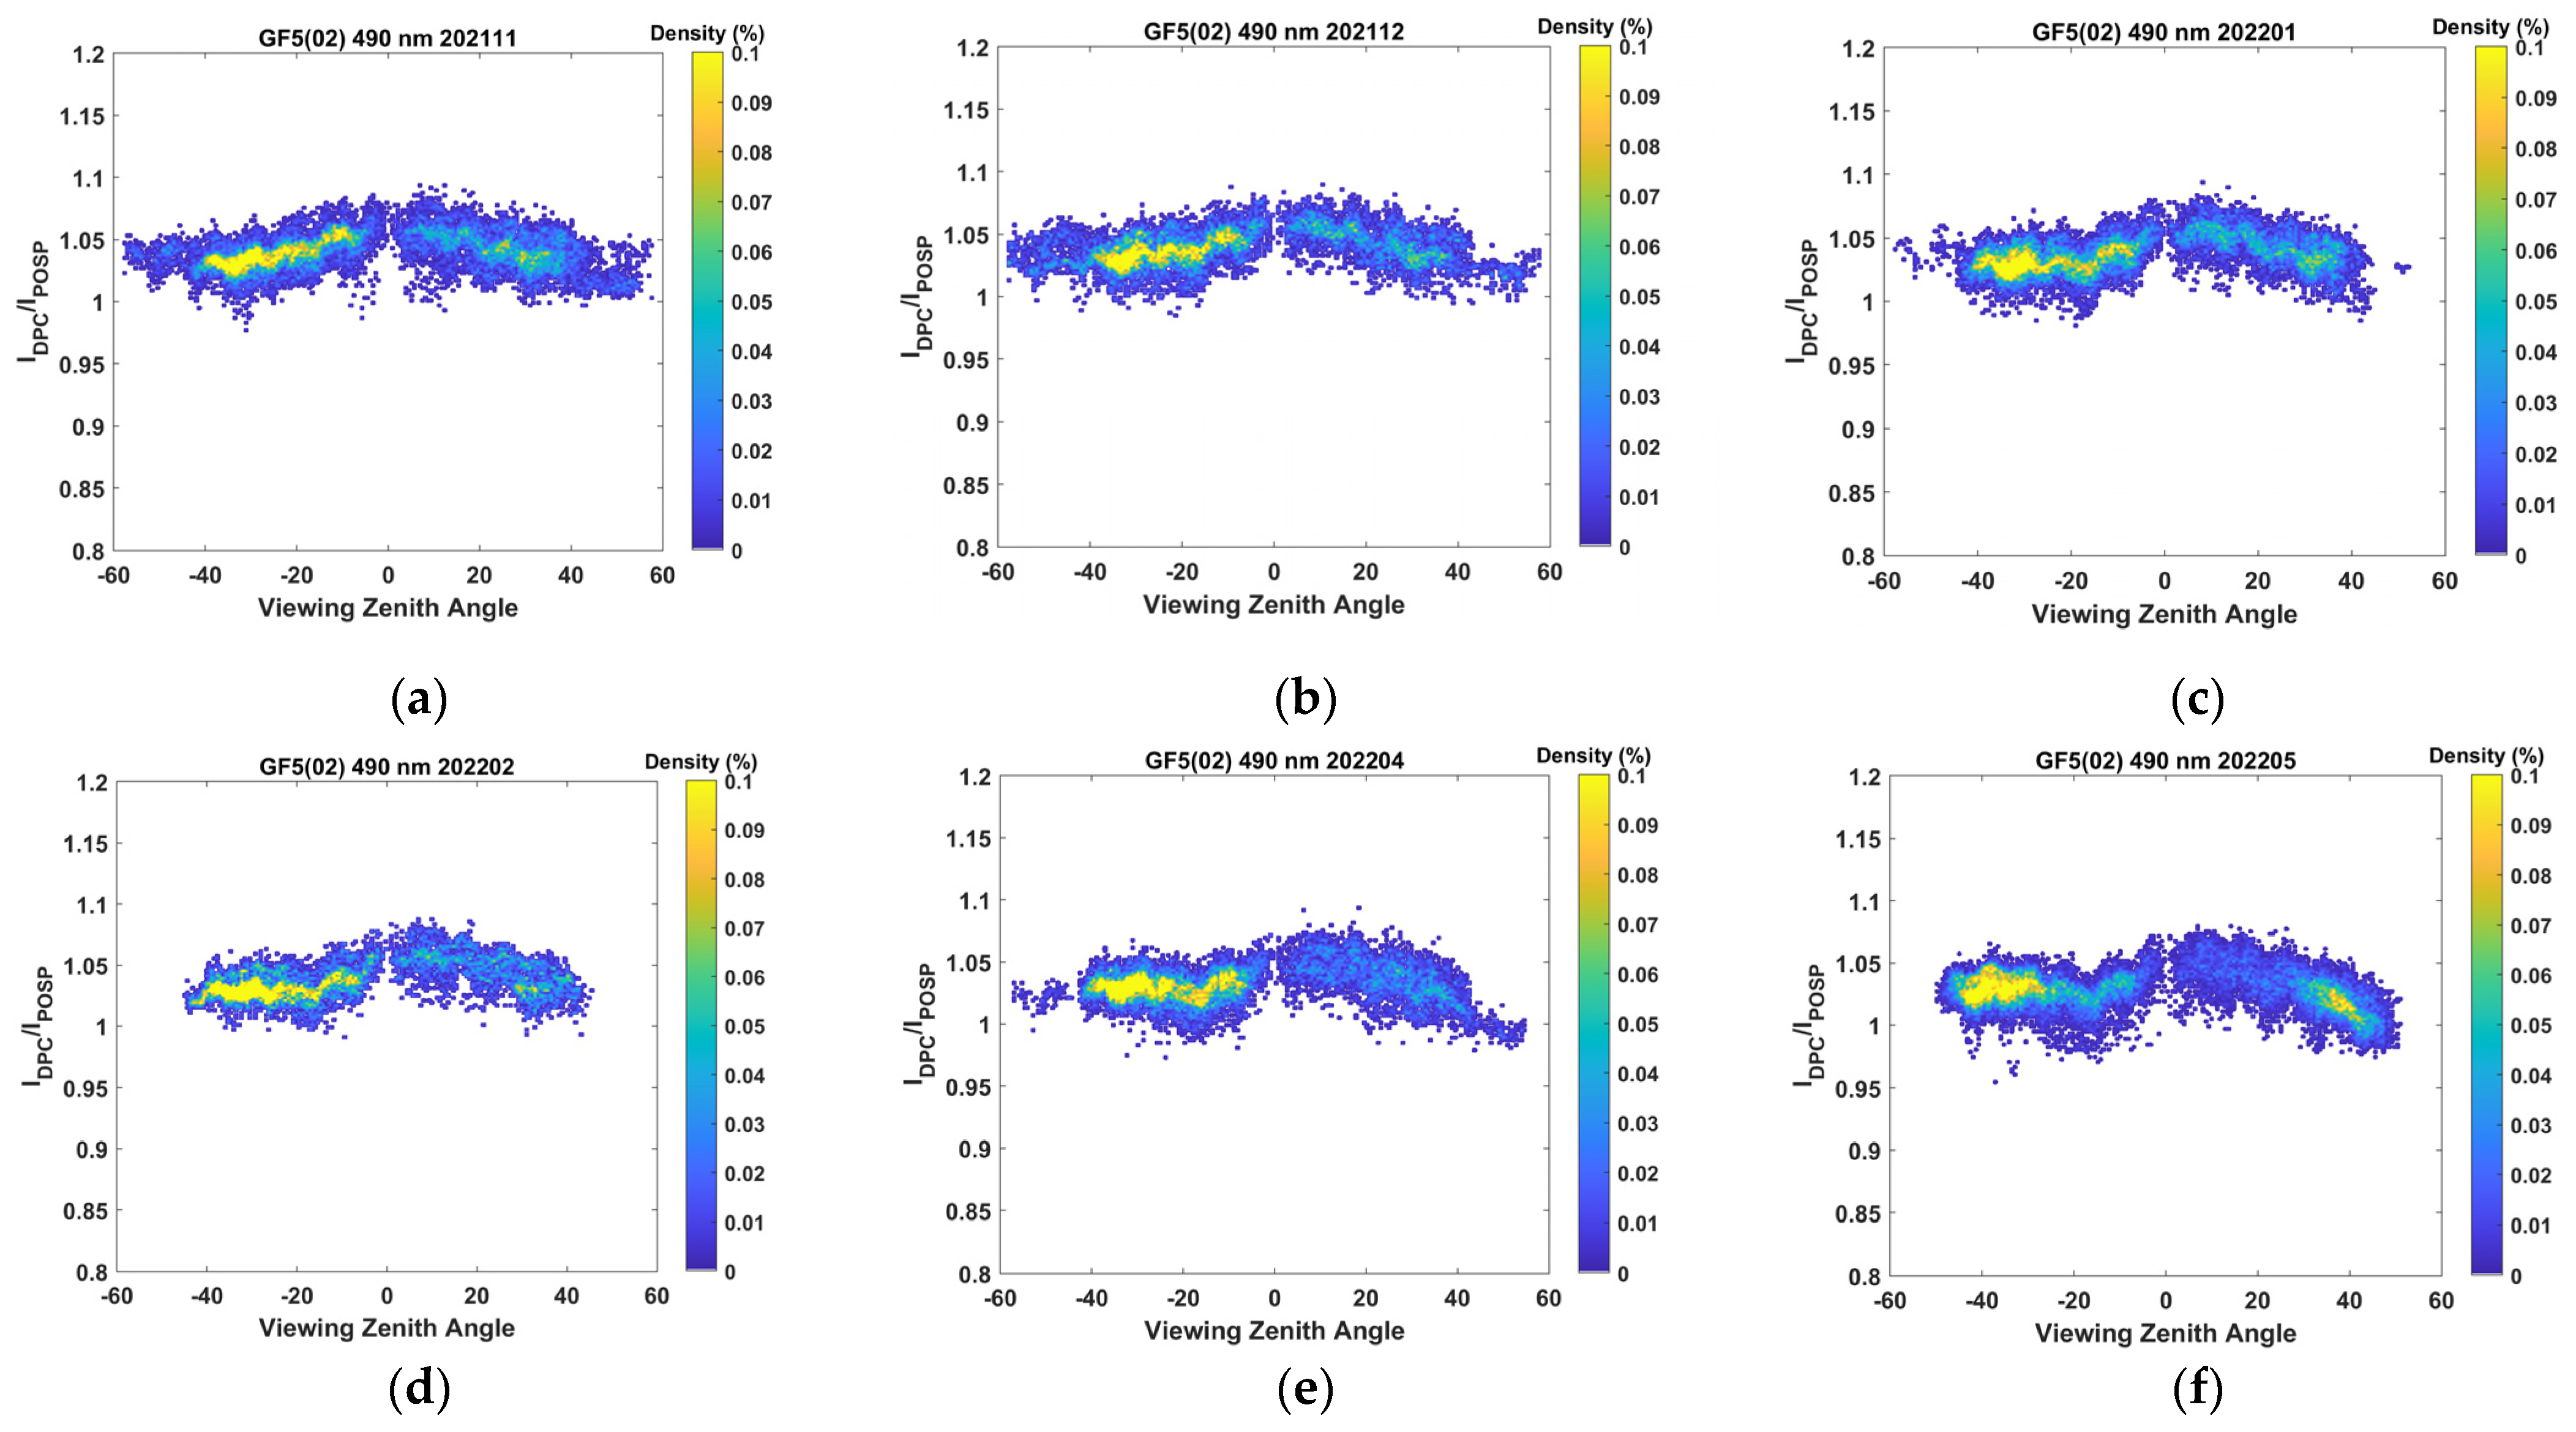
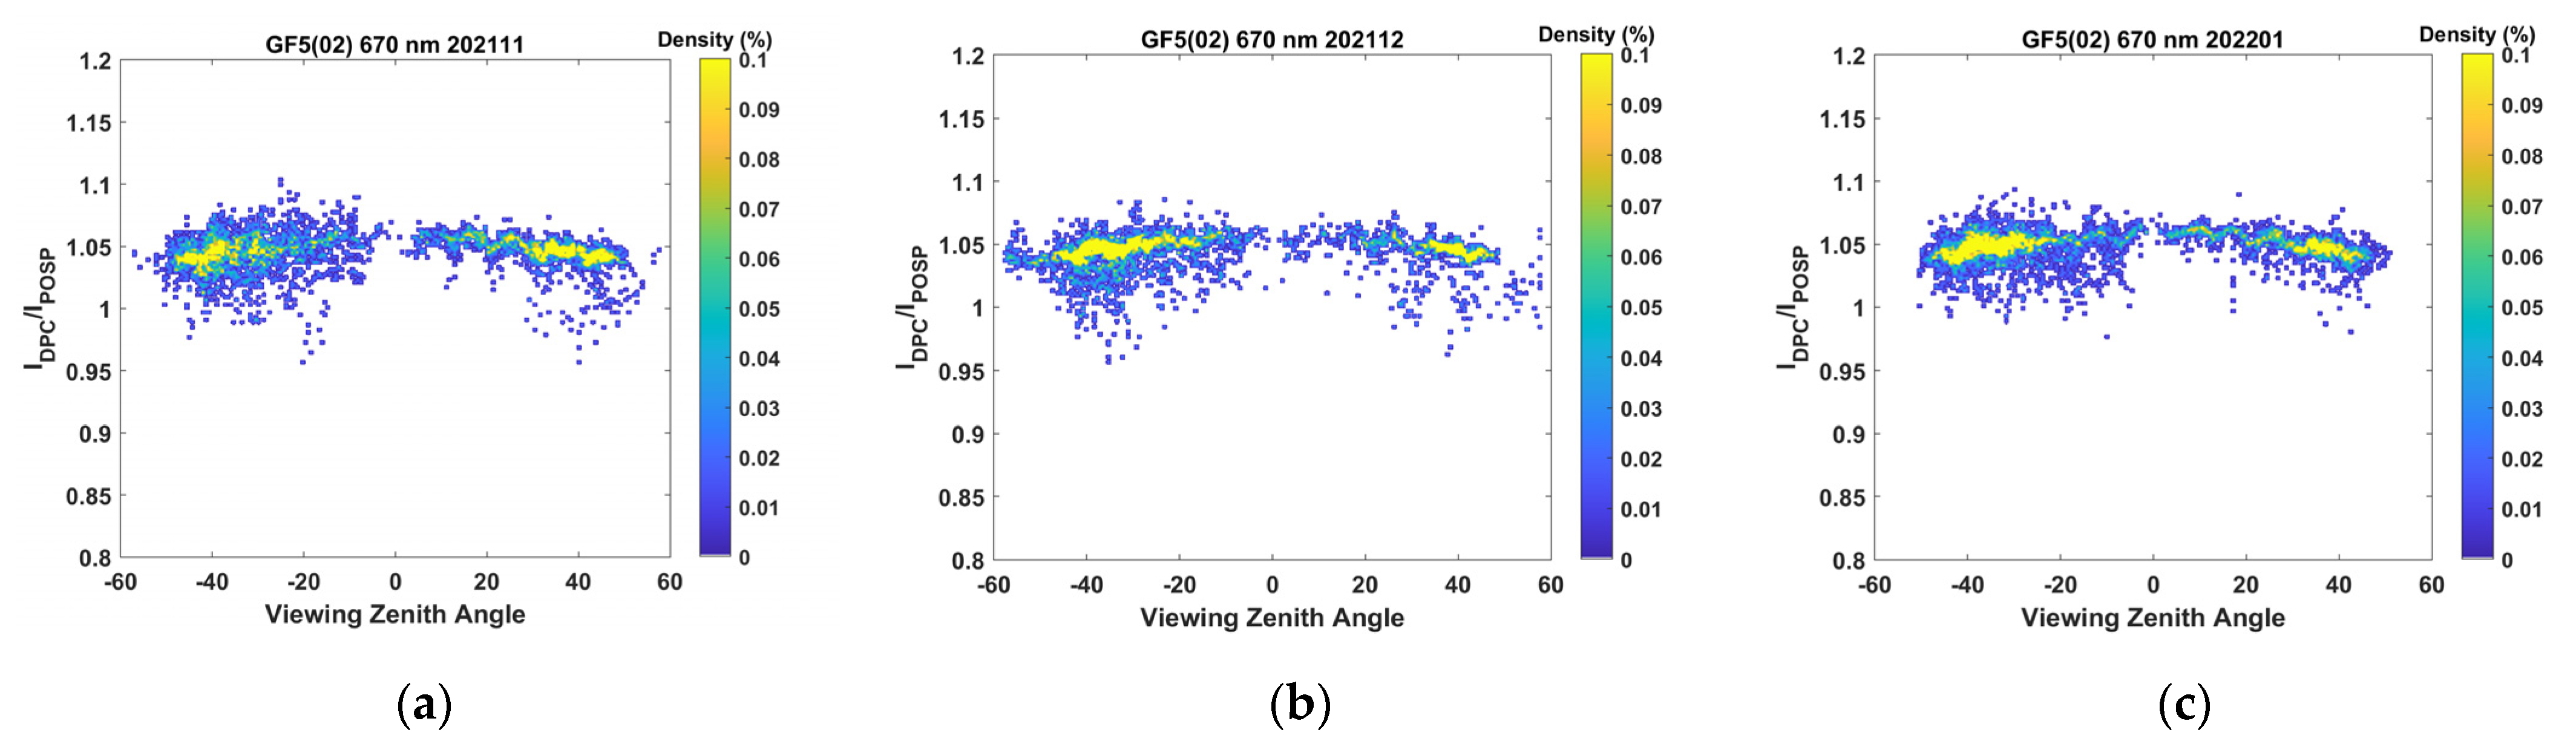
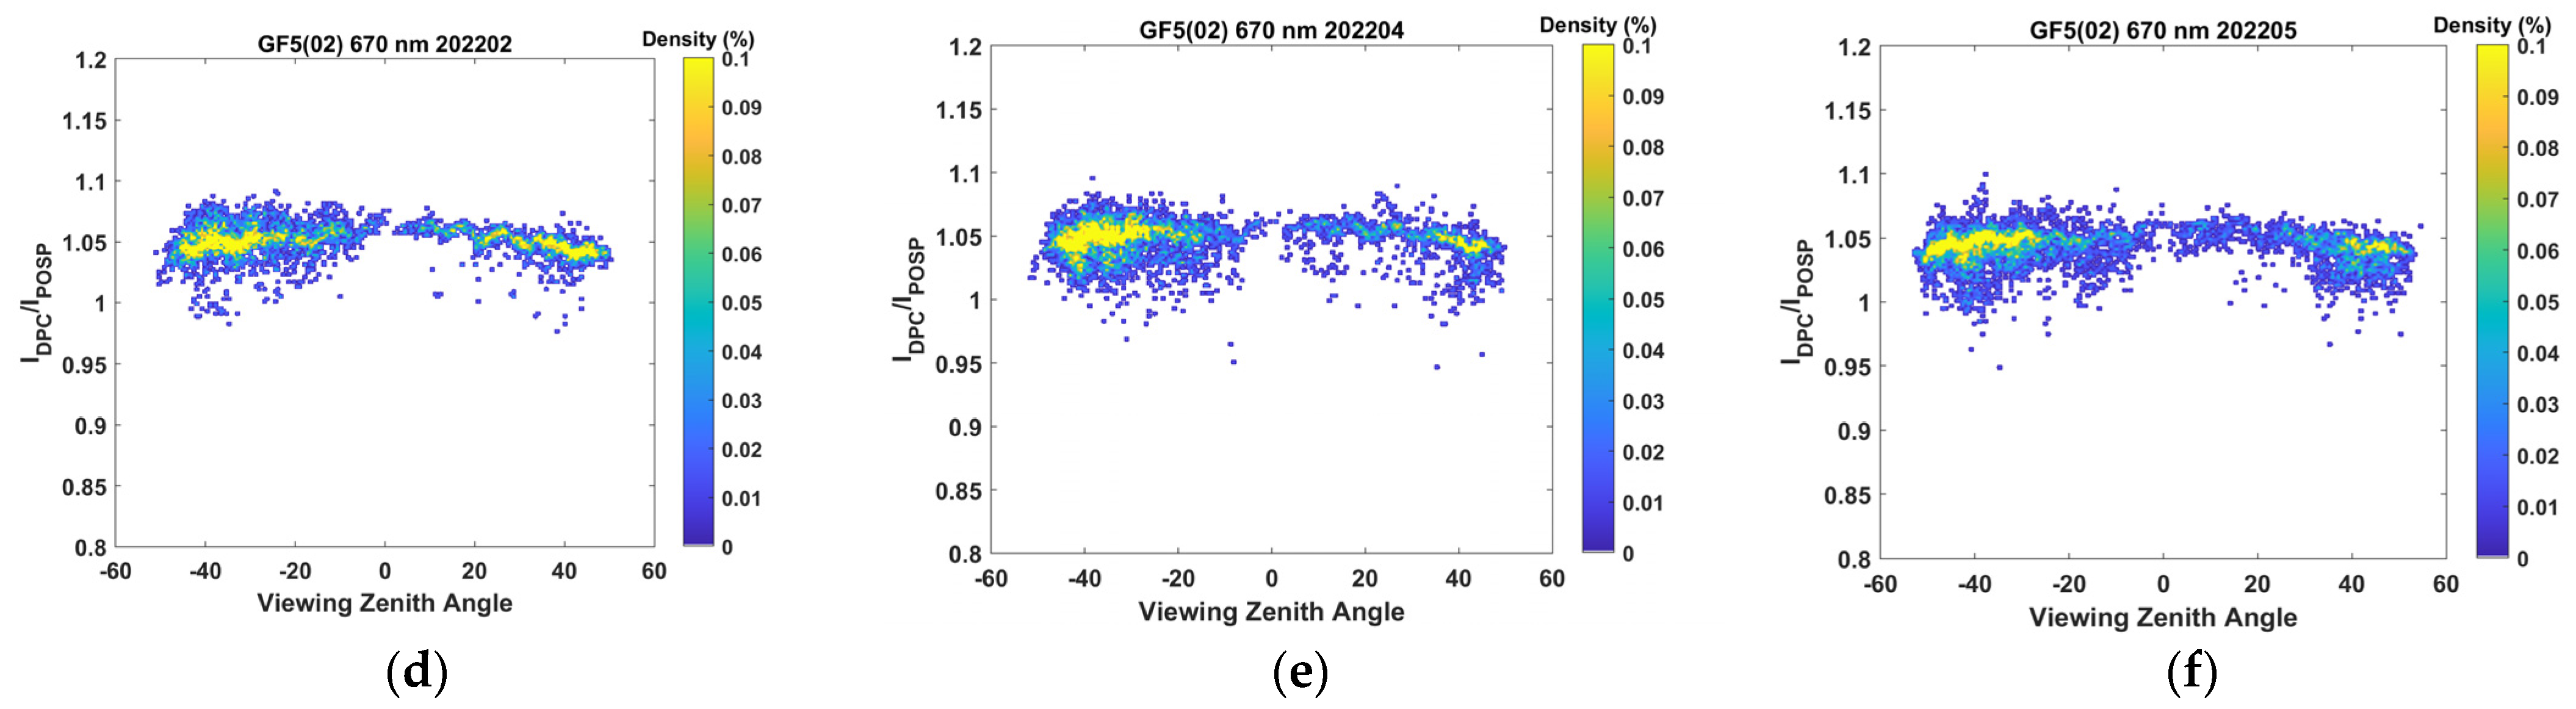
4.2. Relative Radiation Response Calibration

Figure 7 shows the linear fitting slope and corresponding quadratic fitting curve at different post-launch days for data from different VZA ranges. The data pairs are divided into four 30° range intervals symmetrically to the cross-track direction. It is obvious that relative radiation response changes in the −30°–0° VZA range of the 443 nm band have a clear downward trend over time. Additionally, the curves in Figure 7d show the response differences between the central and edge areas of the 865 nm band. The linear fitting slope results in the −30–30° VZA range are larger than the results in the ±30–60° VZA range.
In order to analyze the relative radiation response of the 443 nm and 865 nm bands over time with more detail, the ratio between the normalized radiance of the two sensors from November 2021 to June 2022 is explored as the change of VZAs in data pairs, as shown in Figure 8 and Figure 9. Since the amount of data collected in October 2021 and July 2022 is very small, it is not shown in the figures. For the results of the 443 nm band at different times, there is an obvious relative response attenuation within the range of the −30–0° VZAs. Additionally, the ratio of normalized radiance has a small downward trend at the edge of the 30–60° VZA range. For the 865 nm band, significant differences can be found in the relative responses of the central and edge regions. Additionally, there is an upward temporal drift in the overall results. These phenomena are consistent with the above-mentioned results of relative response changes in different angle intervals analyzed on different launch days.
For the other two common bands of PCF, the small downward trend in the −30–0° VZA range of 490 nm is also shown in Figure 10. Correspondingly, the relative response stability of the overall results in the 670 nm band is also reflected in Figure 11.

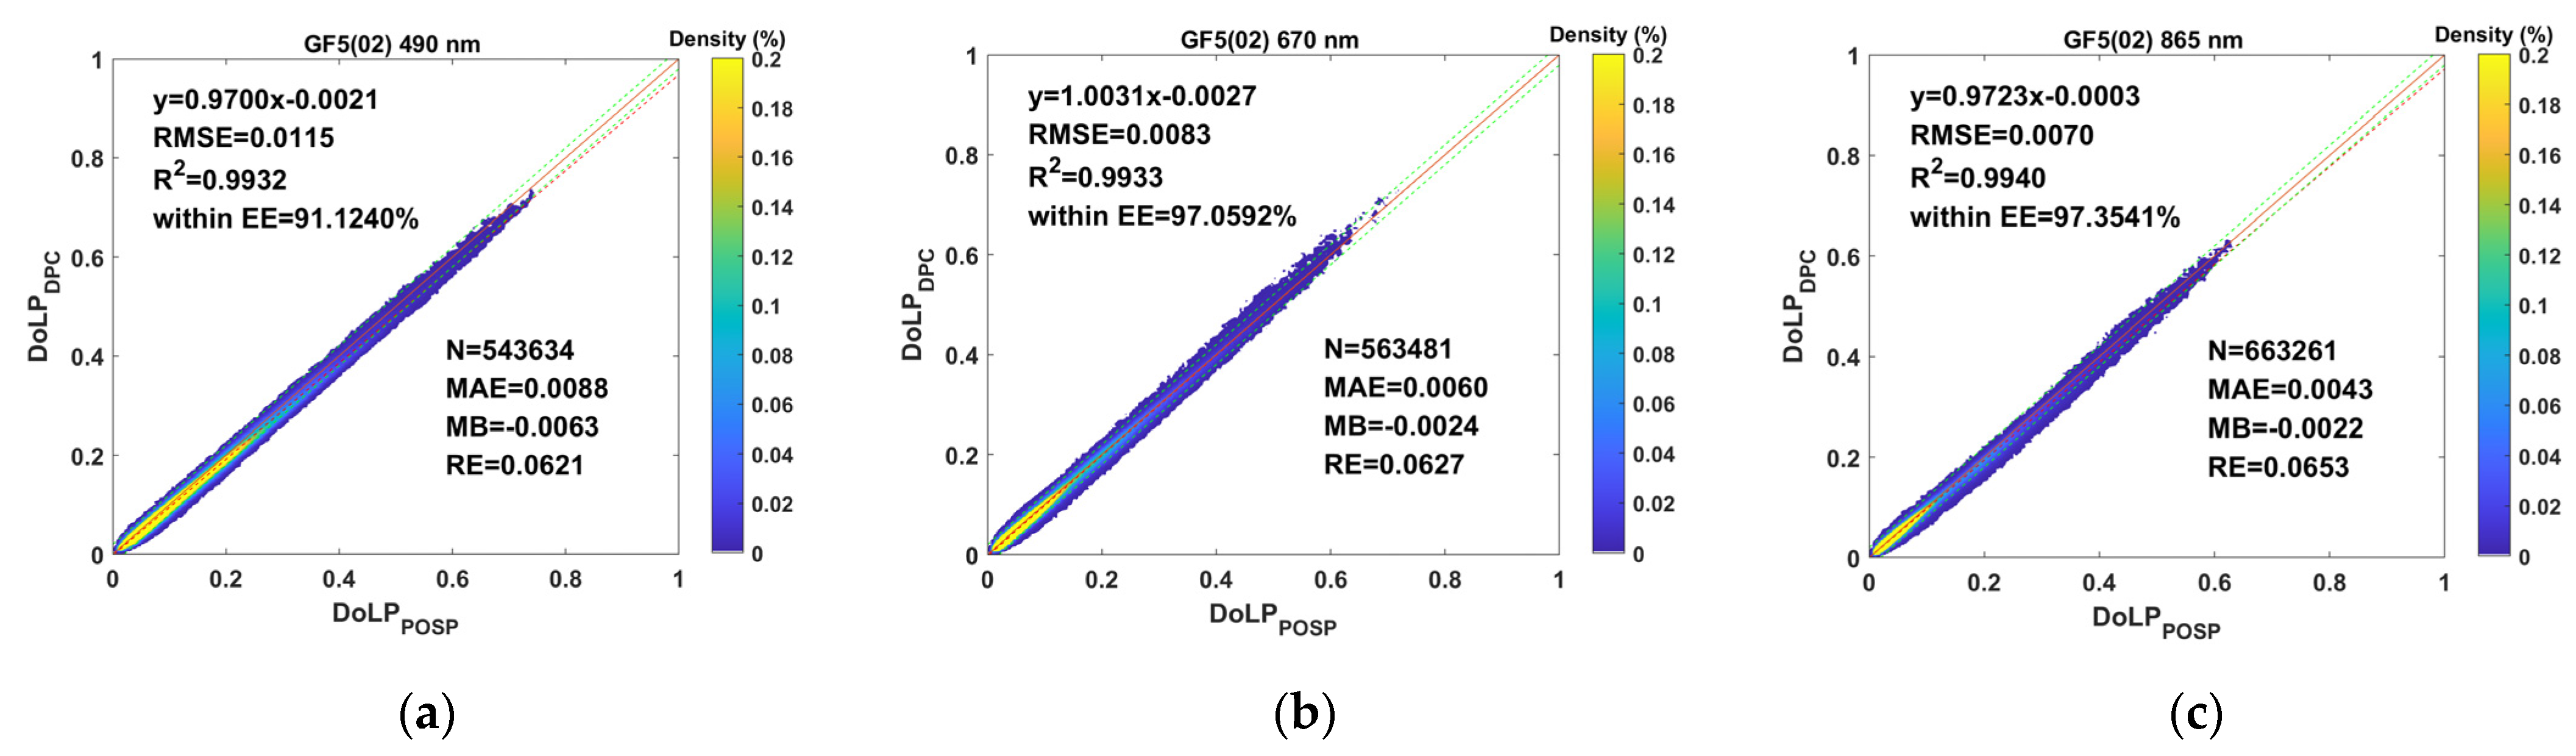
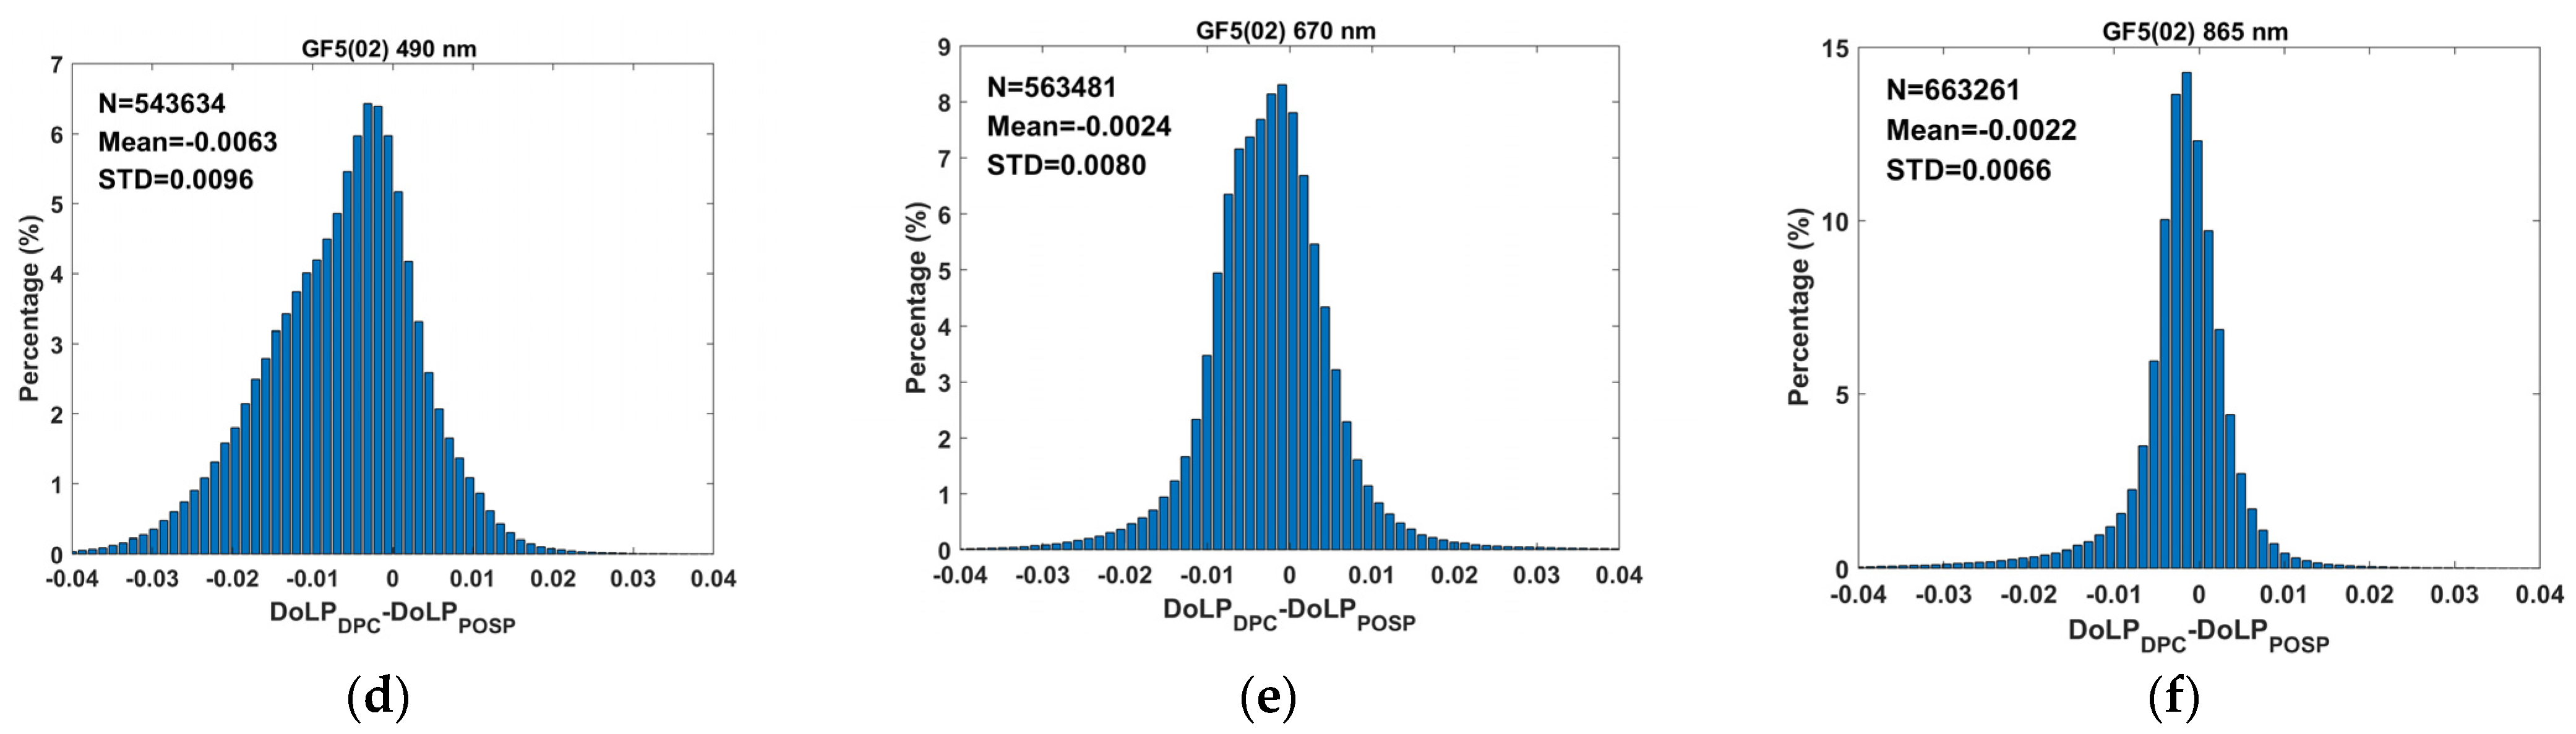
4.3. DoLP Comparison

Figure 12 shows the linear fitting and statistical distribution results of DoLP with DPC versus POSP. The scatter percentage of DPC’s DoLP falling within the expected error (EE = ±0.02) of POSP’s measured DoLP is also estimated. While high polarization detection accuracy POSP results are used as a benchmark in the comparison of DoLP. While the expected polarimetric accuracy of DPC is 0.02 DoLP. The results show that the probability of a DoLP difference less than 0.02 in the common polarimetric bands of two sensors is greater than 90% and that the consistency is high in the large polarization range. For the 490 nm and 865 nm bands, the fitting slope is smaller than the result at the 670 nm band, which might be caused by the change in the relative radiation response of these two bands mentioned above. The other four parameters are also used for quality assessment, including RMSEs, mean absolute errors (MAEs), mean bias (MB), and relative errors (REs). The calculation equations for MAE, MB, and RE are as follows:
M A E = i = 1 N P D P C P P O S P / N
M B = i = 1 N ( P D P C P P O S P ) / N
R E = i = 1 N P D P C P P O S P / i = 1 N P P O S P
where P D P C and P P O S P are the DoLP value of each grid in the DPC and POSP Level 1 products, and N is the number of selected DPC and POSP L1 data.

5. Conclusions

The GaoFen-5(02) satellite, carrying two polarimetric sensors integrated by POSP and DPC, was launched on September 7, 2021. The POSP itself has been equipped with an on-board radiation and polarization system, which can guarantee the measurement accuracy throughout the mission and thus facilitate the cross-calibration and accuracy comparison between the two sensors. In this paper, data comparison and cross-calibration between L1 products of the two polarization sensors on the same satellite platform were carried out; data matching and screening methods were proposed; the radiometric calibration transfer uncertainty and the time series characteristics of the relative radiation response as well as DoLP at different observation angles in the cross-track direction of DPC were analyzed. Data comparison and cross-calibration results indicated the following:
(1)
The radiometric cross-calibration coefficient A k of DPC showed a robust fitting result with transfer uncertainty on the order of 0.55%, and the radiometric calibration transfer uncertainty can be negligible compared to the radiometric measurement uncertainty of the POSP reference sensor and the measurement errors of DPC;
(2)
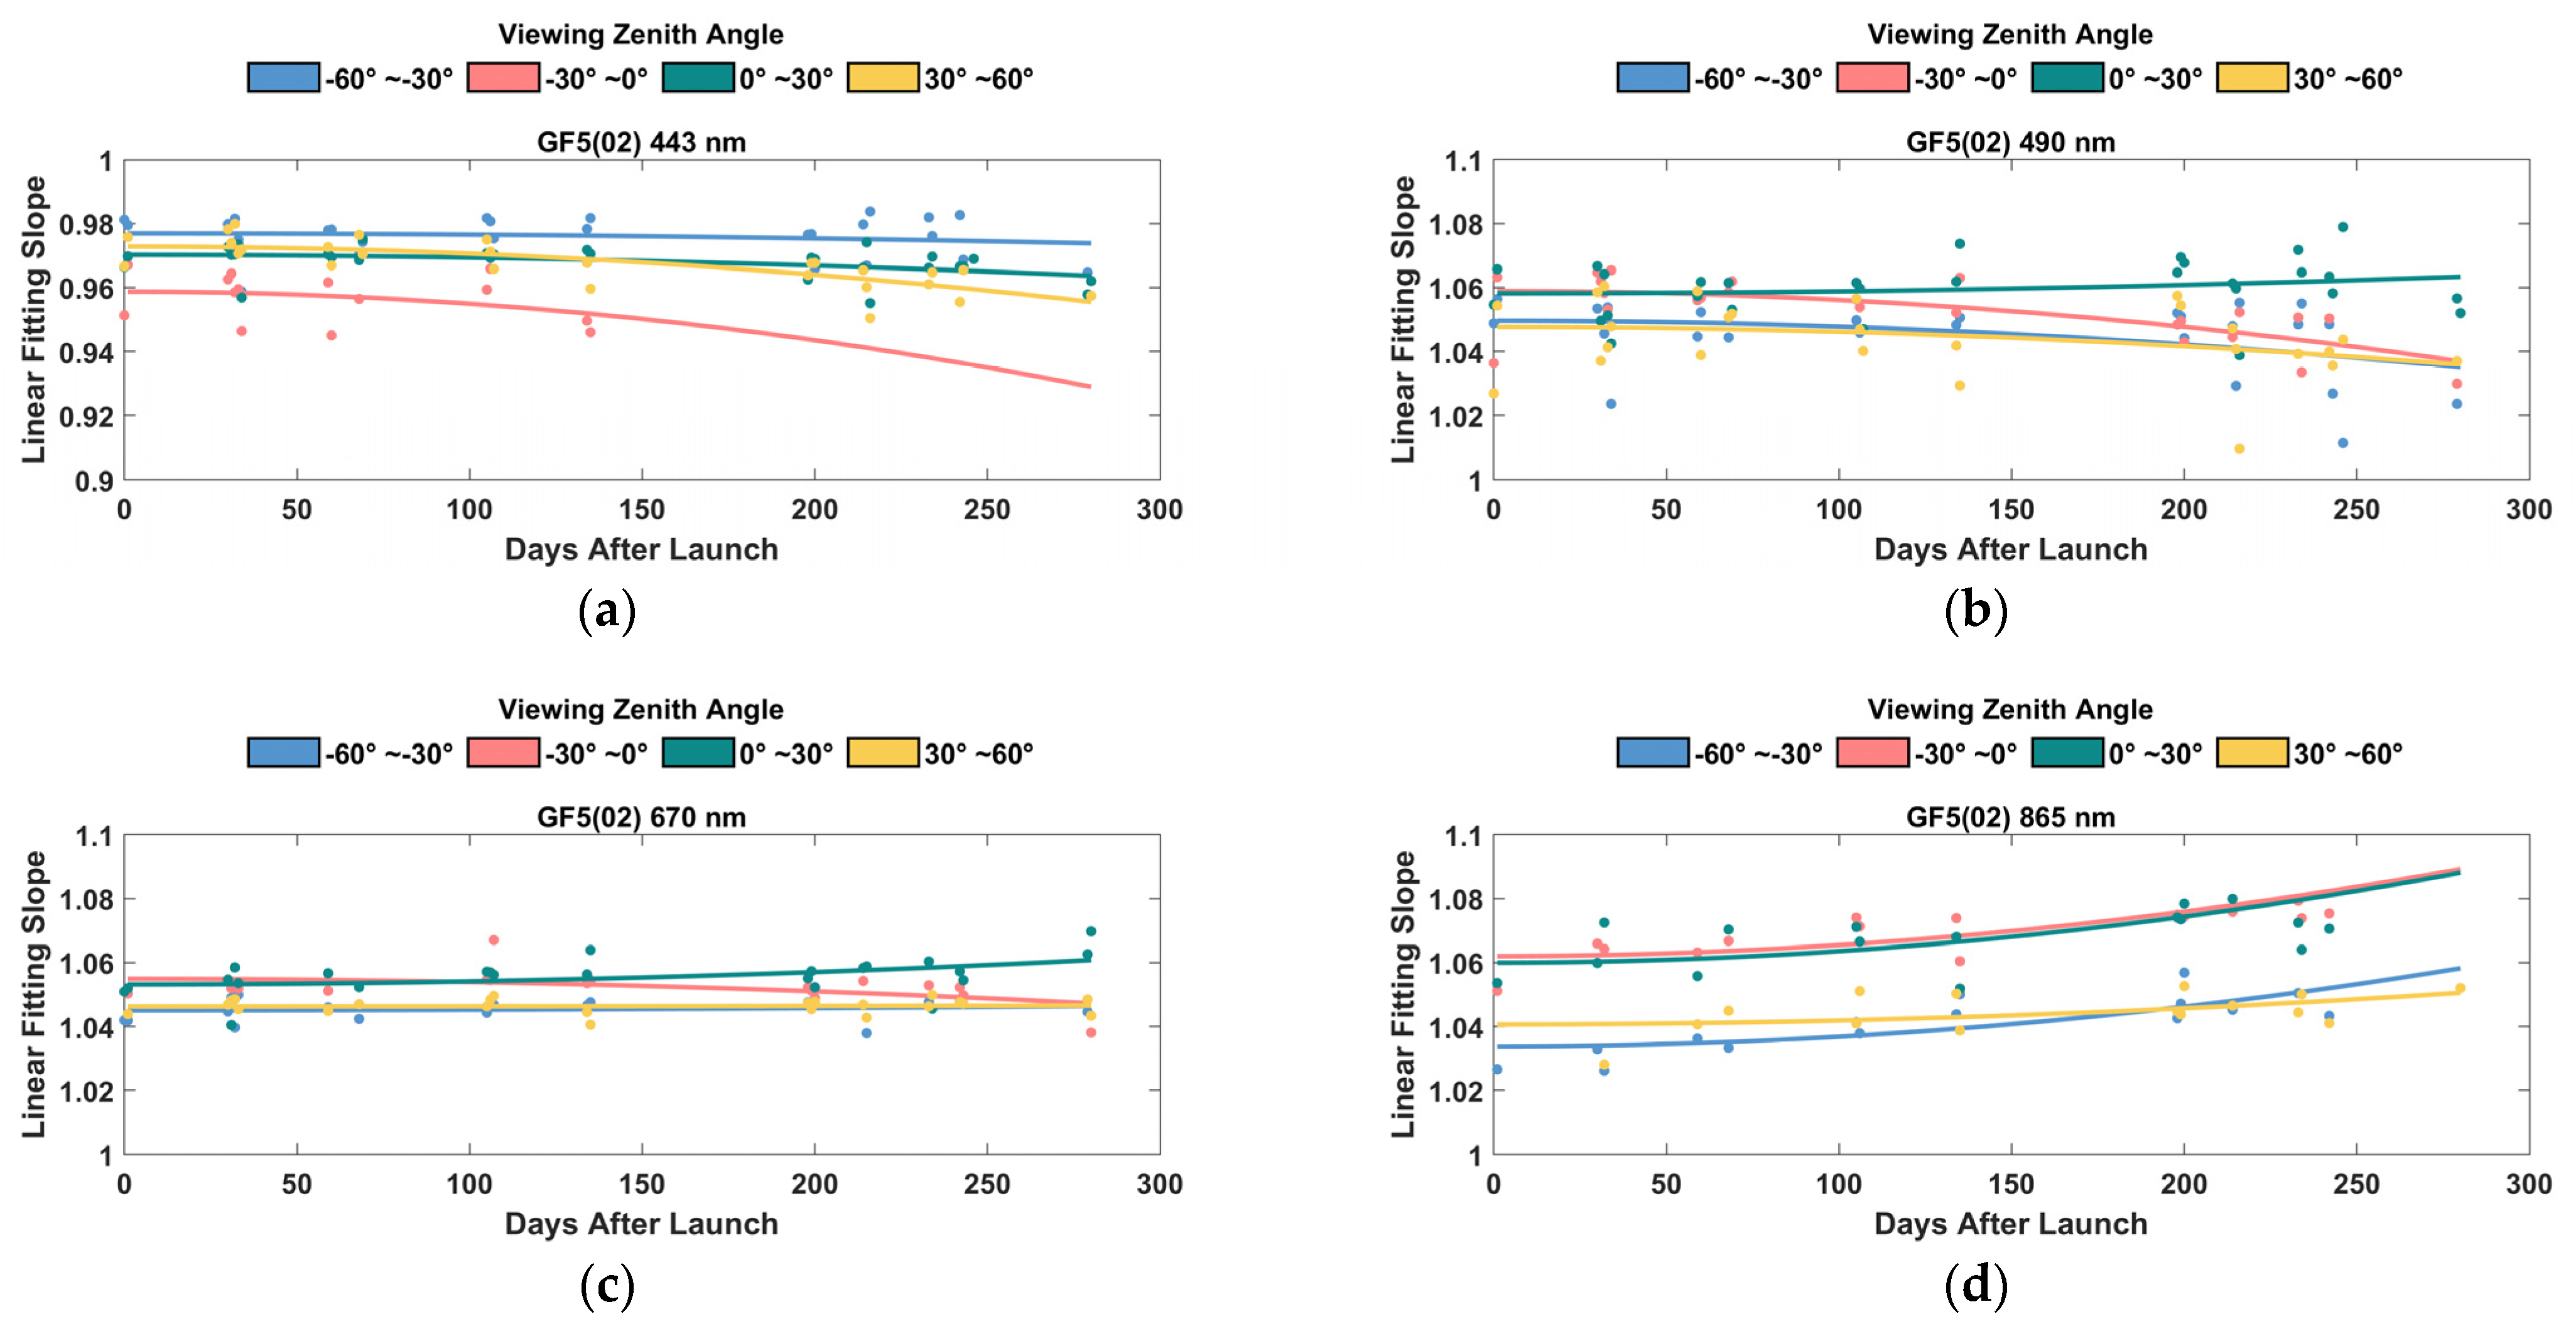
The temporal variations of the relative radiation response cross-calibration coefficients of DPC at different observation angles in the cross-track direction reflect the attenuation characteristics, especially within the range of −30–0° VZAs in the 443 nm band, and the mechanism of this attenuation pattern is currently uncertain and thus needs to be further studied. Particularly, the coefficients were obtained only in the cross-track direction; POSP observation-constrained relative radiation response calibration with a combination of other methods, such as the uniform scenes method used by POLDER [41], will be carried out to cover the full FOV of DPC, and the coefficients will be applied to the L1 product of DPC;
(3)
The cross-comparison results of DoLP between POSP and DPC verify the accuracy of DPC polarimetric measurements, with the scattering percentage of DPC DoLP falling within the expected error (EE = ±0.02), while POSP measured DoLP better than 91%, the former of which has an onboard polarization calibration system with a higher polarimetric accuracy of 0.005. However, polarization characteristics may gradually deteriorate with time, and pixel-level polarimetric cross-calibration on the same satellite platform is a reasonable way to maintain DPC in-orbit polarimetric accuracy, but it also faces the problem of the full FOV calibration expansion.
In this study, the radiometric cross-calibration and polarization comparison between different polarization sensors on the same platform were carried out for the first time, and nearly 29 days of data collected at monthly intervals over a 9 month range were used for analysis. Compared with the traditional vicarious calibration methods using natural targets used by sensors like DPC with a large field of view (>50° off nadir), the cross-calibration and validation between different sensors on the same satellite show significant advantages in terms of precision, calibration frequency, and reliability. In addition, to further improve the accuracy of subsequent joint retrieval results from the two sensors, radiometric and polarimetric cross-calibration at the original pixel level needs to be carried out with great significance and is ongoing at the time of this writing.

Author Contributions

This work was carried out in collaboration with all the authors. Conceptualization, X.L., Z.L., F.T. and J.H.; methodology, X.L., Z.L., F.T. and J.H.; software, X.L., G.X. and B.M.; validation, L.Q., W.H., F.C., M.Z. and Y.X.; data acquisition, L.F., L.C., H.D., C.L., W.H., F.C., F.T. and Y.X.; writing—original draft preparation, X.L. and Z.L.; writing—review and editing, Z.L. and J.H.; visualization, X.L.; supervision, J.H.; project administration, Z.L. and J.H.; funding acquisition, Z.L., J.H., W.H. and L.Q. All authors have read and agreed to the published version of the manuscript.

Funding

This work was supported by the National Natural Science Foundation of China (Grant No. 42275144), the K. C. Wong Education Foundation “International Team of Advanced Polarization Remote Sensing Technology and Application” (Grant No. GJTD-2018-15), the HFIPS Director’s Fund (Grant No. YZJJ202201-TS), and the National Natural Science Foundation of China (Grant Nos. 42175148 and 41871269).

Data Availability Statement

DPC and POSP Level 1 product data can be obtained from the China Centre for Resources Satellite Data and Application (available online at https://data.cresda.cn/ (last accessed on 6 January 2023)).

Acknowledgments

The authors would like to thank Donggen Luo, Liang Sun, Maoxin Song, and Peng Zou in the POSP and DPC teams for their contributions to the project and the manuscript. Additionally, we thank the large team involved in the successful conduct of the GaoFen-5(02) mission. This research was performed at the Anhui Institute of Optics and Fine Mechanics, Chinese Academy of Sciences (CAS), Hefei, China. Additionally, we thank Jun Lin, Shule Ge, and Zhongzheng Hu from the China Centre for Resources Satellite Data and Application for providing DPC and POSP Level 1 product data during the onboard test of the GaoFen-5(02) satellite. Additionally, we thank Zhengqiang Li from the Aerospace Information Research Institute of the Chinese Academy of Sciences for helpful discussions of this article. Additionally, we thank the editor and anonymous reviewers for their constructive comments and suggestions on this article.

Conflicts of Interest

The authors declare no conflict of interest.

References

  1. Dubovik, O.; Li, Z.; Mishchenko, M.I.; Tanré, D.; Karol, Y.; Bojkov, B.; Cairns, B.; Diner, D.J.; Espinosa, W.R.; Goloub, P. Polarimetric remote sensing of atmospheric aerosols: Instruments, methodologies, results, and perspectives. J. Quant. Spectrosc. Radiat. Transf. 2019, 224, 474–511. [Google Scholar] [CrossRef]
  2. Deuzé, J.; Bréon, F.; Devaux, C.; Goloub, P.; Herman, M.; Lafrance, B.; Maignan, F.; Marchand, A.; Nadal, F.; Perry, G. Remote sensing of aerosols over land surfaces from POLDER-ADEOS-1 polarized measurements. J. Geophys. Res. Atmos. 2001, 106, 4913–4926. [Google Scholar] [CrossRef] [Green Version]
  3. Herman, M.; Deuzé, J.L.; Marchand, A.; Roger, B.; Lallart, P. Aerosol remote sensing from POLDER/ADEOS over the ocean: Improved retrieval using a nonspherical particle model. J. Geophys. Res. Atmos. 2005, 110, 4798. [Google Scholar] [CrossRef]
  4. Tanré, D.; Bréon, F.; Deuzé, J.; Dubovik, O.; Ducos, F.; François, P.; Goloub, P.; Herman, M.; Lifermann, A.; Waquet, F. Remote sensing of aerosols by using polarized, directional and spectral measurements within the A-Train: The PARASOL mission. Atmos. Meas. Tech. 2011, 4, 1383–1395. [Google Scholar] [CrossRef] [Green Version]
  5. Li, Z.; Hou, W.; Hong, J.; Zheng, F.; Luo, D.; Wang, J.; Gu, X.; Qiao, Y. Directional Polarimetric Camera (DPC): Monitoring aerosol spectral optical properties over land from satellite observation. J. Quant. Spectrosc. Radiat. Transf. 2018, 218, 21–37. [Google Scholar] [CrossRef]
  6. Huang, C.; Chang, Y.; Xiang, G.; Han, L.; Chen, F.; Luo, D.; Li, S.; Sun, L.; Tu, B.; Meng, B. Polarization measurement accuracy analysis and improvement methods for the directional polarimetric camera. Opt. Exp. 2020, 28, 38638–38666. [Google Scholar] [CrossRef] [PubMed]
  7. Huang, C.; Xiang, G.; Chang, Y.; Han, L.; Zhang, M.; Li, S.; Tu, B.; Meng, B.; Hong, J. Pre-flight calibration of a multi-angle polarimetric satellite sensor directional polarimetric camera. Opt. Exp. 2020, 28, 13187–13215. [Google Scholar] [CrossRef]
  8. Fougnie, B.; Marbach, T.; Lacan, A.; Lang, R.; Schlüssel, P.; Poli, G.; Munro, R.; Couto, A.B. The multi-viewing multi-channel multi-polarisation imager–Overview of the 3MI polarimetric mission for aerosol and cloud characterization. J. Quant. Spectrosc. Radiat. Transf. 2018, 219, 23–32. [Google Scholar] [CrossRef]
  9. Marbach, T.; Riedi, J.; Lacan, A.; Schlüssel, P. The 3MI mission: Multi-viewing-channel-polarisation imager of the EUMETSAT polar system: Second generation (EPS-SG) dedicated to aerosol and cloud monitoring. In Proceedings of the Polarization Science and Remote Sensing VII, San Diego, CA, USA, 1 September 2015; pp. 271–278. [Google Scholar] [CrossRef]
  10. Fernandez-Borda, R.; Waluschka, E.; Pellicori, S.; Martins, J.; Ramos-Izquierdo, L.; Cieslak, J.; Thompson, P.L. Evaluation of the polarization properties of a Philips-type prism for the construction of imaging polarimeters. In Proceedings of the Polarization Science and Remote Sensing IV, San Diego, CA, USA, 11 August 2009; pp. 310–324. [Google Scholar] [CrossRef]
  11. Martins, J.V.; Fernandez-Borda, R.; McBride, B.; Remer, L.; Barbosa, H.M. The HARP hyperangular imaging polarimeter and the need for small satellite payloads with high science payoff for earth science remote sensing. In Proceedings of the IGARSS 2018–2018 IEEE International Geoscience and Remote Sensing Symposium, Valencia, Spain, 22–27 July 2018; pp. 6304–6307. [Google Scholar] [CrossRef]
  12. Mishchenko, M.I.; Cairns, B.; Kopp, G.; Schueler, C.F.; Fafaul, B.A.; Hansen, J.E.; Hooker, R.J.; Itchkawich, T.; Maring, H.B.; Travis, L.D. Accurate monitoring of terrestrial aerosols and total solar irradiance: Introducing the Glory mission. Bull. Am. Meteorol. Soc. 2007, 88, 677–692. [Google Scholar] [CrossRef] [Green Version]
  13. Peralta, R.J.; Nardell, C.; Cairns, B.; Russell, E.E.; Travis, L.D.; Mishchenko, M.I.; Fafaul, B.A.; Hooker, R.J. Aerosol polarimetry sensor for the Glory Mission. In Proceedings of the International Symposium on Multispectral Image Processing and Pattern Recognition, Wuhan, China, 15 November 2007; pp. 1460–1476. [Google Scholar] [CrossRef]
  14. Lei, X.; Zhu, S.; Li, Z.; Hong, J.; Liu, Z.; Tao, F.; Zou, P.; Song, M.; Li, C. Integration model of POSP measurement spatial response function. Opt. Exp. 2020, 28, 25480–25489. [Google Scholar] [CrossRef]
  15. Lei, X.; Liu, Z.; Tao, F.; Hou, W.; Huang, H.; Xie, Y.; Zhao, X.; Dong, H.; Zou, P.; Song, M. Geolocation Error Estimation Method for the Wide Swath Polarized Scanning Atmospheric Corrector Onboard HJ-2 A/B Satellites. IEEE Trans. Geosci. Remote Sens. 2022, 60, 1–9. [Google Scholar] [CrossRef]
  16. Lei, X.; Liu, Z.; Tao, F.; Zhao, X.; Hou, W.; Huang, H.; Xie, Y.; Dong, H.; Zou, P.; Song, M. Data preprocessing methods and procedures for the wide swath polarized scanning atmospheric corrector onboard HJ-2A/B satellites. In Proceedings of the Eighth Symposium on Novel Photoelectronic Detection Technology and Applications, Kunming, China, 27 March 2022; pp. 2029–2034. [Google Scholar] [CrossRef]
  17. Li, Z.; Xie, Y.; Hou, W.; Liu, Z.; Bai, Z.; Hong, J.; Ma, Y.; Huang, H.; Lei, X.; Sun, X. In-orbit Test of the Polarized Scanning Atmospheric Corrector (PSAC) onboard Chinese Environmental Protection and Disaster Monitoring Satellite Constellation HJ-2 A/B. IEEE Trans. Geosci. Remote Sens. 2022, 60, 1–17. [Google Scholar] [CrossRef]
  18. Xie, Y.; Hou, W.; Li, Z.; Zhu, S.; Liu, Z.; Hong, J.; Ma, Y.; Fan, C.; Guang, J.; Yang, B. Columnar Water Vapor Retrieval by Using Data from the Polarized Scanning Atmospheric Corrector (PSAC) Onboard HJ-2 A/B Satellites. Remote Sens. 2022, 14, 1376. [Google Scholar] [CrossRef]
  19. Shi, Z.; Li, Z.; Hou, W.; Mei, L.; Sun, L.; Jia, C.; Zhang, Y.; Li, K.; Xu, H.; Liu, Z. Aerosol Optical Depth Retrieval Based on Neural Network Model Using Polarized Scanning Atmospheric Corrector (PSAC) Data. IEEE Trans. Geosci. Remote Sens. 2022, 60, 1–18. [Google Scholar] [CrossRef]
  20. Cao, C.; Weinreb, M.; Xu, H. Predicting simultaneous nadir overpasses among polar-orbiting meteorological satellites for the intersatellite calibration of radiometers. J. Atmos. Ocean Technol. 2004, 21, 537–542. [Google Scholar] [CrossRef]
  21. Uprety, S.; Cao, C.; Xiong, X.; Blonski, S.; Wu, A.; Shao, X. Radiometric intercomparison between Suomi-NPP VIIRS and Aqua MODIS reflective solar bands using simultaneous nadir overpass in the low latitudes. J. Atmos. Ocean Technol. 2013, 30, 2720–2736. [Google Scholar] [CrossRef]
  22. Werdell, P.J.; Behrenfeld, M.J.; Bontempi, P.S.; Boss, E.; Cairns, B.; Davis, G.T.; Franz, B.A.; Gliese, U.B.; Gorman, E.T.; Hasekamp, O. The Plankton, Aerosol, Cloud, ocean Ecosystem mission: Status, science, advances. Bull. Am. Meteorol. Soc. 2019, 100, 1775–1794. [Google Scholar] [CrossRef]
  23. Omar, A.H.; Tzortziou, M.; Coddington, O.; Remer, L.A. Plankton Aerosol, Cloud, ocean Ecosystem mission: Atmosphere measurements for air quality applications. J. Appl. Remote Sens. 2018, 12, 042608. [Google Scholar] [CrossRef] [Green Version]
  24. Milinevsky, G.; Oberemok, Y.; Syniavskyi, I.; Bovchaliuk, A.; Kolomiets, I.; Fesianov, I.; Wang, Y. Calibration model of polarimeters on board the Aerosol-UA space mission. J. Quant. Spectrosc. Radiat. Transf. 2019, 229, 92–105. [Google Scholar] [CrossRef]
  25. Milinevsky, G.; Yatskiv, Y.; Degtyaryov, O.; Syniavskyi, I.; Ivanov, Y.; Bovchaliuk, A.; Mishchenko, M.; Danylevsky, V.; Sosonkin, M.; Bovchaliuk, V. Remote sensing of aerosol in the terrestrial atmosphere from space: New missions. Adv. Astron. Space Phy. 2015, 5, 11–16. [Google Scholar] [CrossRef]
  26. Milinevsky, G.; Yatskiv, Y.; Degtyaryov, O.; Syniavskyi, I.; Mishchenko, M.; Rosenbush, V.; Ivanov, Y.; Makarov, A.; Bovchaliuk, A.; Danylevsky, V. New satellite project Aerosol-UA: Remote sensing of aerosols in the terrestrial atmosphere. Acta Astronaut. 2016, 123, 292–300. [Google Scholar] [CrossRef]
  27. Li, Z.; Hou, W.; Hong, J.; Fan, C.; Wei, Y.; Liu, Z.; Lei, X.; Qiao, Y.; Hasekamp, O.P.; Fu, G. The polarization crossfire (PCF) sensor suite focusing on satellite remote sensing of fine particulate matter PM2.5 from space. J. Quant. Spectrosc. Radiat. Transf. 2022, 286, 108217. [Google Scholar] [CrossRef]
  28. Li, Z.; Zhang, Y.; Hong, J. Polarimetric remote sensing of atmospheric particulate pollutants. Int. Arch. Photogramm. Remote Sens. Spatial Inf. Sci. 2018, 42, 981–984. [Google Scholar] [CrossRef] [Green Version]
  29. Zhu, S.; Hong, J.; Li, Z.; Lei, X.; Zou, P.; Liu, Z.; Song, M. Radiometer-to-imager in-flight cross calibration and verification. Opt. Exp. 2020, 28, 11001–11015. [Google Scholar] [CrossRef] [PubMed]
  30. Liu, Y.-N.; Sun, D.-X.; Hu, X.-N.; Ye, X.; Li, Y.-D.; Liu, S.-F.; Cao, K.-Q.; Chai, M.-Y.; Zhang, J.; Zhang, Y. The advanced hyperspectral imager: Aboard China’s gaoFen-5 satellite. IEEE Geosc. Rem. Sen. Mag. 2019, 7, 23–32. [Google Scholar] [CrossRef]
  31. Dong, S.; Sun, G.; Du, Y.; Ge, S. Image quality assessment for visual and infrared multis-pectral imager of Gaofen-5. Remote Sens. Technol. Appl. 2020, 35, 381–388. [Google Scholar] [CrossRef]
  32. Shi, H.; Li, Z.; Ye, H.; Luo, H.; Xiong, W.; Wang, X. First level 1 product results of the greenhouse gas monitoring instrument on the GaoFen-5 satellite. IEEE Trans. Geosci. Remote Sens. 2020, 59, 899–914. [Google Scholar] [CrossRef]
  33. Luo, H.-Y.; Li, Z.-W.; Qiu, Z.-W.; Shi, H.-L.; Chen, D.-H.; Xiong, W. Polarization sensitivity error analysis and measurement of a greenhouse gas monitoring instrument. Appl. Optics. 2018, 57, 10009–10016. [Google Scholar] [CrossRef]
  34. Zhang, C.; Liu, C.; Chan, K.L.; Hu, Q.; Liu, H.; Li, B.; Xing, C.; Tan, W.; Zhou, H.; Si, F. First observation of tropospheric nitrogen dioxide from the Environmental Trace Gases Monitoring Instrument onboard the GaoFen-5 satellite. Light Sci. Appl. 2020, 9, 66. [Google Scholar] [CrossRef] [Green Version]
  35. Hagolle, O.; Guerry, A.; Cunin, L.; Millet, B.; Perbos, J.; Laherrere, J.-M.; Bret-Dibat, T.; Poutier, L. POLDER level-1 processing algorithms. In Proceedings of the Algorithms for Multispectral and Hyperspectral Imagery II, Orlando, FL, USA, 17 June 1996; pp. 308–319. [Google Scholar] [CrossRef]
  36. Schott, J.R. Fundamentals of Polarimetric Remote Sensing; SPIE Press: Washington, DC, USA, 2009; Volume 81. [Google Scholar]
  37. Leroy, M.; Deuzé, J.; Bréon, F.; Hautecoeur, O.; Herman, M.; Buriez, J.; Tanré, D.; Bouffies, S.; Chazette, P.; Roujean, J.-L. Retrieval of atmospheric properties and surface bidirectional reflectances over land from POLDER/ADEOS. J. Geophys. Res. Atmos. 1997, 102, 17023–17037. [Google Scholar] [CrossRef]
  38. Knobelspiesse, K.; Tan, Q.; Bruegge, C.; Cairns, B.; Chowdhary, J.; Van Diedenhoven, B.; Diner, D.; Ferrare, R.; Van Harten, G.; Jovanovic, V. Intercomparison of airborne multi-angle polarimeter observations from the Polarimeter Definition Experiment. Appl. Optics. 2019, 58, 650–669. [Google Scholar] [CrossRef] [PubMed]
  39. Zhu, S.; Li, Z.; Qie, L.; Xu, H.; Ge, B.; Xie, Y.; Qiao, R.; Xie, Y.; Hong, J.; Meng, B. In-Flight Relative Radiometric Calibration of a Wide Field of View Directional Polarimetric Camera Based on the Rayleigh Scattering over Ocean. Remote Sens. 2022, 14, 1211. [Google Scholar] [CrossRef]
  40. Gross, G.; Helder, D.; Begeman, C.; Leigh, L.; Kaewmanee, M.; Shah, R. Initial Cross-Calibration of Landsat 8 and Landsat 9 Using the simultaneous underfly event. Remote Sens. 2022, 14, 2418. [Google Scholar] [CrossRef]
  41. Fougnie, B. Improvement of the PARASOL radiometric in-flight calibration based on synergy between various methods using natural targets. IEEE Trans. Geosci. Remote Sens. 2016, 54, 2140–2152. [Google Scholar] [CrossRef]
Figure 1. The sensor assembly of the PCF suite installed on the GaoFen-5(02) satellite.
Remotesensing 15 01933 g001
Figure 2. The layout diagram of the POSP onboard calibrators.
Remotesensing 15 01933 g002
Figure 3. The sampling schematic diagram of PCF [27].
Remotesensing 15 01933 g003
Figure 4. Normalized relative spectral responses of DPC and POSP common bands.
Remotesensing 15 01933 g004
Figure 5. The linear fitting coefficients of DPC and POSP normalized radiance in common spectral bands at nadir. The data pairs are a collection selected from May 2022 of (a) 443 nm; (b) 490 nm; (c) 670 nm; and (d) 865 nm bands in DPC and POSP Level 1 products. Yellow solid and red dashed lines are the 1:1 lines and fit lines, respectively. The reason for the fewer matching data points is that the amount of raw data points at nadir is small.
Remotesensing 15 01933 g005aRemotesensing 15 01933 g005b
Figure 6. The time-varying characteristics of DPC and POSP normalized radiance linear fitting results (a) A k ; (b) R2; and (c) RMSE in common spectral bands at nadir. These data pairs are selected from collections from November 2021 to May 2022 in DPC and POSP Level 1 products.
Remotesensing 15 01933 g006
Figure 7. The linear fitting slope and corresponding quadratic fitting curve of DPC and POSP normalized radiance in common spectral bands with different post-launch days and different VZA ranges. The data pairs are collected in each day selected from October 2021 to July 2022 of (a) 443 nm; (b) 490 nm; (c) 670 nm; and (d) 865 nm bands in DPC and POSP Level 1 products.
Remotesensing 15 01933 g007
Figure 8. The ratio of DPC and POSP normalized radiance in the 443 nm band with different VZAs. These data pairs are selected for collection from (a) November 2021; (b) December 2021; (c) January 2022; (d) February 2022; (e) April 2022; and (f) May 2022 in DPC and POSP Level 1 products.
Remotesensing 15 01933 g008
Figure 9. The ratio of DPC to POSP normalized radiance in the 865 nm band with different VZAs. These data pairs are selected for collection from (a) November 2021; (b) December 2021; (c) January 2022; (d) February 2022; (e) April 2022; and (f) May 2022 in DPC and POSP Level 1 products.
Remotesensing 15 01933 g009
Figure 10. The ratio of DPC to POSP normalized radiance in the 490 nm band with different VZAs. These data pairs are selected for collection from (a) November 2021; (b) December 2021; (c) January 2022; (d) February 2022; (e) April 2022; and (f) May 2022 in DPC and POSP Level 1 products.
Remotesensing 15 01933 g010
Figure 11. The ratio of DPC to POSP normalized radiance in the 670 nm band with different VZAs. These data pairs are selected for collection from (a) November 2021; (b) December 2021; (c) January 2022; (d) February 2022; (e) April 2022; and (f) May 2022 in DPC and POSP Level 1 products.
Remotesensing 15 01933 g011aRemotesensing 15 01933 g011b
Figure 12. The linear fitting and statistical distribution results of DPC and POSP DoLP in common polarimetric bands. The data pairs are selected for collection from October 2021 to May 2022 for (a) and (d) 490 nm; (b) and (e) 670 nm; and (c,f) 865 nm bands in DPC and POSP Level 1 products. Yellow solid, green, and red dashed lines are the 1:1 lines, EE envelope lines, and fit lines, respectively.
Remotesensing 15 01933 g012aRemotesensing 15 01933 g012b
Table 1. Spectral parameters of the PCF suite.
Band No.POSPDPC
Central Wavelength (nm)Spectral Bandwidth (nm)PolarizationCentral Wavelength (nm)Spectral Bandwidth (nm)Polarization
138020Yes---
241020Yes---
344320Yes44320No
449020Yes49020Yes
5---56520No
667020Yes67020Yes
7---76310No
8---76540No
986540Yes86540Yes
10---91020No
11138040Yes---
12161060Yes---
13225080Yes---
Table 2. Sources of cross-calibration uncertainty in the transfer process.
SourcesUncertainty
Spectral Response0.5%
Viewing Geometry0.2%
Target Matching0.1%
Total Calibration Transfer Uncertainty0.55%
Disclaimer/Publisher’s Note: The statements, opinions and data contained in all publications are solely those of the individual author(s) and contributor(s) and not of MDPI and/or the editor(s). MDPI and/or the editor(s) disclaim responsibility for any injury to people or property resulting from any ideas, methods, instructions or products referred to in the content.

