
Urban Flood Resilience Evaluation Based on GIS and Multi-Source Data: A Case Study of Changchun City
Abstract
:
1. Introduction
2. Materials and Methods
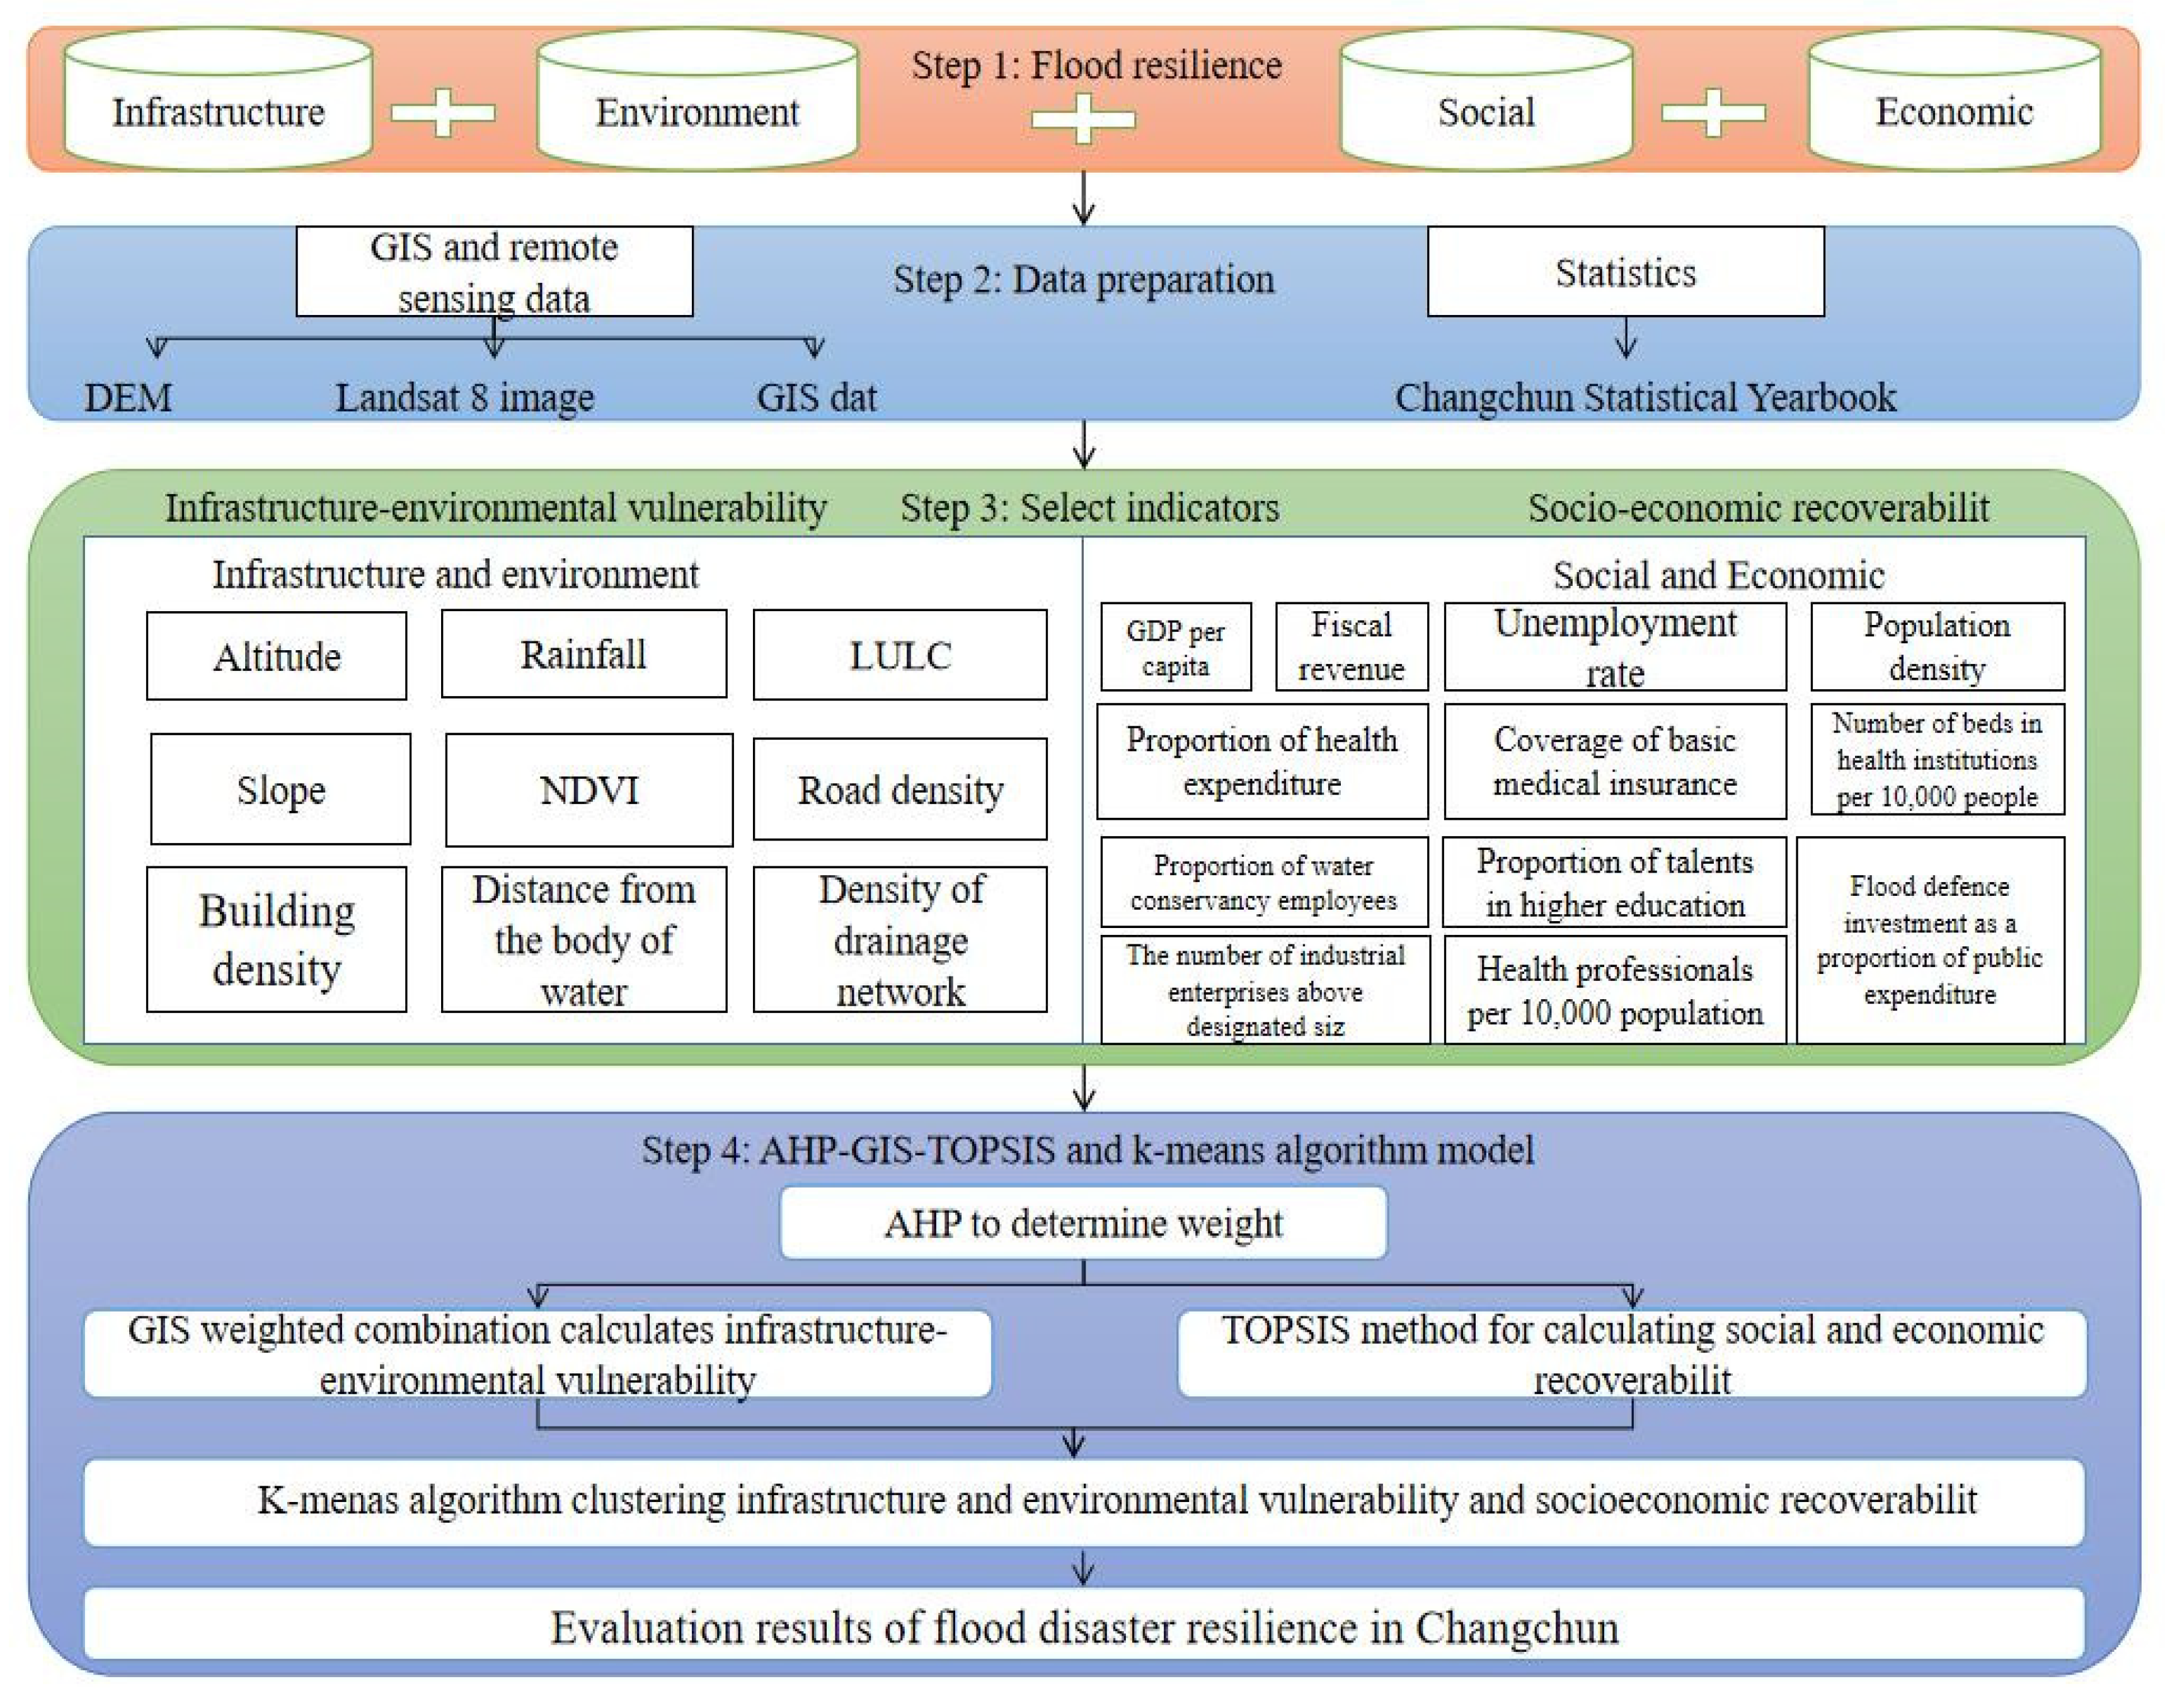
2.1. Data and Methodology
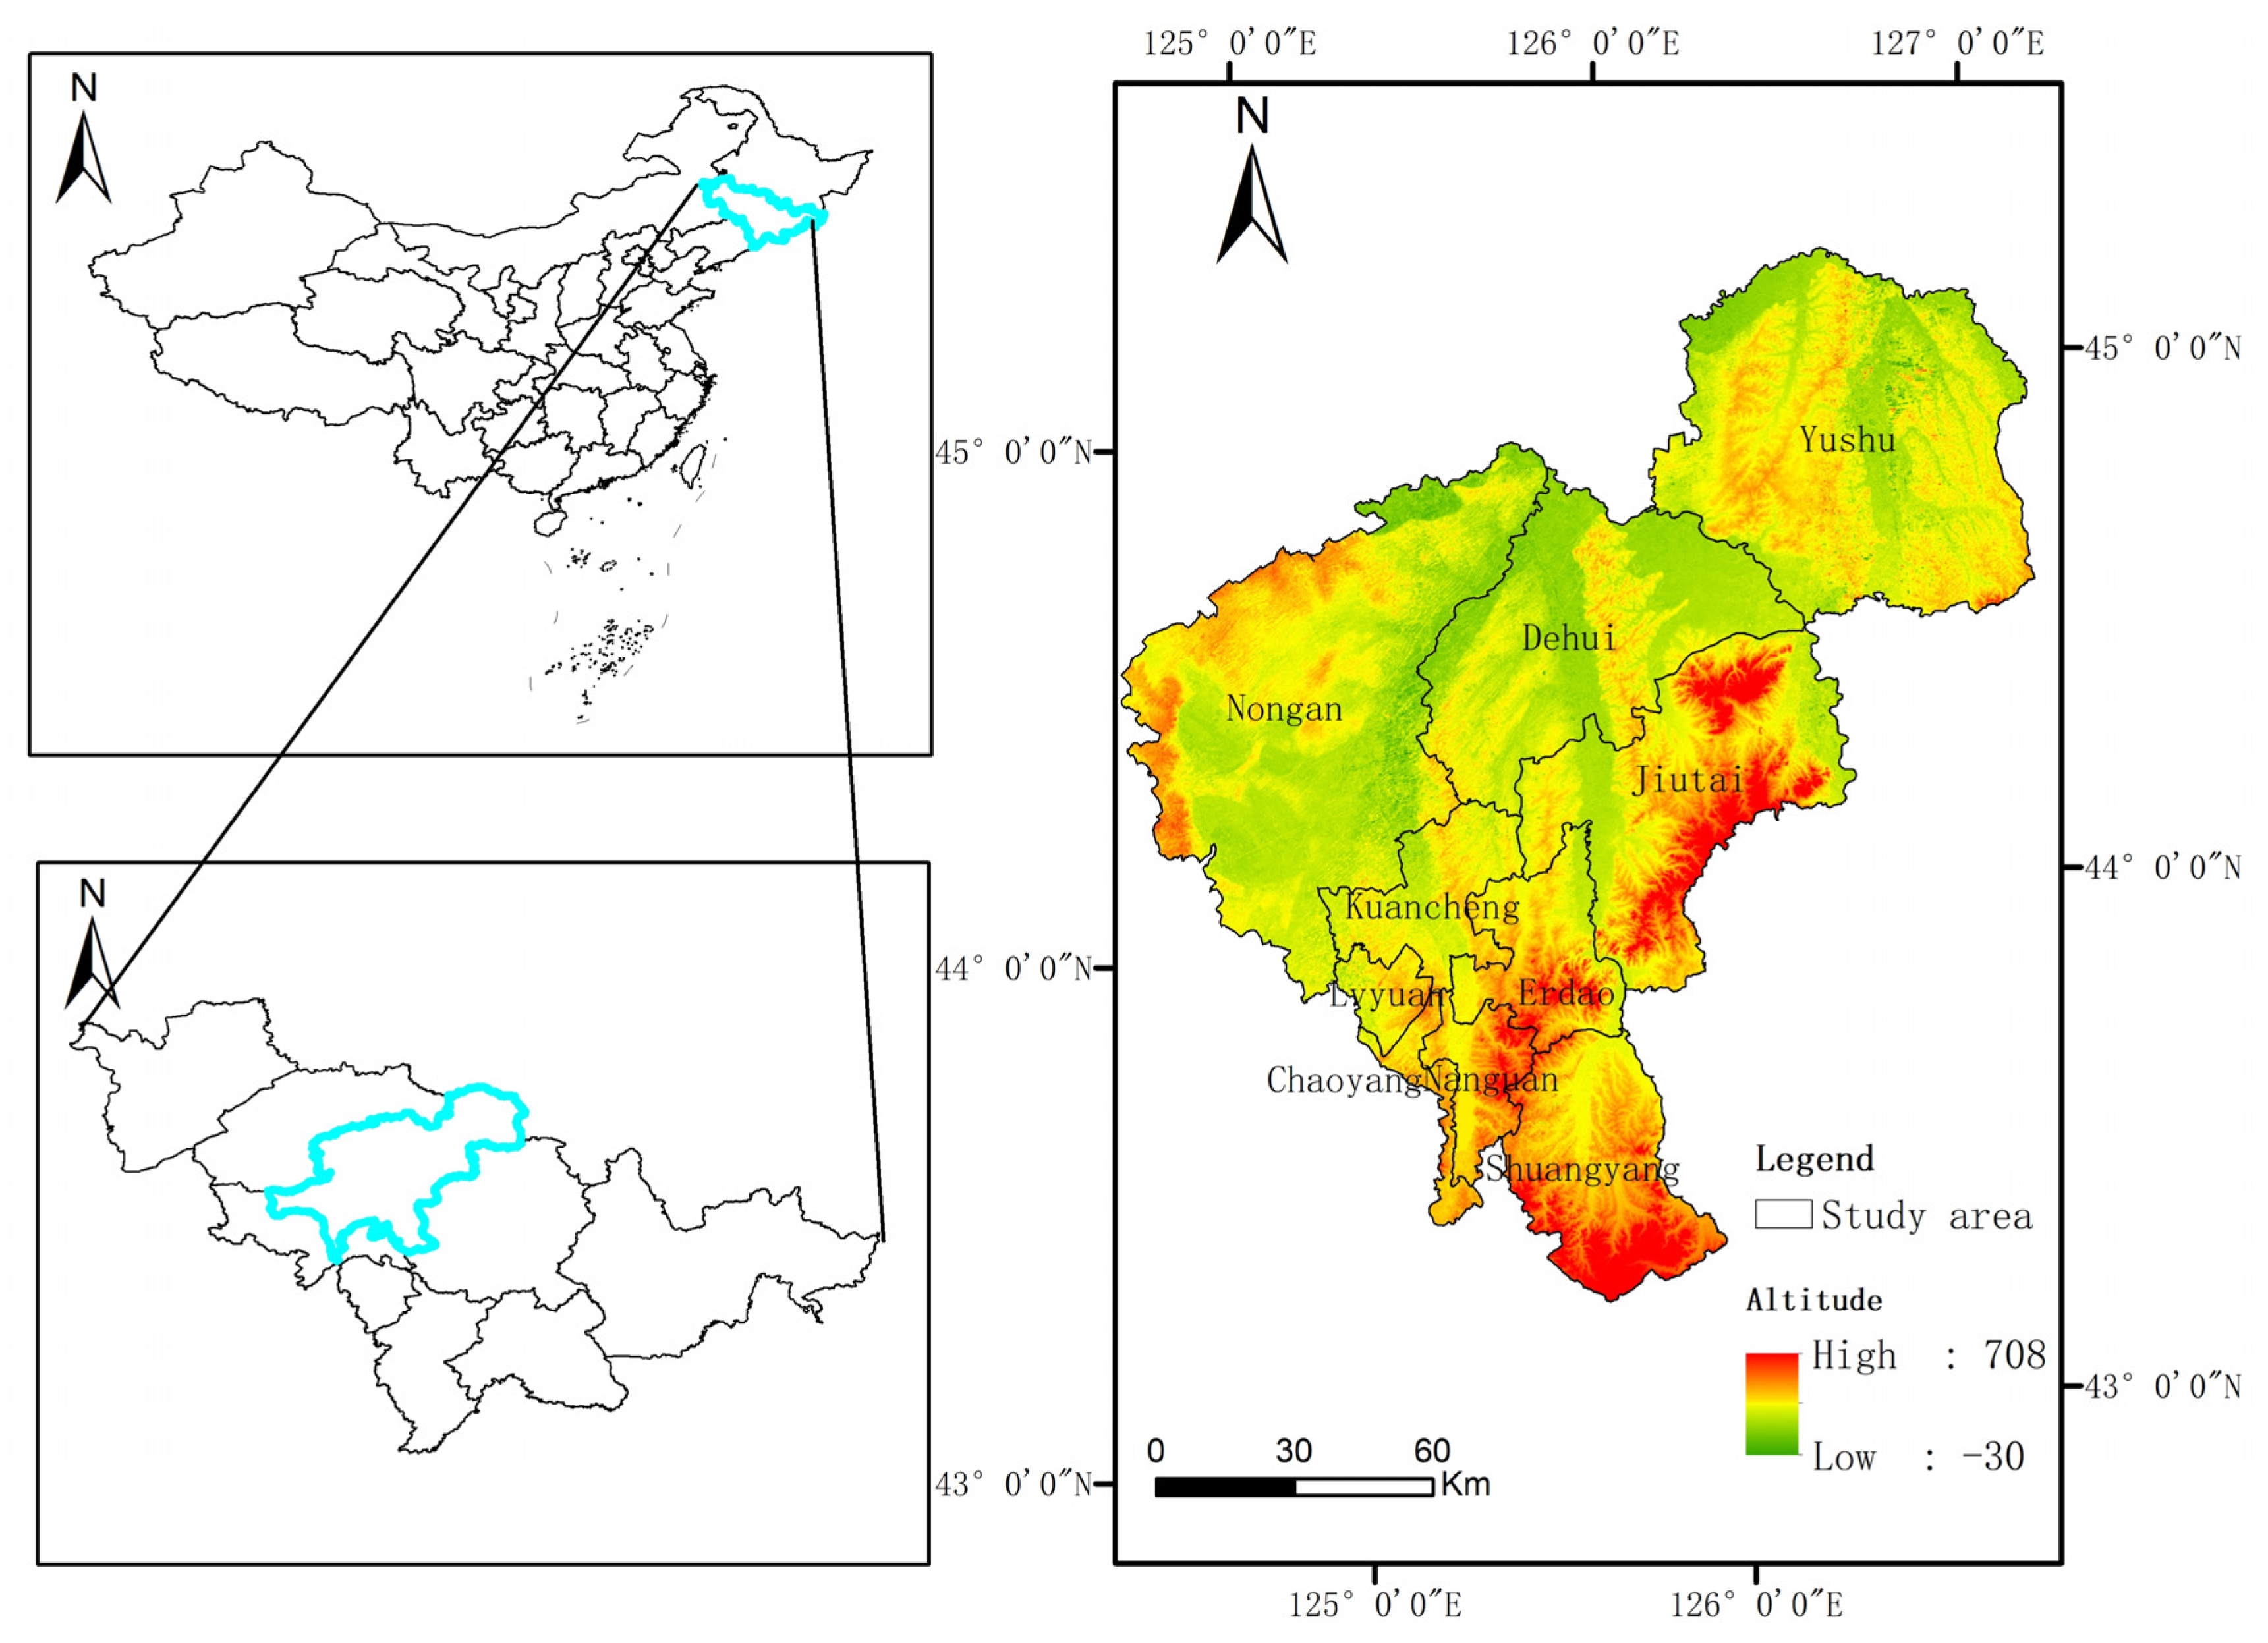
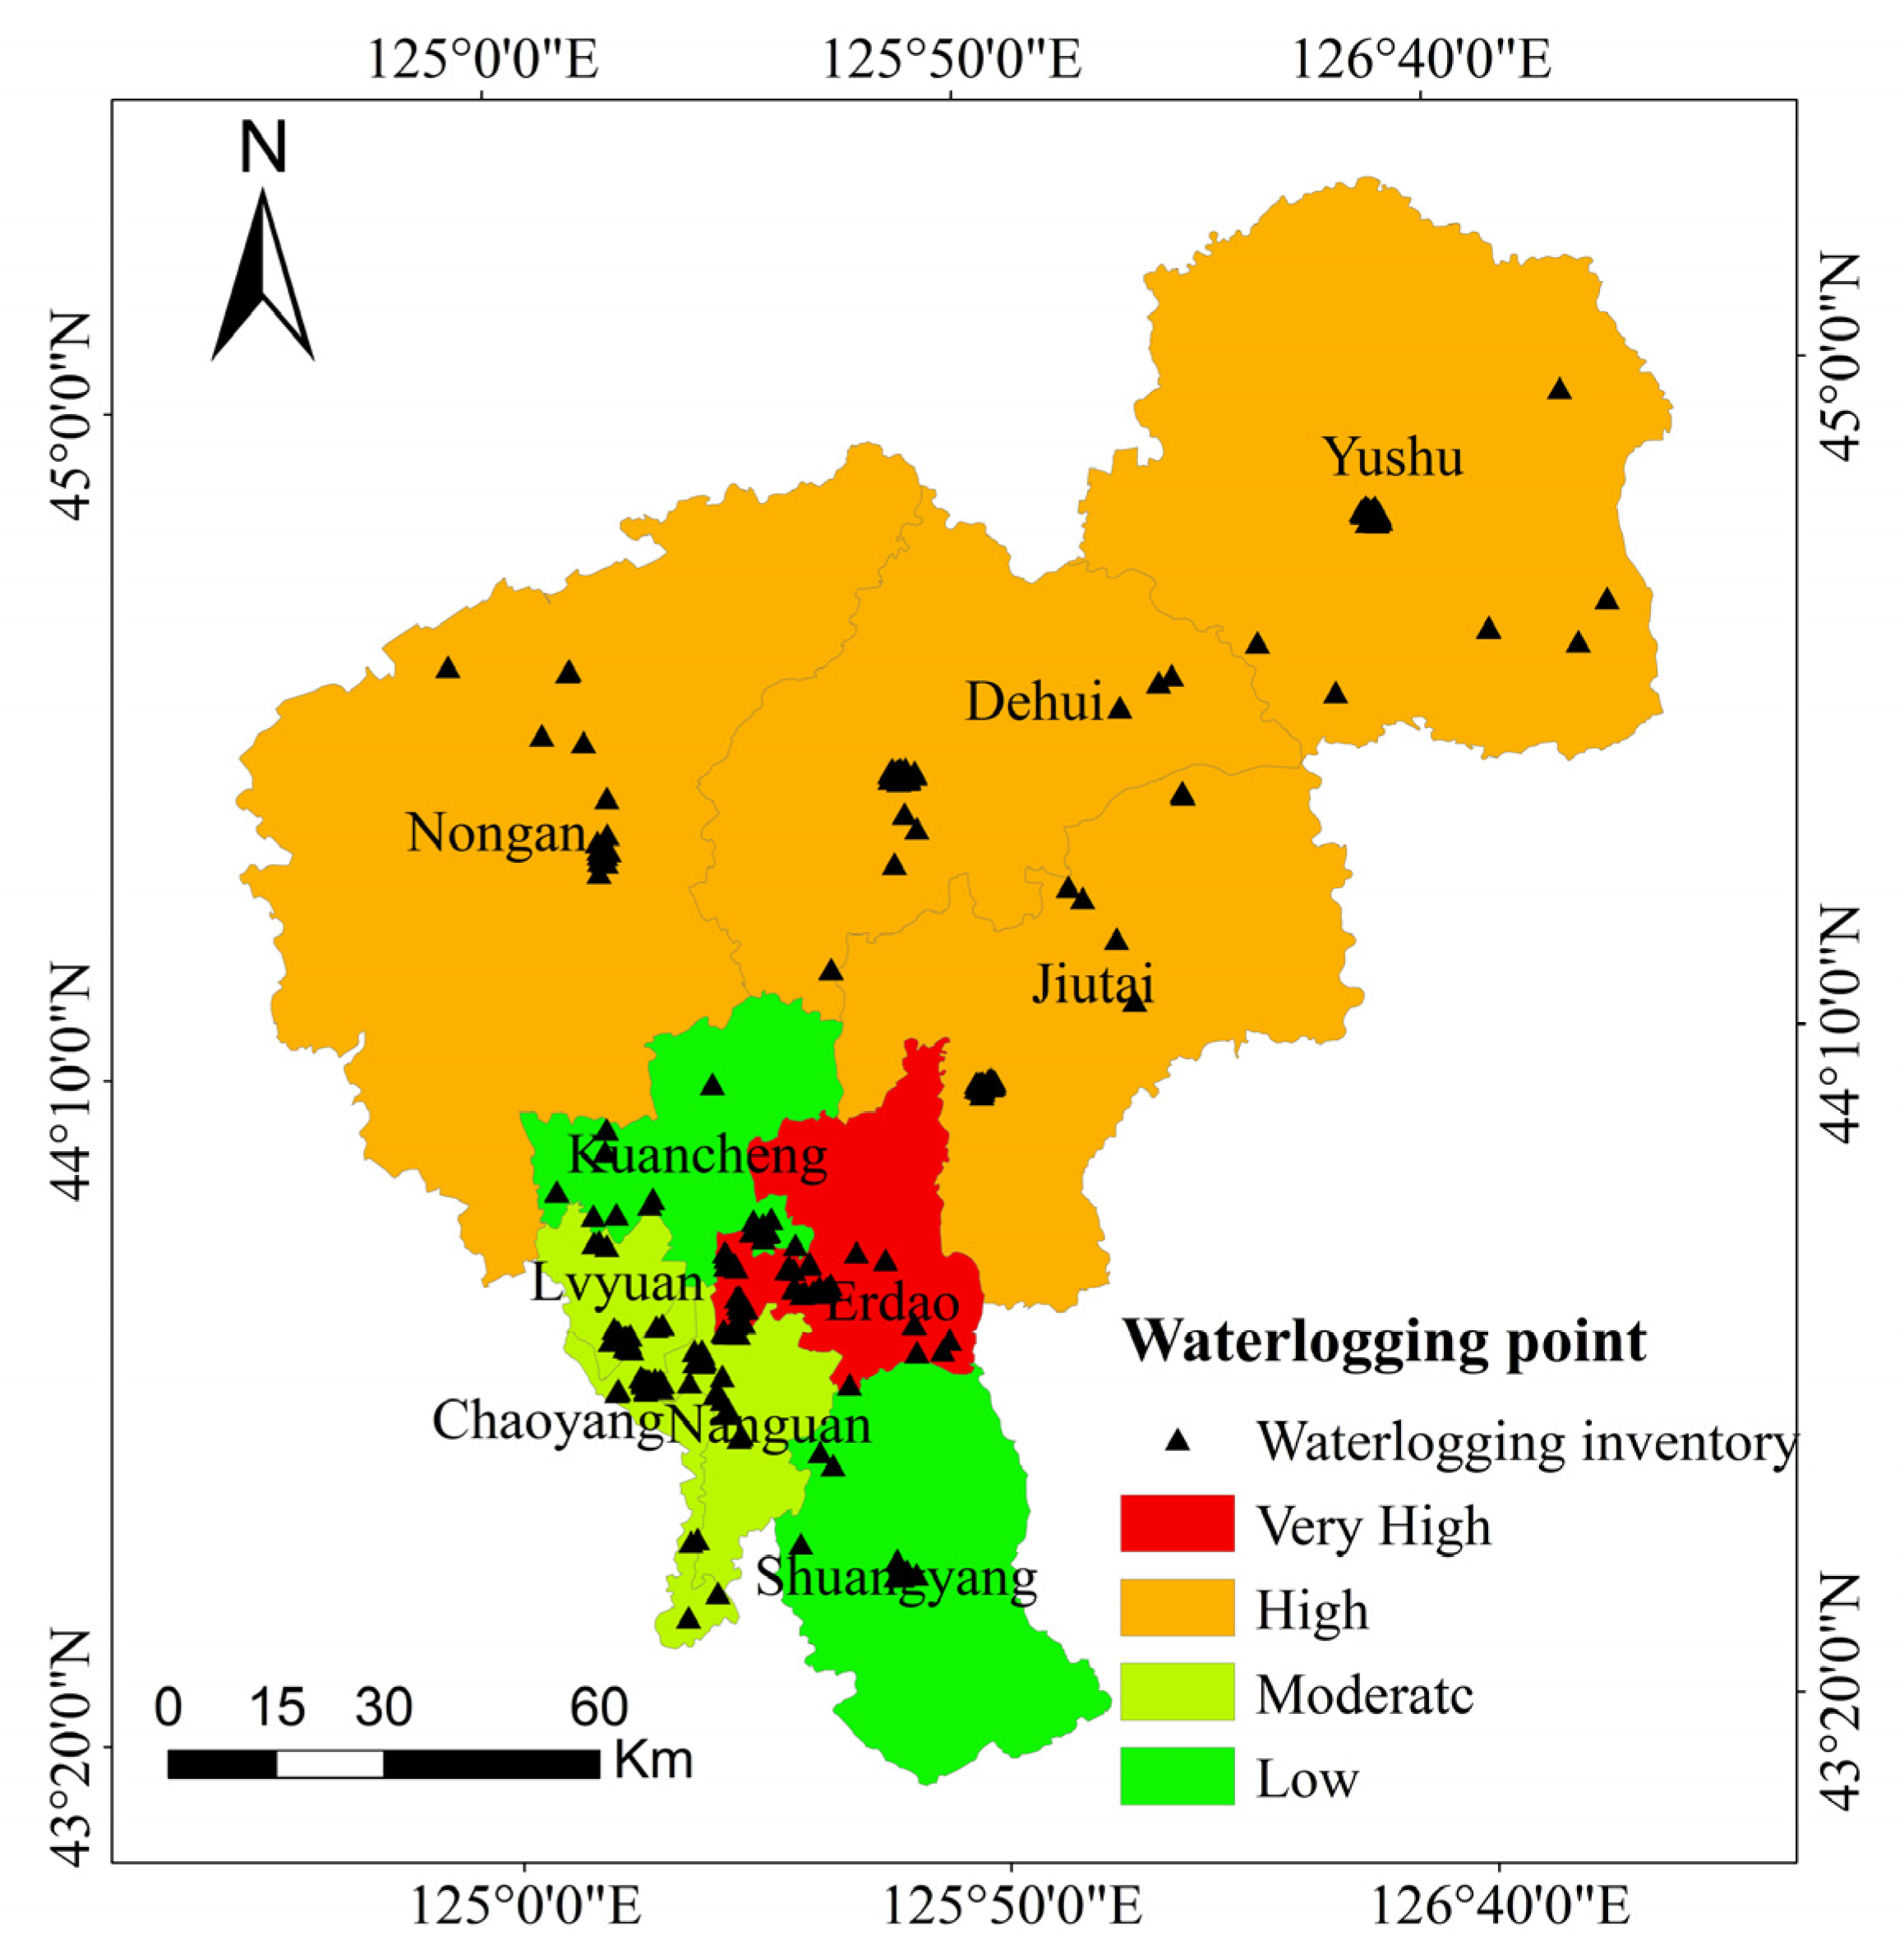
2.1.1. The Study Area
2.1.2. Selection of Evaluation Index
2.1.3. Data Collection
2.1.4. Analytic Hierarchy Process (AHP)
- (1)
- Establish a hierarchical structure.
- (2)
- Construct a pairwise comparison judgment matrix.
- (3)
- Consistency check.
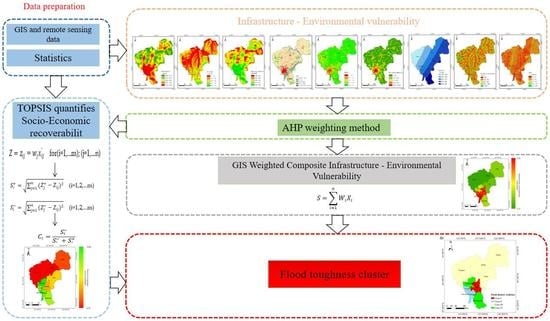
2.2. Quantifying Flood Resilience
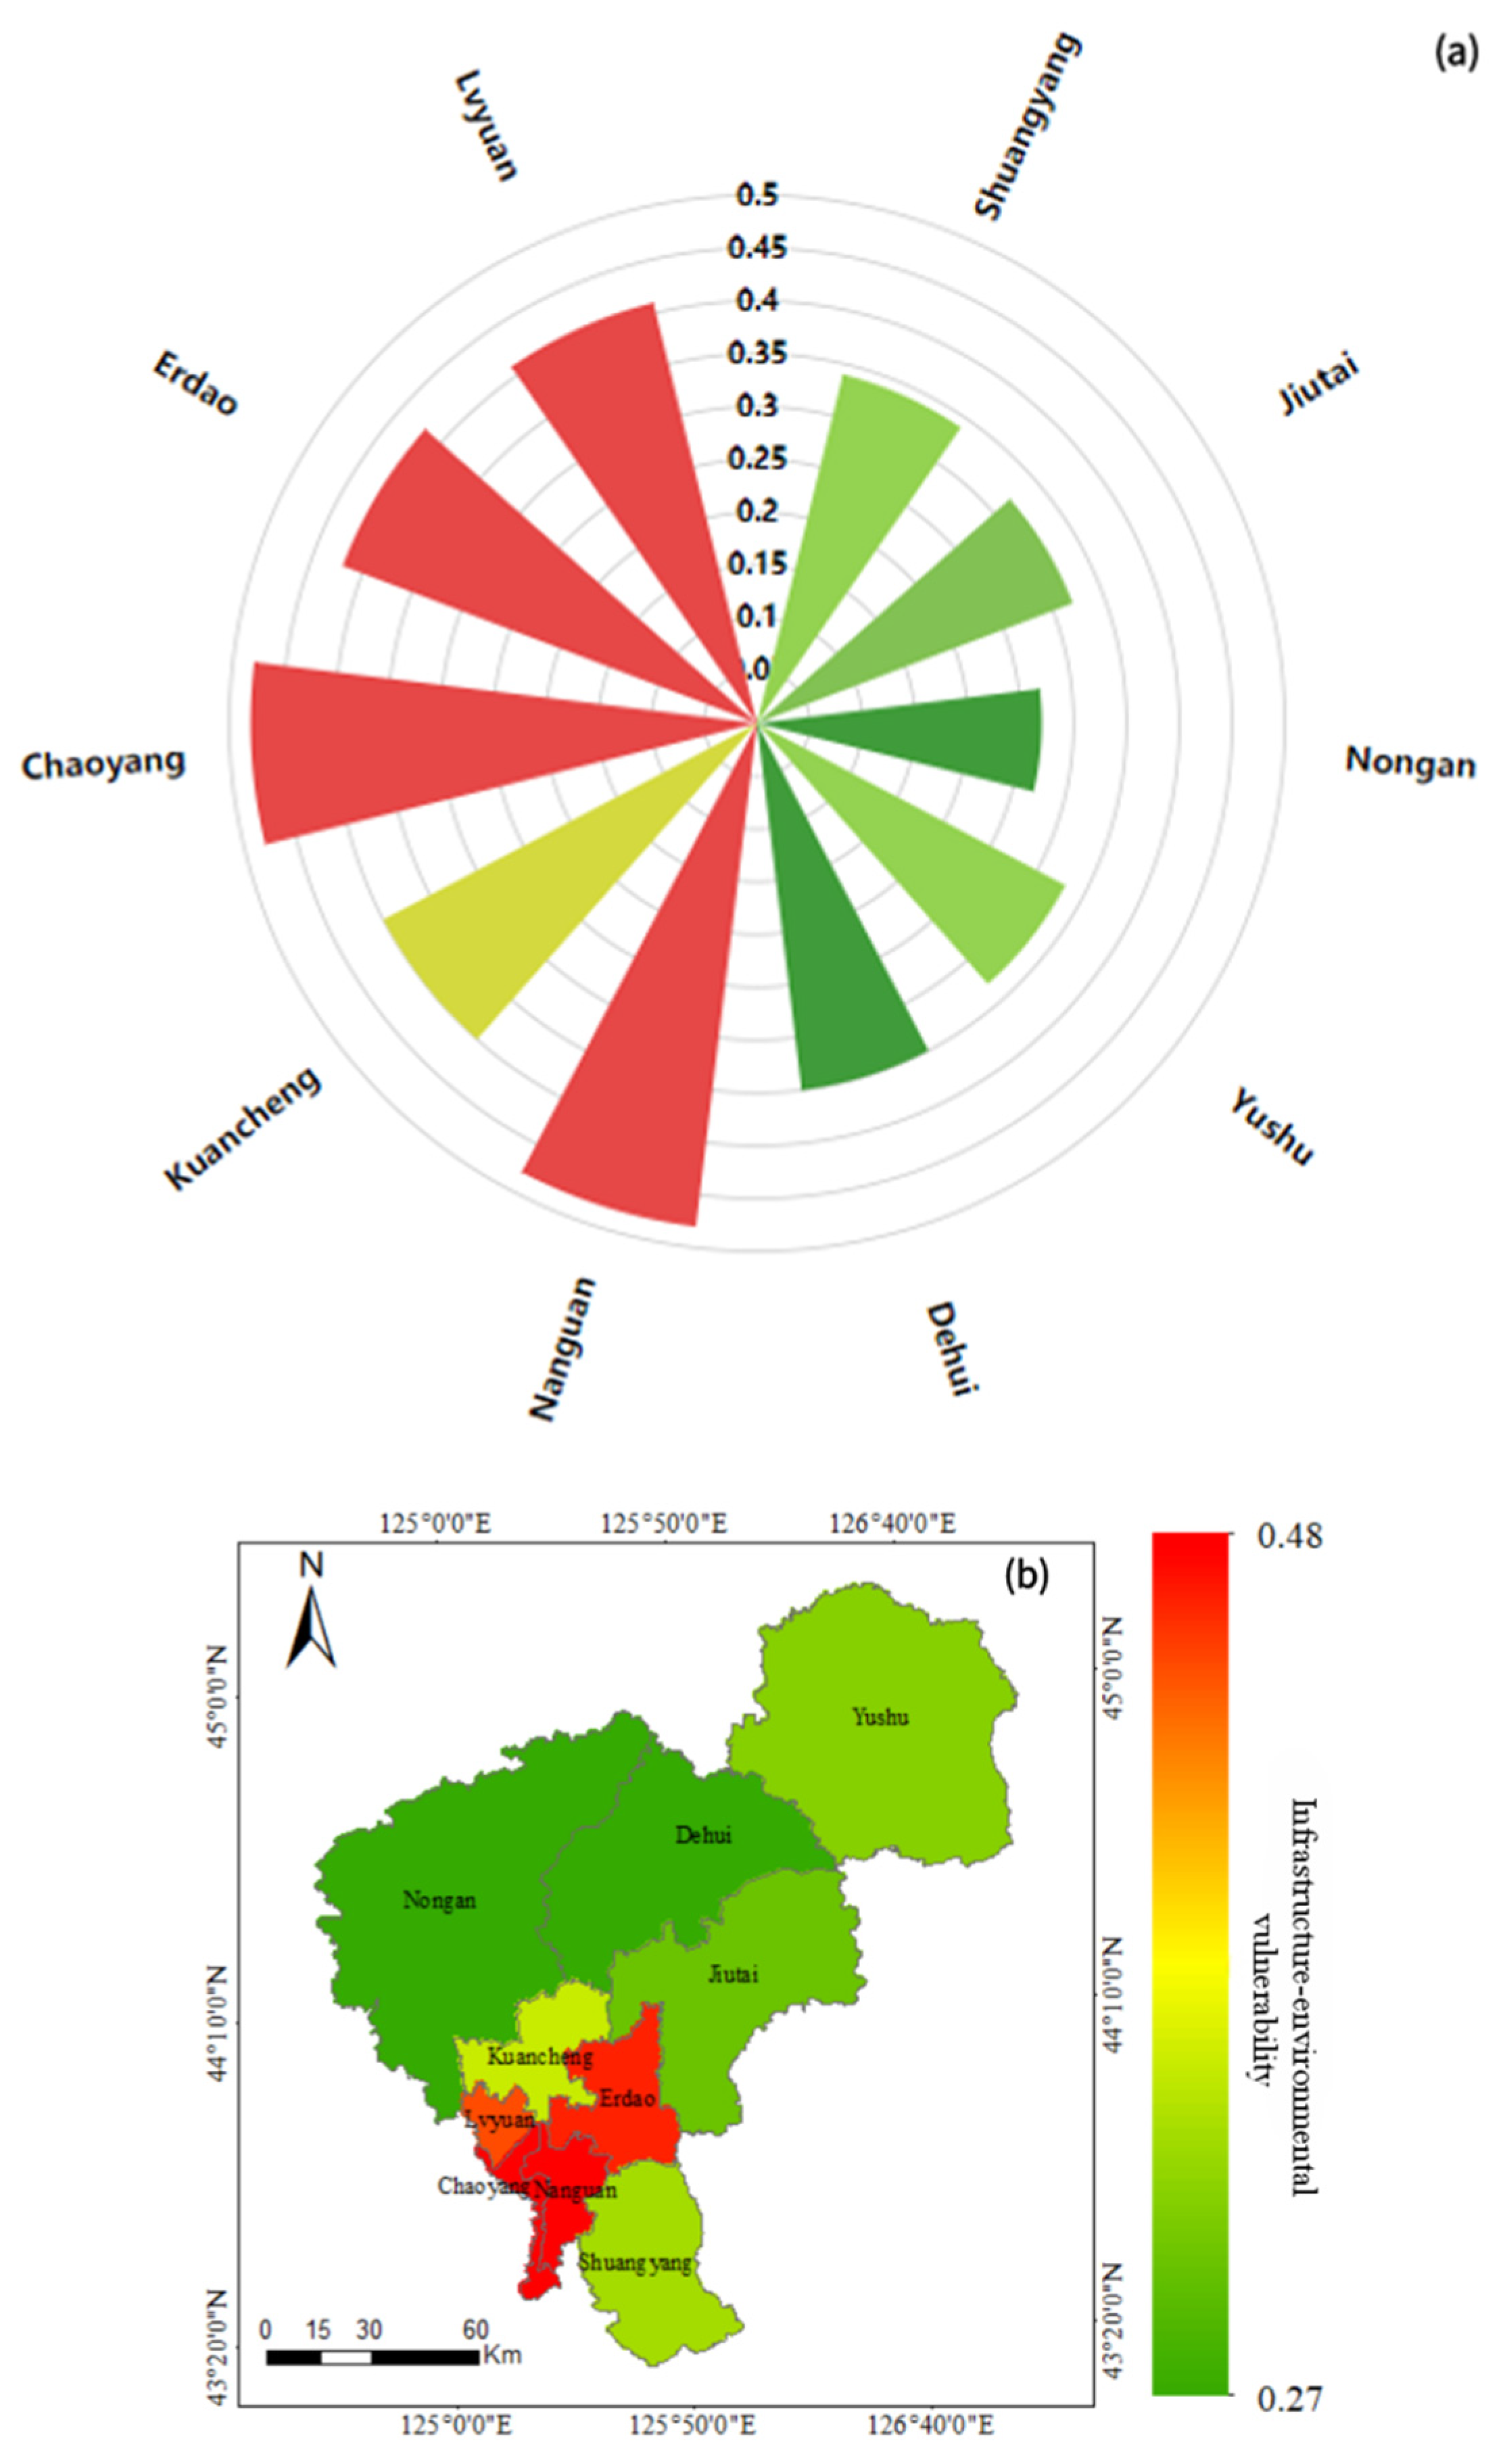
2.2.1. GIS Weighted Combination Quantitative Infrastructure and Environmental Vulnerability
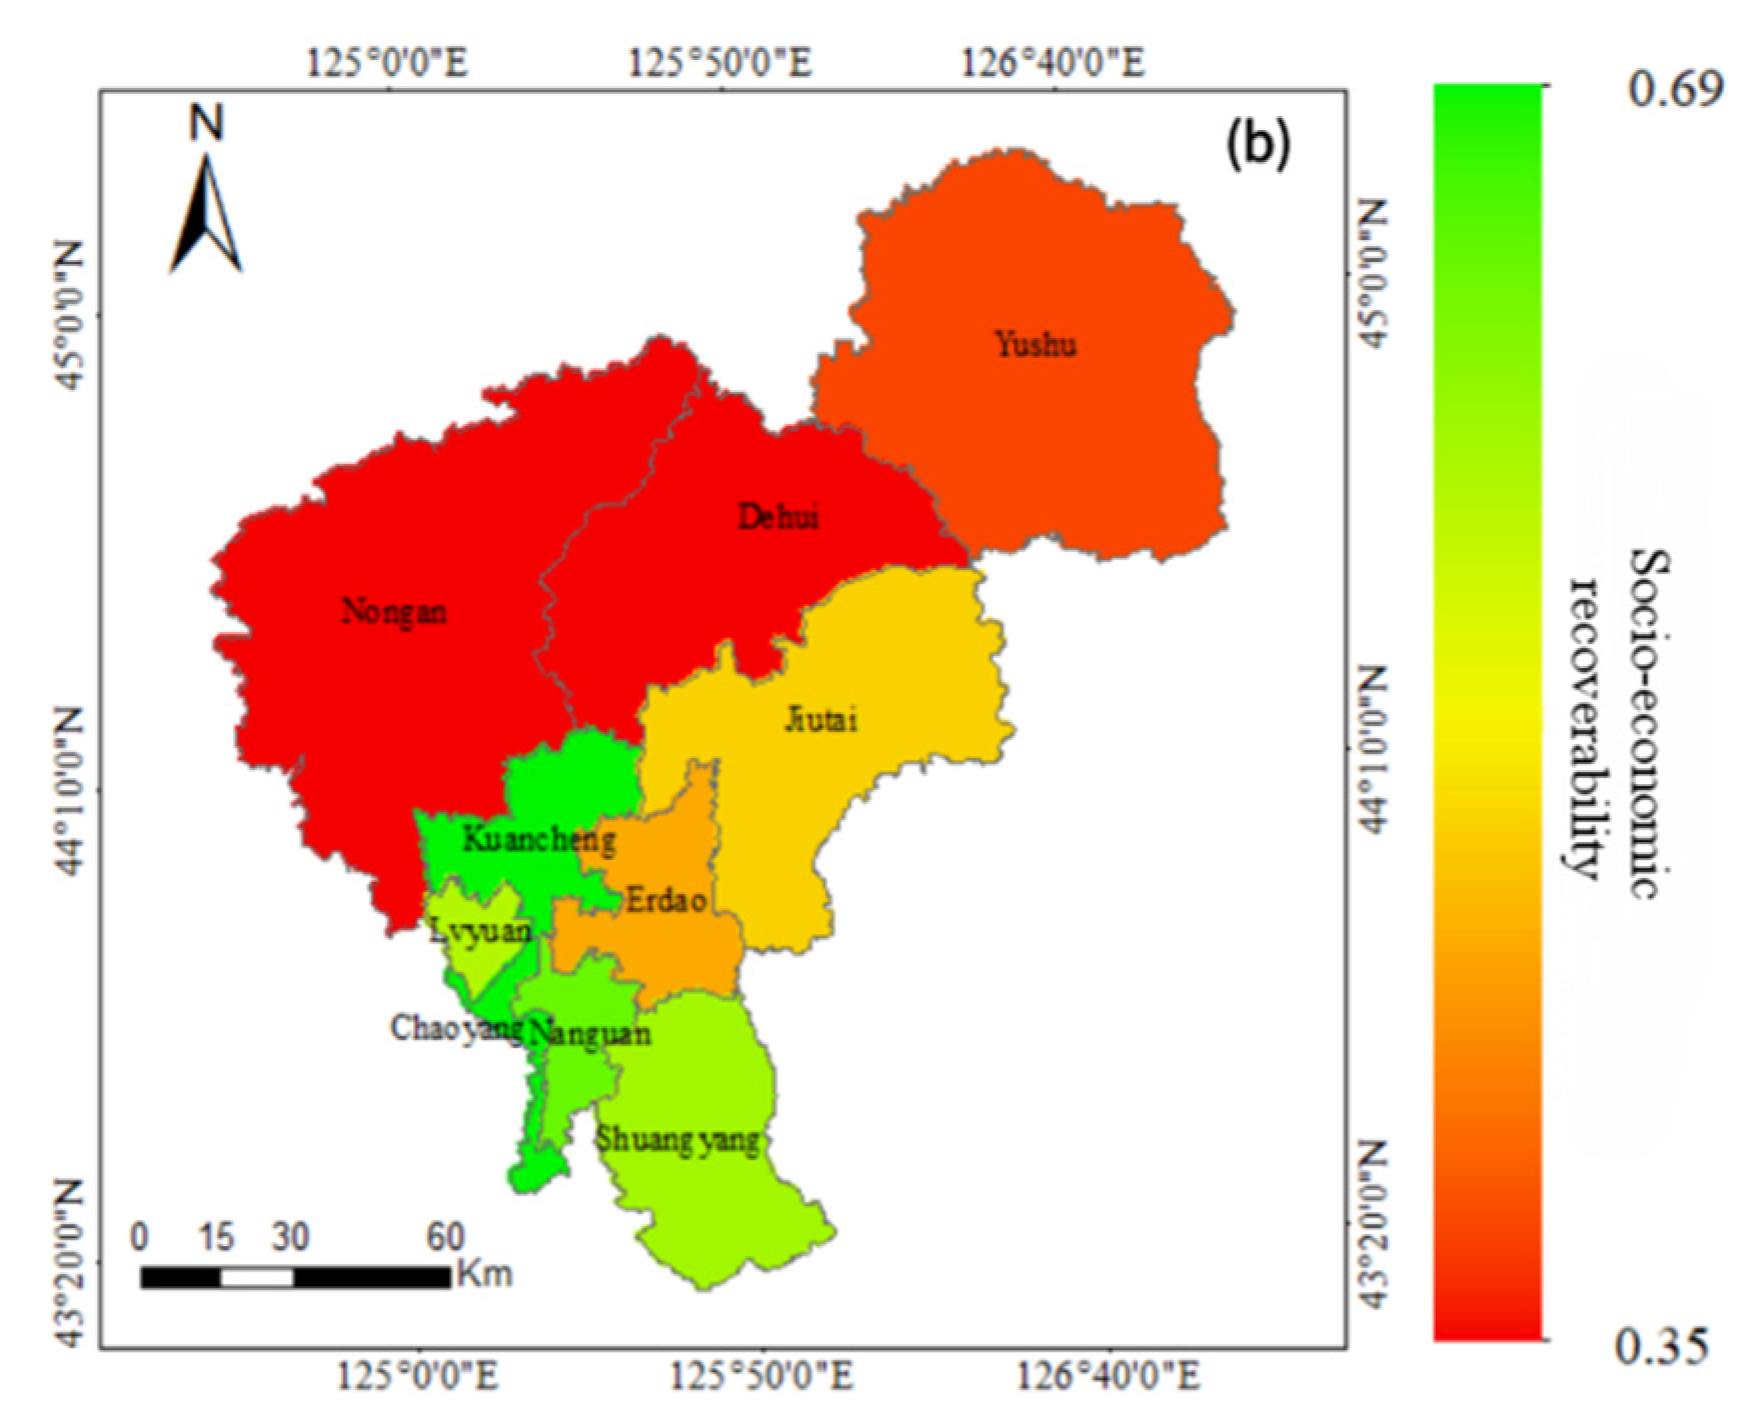
2.2.2. TOPSIS Quantified Socioeconomic Recoverability
- (1)
- Construct a decision matrix.
- (2)
- Calculate the weighted normalized matrix.
- (3)
- Determine positive and negative ideal solutions.
- (4)
- Calculate the geometric distance from positive and negative ideal solutions.
- (5)
- Calculate the close degree between the evaluation object and the ideal solution.
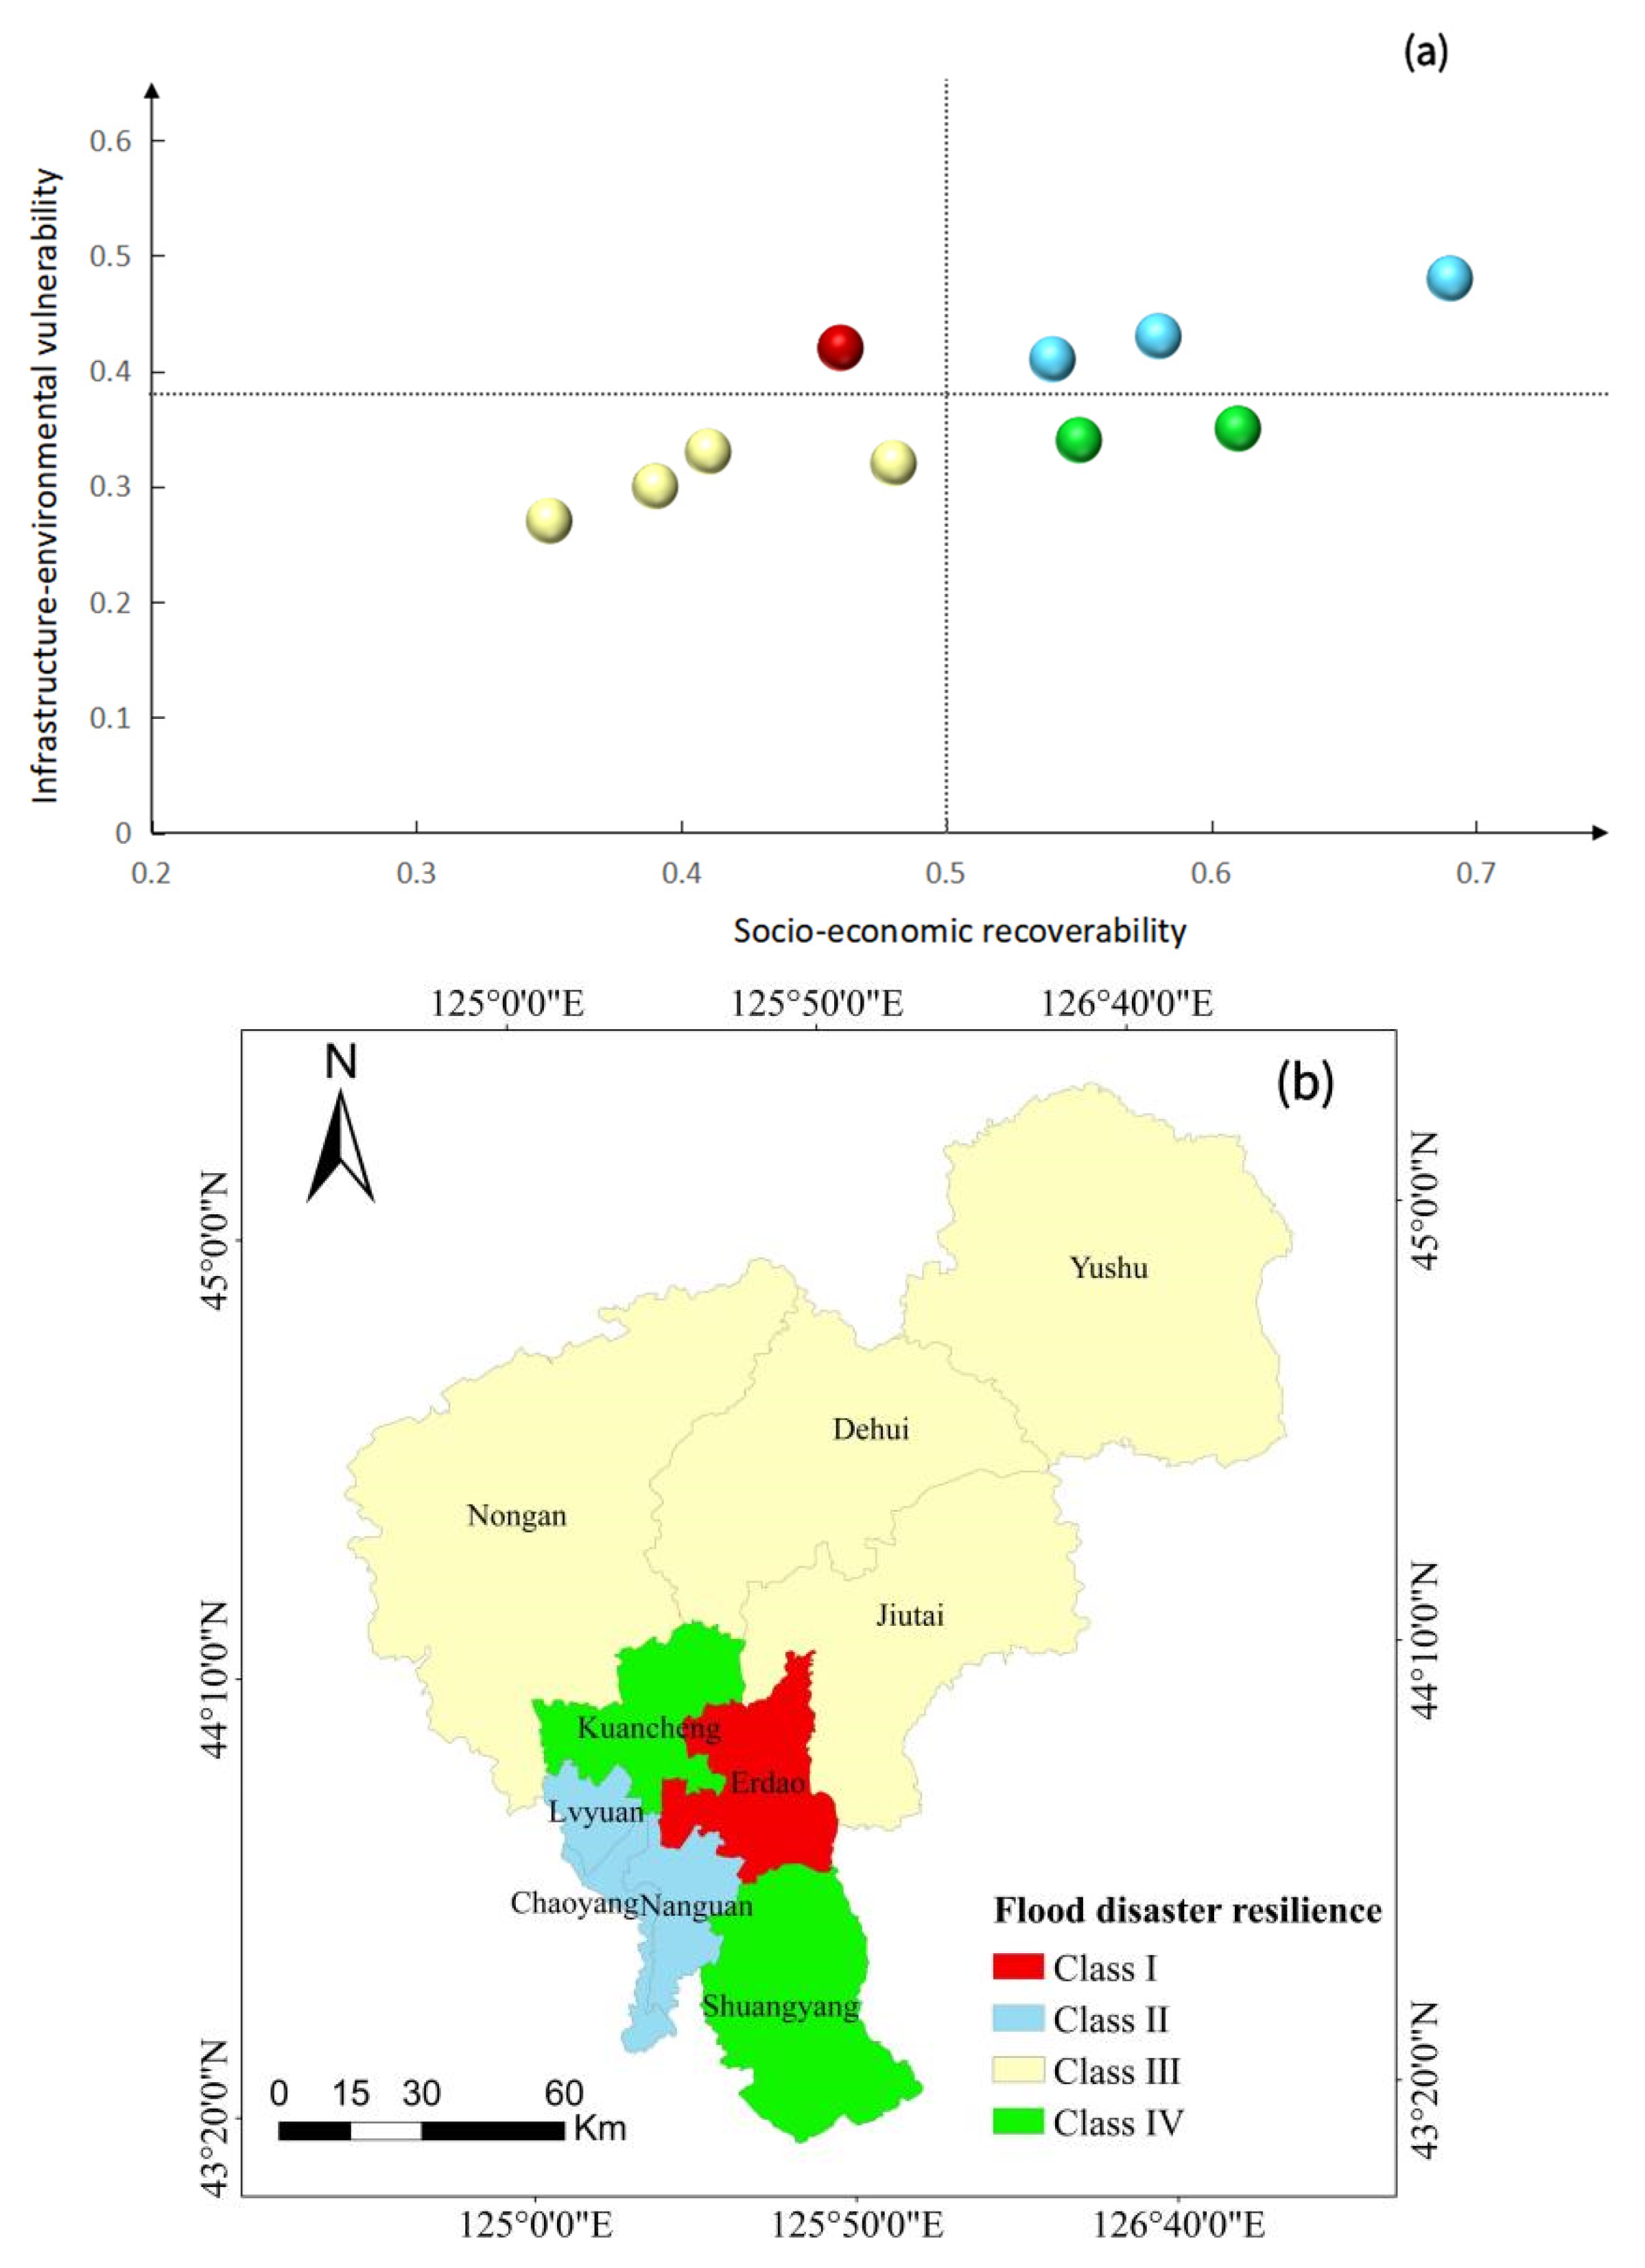
2.2.3. K-Means Algorithm Clusters Flood Resilience
3. Results
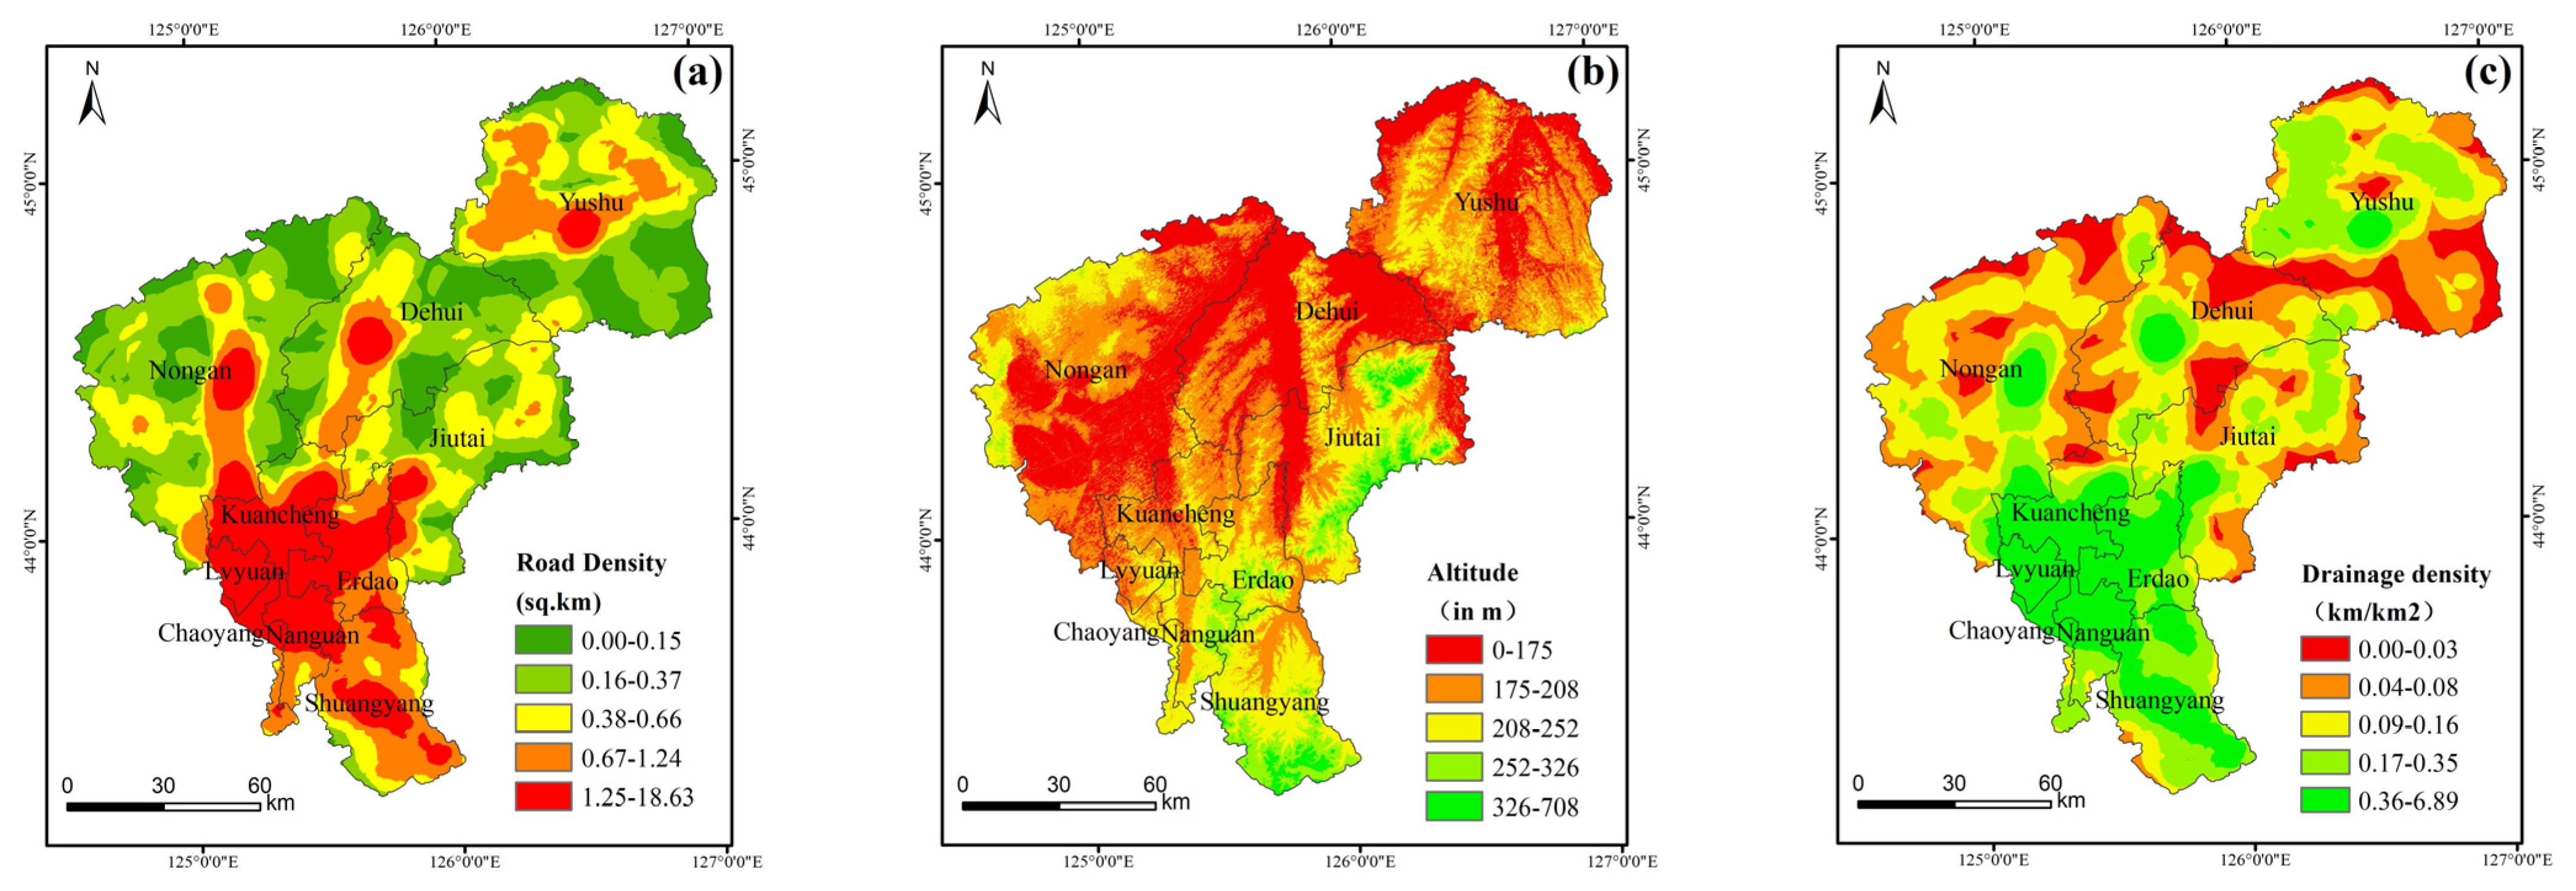
3.1. Infrastructure and Environmental Vulnerability
3.2. Socioeconomic Recoverability
3.3. Flood Resilience
4. Discussion
4.1. Verification by Example Analysis
4.2. Comparison with Other Evaluation Methods
4.3. Measures to Improve Flood Resilience
5. Conclusions
Author Contributions
Funding
Data Availability Statement
Conflicts of Interest
References
- Safiah, Y.M.; Bracken, L.J.; Sahdan, Z.; Norhaslina, H.; Melasutra, M.; Ghaffarianhoseini, A.; Sumiliana, S.; Shereen Farisha, A. Understanding urban flood vulnerability and resilience: A case study of Kuantan, Pahang, Malaysia. Nat. Hazards 2020, 101, 551–571. [Google Scholar] [CrossRef] [Green Version]
- Abhas, K.; Bloch, R.; Lamond, J. A Guide to Integrated Urban Flood Risk Management for the 21st Century; The World Bank: Washington, DC, USA, 2008; p. 20433. [Google Scholar]
- Wallemacq, P.; Below, R.; McClean, D. Economic Losses, Poverty & Disasters: 1998–2017; United Nations Office for Disaster Risk Reduction: Geneva, Switzerland, 2018. [Google Scholar]
- Li, Z.; Zhang, X.; Ma, Y.; Feng, C.; Hajiyev, A. A multi-criteria decision making method for urban flood resilience evaluation with hybrid uncertainties. Int. J. Disaster Risk Reduct. 2019, 36, 101140. [Google Scholar] [CrossRef]
- Yang, Y.; Guo, H.; Wang, D.; Ke, X.; Li, S.; Huang, S. Flood vulnerability and resilience assessment in China based on super-efficiency DEA and SBM-DEA methods. J. Hydrol. 2021, 600, 126470. [Google Scholar]
- Ministry of Emergency Management of the People’s Republic China. Basic Situation of Natural Disasters in 2020; Ministry of Emergency Management of the People’s Republic China: Beijing, China, 2020. [Google Scholar]
- Haque, M.M.; Islam, S.; Sikder, M.B.; Islam, M.S. Community flood resilience assessment in Jamuna floodplain: A case study in Jamalpur District Bangladesh. Int. J. Disaster Risk Reduct. 2022, 72, 102861. [Google Scholar]
- Campanella, T.J. Urban resilience and the recovery of New Orleans. J. Am. Plan. Assoc. 2006, 72, 141–146. [Google Scholar] [CrossRef]
- Muller, M. Adapting to climate change: Water management for urban resilience. Environ. Urban. 2007, 19, 99–113. [Google Scholar] [CrossRef] [Green Version]
- McClymont, K.; Morrison, D.; Beevers, L.; Carmen, E. Flood resilience: A systematic review. J. Environ. Plan. Manag. 2020, 63, 1151–1176. [Google Scholar] [CrossRef] [Green Version]
- Morrison, A.; Westbrook, C.J.; Noble, B.F. A review of the flood risk management governance and resilience literature. J. Flood Risk Manag. 2018, 11, 291–304. [Google Scholar]
- Aerts, J.C.; Botzen, W.W.; Emanuel, K.; Lin, N.; De Moel, H.; Michel-Kerjan, E.O. Evaluating flood resilience strategies for coastal megacities. Science 2014, 344, 473–475. [Google Scholar] [CrossRef]
- Yang, W.; Xu, K.; Lian, J.; Bin, L.; Ma, C. Multiple flood vulnerability assessment approach based on fuzzy comprehensive evaluation method and coordinated development degree model. J. Environ. Manag. 2018, 213, 440–450. [Google Scholar] [CrossRef]
- Shen, Y.; Morsy, M.M.; Huxley, C.; Tahvildari, N.; Goodall, J.L. Flood risk assessment and increased resilience for coastal urban watersheds under the combined impact of storm tide and heavy rainfall. J. Hydrol. 2019, 579, 124159. [Google Scholar] [CrossRef]
- Alfieri, L.; Feyen, L.; Dottori, F.; Bianchi, A. Ensemble flood risk assessment in Europe under high end climate scenarios. Glob. Environ. Change 2015, 35, 199–212. [Google Scholar] [CrossRef]
- Xu, Y.; Li, G.; Cui, S.; Xu, Y.; Pan, J.; Tong, N.; Zhu, Y. Review and perspective on resilience science: From ecological theory to urban practice. Acta Ecol. Sin. 2018, 38, 5297–5304. [Google Scholar]
- Cutter, S.L.; Burton, C.G.; Emrich, C.T. Disaster resilience indicators for benchmarking baseline conditions. J. Homel. Secur. Emerg. Manag. 2010, 7. [Google Scholar] [CrossRef]
- Siebeneck, L.; Arlikatti, S.; Andrew, S.A. Using provincial baseline indicators to model geographic variations of disaster resilience in Thailand. Nat. Hazards 2015, 79, 955–975. [Google Scholar] [CrossRef]
- Qasim, S.; Qasim, M.; Shrestha, R.P.; Khan, A.N.; Tun, K.; Ashraf, M. Community resilience to flood hazards in Khyber Pukhthunkhwa province of Pakistan. Int. J. Disaster Risk Reduct. 2016, 18, 100–106. [Google Scholar] [CrossRef]
- Bertilsson, L.; Wiklund, K.; Moura, T.I.; Rezende, O.M.; Veról, A.P.; Miguez, M.G. Urban flood resilience—A multi−criteria index to integrate flood resilience into urban planning. J. Hydrol. 2019, 573, 970–982. [Google Scholar] [CrossRef]
- Zhang, H.; Yang, J.; Li, L.; Shen, D.; Wei, G.; Dong, S. Measuring the resilience to floods: A comparative analysis of key flood control cities in China. Int. J. Disaster Risk Reduct. 2021, 59, 102248. [Google Scholar] [CrossRef]
- Liu, G.; Yuan, X.; Huang, J. Evaluation of Urban Flood Resilience Based on PSR Framework: A Case Study of Suzhou Wuxi Changzhou Region. Resour. Dev. Mark. 2018, 34, 593–598. [Google Scholar]
- Orencio, P.M.; Fujii, M. A localized disaster-resilience index to assess coastal communities based on an analytic hierarchy process (AHP). Int. J. Disaster Risk Reduct. 2013, 3, 62–75. [Google Scholar]
- Lyu, H.M.; Sun, W.J.; Shen, S.L.; Arulrajah, A. Flood risk assessment in metro systems of mega−cities using a GIS−based modeling approach. Sci. Total Environ. 2018, 626, 1012–1025. [Google Scholar] [CrossRef] [PubMed]
- Sun, R.; Shi, S.; Reheman, Y.; Li, S. Measurement of urban flood resilience using a quantitative model based on the correlation of vulnerability and resilience. Int. J. Disaster Risk Reduct. 2022, 82, 103344. [Google Scholar] [CrossRef]
- Cutter, S.L.; Barnes, L.; Berry, M.; Burton, C.; Evans, E.; Tate, E.; Webb, J. A place-based model for understanding community resilience to natural disasters. Glob. Environ. Change 2008, 18, 598–606. [Google Scholar] [CrossRef]
- Marasco, S.; Cardoni, A.; Noori, A.Z.; Kammouh, O.; Domaneschi, M.; Cimellaro, G.P. Integrated platform to assess seismic resilience at the community level. Sustain. Cities Soc. 2021, 64, 102506. [Google Scholar]
- The Rockefeller Foundation; Arup. City Resilience Index; The Rockefeller Foundation: New York, NY, USA, 2015. [Google Scholar]
- Hoque, M.A.; Tasfia, S.; Ahmed, N.; Pradhan, B. Assessing spatial flood vulnerability at Kalapara Upazila in Bangladesh using an analytic hierarchy process. Sensors 2019, 19, 1302. [Google Scholar] [CrossRef] [Green Version]
- Tayyab, M.; Zhang, J.; Hussain, M.; Ullah, S.; Liu, X.; Khan, S.N.; Baig, M.A.; Hassan, W.; Al-Shaibah, B. Gis−based urban flood resilience assessment using urban flood resilience model: A case study of peshawar city, khyber pakhtunkhwa, pakistan. Remote Sens. 2021, 13, 1864. [Google Scholar] [CrossRef]
- Omran, E. Evolving waterlogged identification system to assess spatiotemporal impact of the new Suez Canal corridor, Egypt. J. Coast. Conserv. 2017, 21, 849–865. [Google Scholar]
- Saha, A.K.; Agrawal, S. Mapping and assessment of flood risk in Prayagraj district, India: A GIS and remote sensing study. Nanotechnol. Environ. Eng. 2020, 5, 11. [Google Scholar] [CrossRef]
- Chen, P.; Zhang, J.; Zhang, L.; Sun, Y. Evaluation of resident evacuations in urban rainstorm waterlogging disasters based on scenario simulation: Daoli district (Harbin, China) as an example. Int. J. Environ. Res. Public Health 2014, 11, 9964–9980. [Google Scholar] [CrossRef] [Green Version]
- Sar, N.; Chatterjee, S.; Das Adhikari, M. Integrated remote sensing and GIS based spatial modelling through analytical hierarchy process (AHP) for water logging hazard, vulnerability and risk assessment in Keleghai river basin, India. Model. Earth Syst. Environ. 2015, 1, 31. [Google Scholar] [CrossRef] [Green Version]
- Hamidi, A.R.; Wang, J.; Guo, S.; Zeng, Z. Flood vulnerability assessment using MOVE framework: A case study of the northern part of district Peshawar. Pakistan. Nat. Hazards 2020, 101, 385–408. [Google Scholar]
- Duan, C.; Zhang, J.; Chen, Y.; Lang, Q.; Zhang, Y.; Wu, C.; Zhang, Z. Comprehensive Risk Assessment of Urban Waterlogging Disaster Based on MCDA−GIS Integration: The Case Study of Changchun, China. Remote Sens. 2022, 14, 3101. [Google Scholar] [CrossRef]
- Tran, D.; Xu, D.; Dang, V.; Alwah, A.A. Predicting urban waterlogging risks by regression models and internet open−data sources. Water 2020, 12, 879. [Google Scholar] [CrossRef] [Green Version]
- Li, G.; Kou, C.; Wang, Y.; Yang, H. System dynamics modelling for improving urban resilience in Beijing, China. Resour. Conserv. Recycl. 2020, 161, 104954. [Google Scholar] [CrossRef]
- Moghadas, M.; Asadzadeh, A.; Vafeidis, A.; Fekete, A.; Kötter, T. A multi−criteria approach for assessing urban flood resilience in Tehran, Iran. Int. J. Disaster Risk Reduct. 2019, 35, 101069. [Google Scholar] [CrossRef]
- Shah, A.A.; Ye, J.; Abid, M.; Khan, J.; Amir, S.M. Flood hazards: Household vulnerability and resilience in disaster−prone districts of Khyber Pakhtunkhwa province, Pakistan. Nat. Hazards 2018, 93, 147–165. [Google Scholar] [CrossRef]
- Sun, R.; Gong, Z.; Gao, G.; Shah, A.A. Comparative analysis of Multi−Criteria Decision−Making methods for flood disaster risk in the Yangtze River Delta. Int. J. Disaster Risk Reduct. 2020, 51, 101768. [Google Scholar]
- Huang, X.; Ling, Z. Construction of urban waterlogging vulnerability assessment system and vulnerability assessment based on PSR & AHP method in Xi’an city. J. Nat. Disasters 2019, 28, 167–175. [Google Scholar]
- Saaty, T.L. The Analytic Hierarchy Process: Planning, Priority Setting, Resource Allocation; McGraw−Hill: Basel, Switzerland, 1980. [Google Scholar]
- Roy, S.; Bose, A.; Singha, N.; Basak, D.; Chowdhury, I.R. Urban waterlogging risk as an undervalued environmental challenge: An Integrated MCDA−GIS based modeling approach. Environ. Chall. 2021, 4, 100194. [Google Scholar] [CrossRef]
- Hwang, C.L.; Yoon, K. Methods for multiple attribute decision making. In Multiple Attribute Decision Making; Springer: Berlin/Heidelberg, Germany, 1981; pp. 58–191. [Google Scholar]
- Saroj, K. Review: Study on simple k mean and modified K mean clustering technique. Int. J. Comput. Sci. Eng. Technol. 2016, 6, 279–281. [Google Scholar]
- Choi, E.; Song, J. Clustering-based disaster resilience assessment of South Korea communities building portfolios using open GIS and census data. Int. J. Disaster Risk Reduct. 2022, 71, 102817. [Google Scholar] [CrossRef]


| Criterion Layer | Indicator Layer | Index Selection Basis |
|---|---|---|
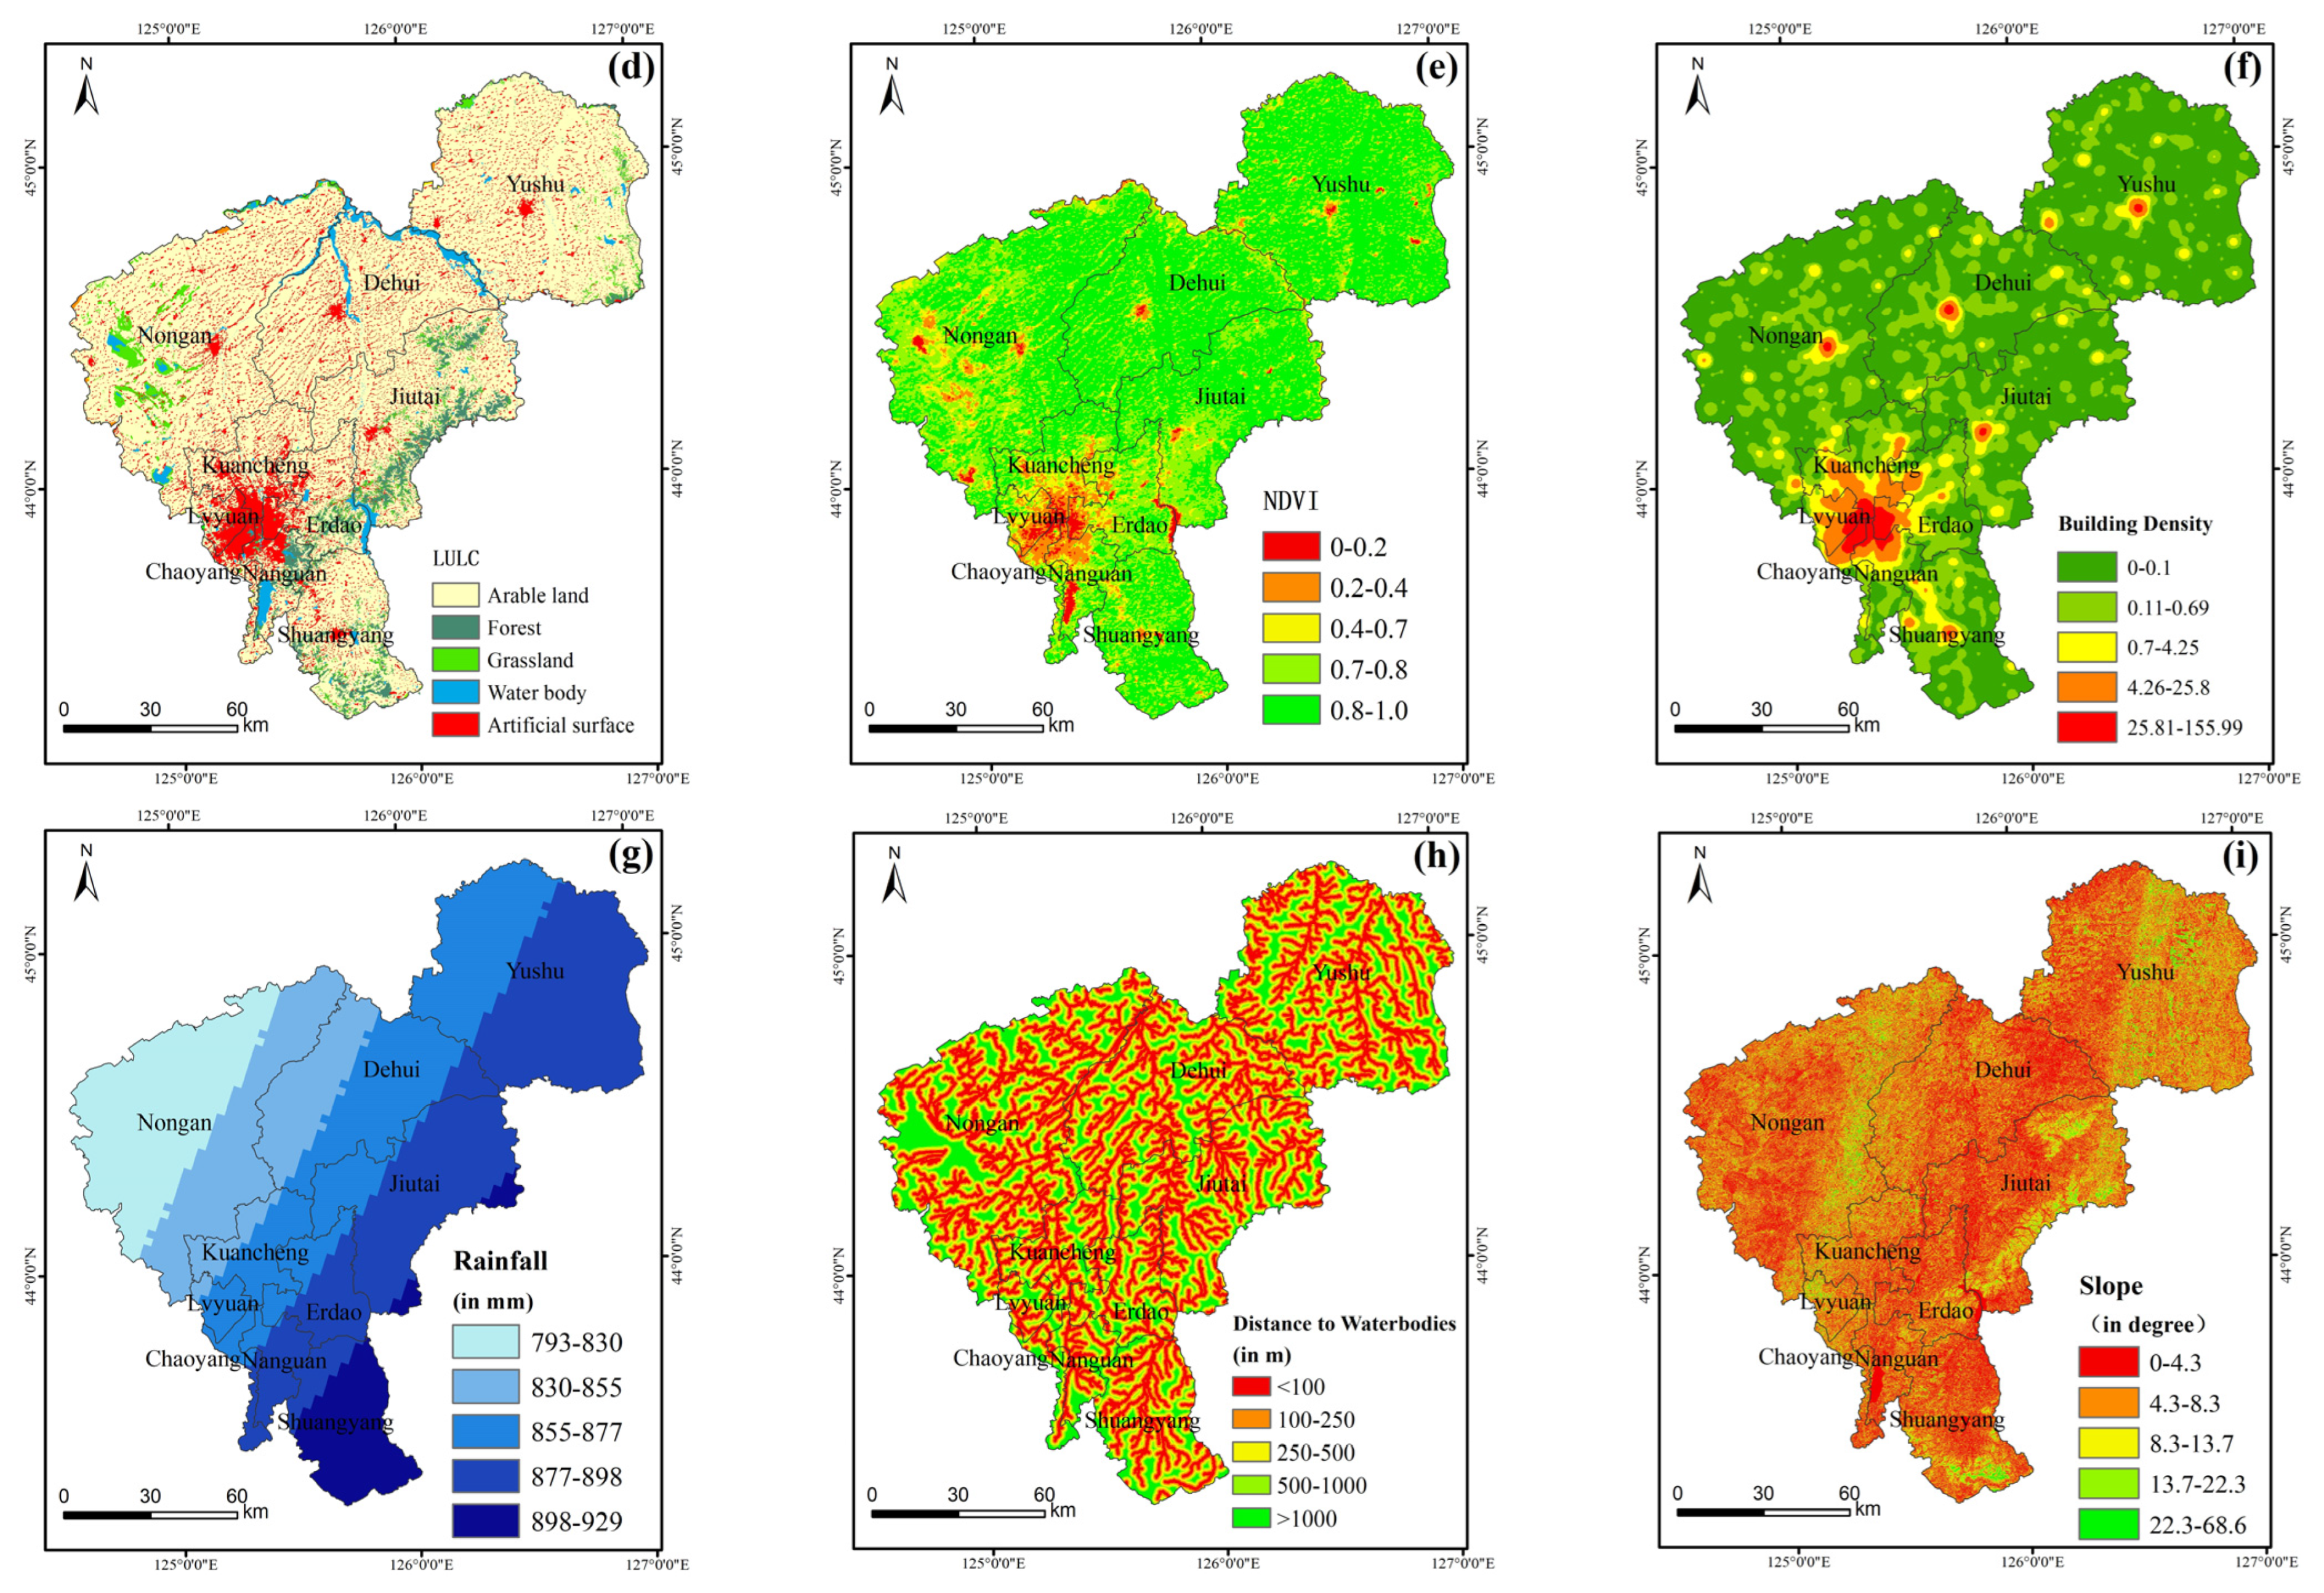
| Environment | Altitude | Altitude will affect the pressure of urban storm flood system, and low-lying areas are more prone to rain and flood damage [29,30]. |
| LULC | In the event of flood, different land use types have different degrees of flood damage and different vulnerability. Compared with green space, impervious ground is less able to absorb water and more prone to flooding [31,32]. | |
| Rainfall | Precipitation is an important cause of flood disaster, so precipitation as an evaluation index is important [33]. | |
| NDVI | NDVI is an important index of vegetation coverage, and vegetation has certain resistance to flood disaster [34]. | |
| Slope | Slope determines the current flood velocity, so slope selection is also an important evaluation index [35]. | |
| Distance to water bodies | The closer an area is to rivers and lakes, the more likely it is to flood [34]. | |
| Infrastructure | Road density | Road density also affects the evacuation of people during flood disasters, which helps improve resilience [36]. |
| Building density | The more built up an area is, the more vulnerable it is to flooding [37]. | |
| Drainage density | Drainage pipe network can remove the flood as soon as possible when the flood disaster occurs, which is an important means of urban drainage [36]. | |
| Economy | GDP per capita | In general, economically less developed areas are more vulnerable to flooding [36]. |
| Flood defense investment as a proportion of public expenditure | The higher the proportion of flood control investment, the lower the probability of flood disaster and the loss caused by flood disaster [37]. | |
| Proportion of health expenditure | Medical and health finance can provide important guarantees for people’s safety after disaster [38]. | |
| Fiscal revenue | Fiscal revenue represents the economic strength of local governments. The higher the fiscal revenue, the stronger the resilience to flood disasters [38]. | |
| The number of industrial enterprises above designated size | Large companies are more resilient to flooding [38]. | |
| Society | Population density | The greater the population density, the greater the damage caused by flood disaster [39]. |
| Proportion of talents in higher education | Education can improve people’s awareness and knowledge of disasters. People with higher education levels have stronger coping abilities when flood disasters happen [40]. | |
| Proportion of water conservancy employees | The higher the proportion of water conservancy employees, the lower the loss caused by a flood disaster [38]. | |
| Number of beds in health institutions per 10,000 people | Provide relief facilities during and after flood disasters. The more beds available, the better the first aid and recovery capacity [41]. | |
| Health professionals per 10,000 population | Health workers can provide relief during and after floods [41]. | |
| Unemployment rate | Unemployment rate is an important factor for social stability. The higher the unemployment rate, the greater the loss caused by the flood disaster [41]. | |
| Coverage of basic medical insurance | As an important means of social security, basic medical insurance provides important medical security for the disaster-stricken people after the flood disaster [39]. |
| Evaluation Index | Data Type | Date Details | Data Source |
|---|---|---|---|
| Altitude | ASTER GDEM | 30 m | Geospatial data cloud |
| LULC | Raster data | 30 m | Data grain |
| Rainfall | Raster data | 2017–2021 | National Data Center for Meteorological Sciences |
| NDVI | Landsat 8 OLI/TIRS | 30 m | Data grain |
| Slope | ASTER GDEM | 30 m | Geospatial data cloud |
| Distance to water bodies | Vector data | 2021 | Geospatial data cloud |
| Road density | Road network shape file | 2021 | Geospatial data cloud |
| Building density | POI | 2021 | Planning cloud |
| Drainage density | Vector data | 2021 | Planning cloud |
| GDP per capita | Attribute data | 2021 | Changchun Statistical Yearbook |
| Flood defense investment as a proportion of public expenditure | Attribute data | 2021 | Changchun Statistical Yearbook |
| Proportion of health expenditure | Attribute data | 2021 | Changchun Statistical Yearbook |
| Fiscal revenue | Attribute data | 2021 | Changchun Statistical Yearbook |
| The number of industrial enterprises above designated size | Attribute data | 2021 | Changchun Statistical Yearbook |
| Population density | Attribute data | 2021 | Changchun Statistical Yearbook |
| Proportion of talents in higher education | Attribute data | 2021 | Changchun Statistical Yearbook |
| Proportion of water conservancy employees | Attribute data | 2021 | Changchun Statistical Yearbook |
| Number of beds in health institutions per 10,000 people | Attribute data | 2021 | Changchun Statistical Yearbook |
| Health professionals per 10,000 population | Attribute data | 2021 | Changchun Statistical Yearbook |
| Unemployment rate | Attribute data | 2021 | Changchun Statistical Yearbook |
| Coverage of basic medical insurance | Attribute data | 2021 | Changchun Statistical Yearbook |
| Scale | Meaning |
|---|---|
| 1 | Equally important |
| 3 | Moderately more important |
| 5 | Strongly more important |
| 7 | Very strongly more important |
| 9 | Extremely more important |
| 2, 4, 6, 8 | Intermediate values |
| Order | 1 | 2 | 3 | 4 | 5 | 6 | 7 | 8 | 9 |
|---|---|---|---|---|---|---|---|---|---|
| 0.00 | 0.00 | 0.58 | 0.90 | 1.12 | 1.24 | 1.32 | 1.41 | 1.45 |
| Target Layer | Criterion Layer | Criterion Layer Weight | Index Layer | Index Layer Weight |
|---|---|---|---|---|
| Flood resilience | Infrastructure | 0.205 | Road density | 0.051 |
| Building density | 0.051 | |||
| Drainage density | 0.102 | |||
| Environment | 0.169 | Altitude | 0.020 | |
| Slope | 0.013 | |||
| Rainfall | 0.026 | |||
| LULC | 0.046 | |||
| NDVI | 0.038 | |||
| Distance to water bodies | 0.026 | |||
| Economy | 0.339 | GDP per capita | 0.089 | |
| Flood defense investment as a proportion of public expenditure | 0.109 | |||
| Proportion of health expenditure | 0.038 | |||
| Fiscal revenue | 0.055 | |||
| The number of industrial enterprises above designated size | 0.048 | |||
| Society | 0.288 | Population density | 0.066 | |
| Proportion of talents in higher education | 0.031 | |||
| Proportion of water conservancy employees | 0.053 | |||
| Number of beds in health institutions per 10,000 people | 0.030 | |||
| Health professionals per 10,000 population | 0.036 | |||
| Unemployment rate | 0.044 | |||
| Coverage of basic medical insurance | 0.028 |
Disclaimer/Publisher’s Note: The statements, opinions and data contained in all publications are solely those of the individual author(s) and contributor(s) and not of MDPI and/or the editor(s). MDPI and/or the editor(s) disclaim responsibility for any injury to people or property resulting from any ideas, methods, instructions or products referred to in the content. |
© 2023 by the authors. Licensee MDPI, Basel, Switzerland. This article is an open access article distributed under the terms and conditions of the Creative Commons Attribution (CC BY) license (https://creativecommons.org/licenses/by/4.0/).
Share and Cite
Zhang, Z.; Zhang, J.; Zhang, Y.; Chen, Y.; Yan, J. Urban Flood Resilience Evaluation Based on GIS and Multi-Source Data: A Case Study of Changchun City. Remote Sens. 2023, 15, 1872. https://doi.org/10.3390/rs15071872
Zhang Z, Zhang J, Zhang Y, Chen Y, Yan J. Urban Flood Resilience Evaluation Based on GIS and Multi-Source Data: A Case Study of Changchun City. Remote Sensing. 2023; 15(7):1872. https://doi.org/10.3390/rs15071872
Chicago/Turabian StyleZhang, Zhen, Jiquan Zhang, Yichen Zhang, Yanan Chen, and Jiahao Yan. 2023. "Urban Flood Resilience Evaluation Based on GIS and Multi-Source Data: A Case Study of Changchun City" Remote Sensing 15, no. 7: 1872. https://doi.org/10.3390/rs15071872