Article

Combination of InSAR with a Depression Angle Model for 3D Deformation Monitoring in Mining Areas

1
College of GeoScience and Surveying Engineering, China University of Mining and Technology (Beijing), Beijing 100083, China
2
School of Mining Engineering, Guizhou University of Engineering Science, Bijie 551700, China
*
Author to whom correspondence should be addressed.
Remote Sens. 2023, 15(7), 1834; https://doi.org/10.3390/rs15071834
Submission received: 3 February 2023 / Revised: 8 March 2023 / Accepted: 27 March 2023 / Published: 29 March 2023
(This article belongs to the Section Satellite Missions for Earth and Planetary Exploration)

Abstract

:
The current three-dimensional (3D) deformation monitoring methods, based on the single line-of-sight (LOS) interferometric synthetic aperture radar (InSAR) technology, are constructed by combining the deformation characteristics of mining subsidence basins, which are incompletely suitable in the edge area of the subsidence basin and some large deformation gradient mines with surface uplift in the LOS direction.The 3D deformation monitoring method of InSAR combined with the surface displacement vector depression angle model (InSAR+ depression angle model) is proposed to obtain more detailed and accurate deformation information of the entire basin. This method first establishes a surface displacement vector depression angle model based on the probability integral method (PIM). The magnitude of the surface displacement vector—owing to the spatial relationship between the LOS direction and the surface displacement vector—is obtained because the horizontal movement direction field and the displacement vector depression angle field of the mining area determine the 3D directions of the surface displacement vector. Then, the PIM model is used to obtain the settlement information of the central area with a large deformation gradient. A complete subsidence basin of the mining area is received by combining the proposed method and the PIM. A total of 35 Sentinel-1A data from 31 March 2018 to 13 May 2019 and the leveling data were used to apply and analyze the accuracy of this method. The experimental results show that this method can obtain more accurate information on surface subsidence around the mining area. Moreover, the overall settlement is more consistent with the actual situation, and the monitoring ability is significantly improved compared with the InSAR and PIM.

Graphical Abstract

1. Introduction

In the process of coal mining, the original tectonic stress and the stress balance of the rock mass in the mining areas are destroyed, resulting in continuous movement, deformation, and discontinuous destruction of rock strata and surface, thus leading to various geological disasters and safety problems. As such, it is vital to monitor and study the surface deformation that is caused by coal mining for the analysis of these problems [1,2,3]. Most traditional surface deformation monitoring methods for coal mining generally lay observation lines along the strike and dip of the working face. They monitor the subsidence and horizontal movement of the points on observation lines based on traditional measurement technologies, such as leveling and global navigation satellite systems (GNSS). These methods provide better accuracy, but their shortcomings include a heavy workload, easily damaged measuring points, and the inability to completely reflect the three-dimensional (3D) surface deformation of the entire mining area [4,5].
The interferometric synthetic aperture radar (InSAR) is widely used for surface deformation monitoring in mining areas, because of its efficiency in obtaining a large range of surface deformation information [6,7,8,9]. However, the differential InSAR (DInSAR) technology is easily affected by atmospheric delay, time decoherence, and other factors. Moreover, DInSAR can only obtain surface deformation during the time interval of the two SAR images. Multi-temporal InSAR (MT-InSAR) technology can overcome these shortcomings, which mainly includes persistent scatter InSAR (PS-InSAR) technology and small baseline subsets (SBAS) InSAR technology, which are widely used in time-series deformation monitoring [8,9]. Many studies have used SBAS-InSAR to monitor the deformation of the mining areas because of its applicability to the distributed target analysis [10,11,12,13,14,15]. The ground deformation monitored by InSAR is the deformation in the line-of-sight (LOS), and the precision can reach the centimeter level or even the millimeter level [16,17,18]. Many studies have used InSAR technology to investigate the acquisition methods of 3D surface deformation in mining areas, which are divided into three categories [19,20,21,22,23,24,25,26,27]. First, the multi-orbit InSAR method obtains observations in multiple directions, based on the multi-orbit InSAR observation method. Furthermore, the 3D deformation through the spatial geometric relations can be accurately and effectively calculated, but this requires at least three InSAR interferometric pairs with significant geometric differences, which is difficult in practical applications [19,20,21]. The second is the single LOS InSAR+ prior model that integrates prior models and single LOS InSAR to calculate the 3D deformation field of the surface. This model is a convenient means to reduce the dependence on other measuring data [22,23,24]. Meanwhile, two representative methods are proposed following the techniques of two scholars: Yang et al. [22,23] presented a novel method for retrieving 3D displacement fields of mining areas from a single InSAR pair after finding that the law of the horizontal displacement of a surface point is proportional to the horizontal gradient of the element subsidence, derived from the probability integral method (PIM). Diao et al. [25] proposed a method based on an analysis of the mining subsidence law for true 3D displacement monitoring by combining DInSAR with the PIM subsidence prediction model. The third is a single LOS InSAR+ mining subsidence characteristic method [26,27]. The 3D deformation of the mining subsidence basin is characterized by symmetrical distribution, which is used to solve a 3D surface deformation by calculating the LOS deformation values of symmetrical points. The last two methods have provided significant results in some mining areas with minor subsidence. However, the above two methods are unsuitable in some large deformation gradient mining areas with surface uplift in the LOS direction, especially in the edge area of the subsidence basin due to the limitations of single LOS InSAR and prior models.
The surface deformation caused by mining is often characterized by high speed and large deformation. In most cases, this deformation in the central area of the subsidence basin exceeds the monitoring capacity of InSAR technology, which restricts the application of this engineering technology [10,11,28]. Typically, the PIM is widely used in mining subsidence prediction to show that the rock strata movement as a random process obeys the statistical laws to express the surface subsidence profile, which is caused by mining as an integral formula of the probability density function. The PIM was developed by the Chinese scholars Baochen Liu and Guohua Liao and is based on the random medium theory [29], which was the most advanced method for predicting 3D surface deformation in the mining area. It is widely used in China as an empirical method, which can remedy the defect that the InSAR technology is difficult to detect effective deformation in mines with large gradient deformation. However, due to the rapid convergence of the PIM at the edge of the subsidence basin, it is difficult to predict the small-scale deformation at the edge of the subsidence basin [30].
Considering the advantages and disadvantages of both methods, some scholars have combined the PIM with InSAR technology to obtain more accurate subsidence basins in the entire region. Tan et al. [31] obtained the surface subsidence information of the whole mining area based on SBAS-InSAR, and used many points to jointly calculate the parameters to obtain more accurate PIM prediction parameters. Chen et al. [30] combined InSAR with the PIM to propose a refined monitoring method for surface subsidence in the mining area and to improve the monitoring accuracy of the edge of the subsidence basin. Some studies have also investigated the fusion of observation results between different methods and InSAR technology to obtain the surface deformation information of the whole basin [11,32,33,34]. However, discontinuous deformation often occurs when making a fusion of InSAR monitoring results and the PIM-predicted results. Chen et al. calculated the cumulative mean square deviation of the InSAR monitoring results and the predicted results of the PIM with many measured leveling values. Then, they further calculated the weights to fuse the results of the two to obtain the subsidence of the entire basin [30]. However, such methods require too much measured data and are inconvenient to apply.
It is vital to determine the included angle between the two vector directions of the LOS and surface displacement vector to calculate the surface displacement vector from the deformation in the LOS direction monitored by InSAR. By analyzing the spatial relationship of each deformation vector, it is concluded that the included angle can be determined by the displacement vector depression angle, the direction of the horizontal displacement vector, and the incident angle and azimuth of the radar beam. Among them, the surface vector depression angle is the most important parameter in calculating the surface displacement vector. The variation law of the vector depression angle from the periphery to the center of mining area is similar to that of surface subsidence. Inspired by this, a displacement vector depression angle model based on the PIM is proposed innovatively; the direction of horizontal displacement vector is determined according to the special law of the subsidence basin. The incident angle and azimuth of the radar beam are known in a specific mining area. Finally, the surface displacement vector is obtained by combining the LOS deformation of InSAR with the included angle. The surface displacement vector can also be converted into 3D deformation in vertical, east–west, and north–south directions. The settlement is calculated using the PIM in the central area of the mining area with a large deformation gradient. The combination of the proposed method and the PIM can obtain the complete 3D deformation information of the mining area, based on the weighted fusion method by distance. This study combines the proposed method with the PIM to explore the Shangwan Mine using 3D surface deformation information of the mining area. The settlement results are verified by the measured leveling values, and the results show that this method can achieve an efficient and accurate extraction of the surface deformation of the mining area, especially with higher subsidence monitoring accuracy in the edge area of the subsidence basin.

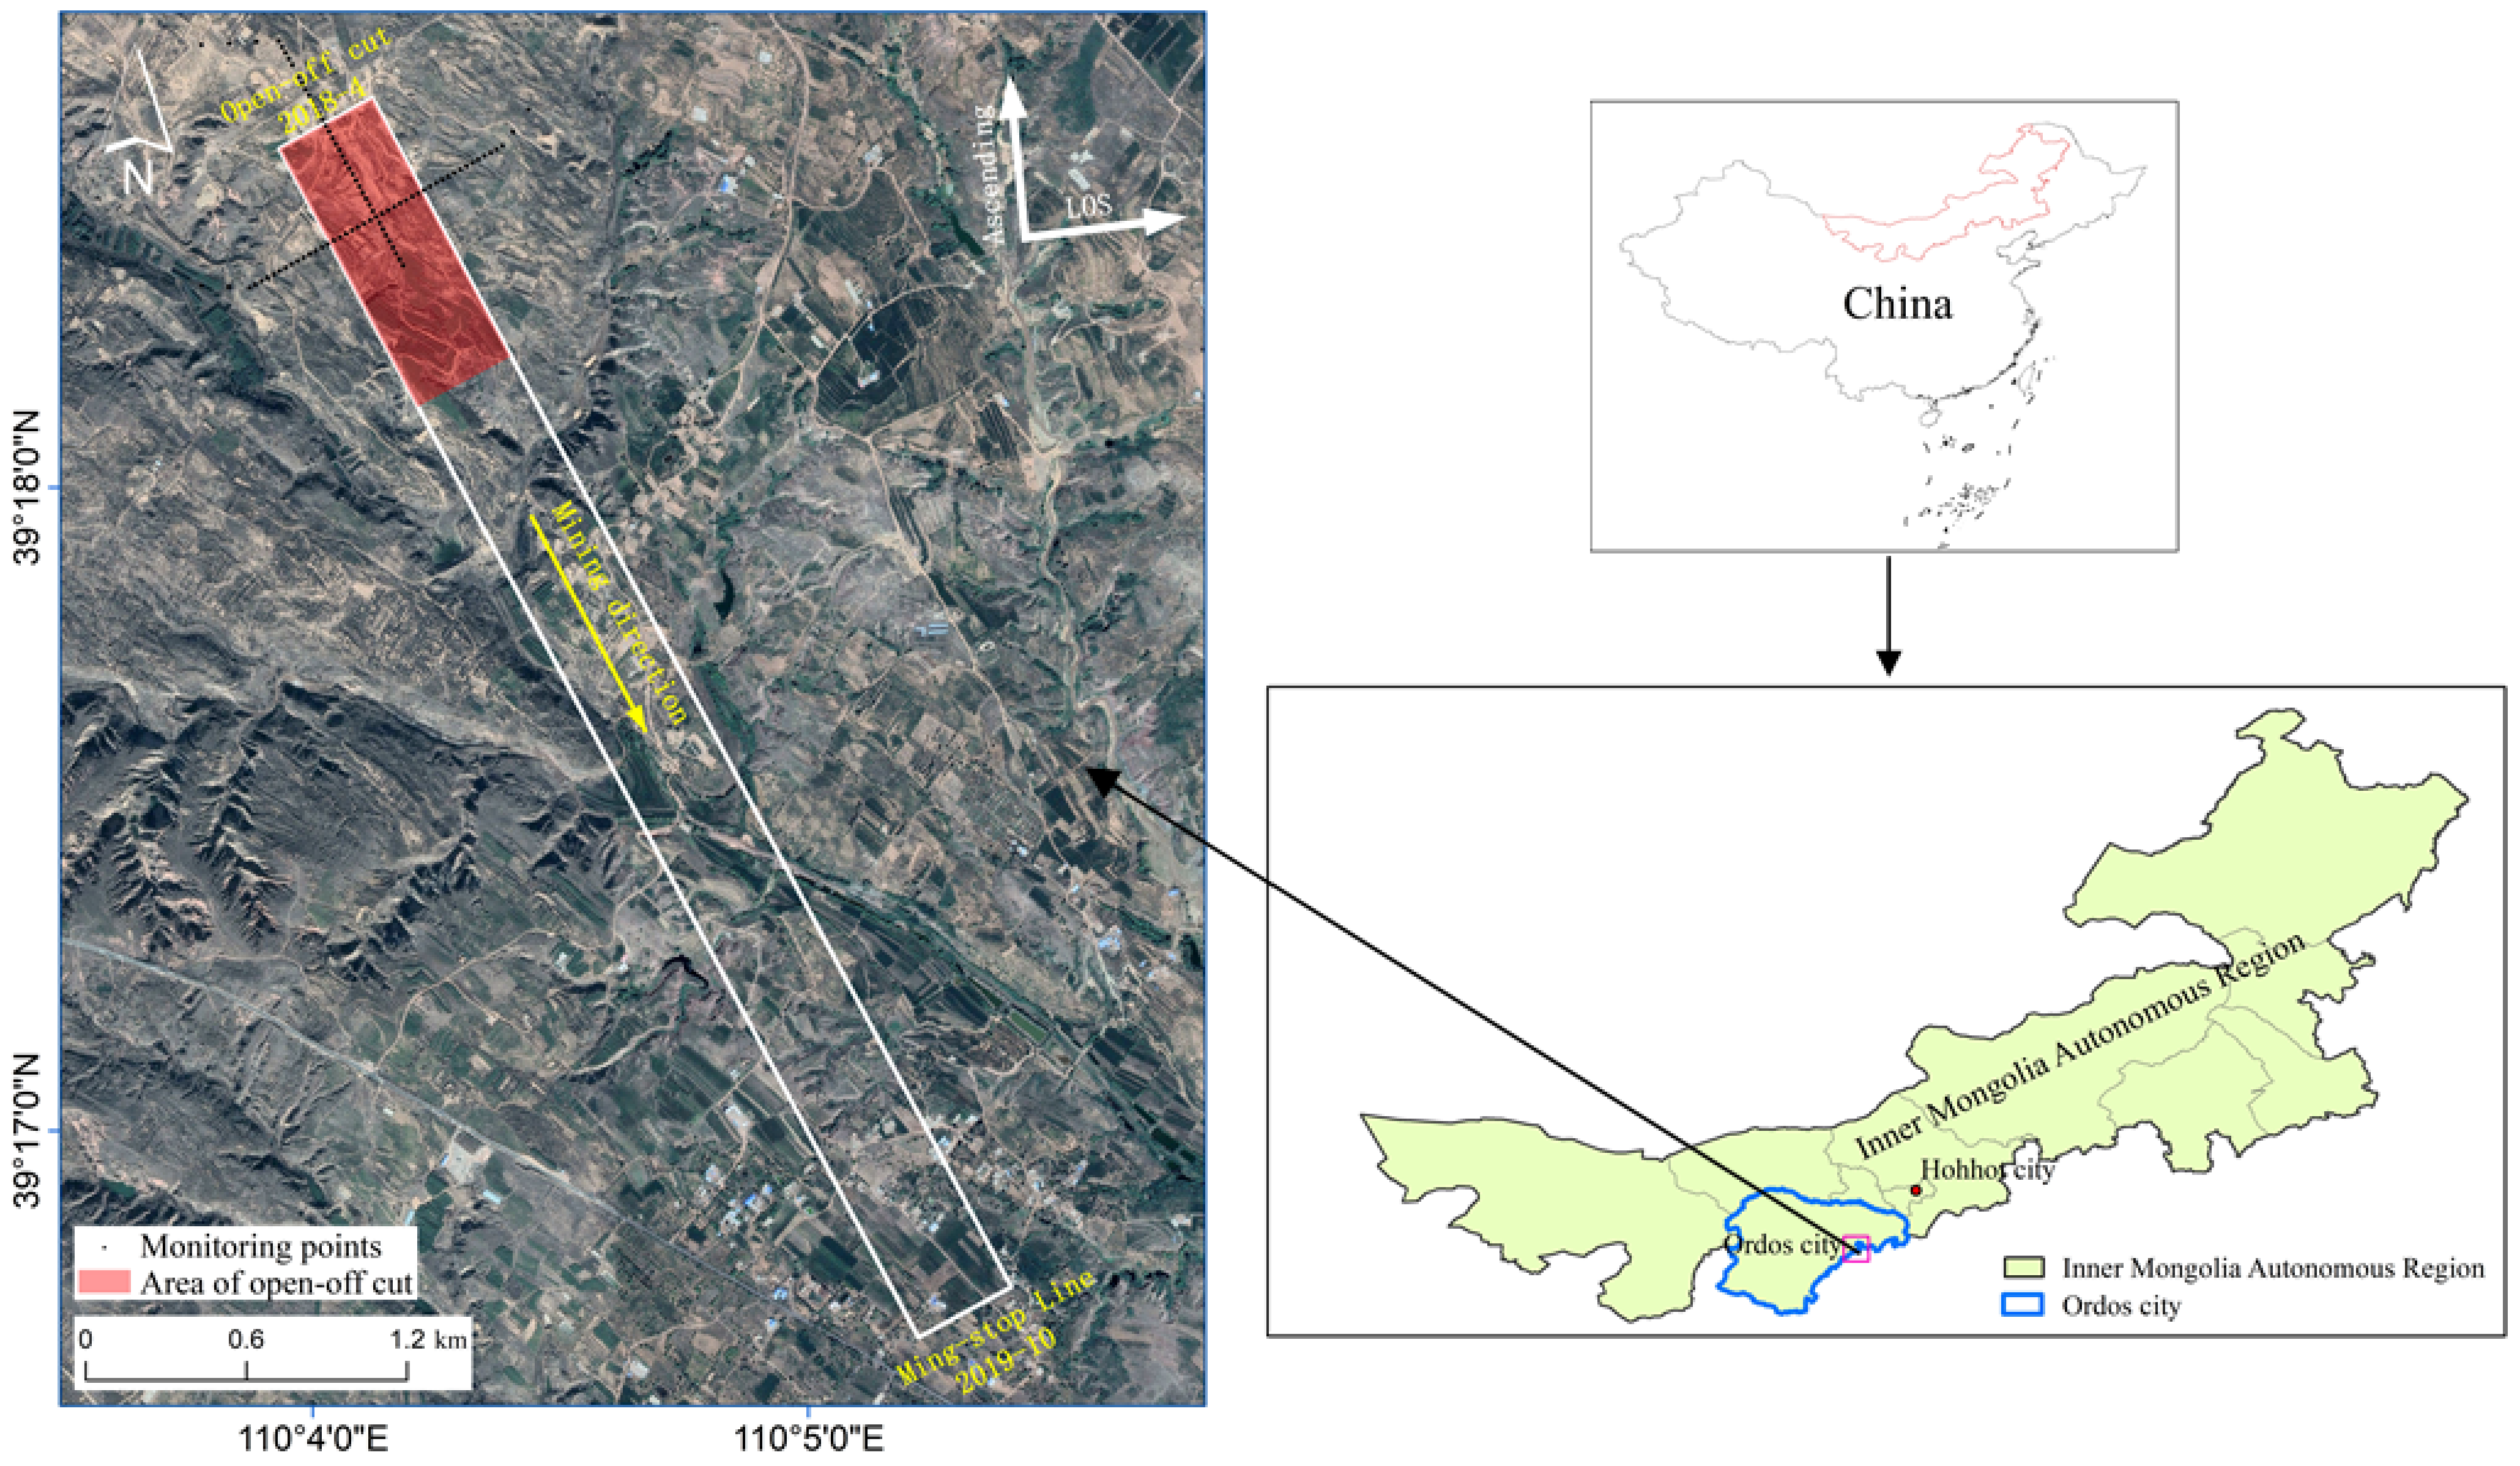
2. Study Areas and Data Source

The Shangwan Coal Mine is one of the main production mines of Shendong Coal District by Shenhua Group Co. It is located in Ejin Horo Banner, Ordos City, with an area of about 62 square kilometers and geological reserves of about 1.23 billion tons. The mining area is a semi-arid and arid zone in the transition from arid grassland to desert grassland, and it belongs to a water-eroded gully landform that is windy and sandy all year round. The vegetation is mainly sandy and xerophytic semi-shrub vegetation and grassland. A working face of Shangwan Coal Mine is the study area, with a length and width of about 5000 m × 300 m, the average thickness of the coal seam is 9 m, the design mining height is 8.6 m, the dip angle of the coal seam is about 1~3° [35], the mining depth is 150 m~250 m, and the average daily advance speed is about 14 m. Figure 1 shows the geographical scope and basic situation of the study area. The red part is the area near the open-off cut, with two observation lines of strike and dip on it. The upper right corner is the orbit direction and the LOS direction of the Sentinel-1 SAR data that are used in this paper.
Sentinel-1 satellite is the two earth observation satellites of the Copernican program of the European Space Agency (ESA). It carries a C-band synthetic aperture radar, which can continuously image in all weather, and plays an important role in topographic mapping, surface deformation monitoring, and related fields. Sentinel-1 data can be downloaded from the ESA official website for free, which has a revisit cycle of 12 d, and the precise orbit data AUX_ POEORB are used to correct the track information. The 12.5 m resolution ALOS DEM can be downloaded from the ASF DAAC website to simulate the terrain phase. In this paper, the slant distance single-look complex data (IW SLC) of 35 ascending orbits Sentinel-1A interferometric wide swath (IW) strip mode covering the mining area are used, and the time span is from 31 March 2018 to 13 May 2019. The basic parameters of Sentinel-1A can be seen in Table 1.
The field measured values for verification of the proposed method are obtained from the leveling and GNSS technology. Images from the field study are shown in Figure 2.

3. Methodology

3.1. Basic Theories of InSAR Technology and PIM

InSAR technology uses conjugate multiplication of two SAR images and covers the same area with small geometric differences to obtain the interferometric phase φ expressed by (1). The DInSAR technology uses InSAR interferometric phase and DEM simulation phase for difference to eliminate the influence of terrain factors and obtain the surface deformation information of the region.
φ = φ f l a t + φ t o p o + φ d e f + φ o r b i t + φ a t m + φ n o i s e
In the equation, the flat ground phase φ f l a t can be removed by accurately calculating the baseline length. Moreover, the terrain phase φ t o p o can be removed using the terrain phase simulated by DEM. The phase φ o r b i t caused by orbit error can be eliminated using precise orbit data. The φ atm and ϕ n o i s e are the atmospheric delay phase and noise phase, respectively, which can be attenuated by phase filtering. Finally, the deformation phase can be separated.
SBAS-InSAR is effective for analyzing distributed targets [10,11,12,13,14,15] and for obtaining surface deformation information in mining areas.
SBAS-InSAR uses the multiple main image DInSAR interferometric pairs to reconstruct the InSAR time-series interferometric phase of highly coherent points to extract the surface deformation information [19,20,21,22,23]. Assuming N + 1 SAR images, one image is selected as the super main image, and the other N scenes are selected as the secondary images for registration and resampling. Then, several interference pairs according to the spatiotemporal baseline threshold are obtained. We perform interference, flattening, terrain removal, filtering, and unwrapping on the interference pairs to obtain the ith interferogram at time tA and tB (tB > tA). Then, the phase value at pixel x can be expressed as the following:
δ ϕ i ( x ) = ϕ ( t B , x ) ϕ ( t A , x ) 4 π λ [ d ( t B , x ) d ( t A , x ) ] + Δ φ i t o p o ( x ) + Δ φ i r e s ( x )
where d ( t B , x ) and d ( t A , x ) are the LOS deformation of the pixel at tA and tB relative to the initial time; λ is the wavelength; Δ φ i t o p o ( x ) is the residual phase derived from DEM inaccuracy; and Δ φ i r e s ( x ) represents the error phase. After flattening and terrain removal, Formula (2) can be converted to the form as follows:
d ( t B , x ) d ( t A , x ) = ν i ( t B t A )
where ν i is the average deformation rate of LOS during the period from tA to tB. Formula (3) can be converted into matrix form as follows:
A ν = σ φ
where A is a coefficient matrix with rank deficiency, which can be solved by SVD algorithm. After ν is reached, then the cumulative deformation can be obtained by calculating the integral of ν during each time period.
Theoretically, the maximum deformation gradient dmax monitored by InSAR technology is related to the radar wavelength λ and SAR image resolution μ . The expression can be written as d max = λ / ( 2 μ ) . For Sentinel-1, the resolution is 20 m × 20 m after multi-look, and so the corresponding dmax is 1.4 × 10⁻³. However, during the practical applications, InSAR is affected by issues, such as spatiotemporal, decoherence, and orbital error, which reduce the maximum deformation gradient that can be monitored by InSAR. Baran et al. [36] have attempted to solve this problem using relationship influence of coherence on the deformation gradient of InSAR technology, which has been presented as follows [36]:
D max = d max + 0.002 ( γ 1 )
where Dmax is the maximum deformation gradient that can be monitored by InSAR and γ is the coherence. For Sentinel-1, when the coherence coefficient is 0.3, the Dmax = 0, that is, when the coherence coefficient is less than 0.3, InSAR can no longer monitor the effective deformation. If there are n interferometric pairs in the monitoring period, the maximum deformation gradient to be monitored in this period is n D max .
According to PIM, the prediction formulas for the subsidence w(x) and the horizontal movement u(x) of the points on the strike line of semi-infinite mining are presented in (6) and (7), respectively. Moreover, the prediction formulas for the subsidence w ( x , y ) of points on the subsidence basin and the horizontal movement u ( x , y , φ ) along the direction φ are presented in (8) and (9), respectively:
w ( x ) = w 0 2 [ e r f ( π r x ) + 1 ]
u ( x ) = b w 0 e π x 2 r 2
w ( x , y ) = 1 w 0 w ° ( x ) w ° ( y )
u ( x , y , φ ) = [ u ° ( x ) w ° ( y ) cos φ + u ° ( y ) w ° ( x ) sin φ ] w 0
among them,
w ( x ) = w ( x ) w ( x l ) w ( y ) = w y ; t 1 w y L ; t 2 u ( x ) = u ( x ) u ( x l ) u ( y ) = u y ; t 1 u y L ; t 2
where w 0 is the maximum subsidence value, wo(x) is the subsidence value of the points whose abscissa on the strike main section is x when the strike is fully mined, wo(y) is the subsidence value of the points whose abscissa on the strike main section is y when the strike is fully mined, and the character behind the semicolon in the right bracket of the equation represents the parameters. For example, t1 in w(y; t1) represents the corresponding parameters of the mountain up or mountain down boundary; uo(x) is the horizontal movement value of the points whose abscissa on the strike main section is x when the strike is fully mined. Moreover, uo(y) is the horizontal movement value of the points whose abscissa on the strike main section is y when the strike is fully mined; r is the main influence radius, and b is the horizontal movement coefficient. Additionally, l and L are the calculating length of the strike and dip, respectively, and φ is the angle of counterclockwise rotation in the positive direction of the x-axis.

3.2. Research Methods

Firstly, we use the PIM to achieve horizontal displacement vector and the vertical displacement vector, and then, the displacement vector depression angle is obtained. Next, the LOS direction and LOS deformation can be determined by the InSAR technology. Then, combined with the LOS deformation of InSAR, the incident angle and azimuth of the radar beam, and the direction of surface horizontal displacement vector, we can acquire the angle between LOS and surface deformation vector. After that, the surface deformation vector is obtained. Finally, after fusing the results of InSAR+ vector depression angle model and PIM, the surface displacement vector of the whole basin could be determined. The specific flow is shown in Figure 3.

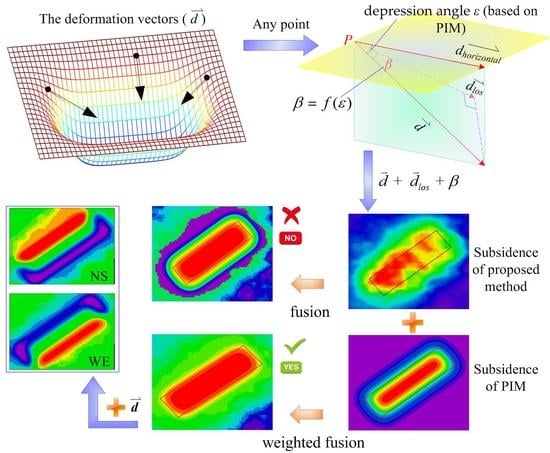
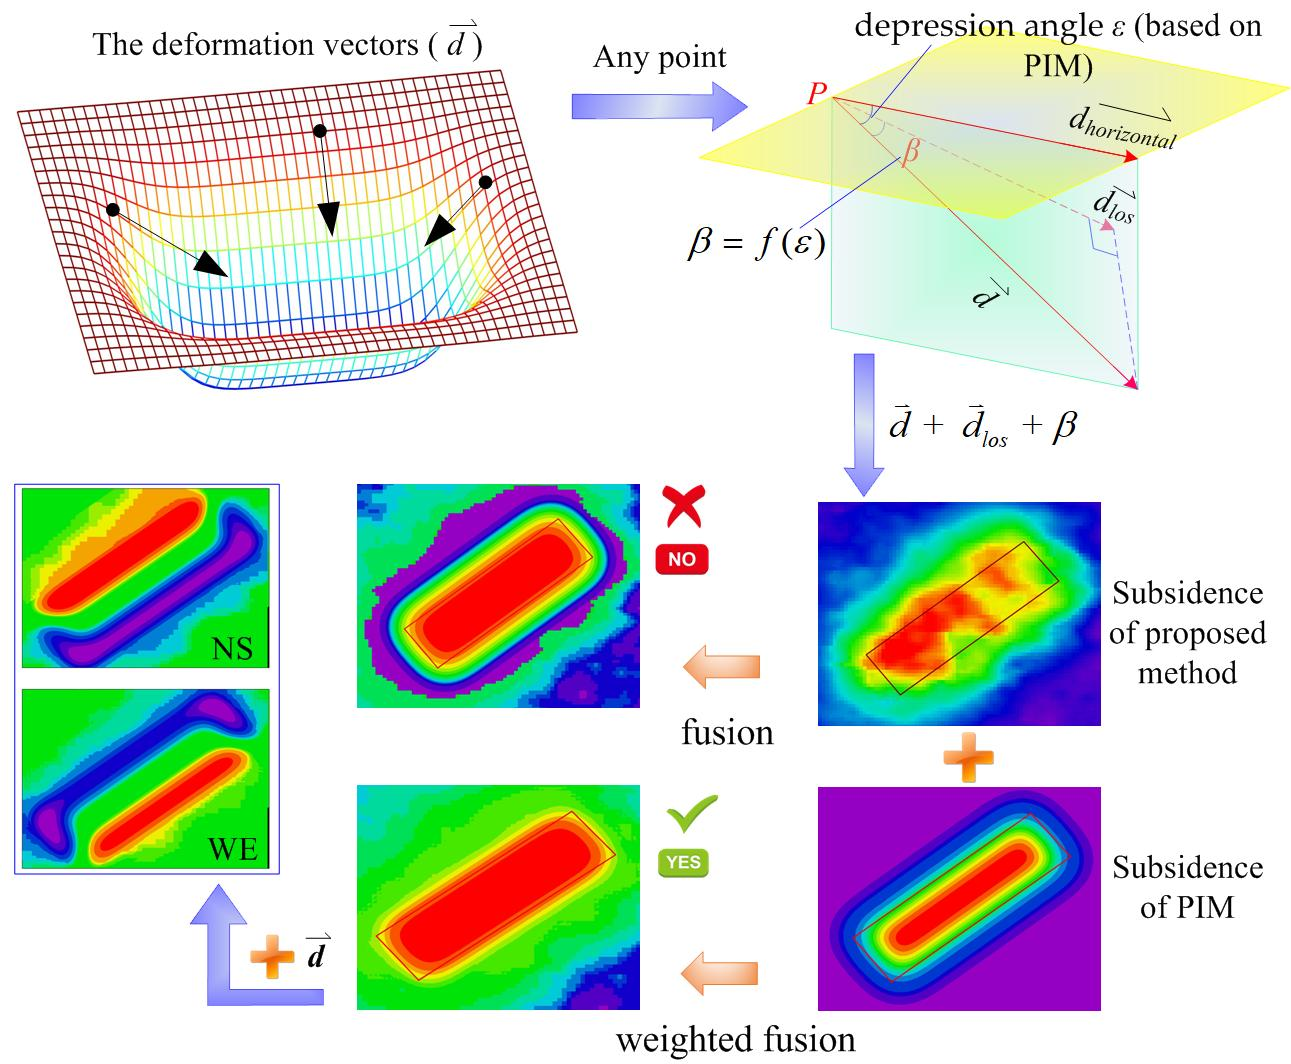
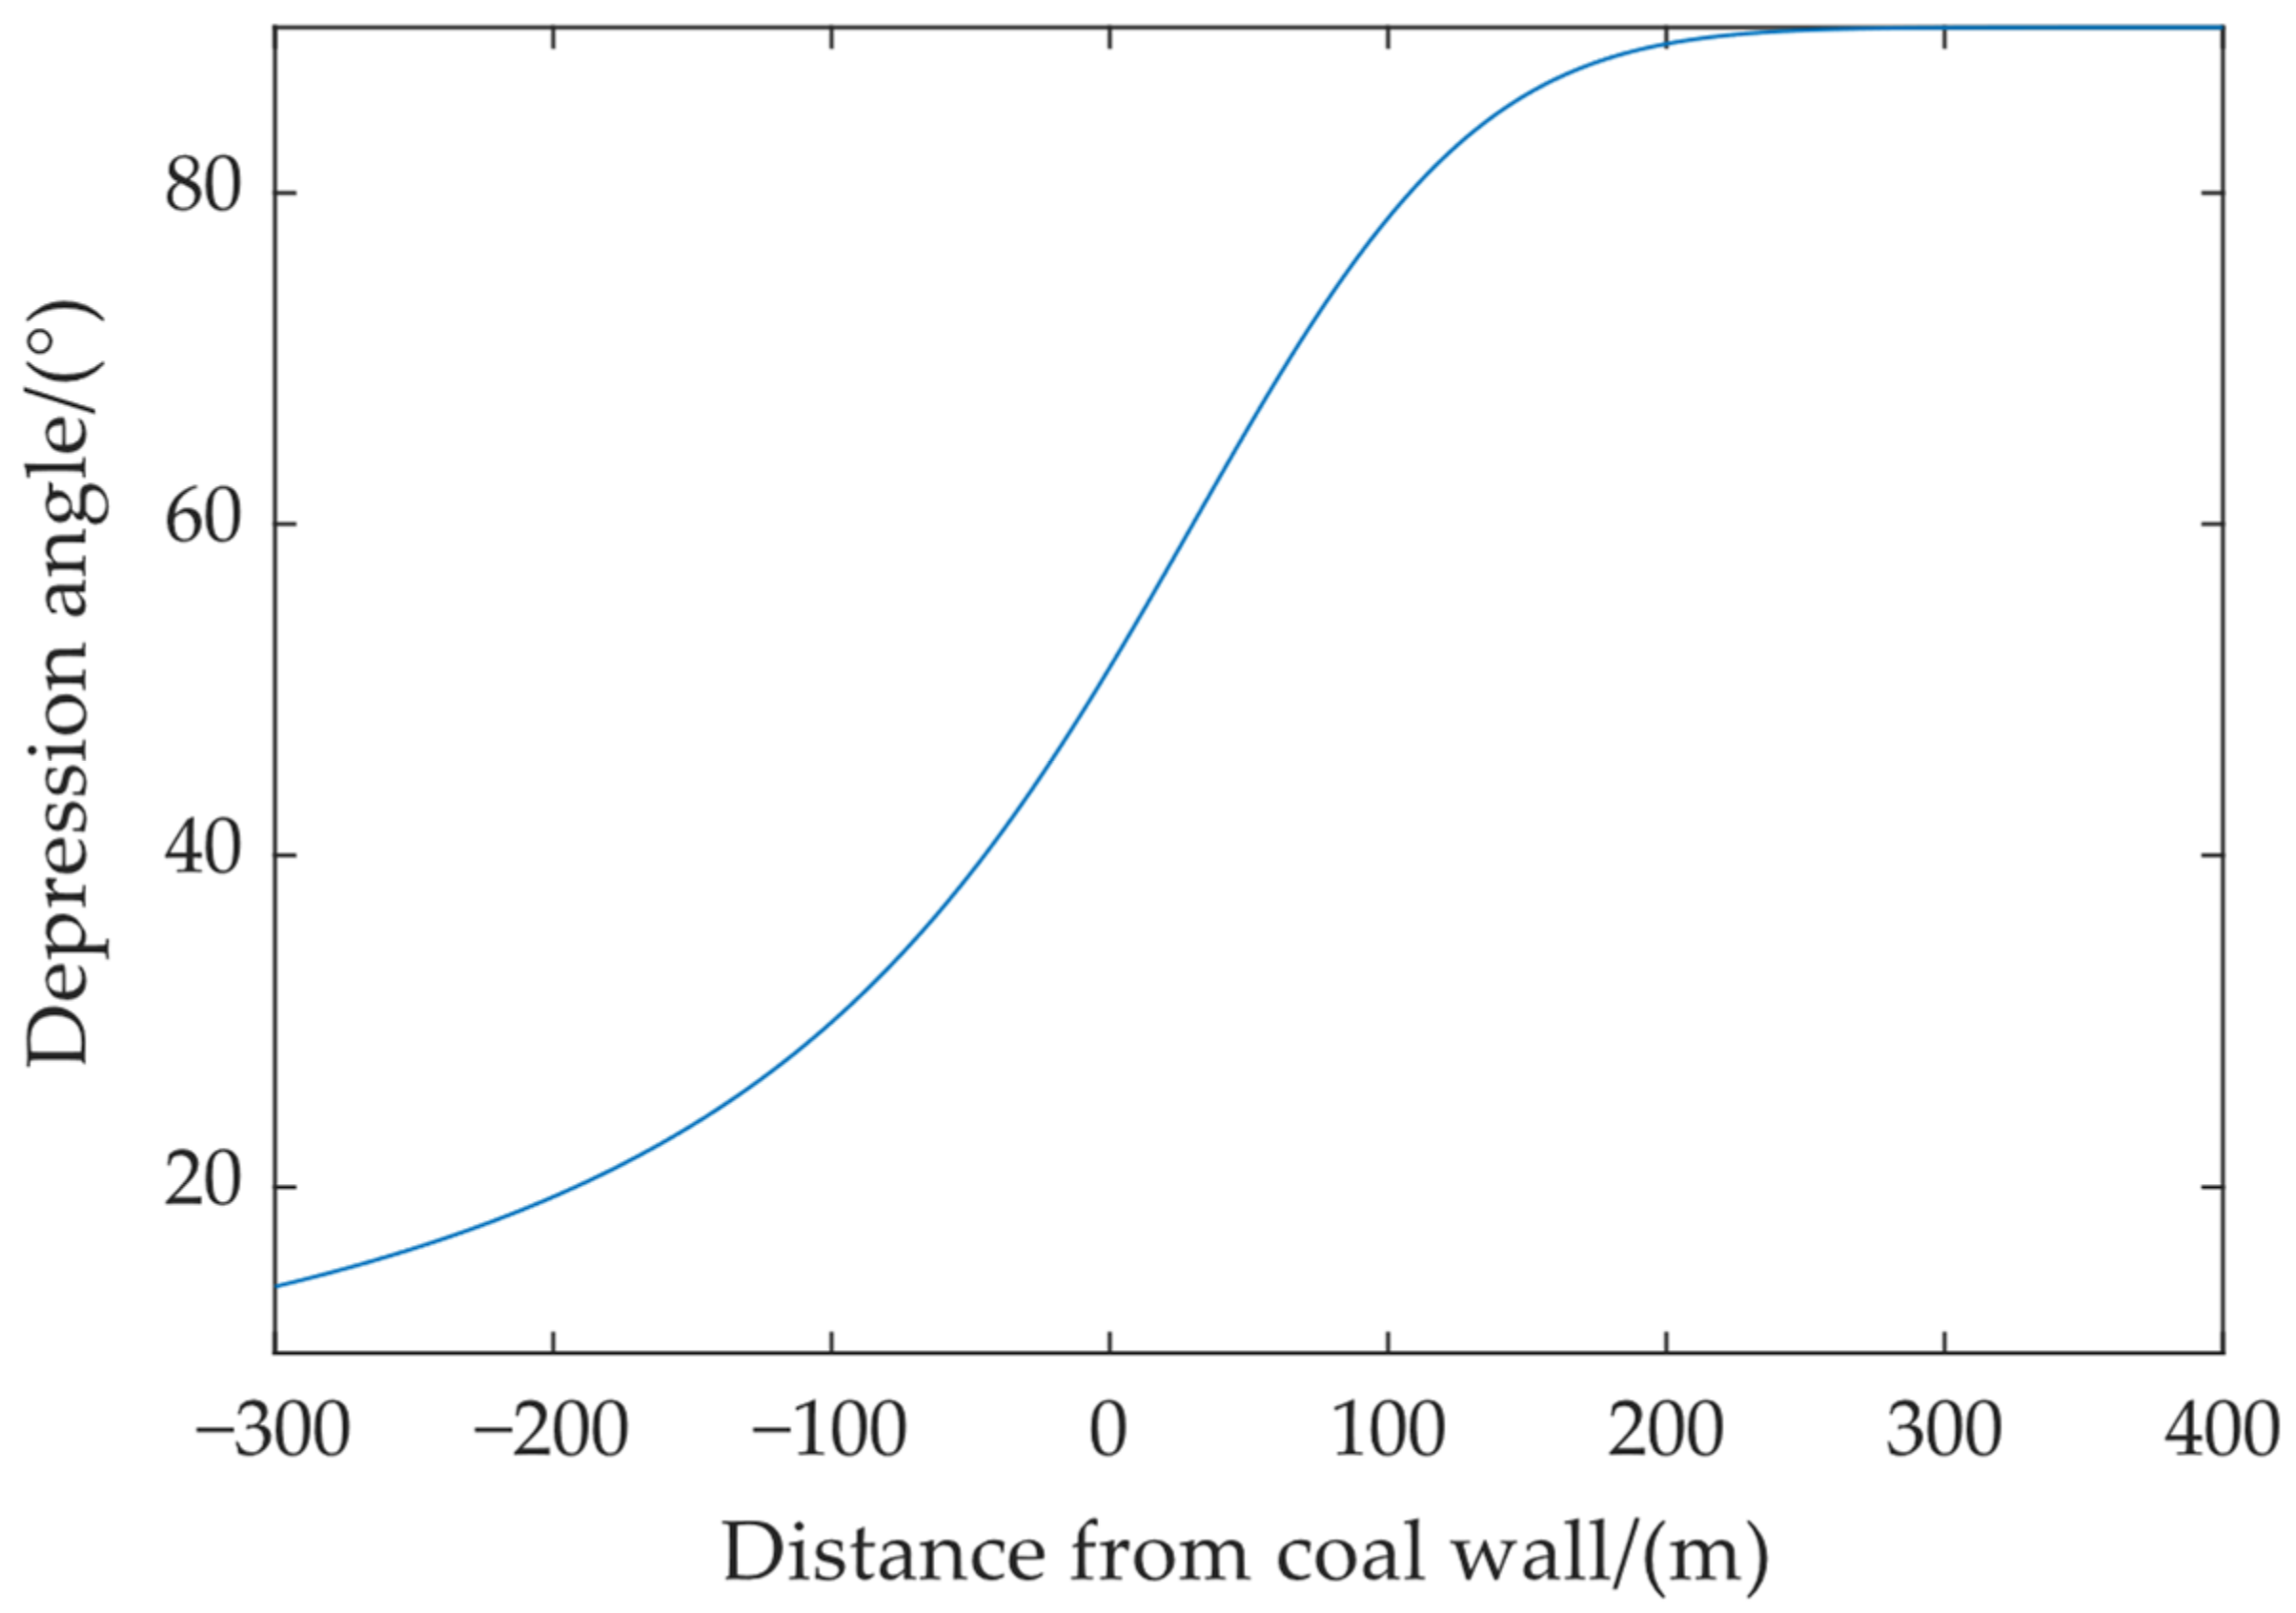
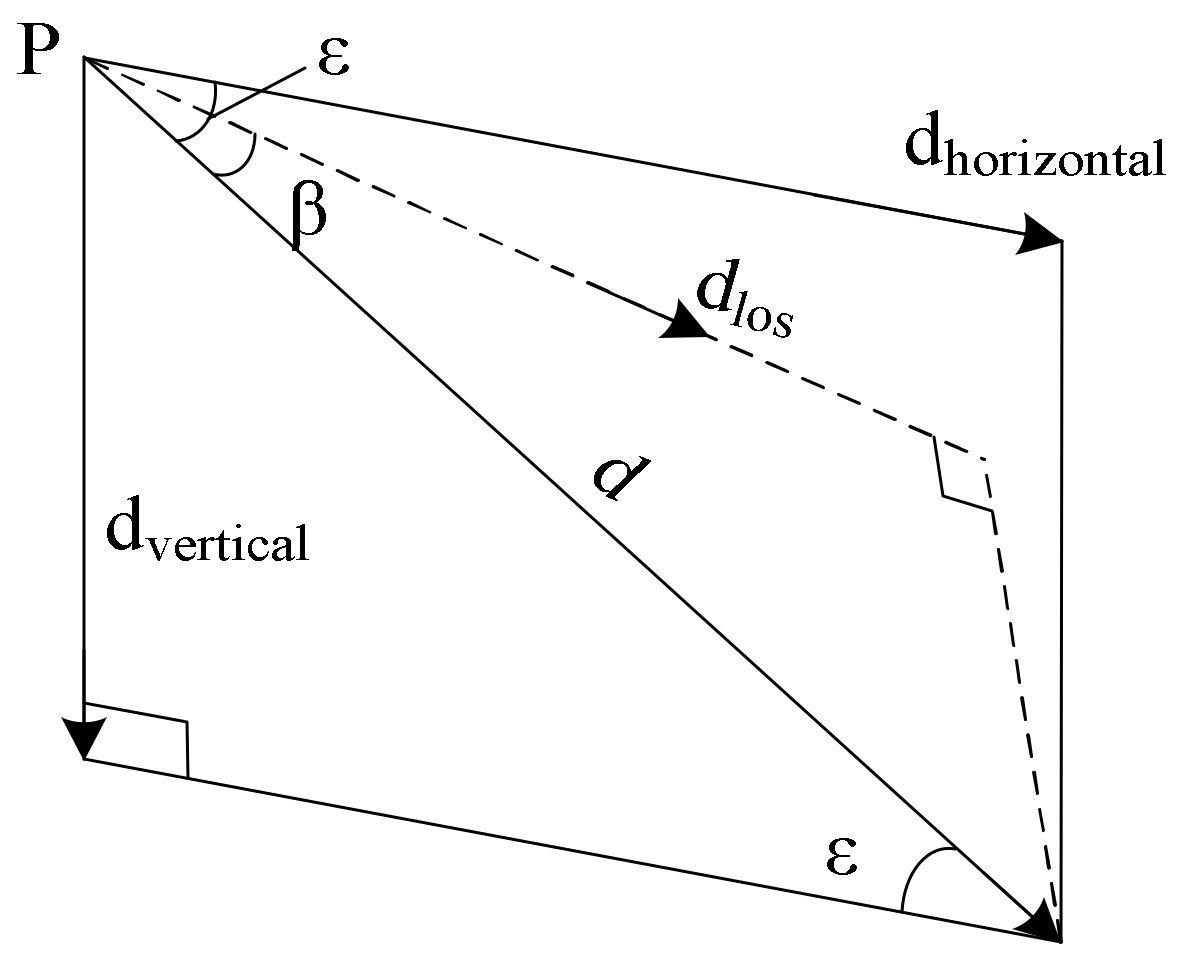
3.2.1. Depression Angle Model of Surface Displacement Vector

The displacement vectors of all points on the surface of the mining subsidence basin point to the center of the goaf, and the subsidence of surface points increases gradually from the periphery of the mining subsidence area to the center of the subsidence basin [29]. The depression angles are the surface displacement vector of the sinking basin points to the center of the basin. This depression angle is downward, which includes the angle between the direction of the displacement vector and the horizontal plane. The depression angles of the displacement vectors also have the same characteristics. The horizontal movement in the fully mined area is insignificant, and it can be considered that the surface only sinks. Currently, the depression angle is approximately 90°, and the depression angle gradually increases from 0° to 90° from the edge of the mining area to the fully mined area. Figure 4 shows the change in trends of angles of the depression, showing the points on the main section surface and the horizontal distance between the surface point and the coal wall.
The surface deformation caused by underground coal mining has obvious deformation laws when the mining depth and mining thickness are large. The subsidence basin of the rectangular coal mining face is nearly elliptical [37], and the depression angles have similar distribution characteristics in space. Therefore, the spatial distribution of depression angles can be described by referring to the subsidence basin model. Wang et al. [38] proposed a surface subsidence basin model that is more consistent with the actual subsidence after analysis, and the expression is
w ( x , y ) = w 0 1 + ( x 2 a 2 + y 2 b 2 ) n 8
where n is the model parameter. This formula is applicable to the coal seam with small dip angle. When the dip angle of the coal seam is large, the dip direction of the subsidence basin is asymmetric, and two models can be constructed by replacing the parameters b in Equation (11) with b1 and b2 to describe the surface subsidence in the uphill and downhill directions, respectively. According to the analysis of Wang Junbao, the model has good applicability when the working face is short and the mining is insufficient [38]. If the working face is long, its accuracy needs further discussion. Assuming that there is a working face with a length and width of L 1 × L 2 , and the main influence radius r is 150 m, the half lengths of the basin are 300 m and 1000 m, respectively (at this time, the strike main section has reached the ultra-full mining). The obtained subsidence basin according to Formula (11) is shown in Figure 5.
As shown in Figure 5, the working face within the range of the incline main section is within the settlement range; whereas the edge areas at both ends of the strike main section are quite different from the actual subsidence basin. Moreover, some areas of the working face have been in the non-subsidence area outside the arc, which is unreasonable. This reflects that the longer the working face, the longer and flatter the ellipse of the subsidence basin, and the greater the difference between the settlement of the edge areas and the actual settlement. When L1 is 1000 m more than 300 m of 2r, it is shown from the PIM that the main section of the strike has achieved super-full mining, and the surface subsidence in this direction has a flat bottom, which is consistent with the actual situation, as shown in Figure 6. Meanwhile, Wang Junbao’s [38] basin model is funnel-shaped, and the maximum subsidence value is in the center of the basin, which is inconsistent with the subsidence basin of the full mining working face with a flat bottom This shows that this model may only apply to the case where the strike and dip main sections are insufficient for mining.
From the above analysis, PIM is more applicable in the prediction of mining subsidence basin. Thus, the PIM applicability in the depression angle model is discussed. The displacement vector depression angles ε of points on the strike line of semi-infinite mining is taken as an example, which is expressed by PIM and expressed by (6) and (7). Meanwhile, the depression model on the strike line is shown as follows:
tan ( ε ) = w ( x ) u ( x ) = e r f ( π r x ) + 1 2 b e π x 2 r 2
The settlement at the inflection point (x = 0) of the PIM subsidence curve is one half of the total subsidence, and tan ( ε ) of the depression angle at the inflection point is ( w 0 / 2 ) / u 0 = 1 / ( 2 b ) . The tan ( ε ) of (9) at x = 0 is 1 / ( 2 b ) , which is consistent with the actual situation. However, if the PIM is directly used to describe the depression angle, the depression angle at the inflection point is one half of the maximum value, which is 45°, and tan ( 45 ) equals 1, which is not necessarily equal to 1/(2b), indicating that the PIM is not necessarily suitable for the depression angle model. Figure 7 shows the schematic diagram of the comparison between the two methods. The depression model in (12) is consistent with the actual situation at the inflection point, and the convergence in the edge area is gentler than that of PIM, which is conducive to the depression angle estimation in the edge area.
In order to obtain the depression angles of the displacement vectors of any points on the surface of a subsidence basin, the maximum horizontal displacement of the surface points should also be known. The maximum inclination directions of the surface points are the actual horizontal movement directions of the surface points. The inclination i ( x , y , φ ) of the surface points along the direction φ is the first derivative of the subsidence [29], namely,
i ( x , y , φ ) = i ° ( x ) w ° ( y ) cos φ + i ° ( y ) w ° ( x ) sin φ w 0
where i°(x) is the inclination value of the points whose abscissa is x on the strike main section when the dip main section is fully mined; i°(y) is the inclination value of the points whose abscissa is y on the dip main section when the strike is fully mined. Set the maximum inclination direction as φ 0 , and according to the extreme value principle, we will achieve the following [29]:
i ( x , y , φ ) φ φ = φ 0 = 0
We substitute (14) into (13) to obtain the horizontal displacement direction of the surface [29]:
φ 0 = arctan w ° ( x ) i ° ( y ) w ° ( y ) i ° ( x )
The horizontal displacement of the actual surface displacement direction is obtained by substituting φ 0 into (9). Then, the depression angle ε of the displacement vector of any point on the surface is expressed according to (8) and (9) to obtain the following:
tan ( ε ) = w ( x , y ) u ( x , y , φ 0 ) = w ° ( x ) w ° ( y ) u ° ( x ) w ° ( y ) cos φ 0 + u ° ( y ) w ° ( x ) sin φ 0
The creatively proposed model in the surface displacement vector depression model of the subsidence basin is shown in (16). For semi-infinite mining of nearly horizontal coal seams, the maximum inclination direction φ 0 of the ground surface points on the strike line equals 0°. By substituting φ 0 into (16), then (12) can be obtained after simplification.
Similarly, φ 0 on the dip main section equals 90°.When the strike main section is fully mined, and the dip main section is limitedly mined, the depression angle ε of the displacement vector can be expressed as the following:
tan ( ε ) | φ 0 = 90 ° = 0.5 e r f ( π r 1 y ) 0.5 e r f ( π r 2 ( y l ) ) b e π y 2 r 1 2 b e π ( y l ) 2 r 2 2
In this formula, l is the calculating length when the dip main section is limitedly mining.

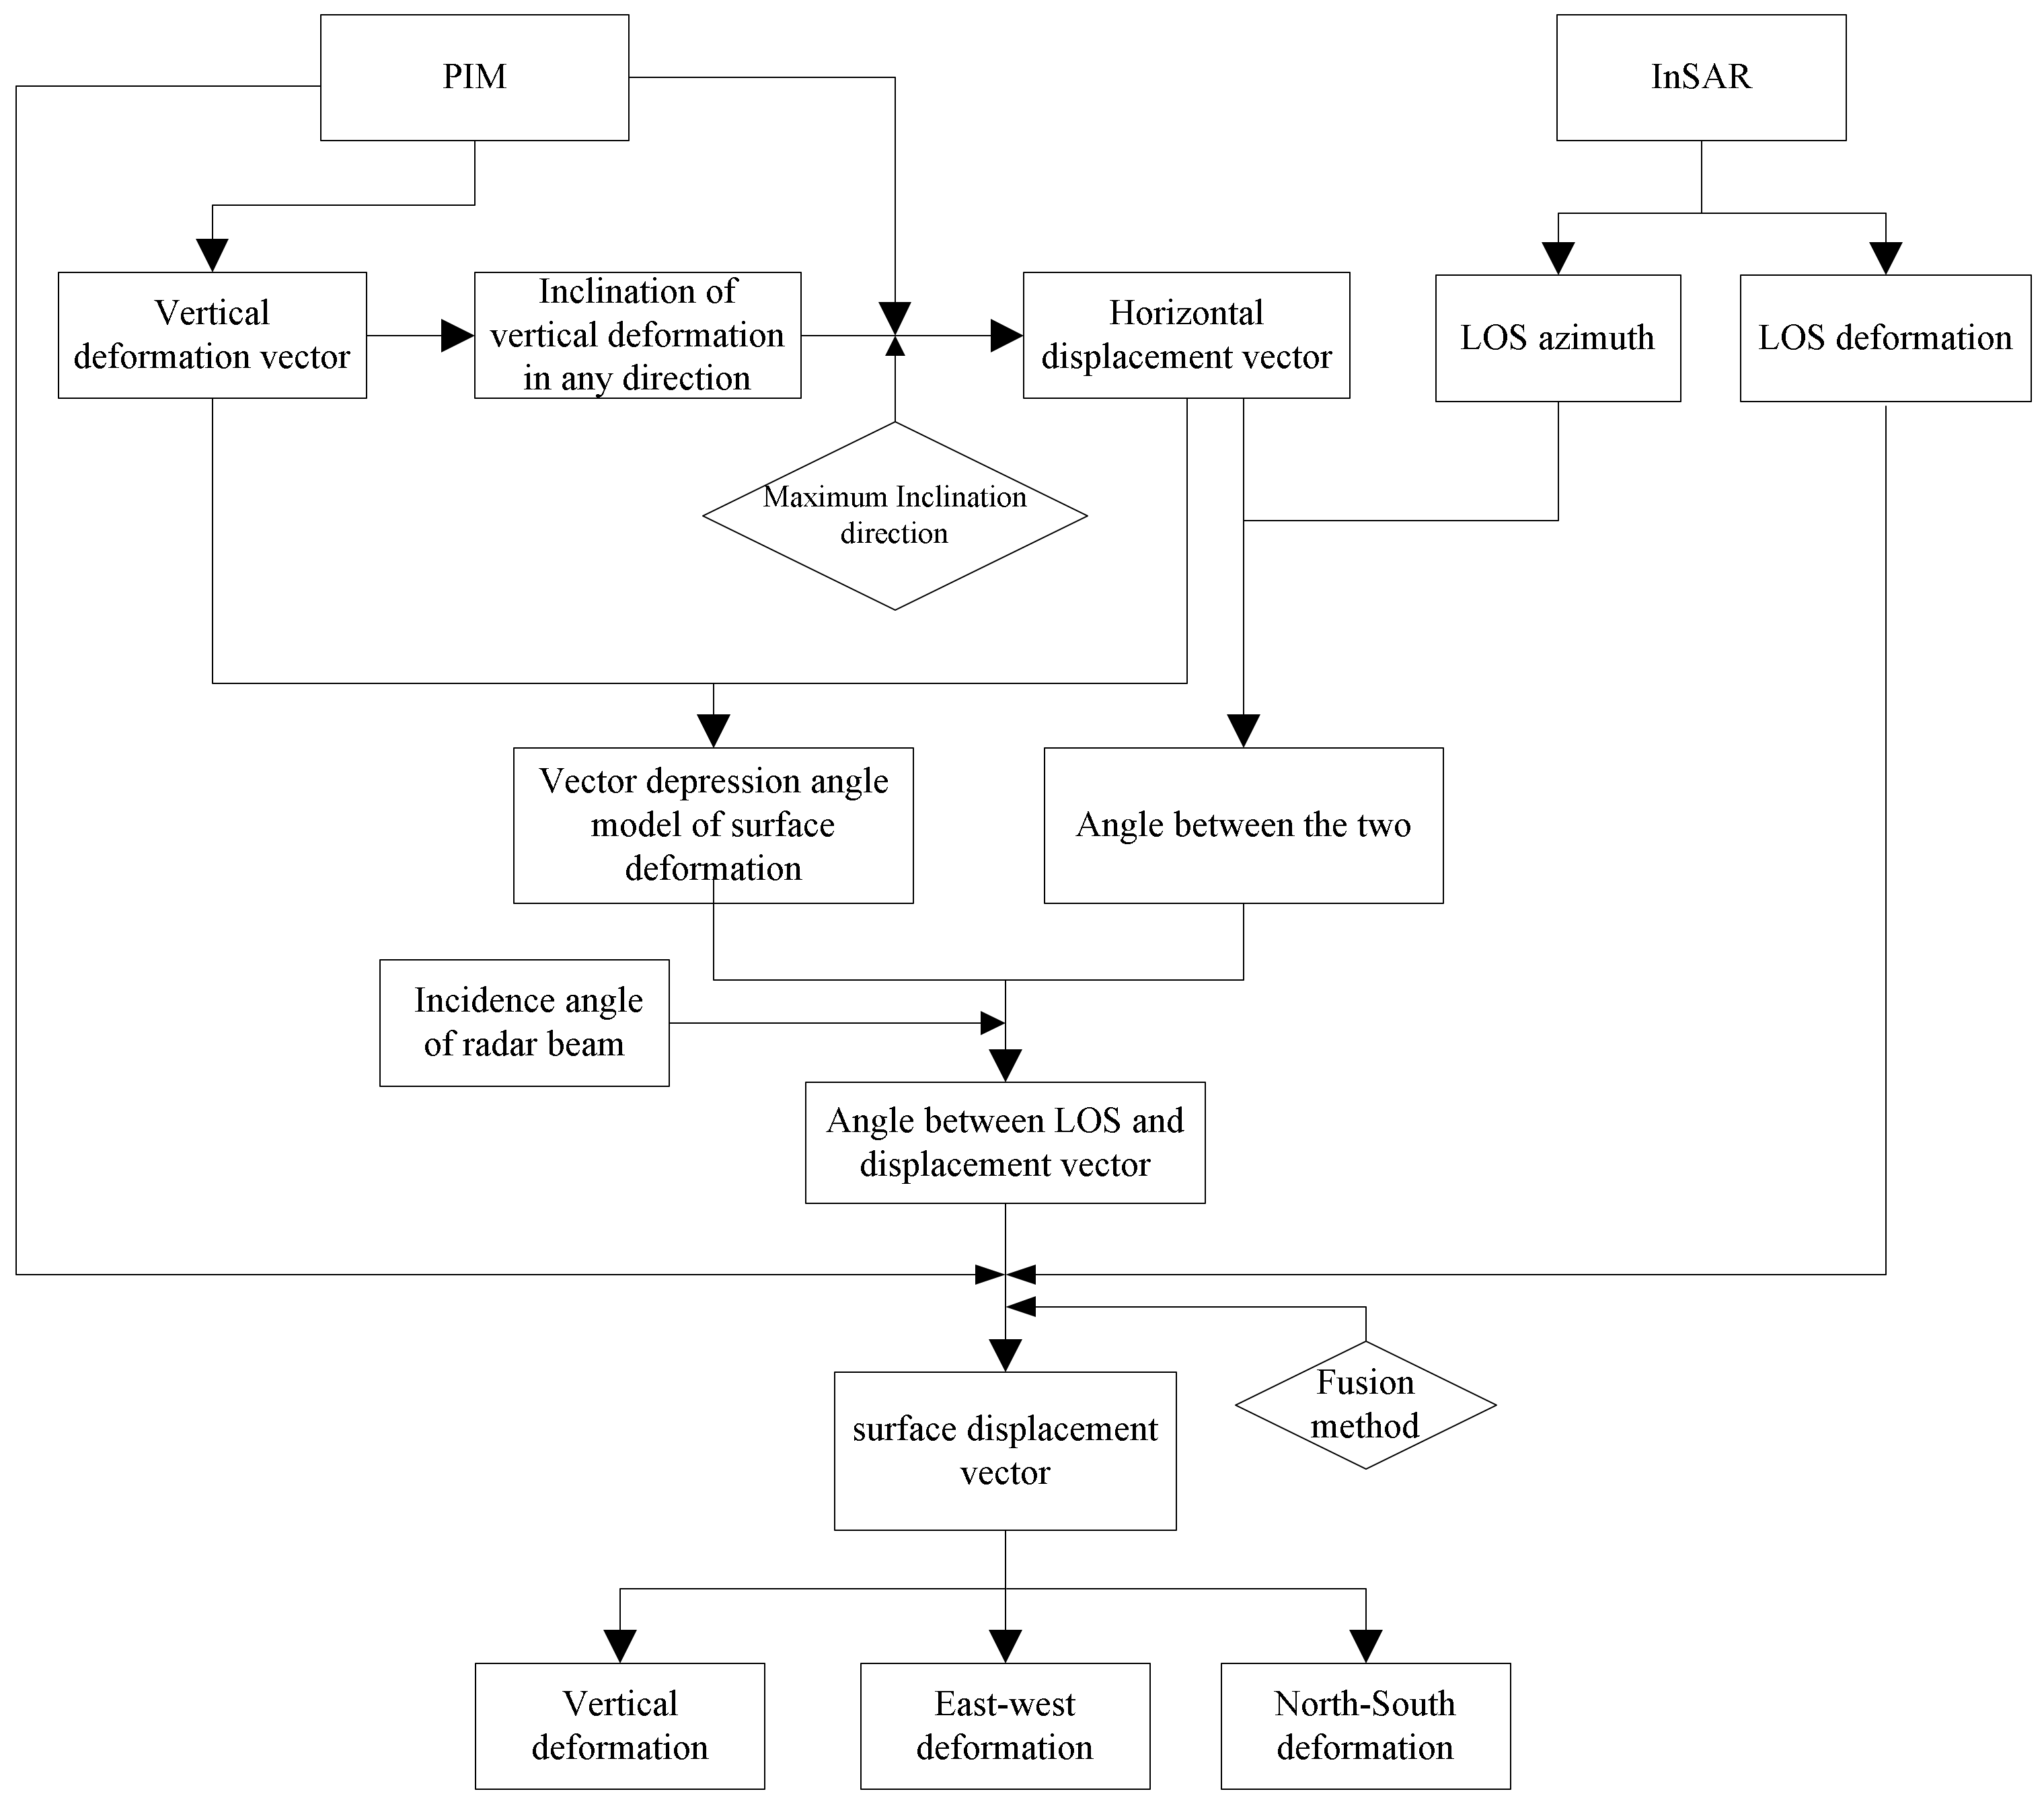
3.2.2. Method for Calculating the Surface Displacement Vector Combined InSAR with the Depression Angle Model

Surface point P is assumed to be any point on the surface of the subsidence basin after stabilization to obtain the true surface deformation, which is based on the LOS deformation obtained by InSAR technology. The vertical deformation vector d v e r t i c a l and horizontal displacement vector d h o r i z o n t a l are the vertical and horizontal components of the 3D displacement vector d ; d l o s is the deformation vector in the LOS direction, and ε is the depression angle of the surface displacement vector d (the angle between d and the horizontal plane). Moreover, β is the angle between the surface displacement vector and LOS direction, and their spatial relationships are shown in Figure 8.
As shown in Figure 8, the projection of the surface displacement vector d in the LOS direction is the deformation monitored by InSAR. The expression is shown in Formula (18):
d l o s = d cos β
According to the law of the displacement vectors of surface points in the subsidence basin, they all point to the center of the goaf. It is therefore considered that the horizontal movement directions of the surface points from the edge of the subsidence basin to the nearest maximum subsidence points. For instance, the surface points on line ab in Figure 9 have the same horizontal movement directions pointing to the nearest maximum subsidence point, which is consistent with the maximum inclination direction (determined by (15)) of the surface subsidence. This shows that this law can determine the horizontal movement direction of any point on the surface of the subsidence basin.
In Figure 8, the included angle β between the LOS deformation vector and surface displacement vector changes with the depression angle ε, making the functional relationship established between the dependent variable β and the independent variable ε. According to the spatial geometric relationship, the following relationship is obtained:
cos β = cos θ sin ε + sin θ cos ε cos γ
where γ is the difference between the LOS azimuth and the azimuth of d h o r i z o n t a l , which is the angle between the LOS projection line on the horizontal plane and the horizontal displacement vector of the surface point, θ is the angle of incidence, which is the angle between the radar beam and the vertical line. Thus, (19) reflects that β can be obtained if ε and γ are known. The LOS azimuth of each pixel is determined for a SAR image, and the azimuth of the corresponding horizontal displacement vector d h o r i z o n t a l of the ground point can be determined according to the horizontal displacement characteristics of the working face based on (15). Then, γ is obtained. The depression angle ε can be obtained by PIM according to (16). The calculation formula of subsidence, based on the spatial relationship in Figure 8, is as follows:
d ver t i c a l = d l o s sin ε / cos β
From the above analysis, the surface subsidence and the 3D displacement vector are obtained based on ε, β, and the LOS deformation obtained from InSAR.

4. Results

4.1. Application Analysis of the Depression Angle Model

The horizontal displacement is calculated according to the measured leveling data of the working face and the plane coordinates measured by GNSS-RTK. Taking the dip main section as an example, the displacement vector depression angle of the surface point is calculated. Then, we used the measured data to calculate the parameters of PIM, and we achieved the following parameters: [ q ; t a n β 1 ; b 1 ; S 1 ] = [0.7; 2.2; 0.37; 55] ( q , tan β 1 , b 1 , S 1 are subsidence factors, the tangent of the mainly affecting radius, the horizontal movement coefficient, and the deviation of inflection point, respectively), and substituted the parameters into (17). Figure 9 shows the depression angle that was calculated from the measured value and the depression angle that was predicted by the model. As shown in Figure 10, these depression angles have a high degree of coincidence; the determination coefficient R2 is 0.9981, and the root mean square error (RMSE) is 2.9°, indicating that the model has good applicability. As the working face is a nearly horizontal coal seam, the maximum subsidence point is located at the center of the basin, and the depression angle of the displacement vector of this point is 90°. The depression angle on both sides of the working face is smaller, revealing that the farther away from the mining area, the closer the surface point moves horizontally.

4.2. InSAR Deformation Monitoring in the Mining Area

The working face was mined from the end of March 2018 to September 2019. The time and space scope of the study was limited to 1 year near the open-off cut because mining in the adjacent working face started after June 2019 to eliminate the impact of mining in the adjacent working face. The 35 Sentinel-1A ascending SAR data were used to obtain the time-series subsidence basin in the study area, based on the SBAS InSAR technology. Then, the time-series cumulative subsidence results from 31 March 2018 to 13 May 2019 were obtained, as shown in Figure 11.
As shown in Figure 11, the working face (12,401) of mining started on 12 April 2018, and was monitored by InSAR. The maximum cumulative settlement in the LOS direction was 12 mm, indicating that the underground mining activities under the working face impacted the overburdened rock. With the continuous advance of mining in the working face, the area and amount of subsidence in the mining area continued to increase, and the extension trend was consistent with the mining direction of the working face. By 13 May 2019, the deformation of the edge area of the open-off cut in the working face was stable. The maximum cumulative settlement of the LOS measured by InSAR was 198 mm, which was far from the maximum settlement of 5500 mm measured by leveling. Two main reasons caused this: First, the C-band wavelength used by Sentinel-1A SAR data is short, and the maximum detectable deformation of adjacent pixels is theoretically half of the wavelength (half of the C-band wavelength is 2.8 cm). Moreover, the resolution after the multi-look of the Sentinel-1A SAR is 20 m, further limiting its ability to detect large gradient deformation. Second, the working face has the characteristics of being shallow and buried with high intensity surface movement and deformation, making the speed of advancement and subsidence very fast. In the center of the subsidence basin during the active mining period, the surface deformation exceeds the deformation range that can be monitored by InSAR within the 12 days revisit period of Sentinel-1A, rendering most of the deformation ineffectively monitored by InSAR. Figure 11 shows that the surface area on the left side has been uplifted (blue purple area) along the mining direction. However, the surface in this area is sinking, showing that with the effective monitoring area of InSAR, errors still show if the LOS deformation is used to replace the real surface subsidence, and sometimes this is completely inconsistent with the actual situation. The reason for the rise of InSAR results is that the direction of the surface displacement vector in this area is opposite to the direction of LOS, that is, the angle β is an obtuse angle. At this time, it can be seen from (18) that the sign of LOS deformation calculated by d is opposite to sign of d.

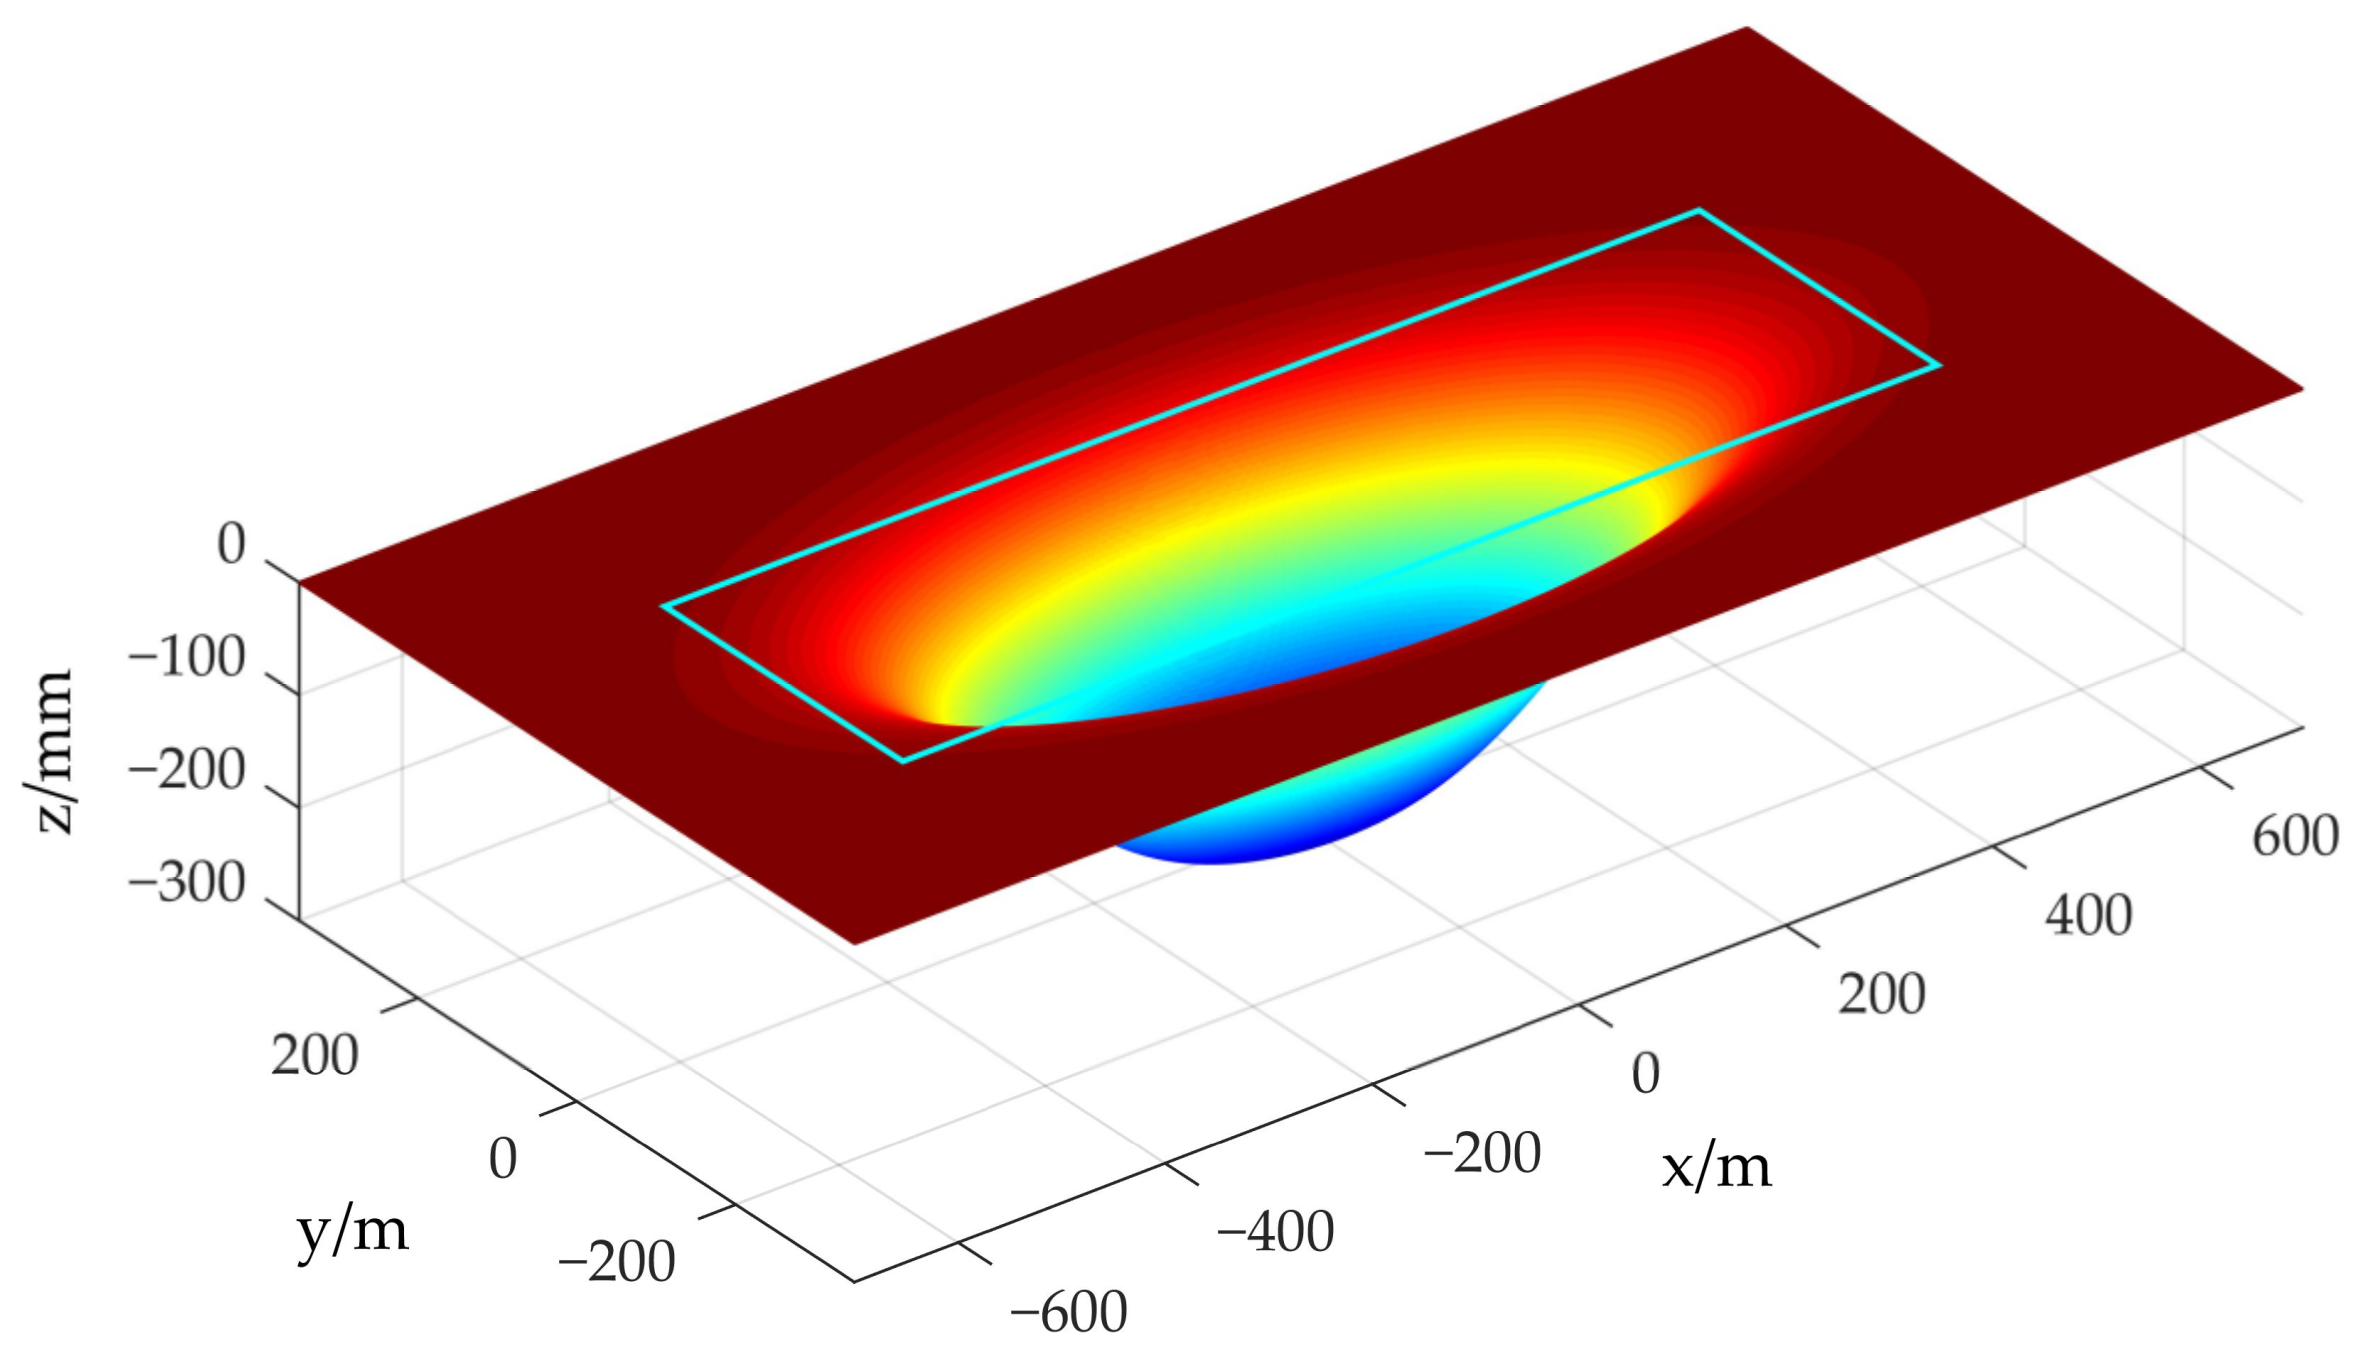
4.3. 3D Deformation Monitoring Based on PIM and InSAR Combined with Depression Angle Model

The inverted parameters [ q ; t a n β ; t a n β 1 ; S ; S 1 ] of the PIM based on the measured leveling values are [0.7; 1.7; 2.2; 25; 55], and the depression angle of the coal seam near the open-off cut is nearly 0°. Thus, the parameters of the uphill directions and the downhill directions are the same. We substitute the above parameters into (5) to obtain the subsidence basin near the open-off cut, as shown in Figure 12.
The strike line azimuth of the working face is 151.1°, and the dip line azimuth is 61.1°. The incidence angle θ of Sentinel-1A SAR in this area is approximately 40.85°, and the LOS azimuth is approximately 83.9°. First, we establish a coordinate system that has a coordinate origin that is in the lower left corner of the working face along the mining direction, then according to (15), (9), and (16), the surface horizontal movement direction field, the horizontal movement field and displacement vector depression angle field are obtained. Finally, the results are geocoded to the local coordinate system, as shown in Figure 13. Moreover, Figure 13a shows that the horizontal movement directions of the surface points in the subsidence basin point to the goaf, which is consistent with the actual horizontal displacement characteristics of surface points. In Figure 13b, the horizontal displacement of the central area of the fully mined area is close to zero. In Figure 13c, the range of the depression angle field is larger than the horizontal movement field and settlement field, reflecting that the convergence of (13) is gentle in the edge area and conducive to the inversion of edge settlement.
The LOS deformation from 31 March 2018 to 13 May 2019 was used to calculate the surface subsidence according to (19) and (20), and the LOS deformation of the null value region was obtained using spatial interpolation firstly. Figure 14 shows the subsidence calculated by InSAR combined with the horizontal movement direction field and the depression angle field. Figure 15 is the 3D deformation diagram of InSAR and the proposed model. It can be seen from the figures that the left area along the extraction advance direction has changed from surface uplift in the LOS deformation field to normal surface subsidence. This shows the effectiveness of this method in obtaining the real subsidence of the surface uplift area in the LOS direction. Correspondingly, methods used by Yang et al. and Jiang et al. will not change the direction of deformation, which results in the failure of obtaining true subsidence in this area [23,24]. During the first month of mining, the mining stopped for a short time because of the trial production and other reasons, leading to a longer settlement time. Then, the InSAR monitored more deformation in the central area of the basin during this period (dark-red area in Figure 14). After the mining returns to normal, the deformation in the central area of the basin during the active mining period is difficult to be monitored by InSAR, resulting in a reduction in effective deformation to be monitored. The white area in Figure 14 is the transition area where the LOS direction deformation is shown as the surface subsidence and uplift. The LOS direction in this area is nearly perpendicular to the surface displacement vector. Then, the value of cosβ in (20) tends to zero, making it difficult to monitor the effective subsidence deformation by (20). Thus, the value of this area is not considered in the calculation process. Therefore, similar situations occur in the working faces of a few mining areas with the LOS deformation showing surface uplift in some parts.
In the study areas, the average coherence coefficient of SAR interference pairs in the adjacent periods is between 0.46 and 0.71, of which the coherence from June to August is between 0.46 and 0.57, which is lower than 0.6. The average coherence coefficient of 34 interference pairs from 12 April 2018 to 13 May 2019 was 0.61, and the resolution of Sentinel-1 after the multi-look was 20 m × 20 m. According to (5), the maximum LOS deformation of 421.6 mm is monitored during this period. However, the main deformation of the surface near the open-off cut occurred during the initial period and the active mining period of 3 months. Based on (5), the maximum deformation in the LOS direction that can be monitored during this period was 93 mm. Because the effective deformation monitored by InSAR in the central area of the subsidence basin mainly occurred in the initial period and the recession period (deformation in the active period exceeded the InSAR monitoring capacity), the LOS deformation monitored by InSAR during this period was approximately 100 mm, accounting for approximately 2% of the total subsidence. Based on this ratio, the surface deformation in the edge areas mainly occurred during the three months of the initial period and the active period. Moreover, the deformation during the recession period was negligible at around 2 mm, accounting for approximately 2% of 93 mm. Therefore, 93 mm is used as the threshold to determine whether the InSAR monitoring results were valid because 93 mm the LOS deformation requires at least 93 mm deformation of the vector d (that is, the two vectors have the same direction corresponding to 70 mm sinking). Thus, 70 mm is taken as the critical threshold value of the settlement. When the subsidence value is less than 70 mm, the result of InSAR combined with the depression angle model is taken as the final value; otherwise, the PIM value is taken as the final value. The fusion effect of the two is shown in Figure 16.
Figure 16 shows that the merged subsidence basin is symmetrical to the centerline of the working face, which is consistent with the subsidence basin characteristics of near-horizontal coal seam mining. However, the subsidence basin monitored by InSAR generally presents a certain degree of skewness due to the LOS deformation; this phenomenon is reflected in Figure 11. The main disadvantage is that the fusion basin has discontinuous areas at the fusion boundary. To solve this problem, two settlement data in a certain area should be found near the fusion boundary for the weighting average.
Figure 17 compares the PIM prediction results with InSAR combined with the depression angle model for monitoring the results, based on pixel values of a line segment on the dip main section in the edge area of the subsidence basin. Figure 17 shows the variation trend of subsidence obtained by these two methods. From the edge of the basin to the center of the basin, the subsidence of InSAR combined with the depression angle model increases slowly, and the PIM subsidence changes from almost no change to a rapid increase. The intersection point is shown with equal subsidence. On the left side of the intersection point, the subsidence value of InSAR combined with the depression angle model is closer to the true value. On the right side of the intersection point, the PIM subsidence value is closer to the true value. This shows that the party that has a large sinking value should have a greater weight in the fused value, which is more consistent with the actual situation. Accordingly, a fusion method weighted by distance is proposed innovatively. This method is like taking the distance from the point on the sinking curve in Figure 17 to the horizontal axis as the weighting coefficient. Thus, when the sinking value is larger, the weight is also larger.
Here, we take the 610 mm settlement result above the open-off cut as the upper bound of the threshold value, and when the settlement limits is greater than 610 mm, the result of the PIM is taken as the final value. When the settlement is between 70 mm and 610 mm, the final settlement d is obtained by the weighted average between d P I M of the PIM and the settlement d c o m of the InSAR combined with the depression angle model, and (21) is the fusion method. It is easier to compare this with the method of Chen, Y. et al. [30], and the weight changes dynamically in different positions, which is more consistent with the facts.
d = d c o m d < 70   mm d c o m d c o m d c o m + d P I M + d P I M d P I M d c o m + d P I M 70   mm d < 610   mm d P I M d 610   mm
The range of the white, solid line in Figure 18 is the area nearly perpendicular to the LOS direction and the displacement vector, revealing no effective monitoring value of InSAR. Thus, the area in this figure is only the predicted value of the PIM. Therefore, effective surface deformation of some parts of the area is not obtained for some mining areas with the local LOS uplift. The 3D displacement vector of the surface can be expressed in the form of a horizontal movement direction field, a displacement vector depression angle field, and a subsidence. It can also be converted into the form of subsidence, such as an east–west horizontal movement field and a north–south horizontal movement field. The horizontal movement in the east–west and north–south directions is shown in Figure 19.

4.4. Accuracy Analysis of Vertical Deformation

The subsidence monitoring results of the InSAR+ depression angle model, PIM, and InSAR are compared and analyzed with the measured leveling data of 43 points from L1 to L43. The monitoring points on the dip line are shown in Figure 14. The goal is to further verify the monitoring accuracy of these methods. L1~L7 and L35~L43, where the InSAR technology can detect effective deformation in this region, are located in the edge area on both sides of the dip line with a settlement of less than 70 mm. L29~L34 are located in the weighted fusion area between 70 mm and 610 mm where the monitoring results of the InSAR technology and PIM are unreliable. The regions from L8 to L33 are only the predicted results of PIM, which are not part of the analysis. Table 2 presents the error comparisons.
Figure 20A is the settlement after weighted fusion, and Figure 20a–d shows the comparisons between monitoring results obtained by different methods and leveling in the edge area of the working face. The outcomes of the comparative analysis in Table 2 and Figure 20 show the following.
(1)
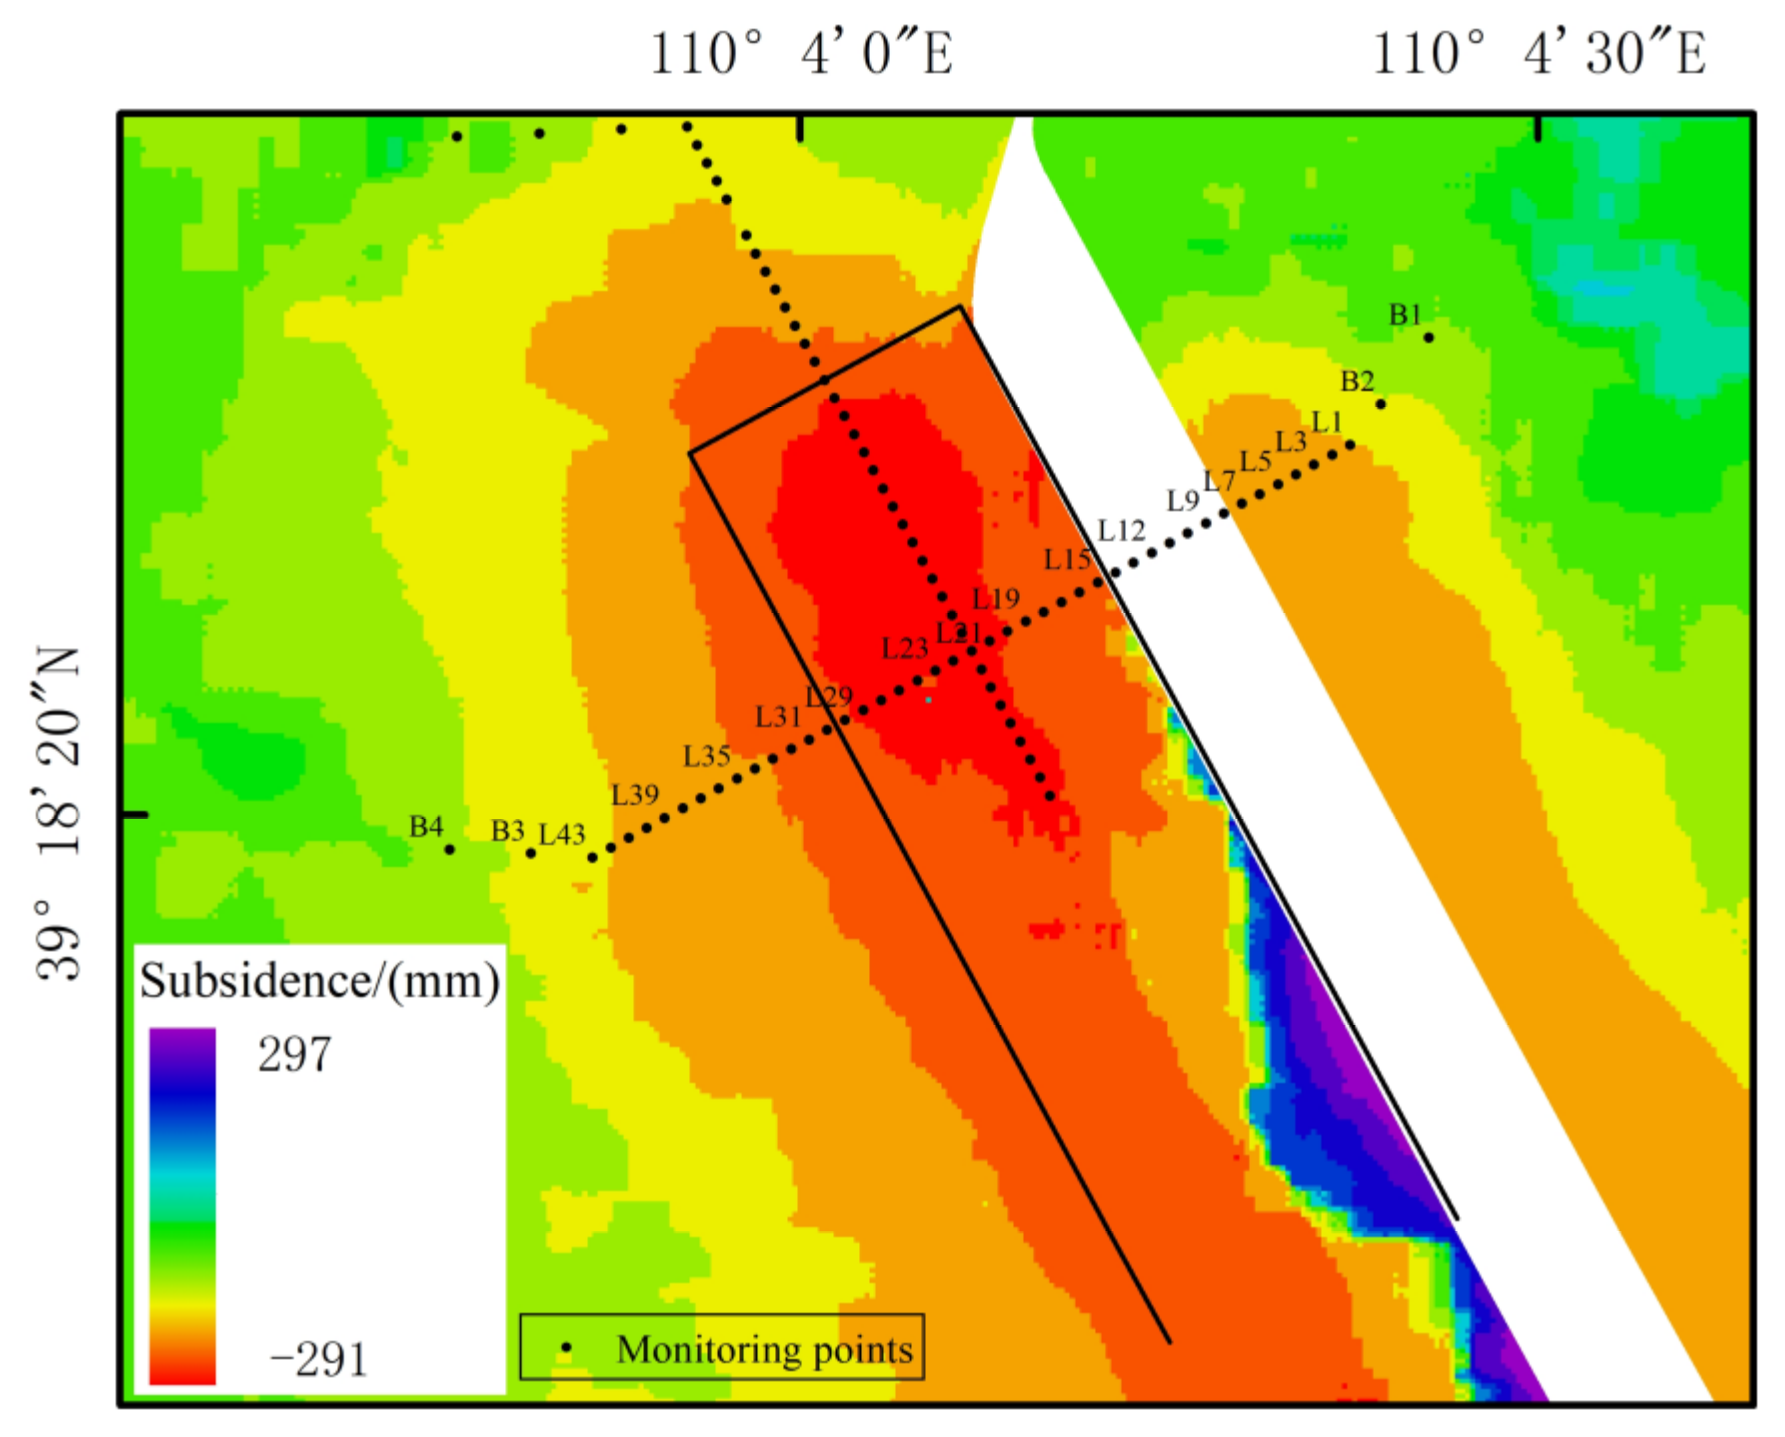
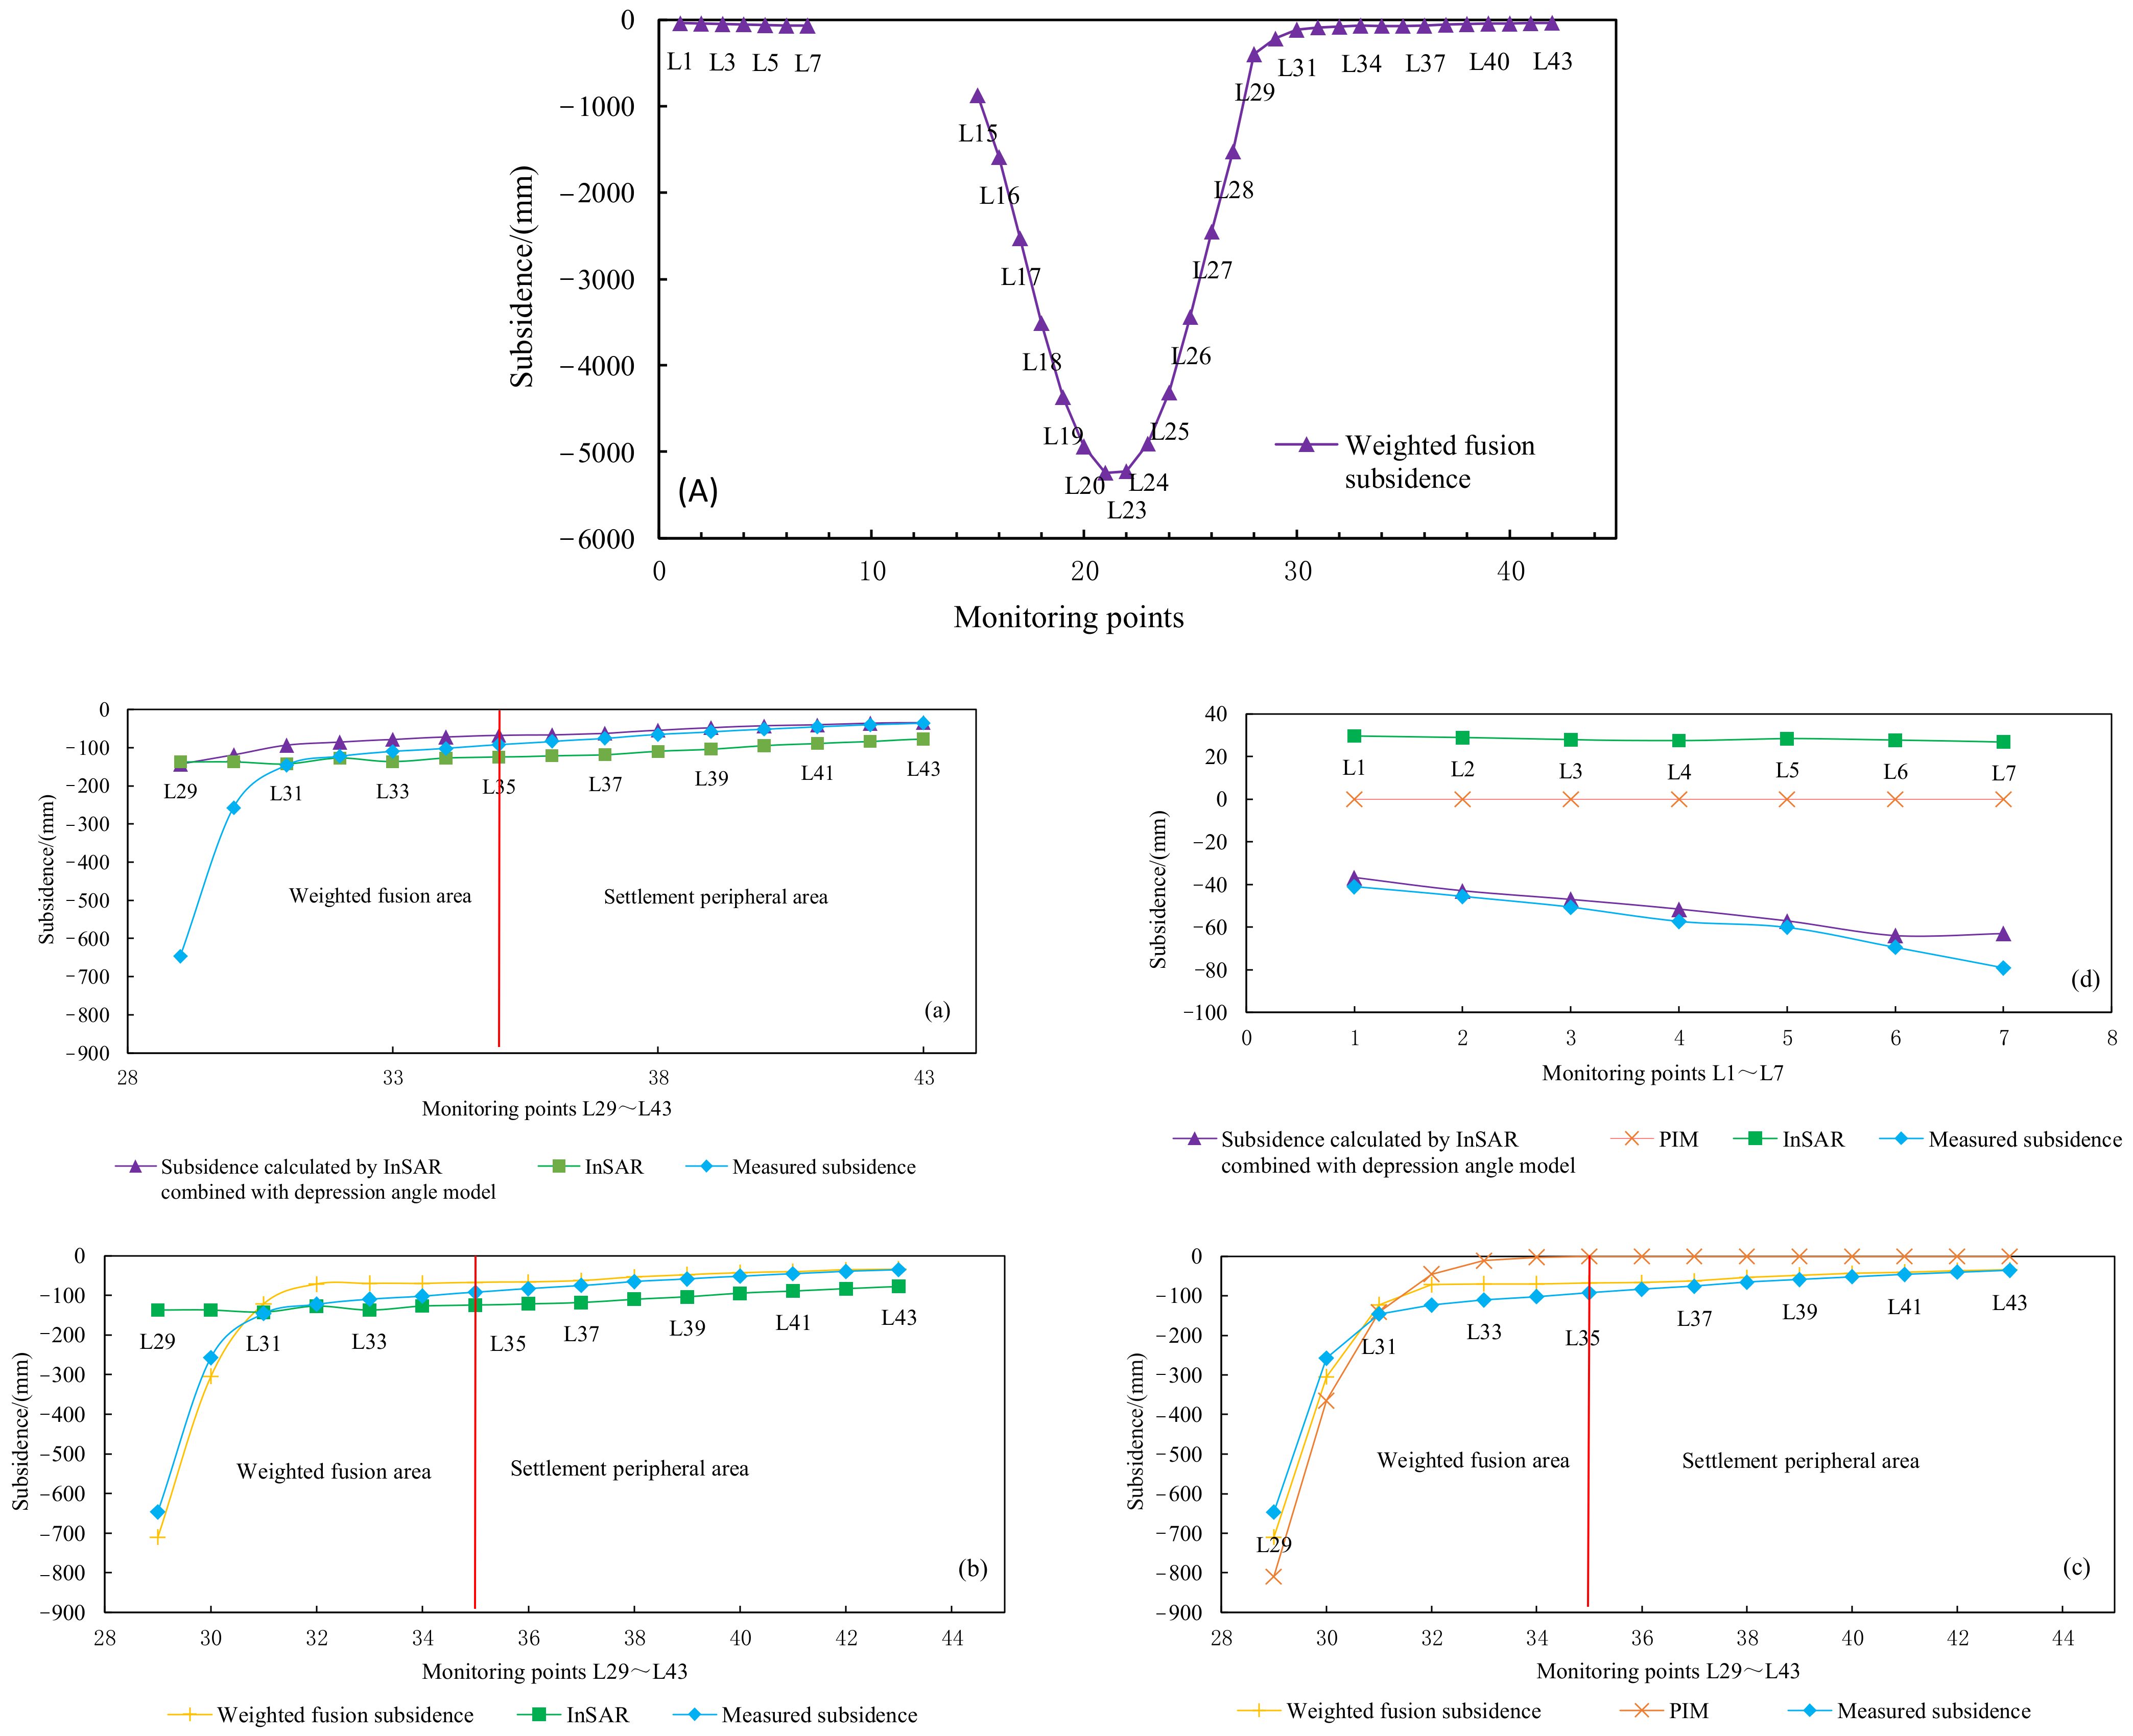
The edge settlement area: The PIM converges too fast, and the predicted result is zero (Figure 20c,d). The difference between the InSAR-monitored results and the measured values is large, especially the InSAR-monitored results in Figure 20d, which shows that the ground surface is uplifted. The settlement after the weighted fusion of L35~L43 in Figure 20a and L1~L7 in Figure 20d (the edge area is equivalent to the settlement calculated by InSAR+ depression angle model) is highly consistent with the measured leveling value, with the RMSE equals 10 mm, which has a monitoring accuracy that is much higher than the 65 mm of InSAR and the 61 mm of PIM, and the monitoring accuracy is increased by 85% and 84%, respectively.
(2)
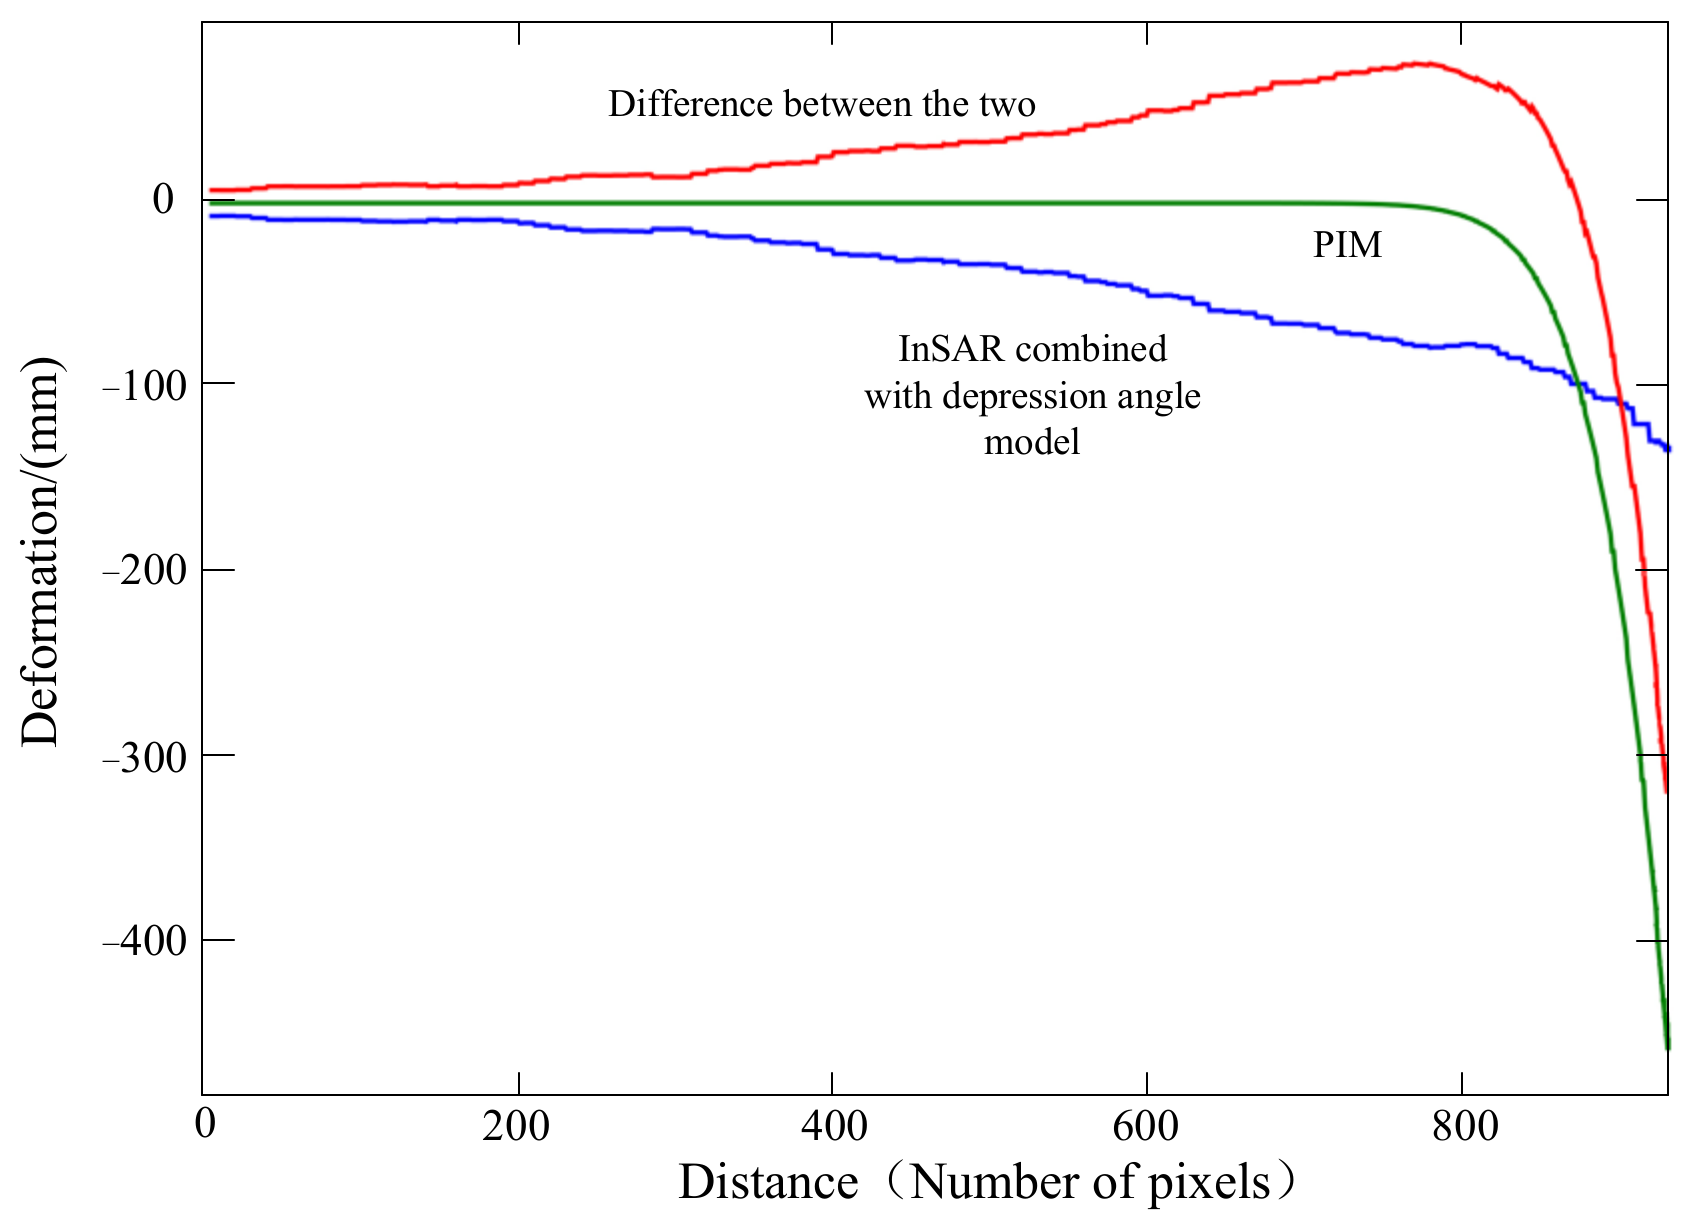
The weighted fusion area: The predicted result of the PIM increases from almost zero of L34 toward the center of the mining area, and it is gradually consistent with the measured value (Figure 20c). InSAR has begun losing surface deformation information gradually in this area as a result, and the subsidence calculated by InSAR+ depression angle model can only obtain part of the settlement information, which is less than the leveling value (Figure 20a). Through weighted fusion, the monitoring settlement accuracy is improved compared with the PIM, and the RMSE is reduced from 133 mm to 80 mm.
(3)
The overall results (edge settlement area and weighted fusion area): The overall monitoring accuracy RMSE of the edge settlement area and weighted fusion area is 42 mm, which is 66% and 44% higher than that of InSAR and PIM, respectively.

5. Discussion

The parameters of the PIM are from the measured values or empirical values, and the prediction accuracy is greatly affected by the parameters, especially the tangent of main influence angle tanβ, which plays a decisive role in determining the influence range of subsidence, and its influencing factors are very complex, which are difficult to describe with certain theoretical formulas. tanβ is the ratio of the mining depth H to the main influence radius r, and its value range is generally from 1.2 to 2.6 [29]; then 1.9 is taken as the most probable value. If ±0.3r error exists in the main influence radius, it will cause a deviation of ±0.63 to tanβ, so ±0.3r is used as the error range to judge the influence of the main influence radius on different monitoring methods.
For the convenience of comparison, suppose there is a horizontal working face with an east–west main section, whose length and width are 1000m and 300 m, respectively. According to the maximum settlement of 2 m, the 160 m main influence radius, the 0.3 horizontal movement coefficient, and the 20 m inflection point offset, a subsidence basin is generated as the actual subsidence basin, and is then used to simulate the LOS subsidence basin of the InSAR technology. The basic parameters of the SAR data are as follows: ascending orbit, LOS azimuth is 83.9°, and the radar incidence angle is 40°. Figure 21 shows the subsidence basin obtained by the PIM and the simulated LOS subsidence basin. It can be seen from Figure 21b that on the side of the goaf of the open-off cut, the subsidence of some areas in the LOS subsidence basin is greater than that in the center of the basin. This is because the deformation in the LOS direction is equal to the sum of the projections of the subsidence and horizontal movement in the LOS direction. When both projections have the same direction with LOS, it may occur that the deformation value in the LOS direction is greater than the deformation of the basin center. If both projections are in the opposite direction and the projection value of the horizontal movement is greater, then the surface is uplifted.
The relative errors between the subsidence calculated by InSAR combined with depression angle model and the actual subsidence basin are shown in Figure 22 when the ±0.3r error occurs in the main influence radius (i.e., when r is 112 m and 208 m) to the simulated LOS subsidence basin. For a more intuitive comparison, the deformation comparison of the strike main section is made, as shown in Figure 23.
Figure 23 shows the subsidence calculated by the PIM and the subsidence curves calculated by InSAR combined with the depression angle model when r is 112 m and 208 m. It can be seen from the figure that the LOS deformation monitored by InSAR are quite different from the actual subsidence, which indicates that in many cases, the mining area surface deformation obtained by single LOS InSAR cannot replace the actual subsidence. At the side of the coal wall of the open-off cut, the subsidence error calculated by the PIM caused by the deviation of r is far greater than that calculated by InSAR combined with depression angle model. Figure 23b shows the enlarged view of the edge area. At −100 m of the actual subsidence of about 0.12 m, the subsidences calculated by InSAR combined with the depression angle model are 0.1 m and 0.125 m, respectively, with relative errors of about 16% and 4%, and the absolute error magnitude is also small, while the subsidences calculated by PIM are 0.04 m and 0.21 m, respectively, and the relative errors are about 67% and 75%. At the side of the open-off cut goaf, the relative error between the subsidence calculated by InSAR combined with depression angle model and the subsidence calculated by PIM is about 6%, but due to the large settlement, the error magnitude is not small. In the fully mined area, except for the LOS deformation monitored by InSAR, the subsidence of each method tends to be consistent. The above analysis shows that in the edge area of the side of the coal wall, the vector depression angle model with low accuracy r combined with InSAR can obtain a more accurate vertical deformation.

6. Conclusions

In view of the shortcomings of InSAR and PIM in 3D mining subsidence monitoring, based on the PIM, the InSAR coherence theory and deformation characteristics of the coal mining subsidence basin, a 3D deformation monitoring method combining InSAR with the displacement vector depression angle model is proposed, and then PIM is combined to obtain the entire area subsidence basin. The study area is near the open-off cut of a working face in the Shangwan coal mine. The method is used to monitor the deformation, obtain complete surface deformation information in the study area, and analyze the accuracy with the measured leveling values. The conclusions are as follows:
(1)
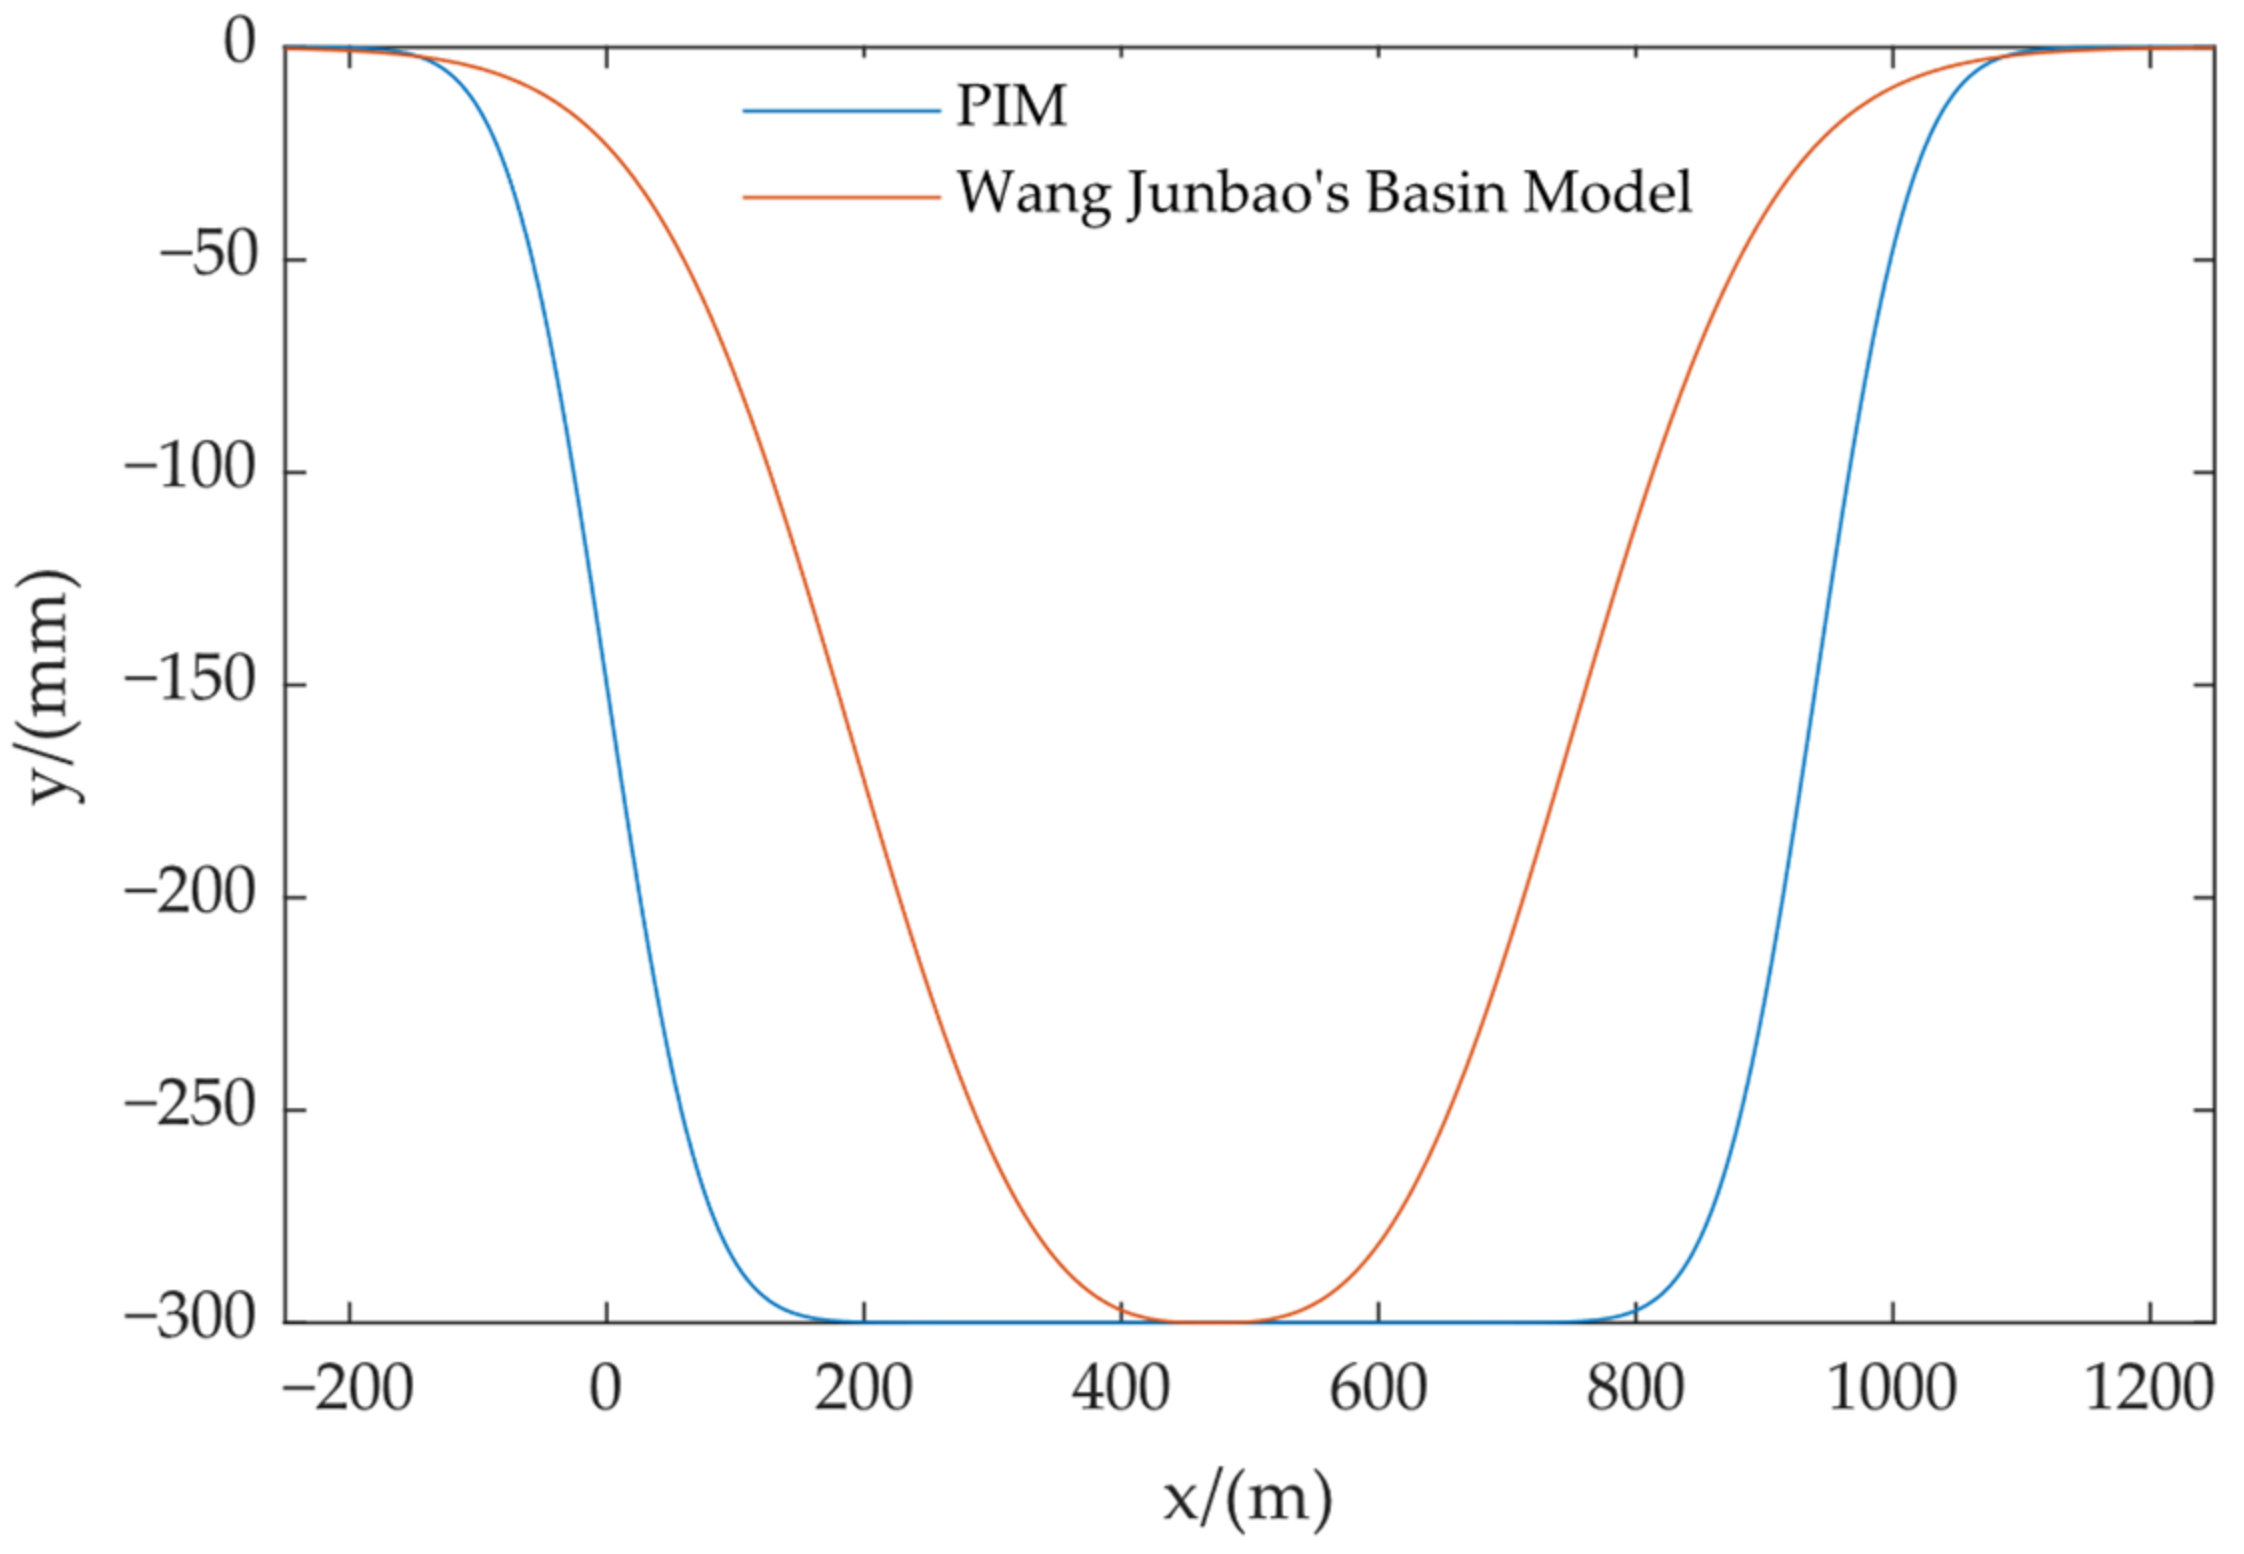
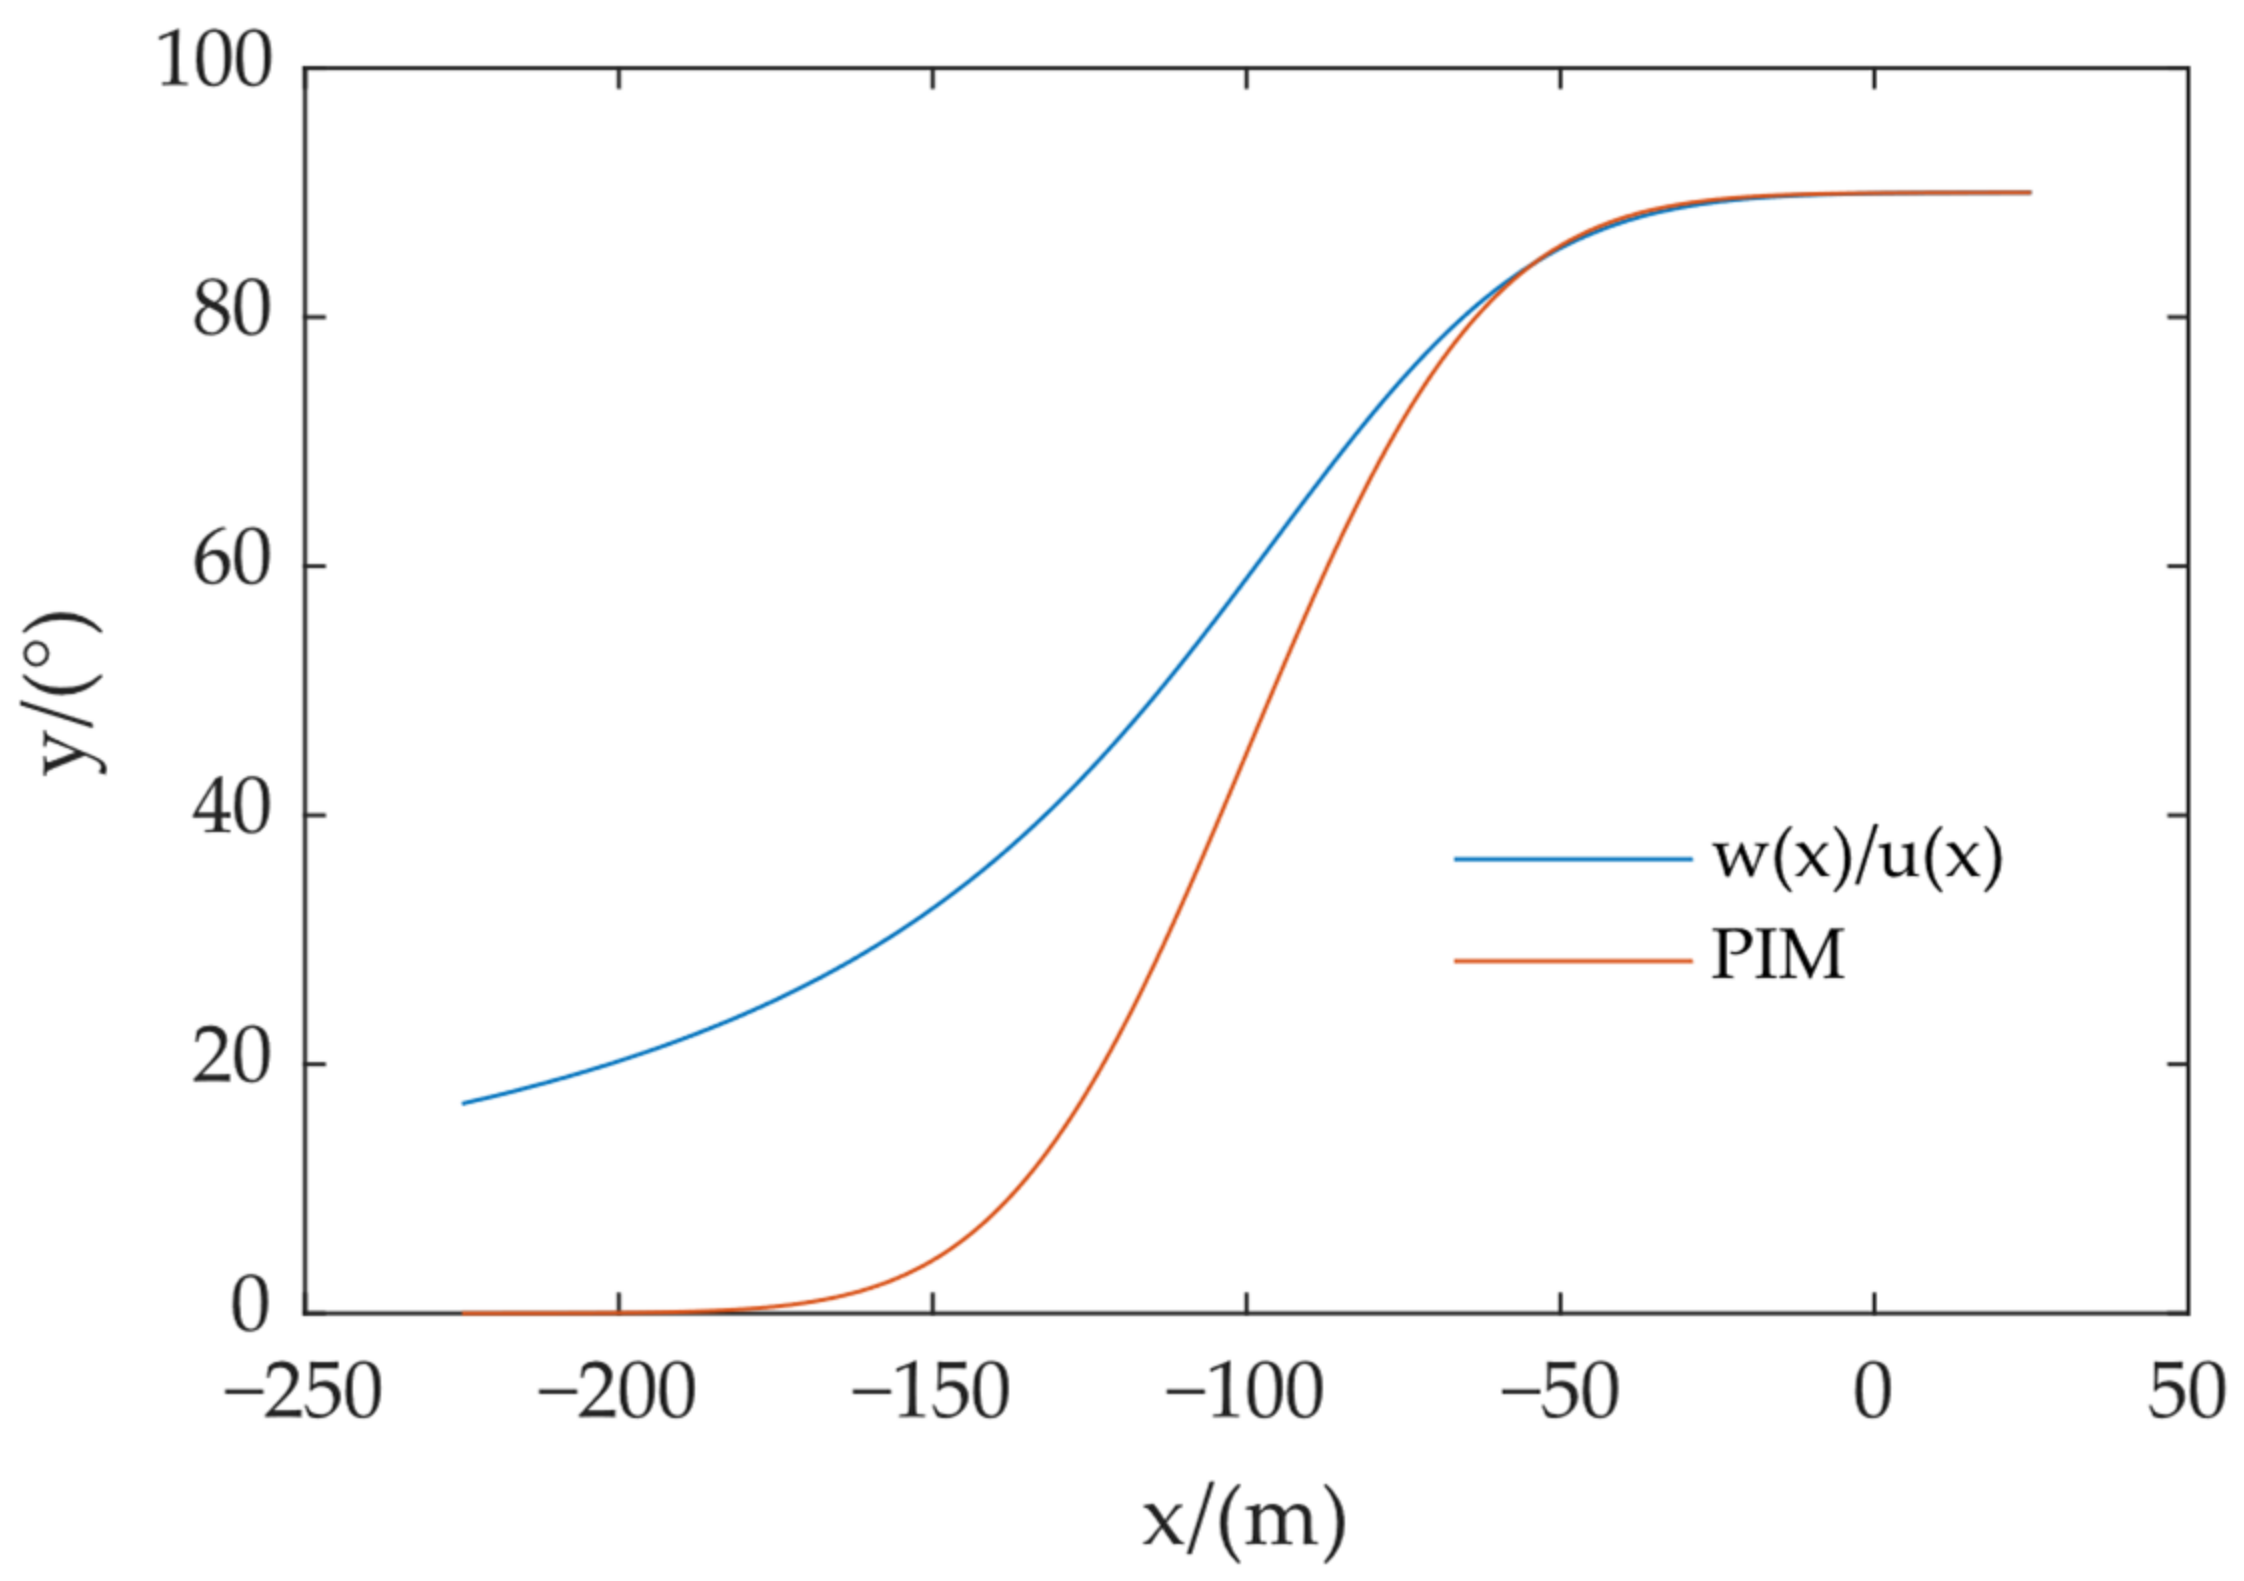
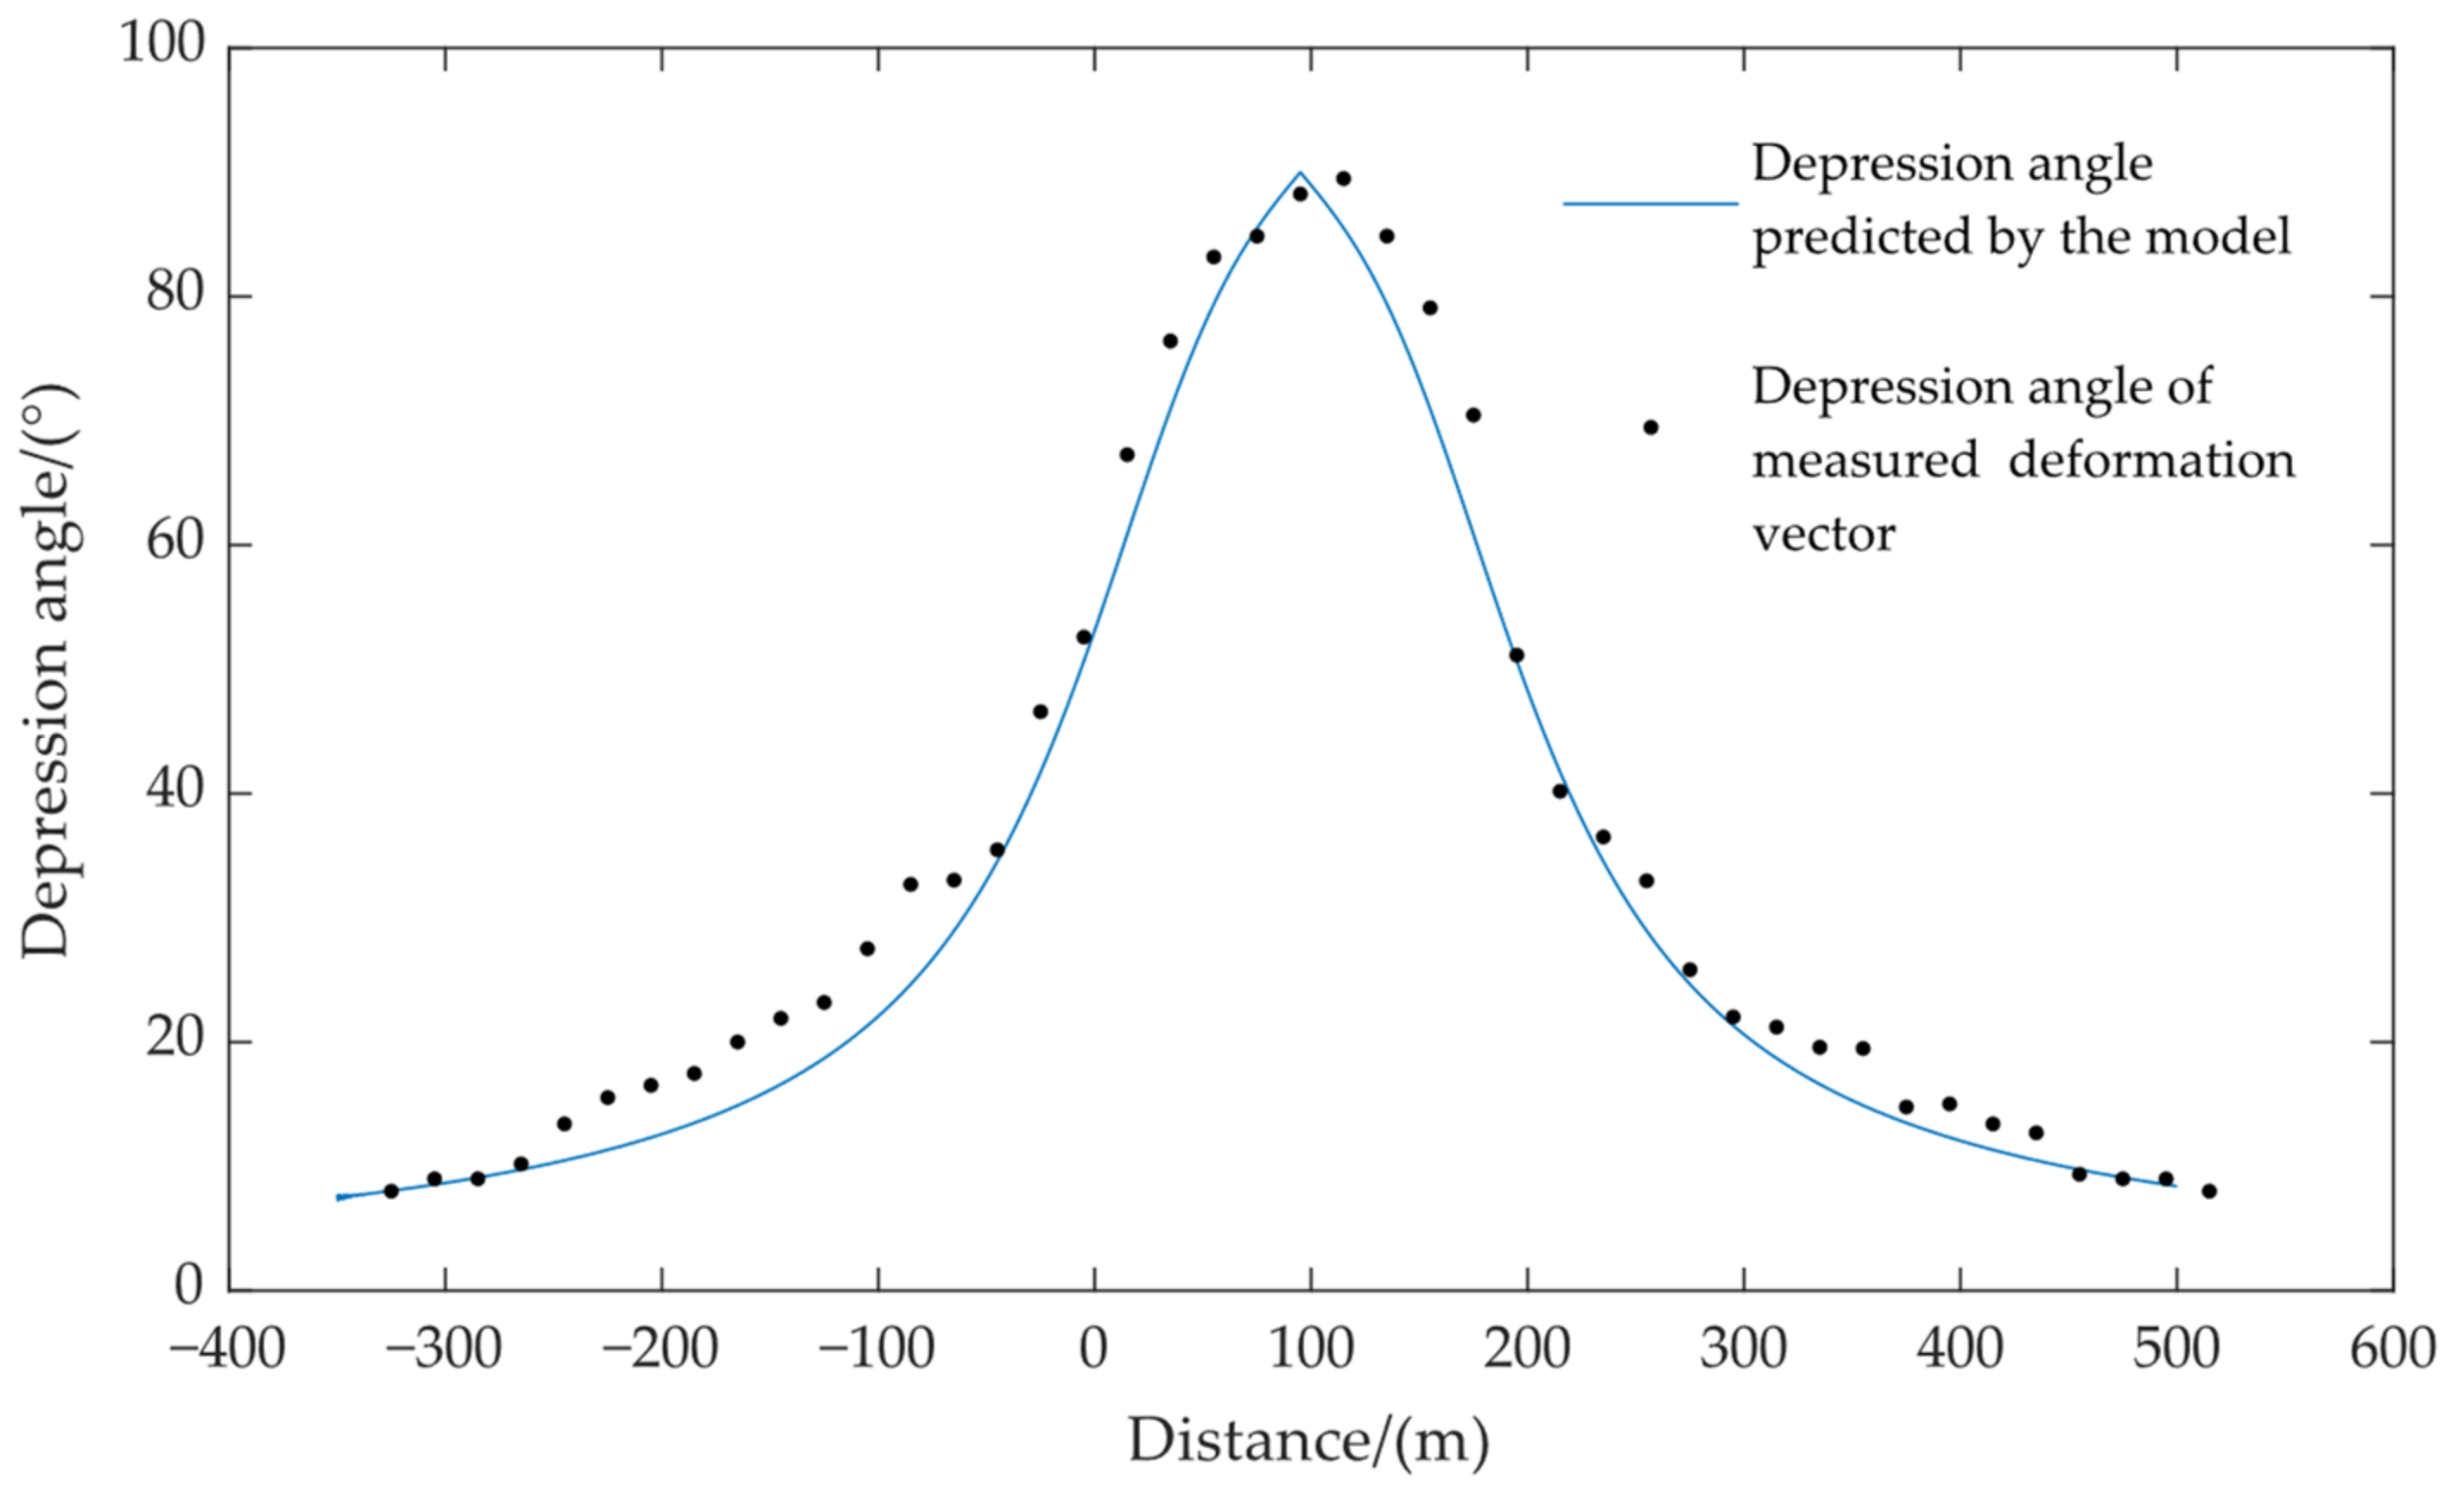
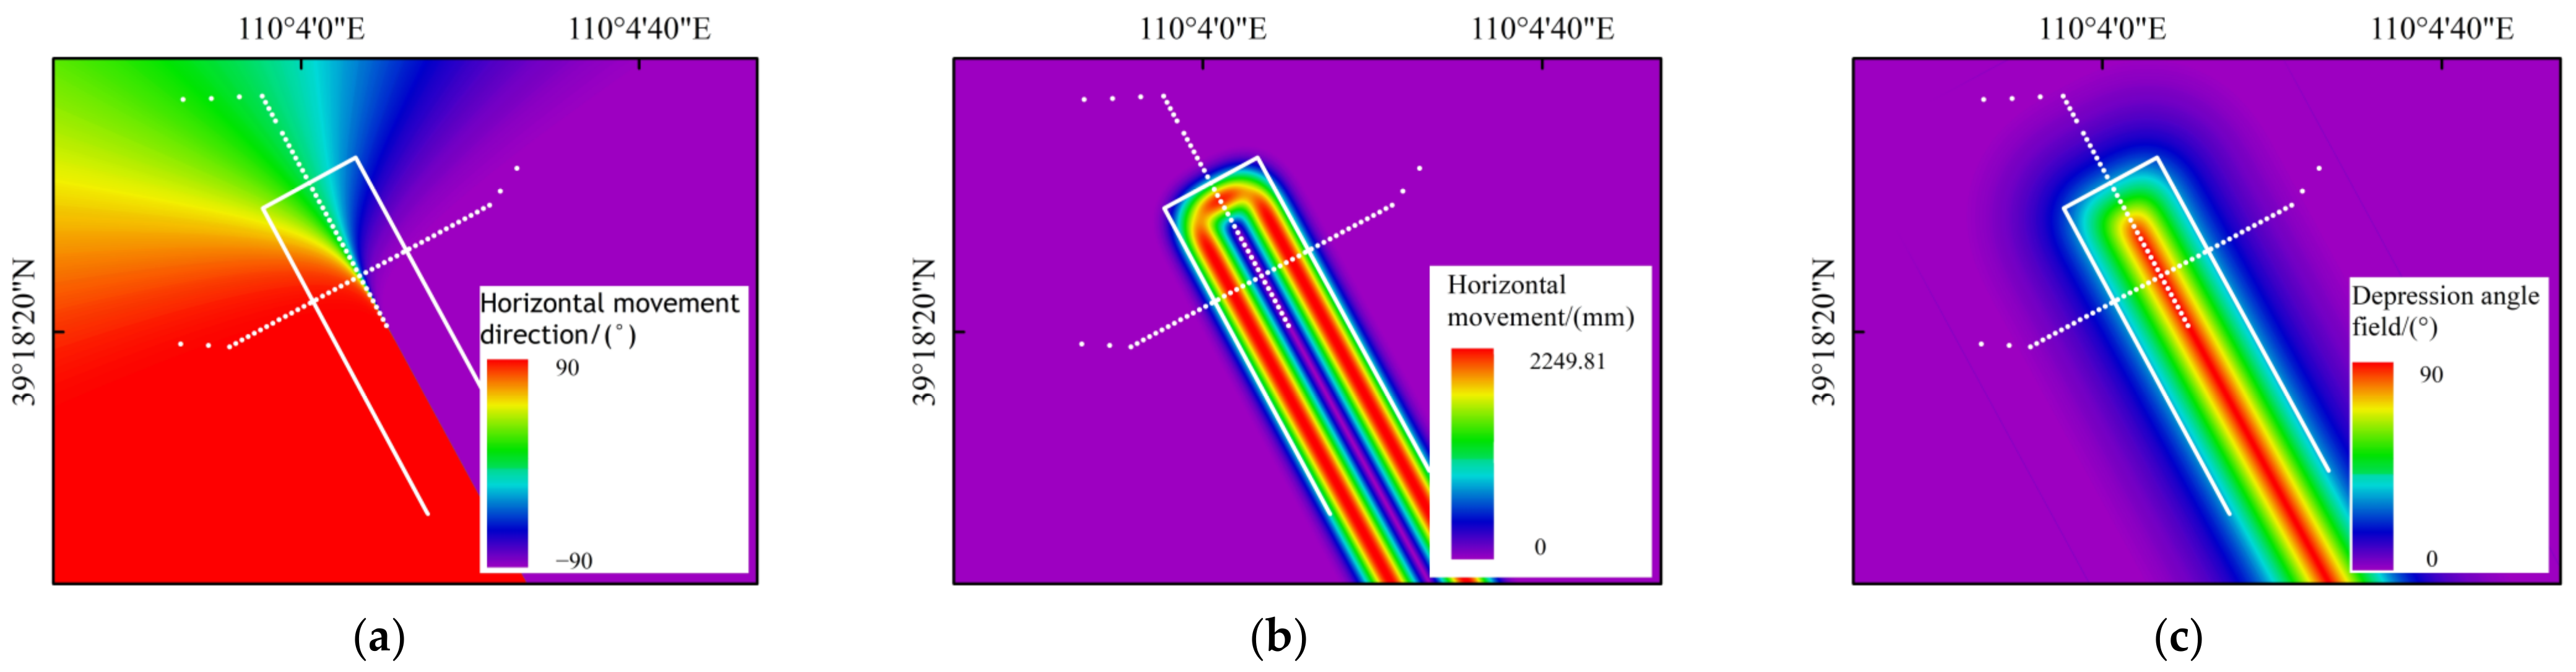
The depression angle model of the displacement vector based on PIM is more consistent with the actual ground movement, which has a high fitting accuracy with the depression angles calculated from the measured values, in which R2 is 0.9981 and the RMSE is 2.9°. This shows that the depression angle model converges gently in the edge region, which is conducive to the inversion of edge subsidence.
(2)
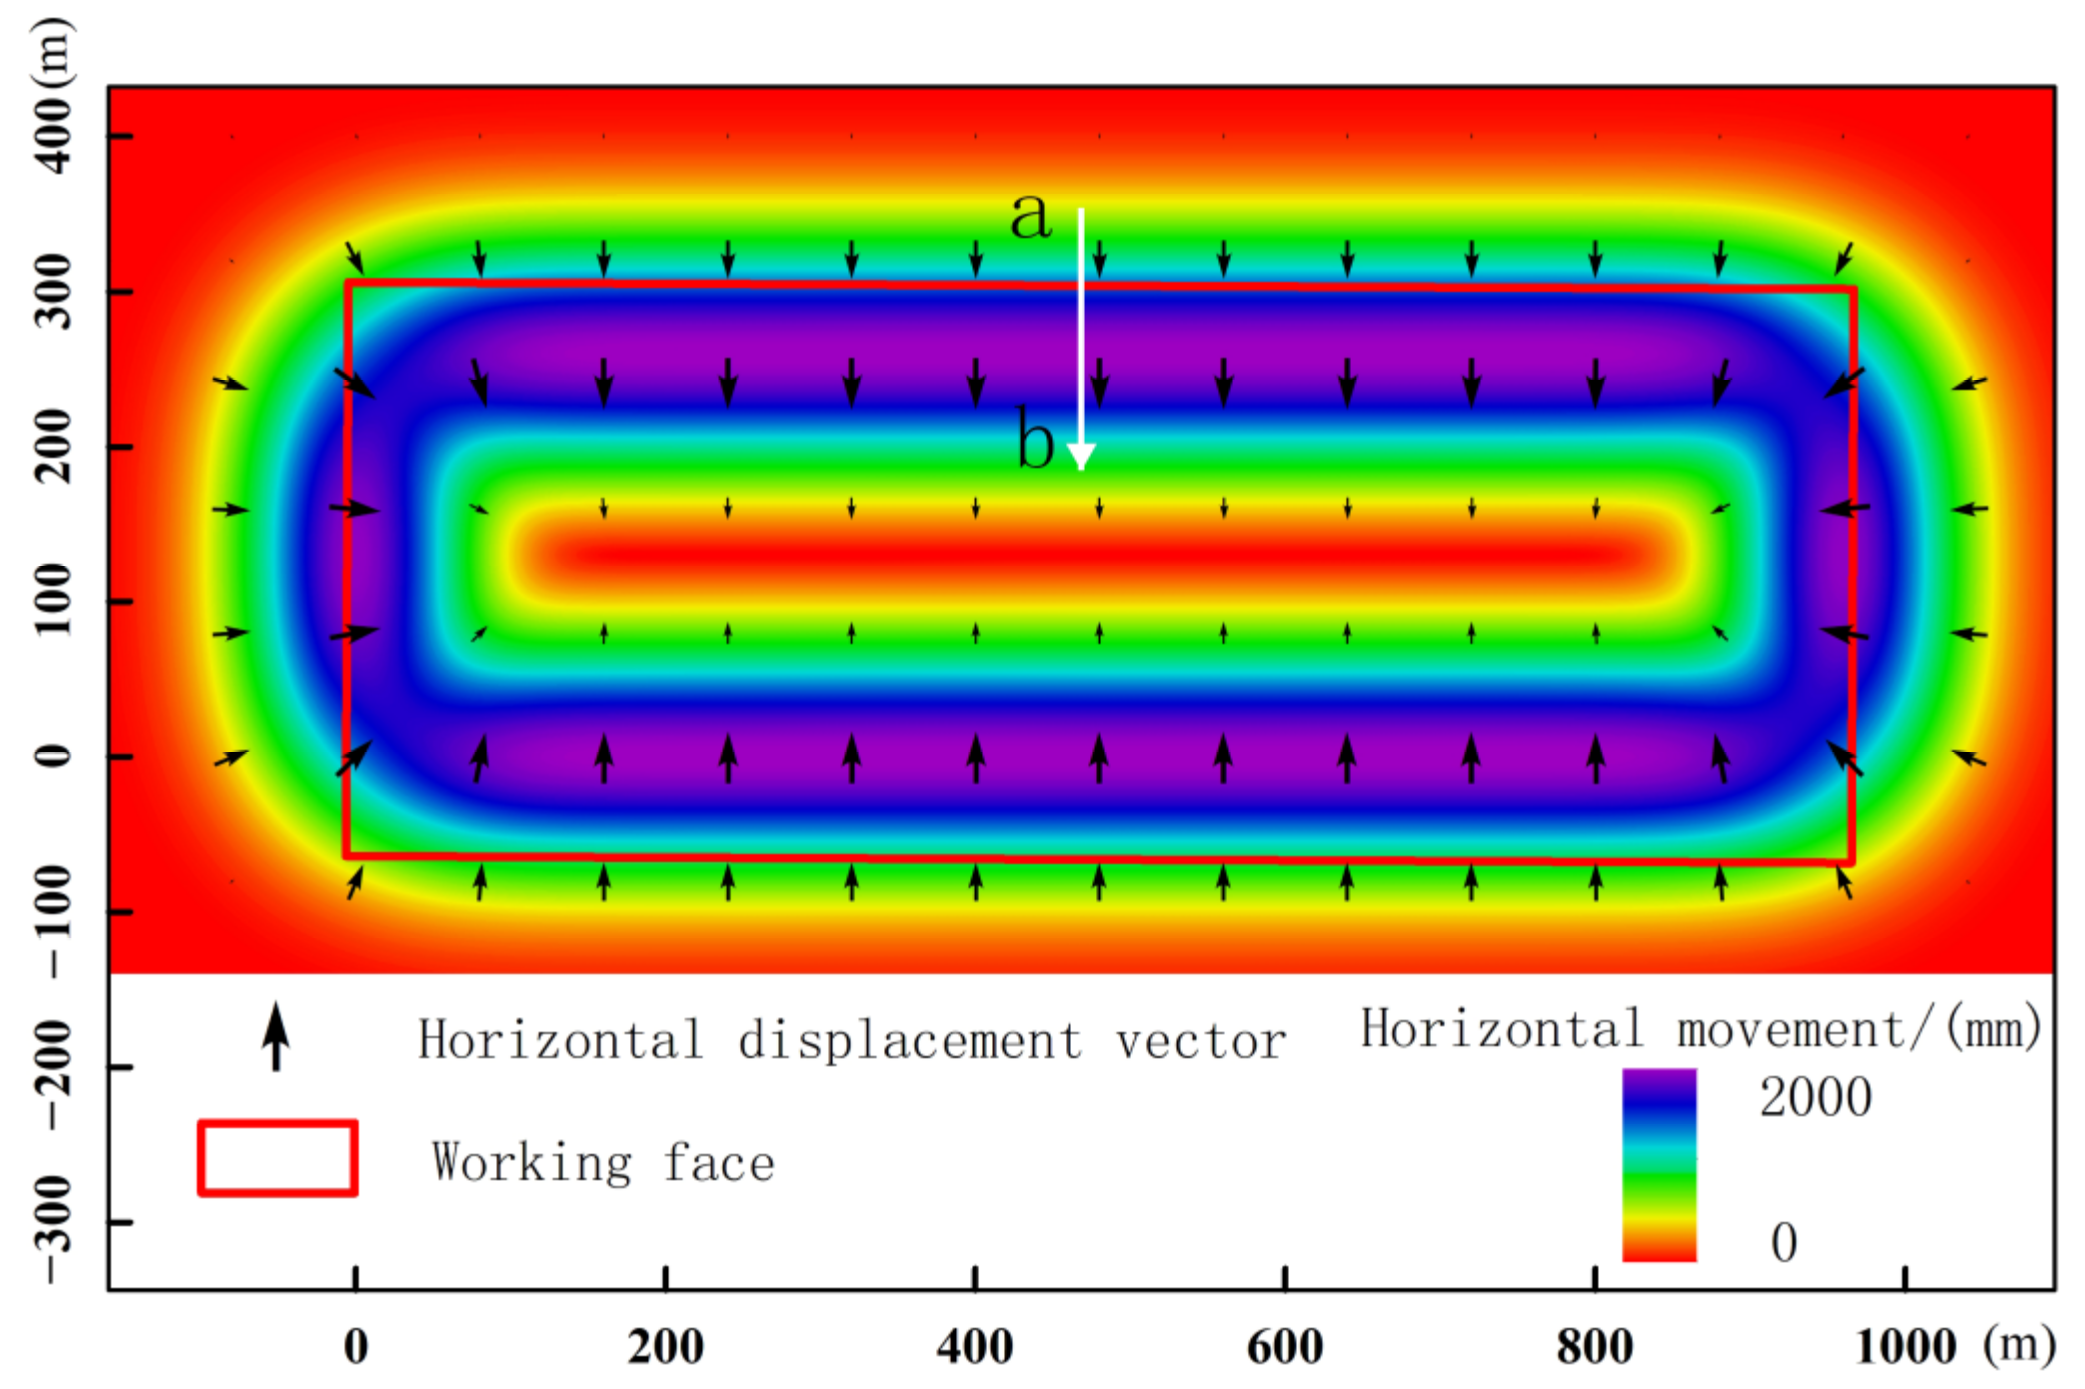
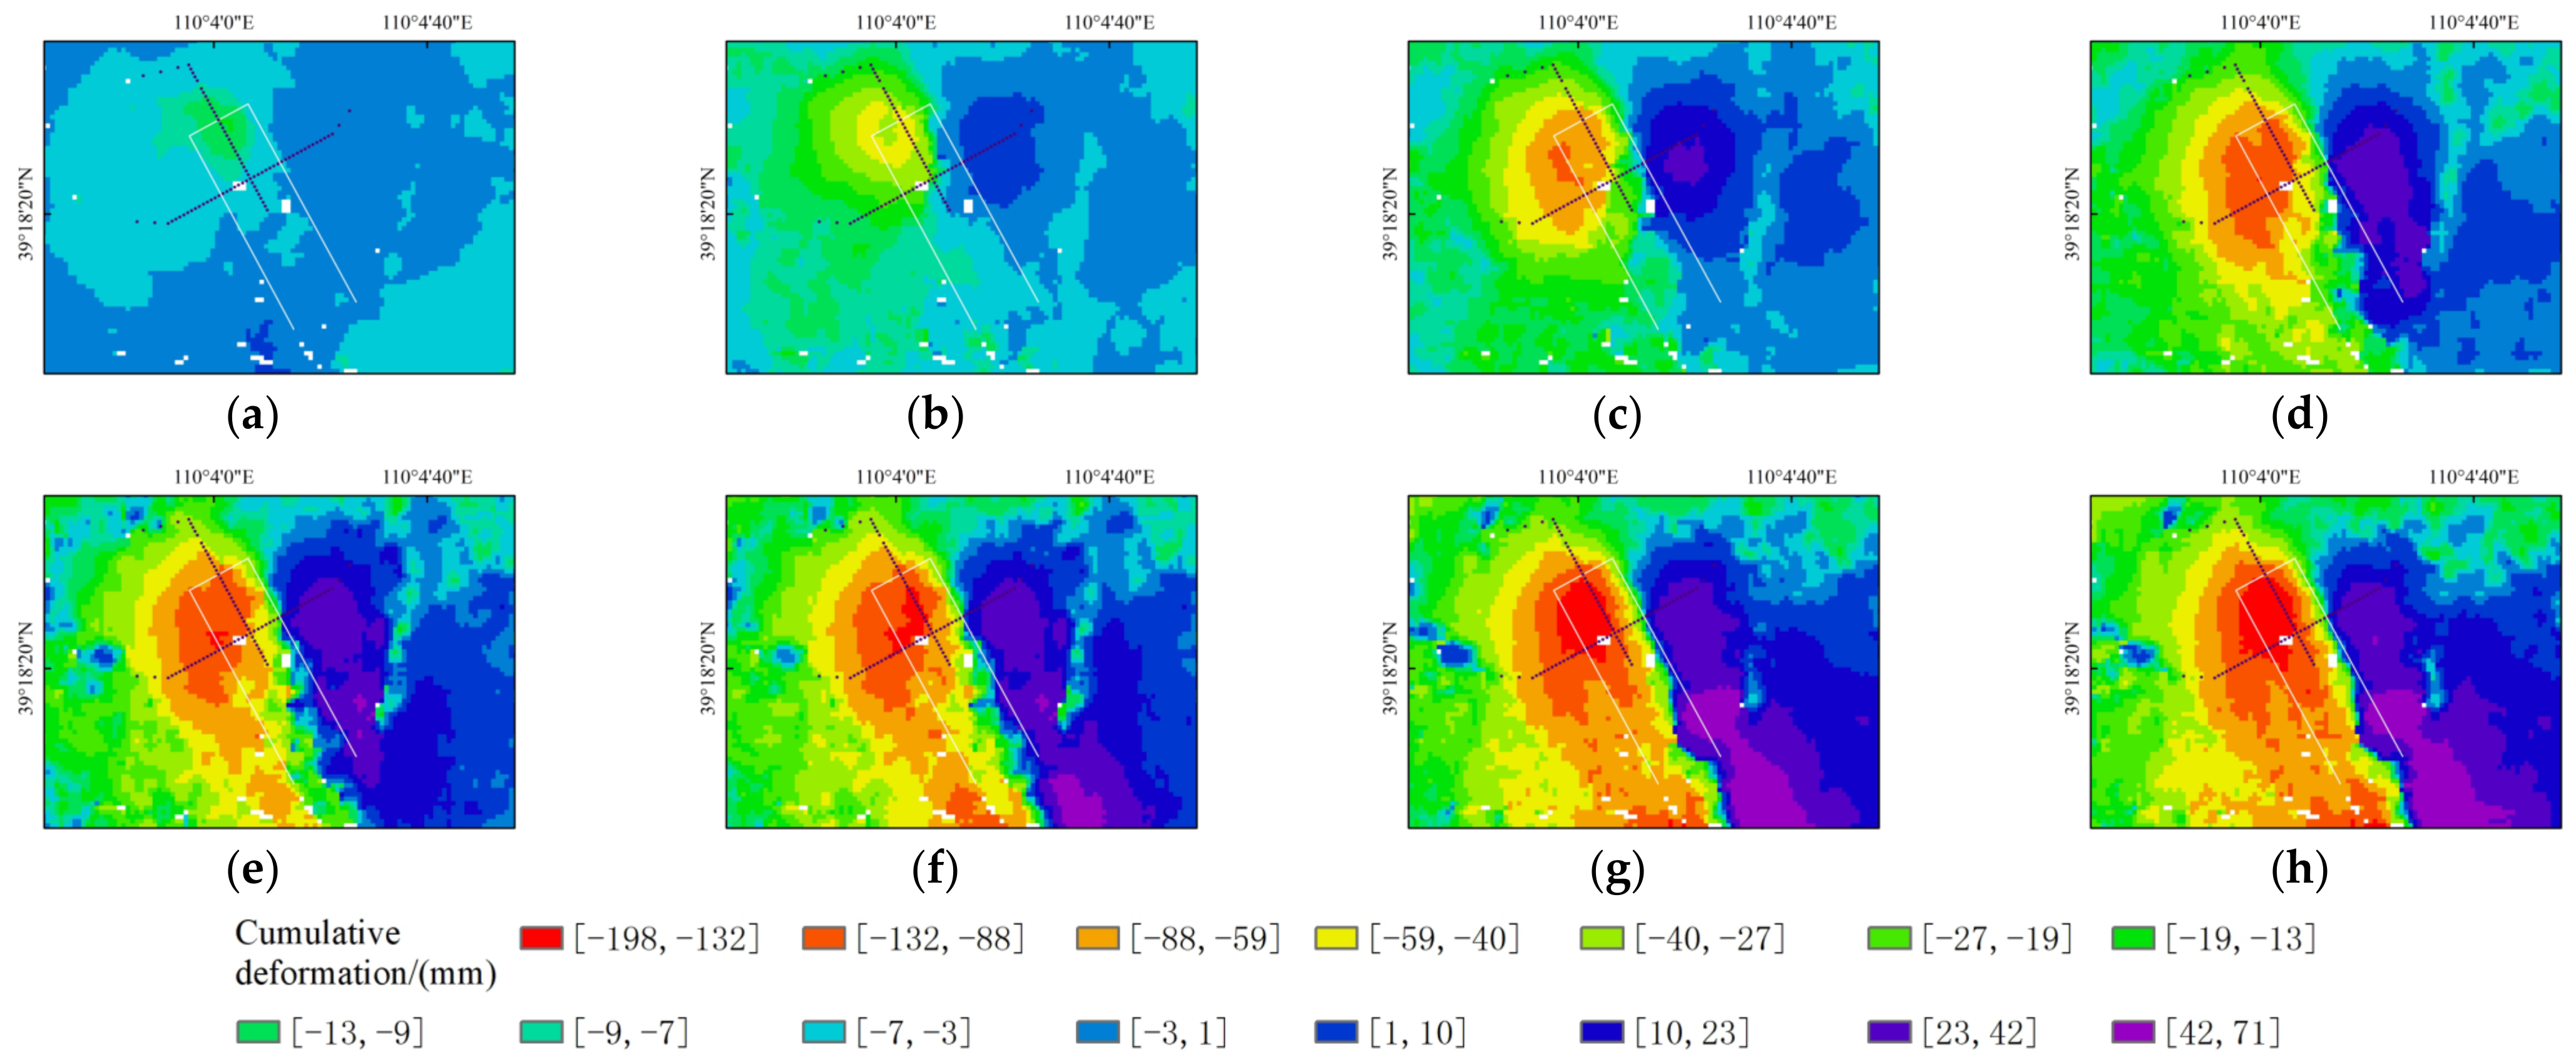
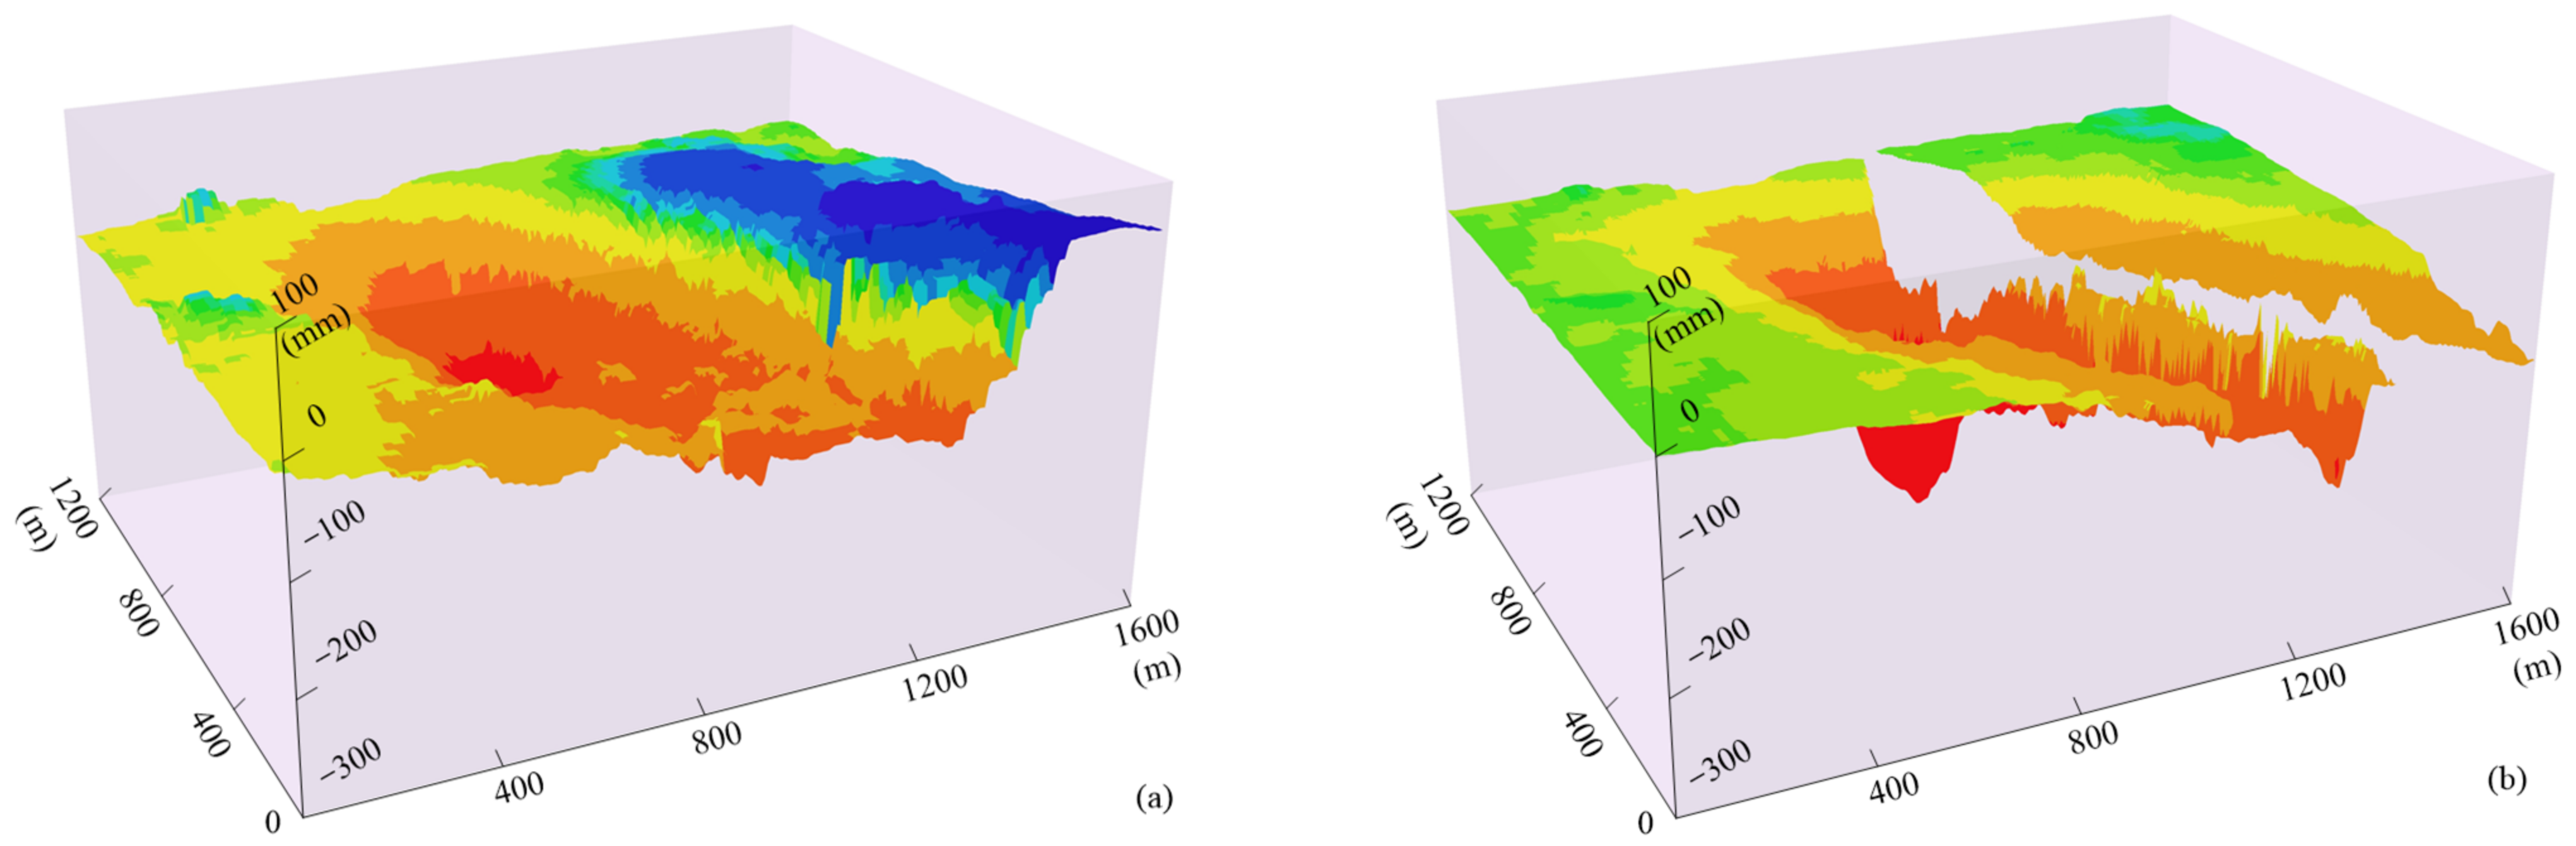
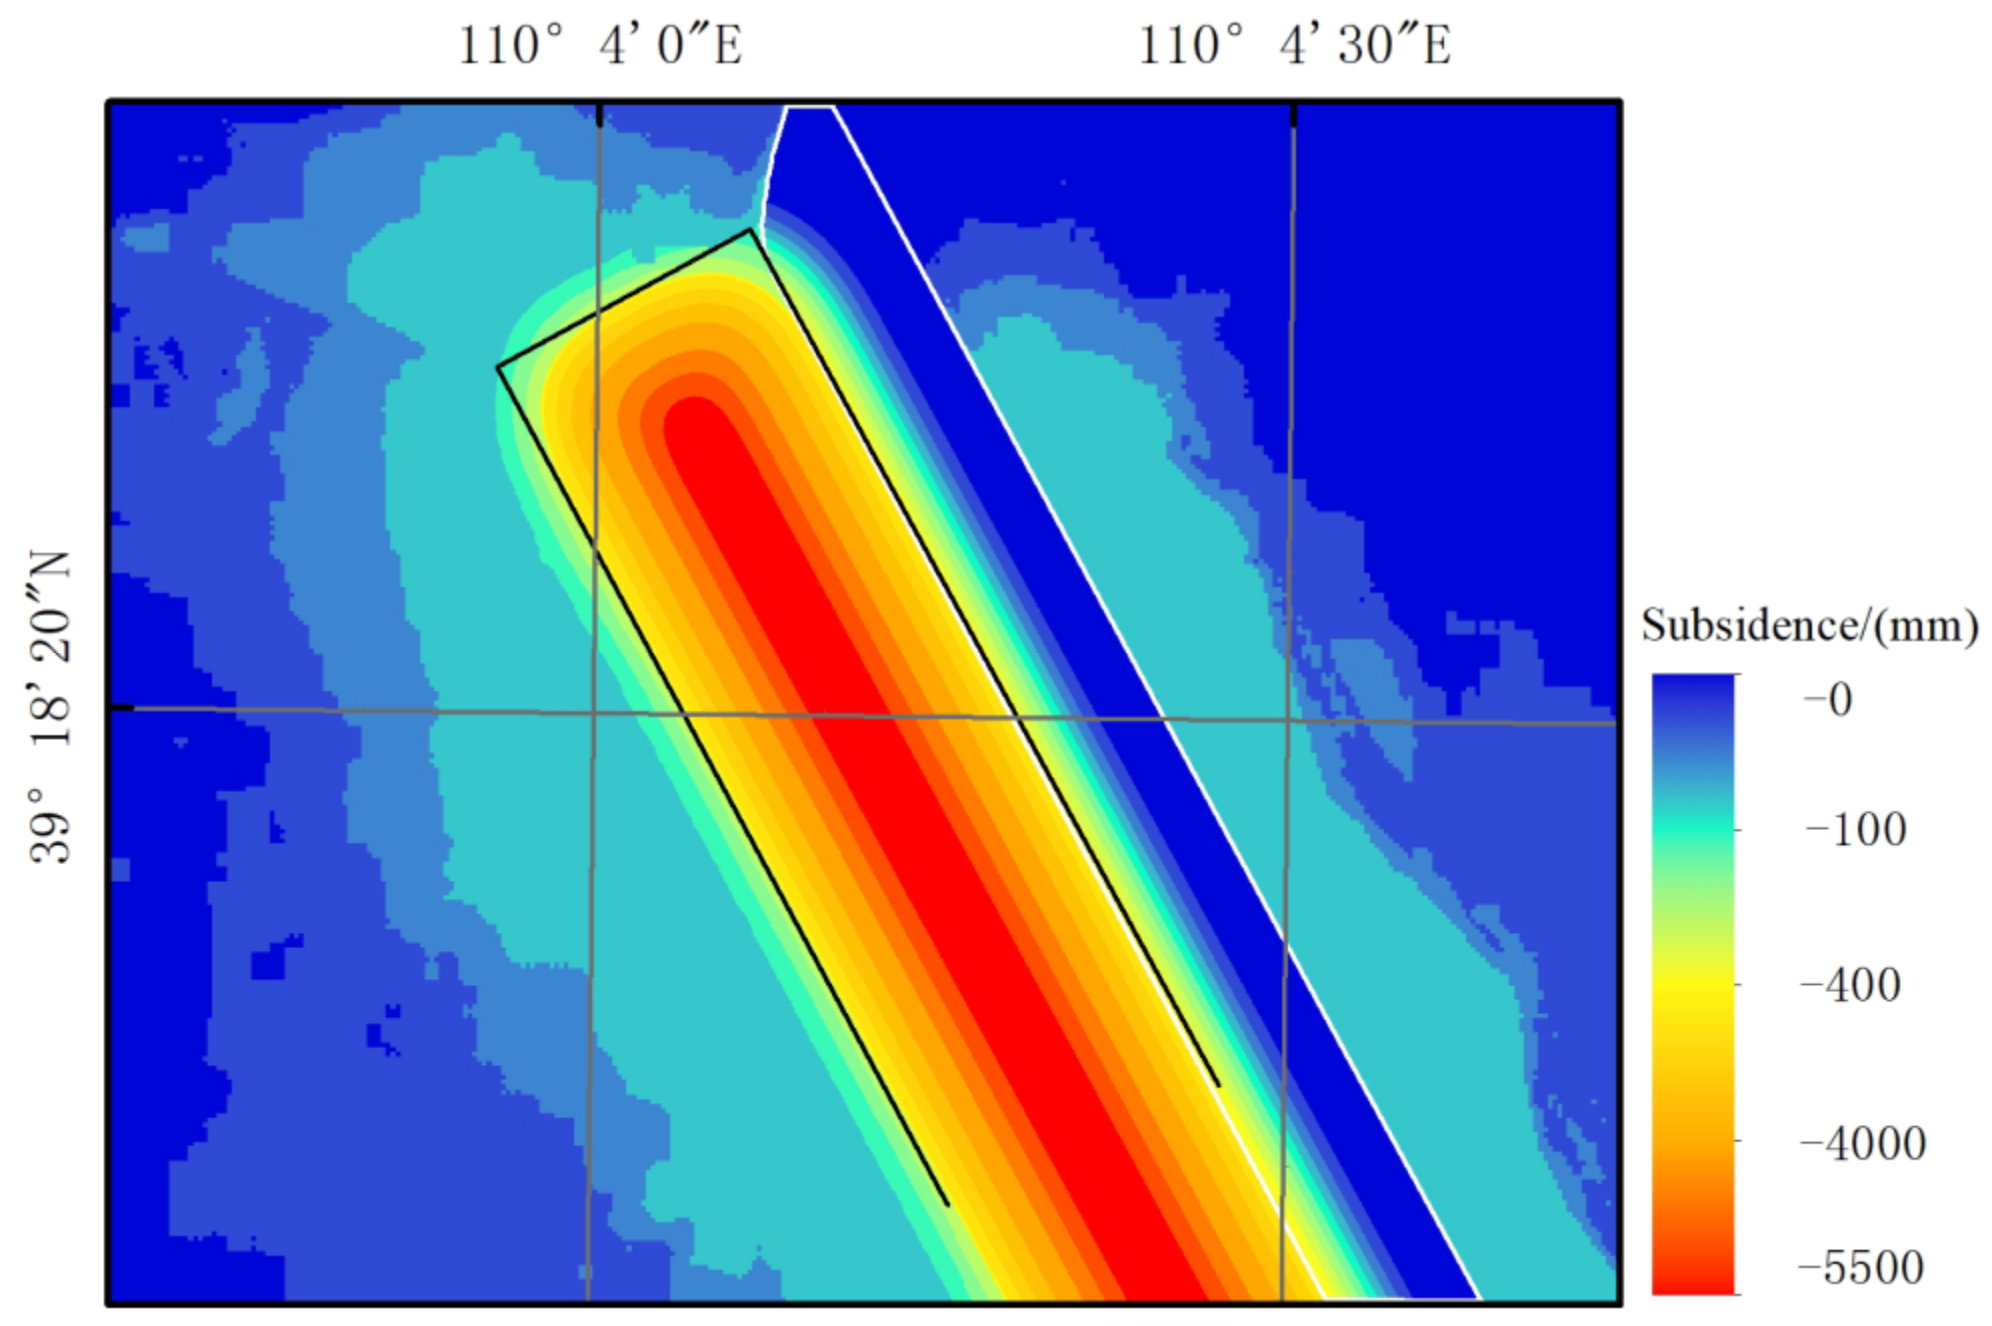
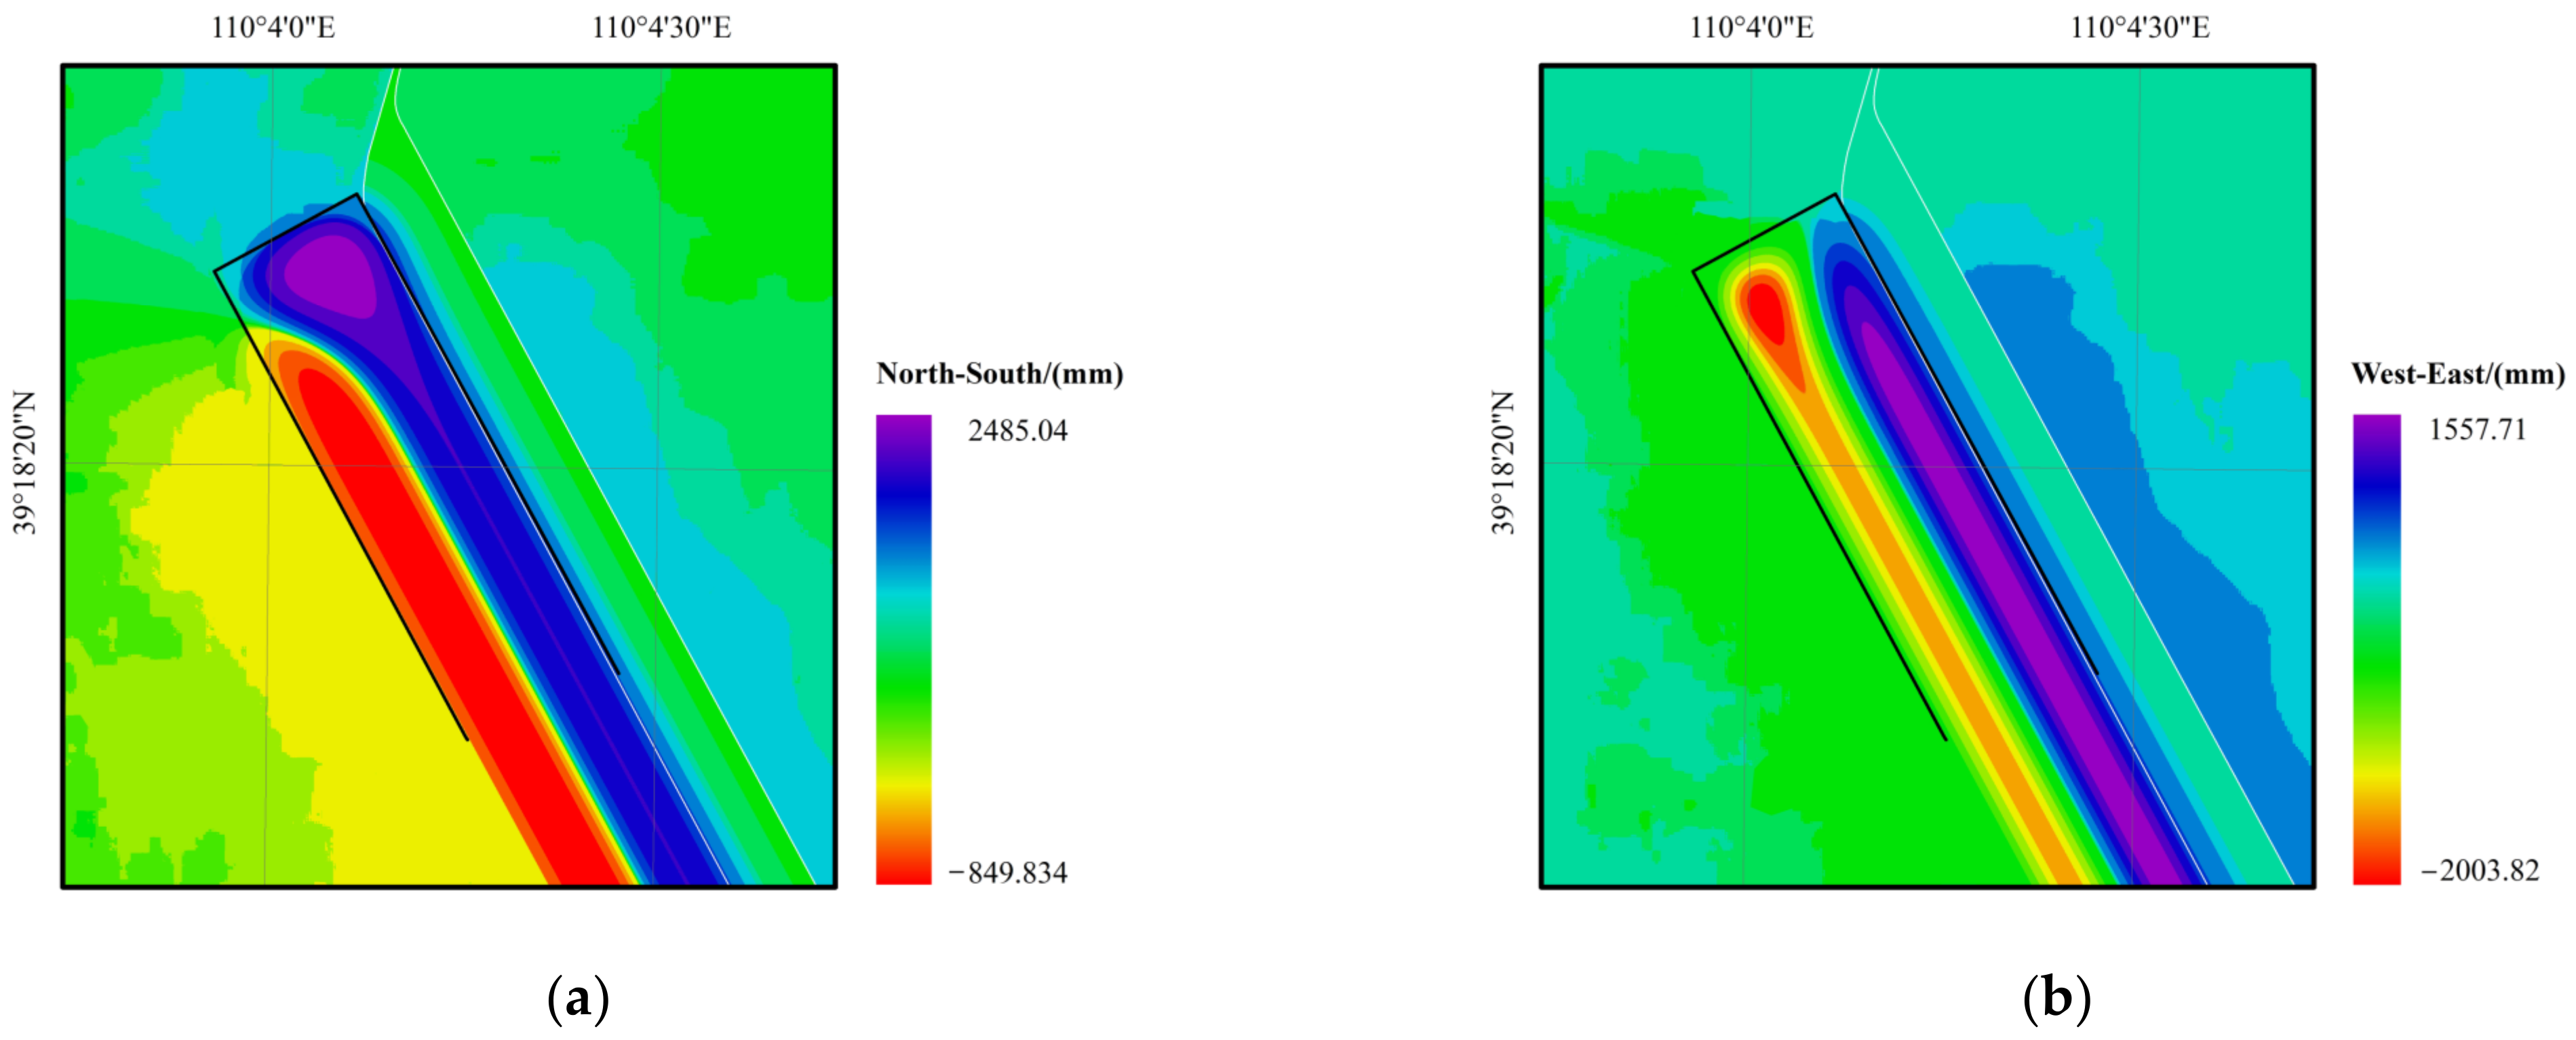
The subsidence basins monitored by InSAR generally show a certain degree of skewness, and even some regions show surface uplift, which is difficult to reflect in the real surface deformation. The horizontal movement direction field of the mining area surface based on the PIM is consistent with the characteristics of the horizontal displacement of the surface. Compared with the depression angle field of the displacement vector and the surface subsidence information obtained by the method, the 3D deformation information of the whole basin is obtained, which makes up for the shortage of using the PIM or InSAR technology alone.
(3)
For the subsidence basin obtained with the proposed method, the subsidence in the edge area is obtained by the depression angle model combined with InSAR, and the RMSE tested by the measured value is 10 mm. The monitoring accuracy is 85% and 84% higher than that of InSAR and PIM, respectively. The RMSE of the weighted fusion area is 80 mm, and the monitoring accuracy improved by 63% and 40%, respectively. The overall RMSE of the two areas is 42 mm, and the monitoring accuracy improved by 66% and 44%, respectively. This shows that the proposed method can obtain more accurate surface subsidence information around the mining area, and the overall subsidence is more consistent with the actual situation.
For a few working faces that are similar to the study area, the LOS deformation monitored by InSAR shows the phenomenon of surface uplift in some areas. In the transition area between subsidence and uplift, the LOS direction is nearly perpendicular to the true deformation vector. Thus, it is difficult for InSAR to obtain reliable deformation information. To solve this problem, SAR data of ascending and descending orbits can be used to obtain complementary surface deformation information. For most other mining areas, the results of InSAR only show surface subsidence, and the deformation in the effective monitoring area of InSAR can be considered reliable deformation information. Based on the proposed method, the entire subsidence basin with higher accuracy can be obtained. In the subsequent study, higher resolution or L-band SAR data are used to obtain the LOS deformation of the whole basin to further verify the effectiveness of this method.

Author Contributions

Conceptualization, Z.W. and Y.Y.; methodology, Z.W.; software, Z.W. and J.R.; formal analysis, Z.W., Y.Y. and H.D.; resources, H.D.; writing—original draft preparation, Z.W. and Y.Y.; writing—review and editing, Z.W. and Y.Y. and J.L.; project administration, H.D. All authors have read and agreed to the published version of the manuscript.

Funding

This research was funded by The National Natural Science Foundation of China (Grant No. 51704205, 51574242, 51404272).

Data Availability Statement

Not applicable.

Acknowledgments

Thanks to the European Space Agency (ESA) for providing Sentinel-1A SAR data and help from the relevant technicians of Shangwan Mine.

Conflicts of Interest

The authors declare no conflict of interest.

References

  1. Cui, X.M.; Che, Y.H.; Malinowska, A.; Zhao, Y.L.; Li, P.X.; Hu, Q.F.; Kang, X.L.; Bai, Z.H. Method and problems for subsidence prediction in entire process induced by underground mining. J. China Coal Soc. 2022, 47, 2170–2181. [Google Scholar]
  2. Wang, L.; Teng, C.Q.; Jiang, K.G.; Jiang, C.; Zhu, S.J. D-InSAR Monitoring Method of Mining Subsidence Based on Boltzmann and Its Application in Building Mining Damage Assessment. KSCE J. Civ. Eng. 2022, 26, 353–370. [Google Scholar] [CrossRef]
  3. Yang, Z.; Li, W.P.; Li, X.Q.; Wang, Q.Q.; He, J.H. Assessment of eco-geo-environment quality using multivariate data: A case study in a coal mining area of Western China. Ecol. Indic. 2019, 107, 105651. [Google Scholar] [CrossRef]
  4. Tang, F.Q. Mining subsidence monitoring using the method of combining InSAR and GPS technology. J. Coal Sci. Eng. 2011, 17, 133–136. [Google Scholar] [CrossRef]
  5. Klein, E.; Vigny, C.; Fleitout, L.; Grandin, R.; Jolivet, R.; Rivera, E.; Métois, M. A comprehensive analysis of the Illapel 2015 Mw8.3 earthquake from GPS and InSAR data. Earth Planet. Sci. Lett. 2017, 469, 123–134. [Google Scholar] [CrossRef] [Green Version]
  6. Vajedian, S.; Motagh, M.; Mousavi, Z.; Motaghi, K.; Fielding, E.J.; Akbari, B.; Wetzel, H.-U.; Darabi, A. Coseismic Deformation Field of the Mw 7.3 12 November 2017 Sarpol-e Zahab (Iran) Earthquake: A Decoupling Horizon in the Northern Zagros Mountains Inferred from InSAR Observations. Remote Sens. 2018, 10, 1589. [Google Scholar] [CrossRef] [Green Version]
  7. Sadeghi, T.J.; Wright, A.J.; Hooper, C.; Jordan, A.; Novellino, L.; Bateson, J. Biggs, Benchmarking and inter-comparison of Sentinel-1 InSAR velocities and time series. Remote Sens. Environ. 2021, 256, 112306. [Google Scholar]
  8. Eshqi Molan, Y.; Kim, J.-W.; Lu, Z.; Wylie, B.; Zhu, Z. Modeling Wildfire-Induced Permafrost Deformation in an Alaskan Boreal Forest Using InSAR Observations. Remote Sens. 2018, 10, 405. [Google Scholar] [CrossRef] [Green Version]
  9. Del Soldato, M.; Solari, L.; Raspini, F.; Bianchini, S.; Ciampalini, A.; Montalti, R.; Ferretti, A.; Pellegrineschi, V.; Casagli, N. Monitoring Ground Instabilities Using SAR Satellite Data: A Practical Approach. ISPRS Int. J. Geo-Inf. 2019, 8, 307. [Google Scholar] [CrossRef] [Green Version]
  10. Xia, Y.P.; Wang, Y.J. InSAR- and PIM-Based Inclined Goaf Determination for Illegal Mining Detection. Remote Sens. 2020, 12, 3884. [Google Scholar] [CrossRef]
  11. Shi, M.; Yang, H.; Wang, B.; Peng, J.; Gao, Z.; Zhang, B. Improving Boundary Constraint of Probability Integral Method in SBAS-InSAR for Deformation Monitoring in Mining Areas. Remote Sens. 2021, 13, 1497. [Google Scholar] [CrossRef]
  12. Chen, Y.; Yu, S.; Tao, Q.; Liu, G.; Wang, L.; Wang, F. Accuracy Verification and Correction of D-InSAR and SBAS-InSAR in Monitoring Mining Surface Subsidence. Remote Sens. 2021, 13, 4365. [Google Scholar] [CrossRef]
  13. Xu, Y.; Li, T.; Tang, X.; Zhang, X.; Fan, H.; Wang, Y. Research on the Applicability of DInSAR, Stacking-InSAR and SBAS-InSAR for Mining Region Subsidence Detection in the Datong Coalfield. Remote Sens. 2022, 14, 3314. [Google Scholar] [CrossRef]
  14. Li, Y.x.; Yang, K.m.; Zhang, J.h.; Hou, Z.x.; Wang, S.; Ding, X.m. Research on time series InSAR monitoring method for multiple types of surface deformation in mining area. Nat. Hazards. 2022, 114, 2479–2508. [Google Scholar] [CrossRef]
  15. Palamà, R.; Crosetto, M.; Rapinski, J.; Barra, A.; Cuevas-González, M.; Monserrat, O.; Crippa, B.; Kotulak, N.; Mróz, M.; Mleczko, M. A Multi-Temporal Small Baseline Interferometry Procedure Applied to Mining-Induced Deformation Monitoring. Remote Sens. 2022, 14, 2182. [Google Scholar] [CrossRef]
  16. Wang, J.; Wang, C.; Zhang, H.; Tang, Y.; Zhang, X.; Zhang, Z. Small-Baseline Approach for Monitoring the Freezing and Thawing Deformation of Permafrost on the Beiluhe Basin, Tibetan Plateau Using TerraSAR-X and Sentinel-1 Data. Sensors 2020, 20, 4464. [Google Scholar] [CrossRef]
  17. Luebeck, D.; Wimmer, C.F.; Moreira, L.; Alcântara, M.; Oré, G.A.; Góes, J.P.; Oliveira, L.; Teruel, B.S.; Bins, L.H.; Gabrielli, L.; et al. Drone-borne Differential SAR Interferometry. Remote Sens. 2020, 12, 778. [Google Scholar] [CrossRef] [Green Version]
  18. Tao, Q.X.; Liu, G.L.; Liu, W.K. Analysis of capabilities of L and C-band SAR data to monitor mining-induced subsidence. Chin. J. Geophys. 2012, 55, 3681–3689. [Google Scholar]
  19. Zhu, J.J.; Yang, Z.F.; Li, Z.W. Recent progress in retrieving and predicting mining induced 3D displacements using InSAR. Acta Geodaetica et Cartographica Sinica 2019, 48, 135–144. [Google Scholar]
  20. Samsonov, S.; d’Oreye, N.; Smets, B. Ground deformation associated with post-mining activity at the French–German border revealed by novel InSAR time series method. Int. J. Appl. Earth Obs. Geoinf. 2013, 23, 142–154. [Google Scholar]
  21. Zhu, J.J.; Li, Z.W.; Hu, J. Research progress and methods of InSAR for deformation monitoring. Acta Geod. Cartogr. Sinica 2017, 46, 1717–1733. [Google Scholar]
  22. Yang, Z.; Li, Z.; Zhu, J.; Feng, G.; Wang, Q.; Hu, J.; Wang, C. Deriving time-series three-dimensional displacements of mining areas from a single-geometry InSAR dataset. J. Geod. 2018, 92, 529–544. [Google Scholar] [CrossRef]
  23. Yang, Z.F.; Li, Z.W.; Zhu, J.J.; Preusse, A.; Hu, J.; Feng, G.C.; Yi, H.W.; Papst, M. An alternative method for estimating 3-D large displacements of mining areas from a single SAR amplitude pair using offset tracking. IEEE Trans. Geosci. Remote Sens. 2018, 56, 3645–3656. [Google Scholar] [CrossRef]
  24. Jiang, C.; Wang, L.; Yu, X.X.; Chi, S.S.; Tao, W.; Wang, X.L. DPIM-Based InSAR Phase Unwrapping Model and a 3D Mining-Induced Surface Deformation Extracting Method: A Case of Huainan Mining Area. KSCE J. Civ. Eng. 2021, 25, 654–668. [Google Scholar] [CrossRef]
  25. Diao, X.P.; Wu, K.; Hu, D.H.; Li, L.; Zhou, D.W. Combining differential SAR interferometry and the probability integral method for three-dimensional deformation monitoring of mining areas. Int. J. Remote Sens. 2016, 37, 5196–5212. [Google Scholar] [CrossRef]
  26. Tang, F.Q.; Dong, L.K.; Wang, Z.L.; Huang, J.C. A 3-D inversion model for InSAR detected displacements based on ground subsidence symmetry induced by horizontal coal mining. J. China Coal Soc. 2019, 44, 210–220. [Google Scholar]
  27. Fan, H.D.; Wang, L.; Wen, B.F.; Du, S. A new model for three-dimensional deformation extraction with single-track insar based on mining subsidence characteristics. Int. J. Appl. Earth Obs. Geoinf. 2021, 94, 102223. [Google Scholar] [CrossRef]
  28. Luo, H.B.; Li, Z.H.; Chen, J.J.; Pearson, C.; Wang, M.M.; Lv, W.C.; Ding, H.Y. Integration of range split spectrum interfer-ometry and conventional InSAR to monitor large gradient surface displacements. Int. J. Appl. Earth Obs. Geoinf. 2019, 74, 130–137. [Google Scholar]
  29. He, G.Q. Mining Subsidence; China University of Mining and Technology Press: Xuzhou, China, 1991. [Google Scholar]
  30. Chen, Y.; Tao, Q.X.; Liu, G.L.; Wang, L.Y.; Wang, F.Y.; Wang, K. Detailed mining subsidence monitoring combined with InSAR and probability integral method. Chin. J. Geophys. 2021, 64, 3554–3566. [Google Scholar]
  31. Tan, Z.X.; Yang, J.W.; Deng, K.Z. Study on method of mining subsidence parameters calculating for whole basin of mining area based on SBAS-InSAR. Coal Sci. Technol. 2021, 49, 312–318. [Google Scholar]
  32. Hou, Z.X.; Yang, K.M.; Li, Y.R.; Gao, W.; Wang, S.; Ding, X.M.; Li, Y.X. Dynamic prediction model of mining subsidence combined with D-InSAR technical parameter inversion. Environ. Earth Sci. 2022, 81, 307. [Google Scholar] [CrossRef]
  33. Zhang, W.H.; Shi, J.C.; Yi, H.W.; Zhu, Y.; Xu, B. Underground Goaf Parameters Estimation by Cross-Iteration with InSAR Measurements. Remote Sens. 2021, 13, 3204. [Google Scholar] [CrossRef]
  34. Zhang, Y.F.; Lian, X.G.; Ge, L.L.; Liu, X.Y.; Du, Z.Y.; Yang, W.F.; Wu, Y.R.; Hu, H.F.; Cai, Y.F. Surface Subsidence Monitoring Induced by Underground Coal Mining by Combining DInSAR and UAV Photogrammetry. Remote Sens. 2022, 14, 4711. [Google Scholar] [CrossRef]
  35. Zhang, K.; Li, Q.S.; Dai, H.Y.; Guo, J.T.; Yan, Y.G. Research on integrated monitoring technology and practice of “space-sky-ground” on surface movement in mining area. Coal Sci. Technol. 2020, 48, 207–213. [Google Scholar]
  36. Baran, I.; Stewart, M.; Claessens, S. A new functional model for determining minimum and maximum detectable deformation gradient resolved by satellite radar interferometry. IEEE Trans. Geosci. Remote Sens. 2005, 43, 675–682. [Google Scholar] [CrossRef]
  37. Hao, Y.J.; Wu, L.X.; Dai, H.Y. Establish ground settlement prediction model with elastic slab theory. Chin. J. Rock Mech. Eng. 2006, 25, 2958–2962. [Google Scholar]
  38. Wang, J.B.; Liu, X.R.; Liu, X.J. Dynamic prediction model for mining subsidence. J. China Coal Soc. 2015, 40, 516–521. [Google Scholar]
Figure 1. Study area.
Remotesensing 15 01834 g001
Figure 2. Images from the field study.
Remotesensing 15 01834 g002
Figure 3. Technical process.
Remotesensing 15 01834 g003
Figure 4. Change in depression angles of surface points on main profile.
Remotesensing 15 01834 g004
Figure 5. Simulated subsidence basin with strike under ultra-full mining.
Remotesensing 15 01834 g005
Figure 6. Comparisons of the main profiles of the strike in a subsidence basin.
Remotesensing 15 01834 g006
Figure 7. Comparisons of the depression angles of the strike main profile.
Remotesensing 15 01834 g007
Figure 8. The spatial relationships between dvertical, d, dhorizontal, and dlos.
Remotesensing 15 01834 g008
Figure 9. Characteristics of surface horizontal displacement vectors.
Remotesensing 15 01834 g009
Figure 10. Example verification of the depression angle model.
Remotesensing 15 01834 g010
Figure 11. Time-series accumulated settlement of InSAR: (a) 12 April 2018, (b) 18 May 2018, (c) 23 June 2018, (d) 29 July 2018, (e) 22 August 2018, (f) 27 September 2018, (g) 18 February 2019, and (h) 13 May 2019.
Remotesensing 15 01834 g011
Figure 12. Subsidence basin based on PIM (Side of open-off cut).
Remotesensing 15 01834 g012
Figure 13. Some deformation field components: (a) horizontal movement direction field, (b) horizontal movement field, and (c) depression angle field.
Remotesensing 15 01834 g013
Figure 14. Subsidence calculated by InSAR combined with depression angle model.
Remotesensing 15 01834 g014
Figure 15. The 3D deformation maps; (a) 3D LOS deformation; and (b) 3D deformation of proposed model.
Remotesensing 15 01834 g015
Figure 16. Subsidence results after fusion.
Remotesensing 15 01834 g016
Figure 17. Comparisons of the deformation calculated by different methods.
Remotesensing 15 01834 g017
Figure 18. Subsidence results after weighted fusion.
Remotesensing 15 01834 g018
Figure 19. Horizontal movement in the north–south (a) and east–west (b) directions.
Remotesensing 15 01834 g019
Figure 20. Comparison of monitoring results. (A) Monitoring results of dip main section. (ac) Comparisons of monitoring results from L29 to L43 by different methods. (d) Comparisons of monitoring results from L1 to L7.
Remotesensing 15 01834 g020
Figure 21. Subsidence basins. (a) Subsidence basin by PIM. (b) Simulated LOS subsidence basin.
Remotesensing 15 01834 g021
Figure 22. Relative errors of different values of r. (a) r is 112 m; (b) r is 208 m.
Remotesensing 15 01834 g022
Figure 23. Comparison of deformations under different r. (a) The open-off cut area; (b) the edge area.
Remotesensing 15 01834 g023
Table 1. Basic parameters of Sentinel-1A.
Basic ParametersSentinel-1A
OrbitSun synchronous orbit
Orbital altitude/km693
Orbit inclination/(°)98.18
Angle of incidence18.3°~46.8°
Revisit period/d12
Imaging modeIW
BandC
Central incidence angle/(°)38.92
Cartographic resolution/m20 × 20
Table 2. Error analysis.
MethodsEdge Subsidence Area (L1~L7, L35~L43)
RMSE/mm
Weighted Fusion Area (L29~L34)
RMSE/mm
Overall Results (L1~L7, L35~L43, and L29~L34)
RMSE/mm
InSAR65214124
InSAR+ depression angle model10180113
PIM6113375
weighted fusion108042
Disclaimer/Publisher’s Note: The statements, opinions and data contained in all publications are solely those of the individual author(s) and contributor(s) and not of MDPI and/or the editor(s). MDPI and/or the editor(s) disclaim responsibility for any injury to people or property resulting from any ideas, methods, instructions or products referred to in the content.

