1. Introduction
The analysis of an inhabited geographical area, in this case the Jijia River catchment, is, regardless of the nature of the study, closely related to the interpretation of physical-geographical, geological, pedological, hydrographic, climatic, floristic and faunistic characteristics. The natural environment, together with its particularities, had a major impact on prehistoric communities in general, and on their behavior in particular, as micro- and macro-regional geographical features create the spatial background for human group development. The analysis and interpretation of geomorphological aspects, such as slopes, their exposures to the sun and the characteristics of the micro-areas in which the settlements are located (plateau, terraces, denudation surfaces, etc.) provide important information on the criteria taken into account by past communities when choosing the location of the settlement, thus facilitating the understanding of their behavioral component.
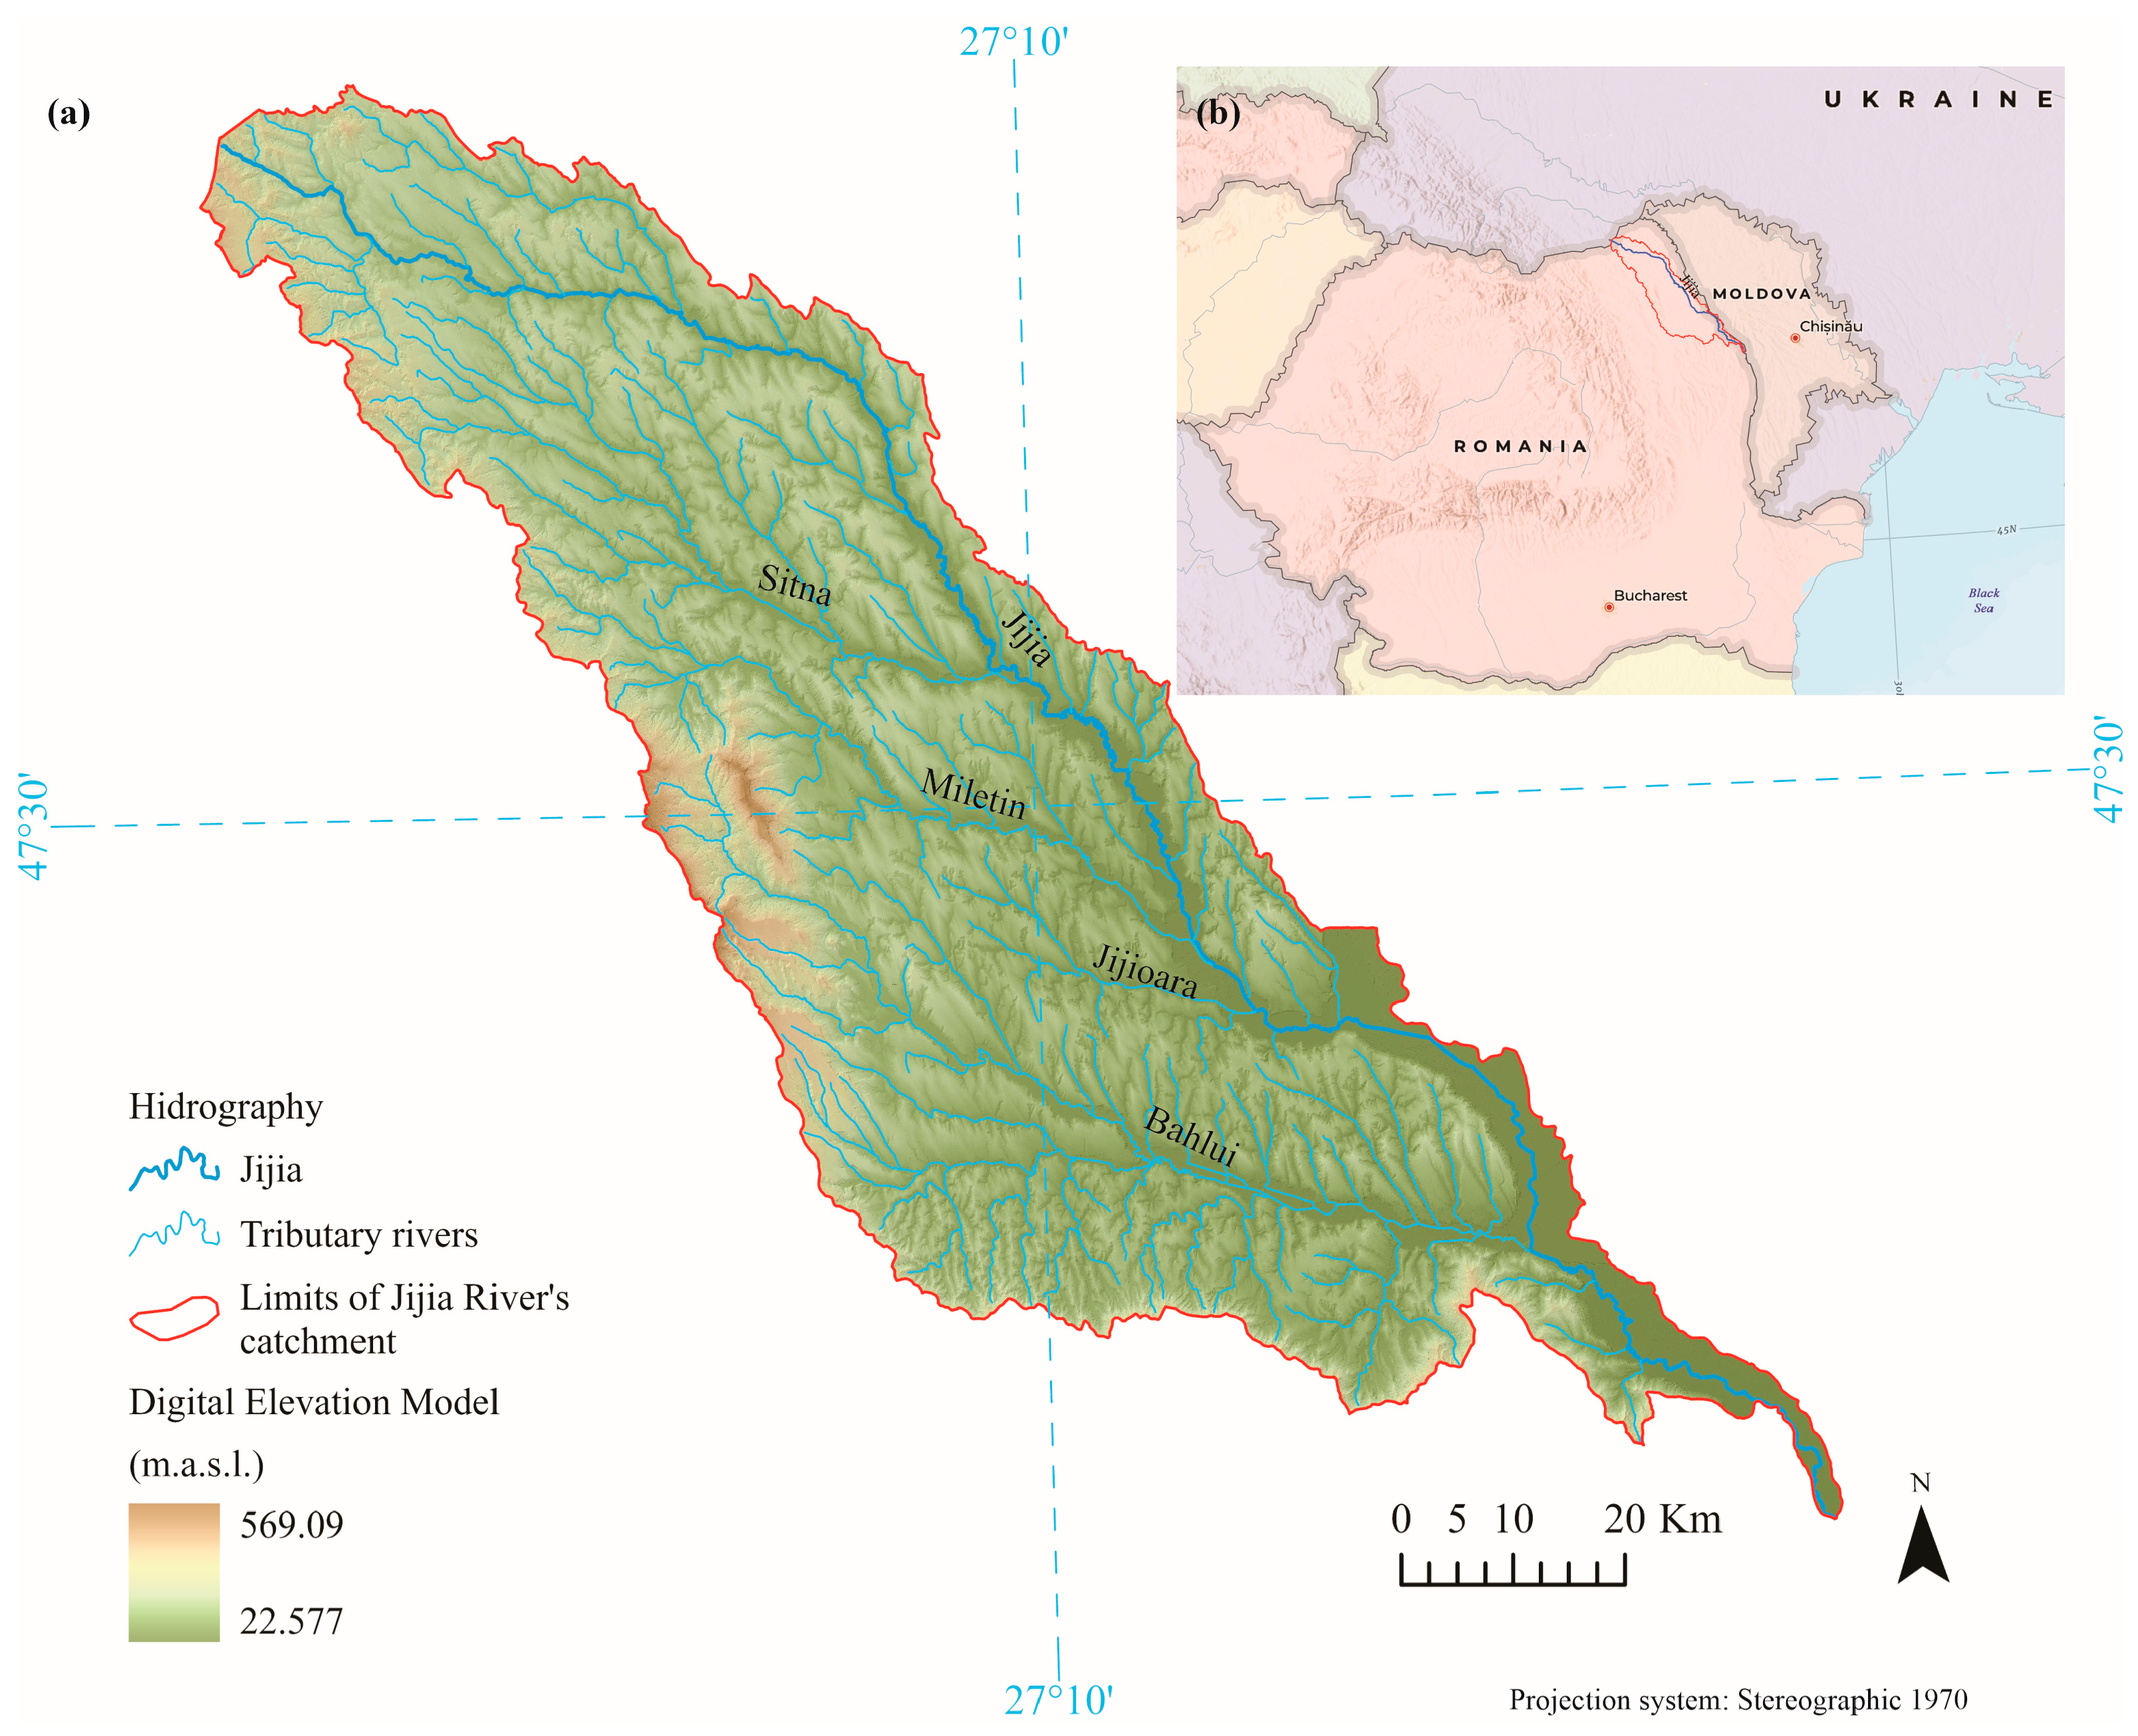
The Jijia River springs in Ukraine, at an altitude of over 400 m.a.s.l., and continues its route approx. 275 km, until its confluence with the Prut River (
Figure 1), carving the physical–geographical unit known as the Jijia Depression of Jijia Hills [
1]. It is clearly bordered, to the north and east by the Prut River, and to the west and south by the so-called Moldavian Coast/Iași Coast. The surface of the area, due to the inclination of the geological layers, presents an asymmetry oriented on the NNW-SSE direction. The consequence of this asymmetry relies on the fact that the north-oriented hillslopes are cuesta scarps, while the south-oriented ones are cuesta dip slopes [
2].
This workspace was selected due to the high density of archaeological sites specific for the prehistoric times, such as Chalcolithic (represented by Cucuteni culture) or Late Bronze Age (LBA) (characterized by the presence of Noua culture communities). This intense habitation reflects the physical–geographical characteristics that describe the area in question, making it suitable for human development. Next, the chronological framework (the end of the Bronze Age) was selected, firstly because it benefits from a consistent number of discoveries (400 sites represented by settlements, necropolises or hoards), but also due to the lack of ‘modern’ research dedicated to it. During this chronological stage, the evolutions of the previous cultures (dating from the Middle Bronze Age) were continued or ended but, more importantly, two significant cultural complexes (Noua-Sabatinovka-Coslogeni and Zimnicea-Plovdiv) emerged as a result of contacts between the local human groups and the eastern as well as southern ones [
3]. In this paper, our focus is on the Noua-Sabatinovka-Coslogeni (NSC) complex. The communities specific for this wide cultural manifestation are documented in a vast area, from the middle and upper Dniester to the east of the Apuseni Mountains (western Romania), and from the sub-Carpathian region of Ukraine to the south of the forest-steppe zone between Siret and Prut Rivers, presenting local differences [
3]. As stated above, in our workspace, NSC is represented by the archaeological sites specific to Noua culture, this area being thought of as the most important territory of Noua culture development (along with the northwestern region of the Republic of Moldova) [
4], with the highest number of discoveries. From a chronological point of view (
Table 1), the radiocarbon data obtained for the Noua settlements located in eastern Romania [
5,
6], Transylvania [
7,
8,
9], the Republic of Moldova [
5,
10,
11] and Ukraine [
5,
12] place the cultural manifestation between 1600 and 1100 BCE.
Noua settlements have been the subject of numerous discussions within academic circles, most of which are contradictory, primarily due to the extremely wide area of site distribution. Other important reasons are the presence of so-called
ashmounds/ash-heaps/cinder-mounds/zolniki (grey, quasi-circular spots visible on the soil surface, with small elevations and diameters of 25–30 m) on the surface of numerous settlements, but most importantly, the relatively defective research in general. The ashmounds were first discovered at the end of the 19th to the beginning of the 20th century, being considered as places destined for votive offerings [
13] or remains of cremation barrows [
14]. Later, during the 1950s and 1960s, ashmounds started to be identified within the settlements belonging to NSC. This, along with their discussion in archaeology papers [
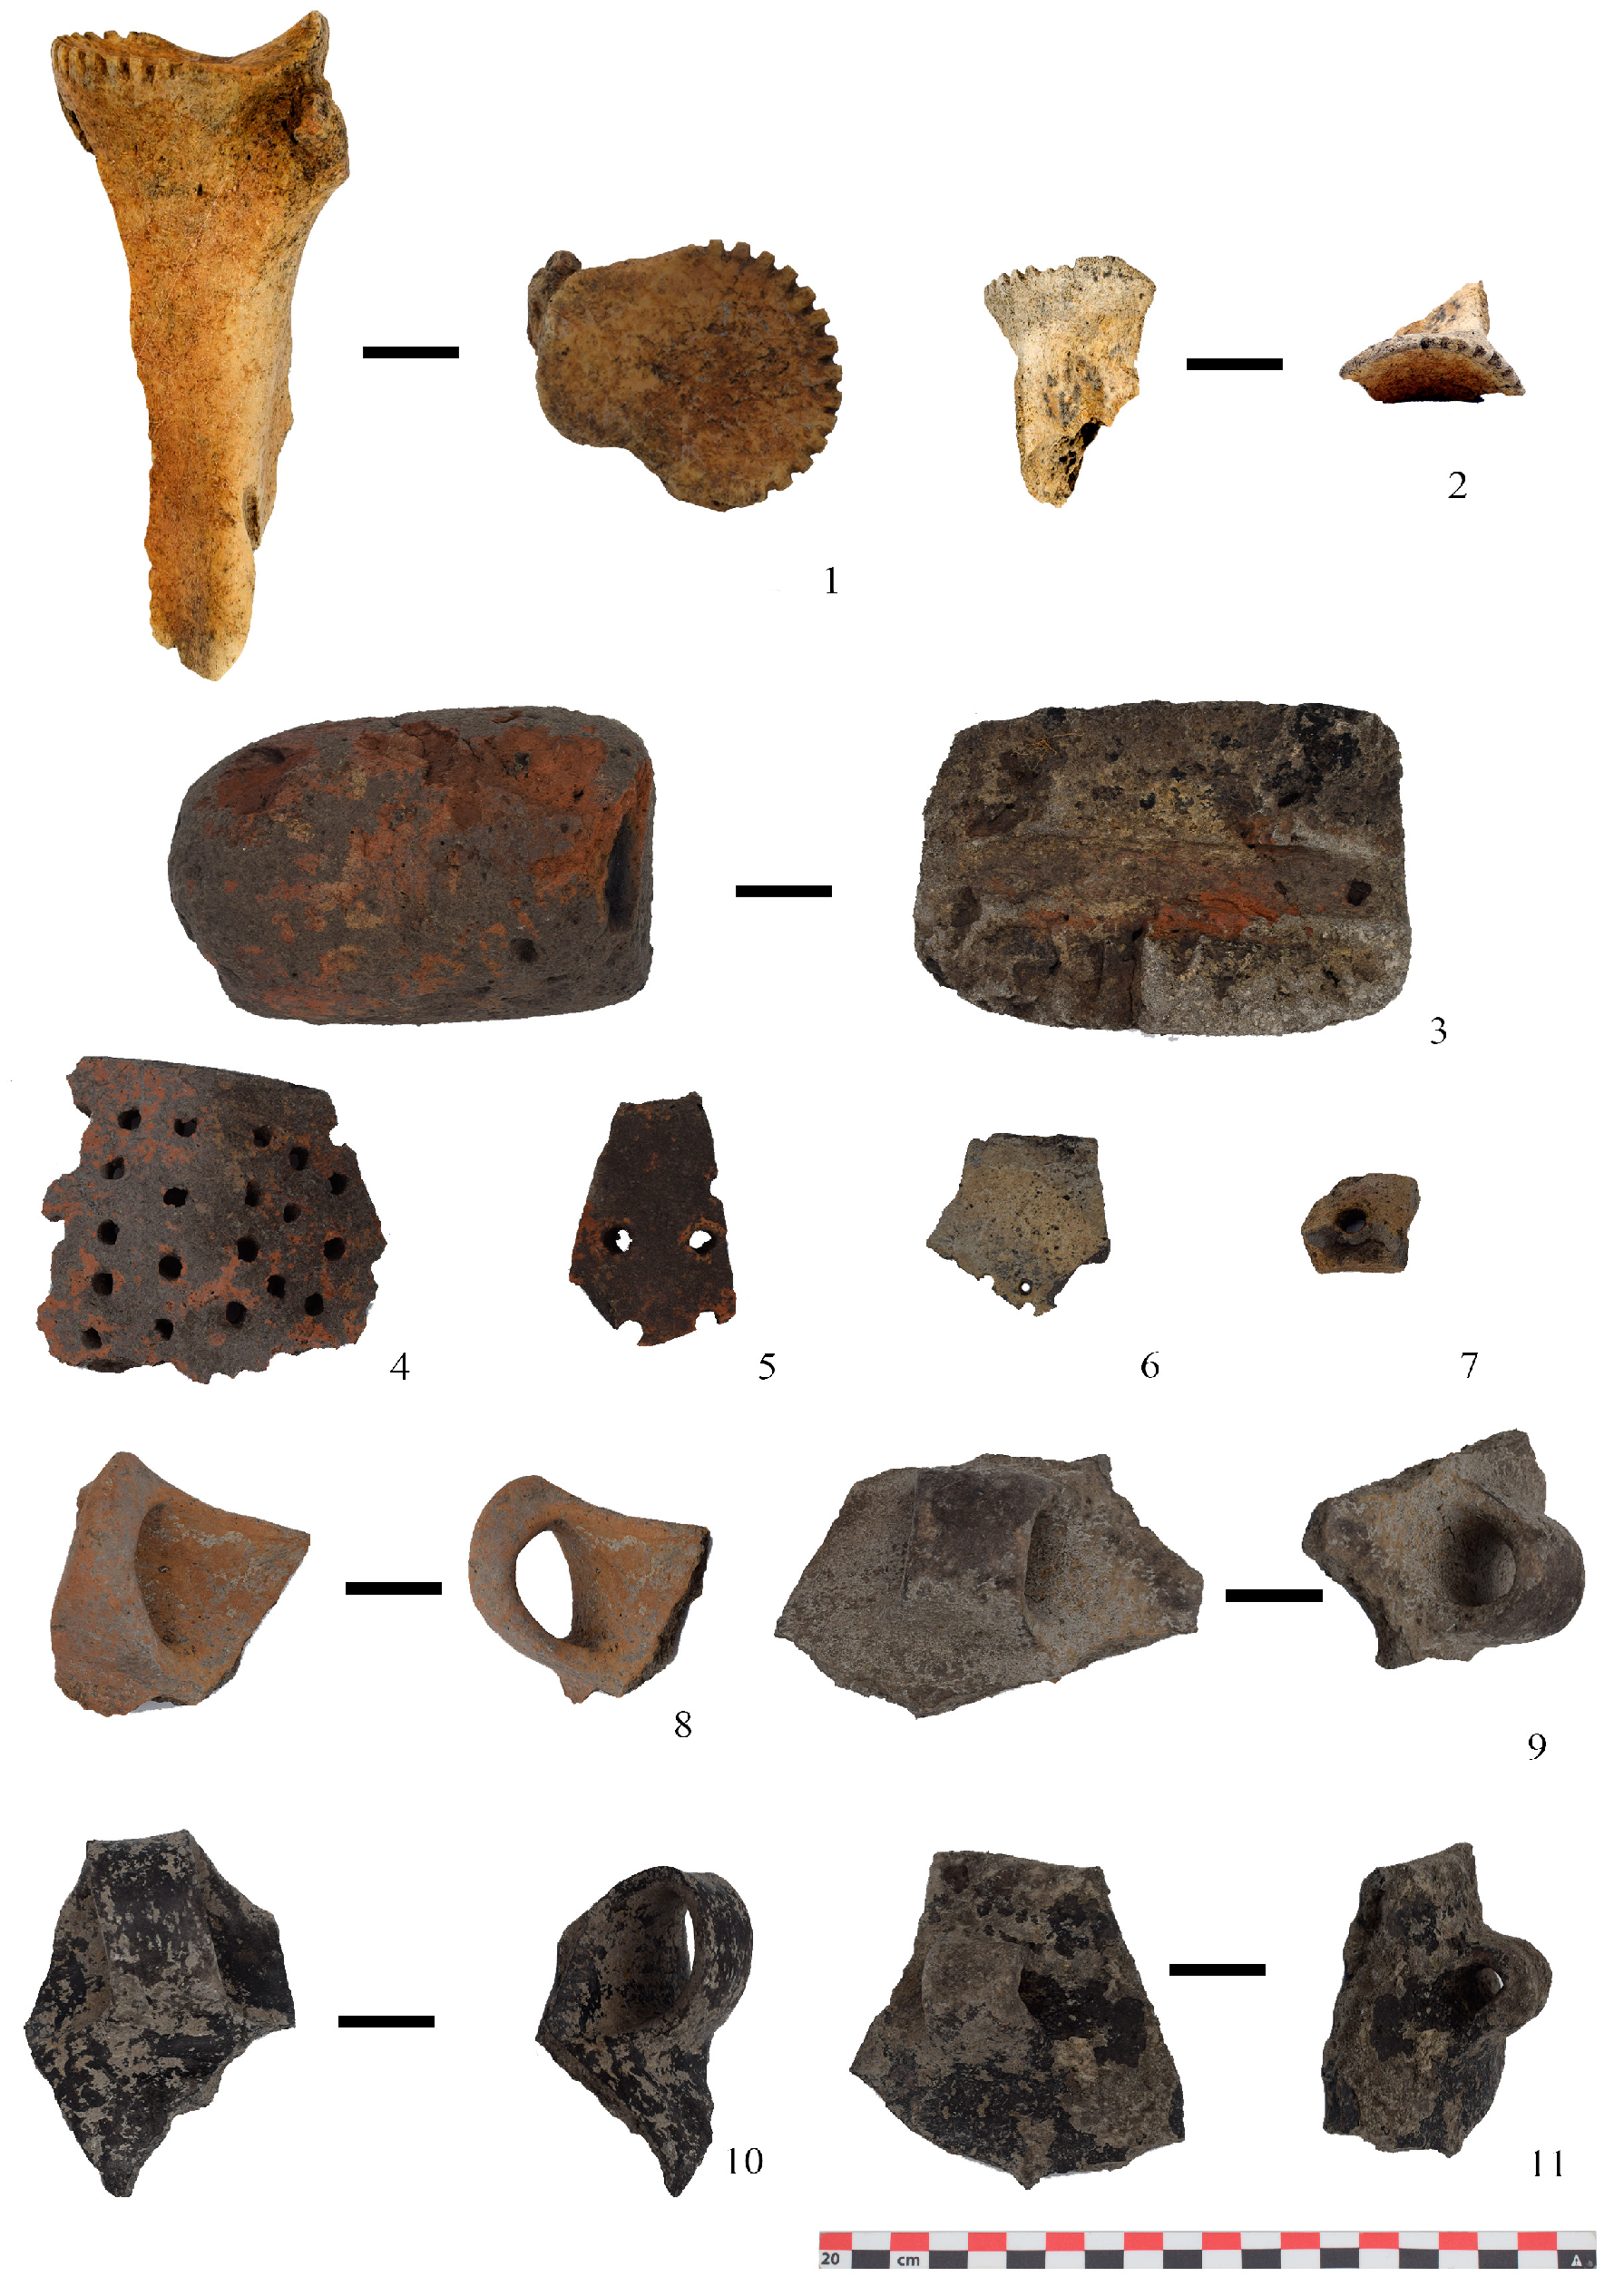
15], provoked numerous controversies regarding their possible functionality. The invasive research carried out so far allowed the identification, inside the ashmounds, of archaeological remains from hearths and surface-dwelling structures, built in the wattle-and-daub technique, along with an important osteological inventory of animal origin (crenated
scapulae,
tupik-sickles, needles, etc.), ceramic material (cups with one or two raised handles,
kantharos, jar-vessels), etc. (
Figure 2). Based on this, numerous opinions have been offered regarding the functionality of these structures, targeting five main directions of interpretation: burnt dwellings [
15,
16,
17,
18], sacred/votive/worship areas [
14,
19,
20,
21,
22,
23], multi-functional spaces [
8,
16,
24,
25,
26,
27,
28,
29,
30], landfills [
31,
32,
33,
34] or hearths [
35,
36]. Until recently, the interpretation as burned dwellings was very popular among researchers, but lately the results obtained by magnetic surveys and pedological analyses [
8,
11,
26], showed that fire took no part in obtaining the ash-like soil, thus the composition does not belong to burned dwellings or hearths. Recently, these structures started to be seen as possible household pits, whose content has led to changes in soil color [
11], thus sparking new controversies.
In this context, the aim of our paper is the identification and description of the relationship existing between the Noua communities from the Jijia River catchment and the occupied environment, with special emphasis on the settlements that present ashmounds on the soil surface. Thus, our study will discuss, from a spatial and a geomorphological point of view, the choices taken by the human groups of the Late Bronze Age. The present research also implied the usage of remote sensing techniques, especially aerial photography and geophysics, in order to obtain new data regarding the behavior of the communities in question.
2. Materials and Methods
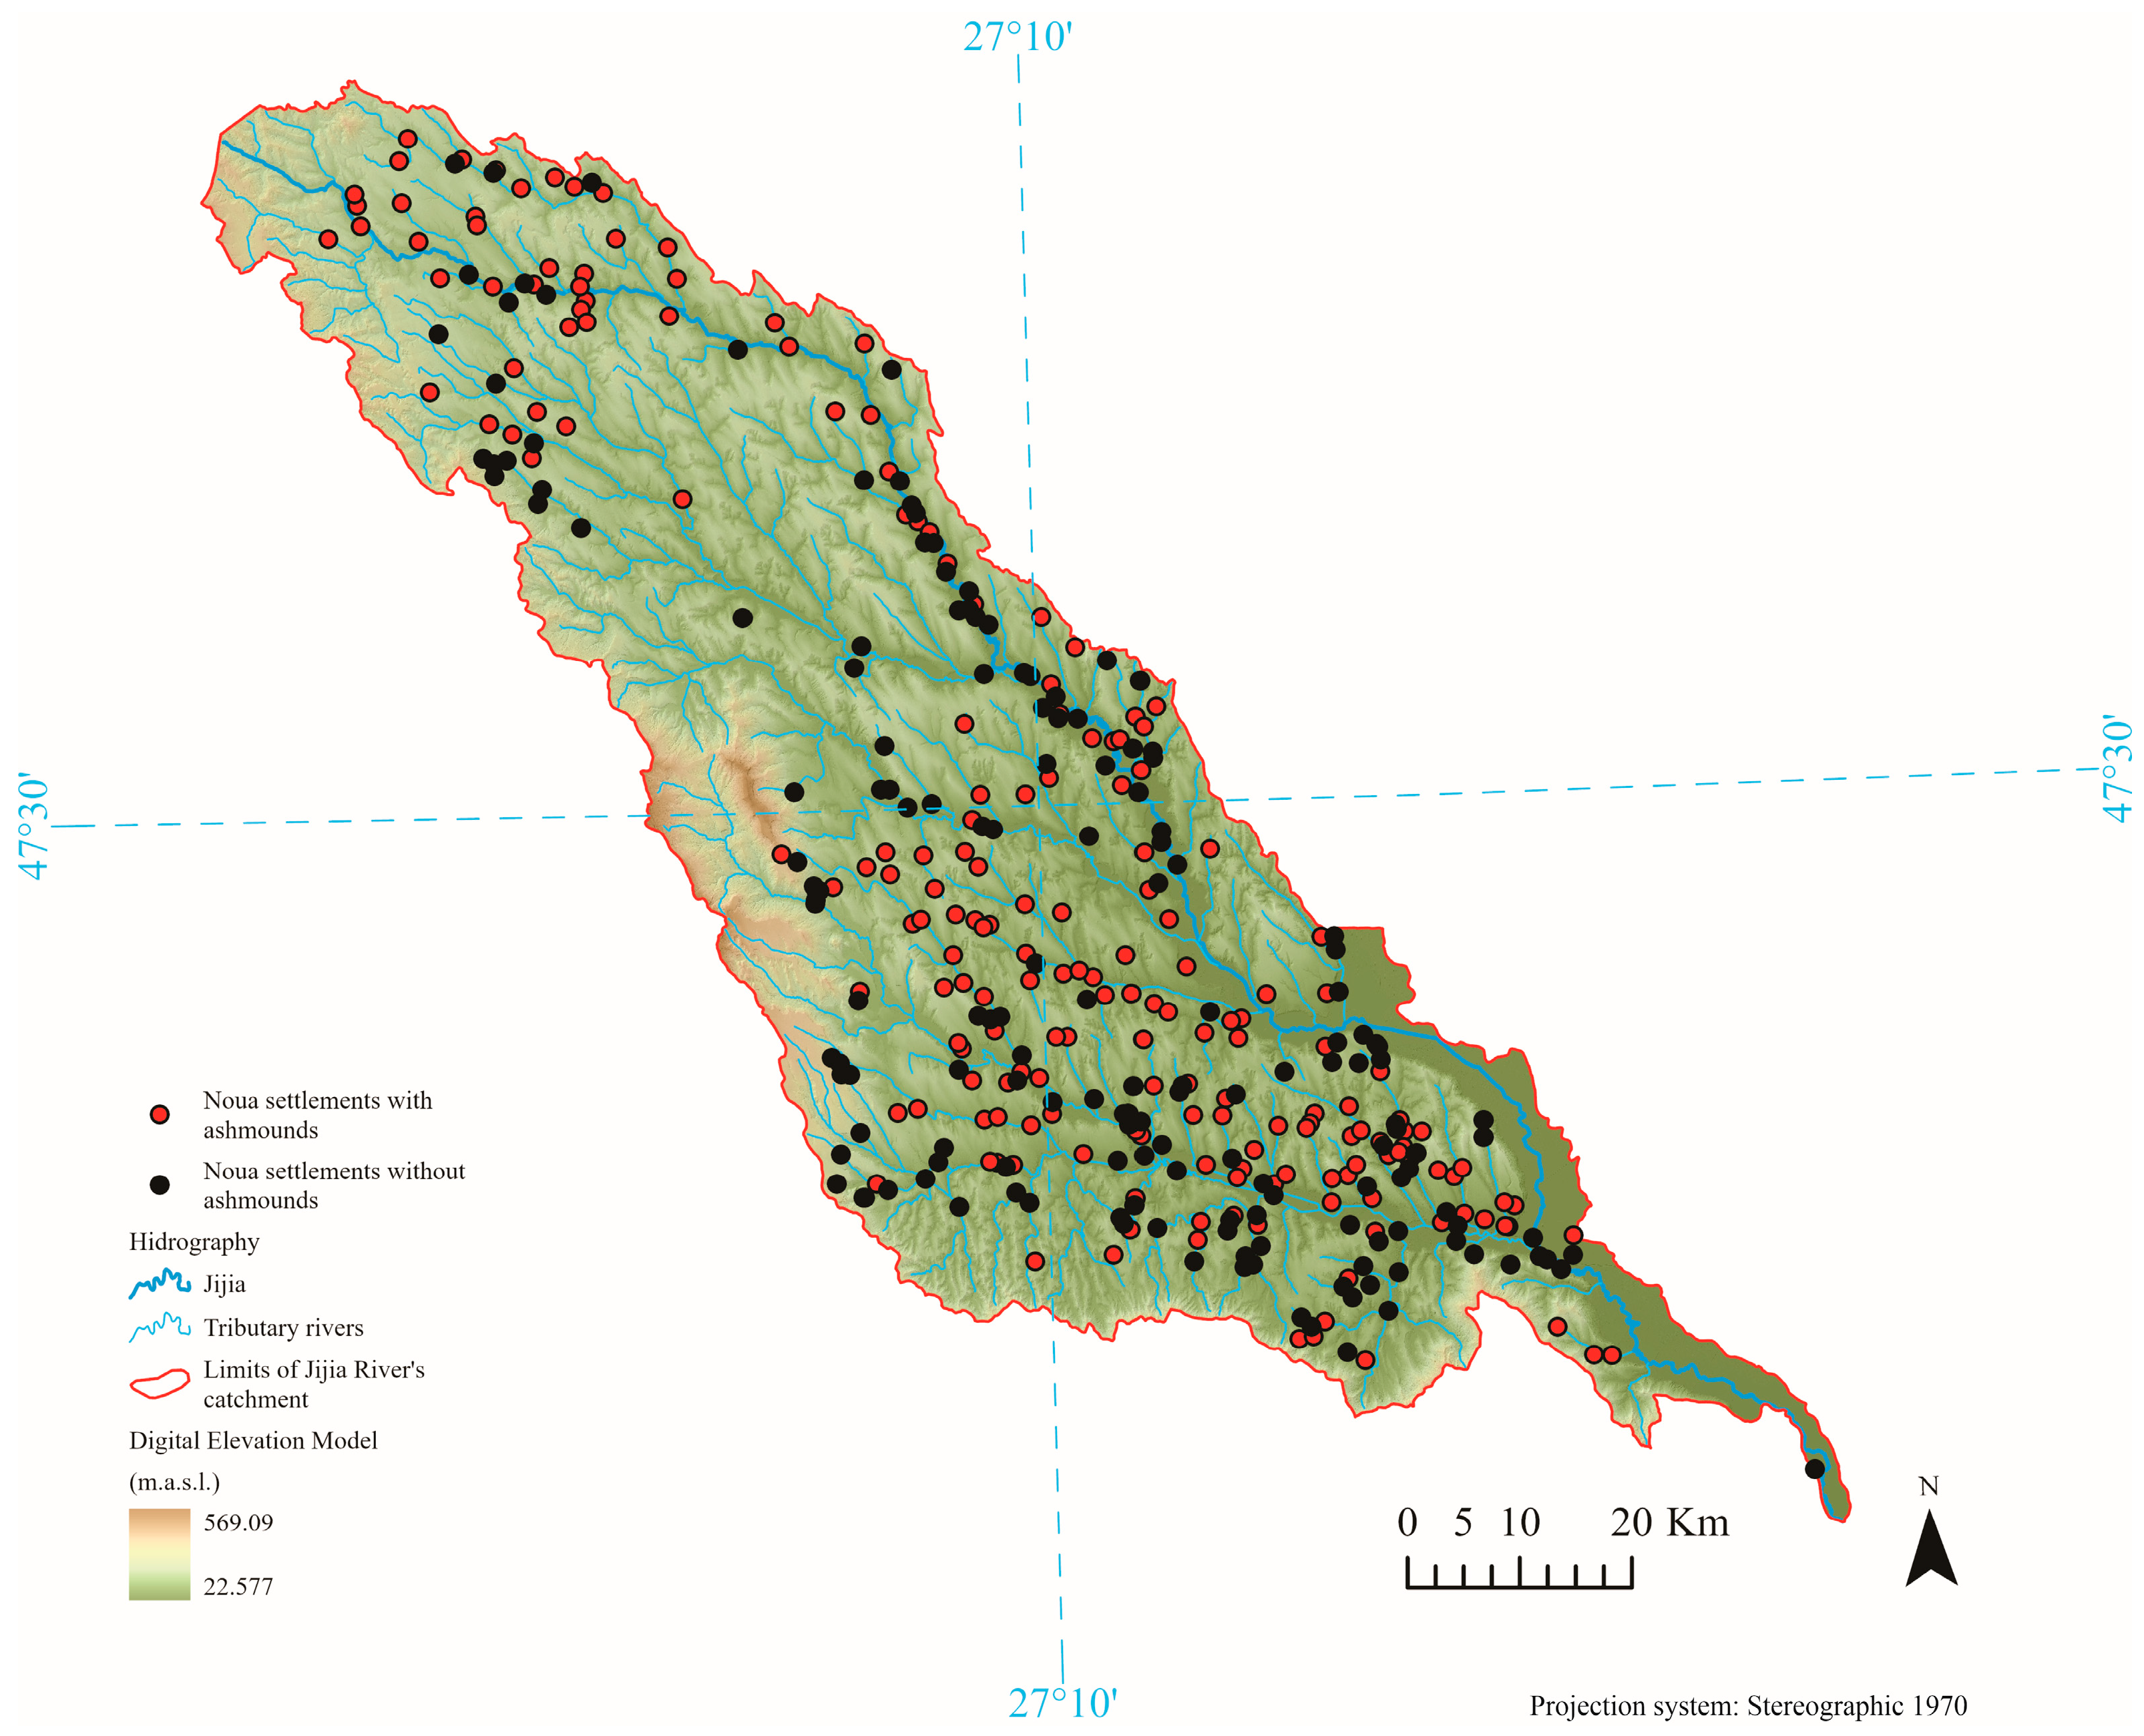
In order to obtain novel information regarding the preferences of Noua human groups when choosing a place for settling, a first step was represented by the compilation of a catalogue of discoveries, including all the settlements dating from the Late Bronze Age, in the working area, starting from the existing information found in the literature. Visualization and mapping were performed, in first instance, in Google Earth Pro 7.3.4. Since the grey spots are visible on the soil surface and, also, they can easily be distinguished from other types of soil marks, the satellite images provided by Google Earth Pro allowed the identification of a significant number of novel settlements with ashmounds (36% of the total of 195 sites). Old maps, as well as orthophotographs available on portals, such as InisViewer, Bing Maps, Here Maps and Atlas Explorer, were also used. The second step consisted of verifying as many archaeological sites as possible. Thus, numerous fieldwalks were conducted, especially in the middle and lower basins of Jijia River, targeting, in particular, the aforementioned novel discoveries. In the current paper, out of the total of 362 Noua settlements (
Figure 3), only the 195 sites that present ashmounds, visible on the soil surface, were selected and introduced into the Global Mapper 18.0 software, where the results of LIDAR measurements were also visualized. In the end, the spatial analysis and the maps were performed and generated by using ArcGIS Pro 3.0.0.
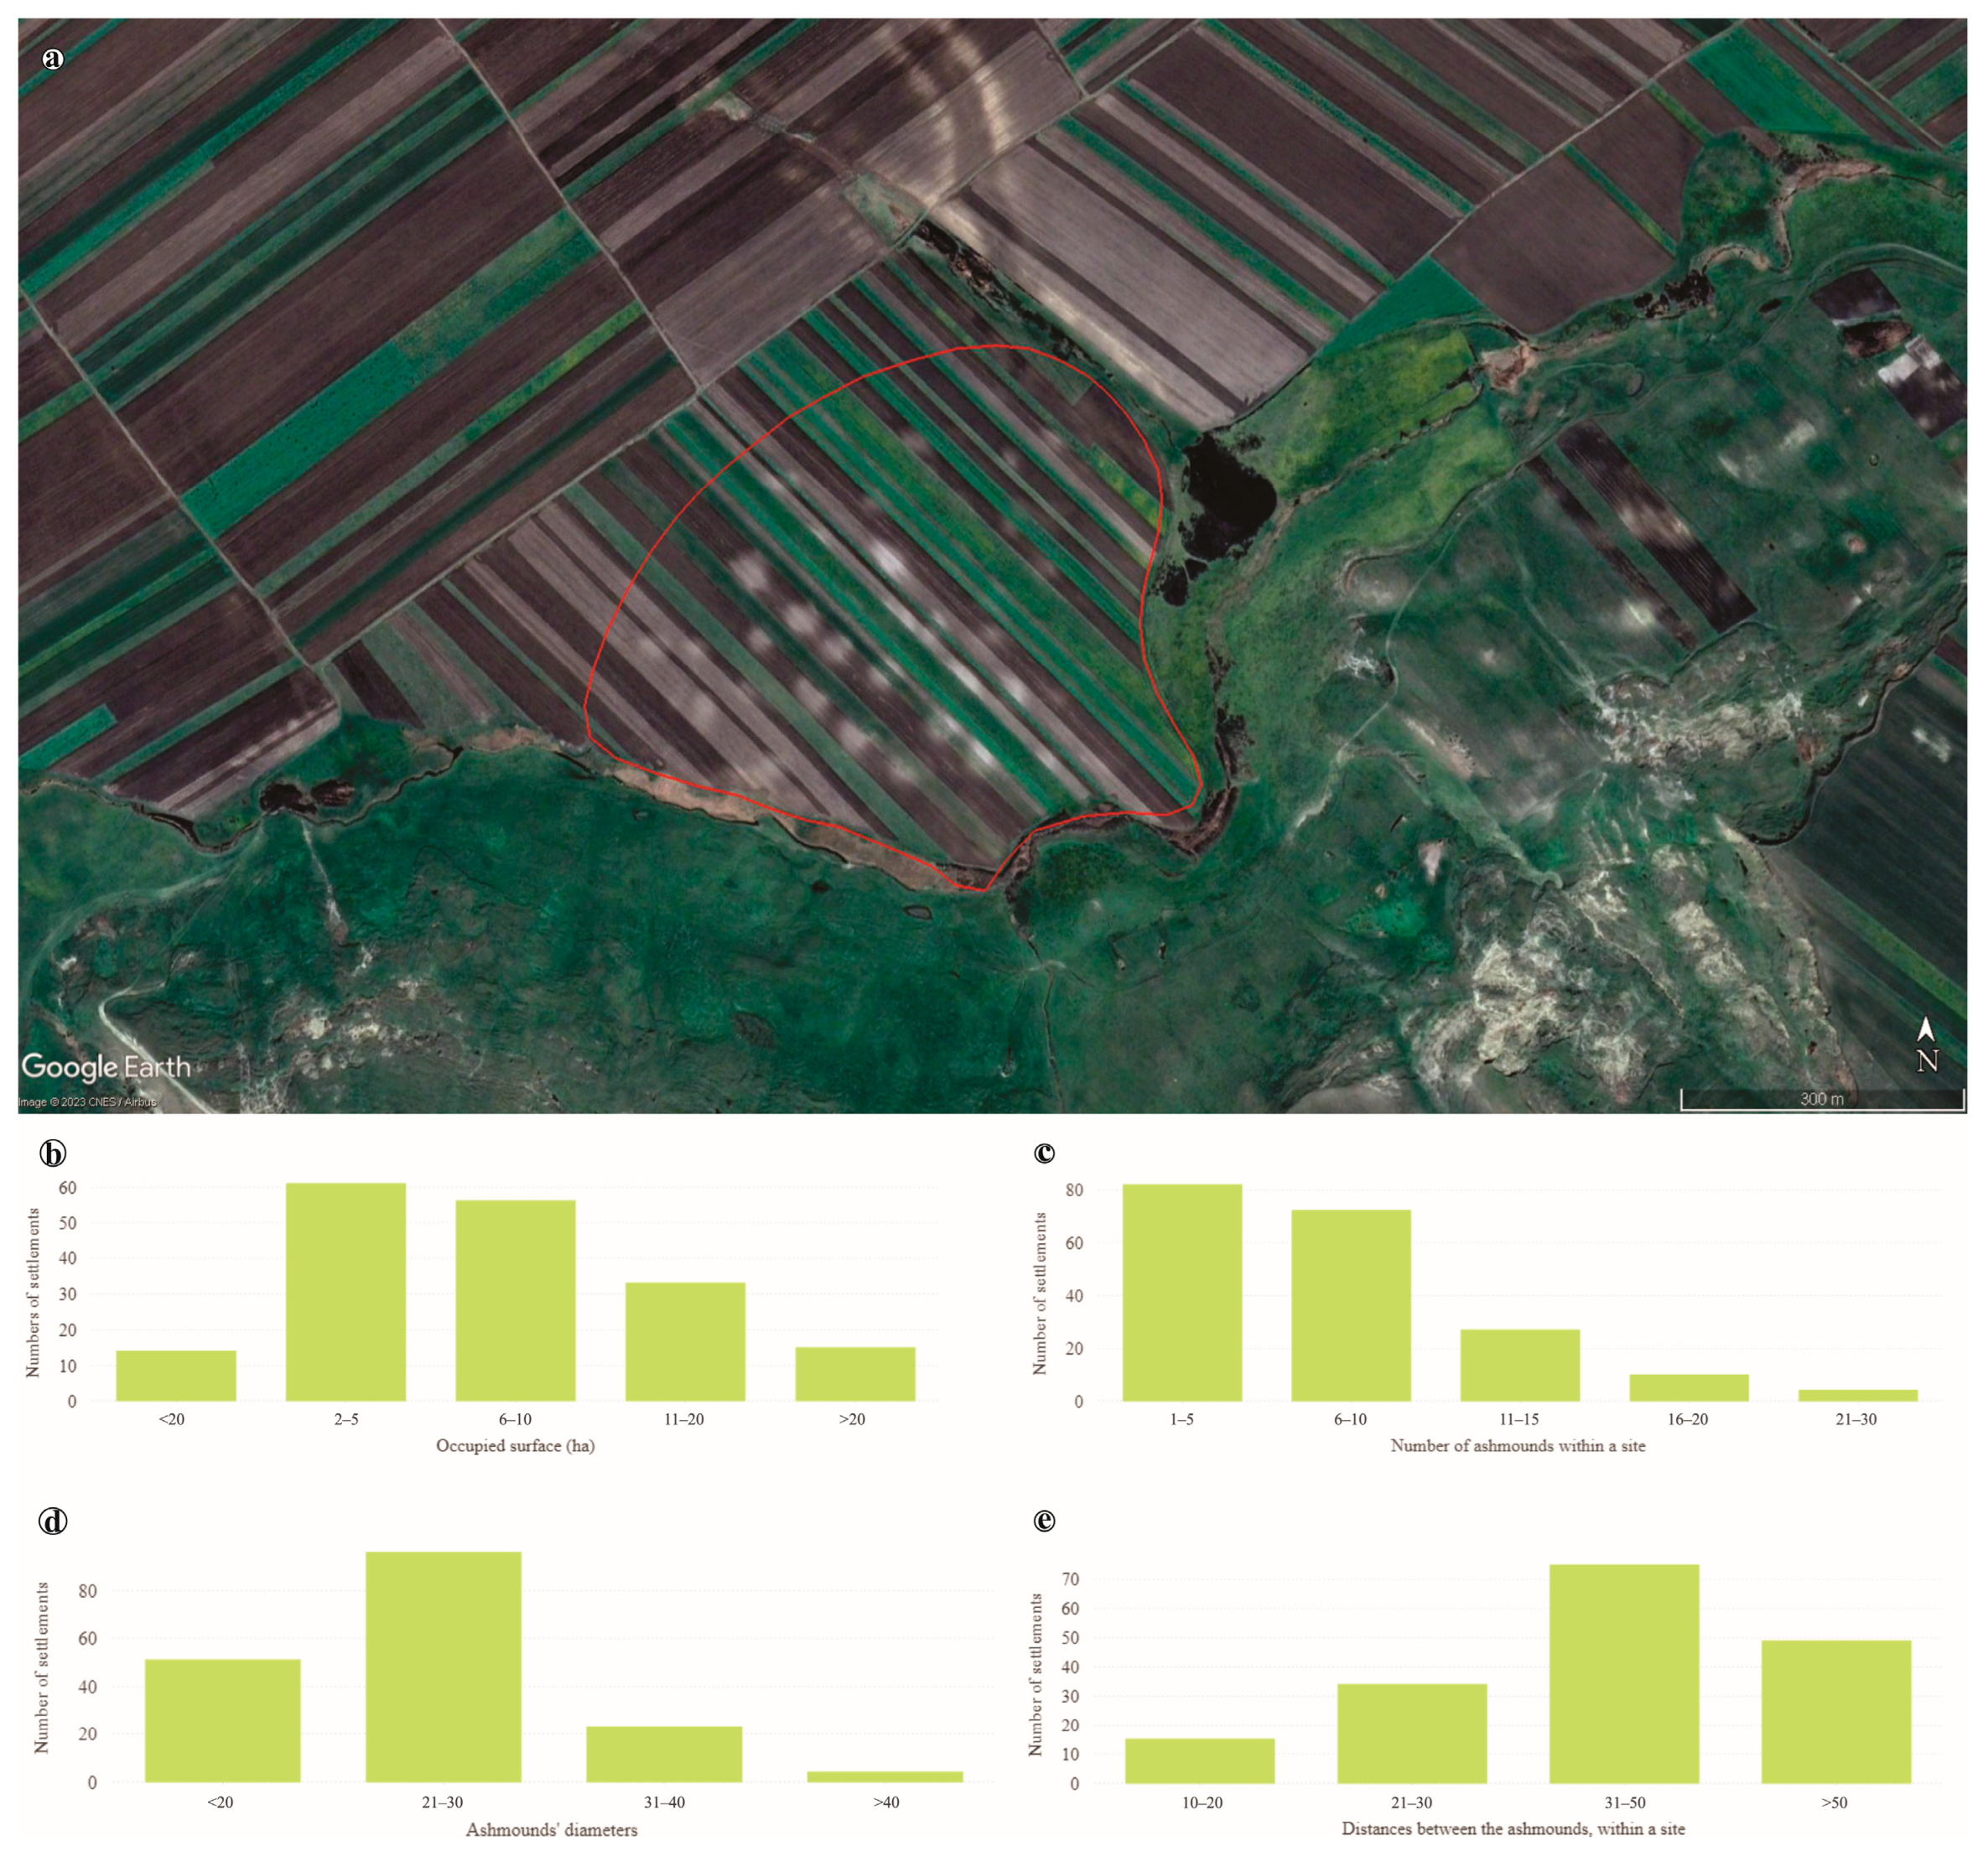
First of all, the presence of the ash-like soil marks allowed us to obtain important information regarding the size of the settlements, the number and the characteristics of the ashmounds, as well as the distances between them, within the sites. The parameters (size, number, diameter and distance) were calculated for each of the 195 sites, thus producing a database that was interrogated so that we could obtain statistical information. The values obtained allowed us to create different classes, thus facilitating a better graphical representation of the results. Depending on the area occupied by these ‘structures’, the settlements were grouped into five classes: <2 ha, 2–5 ha, 6–10 ha, 11–20 ha and >20 ha. Next, the number of ashmounds existing within a site could be structured into five groups: 1–5, 6–10, 11–15, 16–20 and 21–30 ashmounds within a site. The diameters calculated can also be categorized in three classes: less than 20 m, 21–30 m and 31–40 m. Finally, the distances existing between these ‘spots’ can be grouped as follows: 10–20 m, 21–30 m, 31–50 m and larger than 50 m.
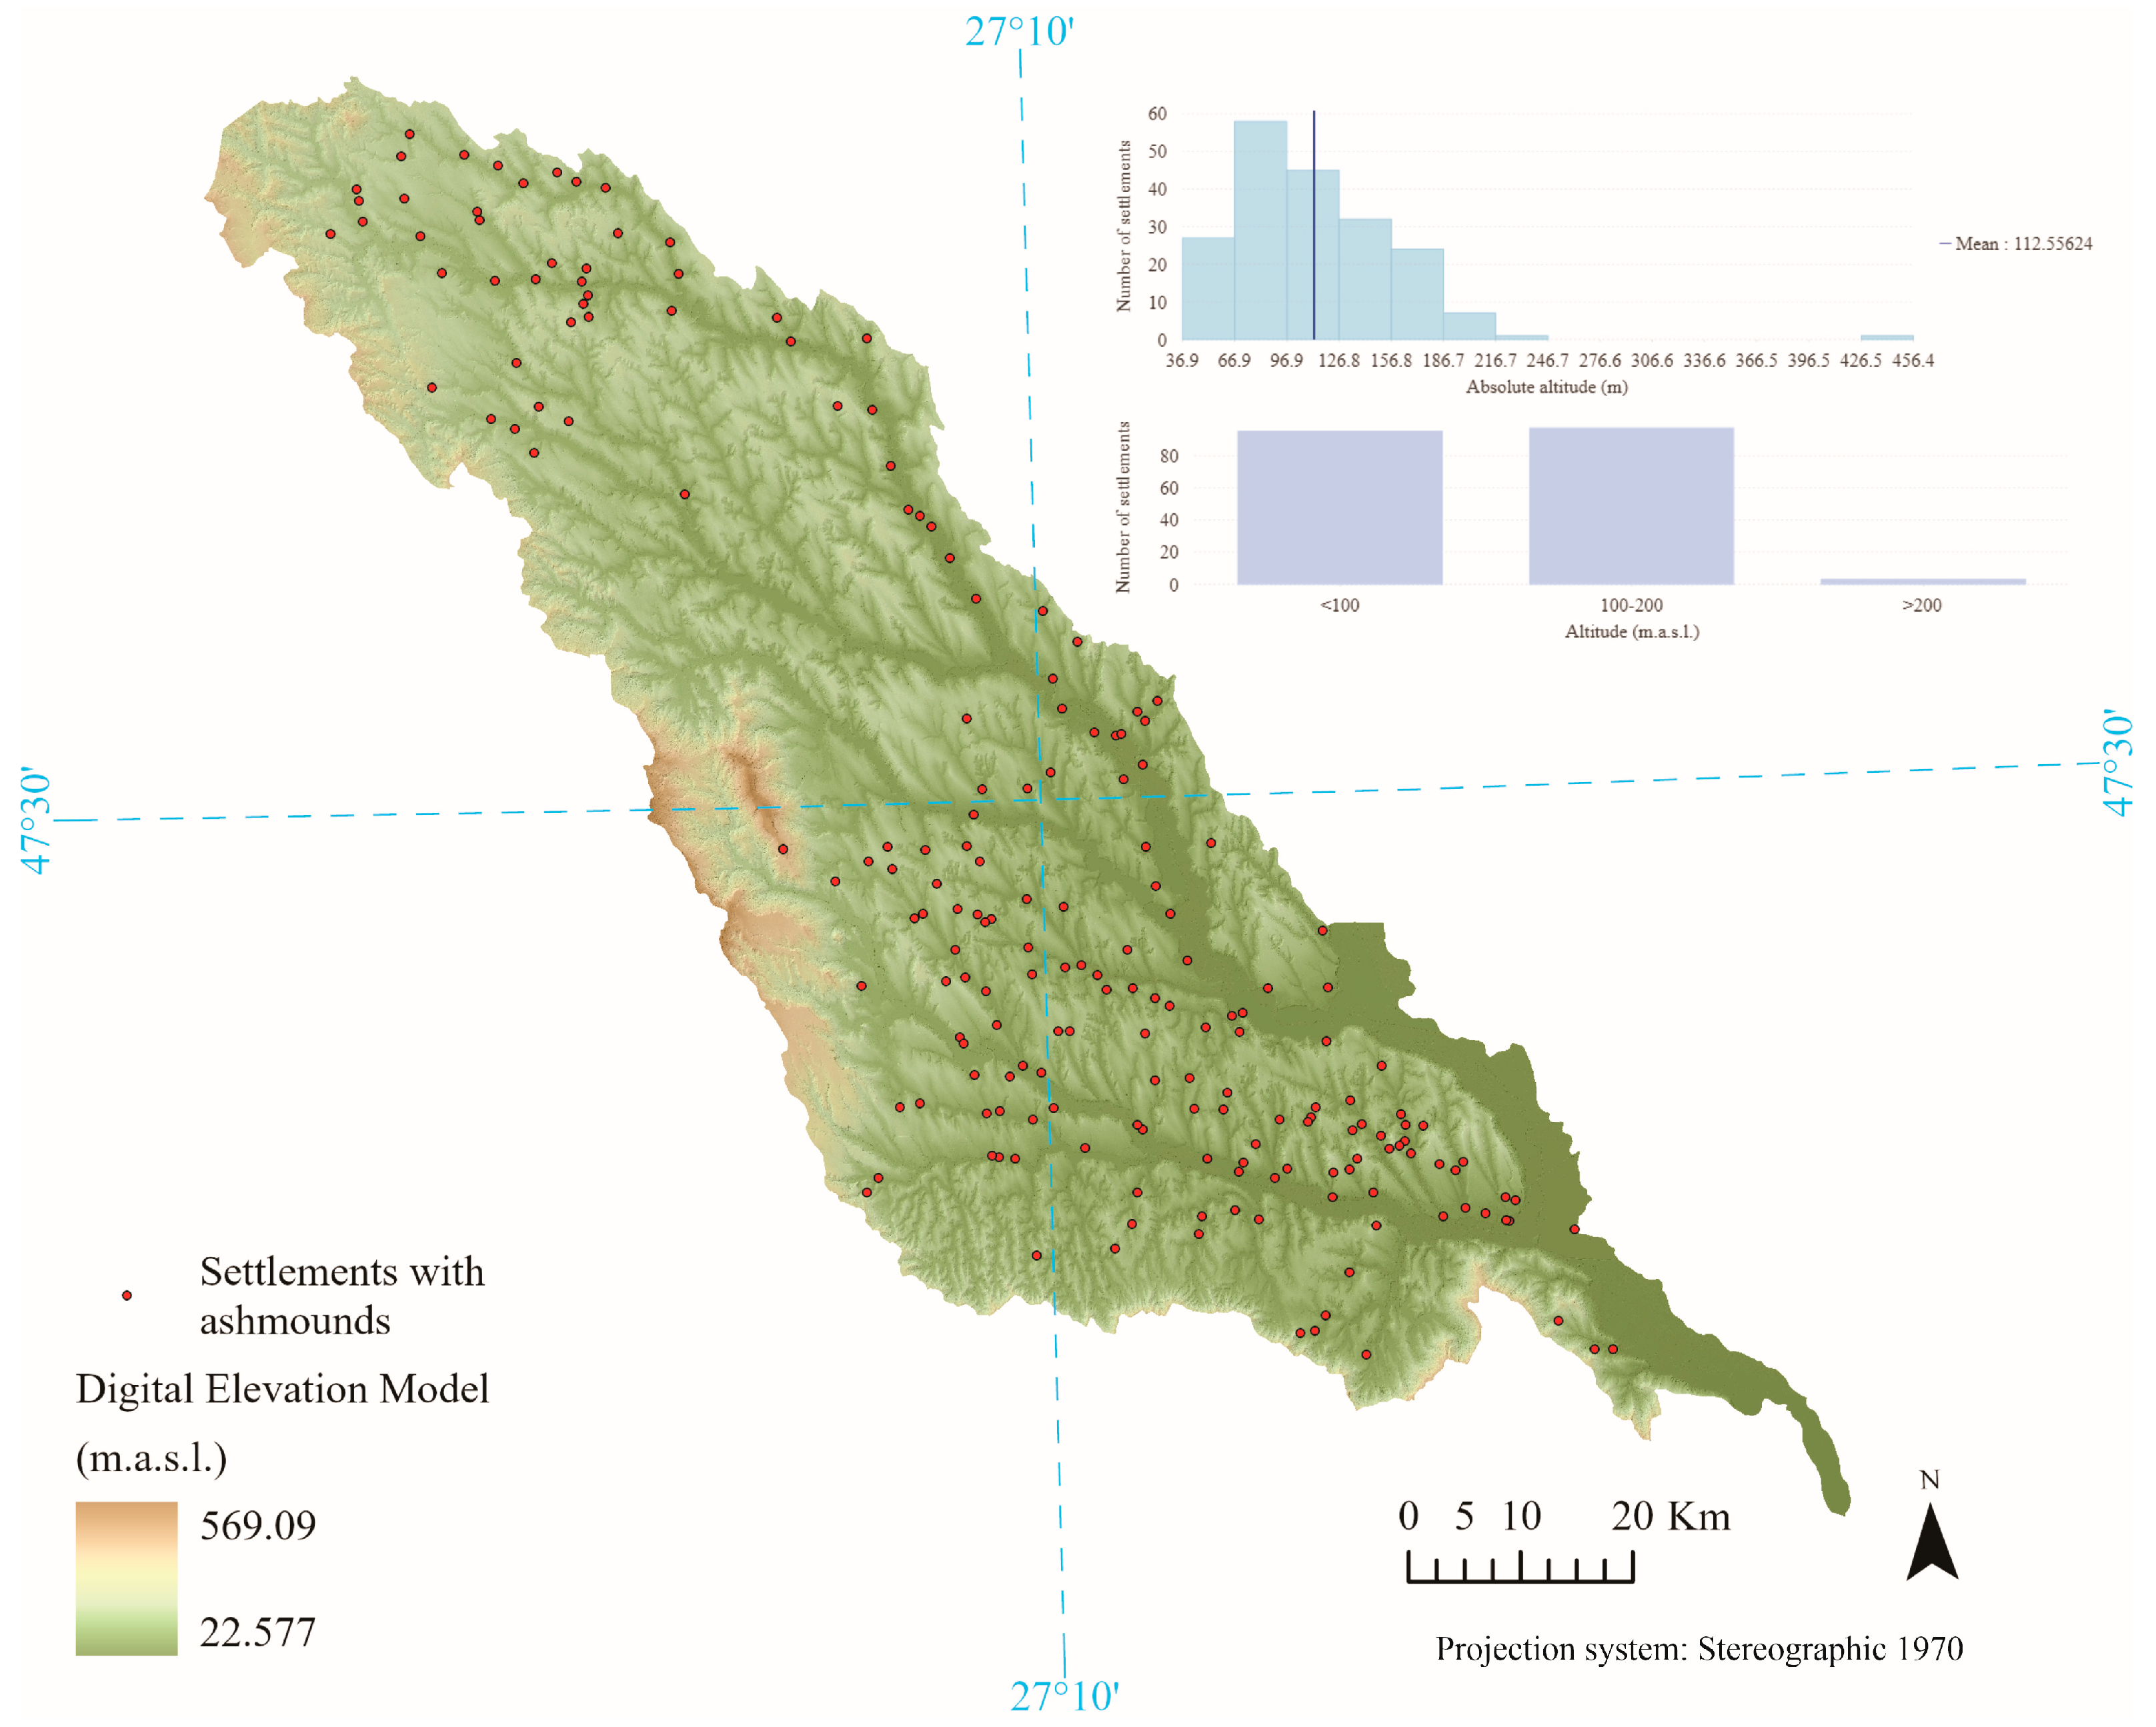
As the present approach aims at identifying the parameters (morphometric, hydrological, etc.) that determined the location of the ashmounds, it was necessary to calculate hydro-geomorphological indicators, such as absolute altitude, slope, orientation, Topographic Position Index and distances (to the closest water source, as well as between settlements). The absolute altitude was extracted from the LiDAR-derived DEM using ArcGIS function Extract Values to Points. Thus, a value included in the attribute table was attributed to each point symbolizing the center of the Noua settlement with ashmounds. The classes were later created in accordance with the data obtained: less than 100 m.a.s.l., between 100 and 200 m.a.s.l. and more than 200 m.a.s.l.
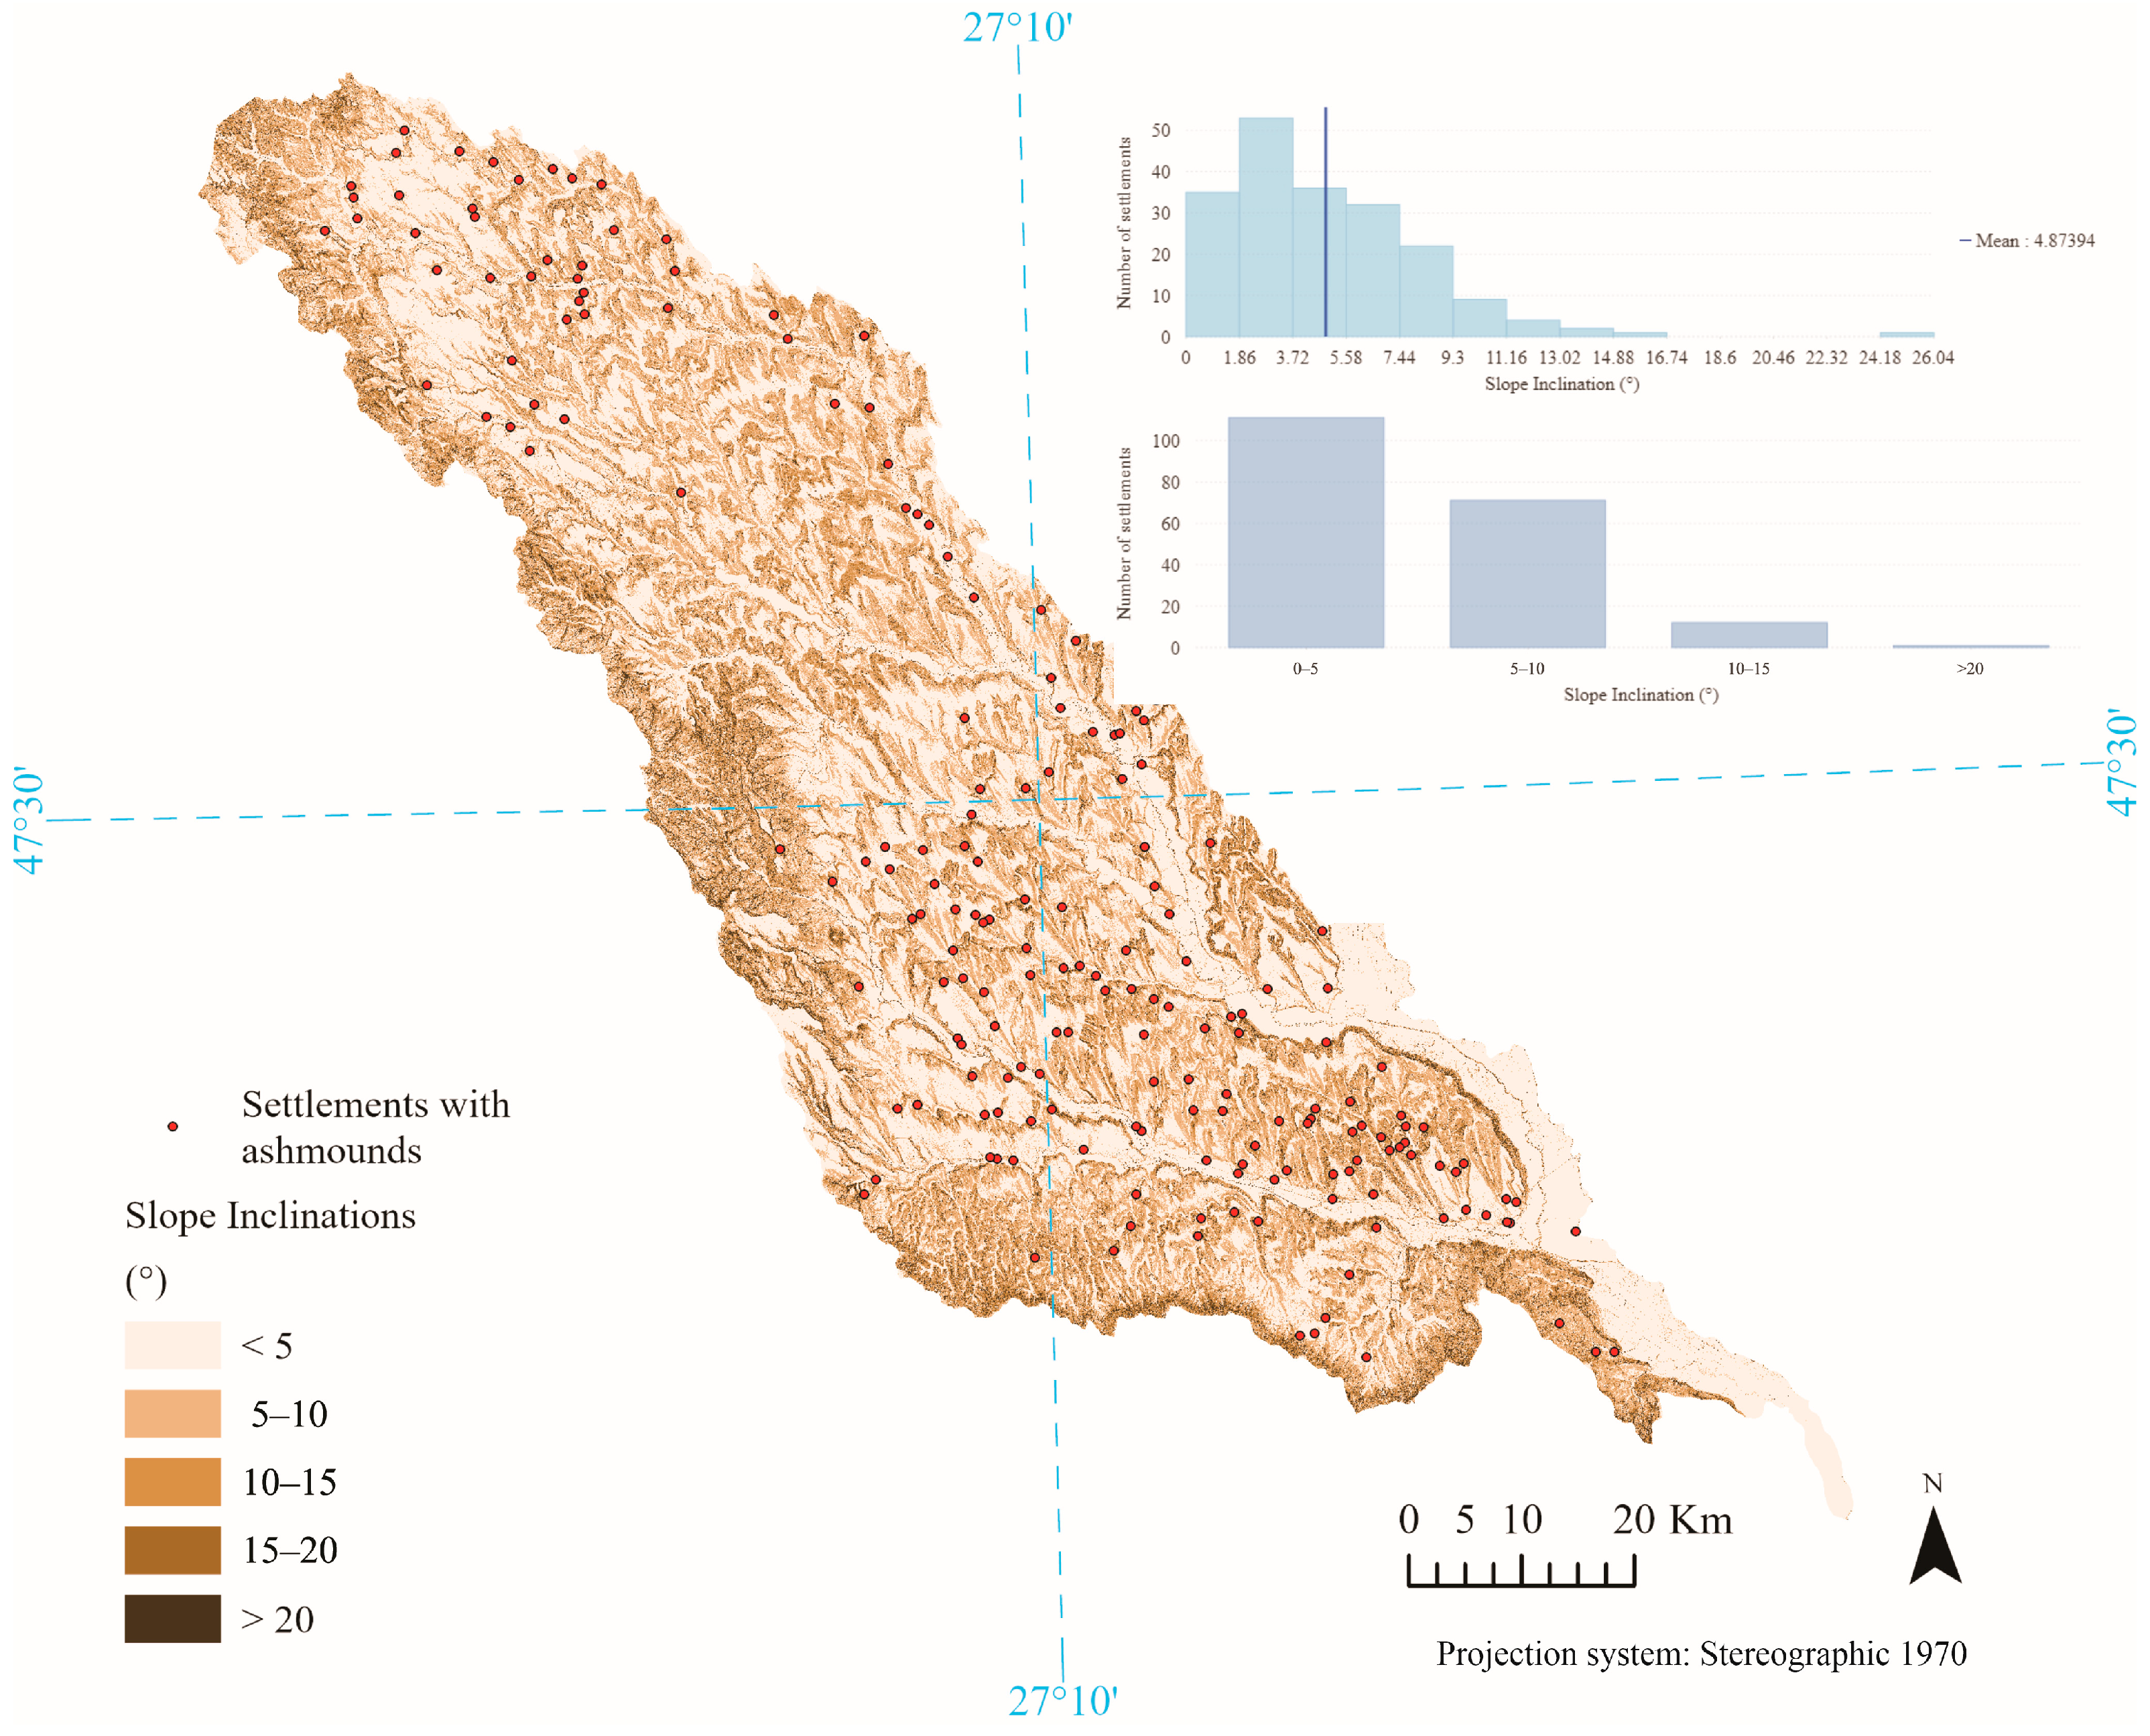
The slope was automatically generated using the
Spatial Analyst toolbox of ArcGIS, namely the
Slope tool. Thus, a value is represented by the average from a window of 3 × 3 pixels (our LiDAR-derived DEM having a 1 × 1 m resolution) [
37]. Next, the same function, as in the previous case, was used in order to extract the obtained values, while the results were structured in four groups: 0–5°, 5–10°, 10–15° and >20°.
The sun-exposure analysis was performed using the tool Aspect of the same ArcGIS toolbox. Following the extraction of values from the Aspect Map, the results were expressed in degrees that were later interpreted with the help of a graphical Wind Rose, in order to obtain the orientations towards the cardinal points. Following the slope exposure values, the terrains can then be characterized as being sunny, partially sunny, shaded or partially shaded.
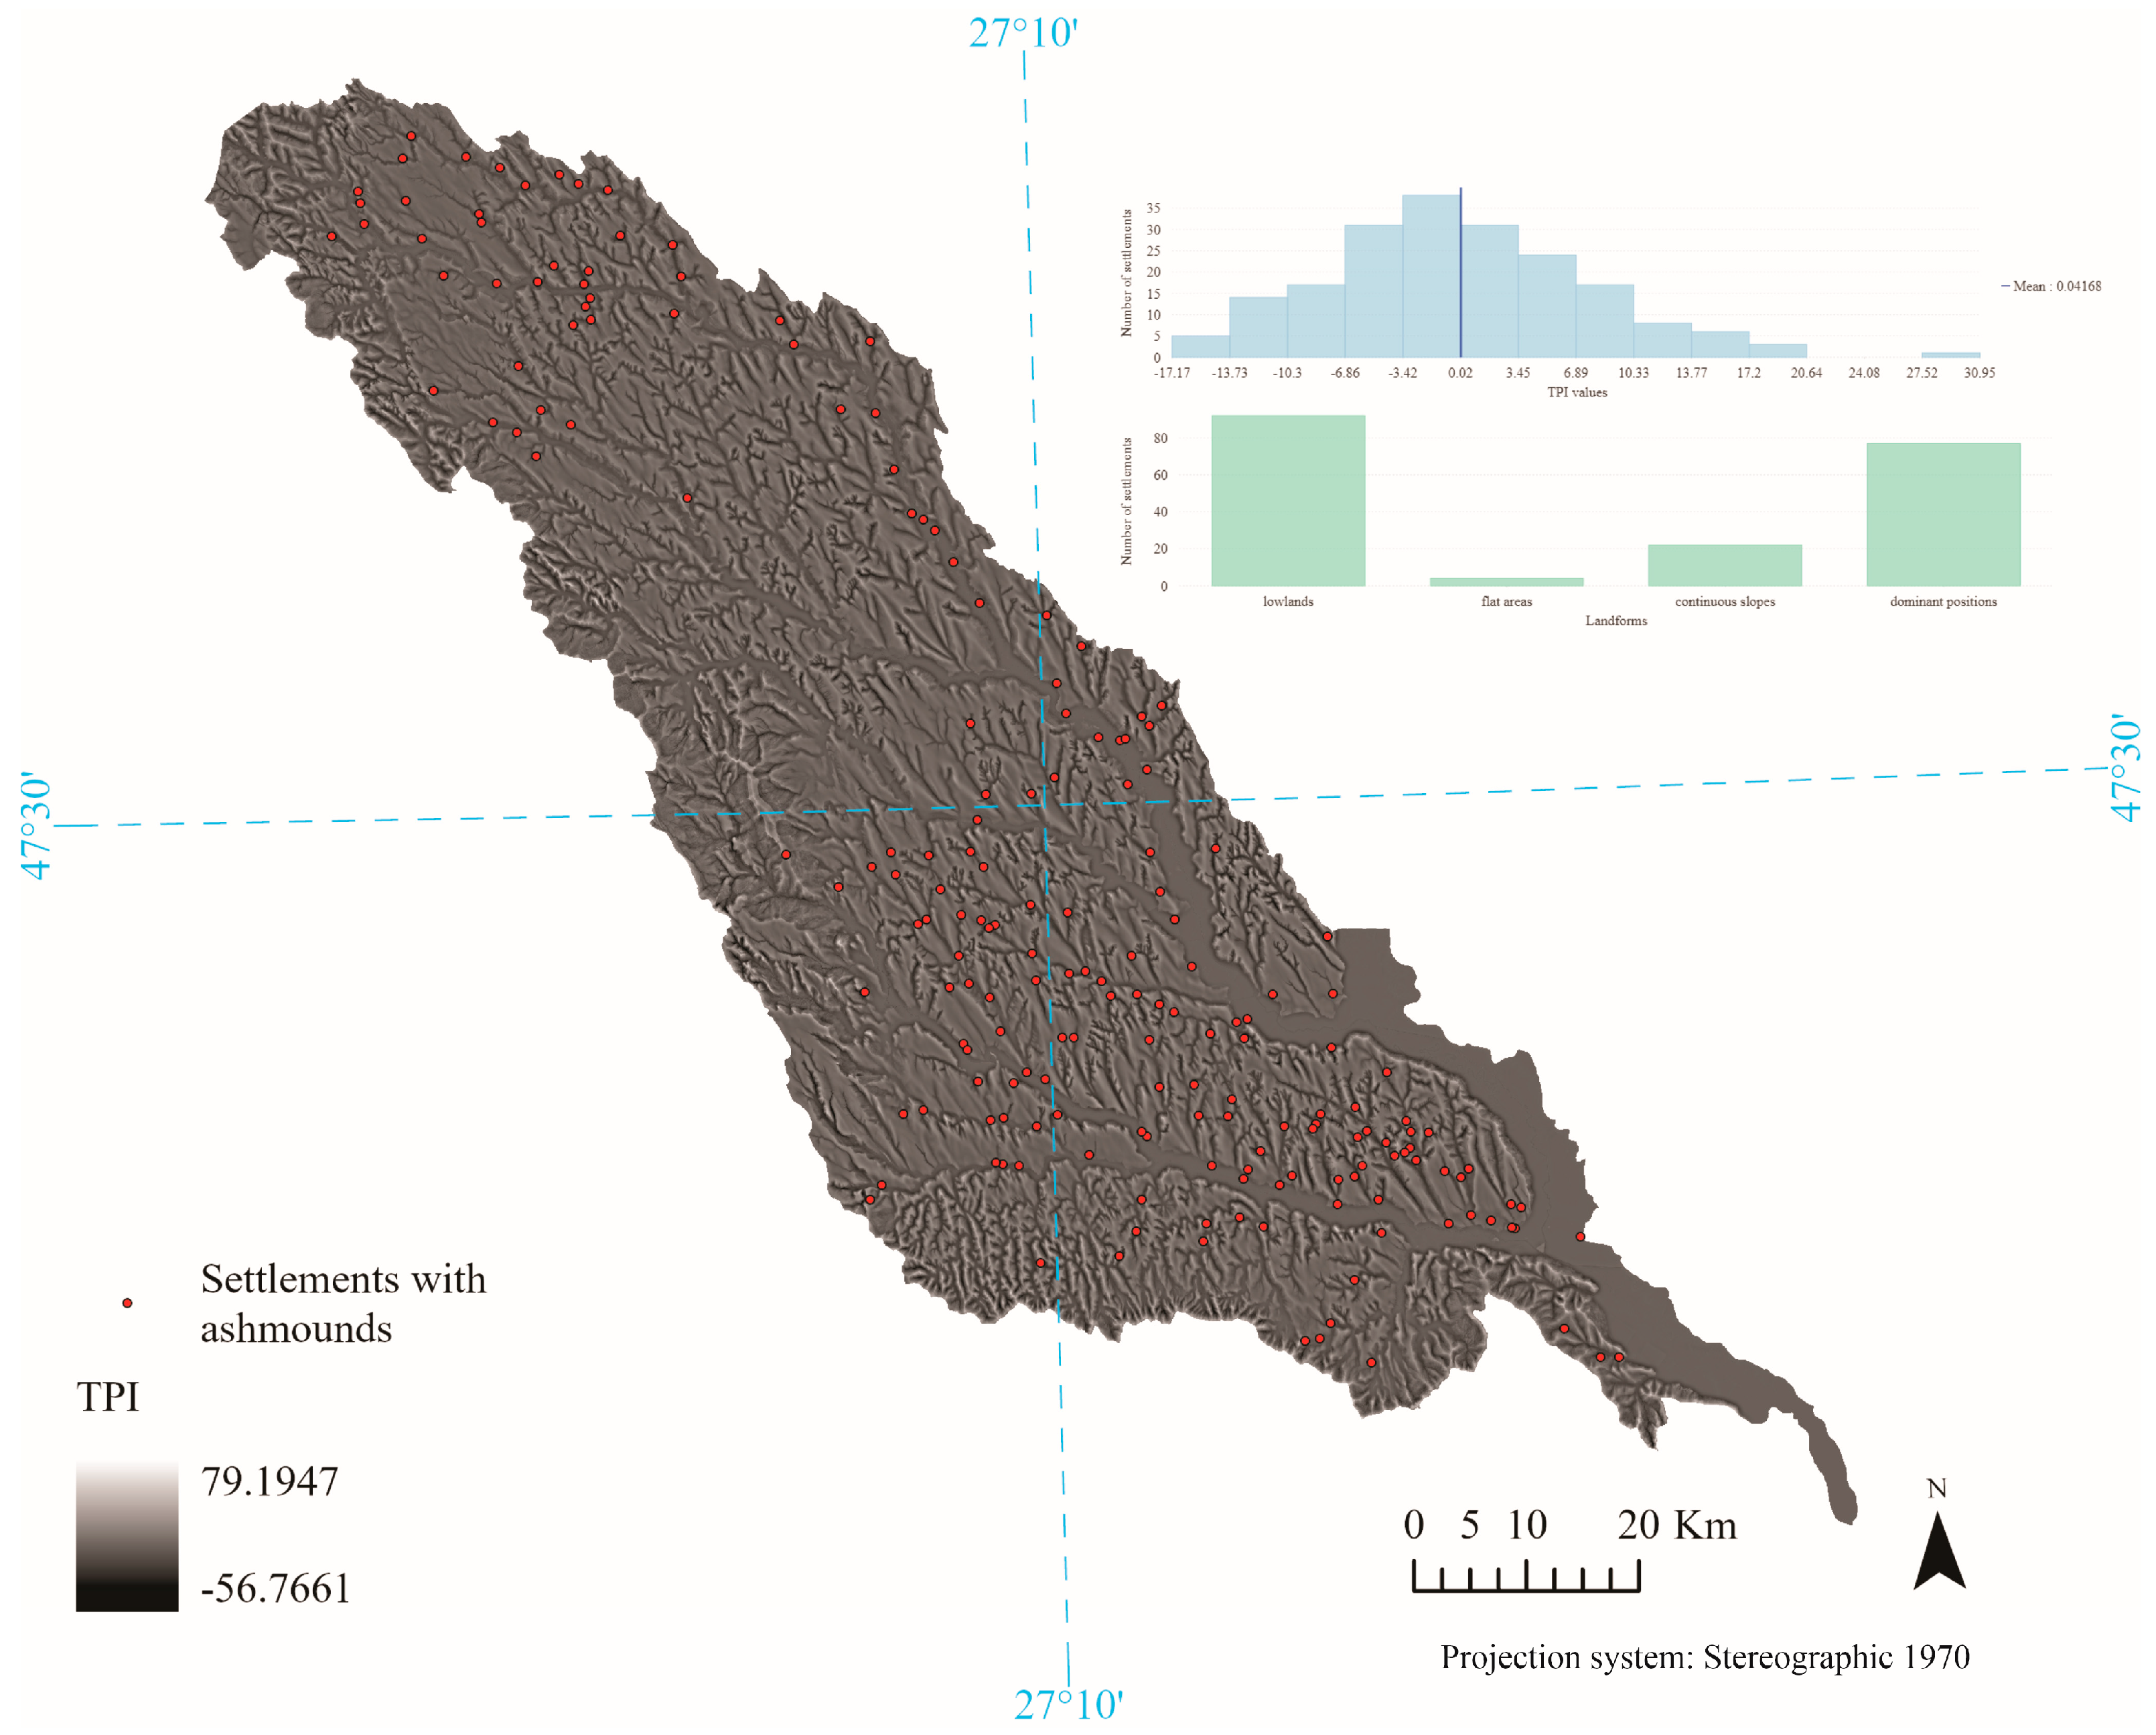
The
Topographic Position Index provided by the
Relief Analysis toolbox has facilitated a classification of the landforms on which the Noua settlements were placed. Through the comparison of the altitude values of each DEM cell with the average altitude of a 500 × 500 m area, this indicator provides a series of results: the positive values represent the dominant terrains (hilltops), with higher altitudes than the average area; the negative values show the lower areas (valleys); the ones that are close to 0 can be attributed either to plane areas (if the slope also tends to 0) or to continuous slopes (if the slope inclination is higher) [
38,
39]. Our study performed a comparison between the site and a circular area of 500 m, this parameter being selected due to the fact that it provided good results when used in other similar studies [
40].
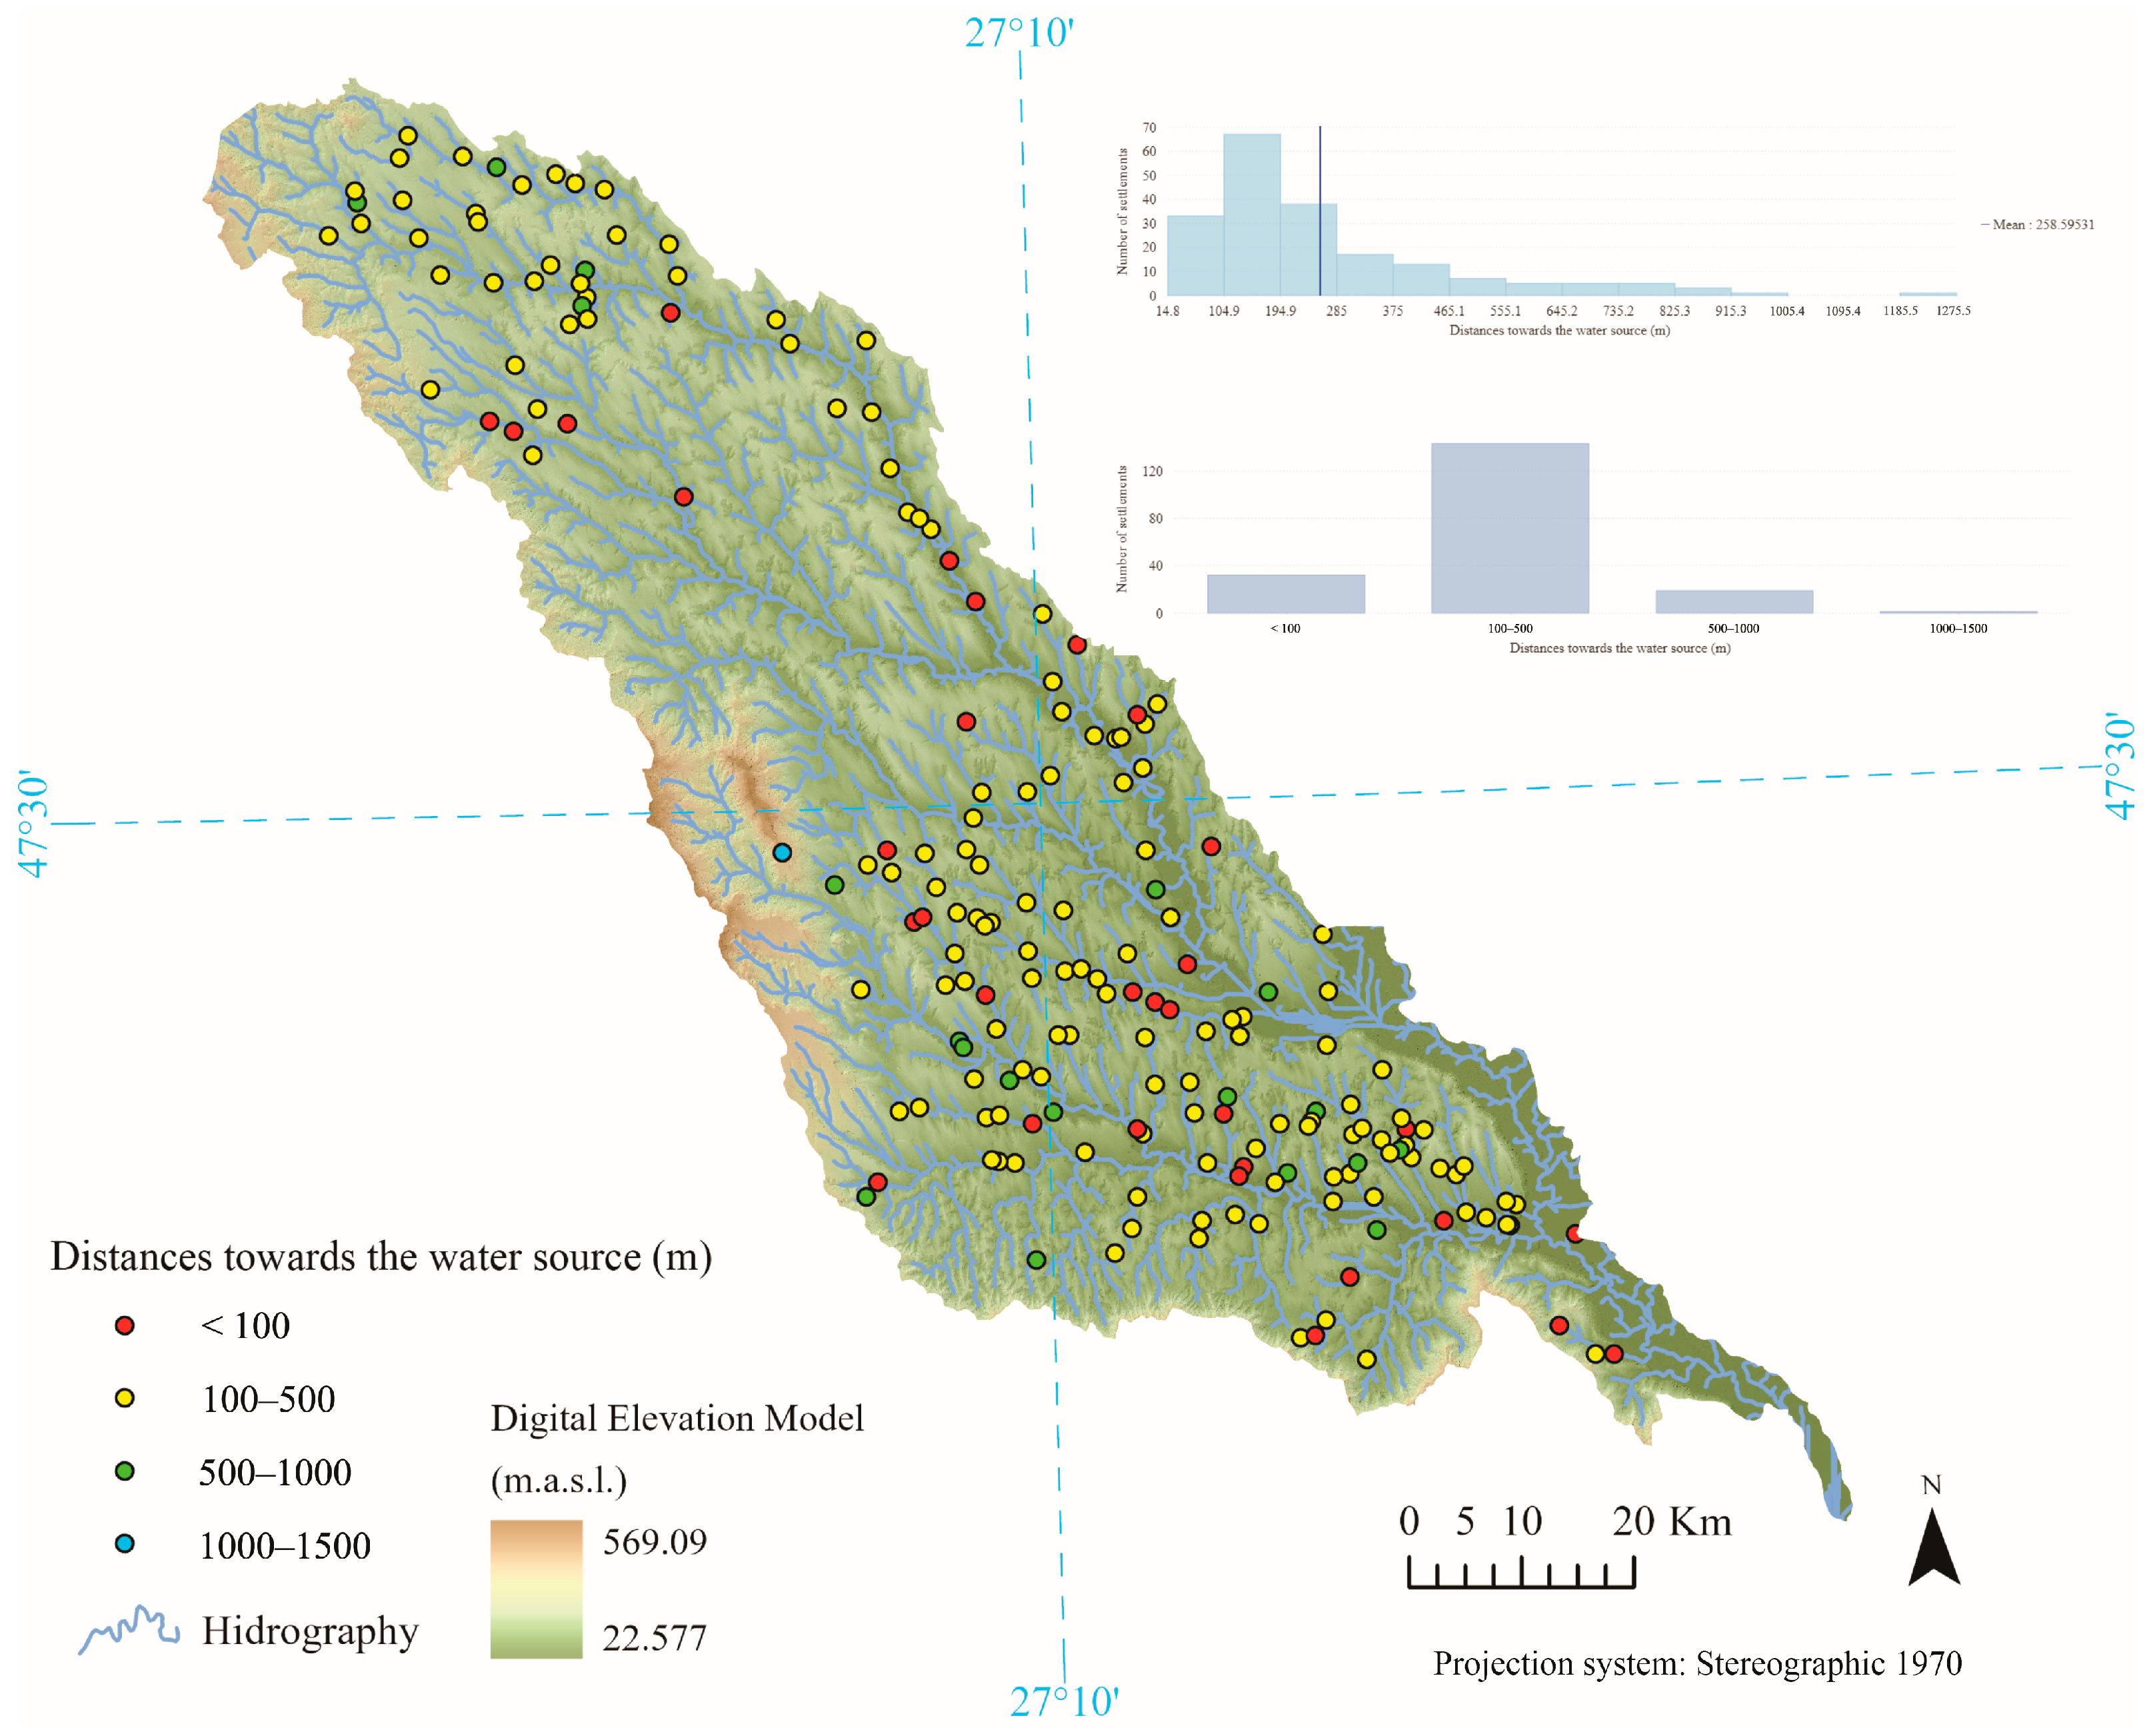
The last hydro-geomorphological parameter calculated was the distance to the nearest water source. This was performed using the Near tool and the automatically generated hydrography for the LiDAR-derived DEM. Thus, we were able to eliminate modern interventions, while even seasonal or semi-permanent watercourses were determined, indicating the possible presence of springs in the past. The set of information provided by the calculus allowed the classification into four categories of distances: <100 m, 100–500 m, 500–1000 m and >1000 m. In order to have a clearer picture regarding the relationship existing between the sites and the water-sources, the use of the Horton–Strahler number made it possible to obtain data regarding the ranks of the rivers of interest for Noua communities. The Near analysis was also undertaken to determine the distance between settlements. The results obtained were structured in three classes: 500–1000 m, 1000–2000 m and >2000 m.
Next, the spatial analysis meant performing a calculus of the aggregation coefficient, complemented by density estimations. The first one was realized using the
Average Nearest Neighbor function provided by ArcGIS Pro. This implies the calculus of the average distances between all the sites analyzed, establishing afterwards the lowest distance existing towards other points. Depending on the values obtained, the coefficient (noted R) can be <1 (suggesting a clustered distribution), =1 (denoting a random distribution) or >1 (up to its theoretical maximum of 2.15 and showing that the points are somewhat regularly spaced) [
41].
The function
Kernel Density Estimation (KDE) was used in order to obtain the density estimation of the Noua settlements with ashmounds in the workspace. The working principle implies the fitting of a smoothly curved surface over each point, the surface being highest at the location of the site and diminishing in relation to the increasing distance from the point [
42]. In this sense, we used a search radius (bandwidth) of 5000 m, that has already been proven to offer relevant results [
43].
All of the information obtained by using the methods described above was visualized by producing thematic maps, while the results led to the structuring of a new database. The latter was afterwards interrogated statistically and the conclusions were structured in graphs, with the main objective of identification of the relationship existing between the LBA communities that used the settlements with ashmounds and the occupied environment.
Finally, the subject could not be treated only as a desk study so, several case studies from the Jijia lower basin were selected. For the settlements in question, we realized aerial photographs, guided flights and geophysical measurements. The selected sites (Bădeni-Moara de Vânt Hill and Coarnele Caprei-Aramei Hill I, Iași County) are located in the Jijioara River catchment, one of the main tributary rivers of Jijia. The main reasons behind this selection were represented by the accessibility of the terrain and by the presence of archaeological materials on the ashmounds’ surfaces. After the initial fieldwalk, in order to acquire the aerial photographs, we used two drones: a DJI Phantom 4 Pro v2 and a Mavic Air 2, manufactured by DJI China. Later, the guided flights were performed for obtaining Digital Surface Models (DSM) and orthomosaics, that were also georeferenced.
The geophysical prospections required performing magnetic as well as geo-electrical measurements. The first is one of the most frequently used geophysical methods due to its high data-acquisition timeframe, the possibility to cover extended surfaces in a relatively short time as well as the very good spatial resolution of the obtained results. This method responds very well to the changes that occur when a material is burned at a high temperature that can alter its magnetic properties. Due to this fact, it is usually used for identifying well-burnt structures, but it can also provide important results regarding the existence of ditches or pits, classified as positive anomalies [
40,
44]. In this case, we used the Sensys gradiometer (MAGNETO
® MXPDA, manufactured in Germany). The five sensors were installed with 0.5 m spacing, at approx. 0.2 m above ground. The preliminary processing was realized using the software provided by the producer (DLM-GPS, Magneto-ARCH). Afterwards, the data were transferred in QGIS 3.1.8 (where the plugin
Archaeological Geophysical Toolbox was used), in order to perform a set of specific adjustments and also to better visualize and interpret the results obtained, along with cartographic and topographic data.
Regarding the geo-electrical measurements, two methods of investigation were selected: electrical resistivity and Electrical Resistivity Tomography (ERT). The first one can be adapted for the identification of a diverse palette of archaeological remains, being used in different situations in which other geophysical techniques could not provide satisfying results. The working principle is represented by the fact that when inserted in a homogenous soil, the electrical current will spread uniformly. If, in its path, it encounters obstacles represented by archaeological features, it will change its course, the effects being measurable [
45]. Thus, mapping the areas with lower or higher resistance helps us to identify potential archaeological anomalies. For our study, we used the RM15 device of Geoscan (UK), with the
twin-probe array configuration: on a mobile frame two electrodes (one injected the electrical current while the other measured the potential) and a measuring device were placed. Two other electrodes, representing the reference probes, were placed at a given distance from the measuring device. Finally, the results were processed and interpreted using the software Geoplot 3.0.
The last geophysical method used, the ERT, is mostly used when studying large monuments, such as mounds, because it provides very detailed two-dimensional profiles which, later, can be processed and visualized, including in 3D models. This technique measures the electrical potential existing between pairs of electrodes, obtaining soil tomographies [
46,
47]. In this case, we used the Lipmann 4point Light 10W Earth resistivity meter (produced in Germany), with 60 active electrodes (ActEle), that allowed us spacings of 0.5–5 m. The measurements were performed using the Geotest 3.0 software (configuration Dipole–Dipole), while the processing was conducted using Res2Dinv 4.8 software.
3. Results
In order to extract as many data as possible regarding the spatial component of the settlements in question, our first concern was represented by the planimetric characteristics of the settlements with ashmounds (
Figure 4).
Therefore, the perimeters outlined on satellite images showed that most of the sites occupy areas between 2 and 5 ha (34%) and 6 and 10 ha (31.2%), being followed by the ones of 11–20 ha (18.4%). In the last two places are found the very large and the very small settlements, summing a percentage of 16.2%. Regarding the spatial distribution of these ones, it is observed that the very small settlements seem to be concentrated in the southern extremity of the workspace, while the sites exceeding 20 ha are located predominantly in the northern extremity.
Overall, the settlements present up to 10 ashmounds (78.9%), but almost a quarter of the total of 195 are characterized by the presence of a much higher number, reaching a maximum of 30 features, found throughout the workspace. The diameters of the gray spots are, in most cases, between 20 and 30 m (55.1%), and the distances between them, within the settlement, are usually greater than 30 m (71.2%).
Regarding the absolute altitude of the sites (
Figure 5), we noticed an almost total pattern in choosing territories with altitudes lower than 200 m.a.s.l. (98.4%), especially between 50 and 100 m.a.s.l. (45.6%) and 100 and 150 m.a.s.l. (30.2%).
While 41 settlements are located at an altitude higher than 150 m.a.s.l., the average of all values is 112.5 m.a.s.l., still being lower than the mean elevation of the entire workspace (according to LiDAR-derived DEM), namely, 150.5 m.a.s.l. Although in a few cases the altitudes may seem quite high, in reality, LBA communities chose lowlands, in relation to the surrounding area. Additionally, the discoveries found at altitudes greater than 200 m.a.s.l. are located in the upper basin of the Jijia River, the highest area throughout the workspace. Only one exception to this ‘rule’ was identified. It is the case of a settlement placed at 456.44 m.a.s.l., located in the western extremity of the catchment. This territory, also known as Holm-Dealul Mare Hills, represents an important landform, characterized by the presence of massive hills that reach up to 587 m.a.s.l. For now, we cannot offer a certain explanation for this, but we believe that its positioning could offer many strategic and or/economic advantages.
Regarding the slope analysis (
Figure 6), a certain preference can be observed for the areas characterized by smooth slopes (less than 5°) (56.9%), followed by those with slopes between 5° and 10° (36.4%), considered medium. Only 13 settlements are located on steeper slopes, and they are distributed throughout the workspace, in the proximity of important hydrographic arteries.
The next parameter of interest was represented by the type of sun exposure of the chosen slopes (
Figure 7). The analysis highlighted a pattern in choosing regions with slopes facing the south (19.4%), east (18.9%) and south-east (17.9%), followed by the south-west (14.8%) and north-east (13.3%). The preference for the southern and western slopes can be explained by the fact that these exposures can assure more sunlight and warmth than the northern or the eastern ones.
A very important analysis for the current research is represented by the Topographic Position Index (
Figure 8), as the generated values reveal important data regarding the landforms that the sites occupied. Being closely related to the slope inclination, this tool can provide information such as the type of position that the site occupied in relation to the surrounding area (dominant/lower/continuous slope/flat area). Most settlements (47.1%) present negative values (min = −17.17). This does not come as a surprise since it has already been stated [
16] that these communities had a preference for slopes found in river valleys due to their economic practices, namely, animal husbandry. However, the sites located on dominant positions (39.4%), characterized by a positive index value (max = 30.9), are next in their preferences, and that represents a surprising finding, especially if we relate it to the pattern noted before (regarding the absolute altitudes and slopes). Finally, for 13.3% of the sites, we obtained values close to 0. In this case, the literature [
40] suggests two possible situations: flat areas (when the degree of inclination of the slope tends to 0), encountered in 2% of the situations; and continuous slopes (when the degree of inclination of the slope is higher than 0), found in 11.2% of the analyzed contexts. Thus, taking into consideration these results, we believe that the rule considered so far as generally valid, when talking about the settling patterns of Noua groups (i.e., the preference for lowland settlements), should at least be nuanced.
The analysis regarding the distances to the nearest water source (
Figure 9) revealed a predisposition for locating settlements at distances between 100 m and 500 m (73.3%) from rivers which, most often, are represented by small secondary water courses (rank 1–3 according to the Horton–Strahler number). However, it was observed that the water sources found in the vicinity of the settlements represent the main rivers of the occupied micro-area. Moreover, on the eastern extremity of the workspace, we identified an important number of sites placed in the immediate vicinity of Jijia River (order 4), the main body of water present in this area.
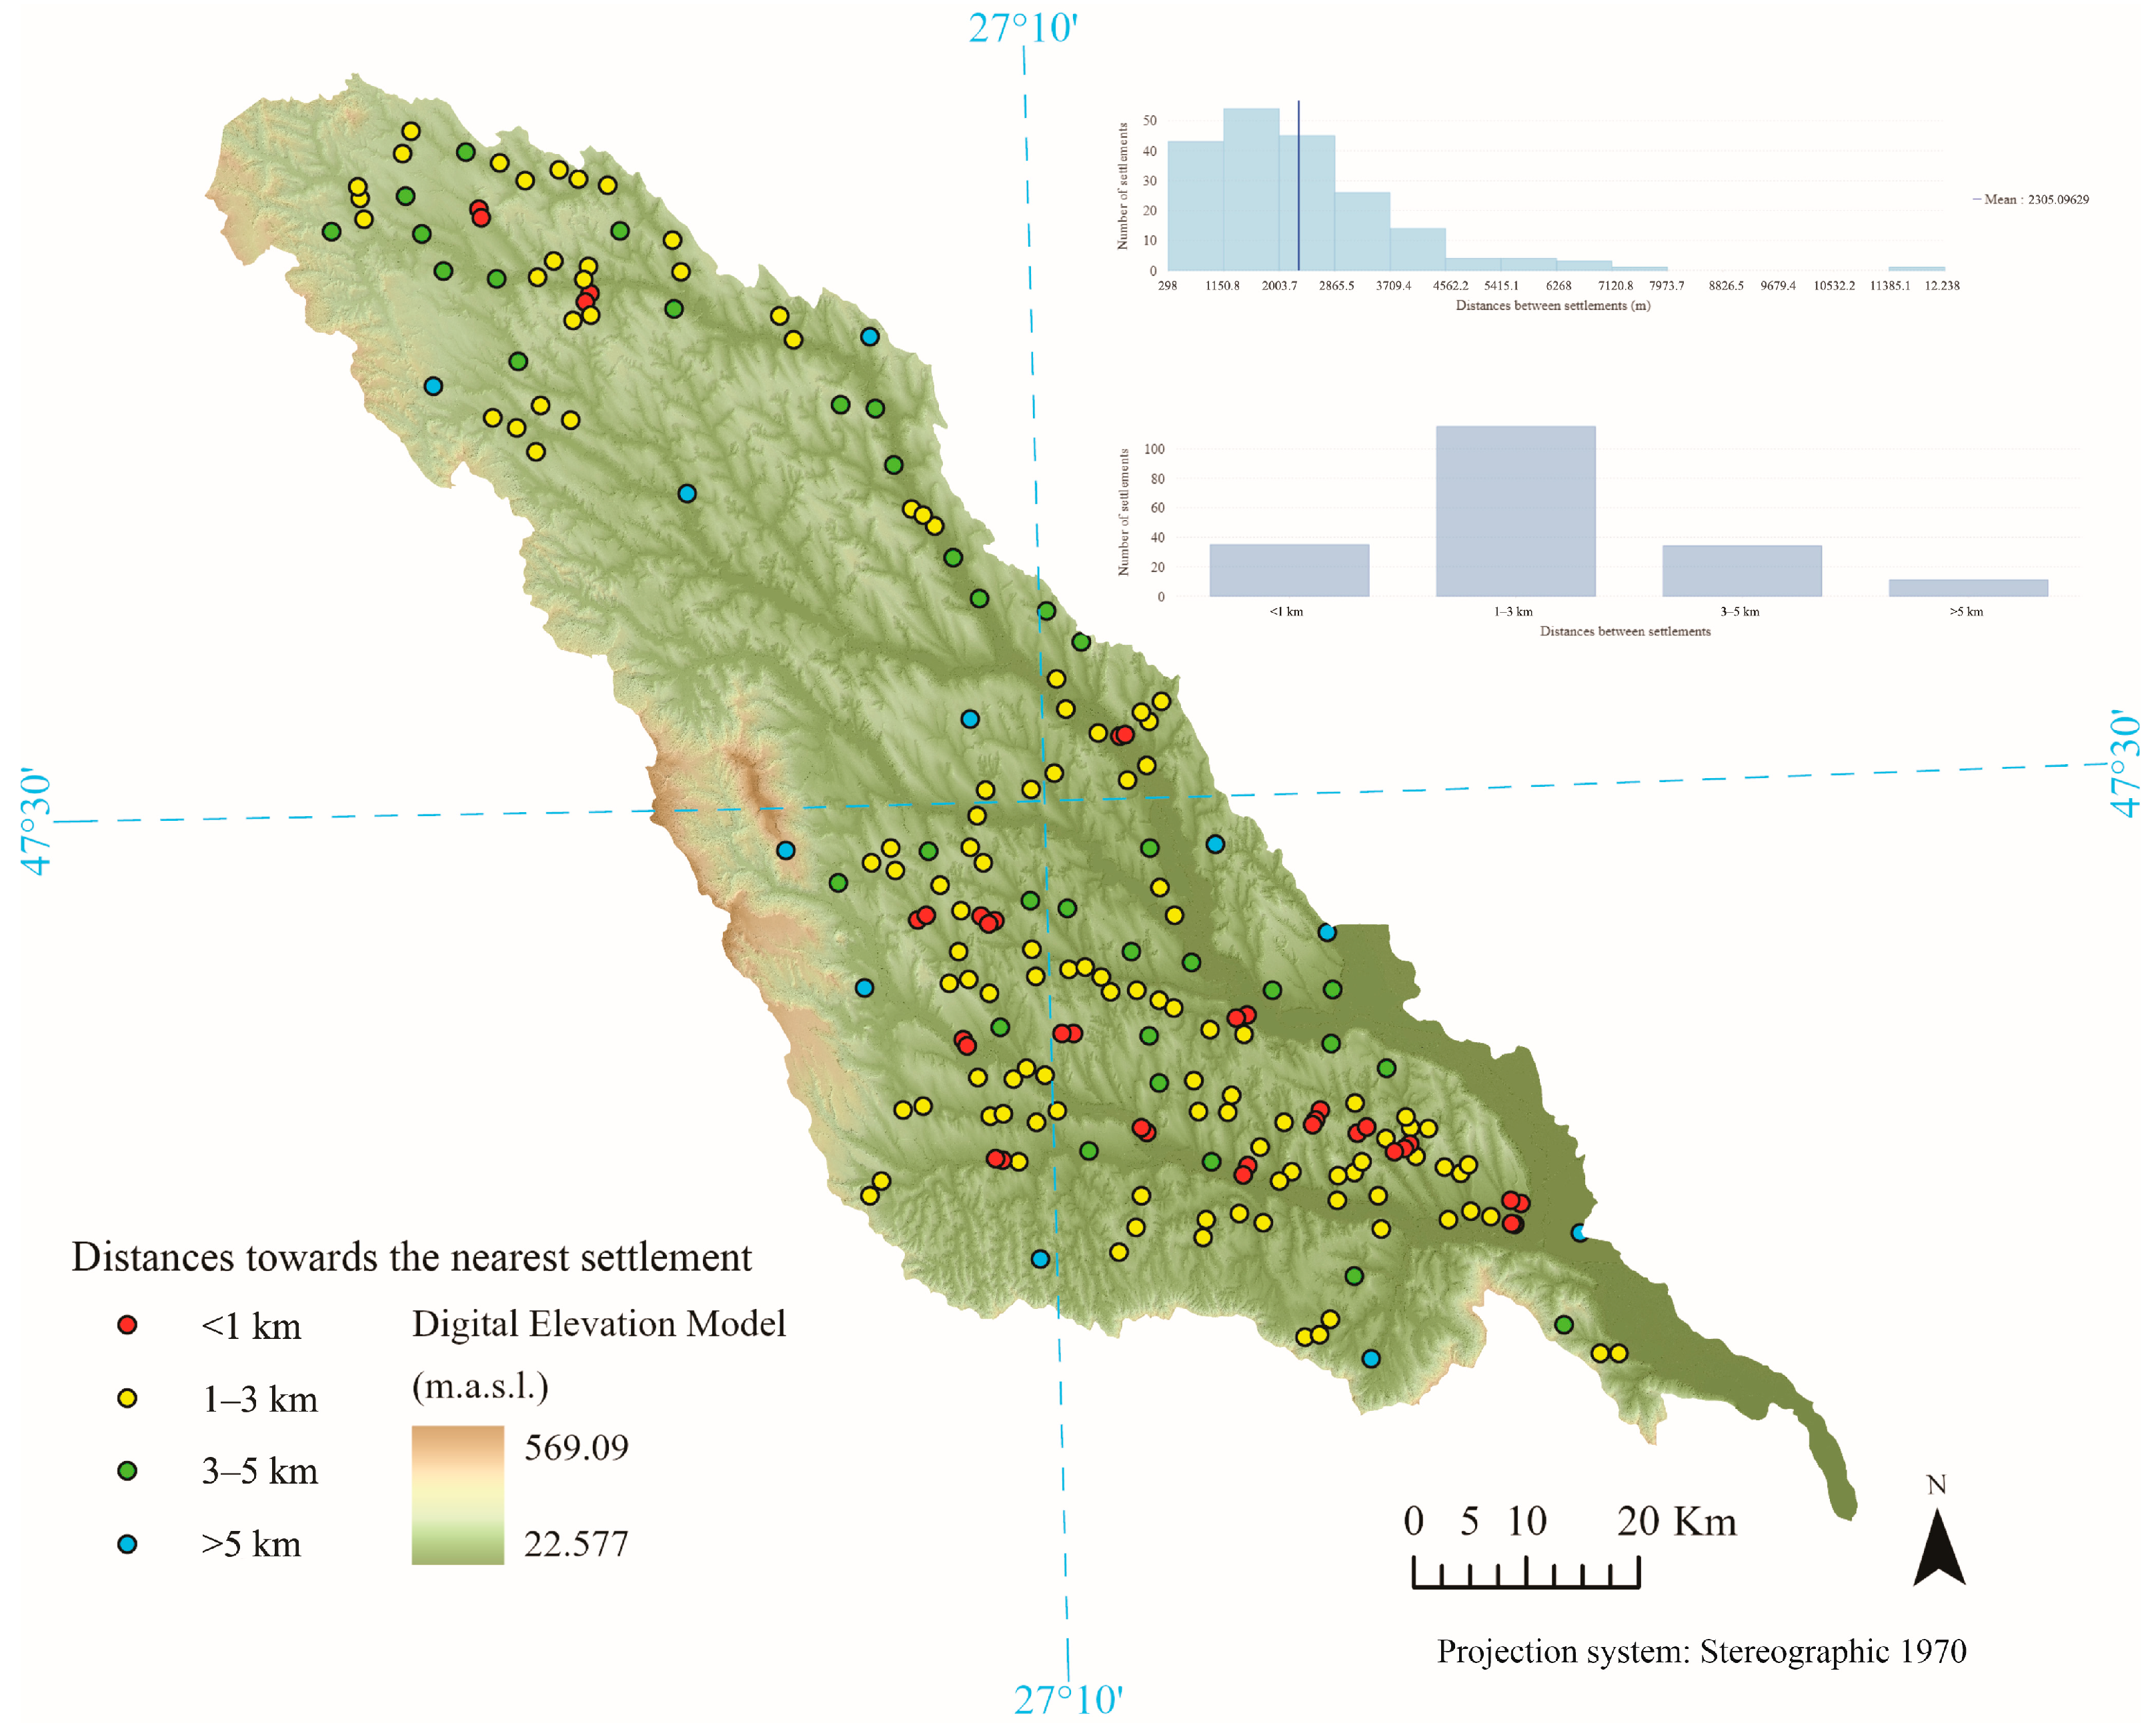
After performing the same calculations for the distances existing between settlements (
Figure 10), we could observe a preference for placing the settlements at distances between 1 and 3 km (58.9%). In general, the results show an appetency for placing the sites at no more than 5 km distance. This analysis is directly related to the following two methods used, namely,
Nearest Neighbor and the density estimation, representing the foundation of the spatial distribution analysis.
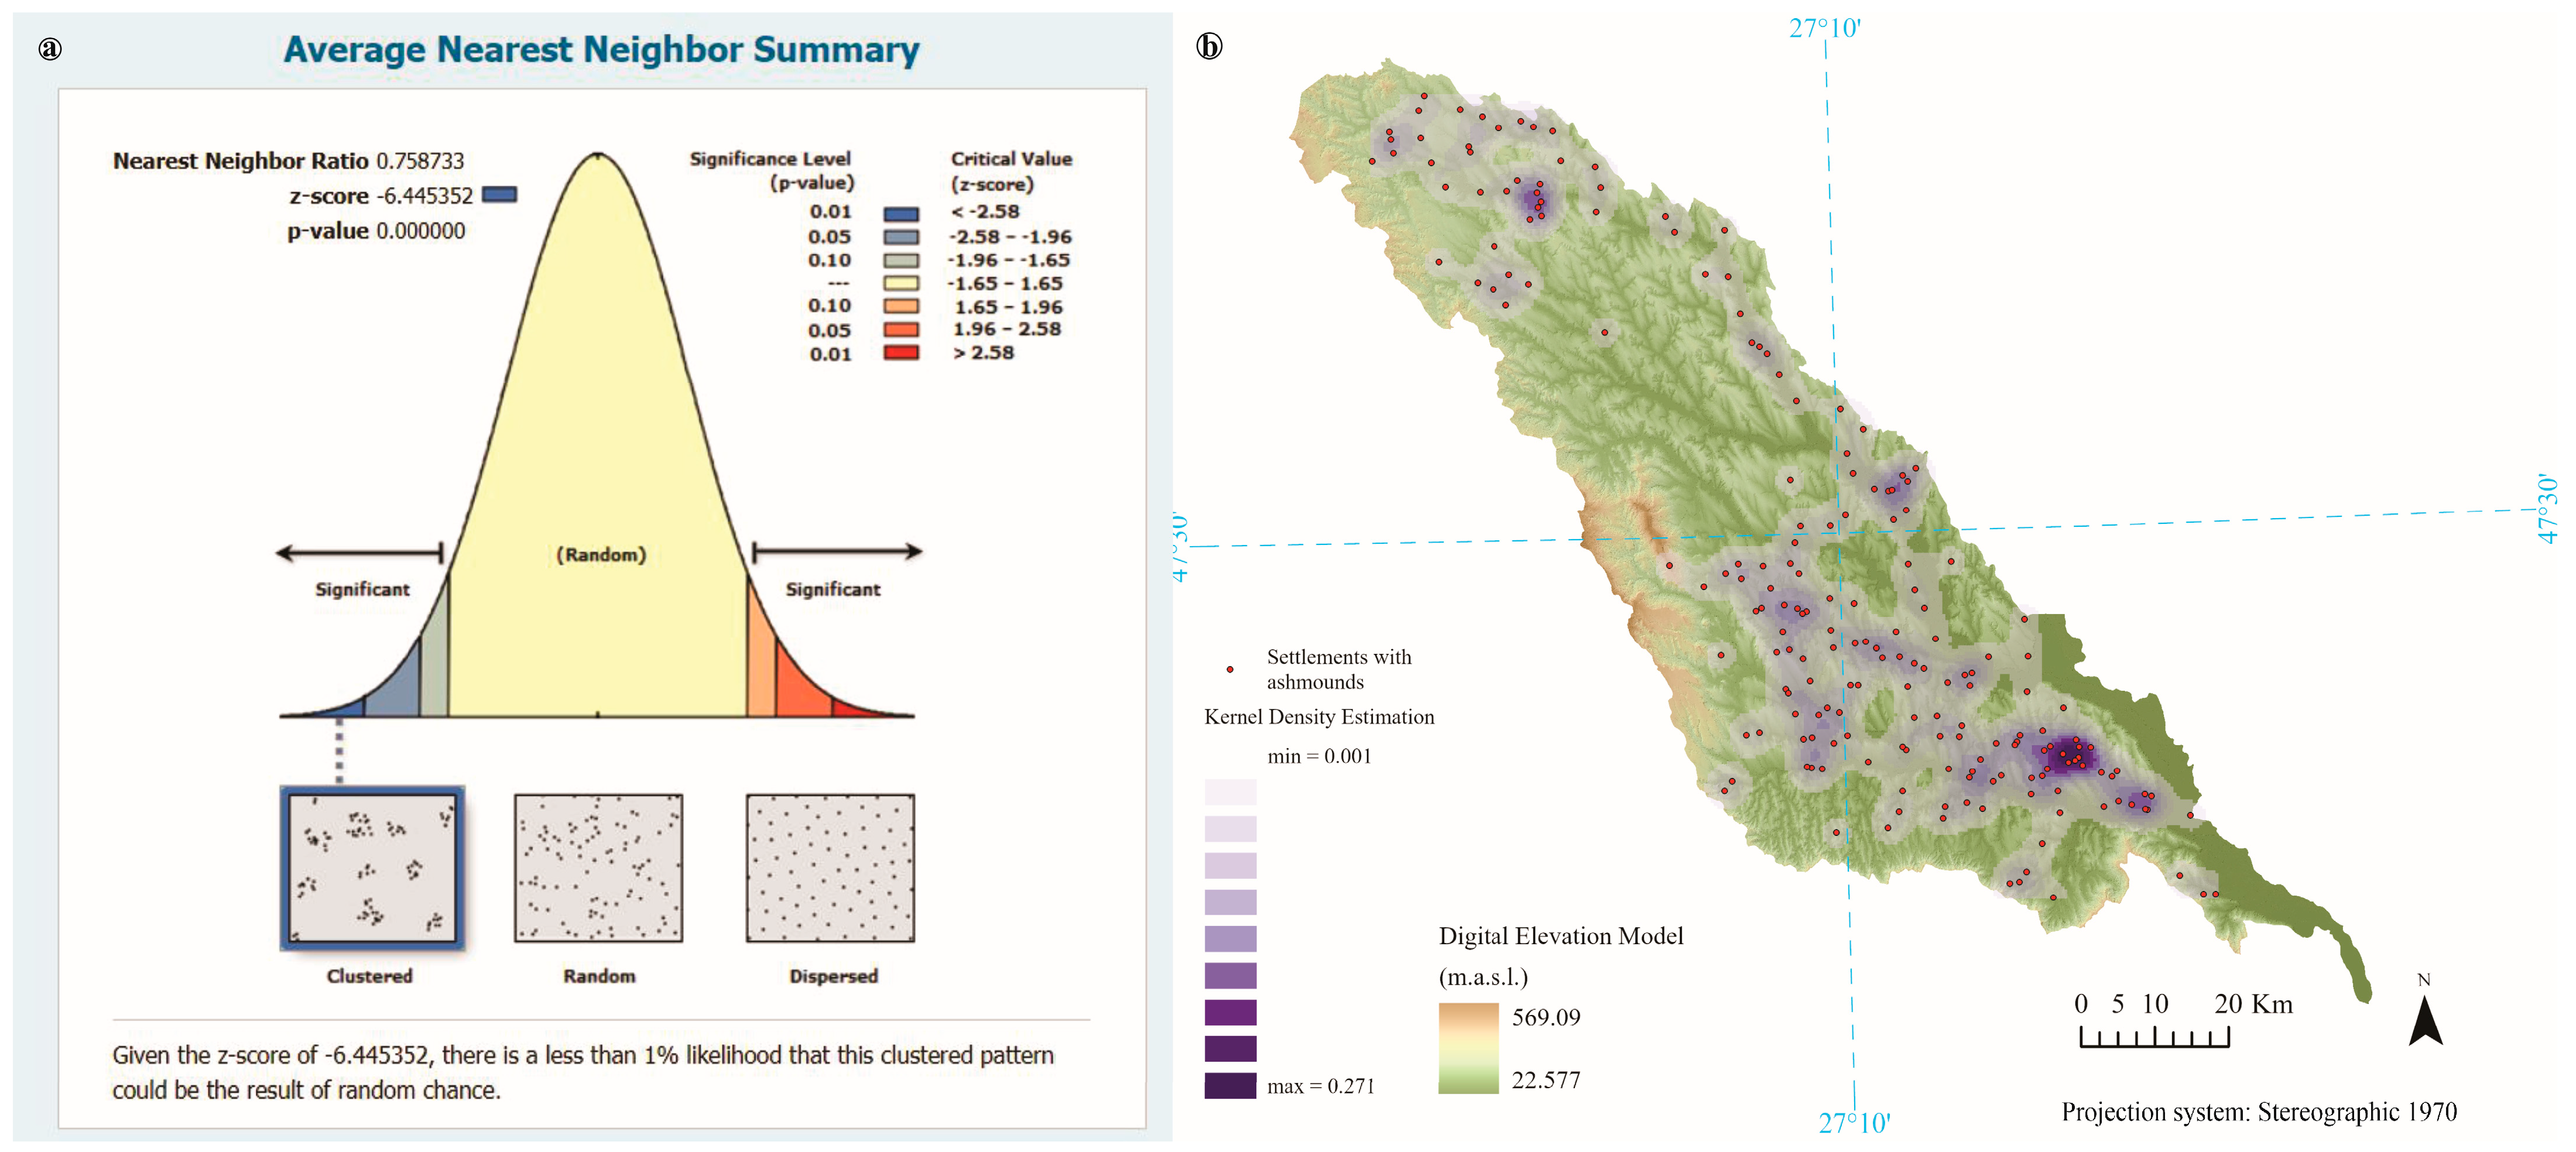
The values obtained from the calculation of the aggregation coefficient (R < 1) (
Figure 11a) suggest that the preferred way of organizing the settlements of Noua communities in the Jijia River basin is represented by large, concentrated groups, placed in relation.
The
Kernel Density Estimation function (
Figure 11b) revealed important data about the main areas of site concentration. The preference for the lower areas located in the southern half of our workspace is obvious, the main core being found along the Ciric and Cacaina Rivers (10 settlements per 44 km
2). Important areas of density were also identified in the upper basin of the Jijioara River and along Gurguiata stream (five sites within a perimeter of about 16 km
2), but also in the upper basin of Jijia, at its confluence with the Tălpeni, Putreda and Valea Iazurilor Rivers (six settlements per 15.4 km
2).
As stated above, in order to obtain a better image regarding the significance of the ashmounds present inside the settlements in question, we conducted non-invasive research on two sites located in the lower basin of the Jijia River. The motivation behind this selection was represented by the high number of grey ‘spots’ visible on the surface, as well as the numerous archaeological materials present. Two settlements were thus investigated, namely, Coarnele Caprei–
Aramei Hill I and Bădeni–
Moara de Vânt Hill, both located in Iași County. First, several UAV flights were performed, thus obtaining aerial photographs, Digital Surface Models and orthomosaics (
Figure 12).
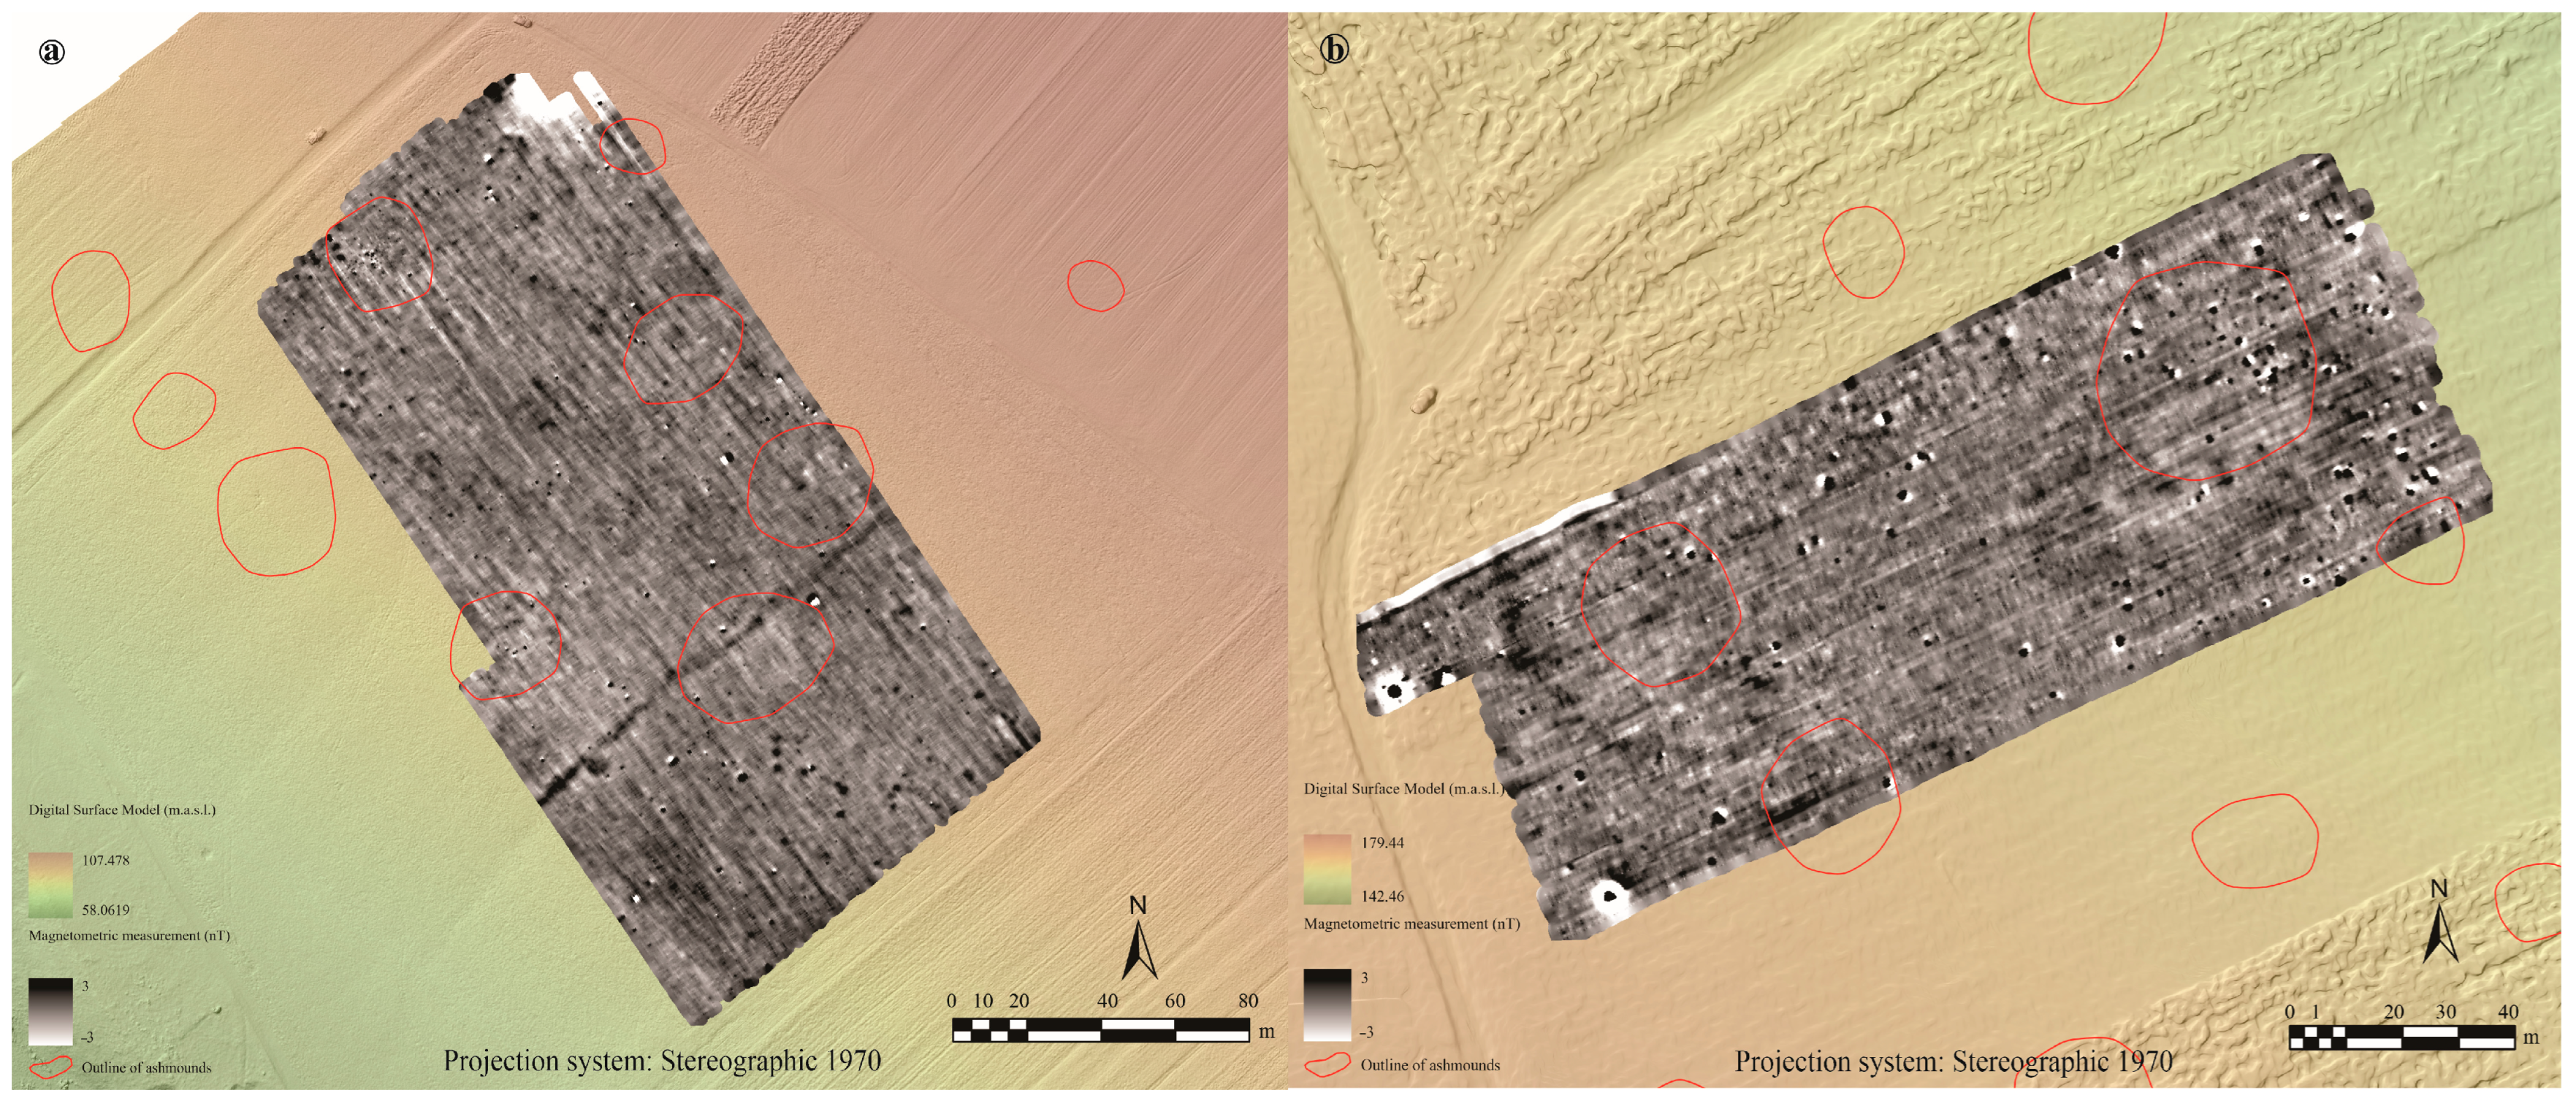
The first geophysical method used was a magnetometer survey (
Figure 13), in order to confirm the hypothesis [
11] according to which the ashmounds were wrongly named, with no connection to a virtual layer of ash. The results show clearly that the burning of LBA dwellings took no part in obtaining the ash-like soil, since if that had happened, then the magnetic map should have presented very high contrasts. In our cases, the visible anomalies are, mostly, specific for pits; however, an outline of the ashmounds is visible, especially in the case of the site from Bădeni. Another interesting observation comes from the site of Coarnele Caprei, where the most distinctive anomalies appear in the south-eastern area, with no ashmounds visible on the soil surface.
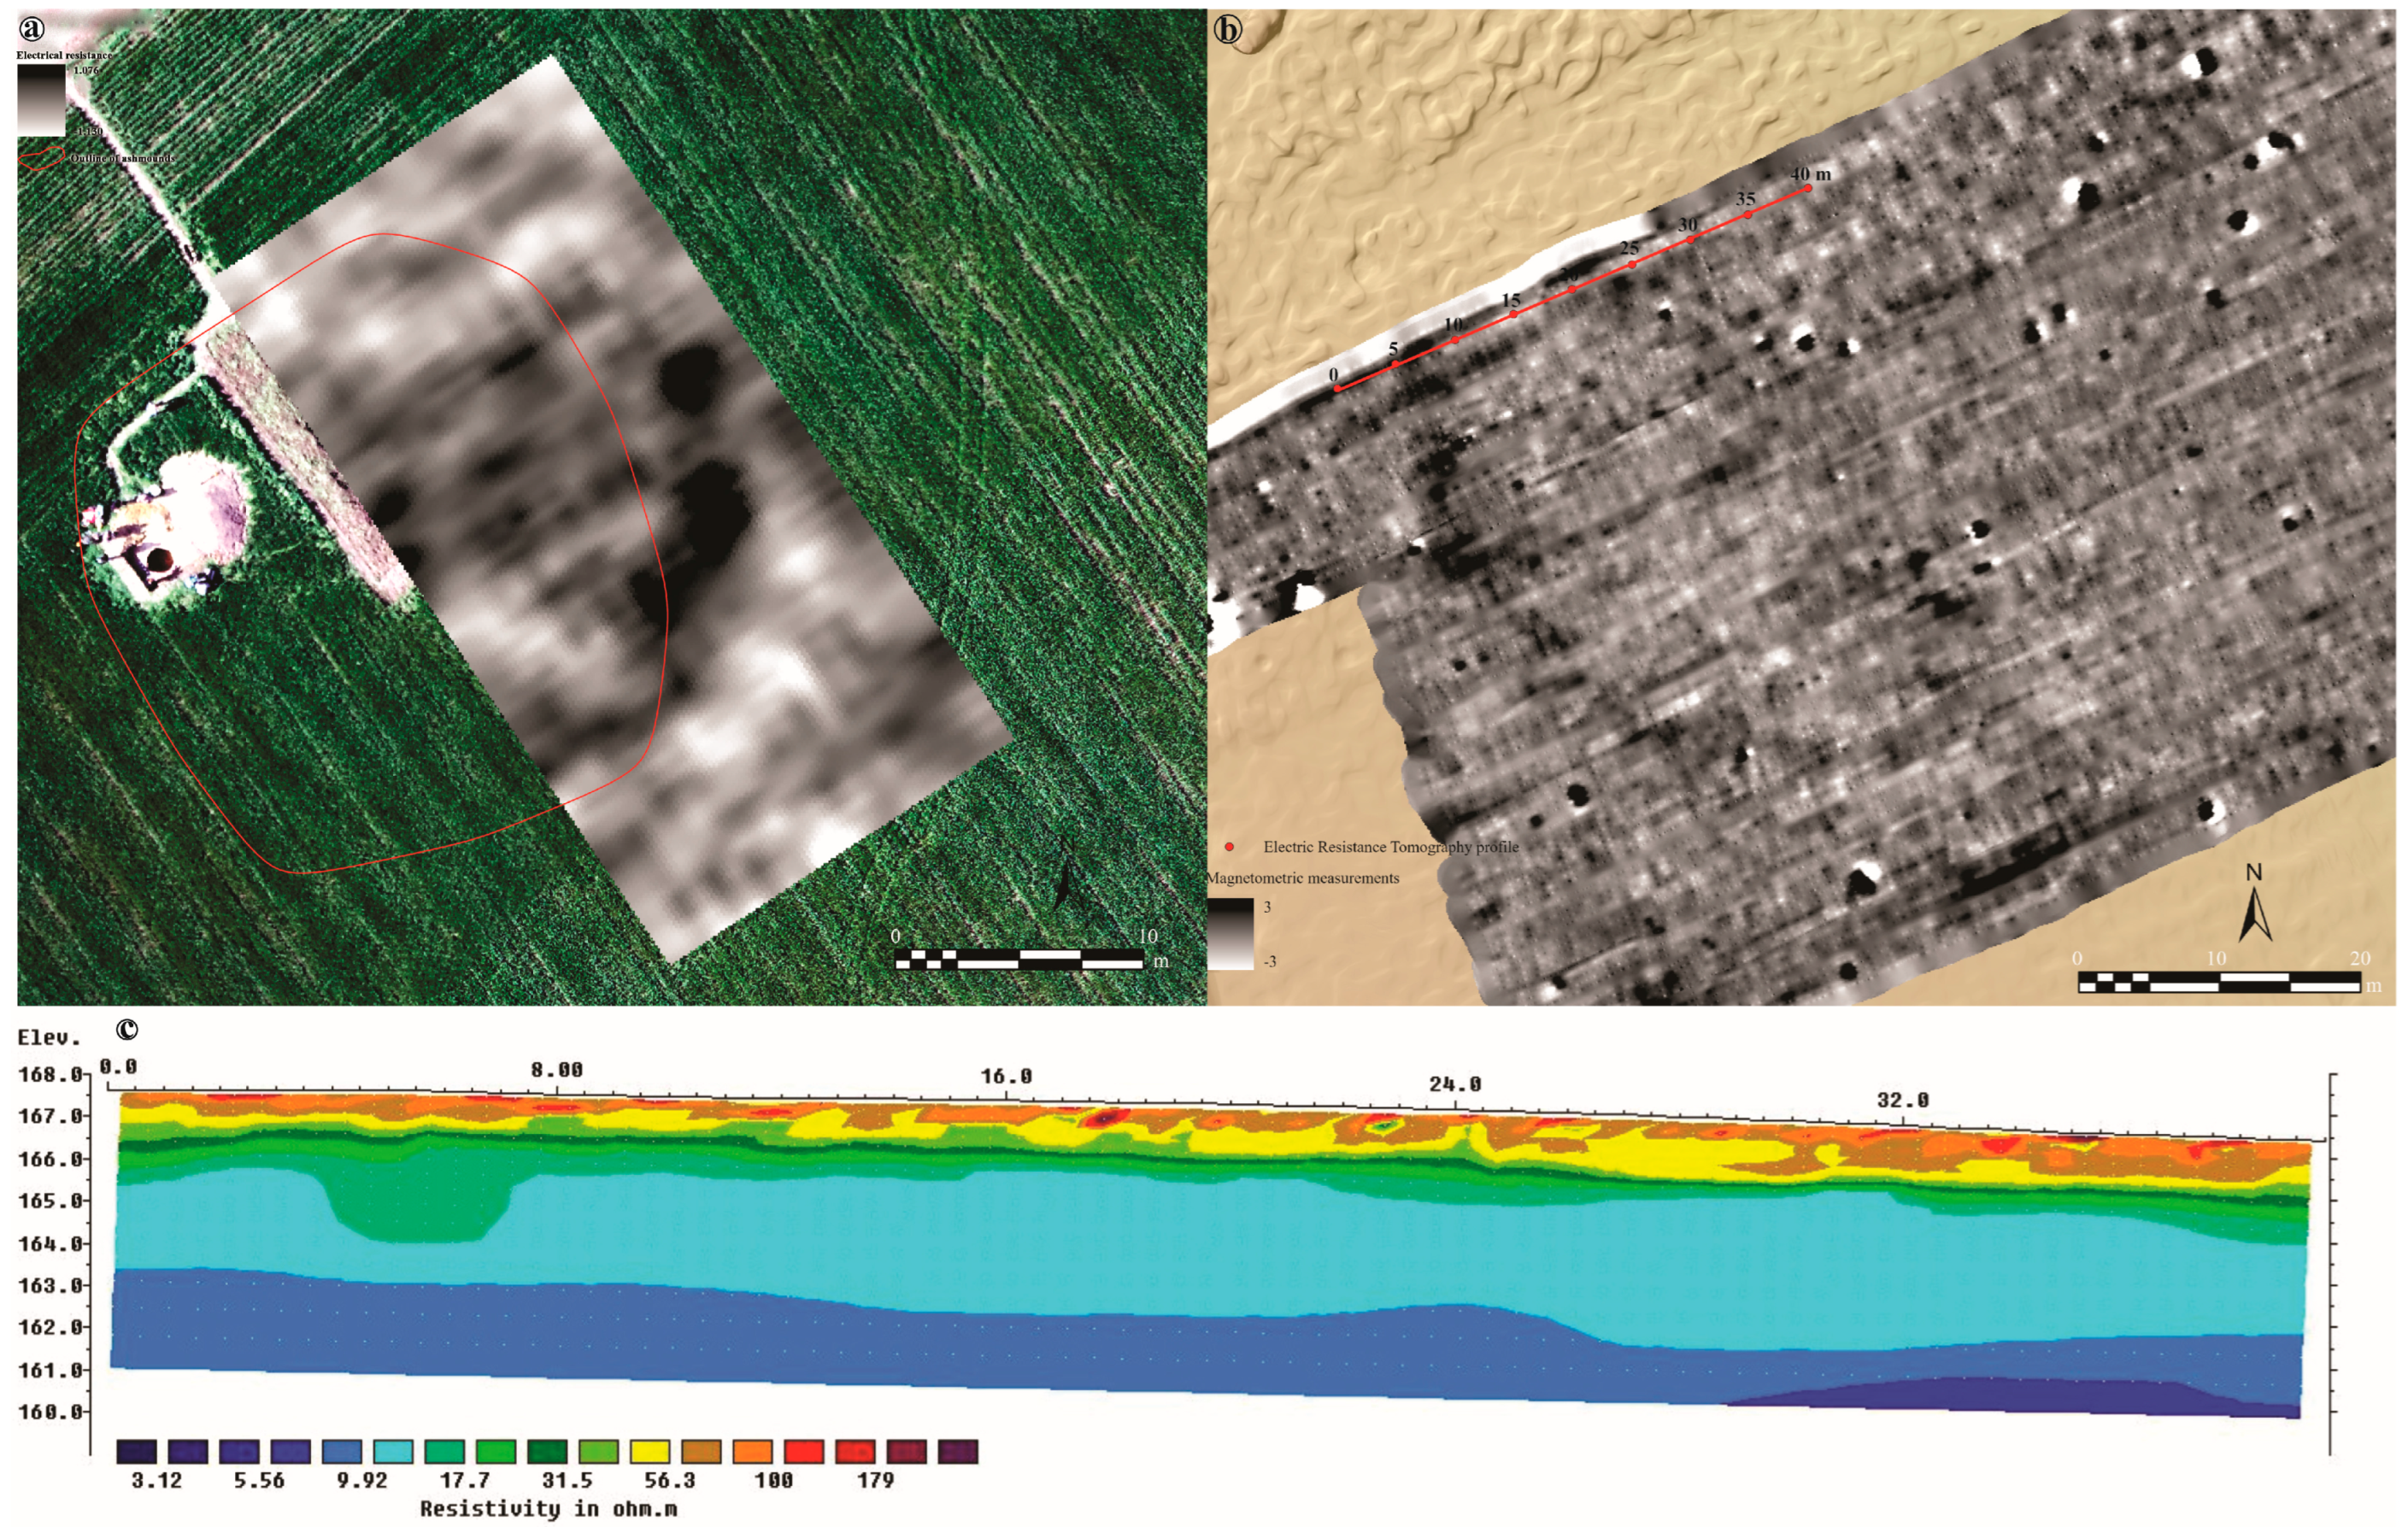
In order to verify the potential of different geophysical measuring methods on the ashmounds as well as the ‘anomalies’ representing the outline of the ashmounds, we conducted geoelectric measurements (
Figure 14), consisting in Electrical Resistance and Electrical Resistance Tomography. The first method was used for the settlement of Coarnele Caprei, and the results show a segment of the ashmounds’ outline, presenting a high resistance, located in the southeastern area. This type of ‘answer’ contrasts the typology of ditch-like anomalies, which usually have a low resistance [
45], excluding this possibility, at least in this case. The archaeological excavations conducted afterwards (the two trenches are visible on the ortophotoplan overlapped by Electrical Resistance results (
Figure 14a)) have proven that the filling of the investigated ashmound was not very consistent, with almost no archaeological materials, while on the surface there were many ceramic and bone fragments.
Meanwhile, in the case of Bădeni, we measured an ERT profile of 40 m (
Figure 14b,c) that allowed us to confirm the presence of a ditch-like anomaly on the ashmounds’ south-western extremity. The depth of approx. 2 m that the ERT profile suggests for this feature compels us to approach this anomaly with caution, until the archaeological excavations will be able to offer new insights.
4. Discussion
Overall, the results show that the settlements of Noua communities from the Jijia River’s catchment were organized in large, concentrated groups, probably interconnected, as evidenced by the calculus of the aggregation coefficient, but also by the distances between settlements (1000–3000 m). However, the high number of sites, together with the economical specificities of Noua groups, may suggest a different interpretation. It has already been stated that the LBA groups belonging to the NSC cultural complex were seasonal migration communities, moving around the territory in order to have access to the necessary resources [
48,
49]. Thus, the relatively small areas that present a high number of sites could have been, in fact, occupied by only one or two groups that kept moving, after fully exploiting the formerly occupied terrain.
In terms of density estimation, the results not only provide information regarding the areas with a high population density, but also about the most ‘avoided’ areas, characterized by shallow habitation. The latter is the case of the central territory (the upper basin of Miletin River and the lower basin of Sitna River), in which only one settlement with ashmounds (newly discovered) was reported. The situation is not much different for the other category of settlements either, with less than 10 sites specific to the LBA, in general, being discovered. The explanation could have its origin in the pedological specificity of this territory, as numerous soil types are reported (chernozems, erodisols, brown-luvic soils, alluvial protosols, regosols and gray soils). Therefore, a high presence of wetland-specific soils is observed, suggesting the existence of an unfavorable living environment. Additionally, the gray forest soils are frequently met, which implies the existence of a heavily forested area. Of course, it is possible that the current state of research is playing a trick on us in visualizing the spatial distribution of the settlements, but it is interesting to note that many isolated discoveries have been identified in this area [
50]. In other words, we cannot rule out the possibility that this area, through its geographical characteristics, may have influenced the behavior of the communities (the isolated discoveries could represent proofs of votive offerings, made in order to ‘ensure’ a safe passage through an area with potential dangers for travelers). Only after performing a high number of field studies and non-invasive investigations will we be able to state, with certainty, what the explanation is behind the avoidance of the central territory.
The analysis of the hydro-geomorphological indicators showed that the settlements frequented by the groups in question were found at low altitudes (usually between 50 and 100 m.a.s.l.), on lands with smooth slopes (<5°), in river valleys, but also in high areas (by comparison with the surrounding area), placed at distances between 100 m and 500 m from secondary rivers or confluence areas. The terrains had, usually, southern, eastern or south-eastern exposures, gaining high solar radiation and warmth. All these parameters can be explained, first of all, by the specifics of the economy practiced by these communities, as they describe areas favorable to animal husbandry, the main activity among Noua communities. Smooth slopes are amongst the most preferred, regardless of the chronological interval, due to the low effort of crossing; this aspect became even more important at the end of the Bronze Age, as it facilitates the high degree of mobility required by activities such as cattle breeding. The proximity to the water source ensures the subsistence of these individuals and contributes to the conduct of daily activities, and also facilitates the supply of water for the animals. At the same time, the areas characterized above (low terraces with smooth slopes, located near water courses) are known for the presence of soils suitable for agriculture and are also characterized by a wide range of vegetation. Most of the Noua settlements were located on territories with different types of chernozems (especially cambic), alluvial soils, protosoils, fluvic gleysols (vertic), etc. Regarding the first category, it can be stated that they belong to the class of soils with the best properties, having a high content of humus and nutrients, being suitable for the cultivation of cereals such as barley or wheat [
51], plants known (due to the archaeobotanical analyses) to have been used by the LBA communities located east of Prut [
11,
49]. Alluvial soils and protosoils offer the advantage of a very low water retention capacity and very fast drainage [
52], which could be a factor of interest for the LBA human groups in the context of economic activities and proximity to watercourses. Finally, fluvic gleysols are part of the halomorphic category, being unsuitable for agriculture due to the high content of soluble salts and clay [
53]. Being specific to Jijia River’s meadow, we consider that the explanation behind this choice is given precisely by the presence of the river in question and the advantages obtained when locating the settlements in its proximity.
The specificities presented above would not have been found at higher altitudes, on terrains characterized by the presence of different soils, with steep slopes, which involved a longer route to the water source. However, we consider that the reasons behind the selection of such areas cannot be restricted to those set out above. Although, in many cases, individuals who lived at the end of the Bronze Age were considered mere shepherds, concerned only with the mentioned activity, the number of preferences expressed by them reveals a different behavior. The choice for proximity to water sources is also explained by the advantage of gaining control over the waterway. Rivers are not only a source of water supply, but also a means of communication or artificial transportation, and the presence of a large number of settlements in the close proximity of Jijia River proves just that. The location of a settlement near a fourth-order river, at very low altitudes and on lands characterized by disadvantageous soils, implies a degree of ‘recklessness’ in the face of danger, especially if we bear in mind that there are many affluents, with much lower flows and which could provide better living conditions nearby. Although there are no findings to certify the practice of navigation by Noua communities, we believe that this hypothesis cannot be ruled out. Thus, if we accept the possibility of water transportation, then the importance of Jijia in the working area cannot be disputed. It could facilitate not only the contact with contemporary human groups from the studied area, but also with those specific to the Sabatinovka culture in present-day Ukraine. In addition, due to its confluence with Prut River, Jijia could represent an access route in the eastern territories (nowadays Republic of Moldova). Regarding the relation to the water source, we have to mention the high number of sites located in the vicinity of confluence areas. In this case, we have to take into consideration the so-called positioning for subsistence, which involves the exploitation of fords along the waters [
54].
The characteristics set out above are broadly valid for several regions in the area occupied by Noua communities [
28,
49,
55,
56,
57,
58,
59]. Additionally, through the comparative analysis of several case studies within the same working area [
50], a certain degree of adaptation of the communities to the existing environmental conditions in the inhabited micro-area, while preserving a set of constants (regardless of the physical–geographical specificity of the space), was noticed.
The presence of a large number of sites, on the surface of which ashmounds were reported, along with access to LiDAR measurements, numerous satellite images and personal aerial photographs, also allowed a new type of analysis to provide information regarding the number and diameters of the structures, occupied surfaces, manner of arrangement, etc. The sites in question occupy up to 30 ha and have between 1 and 30 ashmounds, located at distances of up to 120 m and with diameters between 10 m and 50 m, the largest of which are found, in particular, in the northern extremity of the workspace, while the smallest are found, predominantly, in the southern half. The features are often arranged in parallel semicircles, along the hydrographic arteries located nearby, but linear, circular or irregular arrangements are also encountered. There were also reported cases in which they were arranged in two small groups, separated by one or two water sources, as is the case of the site from Bădeni.
In almost all the cases, the structures of interest offered elevational responses, being noticeable on the LiDAR measurements, a fact already known due to the aspect that these structures acquire over time, being similar to small mounds. On the other hand, although all the existing sources were analyzed, for each of the sites, no defensive or delimitation elements could be identified, such as those indicated in other areas [
54,
55]. The explanations for this could be represented either by the superficial nature of the structures or by the socio-economic specificity of the communities in the workspace. Nevertheless, the geophysical prospections highlighted the outline of the ashmounds, presenting higher electrical resistance than the fillings. These methods were used in order to acquire novel data regarding the potential structures found within the ashmounds, as well as between them. First of all, the magnetometry confirmed the lack of ash or burned remains inside the so-called ashmounds. Additionally, we were able to notice differences regarding the manner in which the ashmounds revealed themselves in the two magnetic maps obtained. The explanation came while performing two test trenches in the settlement of Coarnele Caprei. After the magnetic measuring of almost the entire settlement, we were able to identify only weak contrasts and very few anomalies (most of which were located outside the ashmounds area). One small ashmound (not visible on the soil surface) was, however, highlighted in the north-western area, while the other features (that had high contrast on the field and, also, lots of archaeological materials on the surface) were not visible. Afterwards, we conducted an excavation in order to obtain soil samples for pedological, chemical and archaeobotanical analyses, as well as to confirm the presence of pit anomalies. Unfortunately, the intensive agricultural works have destroyed a big part of the settlement. Thus, the test trenches presented little to no archaeological materials, although on the soil surface we identified numerous ceramic fragments and bone tools specific to Noua communities. Additionally, the LiDAR measurements proved that the studied ashmound has very low elevation, being almost completely flattened. Meanwhile, the measurements realized for the site of Bădeni have provided us with important results: the ashmounds that we investigated presented good magnetic contrast, also highlighting the outline of the ashmounds with diameters that seem to reach up to 70 m. Later, through the usage of geoelectric methods, we were able to notice the presence of alveolar features, such as a ditch-like anomaly that reaches ca. 2 m depth. For now, these results only offer a series of new questions, to which we will be able to find answers only after performing new excavations, in both settlements as well as within other sites.
Additionally, important information is obtained if we take into consideration the situation from the site of Coarnele Caprei, as well as similar cases, such as the one from Mihălășeni (Botoșani County) [
60] where, although the settlement presented no visible ashmounds, the features in question were discovered beneath the arable soil layer. This led us to believe that the ashmounds that present very good contrast on the soil surface and no elevation on LiDAR measurements could in fact be irreversibly damaged by agricultural works. Through intensive ploughing, the small mounds were flattened, and the materials discovered during fieldwalks could represent, in fact, the bottom of the former ashmounds.
5. Conclusions
There have passed 120 years since the discovery of the first archaeological materials belonging to Noua communities [
61], and the studies concerning these groups seem to be still stuck in the archaeological paradigm of the second half of the 20th century. The use of the various methods and techniques that the last century has made available for archaeology has become imperative. Thus, the present approach, through the usage of environmental and landscape archaeology methods (GIS tools, aerial photographs, LiDAR measurements and geophysical prospections) and their corroboration with the existing information from various fields (geography, pedology, biology, etc.) comes to contribute to the completion of the currently fragmentary picture regarding the communities that inhabited the area between the middle and upper Dniester and the territory east of the Apuseni Mountains at the end of the Bronze Age.
The GIS spatial analysis showed that the LBA Noua communities were organized in large, concentrated groups of settlements that were, usually, located on lowlands, with smooth slopes, in the immediate vicinity of secondary rivers or confluence areas. The terrains benefited from warmth and high solar radiation, due to their slope exposure (usually, southern, eastern or south-eastern). Additionally, their positioning not only allowed them to gain control over the hydrographic artery in proximity, but also provided the communities with all the necessary resources in order to perform their usual activities, namely animal husbandry. Next, the aerial photographs, as well as LiDAR measurements and orthophotographs, allowed us to state that the settlements that present ashmounds on the soil surface (from the Jijia River catchment) occupy surfaces of up to 30 ha, with a maximum of 30 ashmounds visible, with diameters between 10 m and 50 m. While the smaller sites are located in the southern half of the workspace, the biggest are found, predominantly, in the northern extremity of the studied area, the latter being a territory with higher altitudinal values. Last but not least, the non-invasive investigations have confirmed yet again that burning played no part in obtaining the ash-like soil. While on the magnetic measurements the features in question show little to no contrast, the geo-electrical investigations have proven the most useful when studying this type of ‘structures’. Finally, integrating all of the above within a GIS software and, also, performing test trenches in one of the settlements with ashmounds, has shown that the grey spots with little to no elevation, that also have very good contrast on the surface, are mere shallow witnesses for what once were the ashmounds belonging Noua culture. Thus, we believe that the current research model could be implemented in the future in the study of other sites with and without ashmounds visible on the soil surface, belonging to distinct areas, in order to relate the geophysical measurements with the archaeological excavations and geo-chemical analyses. Only in such a way will we be able to say for sure what the functionalities of the ashmounds were within a settlement and how were they formed.


