Technical Note

An Improved Approach of Winter Wheat Yield Estimation by Jointly Assimilating Remotely Sensed Leaf Area Index and Soil Moisture into the WOFOST Model

1
College of Land Science and Technology, China Agricultural University, Beijing 100083, China
2
Institute of Arid Meteorology, China Meteorological Administration, Lanzhou 730020, China
3
School of Geography and Earth Sciences, McMaster University, Hamilton, ON L8S 4L8, Canada
4
Key Laboratory of Remote Sensing for Agri–Hazards, Ministry of Agriculture and Rural Affairs, Beijing 100083, China
*
Author to whom correspondence should be addressed.
Remote Sens. 2023, 15(7), 1825; https://doi.org/10.3390/rs15071825
Submission received: 13 February 2023 / Revised: 16 March 2023 / Accepted: 28 March 2023 / Published: 29 March 2023
(This article belongs to the Special Issue Crop Quantitative Monitoring with Remote Sensing)

Abstract

:
The crop model data assimilation approach has been acknowledged as an effective tool for monitoring crop growth and estimating yield. However, the choice of assimilated variables and the mismatch in scale between remotely sensed observations and crop model-simulated state variables have various effects on the performance of yield estimation. This study aims to examine the accuracy of crop yield estimation through the joint assimilation of leaf area index (LAI) and soil moisture (SM) and to examine the scale effect between remotely sensed data and crop model simulations. To address these issues, we proposed an improved crop data-model assimilation (CDMA) framework, which integrates LAI and SM, as retrieved from remotely sensed data, into the World Food Studies (WOFOST) model using the ensemble Kalman filter (EnKF) approach for winter wheat yield estimation. The results showed that the yield estimation at a 10 m grid size outperformed that at a 500 m grid size, using the same assimilation strategy. Additionally, the winter wheat yield estimation accuracy was higher when using the bivariate data assimilation method (R2 = 0.46, RMSE = 756 kg/ha) compared to the univariate method. In conclusion, our study highlights the advantages of joint assimilating LAI and SM for crop yield estimation and emphasizes the importance of finer spatial resolution in remotely sensed observations for crop yield estimation using the CDMA framework. The proposed approach would help to develop a high-accuracy crop yield monitoring system using optical and SAR retrieved parameters.

1. Introduction

World food security is suffering multiple threats [1]. There are many factors affecting agricultural production, especially from 2020, the COVID-19 pandemic is obscuring economic prospects and threatening food security in ways no one could have anticipated, and the situation may only get worse if we do not act urgently and take unprecedented action [2]. Therefore, the importance of obtaining timely and precise regional estimates of crop yields and growth has become increasingly vital to inform and formulate food policies, with an emphasis on ensuring food security and promoting social stability.
The crop growth model (CGM) is popular in crop growth status and grain yield simulation, and there are many successful applications at the field scale [3,4]. However, the uncertainties and spatial variability of the CGM’s input parameters hinder the regional-scale CGM application [5]. The incorporation of remote sensing (RS) technology into crop models through the utilization of data assimilation (DA) techniques has facilitated the estimation of regional-scale crop yields [6,7]. It is usually assumed that the errors caused by RS observations anomalies or rescaling are acceptable when they are integrated into the crop data-model assimilation (CDMA) framework [7,8]. Numerous previous studies have assimilated variables retrieved from RS information into crop models, and the RS data can, therefore, constrain model simulation to increase their accuracy [9,10,11,12,13,14].
Assimilation variables in the CDMA framework are vital in estimating crop yield, and it is closely related to crop management and the leading factors that affect crop yield. For example, LAI has been widely adopted as a univariate variable in the CDMA scheme for regional crop yield estimation, and it may be an ideal assimilation variable in fully irrigated crop regions. However, in rainfed croplands, crop water stress is a common phenomenon, and, therefore, SM observations with high accuracy are preferable for accurate crop yield estimation. Aside from univariate assimilation research, there have been several assimilation studies using two-state variables that try to consider more crop growth-related factors, and some promising results have been achieved. Ines et al. integrated AMSR-E SM data and MODIS LAI product into Decision Support System for Agrotechnology Transfer (DSSAT) model for maize yield prediction, and results showed higher accuracy in maize yield estimation when SM and LAI were jointly assimilated [7]. Xie et al. obtained promising yield estimation results at the 30 m spatial scale by assimilating Landsat retrieved LAI and SM into the CERES-Wheat [15]. Jin et al. assimilated canopy cover (CC) and aboveground biomass (AGB), retrieved from remotely sensed vegetation indices, into the AquaCrop model for maize yield estimation [11]. Results showed that the bivariate assimilation strategy performed better than univariate assimilation and could produce a robust result. These results indicated that a CDMA scheme with more than one state variable could better optimize crop parameters, thereby improving crop yield estimation [9].
In addition, the data assimilation algorithm constitutes a crucial component in the effective operation of the CDMA scheme. To date, the commonly used DA algorithms include variational methods and sequential methods [16]. Four-Dimensional Variational (4DVar), a typical variational approach, define a cost function that describes the distance between the optimized value of the model parameter and the initial value and the distance between available observations and model simulations [17]. The primary limitation of this method is its high computational cost, as a significant number of iterations are required to determine the optimal model parameters. In contrast, the Ensemble Kalman Filter (EnKF), a typical sequential approach, has been shown to be more efficient in reducing the computation time [18]. The implementation of the EnKF in the CDMA scheme has shown favorable outcomes in the accurate estimation of regional-scale crop yield [7,19,20,21,22]. However, EnKF does not always perform better in crop yield estimation. For example, Nearing et al. found the absence of a significant relationship between leaf and grain growth when assimilating observed LAI into the DSSAT model, which hinders the performance of EnKF [23]. Standard EnKF has the problem of “filter divergence” that prefers to refuse observations, especially in the later growth stages [7,20,24], and relative measures are recommended to reduce this issue when using EnKF in the CDMA scheme. Zhuo et al. solved this issue using a factor that can inflate with the growth period [25].
Moreover, scale mismatch among crop models, field measurements, and remotely sensed observations also influence the accuracy of yield estimation. Due to the complexity of the natural environment, there are great differences in the spatial characteristics of ground objects. The phenomenon where ground objects appear differently at various spatial scales is referred to as the “scale effect” [18,26,27]. Agricultural plots, especially the winter wheat field in China, are usually scattered and patchy, and satellites with coarser pixels (>250 m) may lead to RS observations retrieved from the more inhomogeneous land surface than high spatial resolution sensors (1 m to 30 m) [28]. Therefore, it is of paramount importance to explore the performance of sensors with different spatial resolutions in the CDMA scheme and to compare the spatial mismatch, particularly in the context of estimating regional crop yield.
In sum, the objectives of this study were to (1) explore the accuracy of the joint assimilation of LAI and SM into the WOFOST model for regional winter wheat yield estimation; (2) discuss the scale effect of remotely sensed observations on the CDMA scheme. Specifically, as a continuation of our previous study [13], we chose SM and LAI as assimilation variables to construct univariate and bivariate CDMA framework using EnKF, a sequence filter approach, to estimate regional winter wheat yield under different spatial scales (10 m grid size and 500 m grid size). This study is expected to serve as a reference for the variable assimilation selection within the CDMA framework and strengthen our understanding of regional crop yield estimation using the crop model data assimilation method.

2. Materials and Methods

2.1. Study Area

The study area is located in Hengshui city (37°03′N–38°23′N, 115°10′E–116°34′E, Figure 1), which includes 11 counties, which has a temperate continental monsoon climate. The annual average temperature and rainfall range from 9 °C to 15 °C, and 400 mm to 800 mm, respectively [13]. Winter wheat is typically planted from early September to October, with a harvesting period from May to June in the subsequent year [29].

2.2. Data

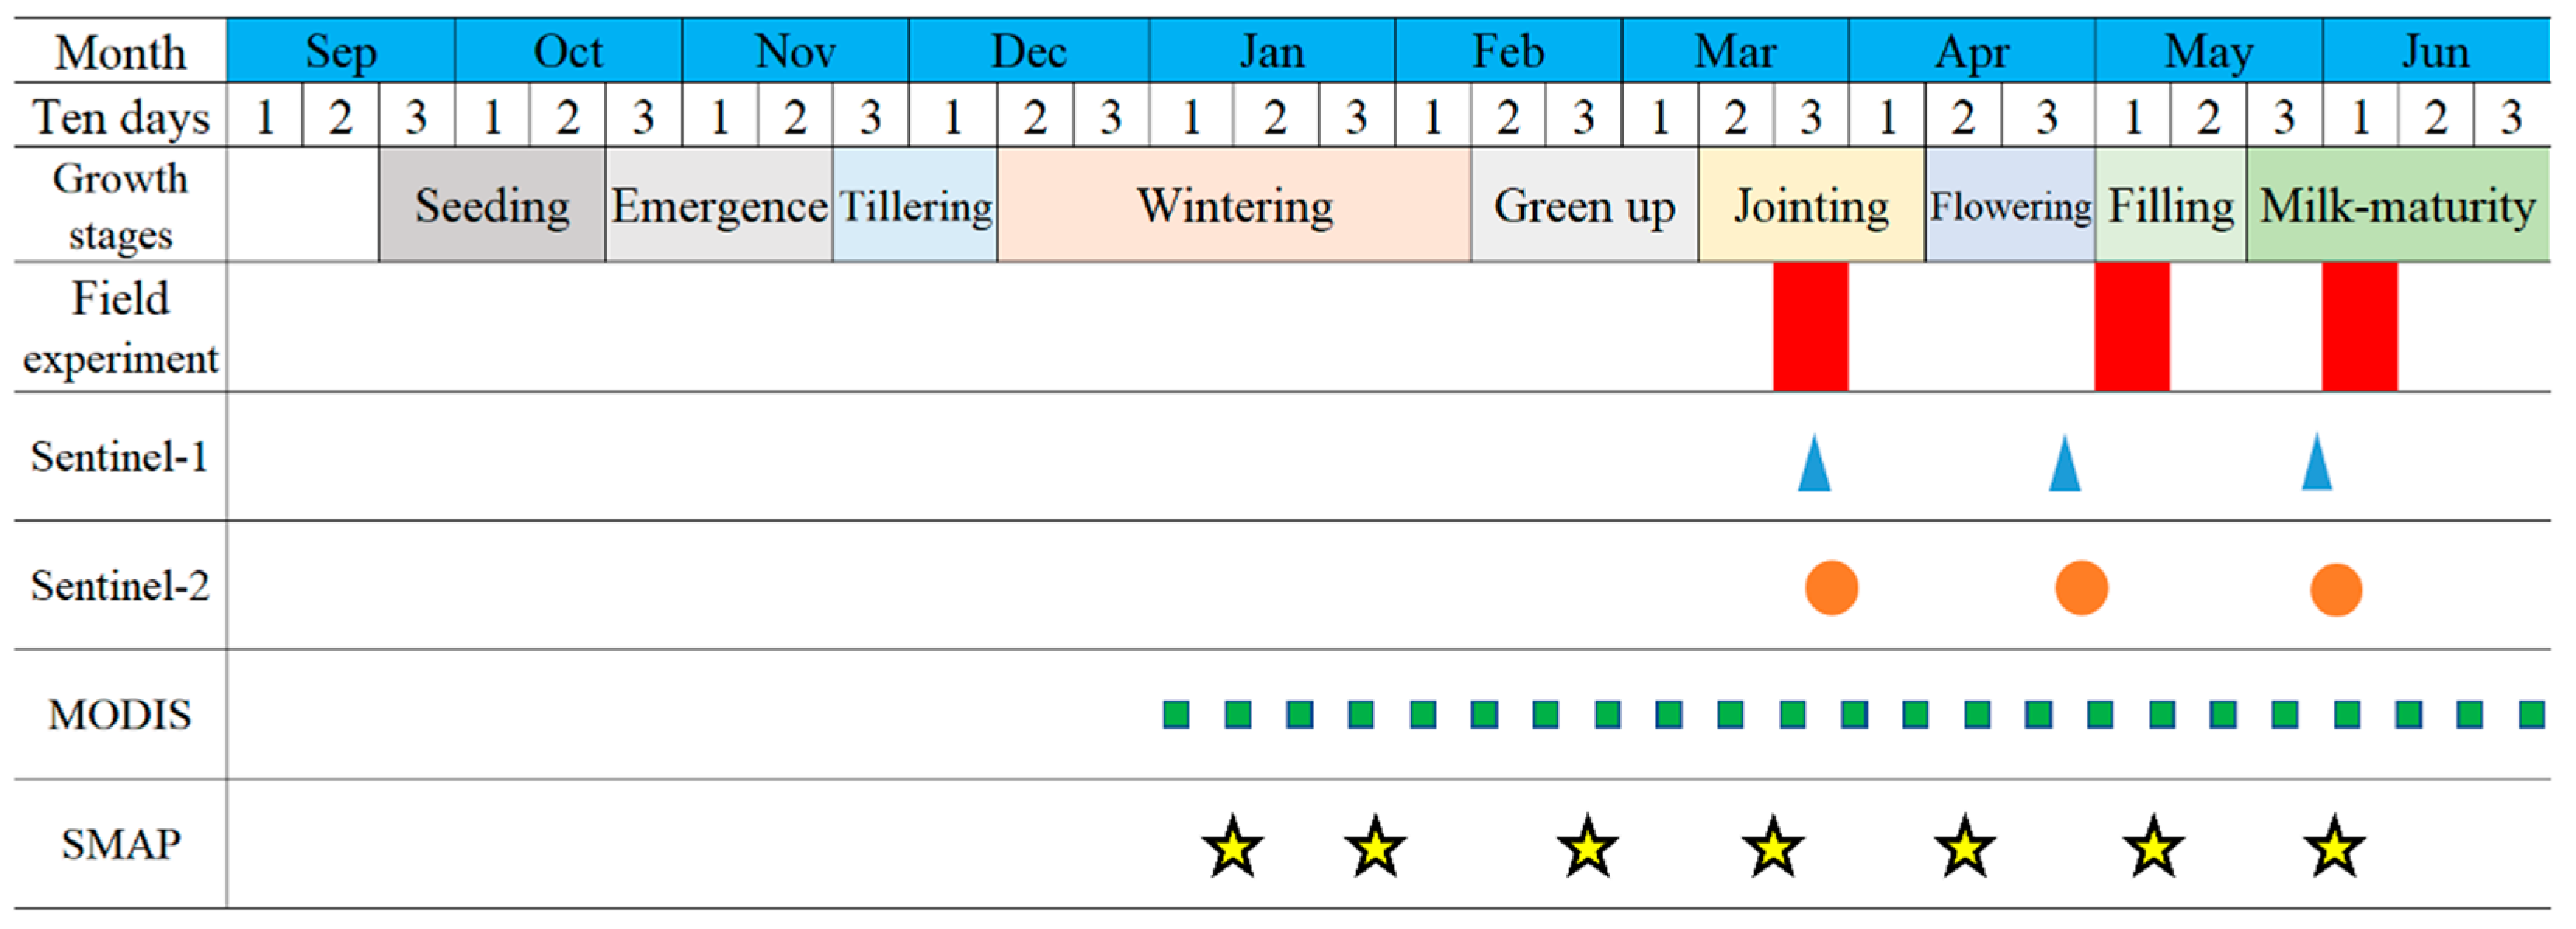
2.2.1. Field-Observed Data

The field observed data were collected at each county of Hengshui city. Two 100 m × 100 m winter wheat observation sites were selected in each county (blue flag in Figure 1), and five 1 m × 1 m sample plots were deployed diagonally with a distance longer than 50 m to each other. Therefore, we have 110 plots for yield validation at the 10 m grid size and 22 plots for the 500 m grid size as we averaged the yield data of 5 plots within each site. Winter wheat growth status, which includes canopy spectrum, LAI, plant height, planting density, SM, irrigation condition, AGB, and yield, was monitored within three main growth stages, which are the jointing stage (field observed date: 29 Marth–1 April), heading stage (field observed date: 4 May–7 May), and milk-maturity stage (field observed date: 31 May–3 June) in 2017 (Figure A1).

2.2.2. Remotely Sensed Data

Sentinel-1 and Sentinel-2 datasets (https://scihub.copernicus.eu accessed on 1 January 2017) were used for SM and LAI retrieval at a 10 m grid size. Sentinel-1 is composed of two polar-orbiting satellites (Sentinel-1A and Sentinel-1B), which carry a synthetic aperture radar (SAR) instrument at C-band. Dual-polarization imagery (VV and VH) with 10 m spatial resolution were used in this study [30], and we conducted S1 imagery preprocessing through the Sentinel Application Platform (SNAP) for the acquisition of the backscatter coefficient (σ0). Sentinel-2 MSI data contains 13 spectral channels. In this study, S2 preprocessing was also conducted using SNAP [31]. The retrieval of LAI and SM with a 10 m grid size is shown in the supplementary (Figures S3–S6).
SM and LAI at 500 m grid size were obtained from SMAP and MODIS products, respectively. The Soil Moisture Active Passive (SMAP) mission has an L-band radiometer and an L-band radar. Due to the malfunction of SMAP radar on 7 July 2015, the L2_SM_SP SM product (https://nsidc.org/data accessed on 1 January 2017) is actually based on the merger of the SMAP L-band radiometer and the Sentinel-1 A/B C-band radar. In this study, the L2_SM_SP SM product, at 1 km resolution from 1 January 2017 to 31 June 2017, was used, and they were further resampled to 500 m spatial resolution using the nearest neighbor interpolation method (Figure S1). The 8-day MOD15A2 version 6 LAI product (LAIMODIS) (http://eospso.gsfc.nasa.gov accessed on 1 January 2017) with 500 m spatial resolution from 1 January 2017 to 31 June 2017 was used in this study (Figure S2).

2.3. WOFOST Model and EnKF Method

Wageningen University and Research developed the WOFOST (WOrld FOod STudies) model [32], which could simulate crop growth by utilizing a set of parameters including soil, crop, meteorological, and agro-management. For detailed information on the WOFOST model could, refer to https://library.wur.nl/WebQuery/wurpubs/fulltext/522204 accessed on 1 January 2016. In this study, we adopted the water-limited mode within the WOFOST model for actual SM simulation. Specifically, the “WATFD” subroutines were employed for soil water balance, which did not take into account the influence of groundwater and assumed the soil to be free draining. The daily meteorological data were obtained from the China Meteorological Administration (http://www.nmic.cn/ accessed on 1 September 2016) for this study. Moreover, field measurement, published values, and the WOFOST default values were used for the calibration of the WOFOST. Our previous research provided a detailed method for WOFOST model calibration [5,13].
Model evaluation was conducted using determination coefficient (R2), root mean squared error (RMSE), and relative error (RE). RMSE, which is sensitive to the scale of the data, was used to evaluate the errors of each DA strategy. While RE is scale-invariant, which makes it a more appropriate metric when comparing the performance of models that operate on different scales. Specifically, the calculation is based on Equations (1)–(3).
R 2 = 1 i = 1 n ( Y i Y i ) 2 i = 1 n ( Y i Y ) 2
R M S E = 1 n i = 1 n ( Y i Y i ) 2
R E = Y i Y i Y i × 100 %
where Y i is observation, Y i is prediction, Y is the average of Y i , n is the number of samples.
The EnKF implementation in this study was based on Huang et al. [20] and Zhuo et al. [25]. A detailed description can be found in the supplementary file. We developed an inflation factor E to avoid “filter divergence” according to previous studies [20,33]:
E = μ ( k 160 ) ( R k P k f )
where μ denotes the random value (from 0 to 1), k denotes the day number (from 1 to 160), and P t = k f and R k are the error covariance of the forecast ensemble and observation ensemble, respectively.

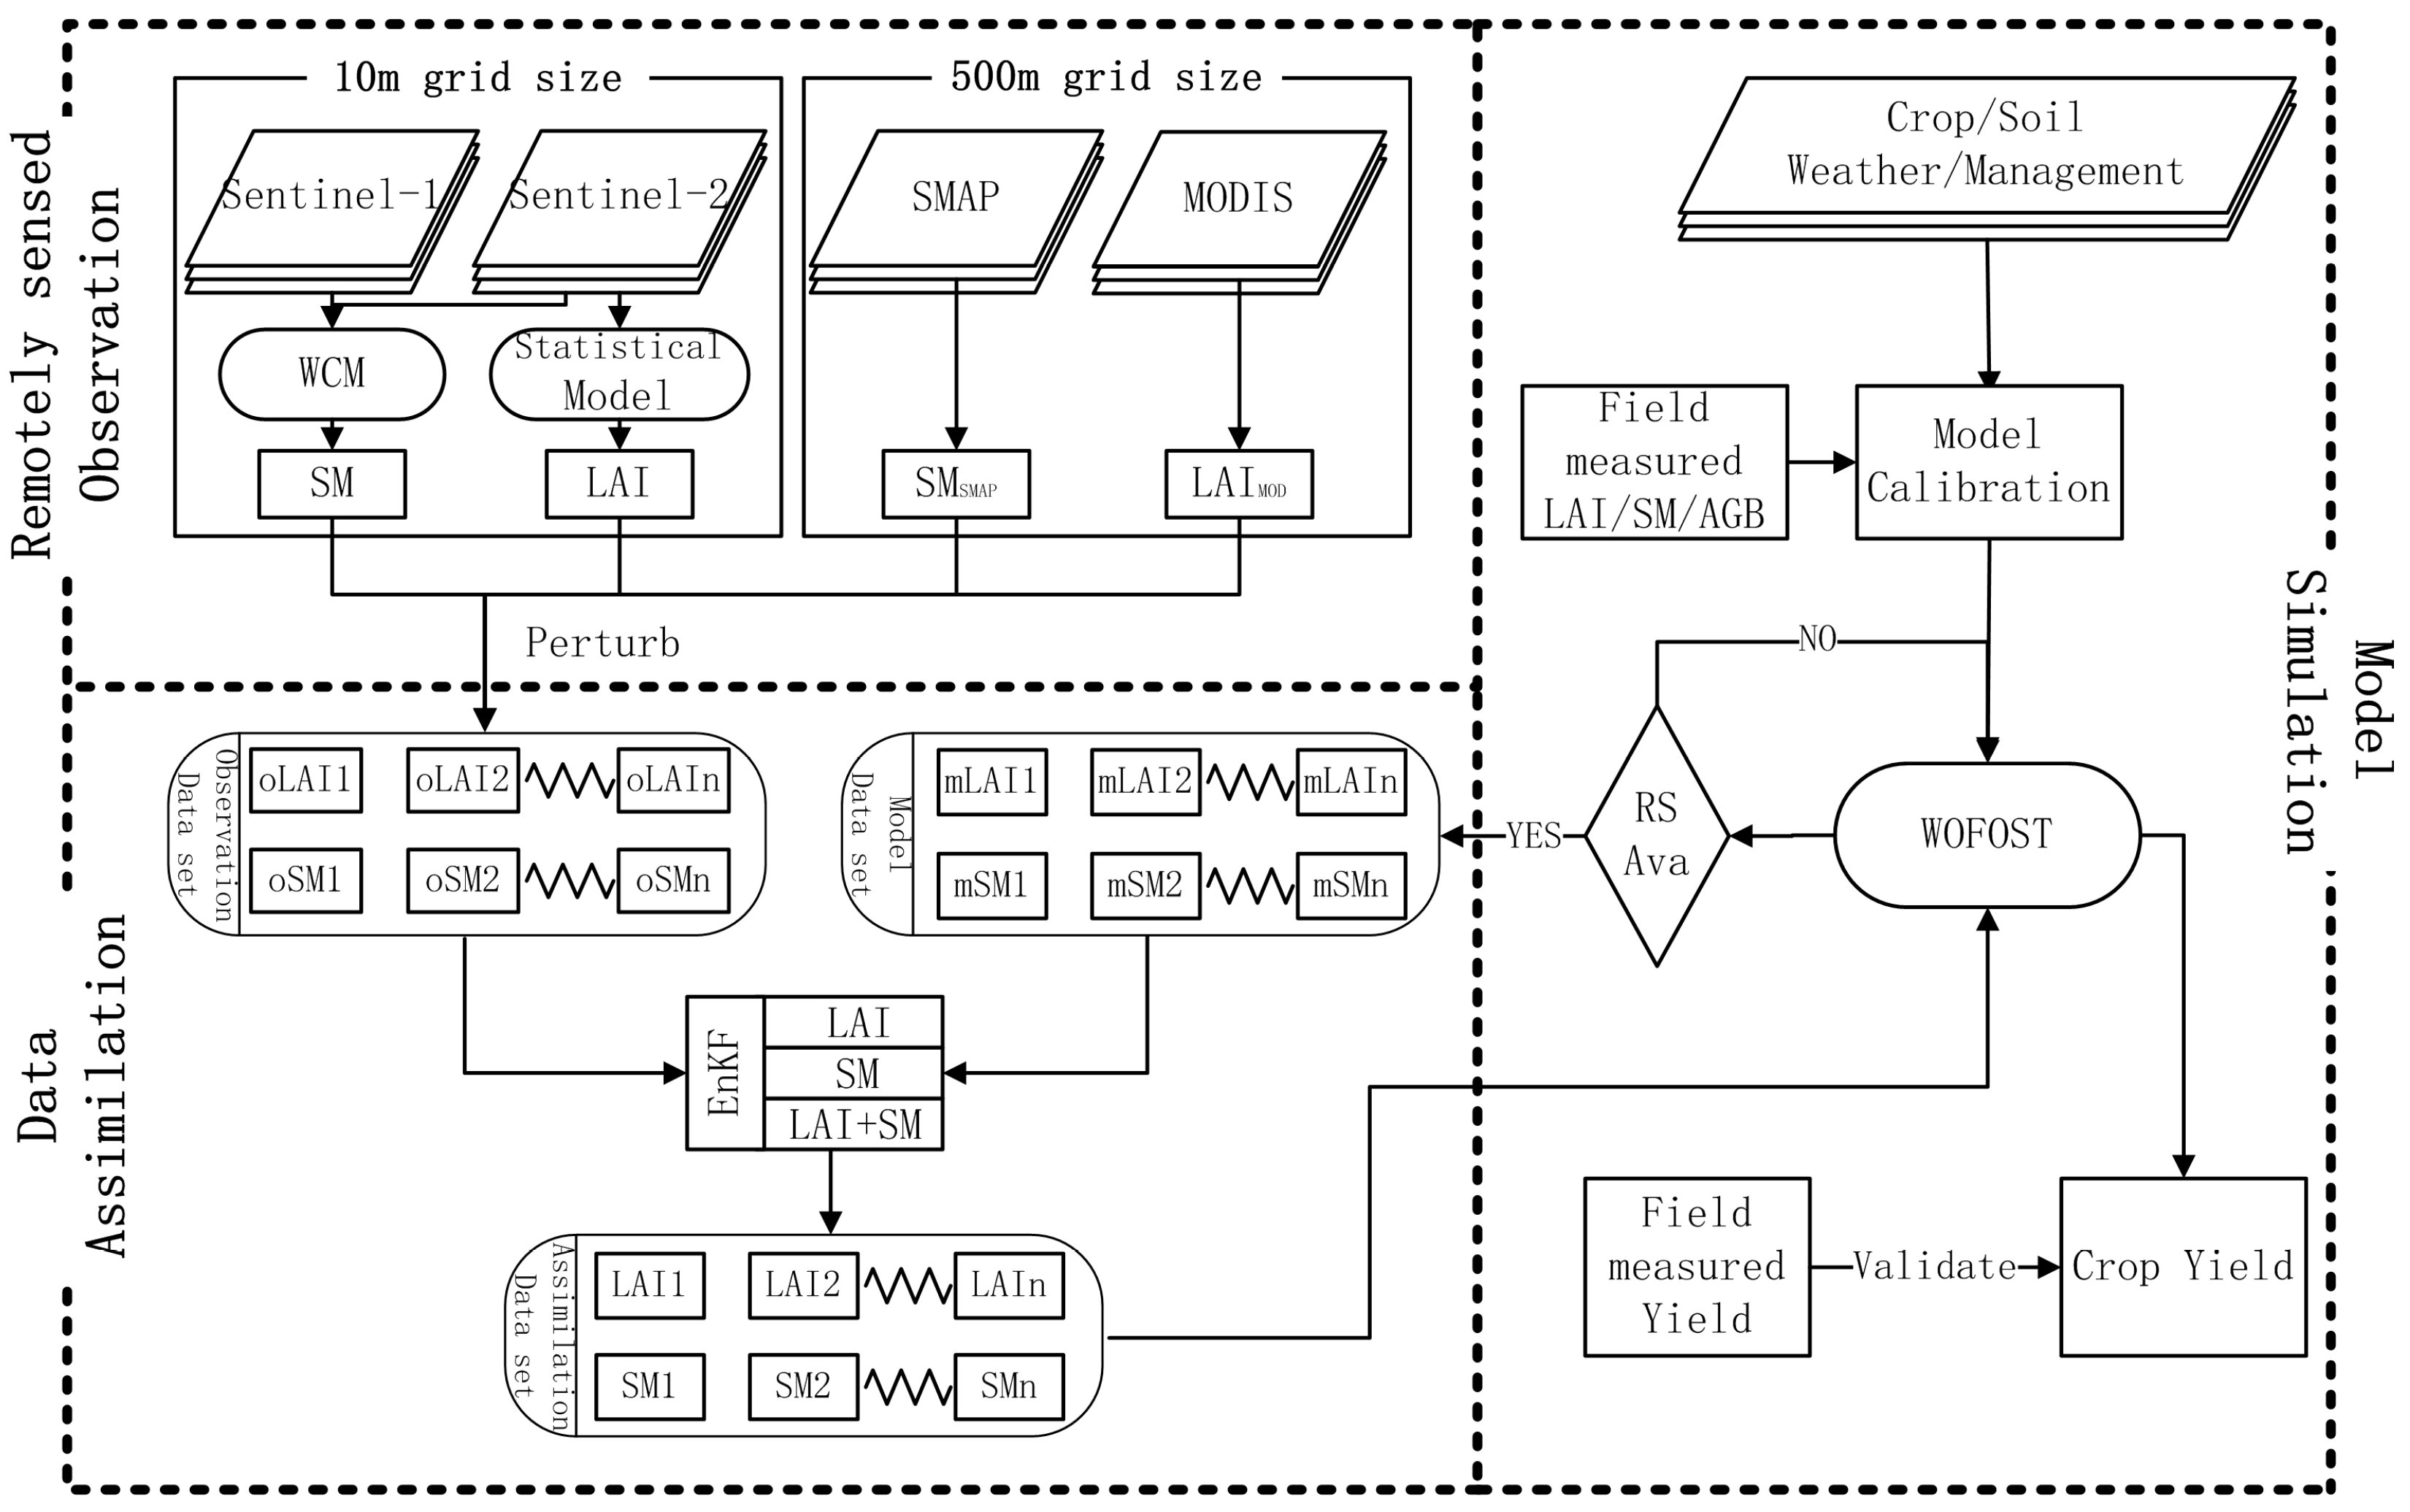
2.4. Data Assimilation Framework

As shown in Figure 2, a CDMA scheme was proposed to integrate LAI and SM into the WOFOST by the EnKF. The scheme generally consists of three parts: the remotely sensed observation, the model simulation, and the data assimilation. In the remotely sensed observation part, we used Sentinel-1 and Sentinel-2 for LAI and SM inversion at the 10 m grid size. LAIMOD and SMSMAP at 500 m grid size were obtained directly from the MODIS and SMAP products. The observation ensembles were created by applying perturbations to the remotely sensed LAI and SM, assuming that the error followed a Gaussian distribution. In the model simulation part, the WOFOST model was driven by input parameters. Then, LAI and SM ensembles would be generated by setting ensemble members (50 for this study) and perturbing initial conditions. The WOFOST model and remotely sensed variables (LAI and SM) errors were set to 10% based on previous studies. Different data assimilation strategies will be employed in anticipation of the availability of the observation data. This implies that once remotely sensed observations become available, they will be assimilated into the WOFOST model. EnKF (the data assimilation part) will update the state variables, and then the WOFOST model will keep running with the updated states (optimal LAI and SM) and simulate the final crop yield.

3. Results

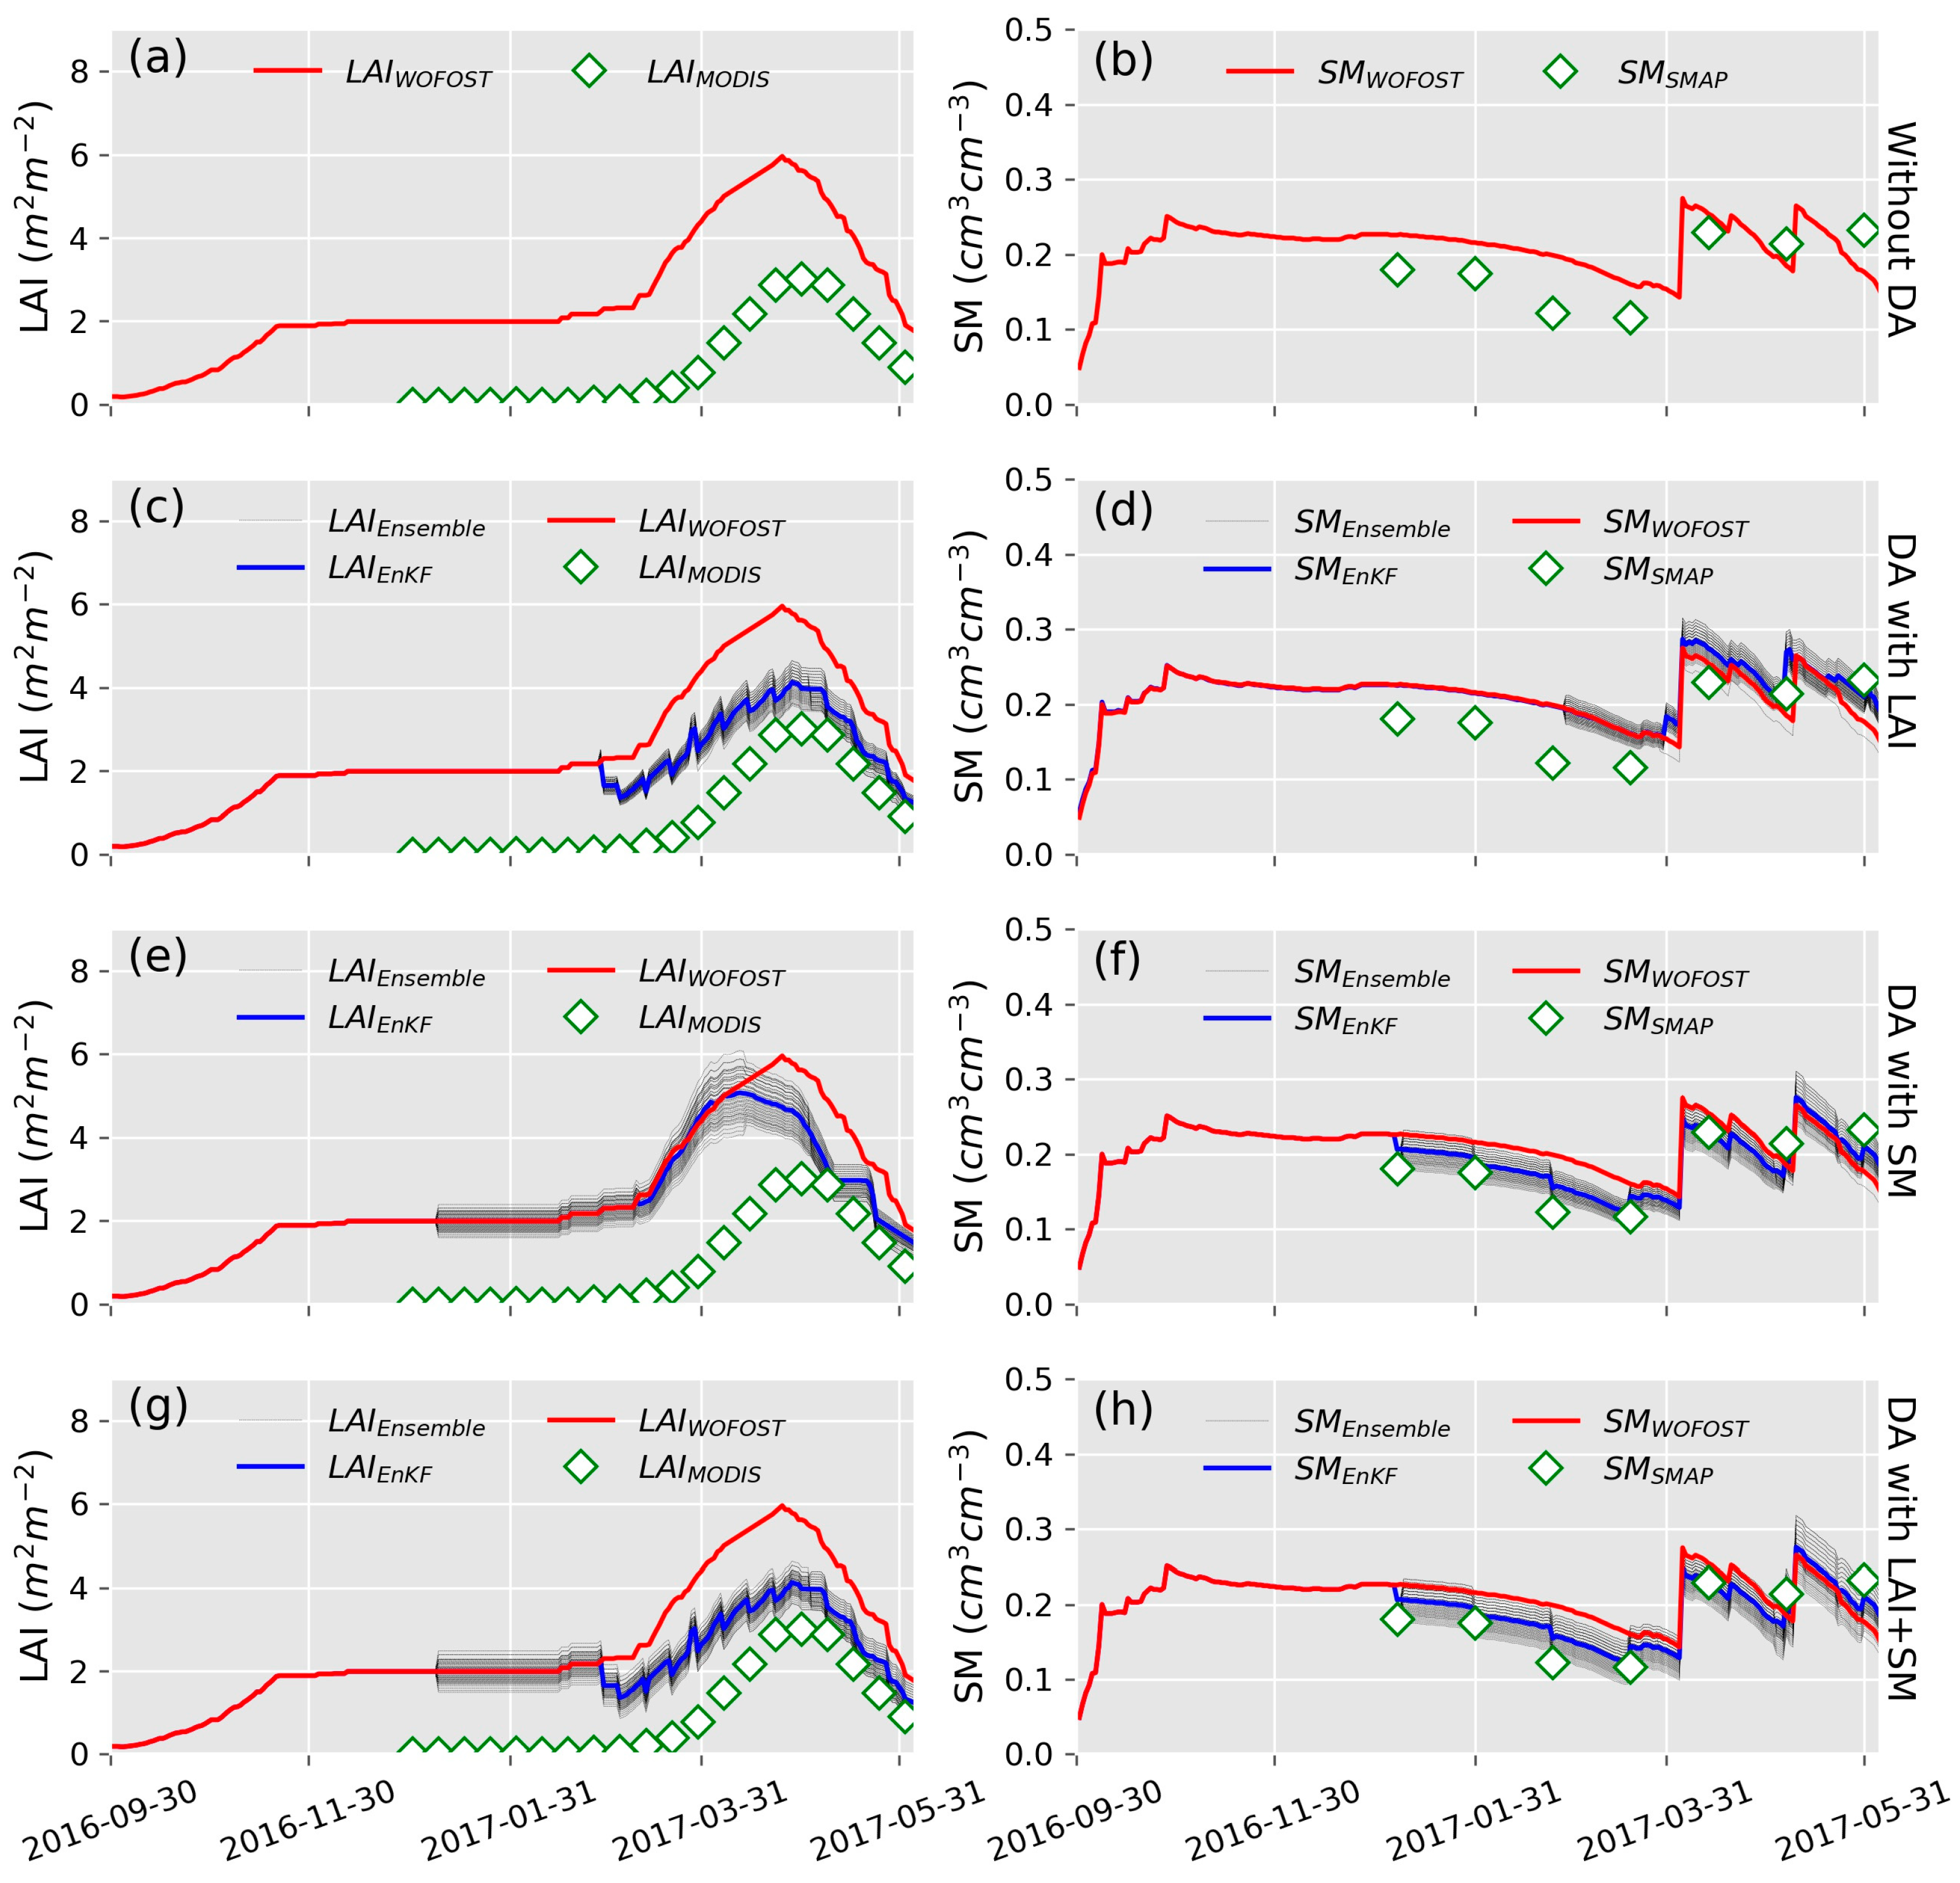
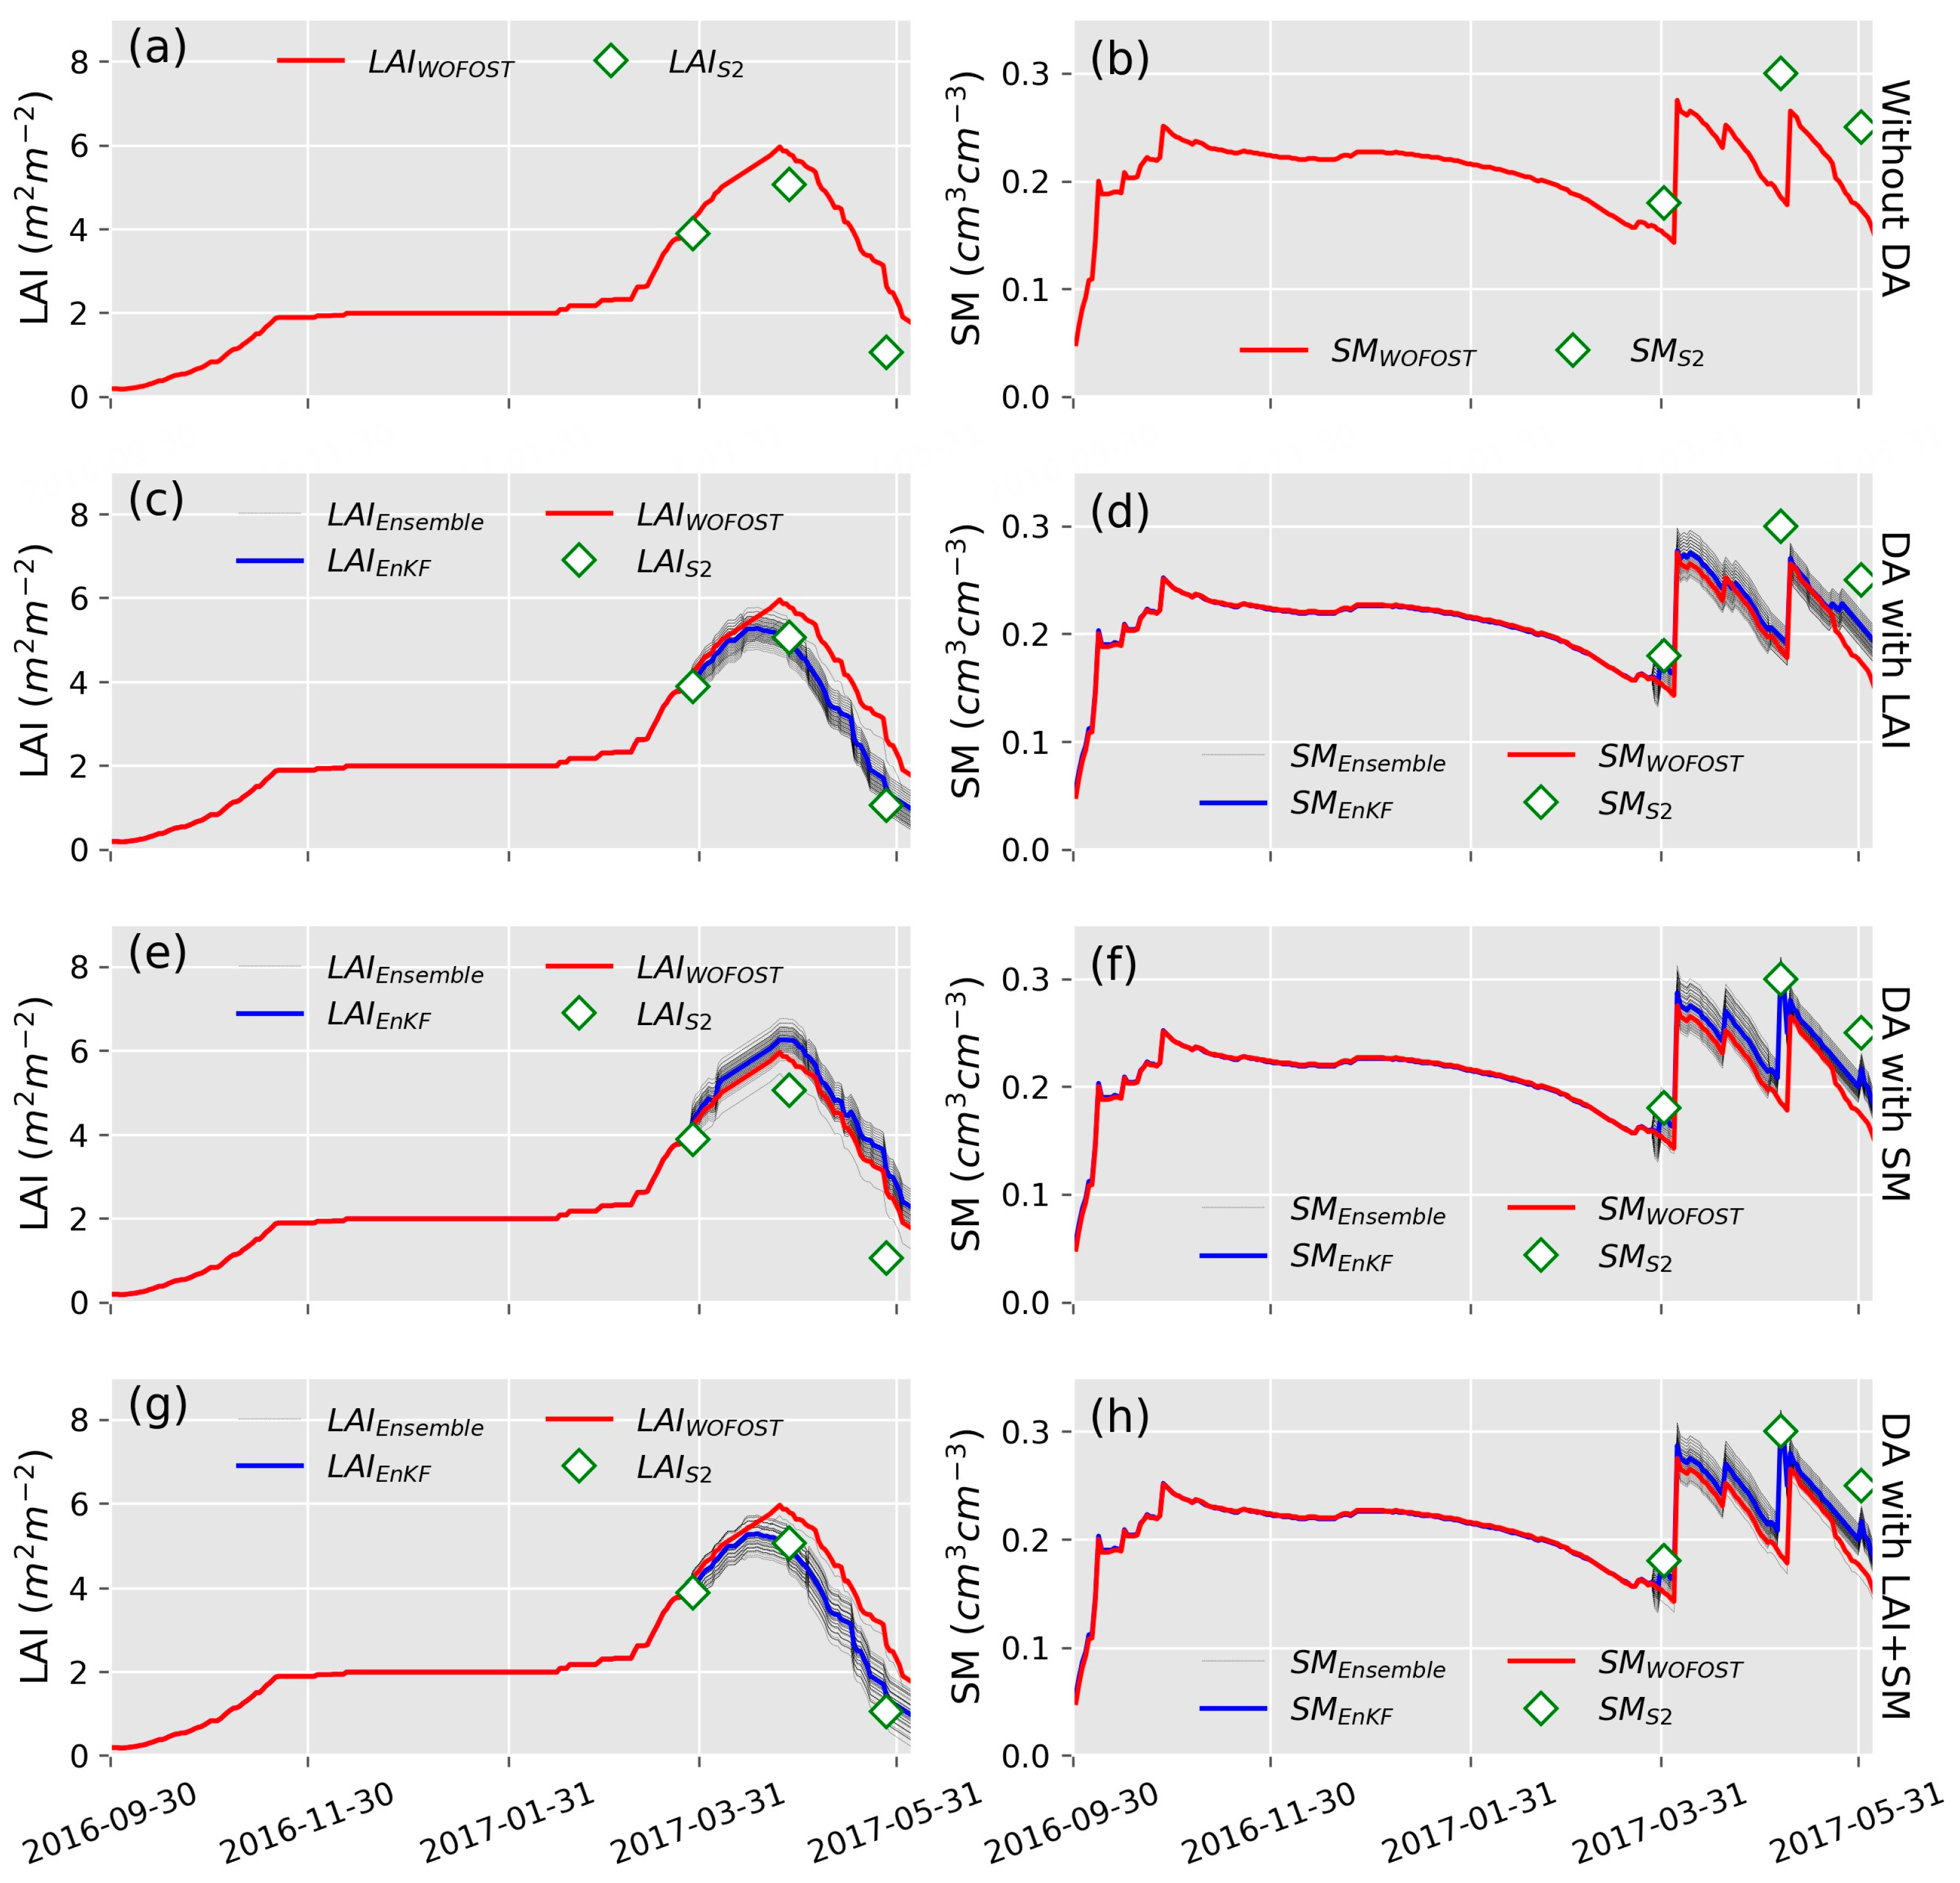
3.1. Assimilation of LAI and SM into WOFOST Model at 500 m Grid Size

500 m-scale LAI and SM were assimilated into the WOFOST for the LAI and SM time series simulation (Figure 3). DA with LAIMODIS or SMSMAP alone improved the WOFOST simulation of LAI or SM (Figure 3c,f) compared with open loop (OL) simulation (Figure 3a,b). Because of the high temporal resolution of RS observations at 500 m grid size, the zigzag shape of time series curves of various parameters is obvious (mainly the LAI time series curve). Moreover, the LAIEnKF are generally lower than LAIWOFOST (Figure 3c,g), which is caused by the low value of MODIS LAI products. Comparing Figure 3c–f, we found that the assimilation of LAI has a limited impact on the water balance (Figure 3d), while the assimilation of SM affects winter wheat canopy growth significantly (Figure 3e).
Figure 4 displays the winter wheat yield map at a 500 m grid size. The yield spatial difference is not apparent with OL (Figure 4a), and most of the simulated winter wheat yields are around 7000 kg/ha. This was primarily because only one set of crop, soil, and management parameters of Hengshui city was input into the WOFOST model, and meteorological parameters were the only driving data that caused the spatial difference in yield. While assimilating RS observations into the WOFOST significantly increased the yield spatial heterogeneity (Figure 3b–d). The yield estimation results were further validated by field-measured yield data (Figure 5). Low accuracy was obtained for WOFOST simulated yield without assimilation at 500 m grid size (R2 = 0.19, RMSE = 530 kg/ha, Figure 5a). The correlation was improved by assimilating RS observations into the WOFOST, and joint assimilation of LAI and SM had the highest correlation (R2 = 0.42, Figure 5d). However, the RMSE increased in varying degrees, and DA with LAI got the highest RMSE (RMSE = 829 kg/ha, Figure 5c) because the MODIS LAI was generally lower than the actual value.

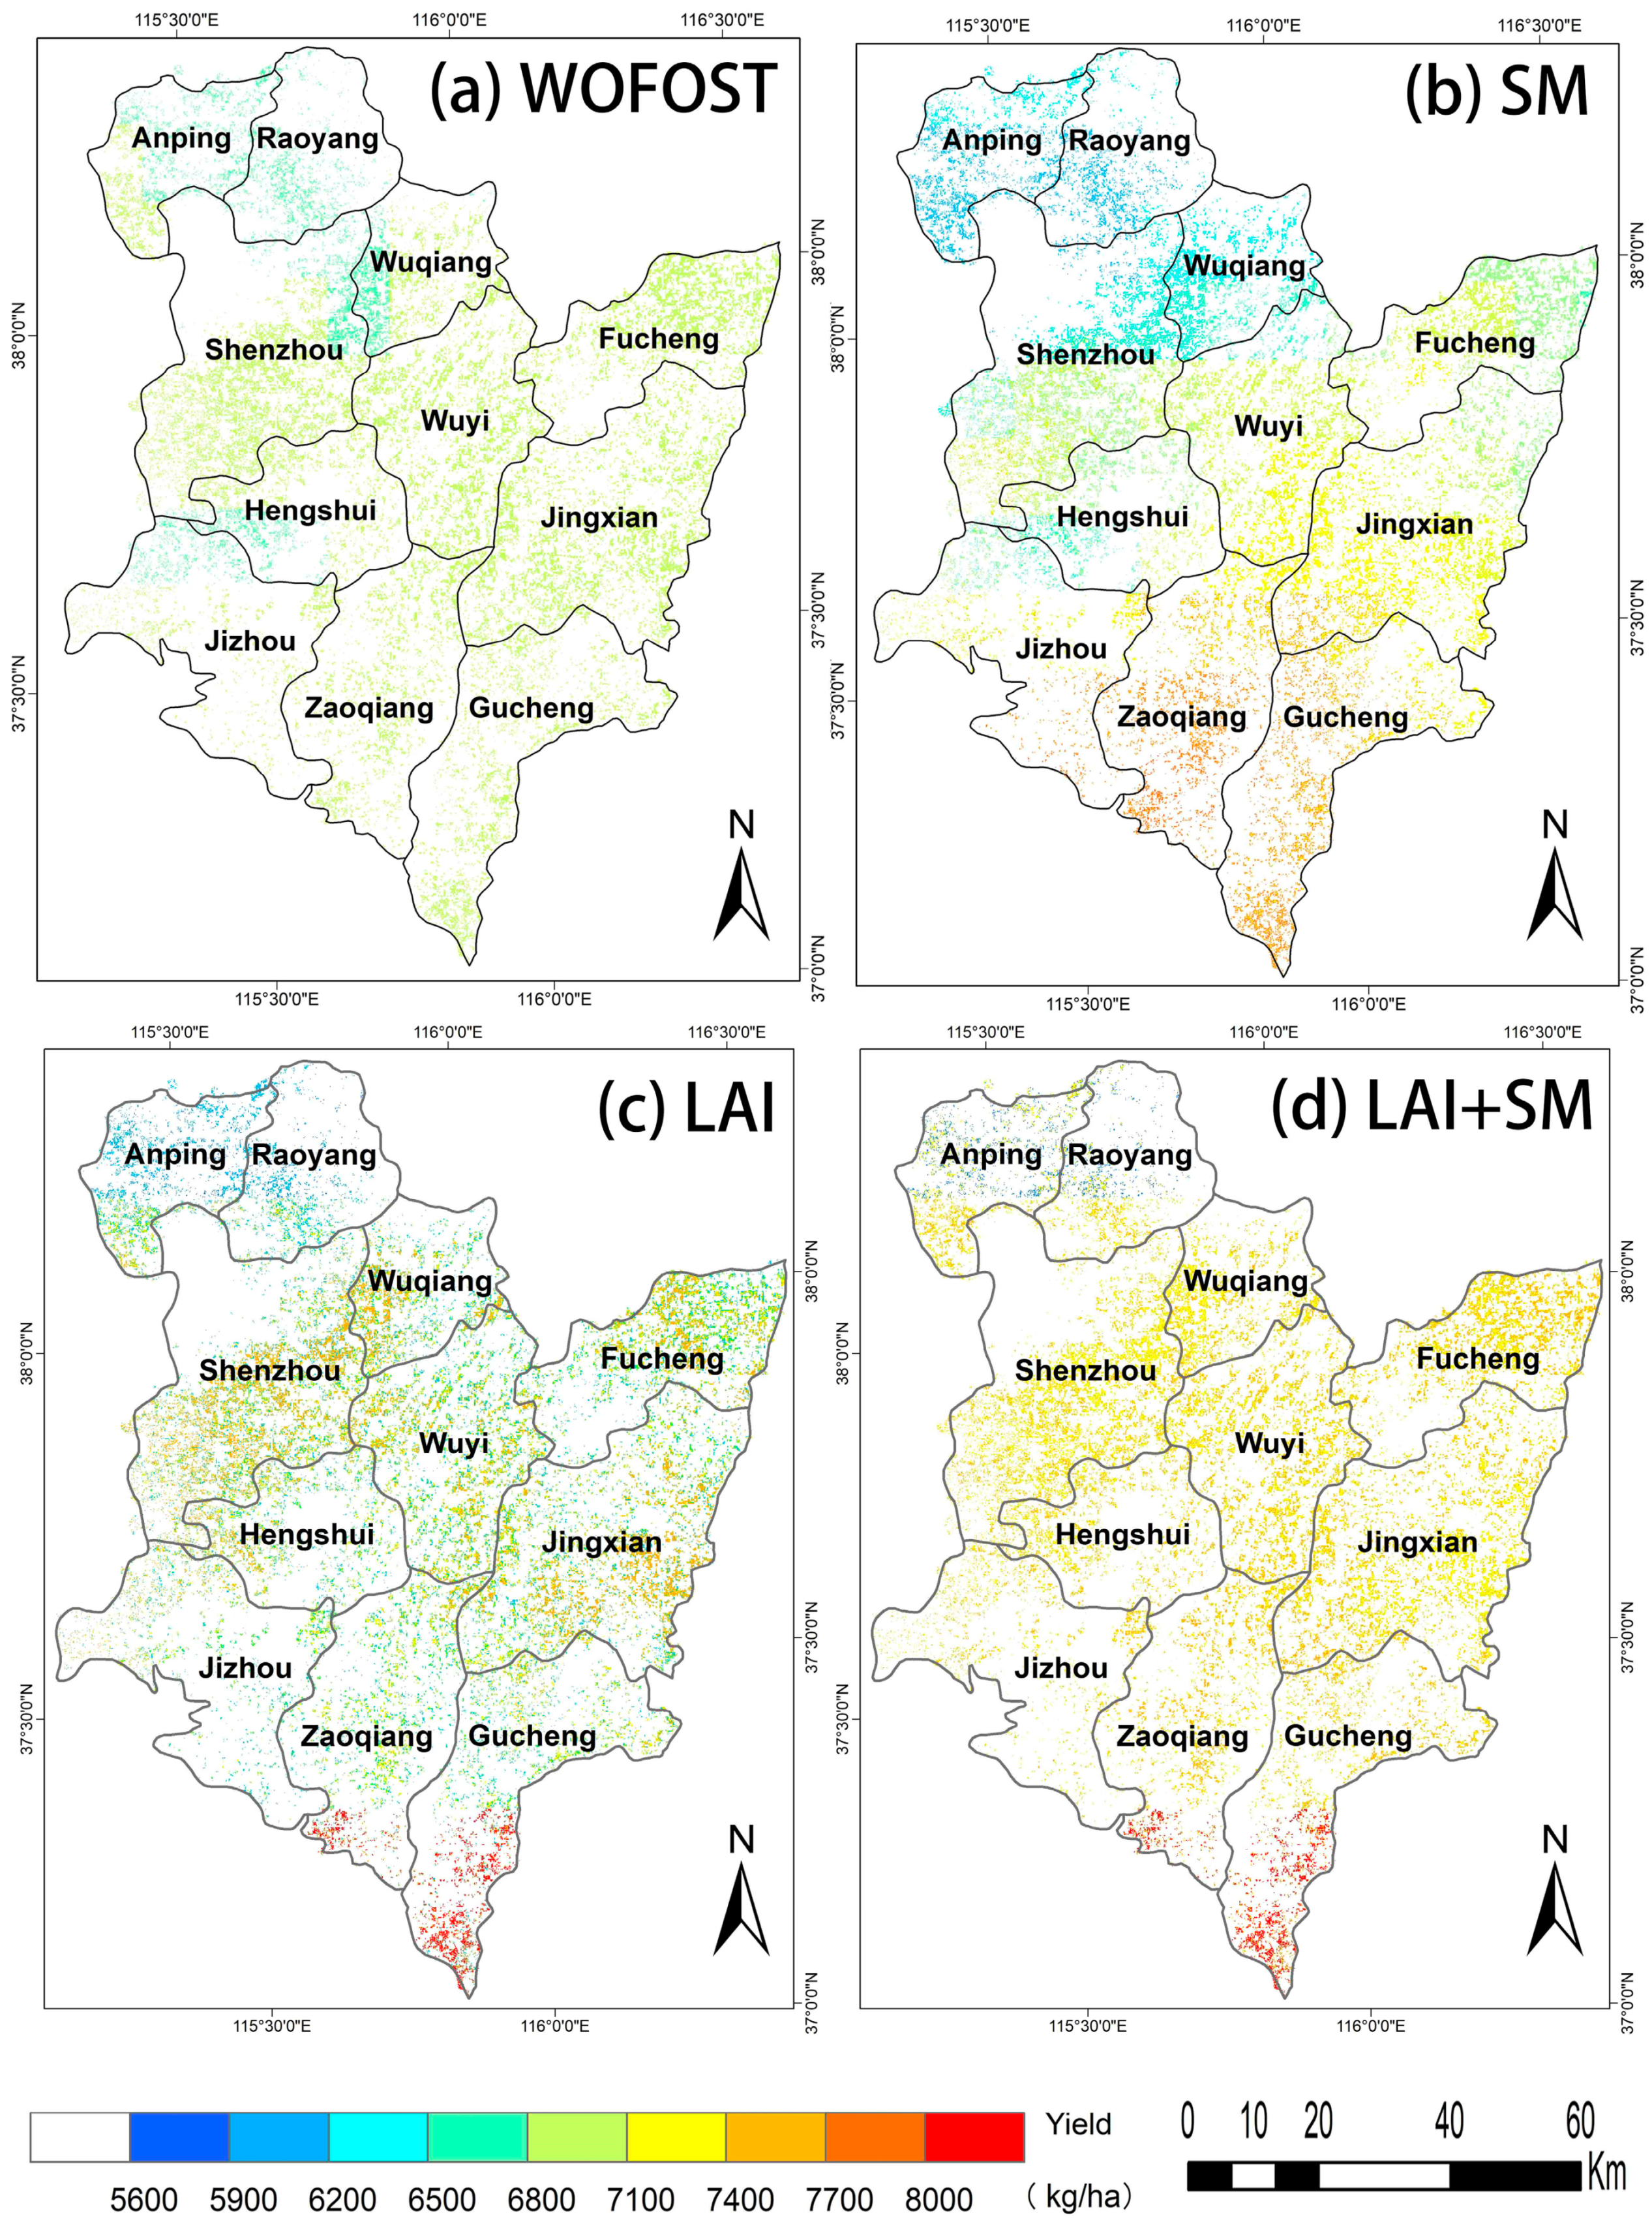
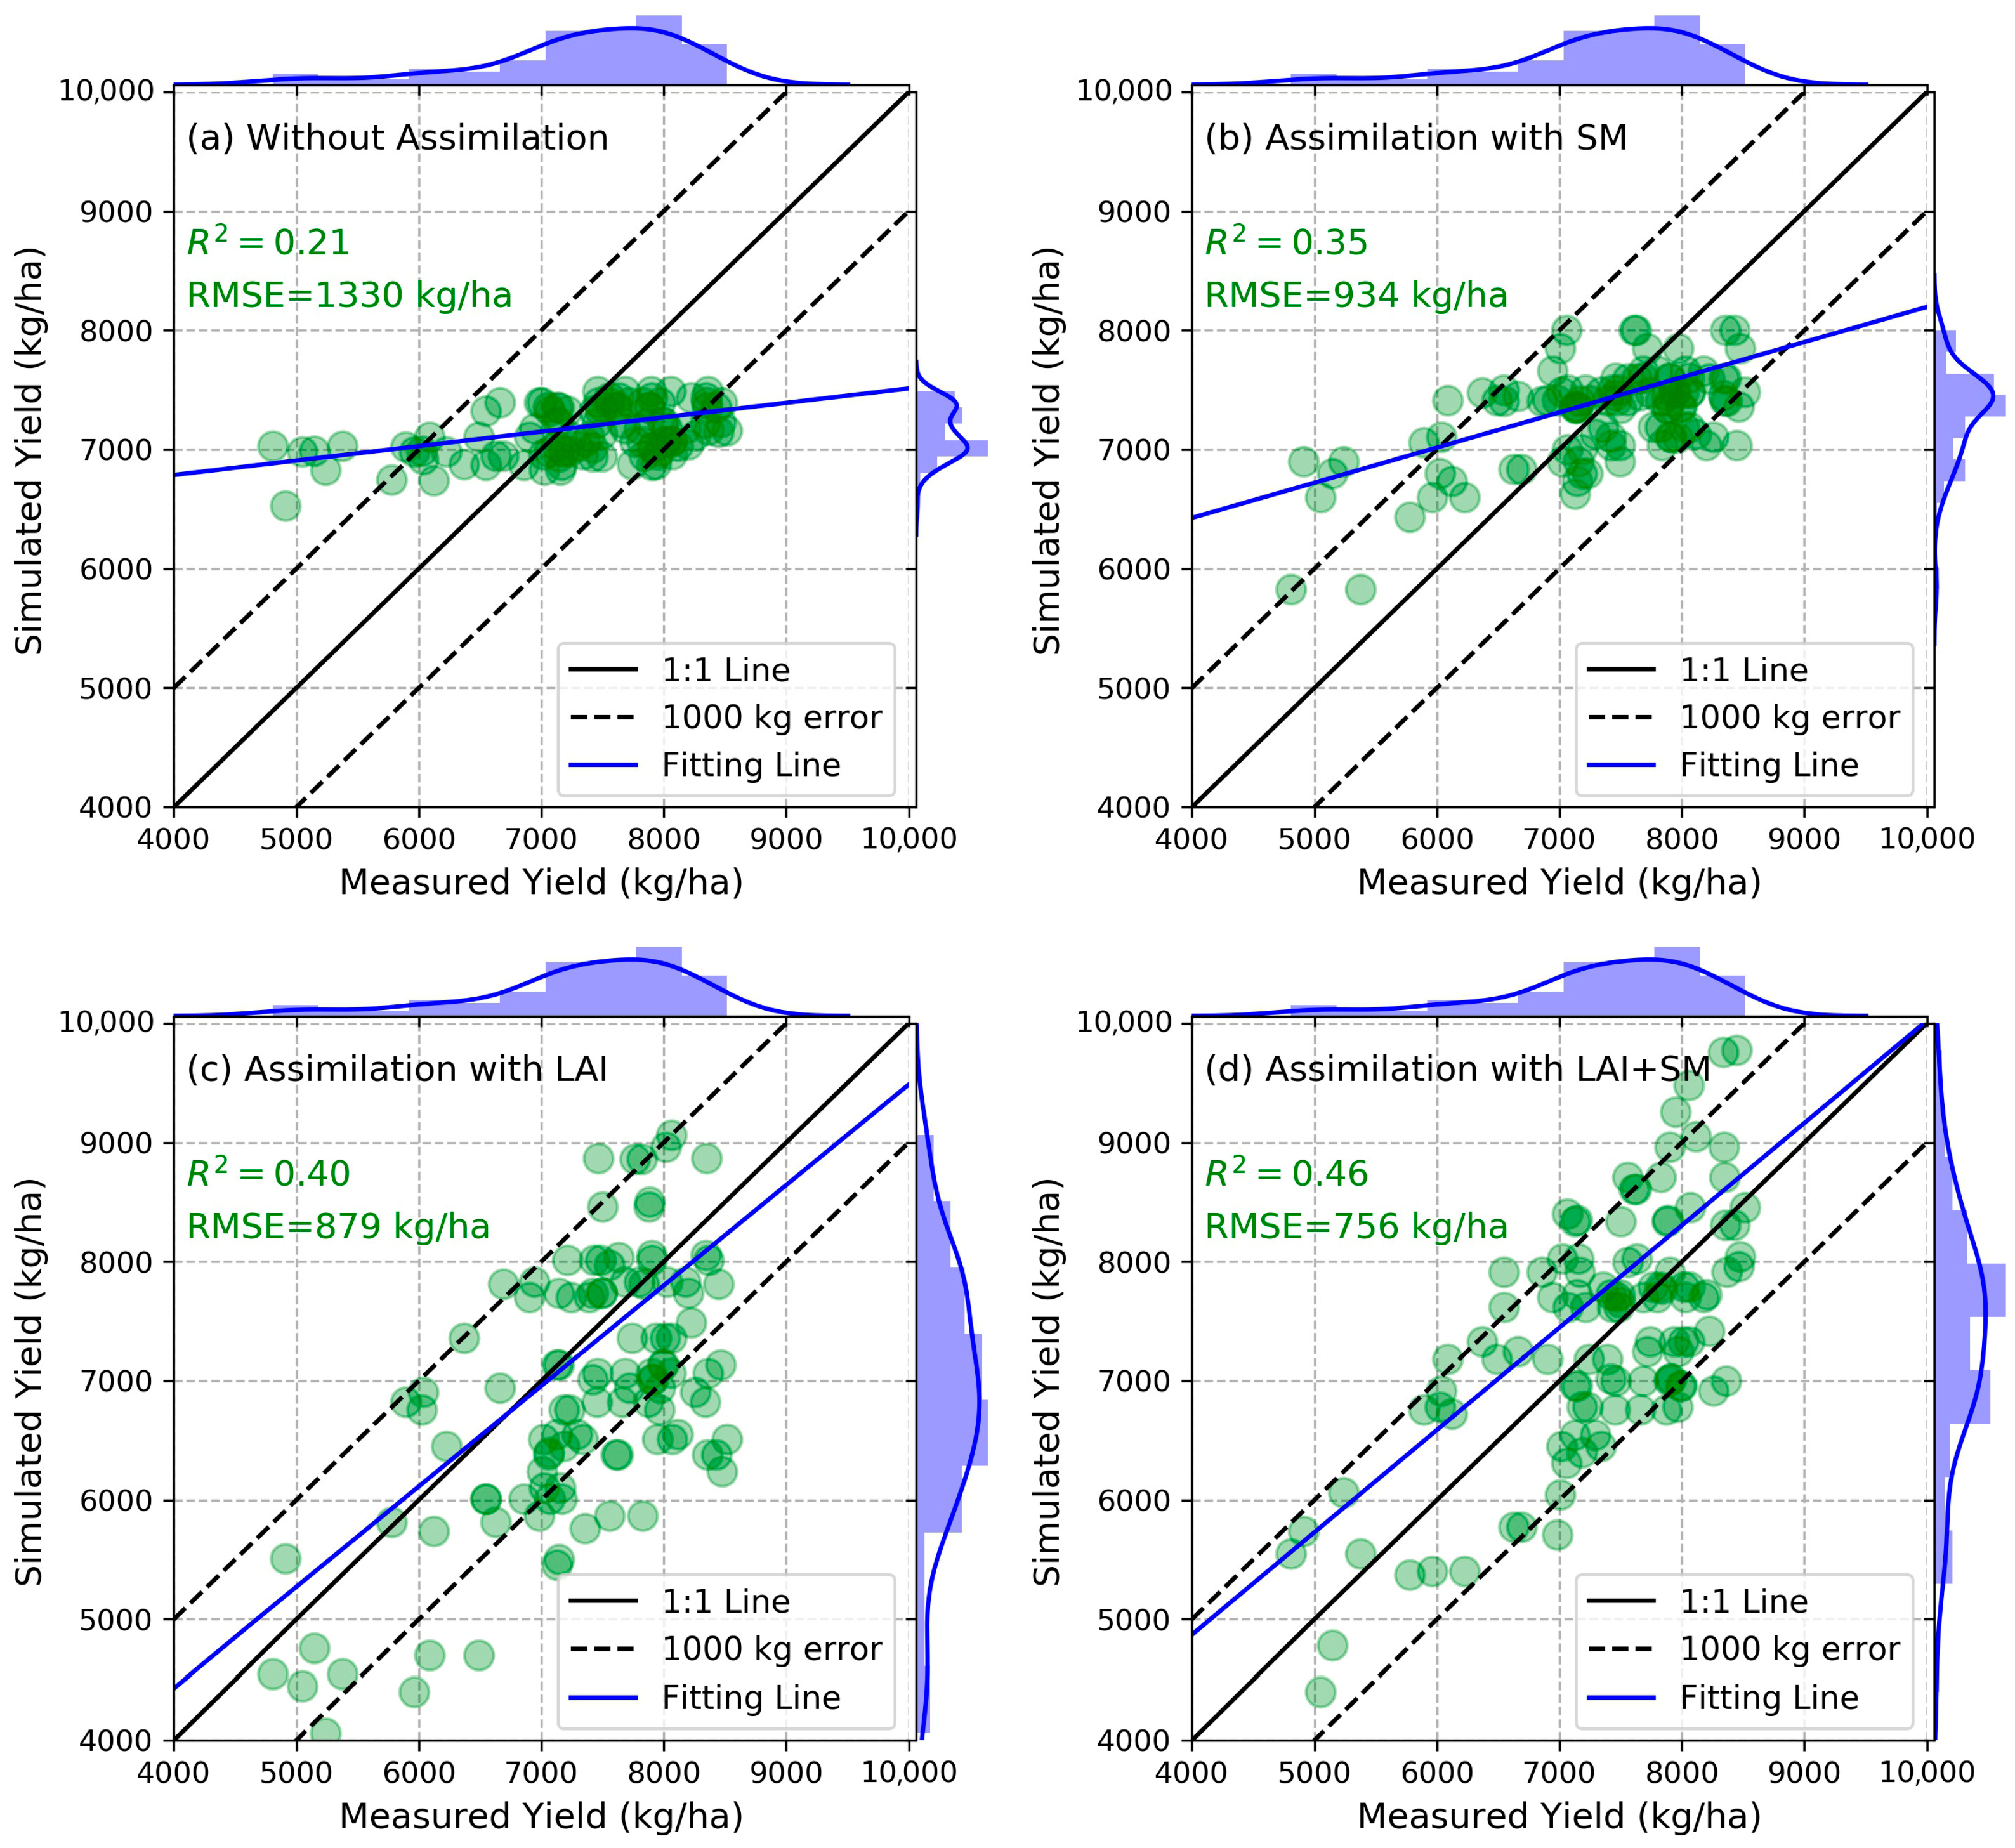
3.2. Assimilation of LAI and SM into WOFOST Model at 10 m Grid Size

Figure 6 presents the WOFOST simulation results of LAI and SM with and without data assimilation at a 10 m grid size. Similar to 500 m-scale results, DA with remotely sensed LAI or SM independently changed the time series curve of WOFOST simulated LAI or SM (Figure 6c,f). Moreover, LAIEnKF and SMEnKF generally agree with the observations. Compared with the results at a 500 m grid size, the value of LAIEnKF and SMEnKF are all in the normal range because the retrieved observations (LAI and SM) at a 10 m grid size were less affected by the scale effect.
The winter wheat yield map at a 10 m grid size is shown in Figure 7. The yield spatial difference with three DA strategies increased in different degrees compared with the OL result. The overall evaluation of yield estimates is plotted in Figure 8. Generally, yield results with different data assimilation strategies performed better than OL estimates. DA with LAIS2 got higher R2 (R2 = 0.40) and lower RMSE (RMSE = 879 kg/ha) than DA with SMS1/2. Moreover, joint DA with LAIS2 and SMS1/2 performed the best among these results (R2 = 0.46, RMSE = 756 kg/ha), and most simulated yields were within the 1000 kg/ha error.

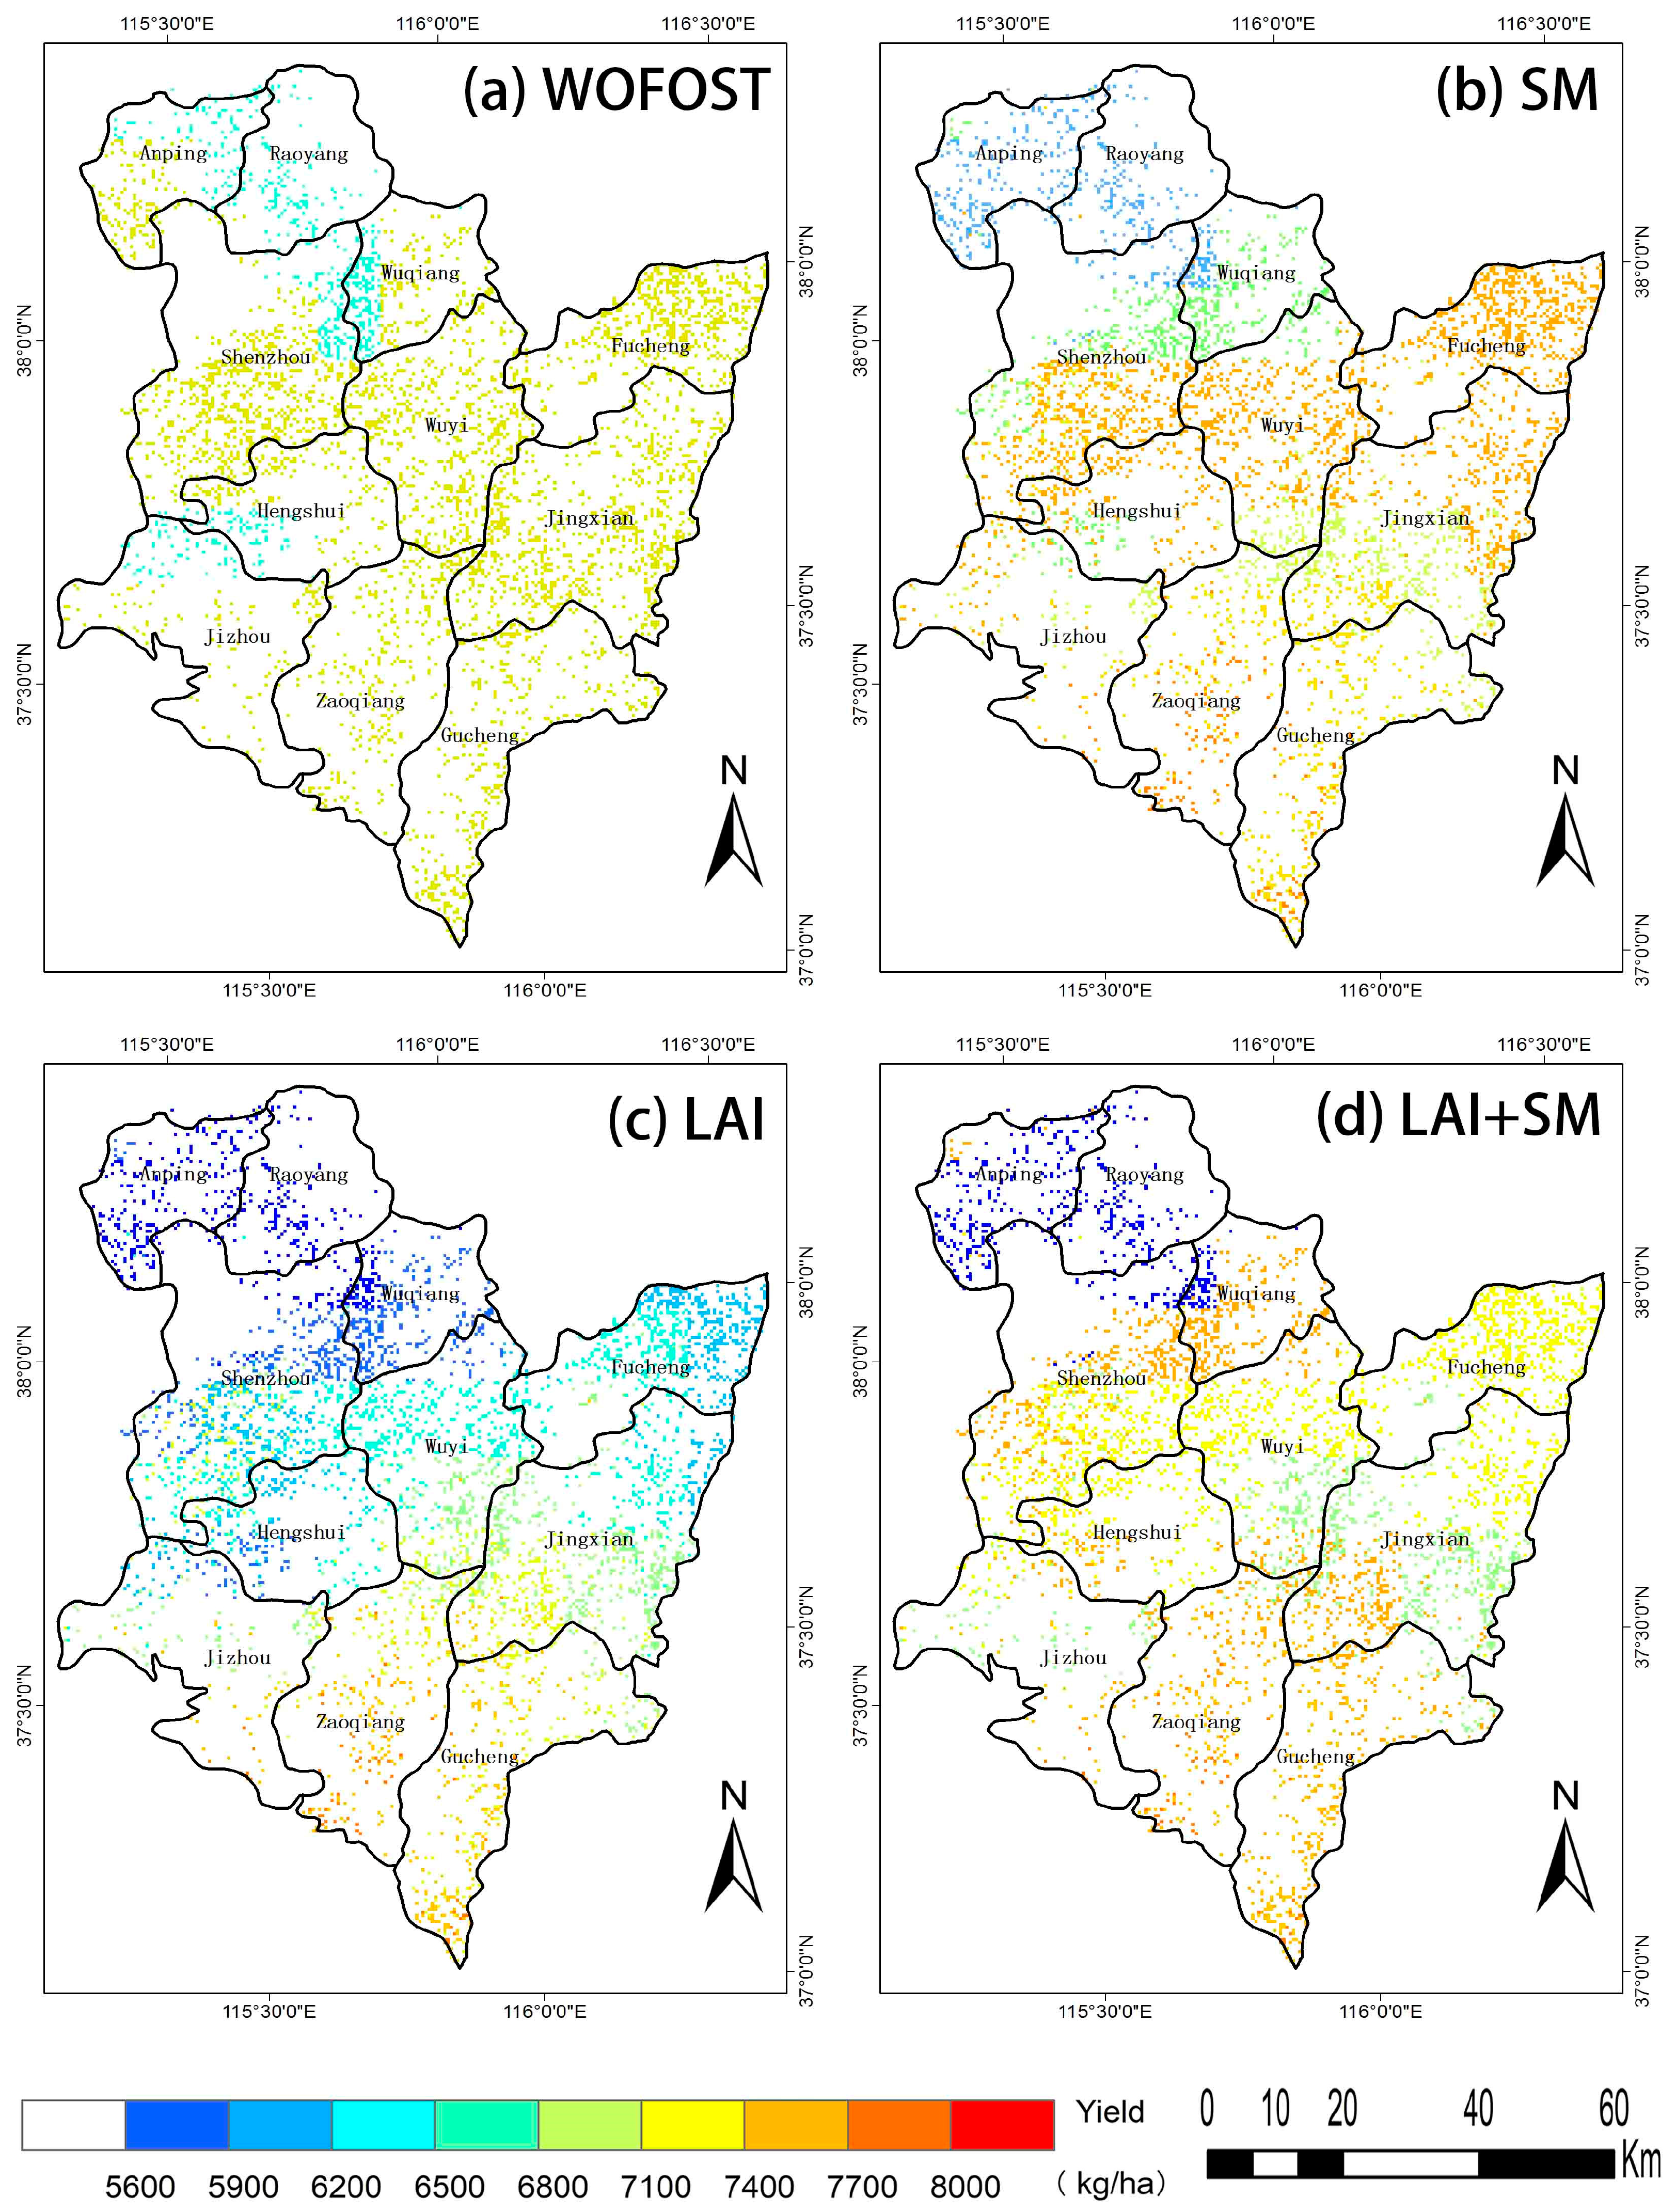
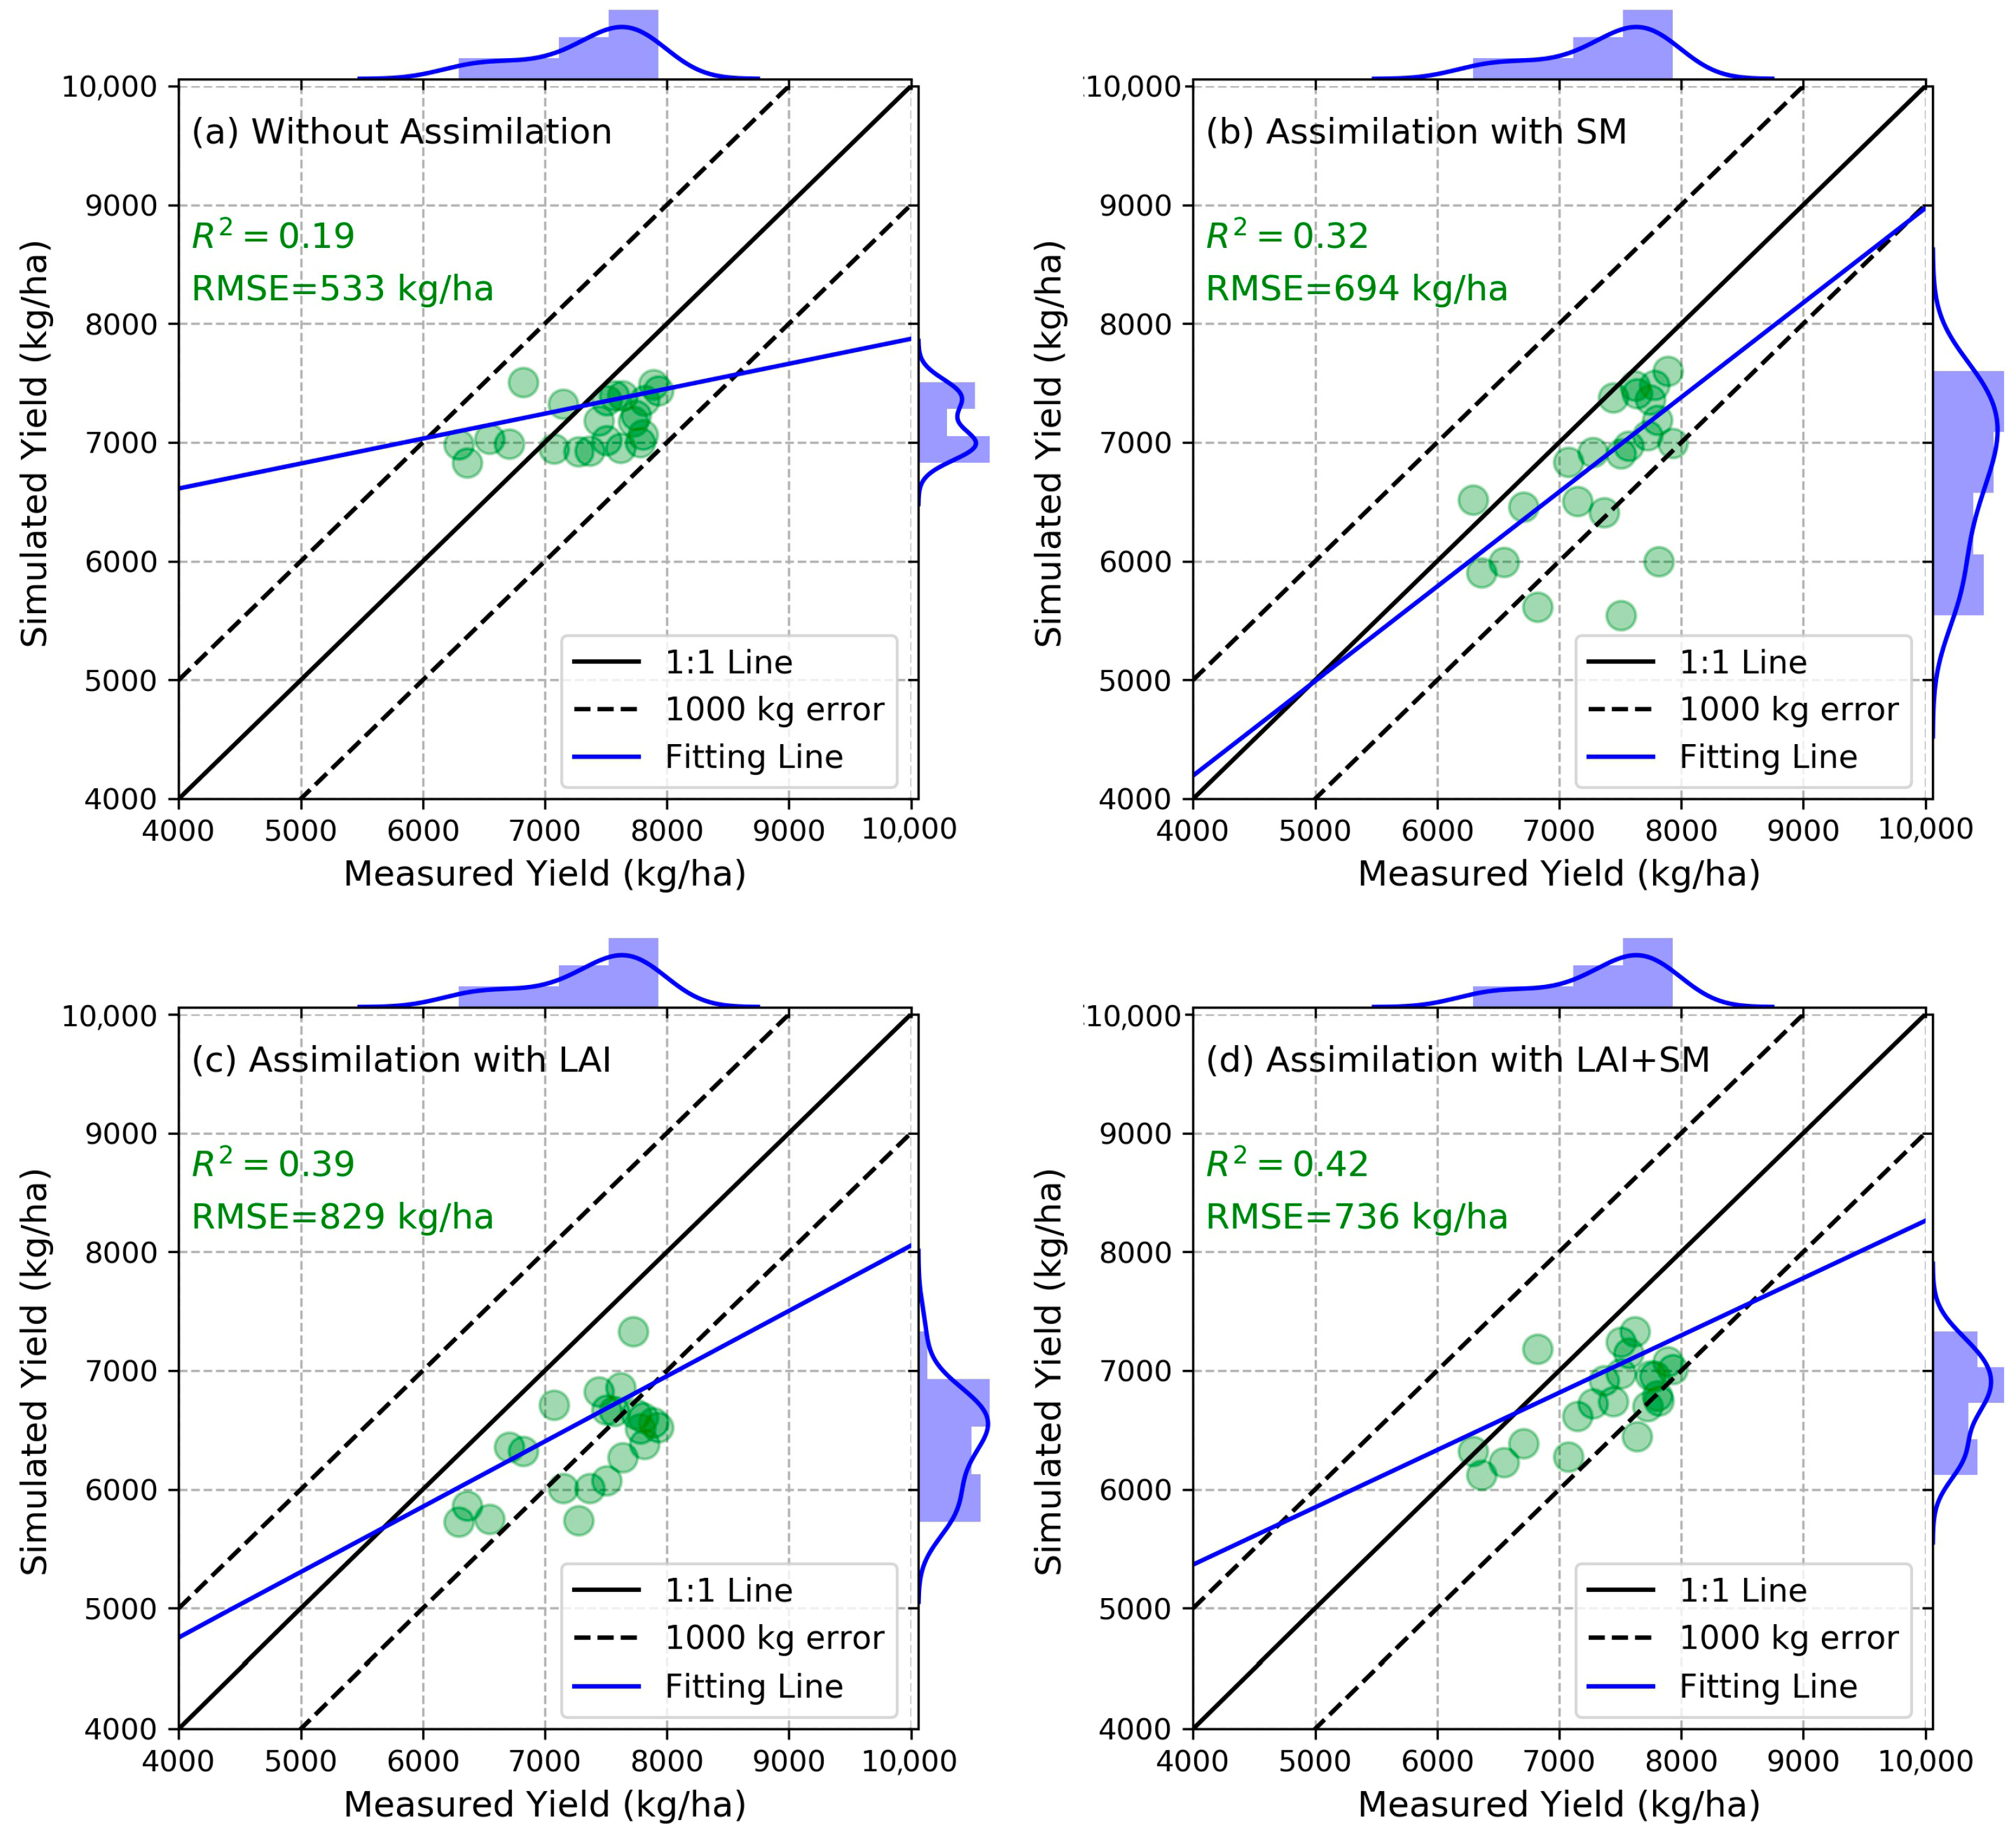
3.3. Comparative Analysis of Different Assimilation Strategies at Two Spatial Scales

Table 1 summarizes the winter wheat yield estimation accuracy of different assimilation strategies at 500 m grid size and 10 m grid size from Figure 5 and Figure 8. Assimilating remotely sensed observations into the WOFOST improved the R2 of yield validation both at the 500 m and the 10 m grid size compared with OL estimates. The RMSE is higher than OL estimates at a 500 m grid size, while it is lower at a 10 m grid size. This is mainly because of the scale effect of the 500 m grid size, which lowers the remotely sensed values more than the normal value of the variables. Moreover, DA with LAI can get a better correlation in yield estimation than DA with SM, and joint DA with LAI and SM hold the best results among the three assimilation strategies in both spatial scales. In general, assimilation of RS observations at a 10 m grid size, which has less scale effect, can obtain better yield estimation results than the 500 m grid size.
Winter wheat yield at the county level was counted by the “Zonal Statistic” toolbox in the software ArcGIS, and relative error (RE) was calculated using official census yield data and an average yield of each county. Figure 9 shows the RE results of three assimilation strategies for each county at both 500 m and 10 m grid sizes. At 500 m grid size, 7 out of 11 DA with LAI results obtained the highest RE, mainly because the value MODIS LAI is too low, and the highest MODIS LAI is around 3 m2/m2 during the whole winter wheat growing stage. In contrast, most of the DA with SM results got the highest RE (8 out of 11) at10 m grid size, which indicated that when the value of assimilation variables is in the normal range, DA with LAI can always obtain a higher yield estimation accuracy than DA with SM in Hengshui city where is an irrigated area. Generally, joint DA with LAI and SM can obtain a relatively lower RE at both spatial scales. Furthermore, 10 out of 11 joint DA with LAI and SM results have a higher accuracy (lower RE) at the 10 m grid size than 500 m.

4. Discussion

4.1. Potential for Estimating Crop Yield by Integrating Remotely Sensed LAI and SM with Crop Model

Results from this study demonstrated the improvement of winter wheat yield estimation accuracy through assimilating remotely sensed observations. Moreover, joint DA of LAI and SM can always obtain better yield estimation results than DA with LAI or SM independently, which agrees with previous research [7,34]. The assimilation results at 500 m grid size and 10 m grid size were compared further to investigate the scale effect on winter wheat yield estimation. We found that the results with a 10 m grid size were generally better than the 500 m grid size, which indicated that coarse spatial resolution of the remotely sensed observations would significantly reduce the space difference because of the mixed ground information. While the 10 m grid size, which can reflect the actual ground condition better, is more suitable for crop yield estimation with high precision. This conclusion aligns with the findings of many prior studies [5,9,18,35].
Both at 500 m and 10 m grid size, assimilating LAI may have a limited effect on the water balance. Meanwhile, the assimilation of SM impacts the LAI simulation, especially when the water condition is near the willing point (0.065 cm3/cm3 for Hengshui city in this study) (Figure 3f). This conclusion agrees with Pan’s research that SM obviously affects LAI simulation under the WOFOST water-limited mode [34]. Moreover, the assimilation of LAI alone obtained a higher yield estimation correlation than assimilating SM alone (Figure 5 and Figure 8), which is consistent with Ines, who claims that it is better to assimilate LAI under very wet conditions, and assimilation of SM may be useless [7]. In Hengshui city, winter wheat rarely suffers from water stress due to irrigation.

4.2. Potential Sources of Errors in the Assimilation of LAI and SM into the WOFOST Model

Although the proposed CDMA scheme yielded promising outcomes, the uncertainties originating from the crop model, chosen assimilation method, and remotely sensed data need further investigation. First of all, the calibration of the WOFOST only used the winter wheat variety of “HengS29”, which is not representative enough for the whole study area and may contribute to errors in estimating regional-scale winter wheat yield [36,37,38]. Moreover, A fixed irrigation period and water quantity were applied for the model, ignoring the spatial variability of the irrigation information. The irrigation date and amount should be determined regionally for a more precise yield estimation result. Moreover, the EnKF algorithm is the most commonly used method for sequence assimilation. Although the inflation factor could avoid the filter divergence to a certain extent, the size of the ensemble used in the data assimilation process can lead to a sampling error, which could affect the accuracy of posterior analysis covariance [39,40,41]. As for the remotely sensed observations, it has the problem of scale effect at 500 m grid size. It is hard to accurately describe the growth parameter characteristics of winter wheat due to mixed information within each pixel. Additionally, the number of available observations also plays a crucial role in the accuracy of assimilation results. However, due to factors such as the revisit frequency of sensors and the impact of clouds and rain, only a limited number of images at a 10 m grid size could be obtained during the winter wheat growing season.

4.3. Future Directions

The data assimilation results at finer spatial scales showed potential improvements for winter wheat yield estimation. It assists in choosing the appropriate RS sensors and state variables when estimating crop yield using the CDMA scheme. However, as the uncertainty expounded in Section 4.2, the high temporal resolution of the satellite is usually accompanied by coarse spatial resolution, and very few good-quality images with high spatial resolution could be obtained within the crop growing season due to the influence of clouds and rain. It is vital to comprehend trade-offs between temporal and spatial resolution in RS observations [18]. One promising solution to overcome this issue is to combine state variables derived from field scale images (e.g., sentinel-1/2) with phenological characteristics retrieved from the satellite with high temporal resolution (i.e., MODIS, SMAP), then creating a time series state variable with a higher spatial and temporal resolution during whole crop growth stages [20].
Moreover, quantitatively evaluating errors within both the observations and process-based models in data assimilation schemes is vital as they can assess the reliability of model state analysis and observations during the assimilation process [42,43]. In this study, we only set the constant errors for the WOFOST model and remotely sensed LAI and SM at different growing seasons, which may significantly impact the assimilation results. However, it is always challenging to evaluate these errors quantitatively. A recent study provided a promising approach to estimating model and observation errors physically and statistically by a dual-cycle assimilation algorithm, which could optimize the model and observation errors to conduct a better assimilation result [44]. Moreover, the Markov-chain Monte Carlo (MCMC) approach, which could quantitatively estimate the model error by sampling from the posterior probability density function of the model variables, is also an excellent choice for model error estimation [9,45,46].

5. Conclusions

This study obtained 10 m- and 500 m-scale LAI and SM images based on sentinel-1, sentinel-2, MODIS, and SMAP RS data. EnKF was used in the CDMA scheme for assimilating LAI and SM into the WOFOST at two spatial scales to enhance the winter wheat yield estimation accuracy. Results showed that yield estimation accuracy at the 10 m grid size is generally better than the 500 m grid size under the same assimilation strategy. Meanwhile, jointly assimilating LAI and SM obtained the best results for the winter wheat yield estimation compared with LAI or SM alone. This successful case study demonstrates the superiority of combining LAI and SM in improving crop yield estimation accuracy and highlights the impact of scale effect on crop yield estimation using the CDMA scheme at the regional scale. It also provides valuable information for future CDMA research by selecting appropriate remotely sensed observations and state variables.

Supplementary Materials

The following supporting information can be downloaded at: https://www.mdpi.com/article/10.3390/rs15071825/s1, implementation of the Ensemble Kalman Filter and Figures S1–S6. Figure S1: SMSMAP images of Hengshui city in 2017 during winter wheat growing season. Figure S2: LAIMODIS images of Hengshui city in 2017 during winter wheat growing season. Figure S3: (a) Modeling of measured LAI and NDVI (b) Validation of retrieved LAI results. Figure S4: LAIS2 images of Hengshui city in 2017 during winter wheat growing season. Figure S5: Maps of SM in the study area retrieved from the water cloud model (a) 1 April, (b) 7 May and (c) 1 Jun [13]. Figure S6: Validation of the retrieved SM from the water cloud model [13,47].

Author Contributions

Conceptualization, J.H. and W.Z.; software, W.Z. and H.H.; validation, W.Z., X.G., and H.H.; writing—original draft preparation, W.Z.; writing—review and editing, J.H. and X.L.; visualization, W.Z. and X.G.; funding acquisition, J.H. All authors have read and agreed to the published version of the manuscript.

Funding

This research was funded by the Scientific Research Fund for Drought Meteorology (Project No. IAM202107), National Natural Science Foundation of China (Project No. 41971383).

Data Availability Statement

No new datasets were created in this study.

Acknowledgments

We thank the scholarship under the International Postdoctoral Exchange Fellowship Program by the Office of China Postdoctoral Council (PC2022064). We thank the journal’s editors and three anonymous reviewers for their kind comments and valuable suggestions to improve the quality of this manuscript.

Conflicts of Interest

The authors declare no conflict of interest.

Abbreviations

The following abbreviations are used in this manuscript:
AGBAbove Ground Biomass
CCCanopy Cover
CDMACrop Data-Model Assimilation
CGMCrop Growth Model
DAData Assimilation
DSSATDecision Support System for Agrotechnology Transfer
EnKFEnsemble Kalman Filter
LAILeaf Area Index
MCMCMarkov-Chain Monte Carlo
MODISMODerate resolution Imaging Spectrometer
OLOpen Loop
RERelative Error
RMSERoot Mean Squared Error
RSRemote Sensing
SARSynthetic Aperture Radar
SMSoil Moisture
SMAPSoil Moisture Active Passive
SNAPSentinel Application Platform
WCMWater Cloud Model
WOFOSTWOrld FOod STudies

Appendix A

Figure A1. General growth stages of winter wheat and corresponding satellite observations in Hengshui city in 2017.
Remotesensing 15 01825 g0a1

References

  1. Sun, Z.; Scherer, L.; Zhang, Q.; Behrens, P. Adoption of plant-based diets across Europe can improve food resilience against the Russia–Ukraine conflict. Nat. Food. 2022, 3, 905–910. [Google Scholar] [CrossRef]
  2. Food and Agriculture Organization of the United Nations; International Fund for Agricultural Development; United Nations Children’s Fund; World Food Programme; World Health Organization. The State of Food Security and Nutrition in the World 2020; Transforming Food Systems for Affordable Healthy Diets; FAO: Rome, Italy, 2020. [Google Scholar]
  3. Tao, F.; Palosuo, T.; Rötter, R.P.; Díaz-Ambrona, C.G.H.; Mínguez, M.I.; Semenov, M.A.; Kersebaum, K.C.; Cammarano, D.; Specka, X.; Nendel, C.; et al. Why do crop models diverge substantially in climate impact projections? A comprehensive analysis based on eight barley crop models. Agric. For. Meteorol. 2020, 281, 107851. [Google Scholar] [CrossRef]
  4. Wang, J.; Li, X.; Lu, L.; Fang, F. Estimating near future regional corn yields by integrating multi-source observations into a crop growth model. Eur. J. Agron. 2013, 49, 126–140. [Google Scholar] [CrossRef]
  5. Huang, J.; Tian, L.; Liang, S.; Becker-Reshef, I.; Su, W.; Zhang, X.; Zhu, D.; Wu, W. Improving winter wheat yield estimation by assimilation of the leaf area index from Landsat TM and MODIS data into the WOFOST model. Agric. For. Meteorol. 2015, 204, 106–121. [Google Scholar] [CrossRef] [Green Version]
  6. Bouman, B.A.M.; Van Diepen, C.A.; Vossen, P.; Van Der Val, T. Simulation and systems analysis tools for crop yield forecasting. In Applications of Systems Approaches at the Farm and Regional Levels; Teng, P.S., Ed.; Kluwer Academic Publishers: Amsterdam, The Netherlands, 1997; pp. 325–340. [Google Scholar]
  7. Ines, A.V.; Das, N.N.; Hansen, J.W.; Njoku, E.G. Assimilation of remotely sensed soil moisture and vegetation with a crop simulation model for maize yield prediction. Remote Sens. Environ. 2013, 138, 149–164. [Google Scholar] [CrossRef] [Green Version]
  8. Fang, H.; Liang, S.; Hoogenboom, G.; Teasdale, J.; Cavigelli, M. Corn-yield estimation through assimilation of remotely sensed data into the CSM-CERES-maize model. Int. J. Remote Sens. 2008, 29, 3011–3032. [Google Scholar] [CrossRef]
  9. Huang, J.; Gómez-Dans, J.L.; Huang, H.; Ma, H.; Wu, Q.; Lewis, P.E.; Liang, S.; Chen, Z.; Xue, J.H.; Wu, Y.; et al. Assimilation of remote sensing into crop growth models: Current status and perspectives. Agric. For. Meteorol. 2019, 276–277, 107609. [Google Scholar] [CrossRef]
  10. Huang, H.; Huang, J.; Li, X.; Zhuo, W.; Wu, Y.; Niu, Q.; Su, W.; Yuan, W. A dataset of winter wheat aboveground biomass in China during 2007–2015 based on data assimilation. Sci. Data 2022, 9, 200. [Google Scholar] [CrossRef]
  11. Jin, X.; Li, Z.; Yang, G.; Yang, H.; Feng, H.; Xu, X.; Wang, J.; Li, X.; Luo, J. Winter wheat yield estimation based on multi-source medium resolution optical and radar imaging data and the AquaCrop model using the particle swarm optimization algorithm. ISPRS J. Photogramm. Remote Sens. 2017, 126, 24–37. [Google Scholar] [CrossRef]
  12. Weiss, M.; Jacob, F.; Duveiller, G. Remote sensing for agricultural applications: A meta-review. Remote Sens. Environ. 2020, 236, 111402. [Google Scholar] [CrossRef]
  13. Zhuo, W.; Huang, J.; Li, L.; Zhang, X.; Ma, H.; Gao, X.; Huang, H.; Xu, B.; Xiao, X. Assimilating Soil Moisture Retrieved from Sentinel-1 and Sentinel-2 Data into WOFOST Model to Improve Winter Wheat Yield Estimation. Remote Sens. 2019, 11, 1618. [Google Scholar] [CrossRef] [Green Version]
  14. Zhuo, W.; Fang, S.; Gao, X.; Wang, L.; Wu, D.; Fu, S.; Wu, Q.; Huang, J. Crop yield prediction using MODIS LAI, TIGGE weather forecasts and WOFOST model: A case study for winter wheat in Hebei, China during 2009–2013. Int. J. Appl. Earth Obs. Geoinf. 2022, 106, 102668. [Google Scholar] [CrossRef]
  15. Xie, Y.; Wang, P.; Bai, X.; Khan, J.; Zhang, S.; Li, L.; Wang, L. Assimilation of the leaf area index and vegetation temperature condition index for winter wheat yield estimation using landsat imagery and the CERES-wheat model. Agric. For. Meteorol. 2017, 246, 194–206. [Google Scholar] [CrossRef]
  16. Wu, S.; Yang, P.; Chen, Z.; Ren, J.; Li, H.; Sun, L. Estimating winter wheat yield by assimilation of remote sensing data with a four-dimensional variation algorithm considering anisotropic background error and time window. Agric. For. Meteorol. 2021, 301, 108345. [Google Scholar] [CrossRef]
  17. Wu, S.; Yang, P.; Ren, J.; Chen, Z.; Li, H. Regional winter wheat yield estimation based on the WOFOST model and a novel VW-4DEnSRF assimilation algorithm. Remote Sens. Environ. 2021, 255, 112276. [Google Scholar] [CrossRef]
  18. Jin, X.; Kumar, L.; Li, Z.; Feng, H.; Xu, X.; Yang, G.; Wang, J. A review of data assimilation of remote sensing and crop models. Eur. J. Agron. 2018, 92, 141–152. [Google Scholar] [CrossRef]
  19. de Wit, A.J.W.; van Diepen, C.A. Crop model data assimilation with the Ensemble Kalman Filter for improving regional crop yield forecasts. Agric. For. Meteorol. 2007, 146, 38–56. [Google Scholar] [CrossRef]
  20. Huang, J.; Sedano, F.; Huang, Y.; Ma, H.; Li, X.; Liang, S.; Tian, L.; Zhang, X.; Fan, J.; Wu, W. Assimilating a synthetic Kalman flter leaf area index series into the WOFOST model to improve regional winter wheat yield estimation. Agric. For. Meteorol. 2016, 216, 188–202. [Google Scholar] [CrossRef]
  21. Ji, F.; Meng, J.; Cheng, Z.; Fang, H.; Wang, Y. Crop Yield Estimation at Field Scales by Assimilating Time Series of Sentinel-2 Data into a Modified CASA-WOFOST Coupled Model. IEEE Trans. Geosci. Remote Sens. 2021, 60, 4400914. [Google Scholar] [CrossRef]
  22. Zhuo, W.; Fang, S.; Wu, D.; Wang, L.; Li, M.; Zhang, J.; Gao, X. Integrating remotely sensed water stress factor with a crop growth model for winter wheat yield estimation in the North China Plain during 2008–2018. Crop J. 2022, 10, 1470–1482. [Google Scholar] [CrossRef]
  23. Nearing, G.S.; Crow, W.T.; Thorp, K.R.; Moran, M.S.; Reichle, R.H.; Gupta, H.V. Assimilating remote sensing observations of leaf area index and soil moisture for wheat yield estimates: An observing system simulation experiment. Water Resour. Res. 2012, 48, W05525. [Google Scholar] [CrossRef] [Green Version]
  24. Burgers, G.; Van Leeuwen, P.J.; Evensen, G. Analysis scheme in the ensemble Kalman filter. Mon. Weather Rev. 1998, 126, 1719–1724. [Google Scholar] [CrossRef]
  25. Zhuo, W.; Huang, J.; Xiao, X.; Huang, H.; Bajgain, R.; Wu, X.; Gao, X.; Wang, J.; Li, X.; Wagle, P. Assimilating Remote sensing-based VPM GPP into the WOFOST Model for Improving Regional Winter Wheat Yield Estimation. Eur. J. Agron. 2022, 139, 126556. [Google Scholar] [CrossRef]
  26. Li, X.; Zhao, H.; Zhang, H.; Wang, J. Global change study and quantitative remote sensing for land surface parameters. Earth Sci. Front. 2002, 9, 365–370. (In Chinese) [Google Scholar]
  27. Wang, L.; Fang, S.; Pei, Z.; Wu, D.; Zhu, Y.; Zhuo, W. Developing machine learning models with multisource inputs for improved land surface soil moisture in China. Comput. Electron. Agric. 2022, 192, 106623. [Google Scholar] [CrossRef]
  28. Zhao, F.; Gu, X.; Verhoef, W.; Wang, Q.; Yu, T.; Liu, Q.; Huang, H.; Qin, W.; Chen, L.; Zhao, H. A spectral directional reflectance model of row crops. Remote Sens. Environ. 2010, 114, 265–285. [Google Scholar] [CrossRef]
  29. Wu, S.; Ren, J.; Chen, Z.; Yang, P.; Li, H. Soil moisture estimation based on the microwave scattering mechanism during different crop phenological periods in a winter wheat-producing region. J. Hydrol. 2020, 590, 125521. [Google Scholar] [CrossRef]
  30. Veloso, A.; Mermoz, S.; Bouvet, A.; Le Toan, T.; Planells, M.; Dejoux, J.F.; Ceschia, E. Understanding the temporal behavior of crops using Sentinel-1 and Sentinel-2- like data for agricultural applications. Remote Sens. Environ. 2017, 199, 415–426. [Google Scholar] [CrossRef]
  31. Louis, J.; Debaecker, V.; Pflug, B.; Main-Knorn, M.; Bieniarz, J.; Mueller-Wilm, U.; Cadau, E.; Gascon, F. Sentinel-2 Sen2Cor: L2A Processor for Users. In Proceedings of the Living Planet Symposium 2016, Prague, Czech Republic, 9–13 May 2016; pp. 1–8. [Google Scholar]
  32. de Wit, C.T. Photosynthesis of Leaf Canopies; Agricultural Research Reports; Pudoc: Wageningen, The Netherlands, 1965. [Google Scholar]
  33. Lin, C.; Wang, Z.; Zhu, J. An ensemble Kalman filter for severe dust storm data assimilation over China. Atmos. Chem. Phys. 2008, 8, 2975–2983. [Google Scholar] [CrossRef] [Green Version]
  34. Pan, H.; Chen, Z.; de Allard, W.; Ren, J. Joint assimilation of leaf area index and soil moisture from sentinel-1 and sentinel-2 data into the WOFOST model for winter wheat yield estimation. Sensors 2019, 19, 3161. [Google Scholar] [CrossRef] [Green Version]
  35. Kang, Y.; Özdoğan, M. Field-level crop yield mapping with Landsat using a hierarchical data assimilation approach. Remote Sens. Environ. 2019, 228, 144–163. [Google Scholar] [CrossRef]
  36. Huang, J.; Zhuo, W.; Li, Y.; Huang, R.; Sedano, F.; Su, W.; Dong, J.; Tian, L.; Huang, Y.; Zhu, D.; et al. Comparison of three remotely sensed drought indices for assessing the impact of drought on winter wheat yield. Int. J. Digit. Earth 2020, 13, 504–526. [Google Scholar] [CrossRef]
  37. Dong, T.; Liu, J.; Qian, B.; He, L.; Liu, J.; Wang, R.; Jing, Q.; Champagne, C.; McNairn, H.; Powers, J.; et al. Estimating crop biomass using leaf area index derived from Landsat 8 and Sentinel-2 data. ISPRS J. Photogramm. Remote Sens. 2020, 168, 236–250. [Google Scholar] [CrossRef]
  38. Zhuo, W.; Huang, J.; Gao, X.; Ma, H.; Huang, H.; Su, W.; Meng, J.; Li, Y.; Chen, H.; Yin, D. Prediction of Winter Wheat Maturity Dates through Assimilating Remotely Sensed Leaf Area Index into Crop Growth Model. Remote Sens. 2020, 12, 2896. [Google Scholar] [CrossRef]
  39. Kepert, J.D. Covariance localisation and balance in an ensemble Kalman filter. Q. J. R. Meteorol. Soc. 2009, 135, 1157–1176. [Google Scholar] [CrossRef]
  40. Mitchell, H.L.; Houtekamer, P.L.; Pellegrin, G. Ensemble size, balance, and model-error representation in an ensemble Kalman filter. Mon. Weather Rev. 2002, 130, 2791–2808. [Google Scholar] [CrossRef]
  41. Yin, J.; Zhan, X.; Zheng, Y.; Hain, C.R.; Liu, J.; Fang, L. Optimal ensemble size of ensemble Kalman filter in sequential soil moisture data assimilation. Geophys. Res. Lett. 2015, 42, 6710–6715. [Google Scholar] [CrossRef] [Green Version]
  42. Daley, R. The effect of serially correlated observation and model error on atmospheric data assimilation. Mon. Weather Rev. 1992, 120, 164–177. [Google Scholar] [CrossRef]
  43. Tandeo, P.; Ailliot, P.; Bocquet, M.; Carrassi, A.; Miyoshi, T.; Pulido, M.; Zhen, Y. A review of innovation-based methods to jointly estimate model and observation error covariance matrices in ensemble data assimilation. Q. J. R. Meteorol. Soc. 2018, 148, 3973–3994. [Google Scholar] [CrossRef]
  44. Tian, J.; Qin, J.; Yang, K.; Zhao, L.; Chen, Y.; Lu, H.; Li, X.; Shi, J. Improving surface soil moisture retrievals through a novel assimilation algorithm to estimate both model and observation errors. Remote Sens. Environ. 2022, 269, 112802. [Google Scholar] [CrossRef]
  45. Wu, Y.; Xu, W.; Huang, H.; Huang, J. Bayesian Posterior-Based Winter Wheat Yield Estimation at the Field Scale through Assimilation of Sentinel-2 Data into WOFOST Model. Remote Sens. 2022, 14, 3727. [Google Scholar] [CrossRef]
  46. Huang, H.; Huang, J.; Wu, Y.; Zhuo, W.; Song, J.; Li, X.; Li, L.; Su, W.; Ma, H.; Liang, S. The improved winter wheat yield estimation by assimilating GLASS LAI into a crop growth model with the proposed Bayesian posterior-based ensemble Kalman filter. IEEE Trans. Geosci. Remote Sens. 2023. [Google Scholar] [CrossRef]
  47. Houtekamer, P.L.; Mitchell, H.L. A sequential ensemble Kalman filter for atmospheric data assimilation. Mon. Weather Rev. 2001, 129, 123–137. [Google Scholar] [CrossRef]
Figure 1. Study area.
Remotesensing 15 01825 g001
Figure 2. Flowchart for the CDMA scheme. Notes: SMAP (Soil Moisture Active Passive); MODIS (MODerate resolution Imaging Spectrometer); WCM (water cloud model); SM (soil moisture); LAI (leaf area index); AGB (above ground biomass); oLAI1, oLAI2, …, oLAIn (observed LAI ensemble); oSM1, oSM2, …, oSMn (observed SM ensemble); mLAI1, mLAI2, …, mLAIn (WOFOST model simulated LAI ensemble); mSM1, mSM2, …, mSMn (WOFOST model simulated SM ensemble); LAI1, LAI2, …, LAIn (optimal LAI ensemble after data assimilation); SM1, SM2, …, SMn (optimal SM ensemble after data assimilation); RS Ava (remote sensing observations are available).
Remotesensing 15 01825 g002
Figure 3. Comparison of LAI and SM simulations at 500 m grid size. Notes: (a,b) represent LAI and SM simulations without DA, respectively; (c,d) represent LAI and SM simulations with DA of LAIMODIS, respectively; (e,f) represent LAI and SM simulations with DA of SMSMAP, respectively; (g,h) represent LAI and SM simulations with joint DA of LAIMODIS and SMSMAP, respectively.
Remotesensing 15 01825 g003
Figure 4. Winter wheat yield map simulated by WOFOST (a) without DA, (b) with DA of SMSMAP, (c) with DA of LAIMODIS, and (d) with joint DA of LAIMODIS and SMSMAP at 500 m grid size.
Remotesensing 15 01825 g004
Figure 5. Validation of winter wheat yield estimation results at 500 m grid size. (a) without DA, (b) with DA of SMSMAP, (c) with DA of LAIMODIS, and (d) with joint DA of LAIMODIS and SMSMAP.
Remotesensing 15 01825 g005
Figure 6. Comparison of LAI and SM simulations at 10 m grid size. Notes: (a,b) represent LAI and SM simulations without DA, respectively; (c,d) represent LAI and SM simulations with DA of LAIS2, respectively; (e,f) represent LAI and SM simulations with DA of SMS1/2, respectively; (g,h) represent LAI and SM simulations with joint DA of LAIS2 and SMS1/2, respectively.
Remotesensing 15 01825 g006
Figure 7. Winter wheat yield map simulated by WOFOST (a) without DA, (b) with DA of SMS1/2, (c) with DA of LAIS2, and (d) with joint DA of LAIS2 and SMS1/2 at 10 m grid size.
Remotesensing 15 01825 g007
Figure 8. Validation of winter wheat yield estimation results at 10 m grid size. (a) without DA, (b) with DA of SMS1/2, (c) with DA of LAIS2, and (d) with joint DA of LAIS2 and SMS1/2.
Remotesensing 15 01825 g008
Figure 9. Relative error of winter wheat yield for each county (zonal statistic of official census yield VS. simulated yield at the county level).
Remotesensing 15 01825 g009
Table 1. Comparison of yield estimation accuracy of different assimilation strategies.
Assimilation StrategyR2 (500 m)RMSE (500 m)
(kg/ha)
R2 (10 m)RMSE (10 m)
(kg/ha)
Without DA0.195330.211330
DA with SM0.326940.35934
DA with LAI0.398290.40879
DA with LAI + SM0.427360.46756
Disclaimer/Publisher’s Note: The statements, opinions and data contained in all publications are solely those of the individual author(s) and contributor(s) and not of MDPI and/or the editor(s). MDPI and/or the editor(s) disclaim responsibility for any injury to people or property resulting from any ideas, methods, instructions or products referred to in the content.

