Article

Exploring the Use of Orthophotos in Google Earth Engine for Very High-Resolution Mapping of Impervious Surfaces: A Data Fusion Approach in Wuppertal, Germany

by
Jan-Philipp Langenkamp
* and
Andreas Rienow
Geomatics Research Group, Institute of Geography, Faculty of Geosciences, Ruhr-University Bochum, 44870 Bochum, Germany
*
Author to whom correspondence should be addressed.
Remote Sens. 2023, 15(7), 1818; https://doi.org/10.3390/rs15071818
Submission received: 27 February 2023 / Revised: 24 March 2023 / Accepted: 27 March 2023 / Published: 29 March 2023
(This article belongs to the Special Issue Urban Planning Supported by Remote Sensing Technology)

Abstract

:
Germany aims to reduce soil sealing to under 30 hectares per day by 2030 to address negative environmental impacts from the expansion of impervious surfaces. As cities adapt to climate change, spatially explicit very high-resolution information about the distribution of impervious surfaces is becoming increasingly important for urban planning and decision-making. This study proposes a method for mapping impervious surfaces in Google Earth Engine (GEE) using a data fusion approach of 0.9 m colour-infrared true orthophotos, digital elevation models, and vector data. We conducted a pixel-based random forest (RF) classification utilizing spectral indices, Grey-Level Co-occurrence Matrix texture features, and topographic features. Impervious surfaces were mapped with 0.9 m precision resulting in an Overall Accuracy of 92.31% and Kappa-Coefficient of 84.62%. To address challenges posed by high-resolution imagery, we superimposed the RF classification results with land use data from Germany’s Authoritative Real Estate Cadastre Information System (ALKIS). The results show that 25.26% of the city of Wuppertal is covered by impervious surfaces coinciding with a government-funded study from 2020 based on Sentinel-2 Copernicus data that defined a proportion of 25.22% as built-up area. This demonstrates the effectiveness of our method for semi-automated mapping of impervious surfaces in GEE to support urban planning on a local to regional scale.

Graphical Abstract

1. Introduction

Germany aims to reduce soil sealing to less than 30 hectares per day by 2030 [1]. Soil sealing, the process of covering natural land with impervious materials (e.g., asphalt or concrete), restricts natural soil functions [2,3]. Soil sealing impacts ecology, economy, and society [4]. For example, soil sealing contributes to the loss of habitat for plants and animals [5], increased runoff and flooding [2] and increased temperatures in urban areas through the urban heat island effect [6]. Hence, impervious surfaces such as built-up areas, roads, buildings, and car parks, represent a crucial indicator of environmental quality [3,4]. Therefore, effective monitoring of impervious surfaces is required.
The rate of soil sealing in Germany is monitored through the use of ground-based information on settlements and transportation areas [7,8]. This information is provided by the standardized federal data model of the Authoritative Real Estate Cadastre Information System (ALKIS). However, since the transition of the Authoritative Property Registry (ALB) and Authoritative Property Map (ALK) to the ALKIS data model in 2015/16, data inconsistencies and disruptions in the time series have been described [7]. Moreover, the ALKIS land use dataset does not specifically provide information on impervious surfaces as land cover, requiring the use of statistical methods to approximate this information [9]. Therefore, additional data sources such as remote sensing (RS), can aid in improving the consistency of soil sealing rate measurements and reducing costs [7]. Recently, satellite imagery with high spatial resolution [10] or more advanced mapping methodologies [11] are used in Germany. These advanced methods may require more computing power and expertise. As cities adapt to a changing climate, it is becoming increasingly apparent that very high-resolution spatially explicit information about impervious surfaces and easy-to-use methods for urban planners or decision-makers are needed [12]. However, sufficient datasets are lacking.
Remote sensing (RS) using aerial imagery, such as orthophotos, has the potential to provide very high-resolution spatially explicit information on impervious surfaces [13,14]. However, mapping impervious surfaces in urban areas pose spatial resolution-related challenges. For example, the literature describes challenges due to influenced spectral information caused by shadows of buildings, trees, topographic characteristics [15], and low sun position [16] or increased spectral variability [17]. Specifically, high spatial detail contributes to increased spectral variability within the same land cover types (intra-class) and decreased spectral variability between land cover types (inter-class) [18]. To address these challenges, the use of multi-features such as spectral, textural, topographic or temporal information is proposed [19,20,21]. Specifically, spectral indices such as built-up indices such as the Normalized Difference Built-Up Index (NDBI) [22] are best practices to emphasize the spectral characteristics of built-up areas. However, several built-up indices rely on more spectral bands than red (R), green (G), blue (B) and near-infrared (NIR) [23,24], which orthophotos often do not cover. The more recent Perpendicular Impervious Surface Index (PISI) [24], which is based only on the blue and NIR channels, is a promising index for distinguishing between bare soil and impervious surfaces [23]. Additionally, impervious surfaces such as roads and buildings have distinct geometric properties that can be utilized to differentiate them from other land cover types [25]. For this, texture analysis methods have been employed, which analyse the spatial arrangement of pixels in an image [26]. Haralick et al. [27] propose the Grey-Level Co-occurrence Matrix (GLCM) which is a widely used texture analysis method [19,28,29]. For instance, Puissant et al. [30] emphasize the potential of texture analysis to improve classification accuracy in urban areas when used in conjunction with high to very high-resolution imagery. Furthermore, the use of topographic data such as radar data has been proposed to provide a more complete representation of the scene being observed [31]. For instance, Guan et al. [32] improve the classification results of urban thematic mapping through a combination of orthophotos with Light Detection and Ranging (LiDAR) data.
Despite this wide-ranging wealth of information, RS data has spectral, spatial, and temporal limitations [33]. Therefore, the integrational use of RS data and ground-based information has been described [34]. For instance, Yin et al. [33] integrate Sentinel-2 data and points of interest (POI), along with spectral, textual, and density features to classify impervious surfaces. Similarly, Wan et al. [35] utilize the OpenStreetMap (OSM) to first create training data and subsequently superimpose the classification results based on Gaofen-2 high-resolution satellite imagery with OSM road information. Schmidt and Barron [9] propose a method to map impervious surfaces in very high-resolution orthophotos using a threshold-based vegetation mask based on the Normalized Difference Vegetation Index (NDVI) [36] and the superimposition of ALKIS land use data in the city of Mannheim, Germany. Besides promising results by applying this method, Schmidt and Barron [9] emphasize the use of more advanced classification methods.
Moreover, cloud computing has recently made significant advancements in the field of earth observation science [37]. Google Earth Engine (GEE) is a noteworthy platform for accessing satellite earth observation data. It provides a free, open-access application programming interface for both Python and JavaScript programming languages integrating cloud computing capabilities and ready-to-use processing functions including state-of-the-art machine learning (ML) algorithms such as CART, Support Vector Machine (SVM) or Random Forest (RF) [37]. Given GEE’s potential, researchers have already carried out studies at varying scales, e.g., land cover classification at the national level [20] or urban change monitoring [19] based on supervised classification approaches. However, GEE is preferably used for large-scale satellite RS [37]. Therefore, only a few studies consider GEE for the processing of very high-resolution imagery. For instance, Prasai et al. [38] demonstrate the use of GEE to efficiently extract land use and land cover information in Florida using meter-precise aerial imagery from the US National Agriculture Imagery Program (NAIP) available on GEE. Zhang et al. [39] conduct a RF classification of impervious surfaces in Texas using NAIP imagery and Landsat surface reflectance data in GEE. For the generation of training data, Zhang et al. [39] propose a semi-automatic labelling approach based on OSM data demonstrating GEE’s potential to provide a comprehensive mapping approach. Although previous studies already indicate the potential of GEE for processing very high-resolution imagery, the integrational use of external data sources uploaded in GEE has not yet been sufficiently considered.
This study addresses the need for very high-resolution spatially explicit information on impervious surfaces to support urban planning processes on a local to regional scale. The objective of this study is to develop a methodology that (1) enables semi-automated very high-resolution mapping of impervious surfaces, (2) is easily reproducible and transferable and (3) is based on freely available data and allows free processing.
To do so, we propose a method based on a data fusion approach of colour-infrared (CIR) True Digital Orthophotos (TDOP), Digital Elevation Model (DEM), Normalized Difference Surface Model (nDSM), and ground-based ALKIS land use data using GEE. We utilized a pixel-based RF classification approach considering spectral indices, GLCM texture features, and topographic features. To address challenges of high-resolution imagery, we superimpose the RF classification results with cadastre accuracy ALKIS land use data.
This paper addresses the following questions (1) whether GEE can serve as a suitable alternative to map impervious surfaces sufficiently based on external very high-resolution data sources, (2) which multi-features are decisive for the classification result in the study area and (3) which ALKIS land use data can potentially be used to refine misclassifications, leading to a more consistent impervious surface map for future applications.
Subsequently, the study area as well as the data used, and the proposed methodology are explained. The results, including spatial data and validation, are then presented, and discussed, followed by a conclusion.

2. Study Area and Materials
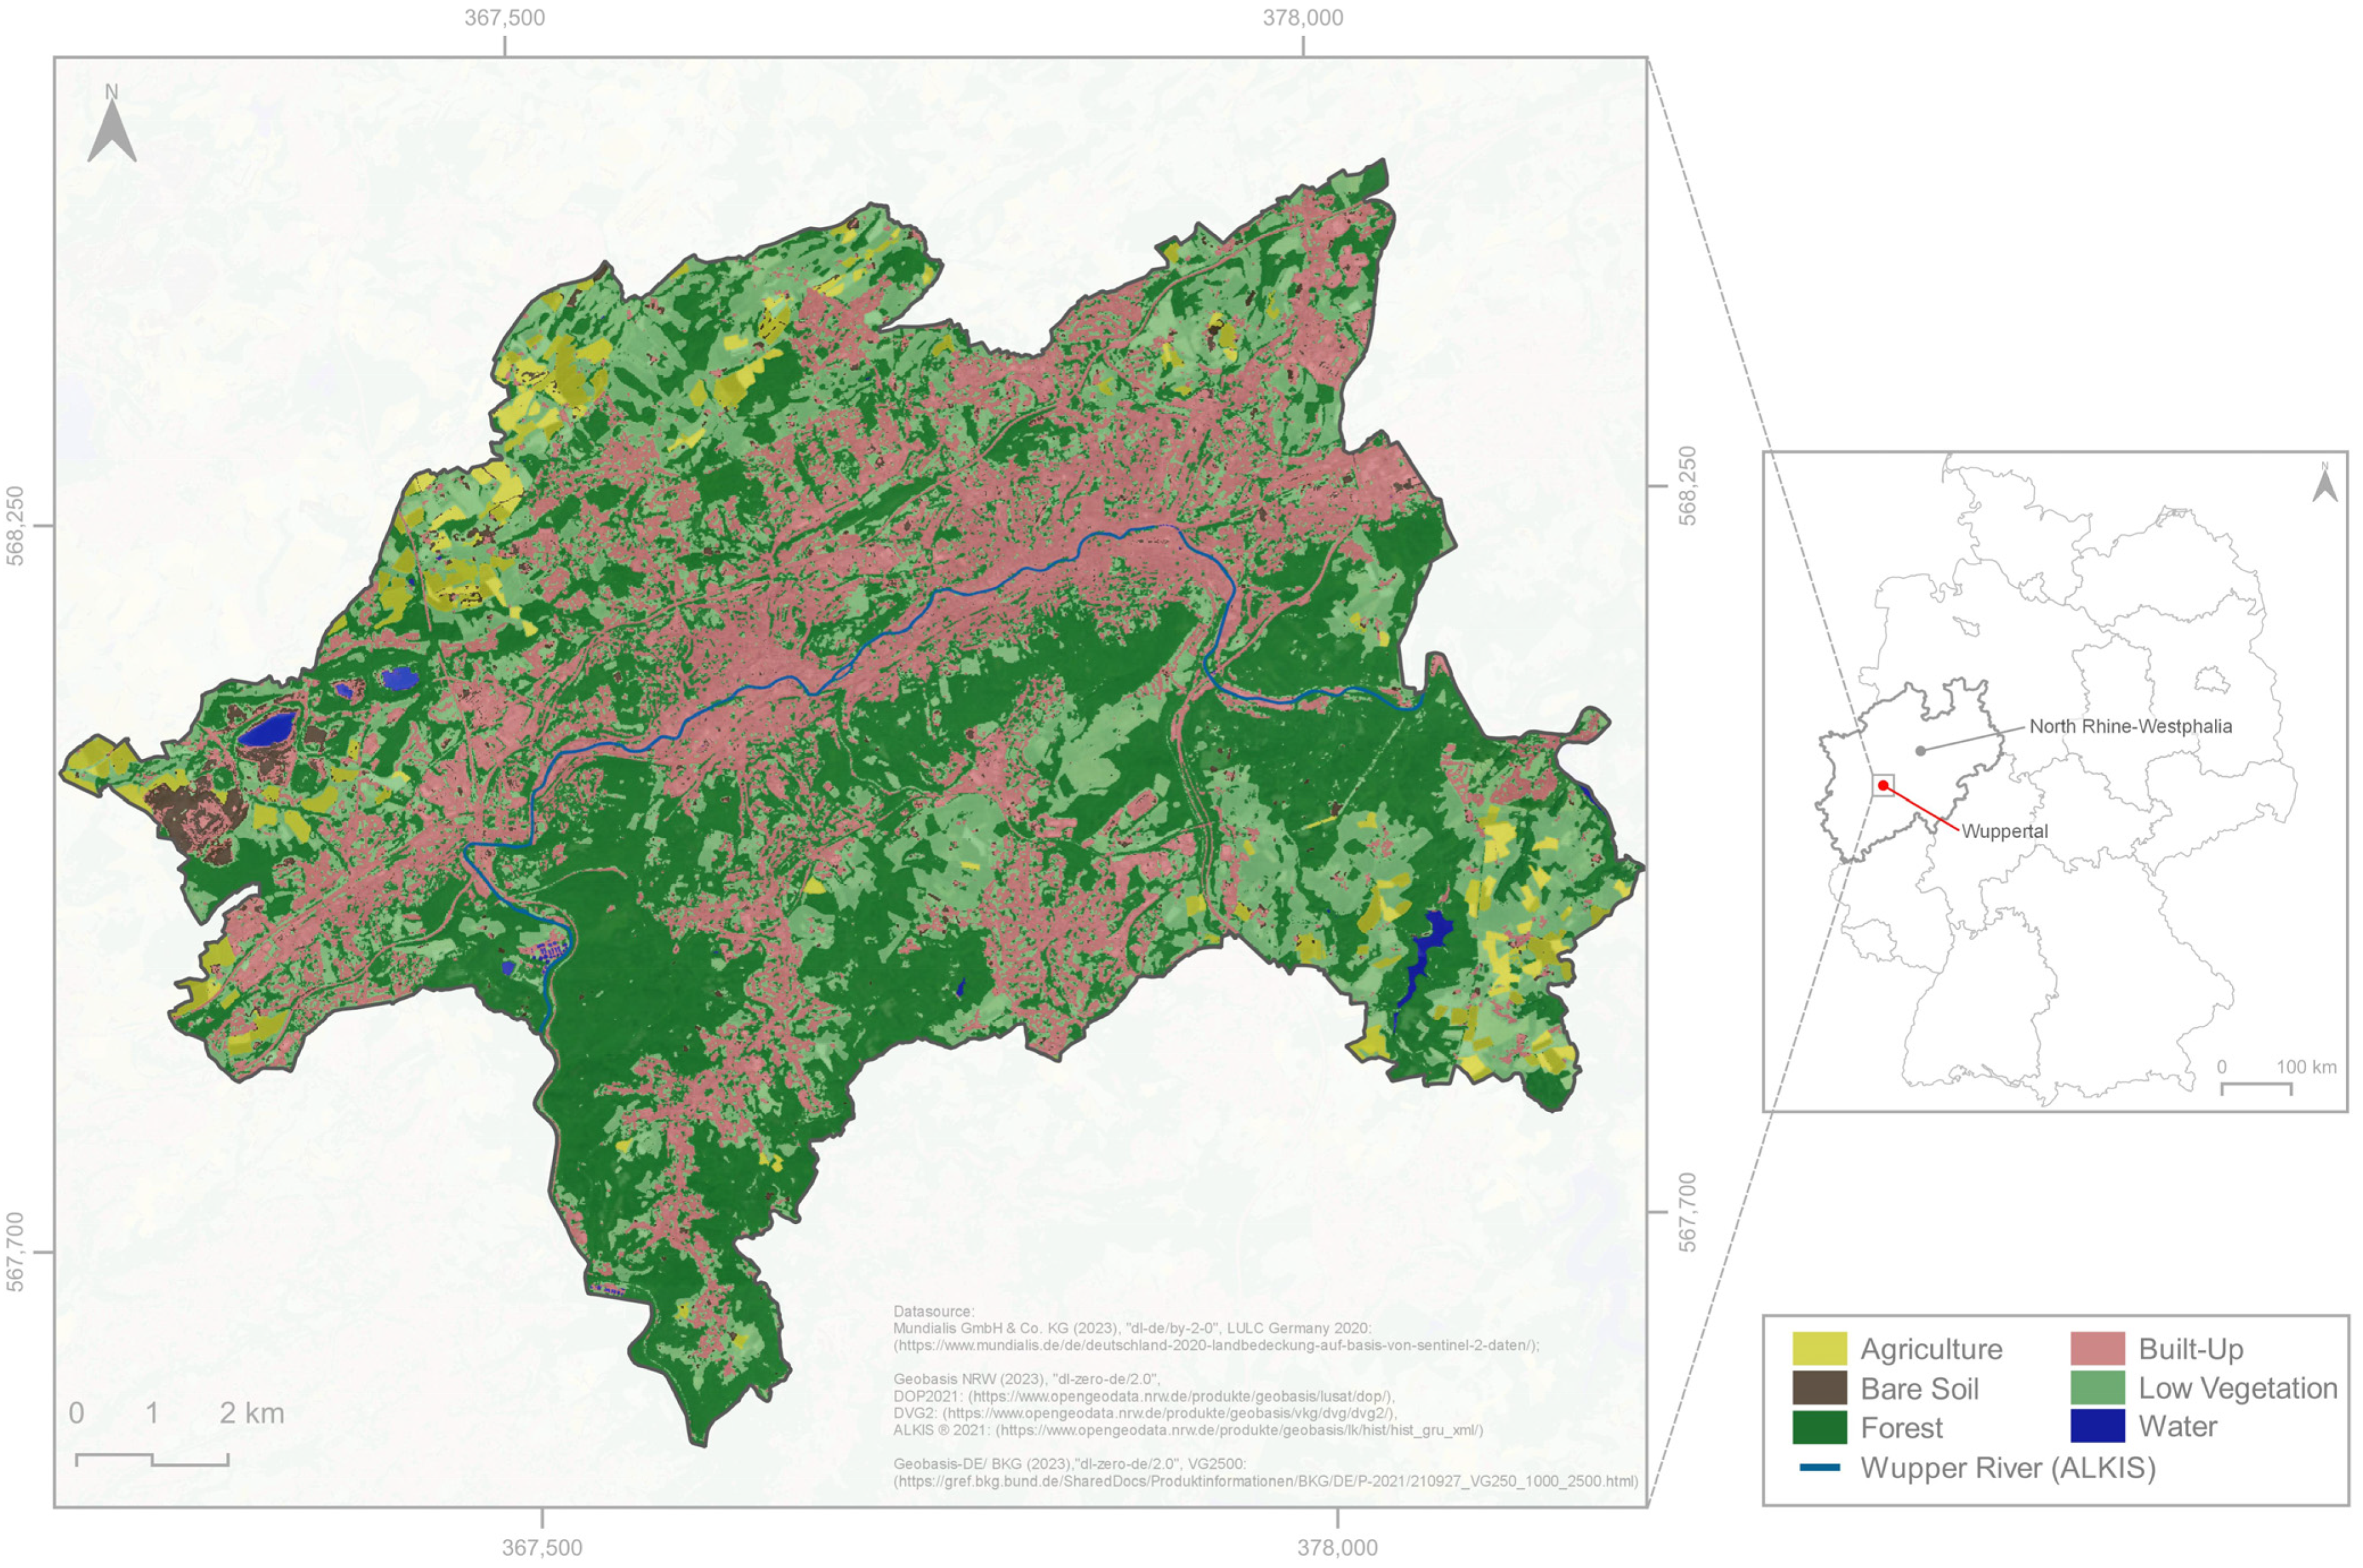
2.1. Study Area

The study area is the city of Wuppertal situated in the Rhine-Ruhr Metropolitan Region within the federal state of North Rhine-Westphalia (NRW), Western Germany (Figure 1). With a population of 365,958 residents [40], Wuppertal is considered a mid-sized German city. Wuppertal represented an important centre within early industrialization. Today, Wuppertal encompasses a diverse range of economic sectors, for example the automotive industry, metal processing or product development [41]. The city of Wuppertal covers an area of 168.41 km2 [40], which is characterized by a steep gradient between rural and urban regions. The land use is dominated by settlement, traffic, industrial and commercial areas representing built-up land cover, as well as extensive vegetation areas characterized by forest and grassland. Quarries, which are characterized by extensive bare soil areas located in the west of the study area, agricultural areas and water bodies are less prevalent. The Wupper river shapes the townscape. Moreover, the city of Wuppertal is characterized by a suspension railway that crosses the city centre, partly above the Wupper river. The study area is challenging to classify due to the highly heterogeneous land cover types, including urban to suburban settlement areas and quarry areas. Therefore, the area is well-suited for this study to serve as a representative example, regarding Wuppertal’s challenging land use/land cover characteristics, as well as its size and population.

2.2. Data Collection and Pre-Processing

In our study, we utilized both the free data infrastructure of the federal state of NRW and the official ALKIS land use data, which provides standardized real estate and cadastral information throughout Germany.

2.2.1. Optical Data

We used freely available official TDOP of the federal state of NRW to provide very high-resolution, distortion-free, and true-to-scale images of our study area [43]. These TDOPs are updated every two years. We have chosen TDOPs from summer on 1 June 2021, to better distinguish between vegetation and impervious surfaces. Moreover, these TDOPs provide 4 spectral bands (R, G, B, NIR). The original TDOPs have a spatial resolution of 0.1 m. To minimize computing capacity requirements in GEE, we used 0.9 m coarsened TDOPs which were made available to us by IT.NRW (https://www.it.nrw/ (accessed on 20 February 2023)).

2.2.2. Topographic Data

To extract the topographic properties of our study area, we used the freely available DEM [44] and the nDSM [45] provided by the federal state of NRW from 2021. The DEM is derived from Airborne Laser Scanning (ALS) and provides a spatial resolution of 1 m. The nDSM, however, is derived from the intersection of DEM and the image-based digital surface model [45], providing information on the relative height of objects on the ground surface in a spatial resolution of 0.5 m. For further processing, we conducted a spatially weighted averaging approach in GEE to align both data products to the same spatial resolution as the TDOP (0.9 m).

2.2.3. ALKIS Land Use Data
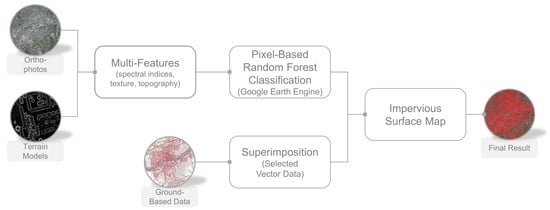
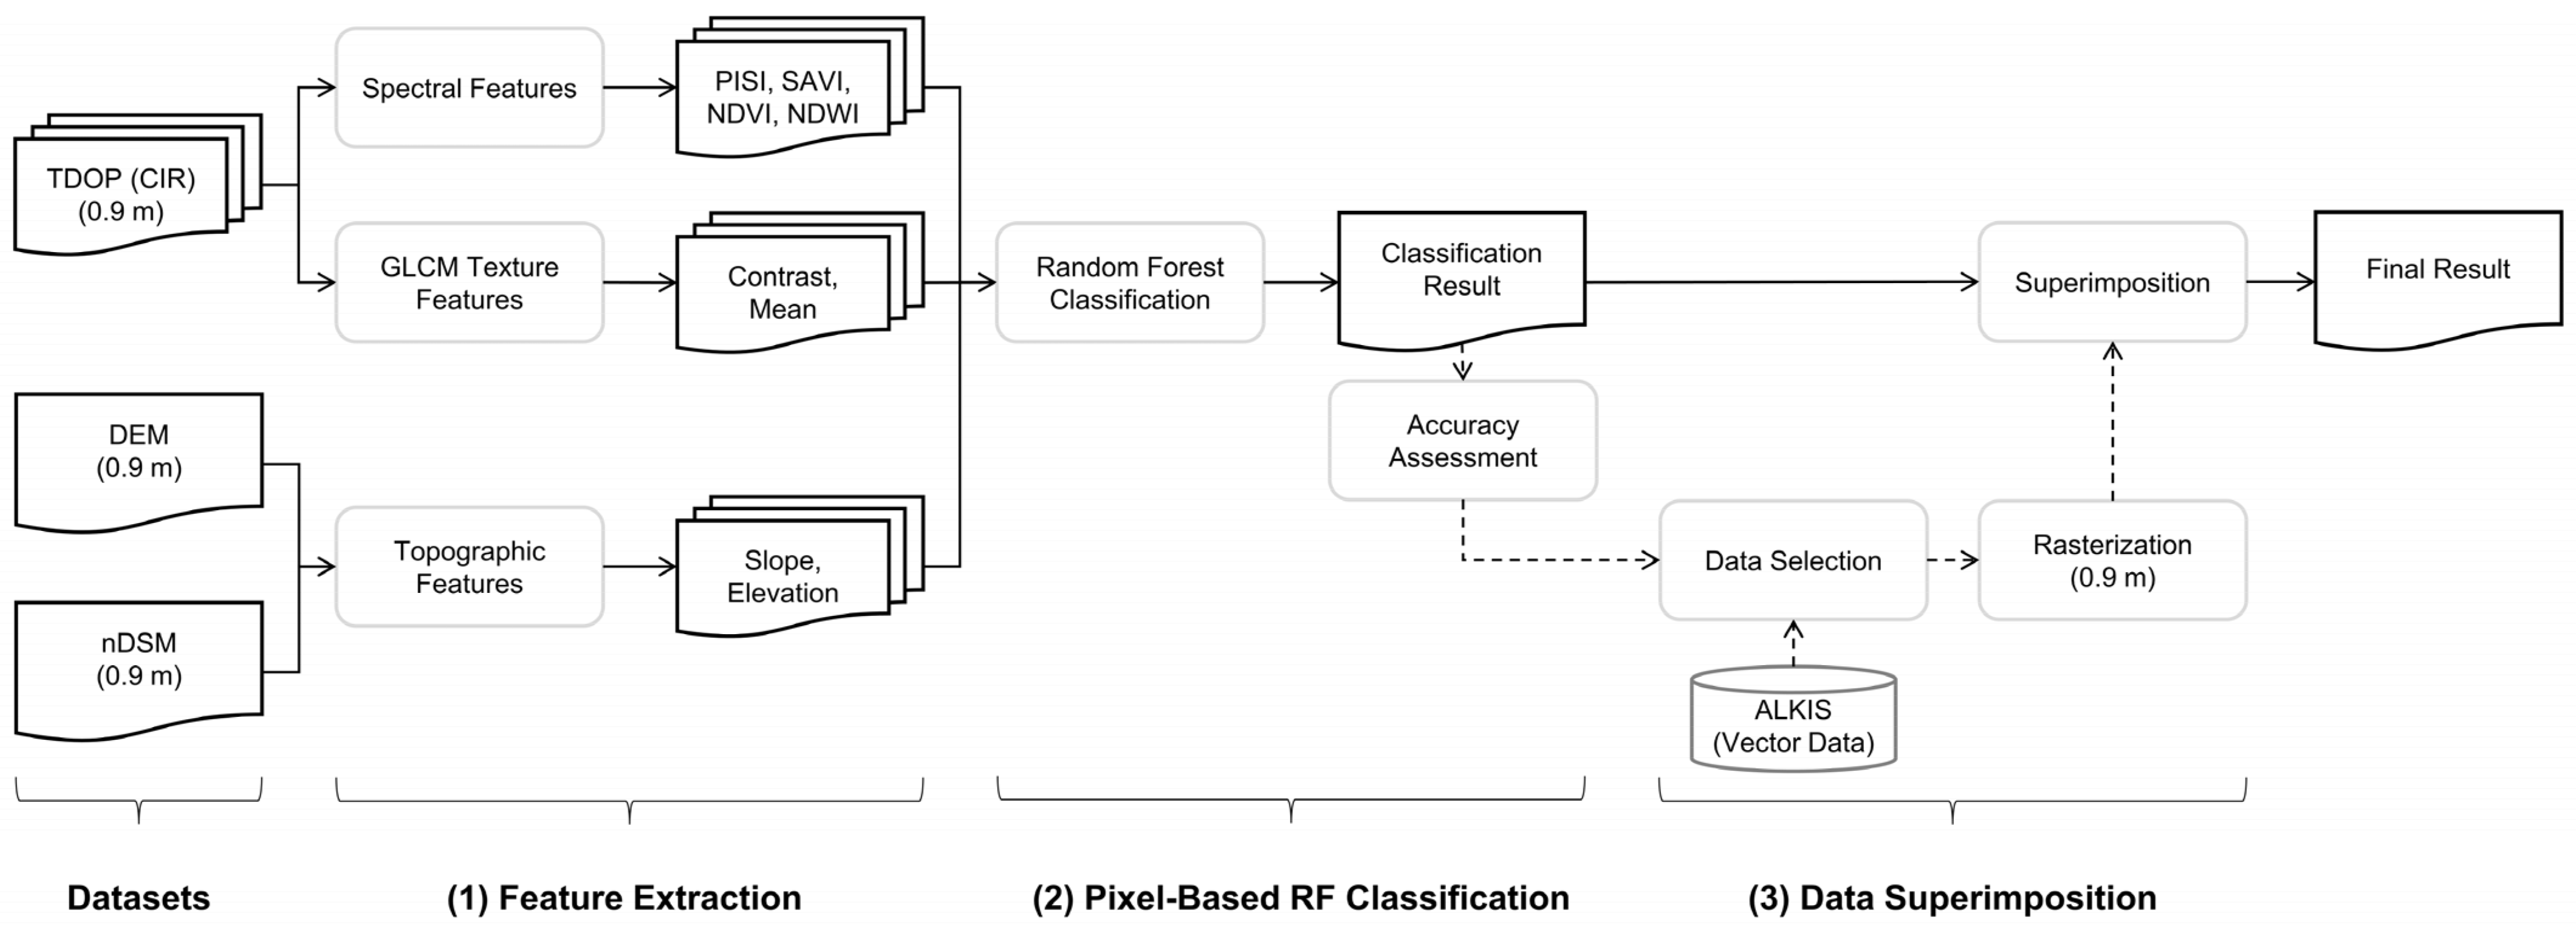
In addition to optical and topographic data, we used ALKIS land use vector data from 2021 [46]. ALKIS is a standardized and centralized database with cadastre accuracy providing wide-ranging information on parcels, buildings, actual use, land estimates and ownership in Germany [47]. ALKIS land use data is structured into the area of object types such as “actual use” which splits further down into object type groups such as “traffic” and more defining object types like “road traffic”. Specifically, these object types are broken down into diverse value types that describe the type of “road traffic”, e.g., “pedestrian zone”. Table 1 presents the ALKIS data model structure, with a focus on the “object types” employed in this study as an illustrative example. A complete documentation of the ALKIS data model is given in AdV [47]. We previously transformed the provided ALKIS land use data into ESRI shape format using the more convenient and time-efficient data interoperability extension in ArcGIS Pro [48]. However, this data transformation is also possible using the free software QGIS. For further processing in GEE, we selected corresponding value types from the ALKIS land use data and rasterized them regarding the spatial resolution of the TDOP (0.9 m) in georeferenced units within QGIS (3.24.2) software. Subsequently, the rasterized datasets were imported into GEE.

3. Methods

Our methodology can be divided into three major steps (Figure 2). In the first step, spectral, texture, and topographic features are extracted in GEE using the TDOP, the DEM and the nDSM. In the second step, a pixel-based RF Classification is conducted in GEE based on this feature set. The results are then validated in an Accuracy Assessment (AA). In the third step, auxiliary ALKIS land use vector data is selected based on the previous AA, rasterized, and directly superimposed with the RF classification result. We describe these steps in the following subsections.

3.1. Feature Extraction

For the first step of this methodology, we imported the TDOPs, DEM and nDSM into GEE to extract spectral, texture, and topographic features.

3.1.1. Spectral Features

We calculated commonly used spectral indices in GEE based on the TDOPs. Since the correlation between vegetation areas and impervious surfaces is described as inverse [49], we focused on spectral indices to emphasise the vegetation in our study area. For this purpose, we calculated the well-known NDVI [36] and the Soil-Adjusted Vegetation Index (SAVI) [50]. For additional highlighting of water features which broadly appear in our study area, we used the Normalized Difference Water Index (NDWI) [51]. To emphasize impervious surfaces, we calculated the more recent PISI [24], as this index produces promising results to accurately detect impervious surfaces without allowing great confusion with bare soil [52]. Considering the low spectral resolution of the TDOPs, the PISI comes in handy requiring only blue and NIR bands [23]. The spectral indices used, including the calculation formulas, are listed in Table 2.

3.1.2. Topographic Features

To improve the overall accuracy of the classification results, we extracted the slope and the elevation as additional topographic features [53,54]. With this additional information, we considered the specific topographic characteristics of roads and buildings to better distinguish impervious surfaces from other land cover types. We calculated the slope of the study area using the DEM. For information on the elevation, we used the nDSM, which represents the relative elevation of objects above ground.

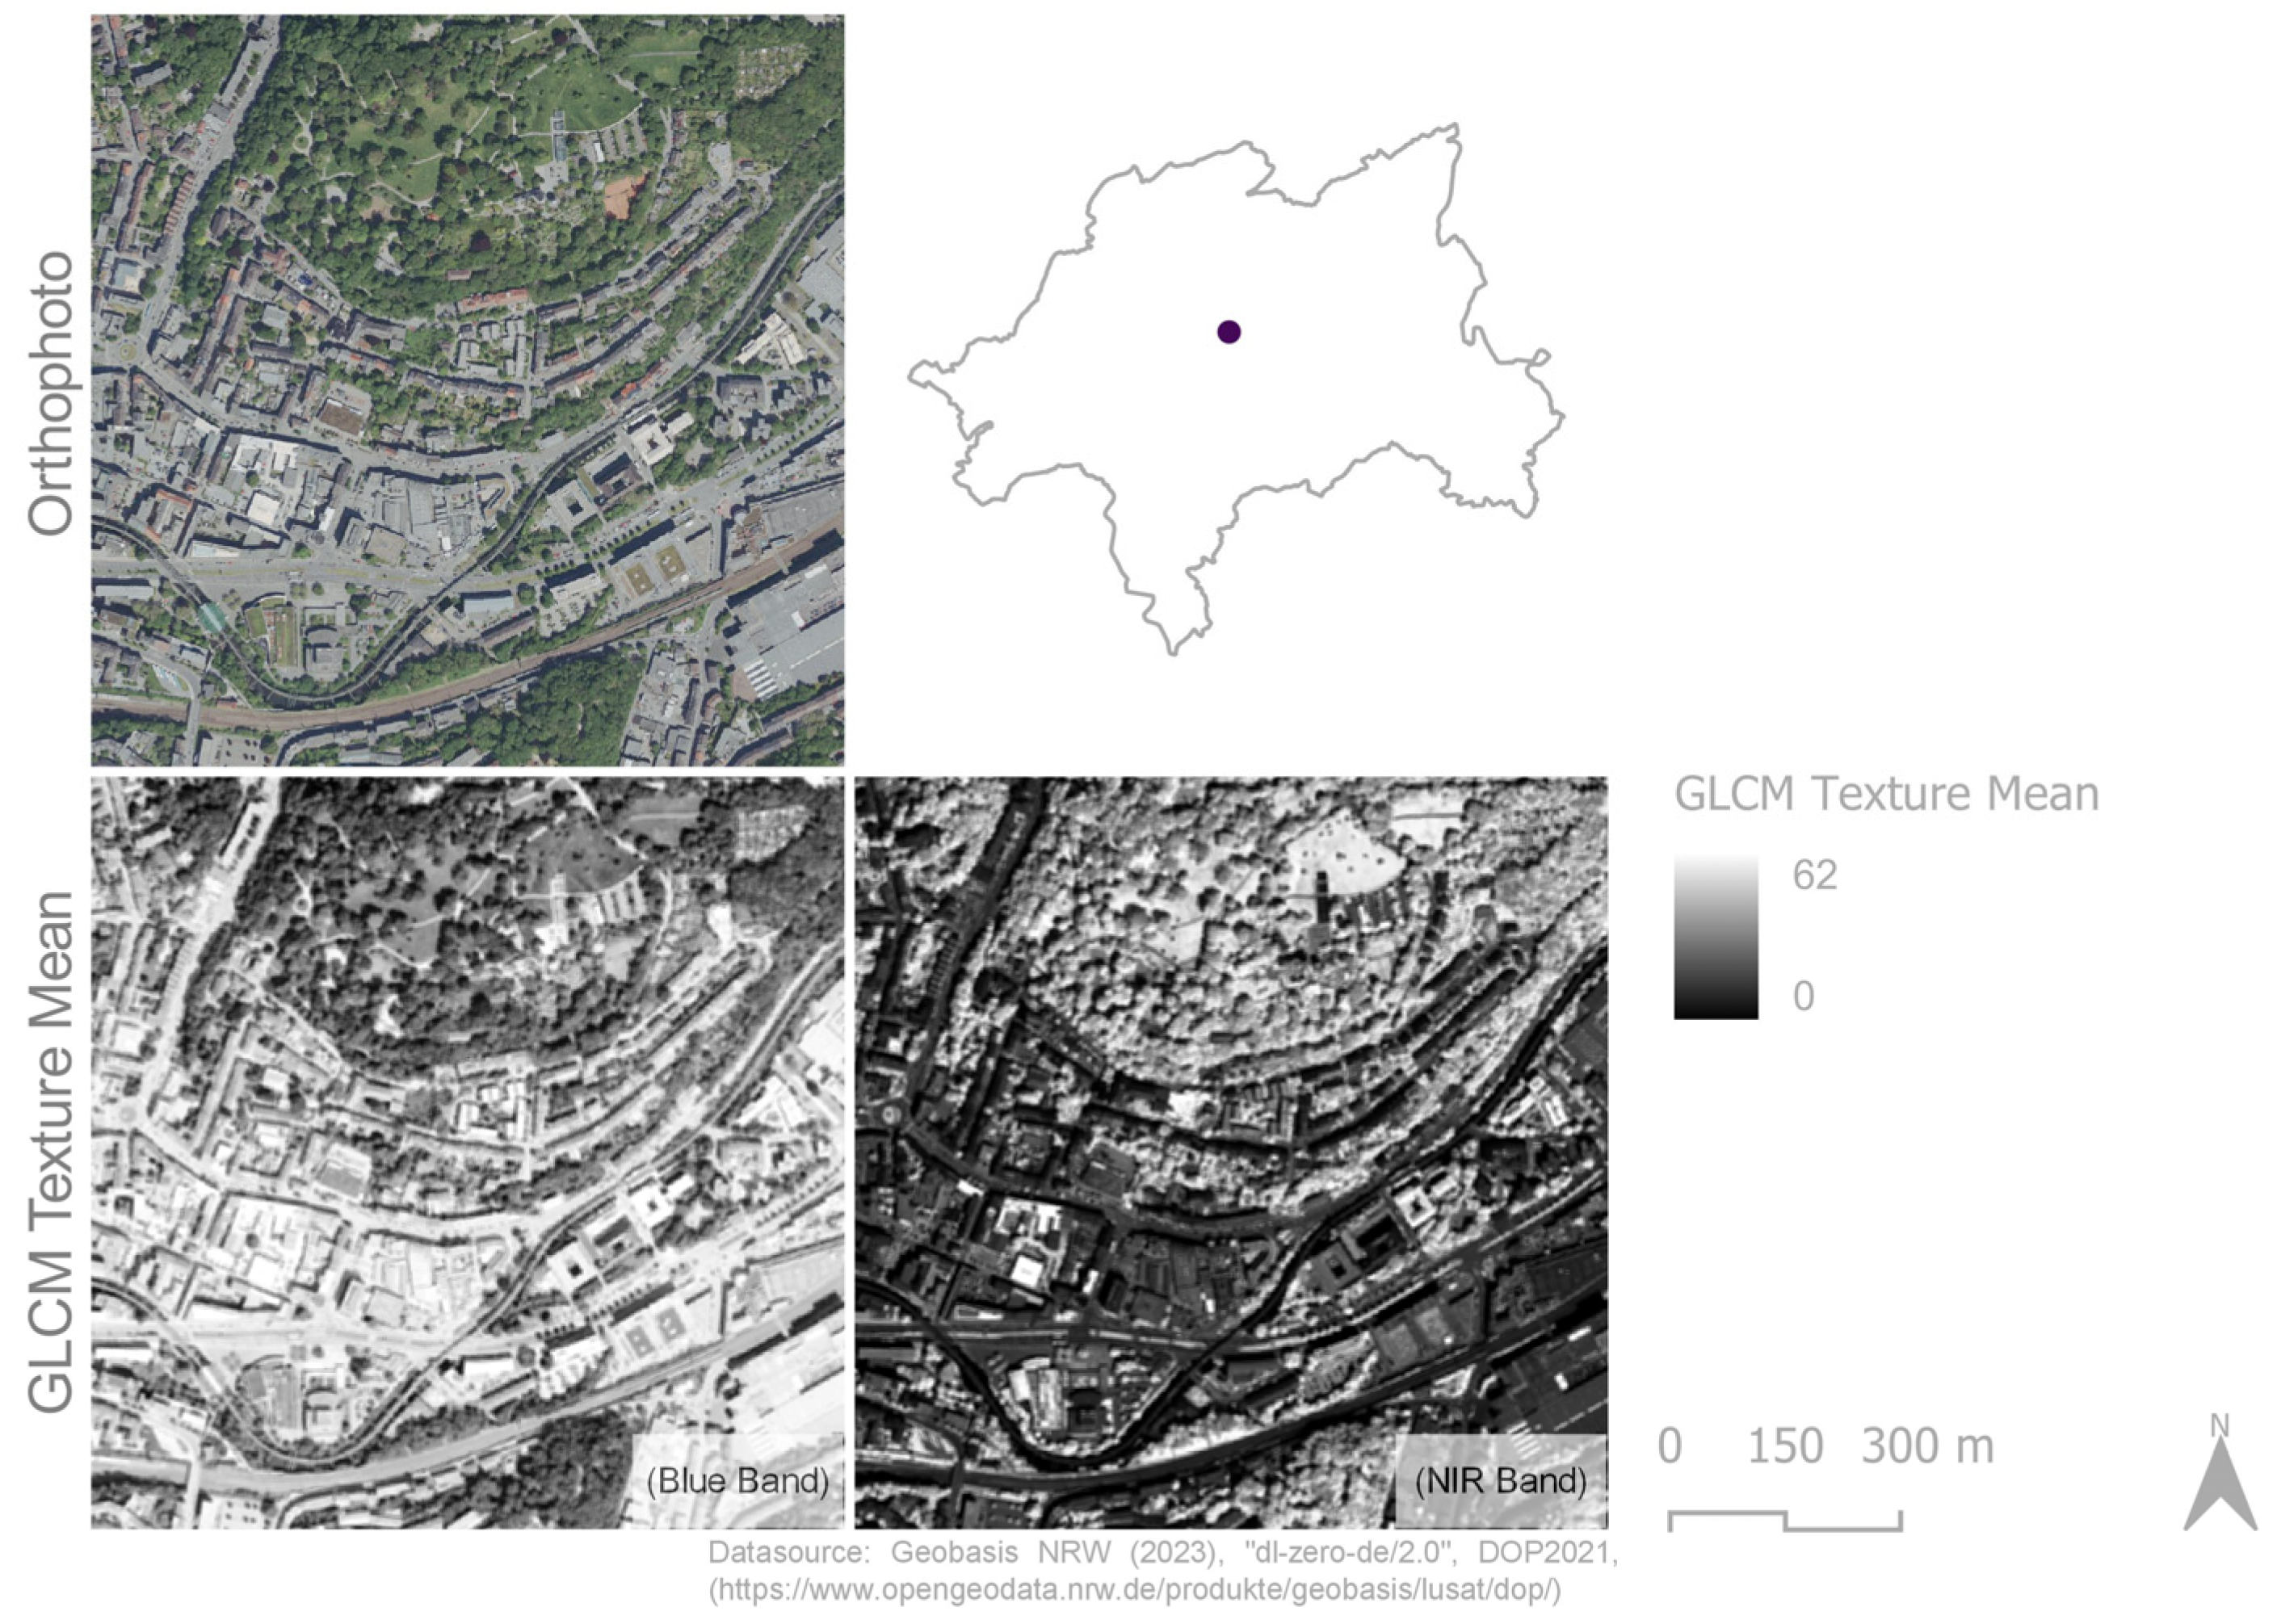
3.1.3. Texture Features

In mapping impervious surfaces, pixel neighbourhoods are taken into account, as each pixel exhibits distinct properties compared to its neighbouring pixels [26]. To capture this information in the TDOPs, we used the GLCM [27] to compute texture features. The GLCM is based on the neighbourhood relationships of pixels within a greyscale image [27]. We calculated GLCM texture features based on the spectral bands (R, G, B, NIR) of the TDOP with GEE’s built-in algorithm [55]. To keep the computation in GEE as efficient as possible, we only selected the GLCM texture features “mean” (savg) and “contrast” (contrast) for simple texture analysis, as recommended by Hall-Beyer [26]. The GLCM texture feature contrast indicates the local difference between the highest and lowest value of a group of pixels [26]. The GLCM texture feature mean considers the mean value of the greyscale sum distribution of the image. Here, the pixel values are weighted according to the frequency of their occurrence in combination with a certain neighbouring pixel value [26]. In the literature, kernel size is described as an important parameter to define, as it determines the spatial context of the reference pixel [19,26,28]. Smaller kernels capture smaller shape boundaries, while larger kernels consider a larger number of pixels, thus smaller shapes are not sufficiently represented [28]. After an empirical trial-and-error approach, we chose a kernel size of 5 × 5 to ensure a suitable neighbourhood for the fine spatial detail in the heterogeneous study area. Simultaneously, with this kernel size, we avoid the influences of blurring effects that were described by Dorigo et al. [56].

3.2. Pixel-Based Random Forest Classification

The literature indicates that object-based classification methods provide more accurate results than traditional pixel-based classification methods [13,17]. Moreover, object-based image analysis (OBIA) can sufficiently reduce intra-class variability and efficiently tackles salt-and-pepper effects affecting pixel-based methods [25]. Since the goal of this study is to provide a straightforward and transferable mapping approach, we decided to use a pixel-based classification method, as object-based methods require more know-how in the application. Therefore, more complex RS techniques such as OBIA or deep learning were not considered.
Moreover, we used a binary supervised classification approach [21,33,52] allowing directly derivable information about impervious surfaces. For this purpose, we defined the two classes “impervious” and “non-impervious”. The class “impervious” refers to settlement, traffic, industrial, and commercial areas with all kinds of artificial surfaces (e.g., asphalt, concrete, or paving). At this point, we must note that we have considered railway tracks and sports fields with artificial turf as impervious surfaces. We excluded these land use types to generate training samples due to their confusion potential in the training process caused by redundant spectral information, such as mixed materials within the railway tracks (e.g., heterogeneous gravel stones, steel, and wood), and the absence of NDVI in sports fields with artificial turf. The class “non-impervious” refers to all kinds of water bodies (e.g., rivers or reservoirs), bare soil, agricultural land, and vegetation areas (e.g., forests and meadows).

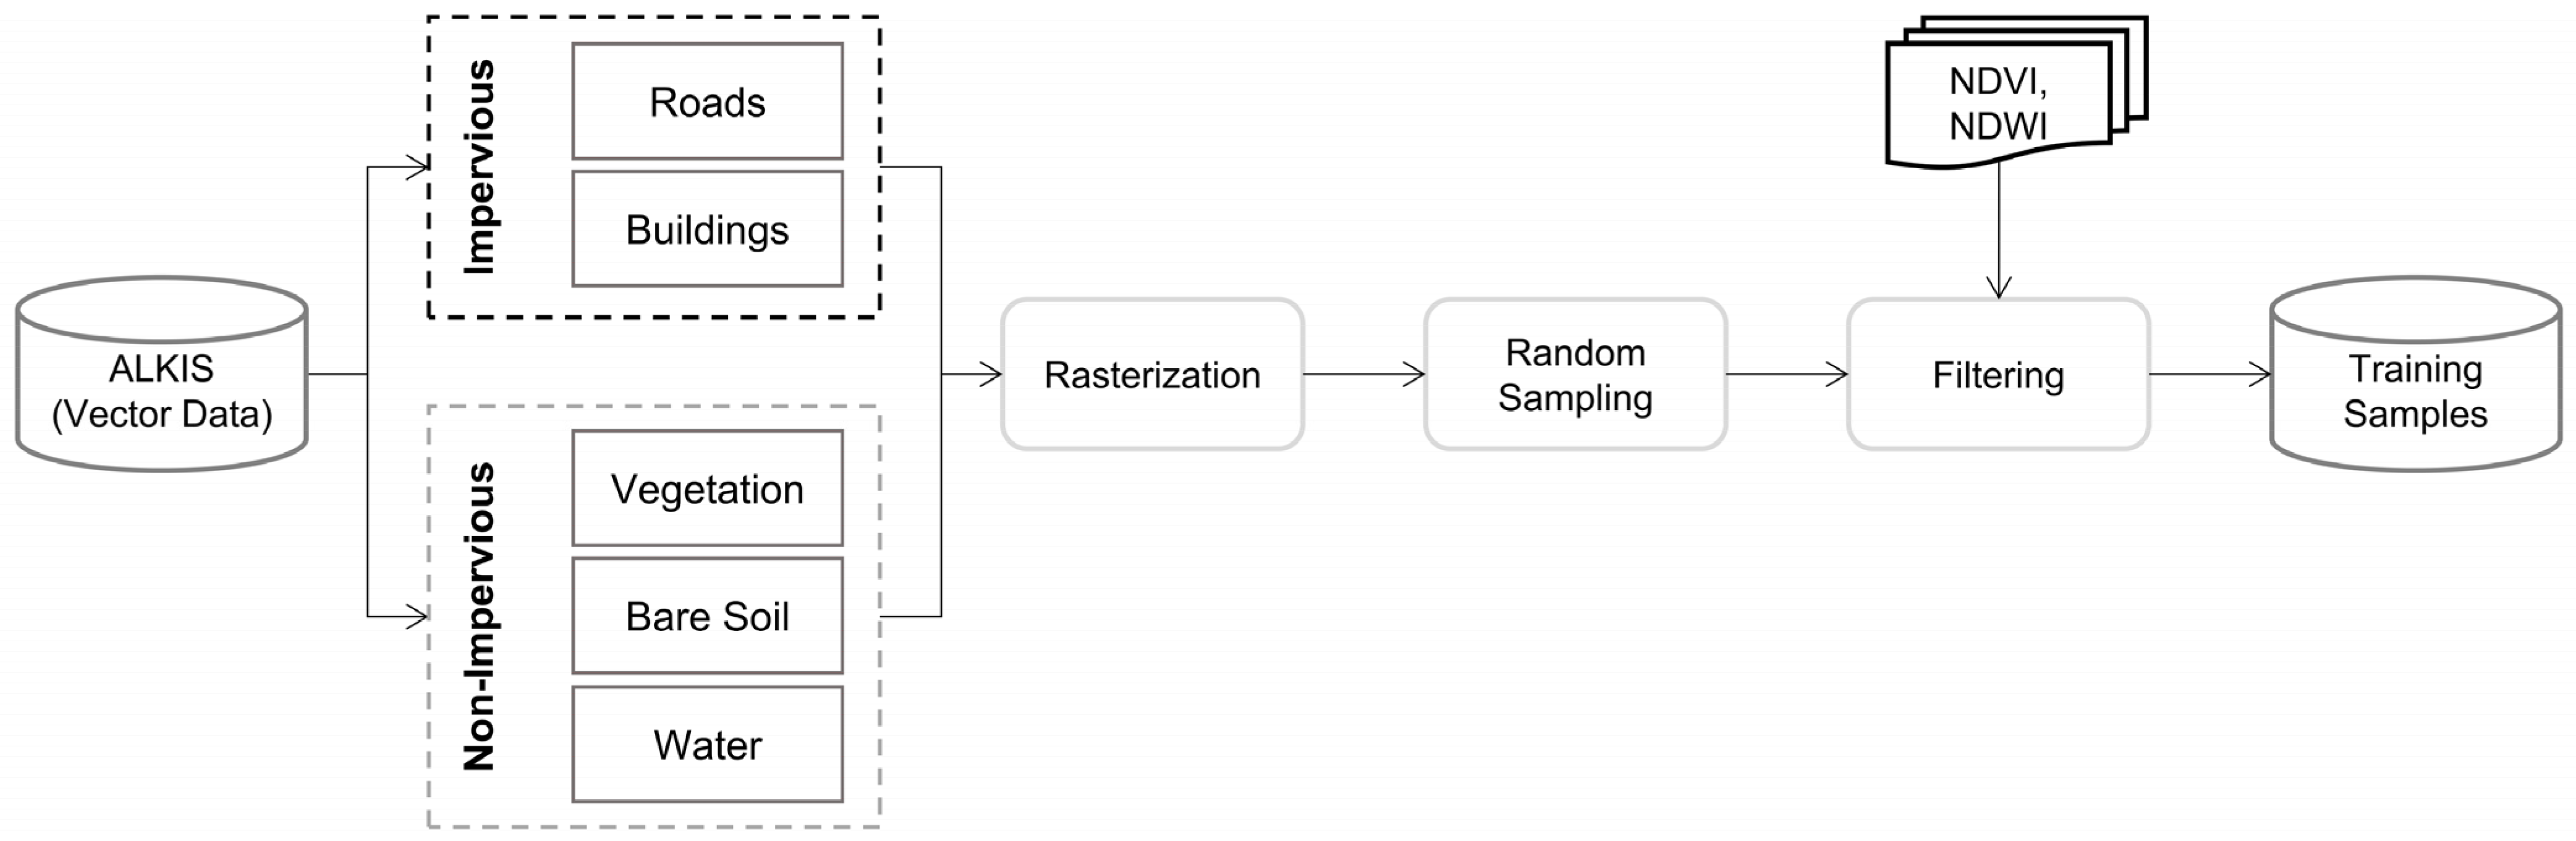
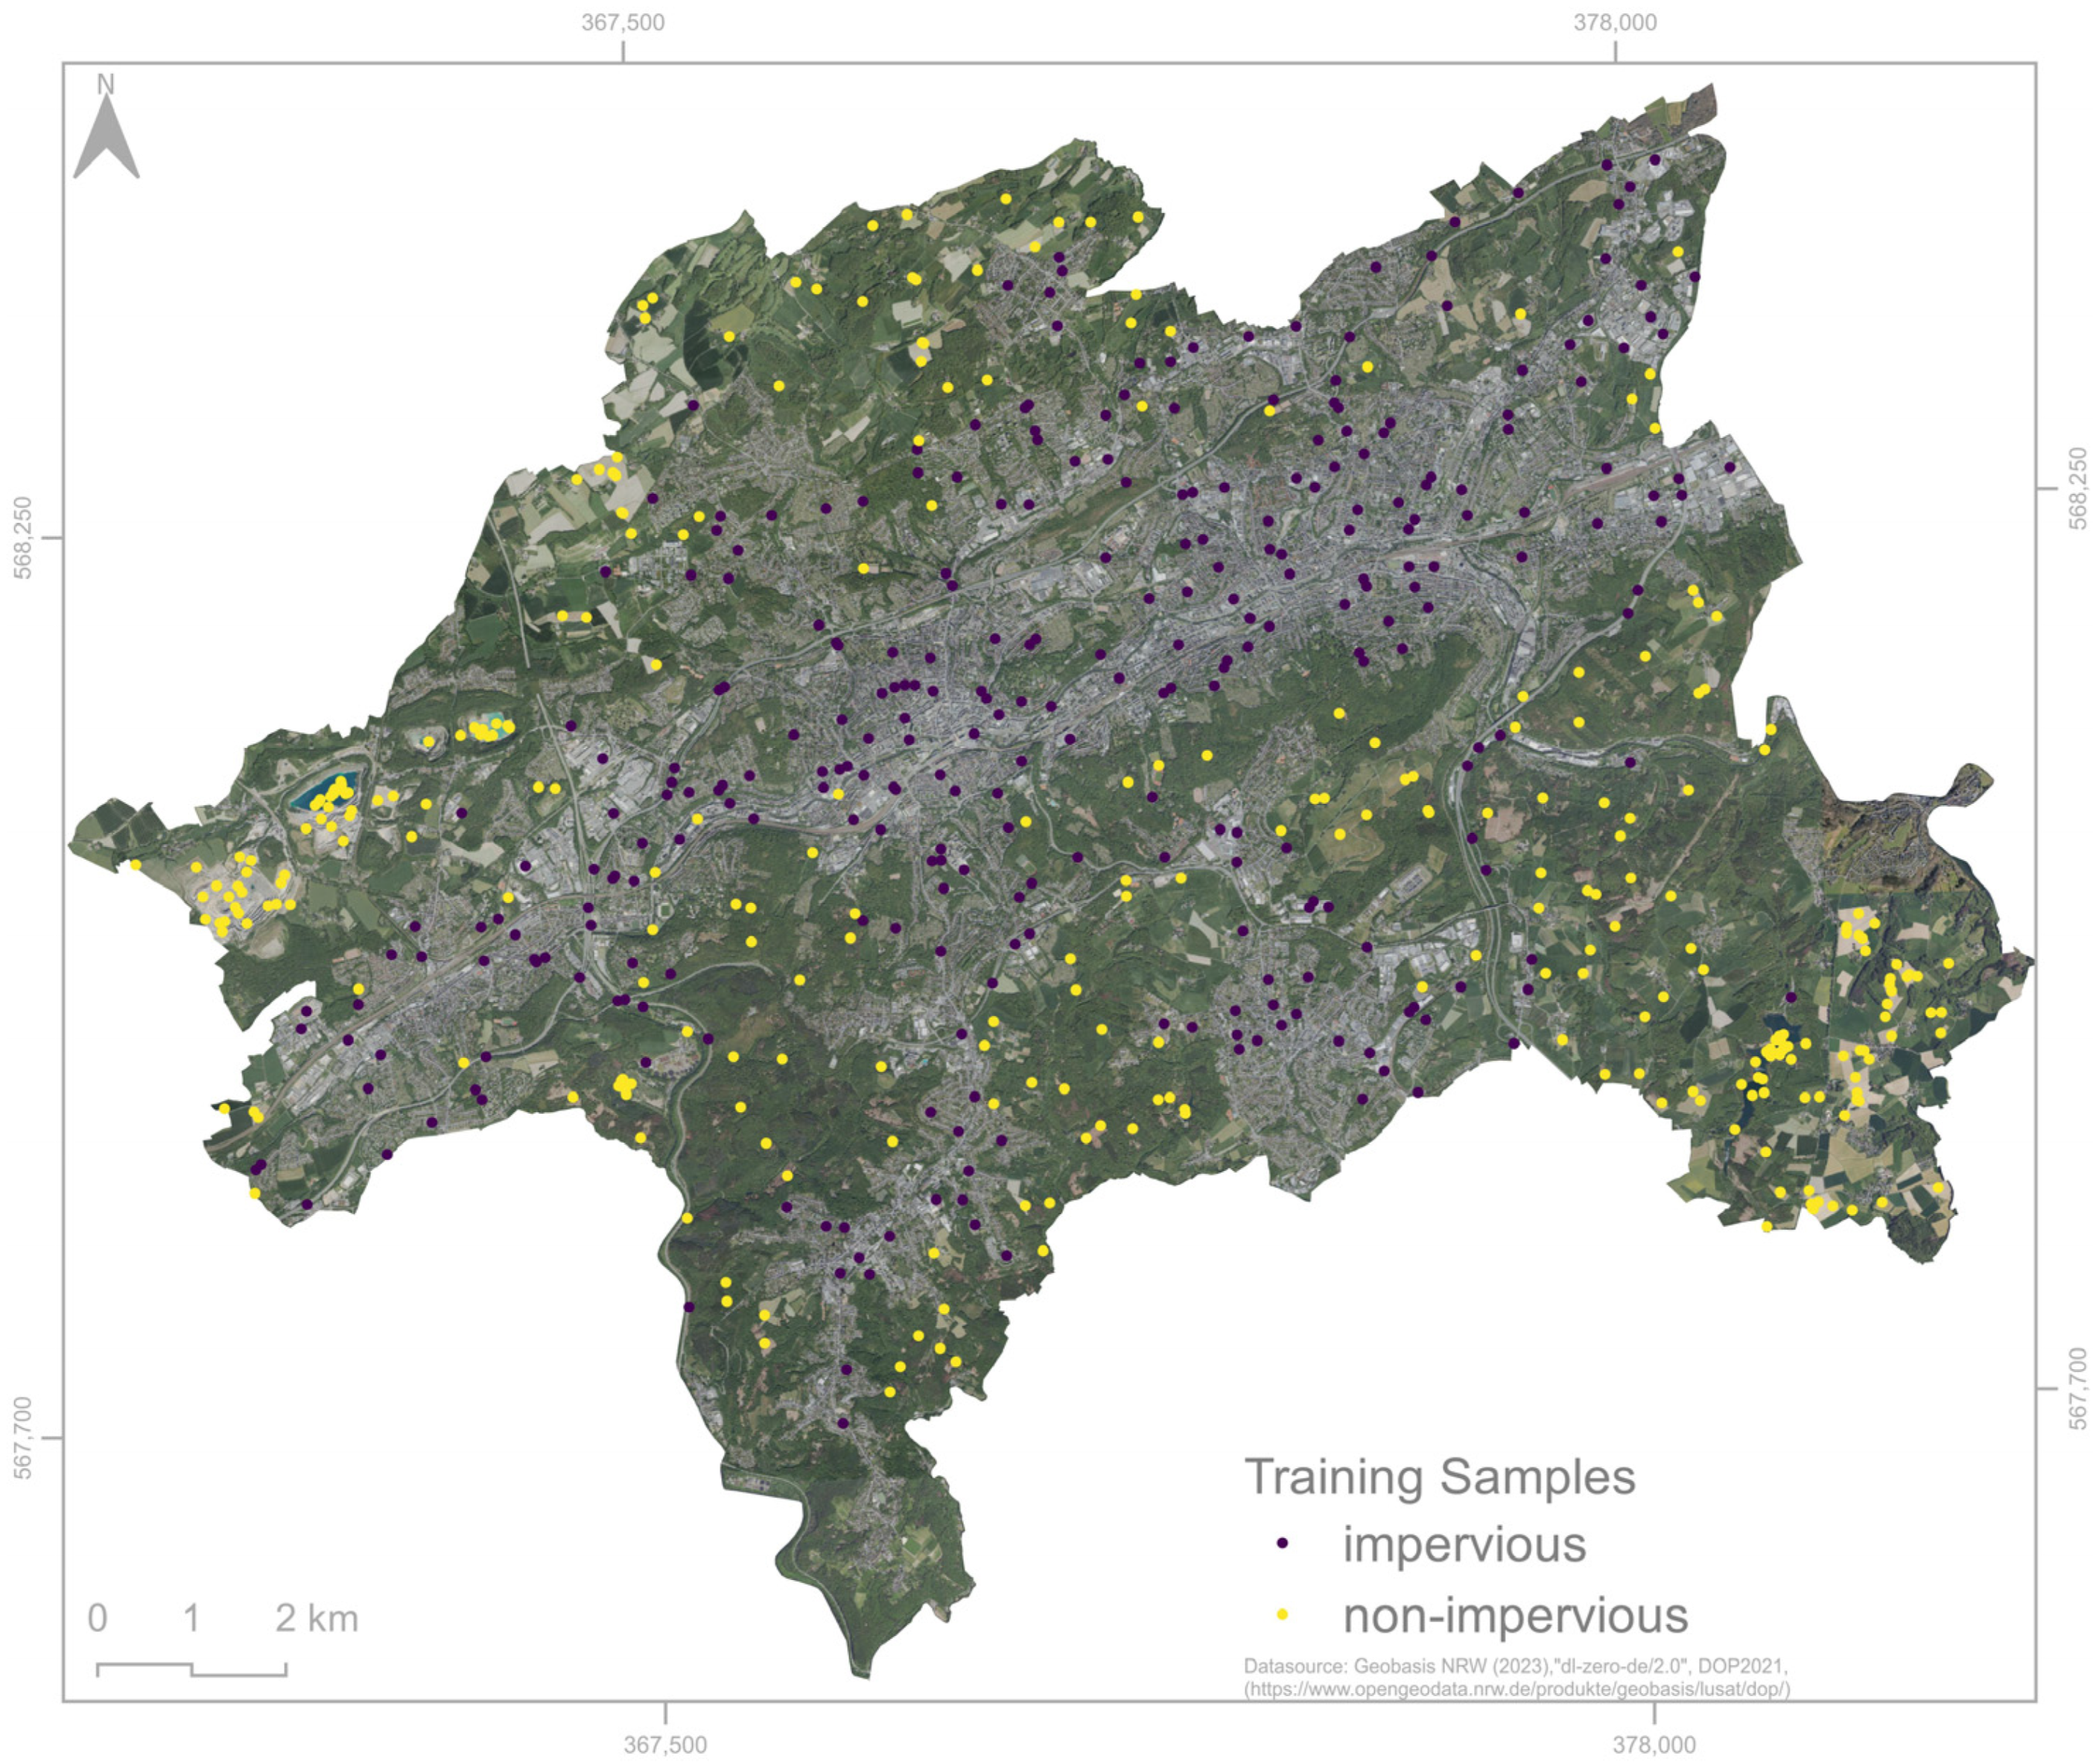
3.2.1. Generation of Training Samples

Since the creation of suitable training data for supervised classification approaches is an elaborative process [25], we have conducted a semi-automated process in GEE to keep this effort as small as possible [35,39,57]. For this purpose, we generated random training samples inside previously rasterized, selected ALKIS land use vector data as presented in Figure 3.
Since ALKIS data describes land use information (Table 1), information on impervious surfaces is mainly mixed within different value types. Therefore, we focused only on the ALKIS object types “road traffic (42001)” and “buildings (31001)” to generate random training samples for the class “impervious” to prevent mixed samples as far as possible [39]. Additionally, we filtered generated samples using a threshold of NDVI < 0, based on the TDOP, to ensure samples unaffected by vegetation. To provide training samples for the class “non-impervious”, we focused on vegetation, water, and bare soil information. Vegetation samples contain information on trees and grassland collected in the object types of “forest (43002)” and “agriculture (43001)”. Water samples were generated in the object types of “running waters (44001)” and “standing waters (44006)” to represent rivers, canals, and reservoirs. These water samples were filtered using a threshold of NDWI > 0.2 to control spatial differences of water bodies in the ALKIS land use data due to potential fluctuations in water levels. Bare soil samples contain information on farmland, wasteland and quarry areas collected in the object types of “agriculture” and “opencast mine, pit, quarry (41005)”. These samples were filtered using a threshold of NDVI < 0 to ensure samples unaffected by vegetation. We collected 300 equally weighted training samples within the classes “impervious” and “non-impervious” using a randomised stratified sampling approach in GEE. The distribution of extracted training samples is presented in Figure 4.

3.2.2. Random Forest Classification

For the pixel-based supervised classification approach, we chose the RF classifier [58], which is well-known to achieve high accuracies and robust results [59,60] and its insensitivity to overfitting [60]. Gislason et al. [61] also highlight that the RF classifier can be successfully used to classify RS and geospatial data from multiple sources. The RF algorithm is an ensemble learning method where many decision trees are created during the training phase to avoid overfitting [58]. Voting among the decision trees produces the classification result, which thus stands out as more robust than when using a single decision tree [59].
For further processing, we assembled the 4 spectral bands of the TDOP, spectral indices, GLCM texture features, and topographic features into an image collection in GEE, resulting in 18 input features for the RF classifier (Table 3).
To guarantee optimal training of the RF classifier, we normalized the final feature set in GEE using a min-max normalisation method, which provided a uniform value range. Afterwards, we fed the final input features together with the training data into GEE’s RF classifier [62] for pixel-based classification. The hyperparameters of the RF classifier were set to 500 decision trees, and the number of features considered for splitting at each node was determined as the square root of the total number of input features. This hyperparameter setting is well-known to be a good fit for RF classification approaches [57,60,61]. All other modifiable hyperparameters remained at the initial values. To finally smooth the classification result and reduce smaller salt-and-pepper effects, we implemented a simple post-processing procedure in GEE replacing isolated pixels with the surrounding value using a straightforward majority filter approach.

3.2.3. Feature Importance

An additional internally calculated output of the RF classification is the feature importance [58]. In GEE, the feature importance is calculated using the Gini index as a measure of optimal split selection [53]. This information is gathered by measuring the increase in the prediction error of the RF, referred to as the out-of-bag (OOB) error, and the decrease in the Gini index, which indicates the probability that a particular feature will be misclassified if randomly selected [29]. For this, one of the features is randomly exchanged while the others remain constant. We calculated this measure to provide information on the most influential predictive features in RF classification to better understand the RF model created.

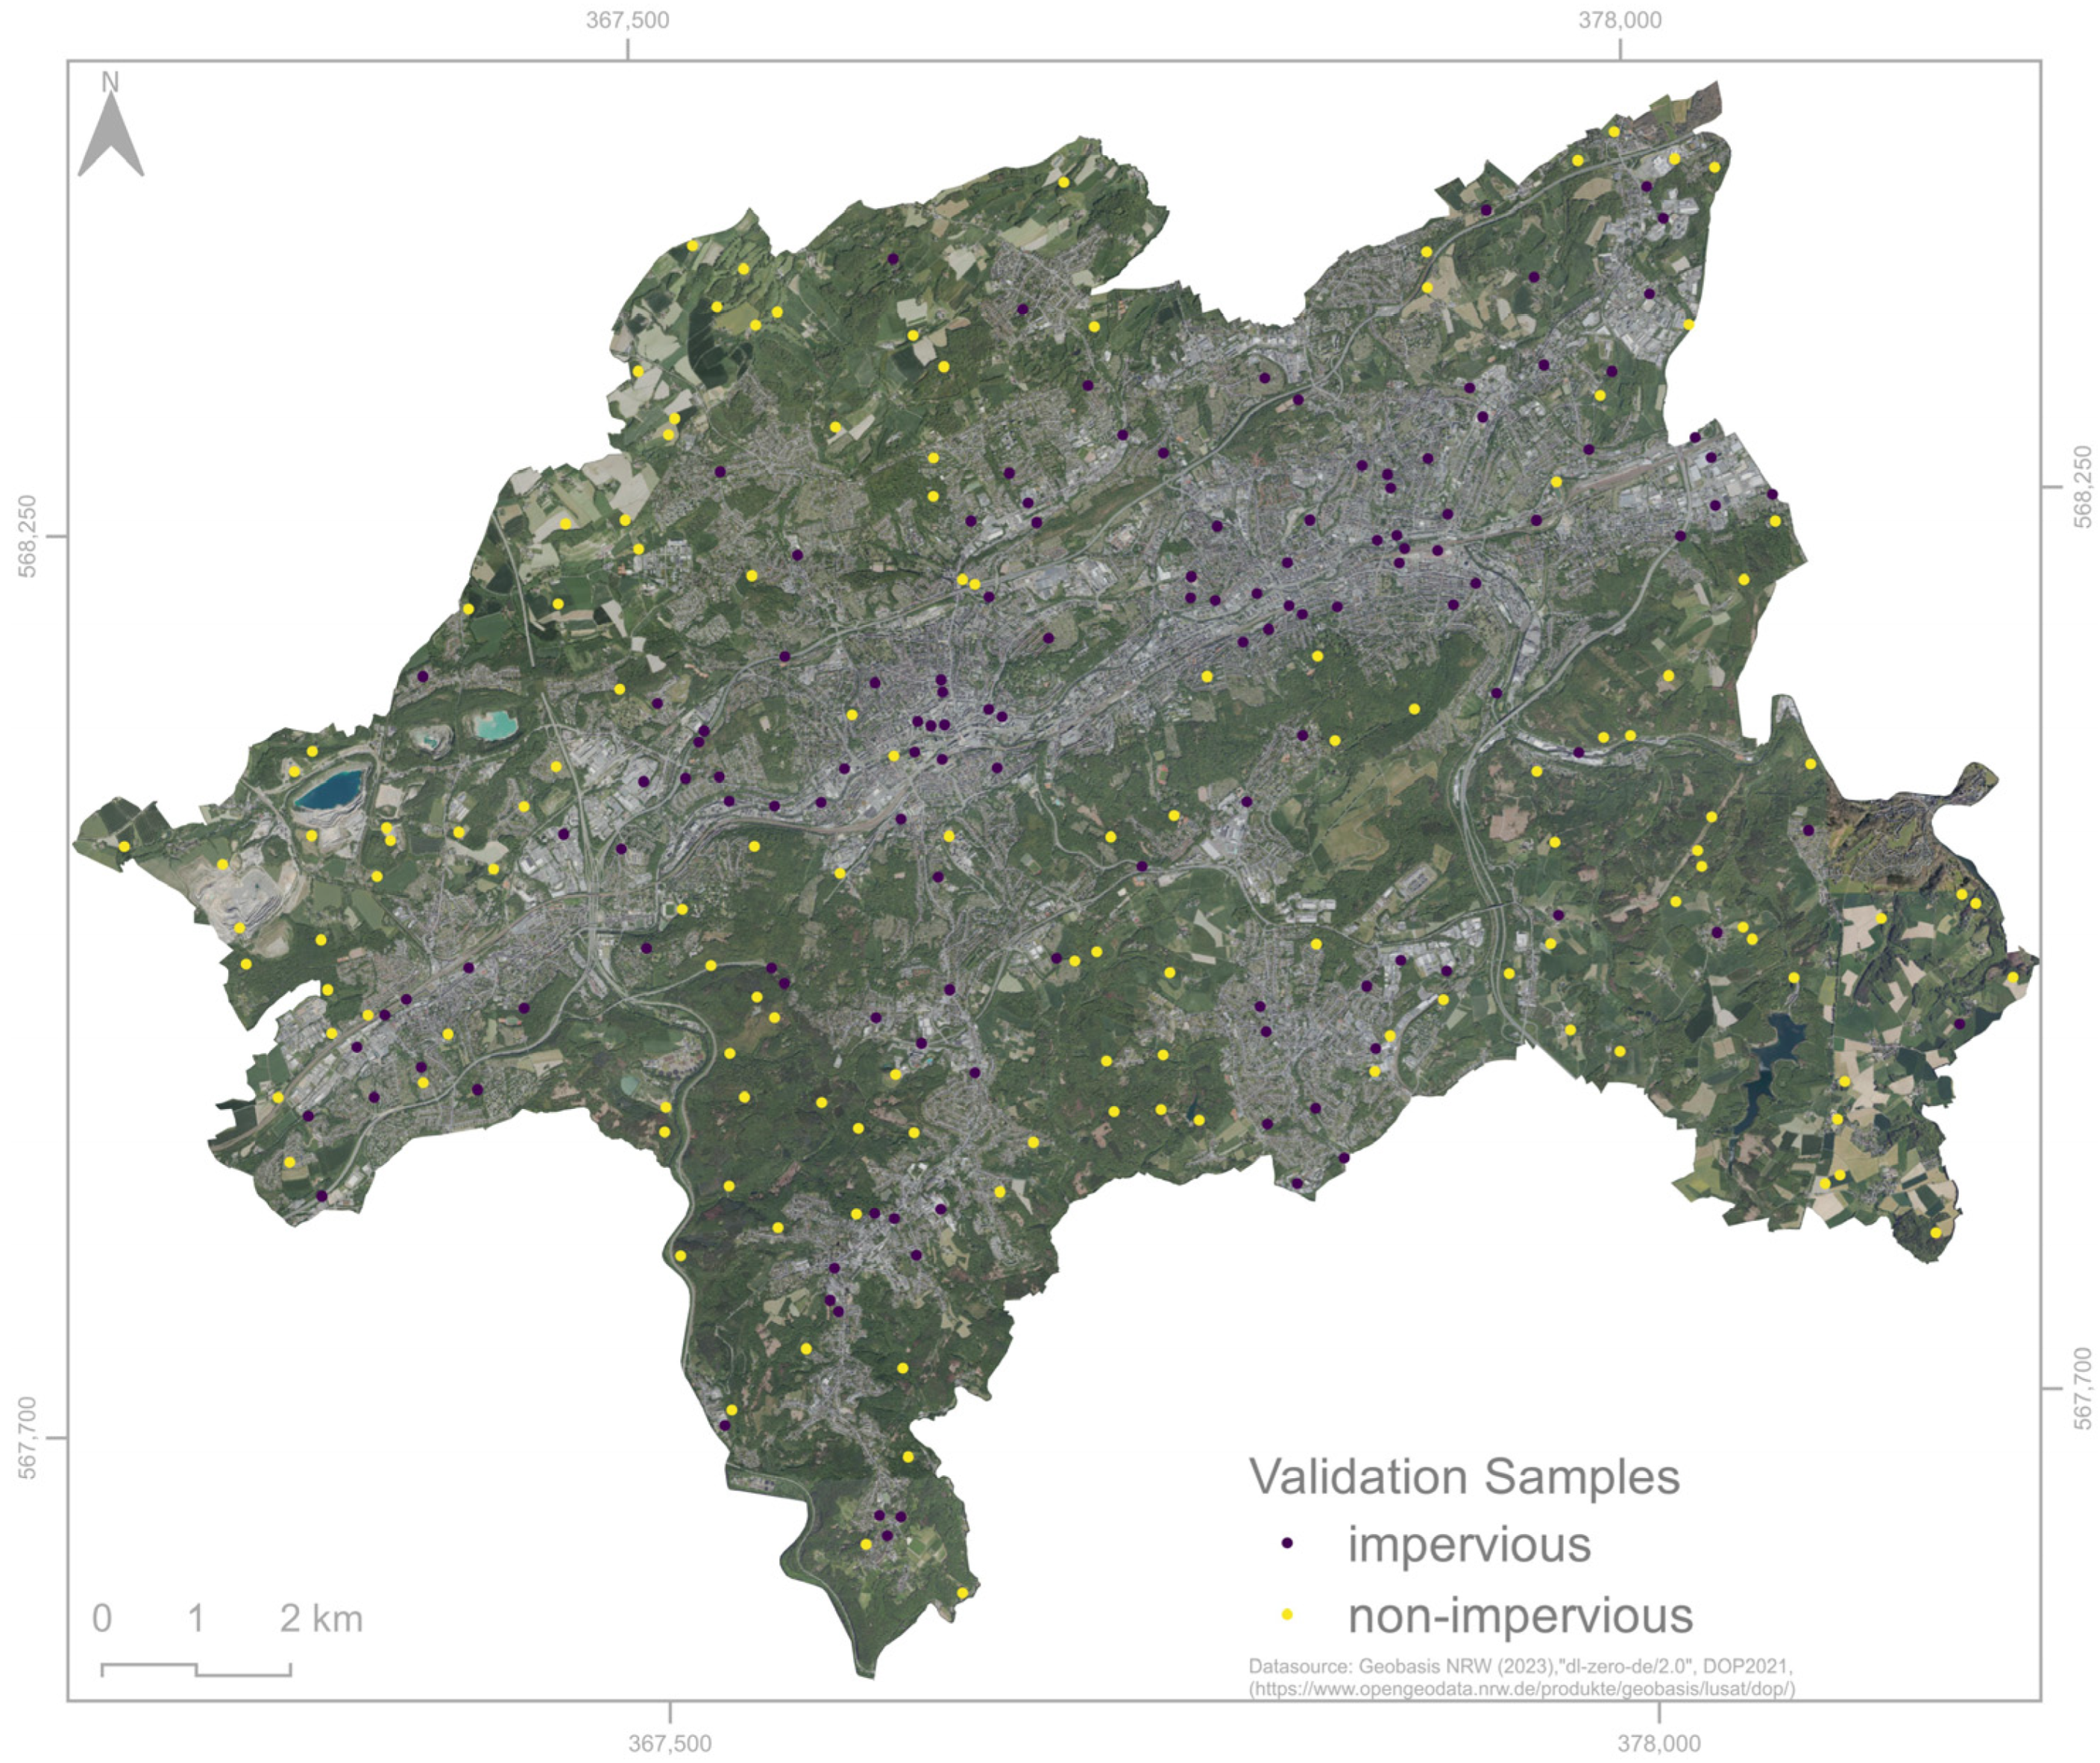
3.2.4. Accuracy Assessment

To evaluate the RF classification accuracy, we performed an AA using the confusion matrix method comparing validation samples with the respective results [63]. For the collection of validation samples, we buffered the training samples within a radius of 100 m to ensure independence between training and validation samples utilizing QGIS. Subsequently, we created 130 validation samples per class based on the RF classification result using a randomized stratified sampling approach. This corresponds to a split of 2/3 training and 1/3 validation samples as conducted in previous studies [29,38]. To ensure reliable validation samples, we visually inspected every sample for their ground-truth land cover class. As recommended by Kattenborn et al. [64], we performed this visual inspection based on the original very high-resolution TDOP (Section 2.2.1) providing a spatial resolution of 0.1 m. The distribution of validation samples is presented in Figure 5.
To quantitatively analyse the accuracy of the RF classification results, we determined the Producer’s Accuracy (PA), the User’s Accuracy (UA), the Overall Accuracy (OA) and the Kappa Coefficient (KC) [63].

3.3. Data Superimposition

Considering the AA of the RF classification result, we analysed areas of misclassifications. Based on this analysis, we selected ALKIS vector data to superimpose with the RF classification results refining the produced map for further applicational use. In this context, we considered ALKIS land use data due to its cadastral accuracy. Similar approaches were described by Schmidt and Barron [9], Yin et al. [33], and Wan et al. [35]. For this superimposition approach, we only used reasonable ALKIS data which could certainly be assumed to be pervious or impervious and which relevantly support the reduction of misclassifications preventing inconsistencies in the final output. For the data selection, we first detected misclassified validation points of the RF classification results and visually interpreted affected land use types. Based on these observations, we extracted auxiliary ALKIS land use object/value types. Subsequently, we rasterized this data as described in Section 2.2.3. To keep the binary classification design, the ALKIS data have previously been categorized into their corresponding classes.

4. Results

4.1. Results of the Proposed Methodology

The produced RF classification map of impervious surfaces within the study area (a) and the selected impervious and pervious object/value types of the rasterized ALKIS land use data are presented in Figure 6.
The result of the superimposition of the RF classification map and the ALKIS land use data is a 0.9 m spatially explicit map of the impervious surfaces in the study area (Figure 7). Considering the total area of Wuppertal, 25.26% of the land cover is classified as impervious surfaces that corresponds to an area of 42.54 km2. This value relates to a government-funded data product based on Sentinel-2 Copernicus data from 2020 (see Figure 1) that classified 42.47 km2 as built-up area [10,42].

4.2. Accuracy Assessment and Feature Importance

4.2.1. Accuracy Assessment of the Pixel-Based Random Forest Classification

The calculated confusion matrix of our classification result is shown in Table 4. The OA of the classification result was at a high level of 92.32%. This also was the case for the KC which had a value of 84.62%. Both PA and UA had the same accuracy levels for the “impervious” and “non-impervious” classes. Accordingly, the confusion matrix displays that in both classes the same number of misclassifications occurred.

4.2.2. Feature Importance

The feature importance calculated internally in the RF classifier in GEE is shown in Figure 8. It became clear that the spectral indices, specifically the PISI, were the most important features. These were followed by the elevation and the GLCM texture feature contrast of the blue band. The results showed that the GLCM texture features mean and contrast of the blue and NIR bands and their initial spectral bands were of moderate importance. On the other hand, the GLCM texture features contrast and mean of the red and green channels and their initial spectral bands had limited influence. Overall, the slope had the lowest impact on the classification result.

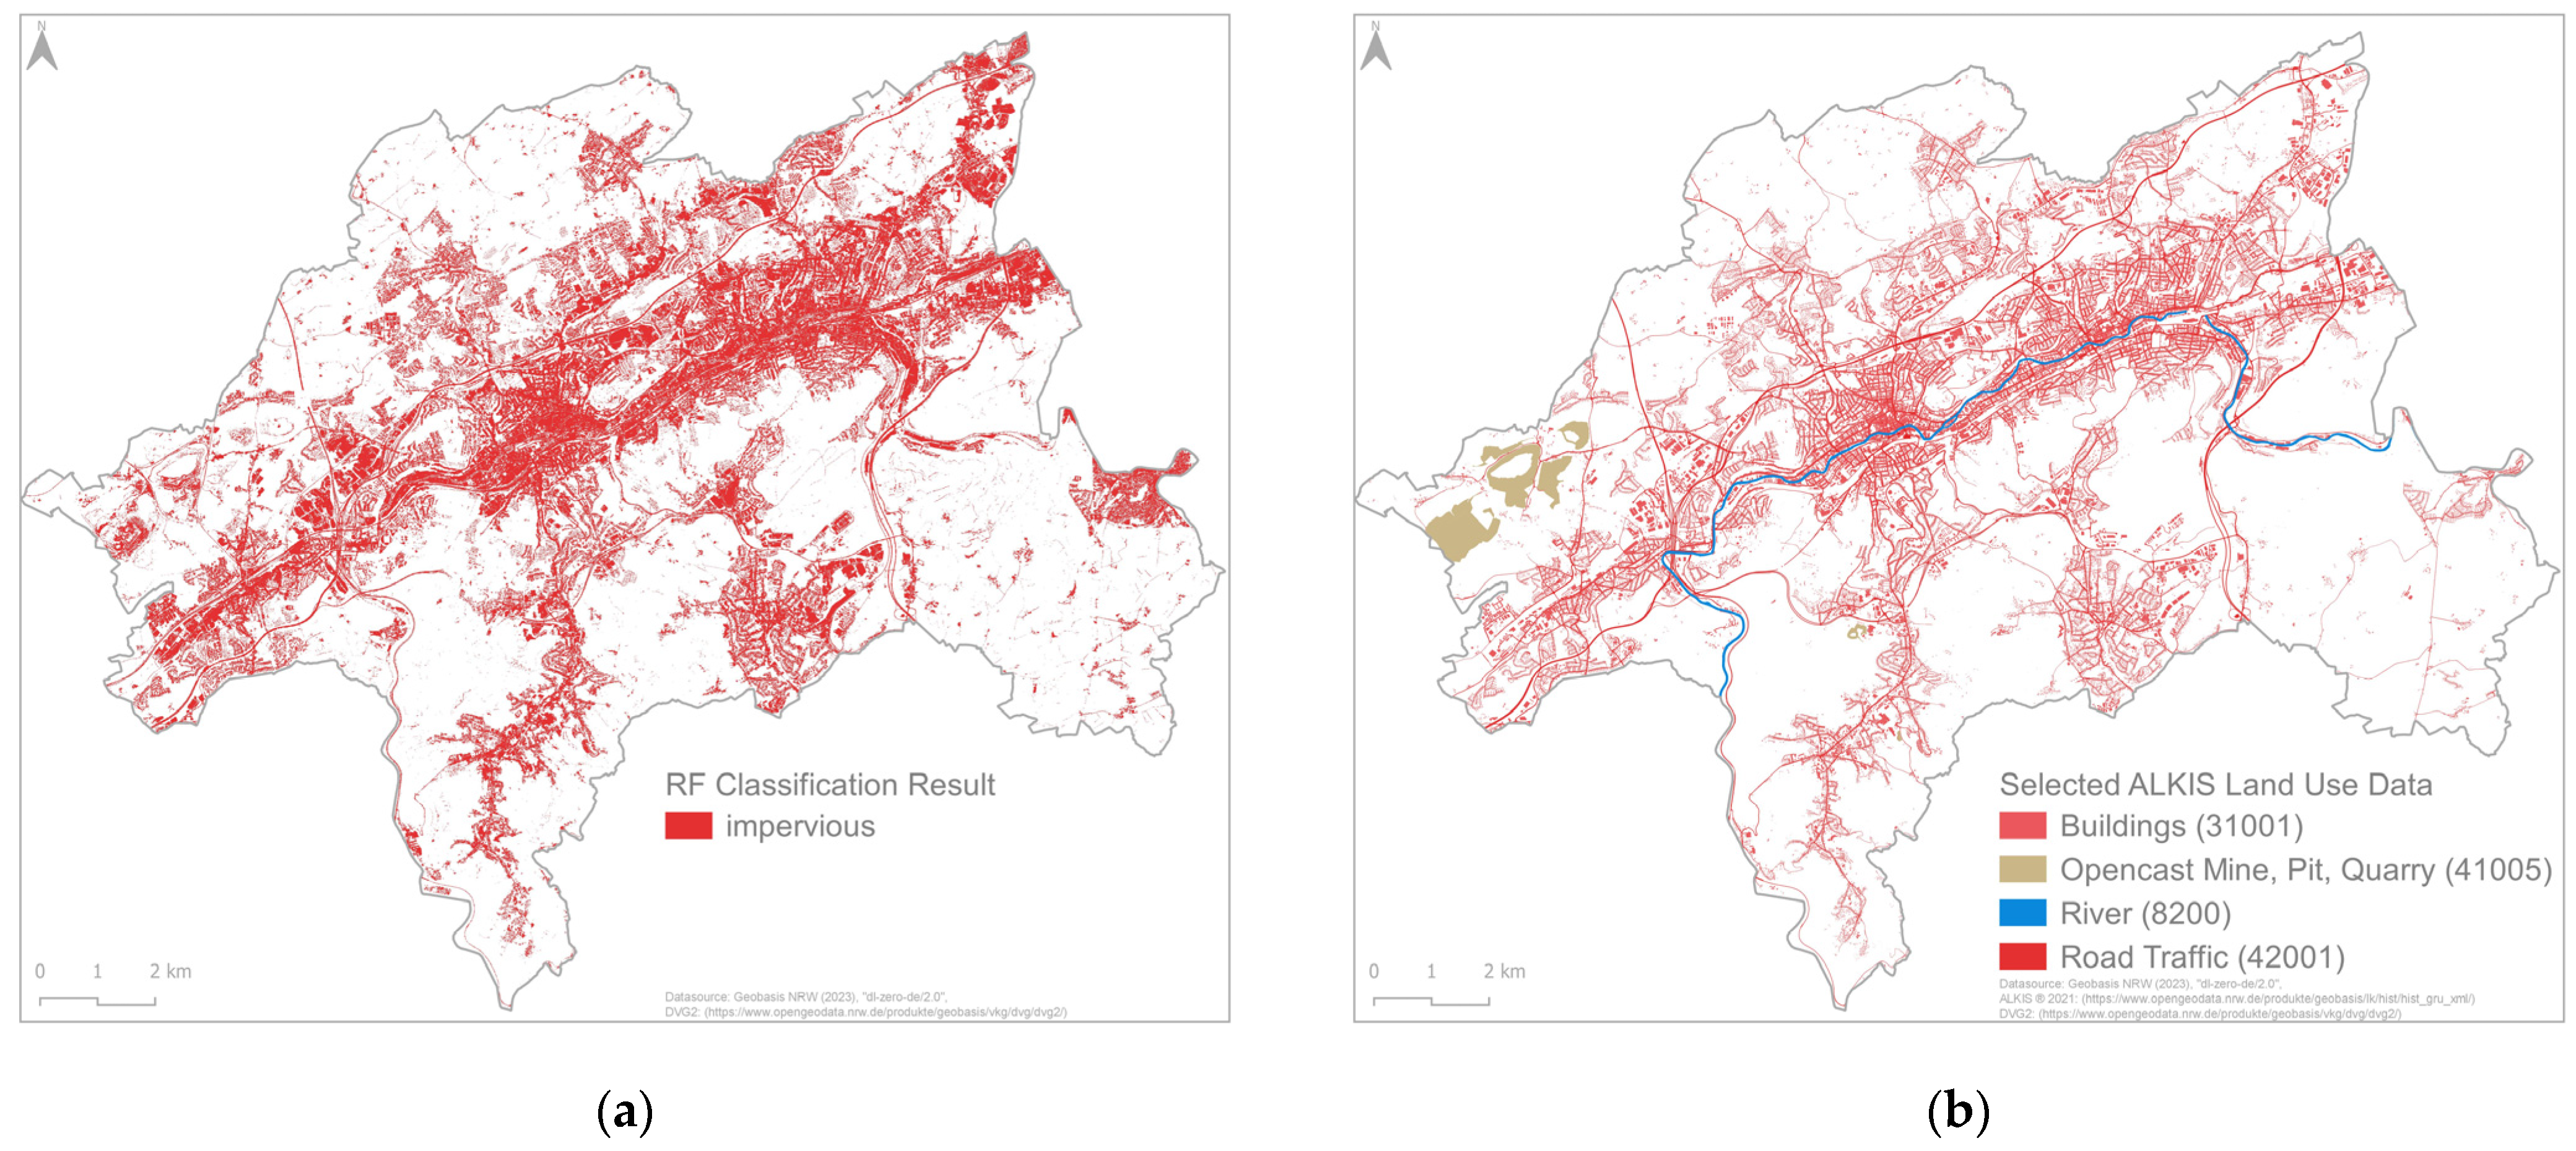
4.3. Data Superimposition

In addition to the performed AA of the RF classification results, we performed a visual analysis of misclassified validation samples. This analysis revealed that the quarry area, shaded and obscured areas, individual rooftops, dark appearing water, and civil engineering structures are the most decisive factors of over- or underestimation of impervious surfaces in the study area indicating the necessity of post-analysis steps. To optimize these influences retrospectively, we selected corresponding ALKIS land use data to superimpose with the RF classification results refining the produced map. Table 5 lists all areas that were determined in the AA in conjunction with the selected ALKIS object/value types for superimposition.

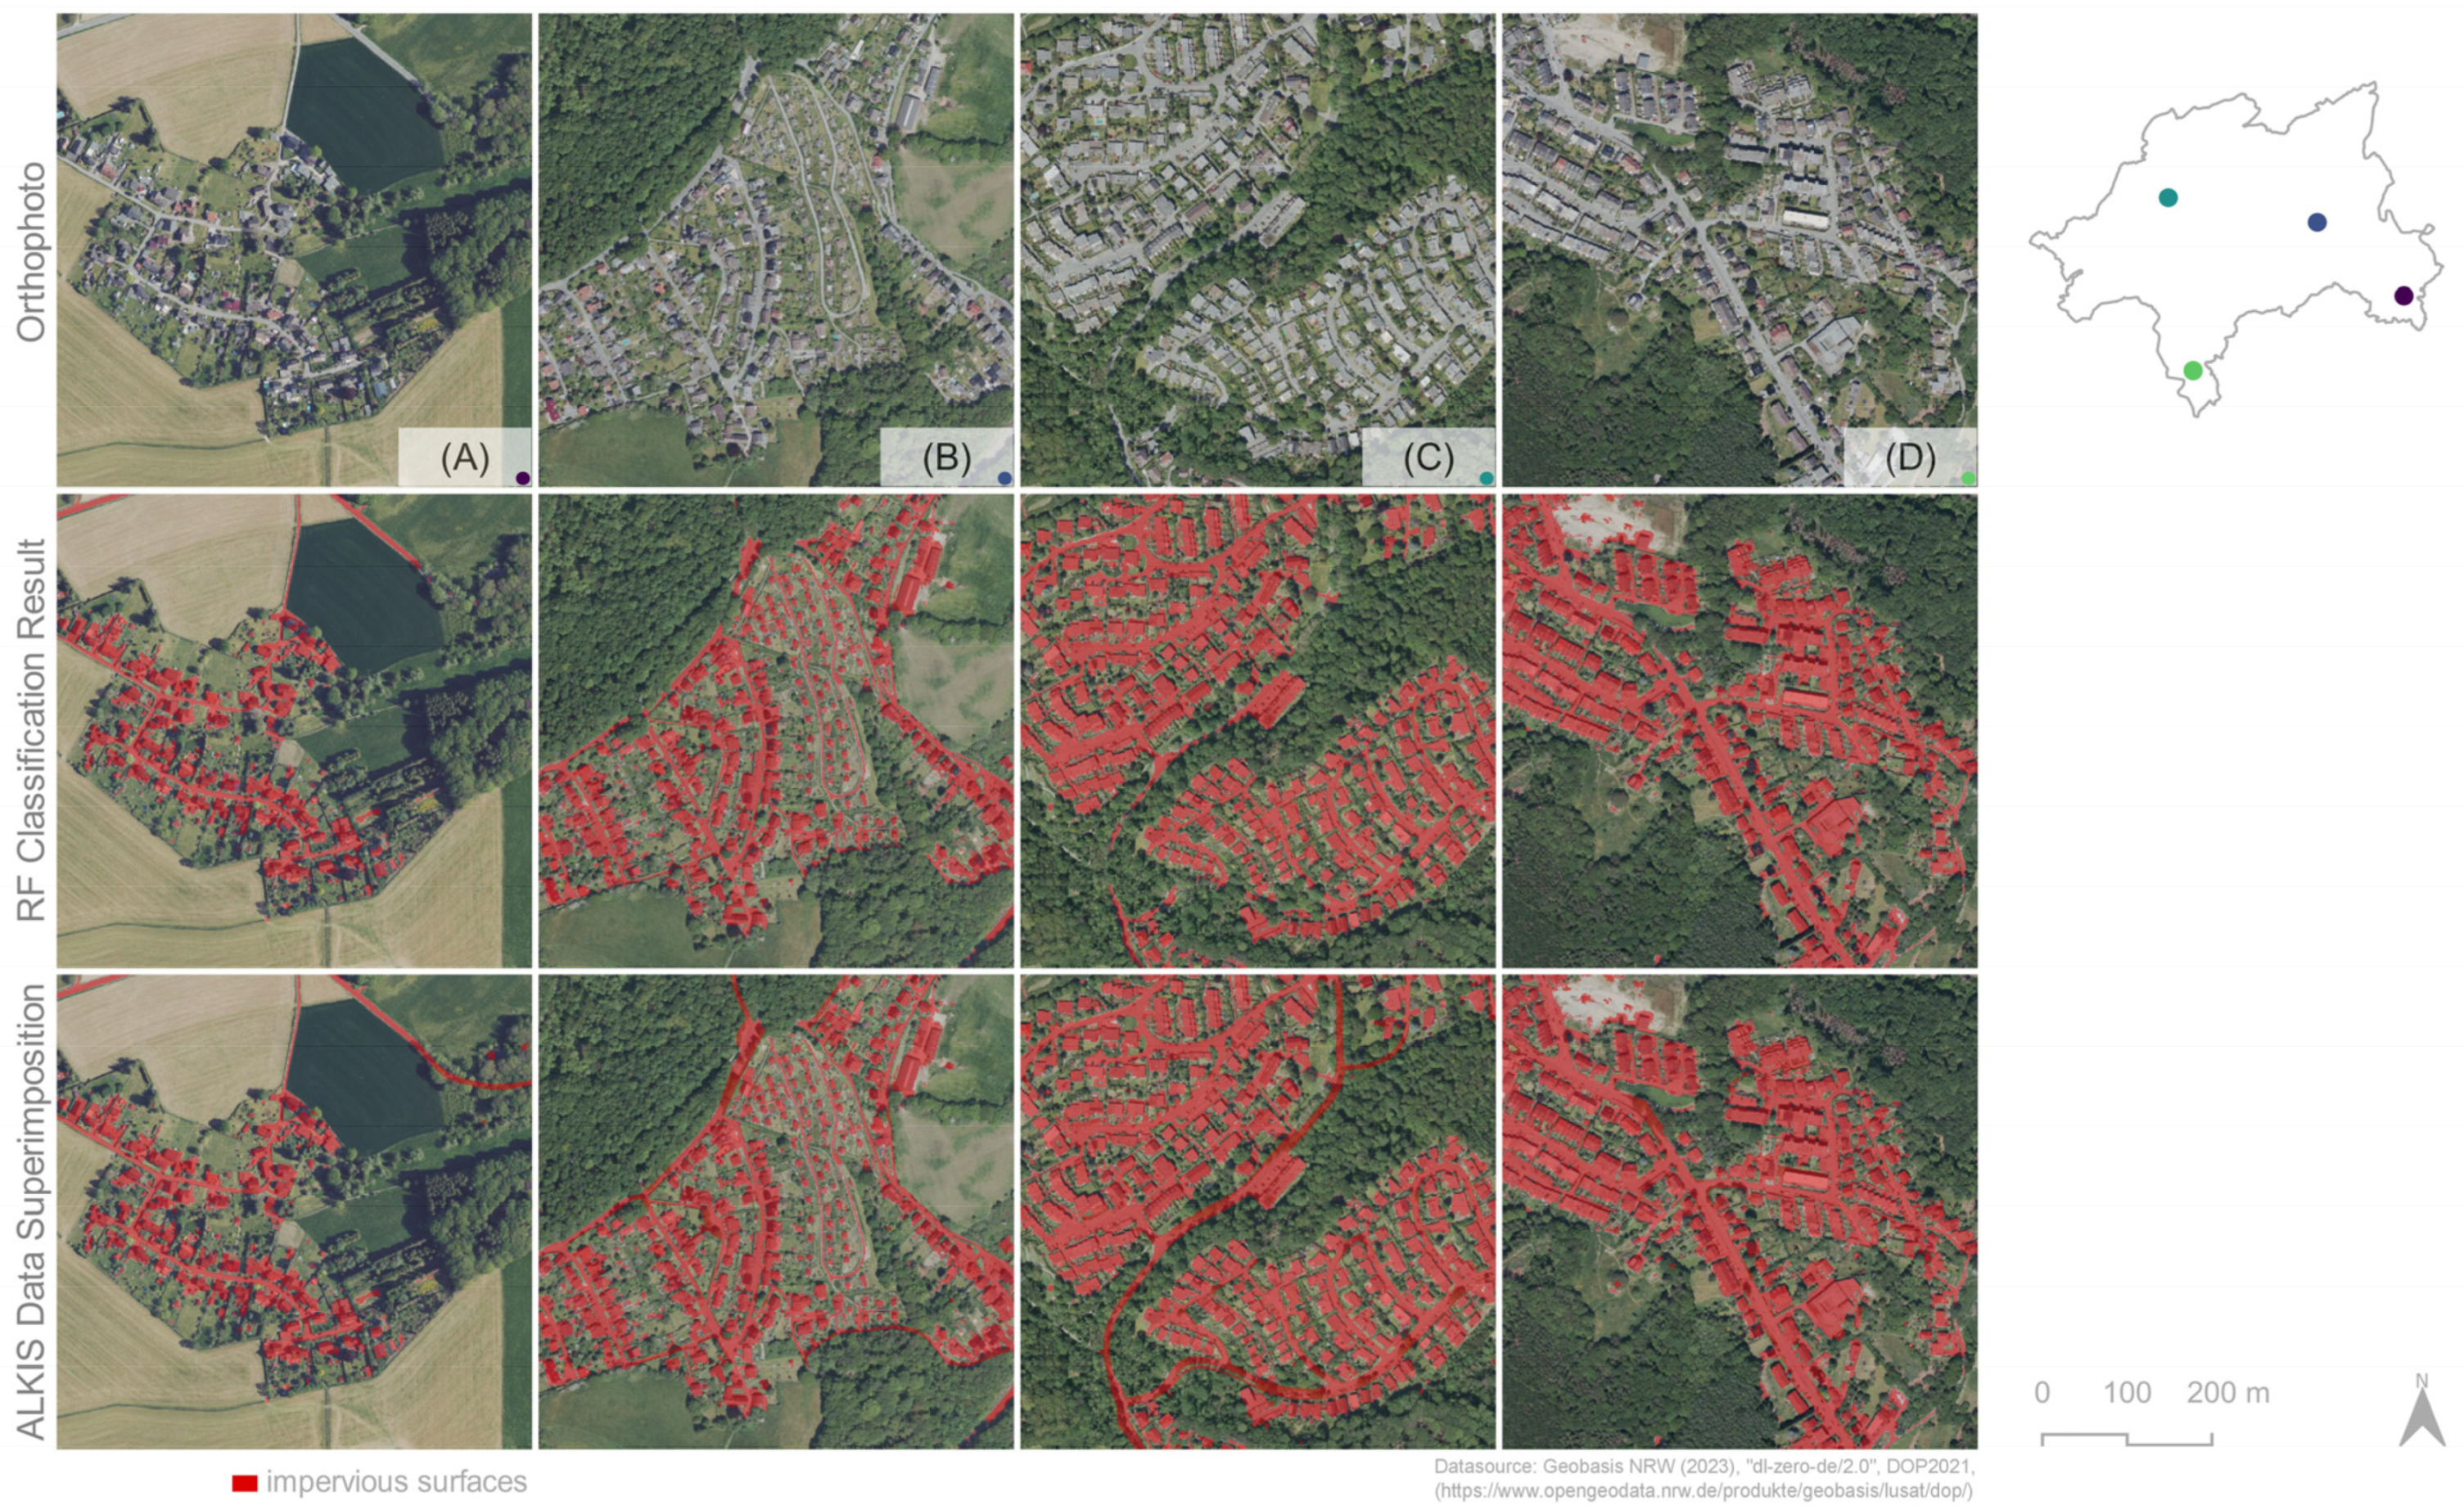
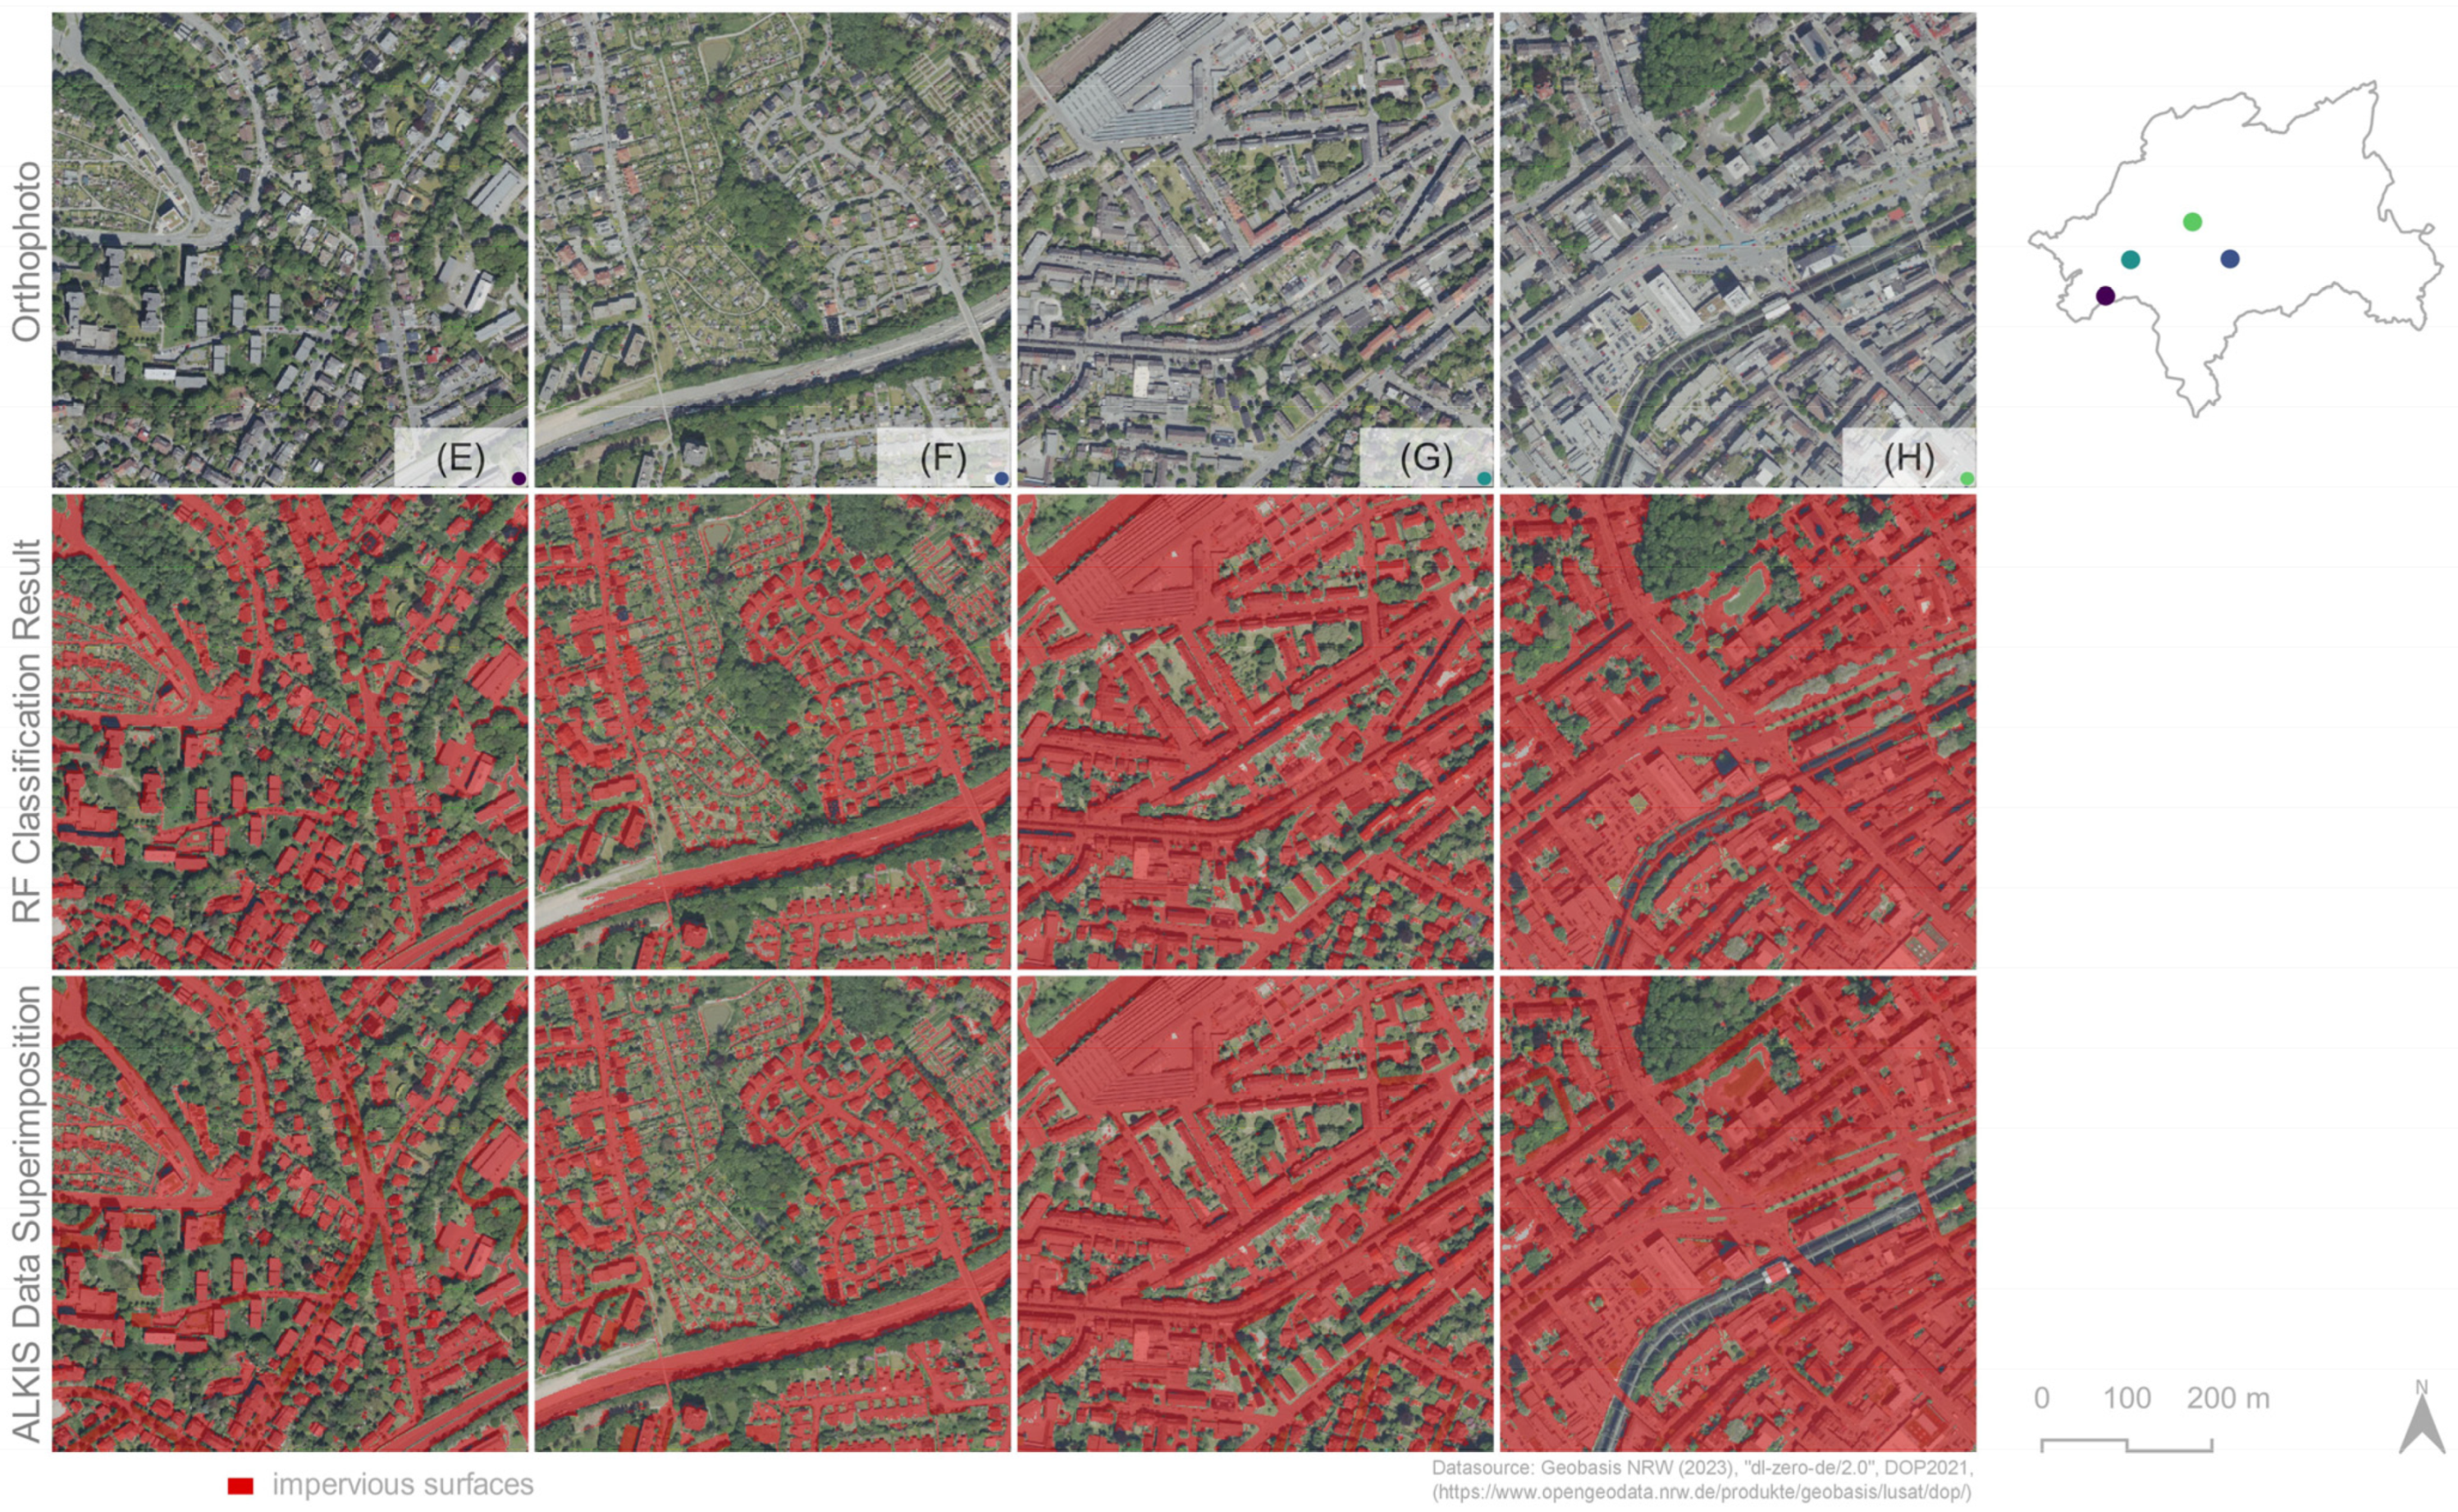
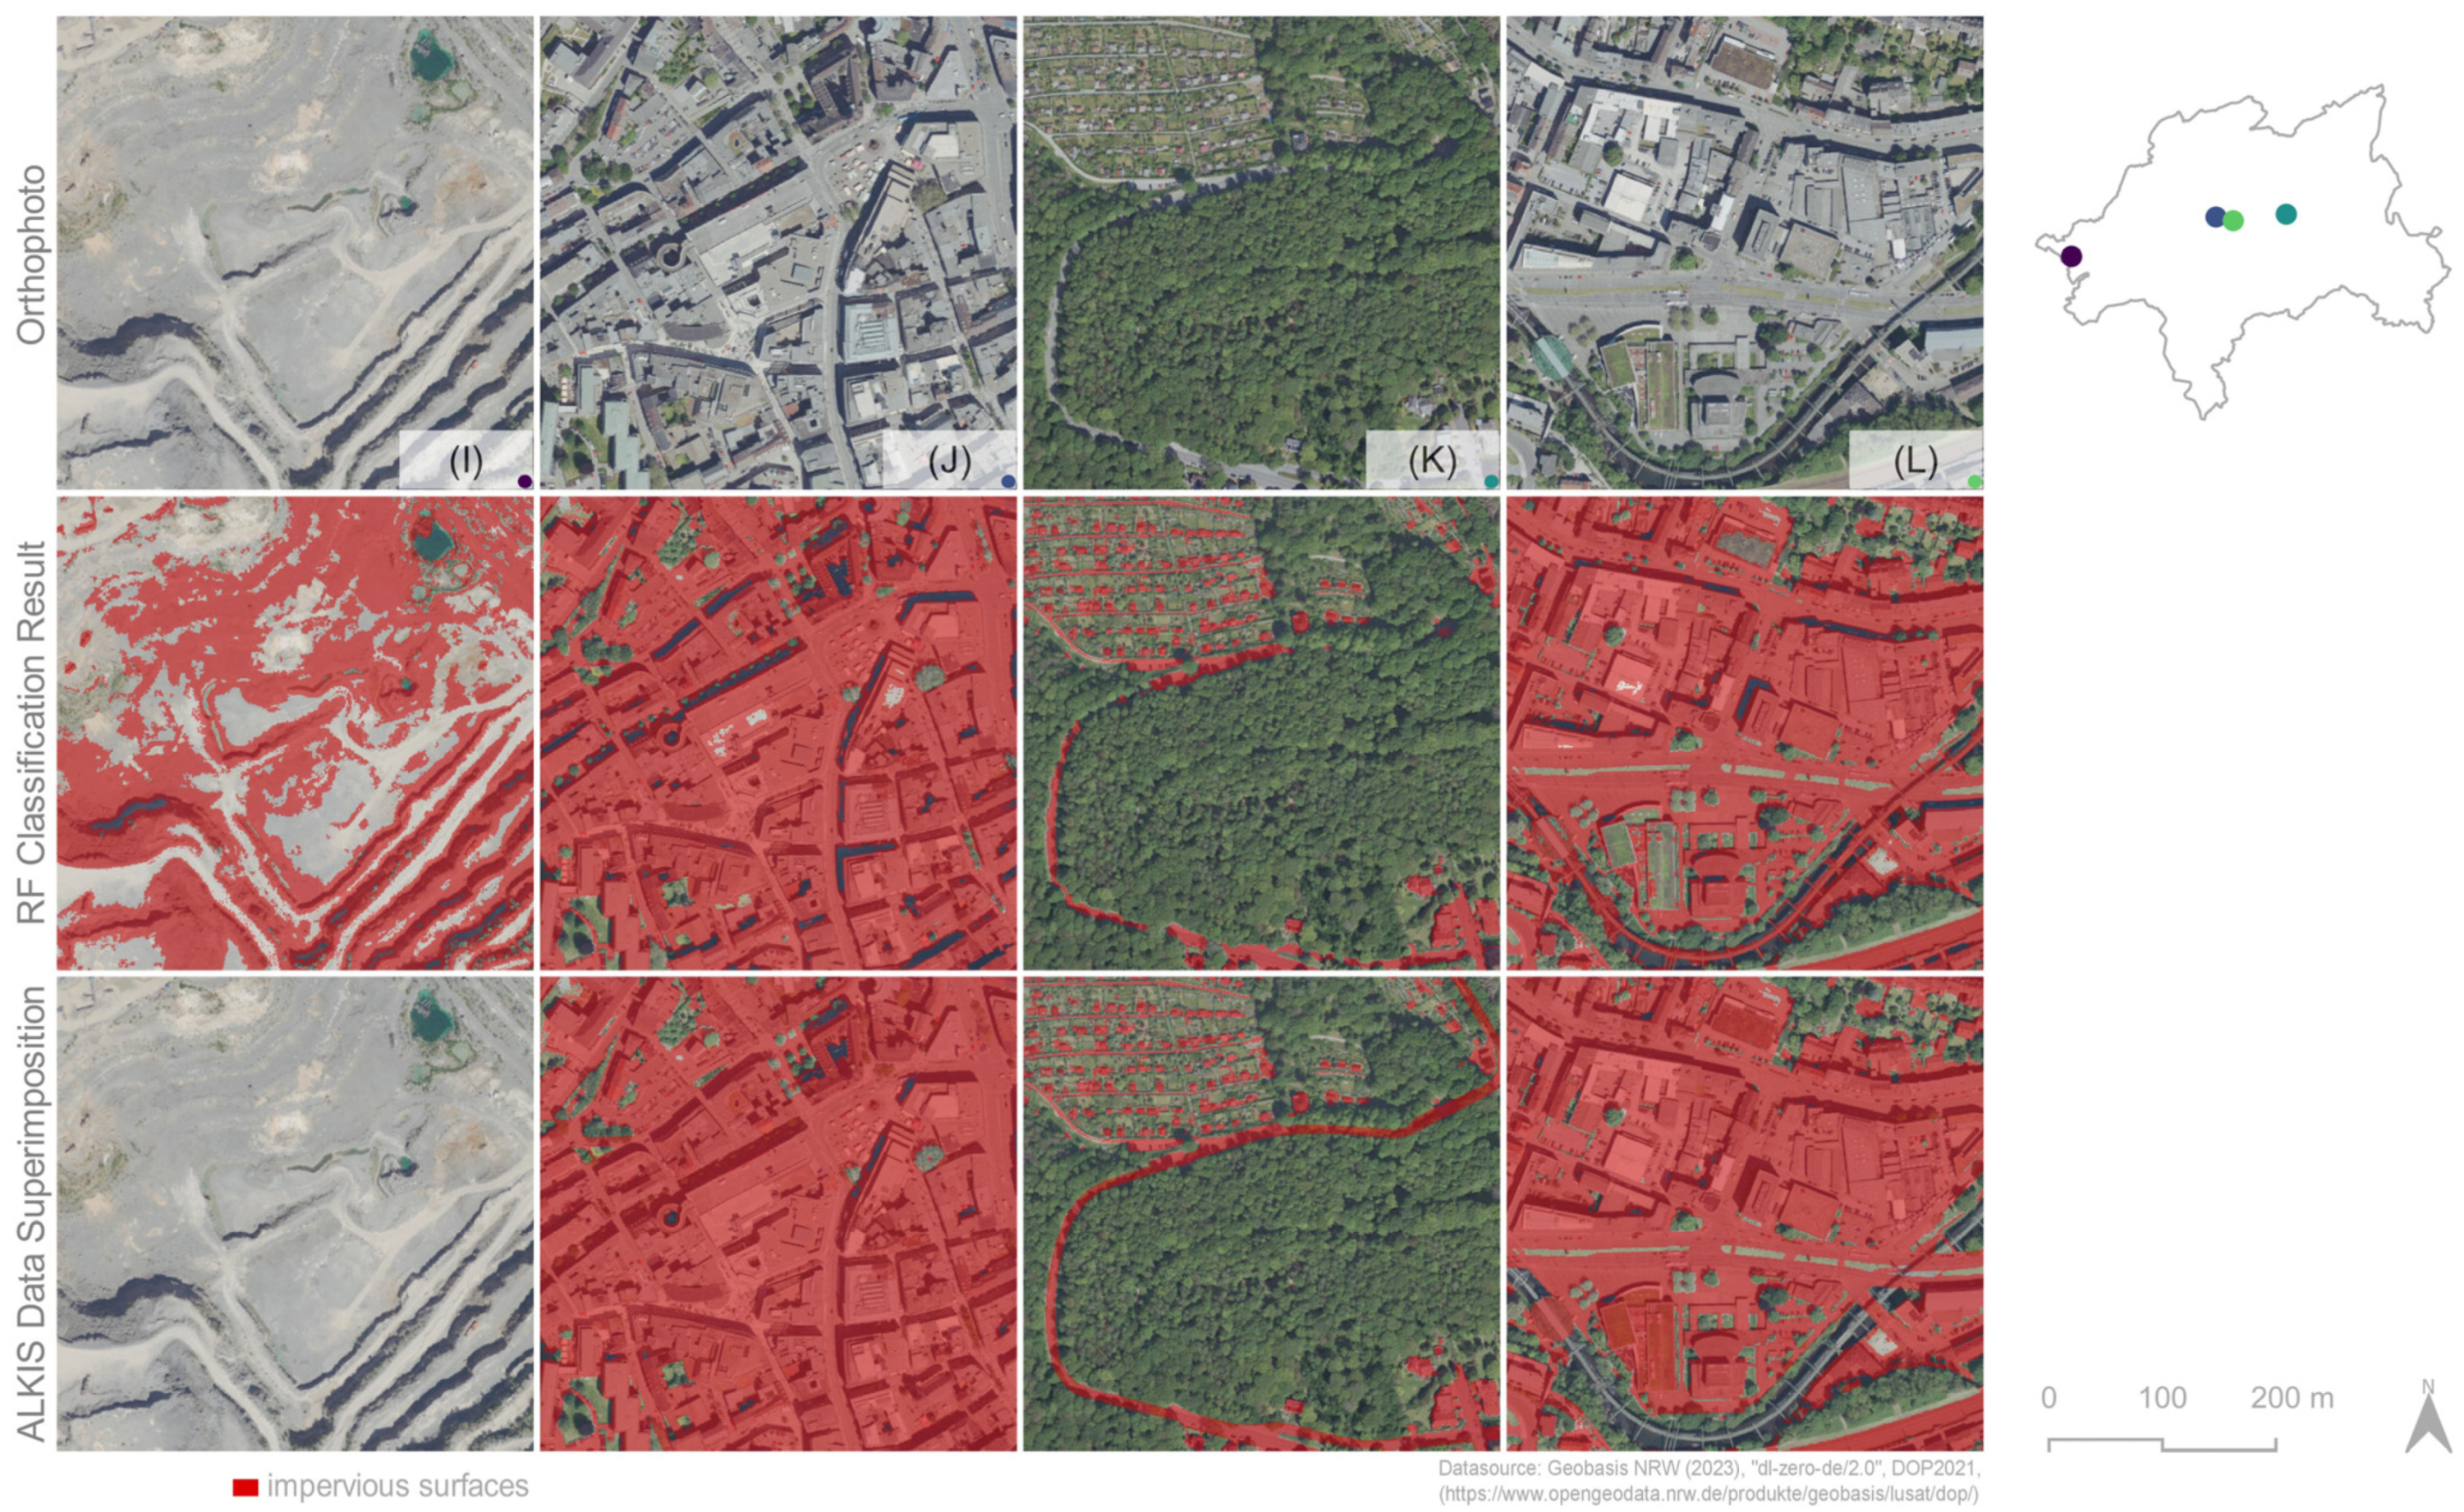
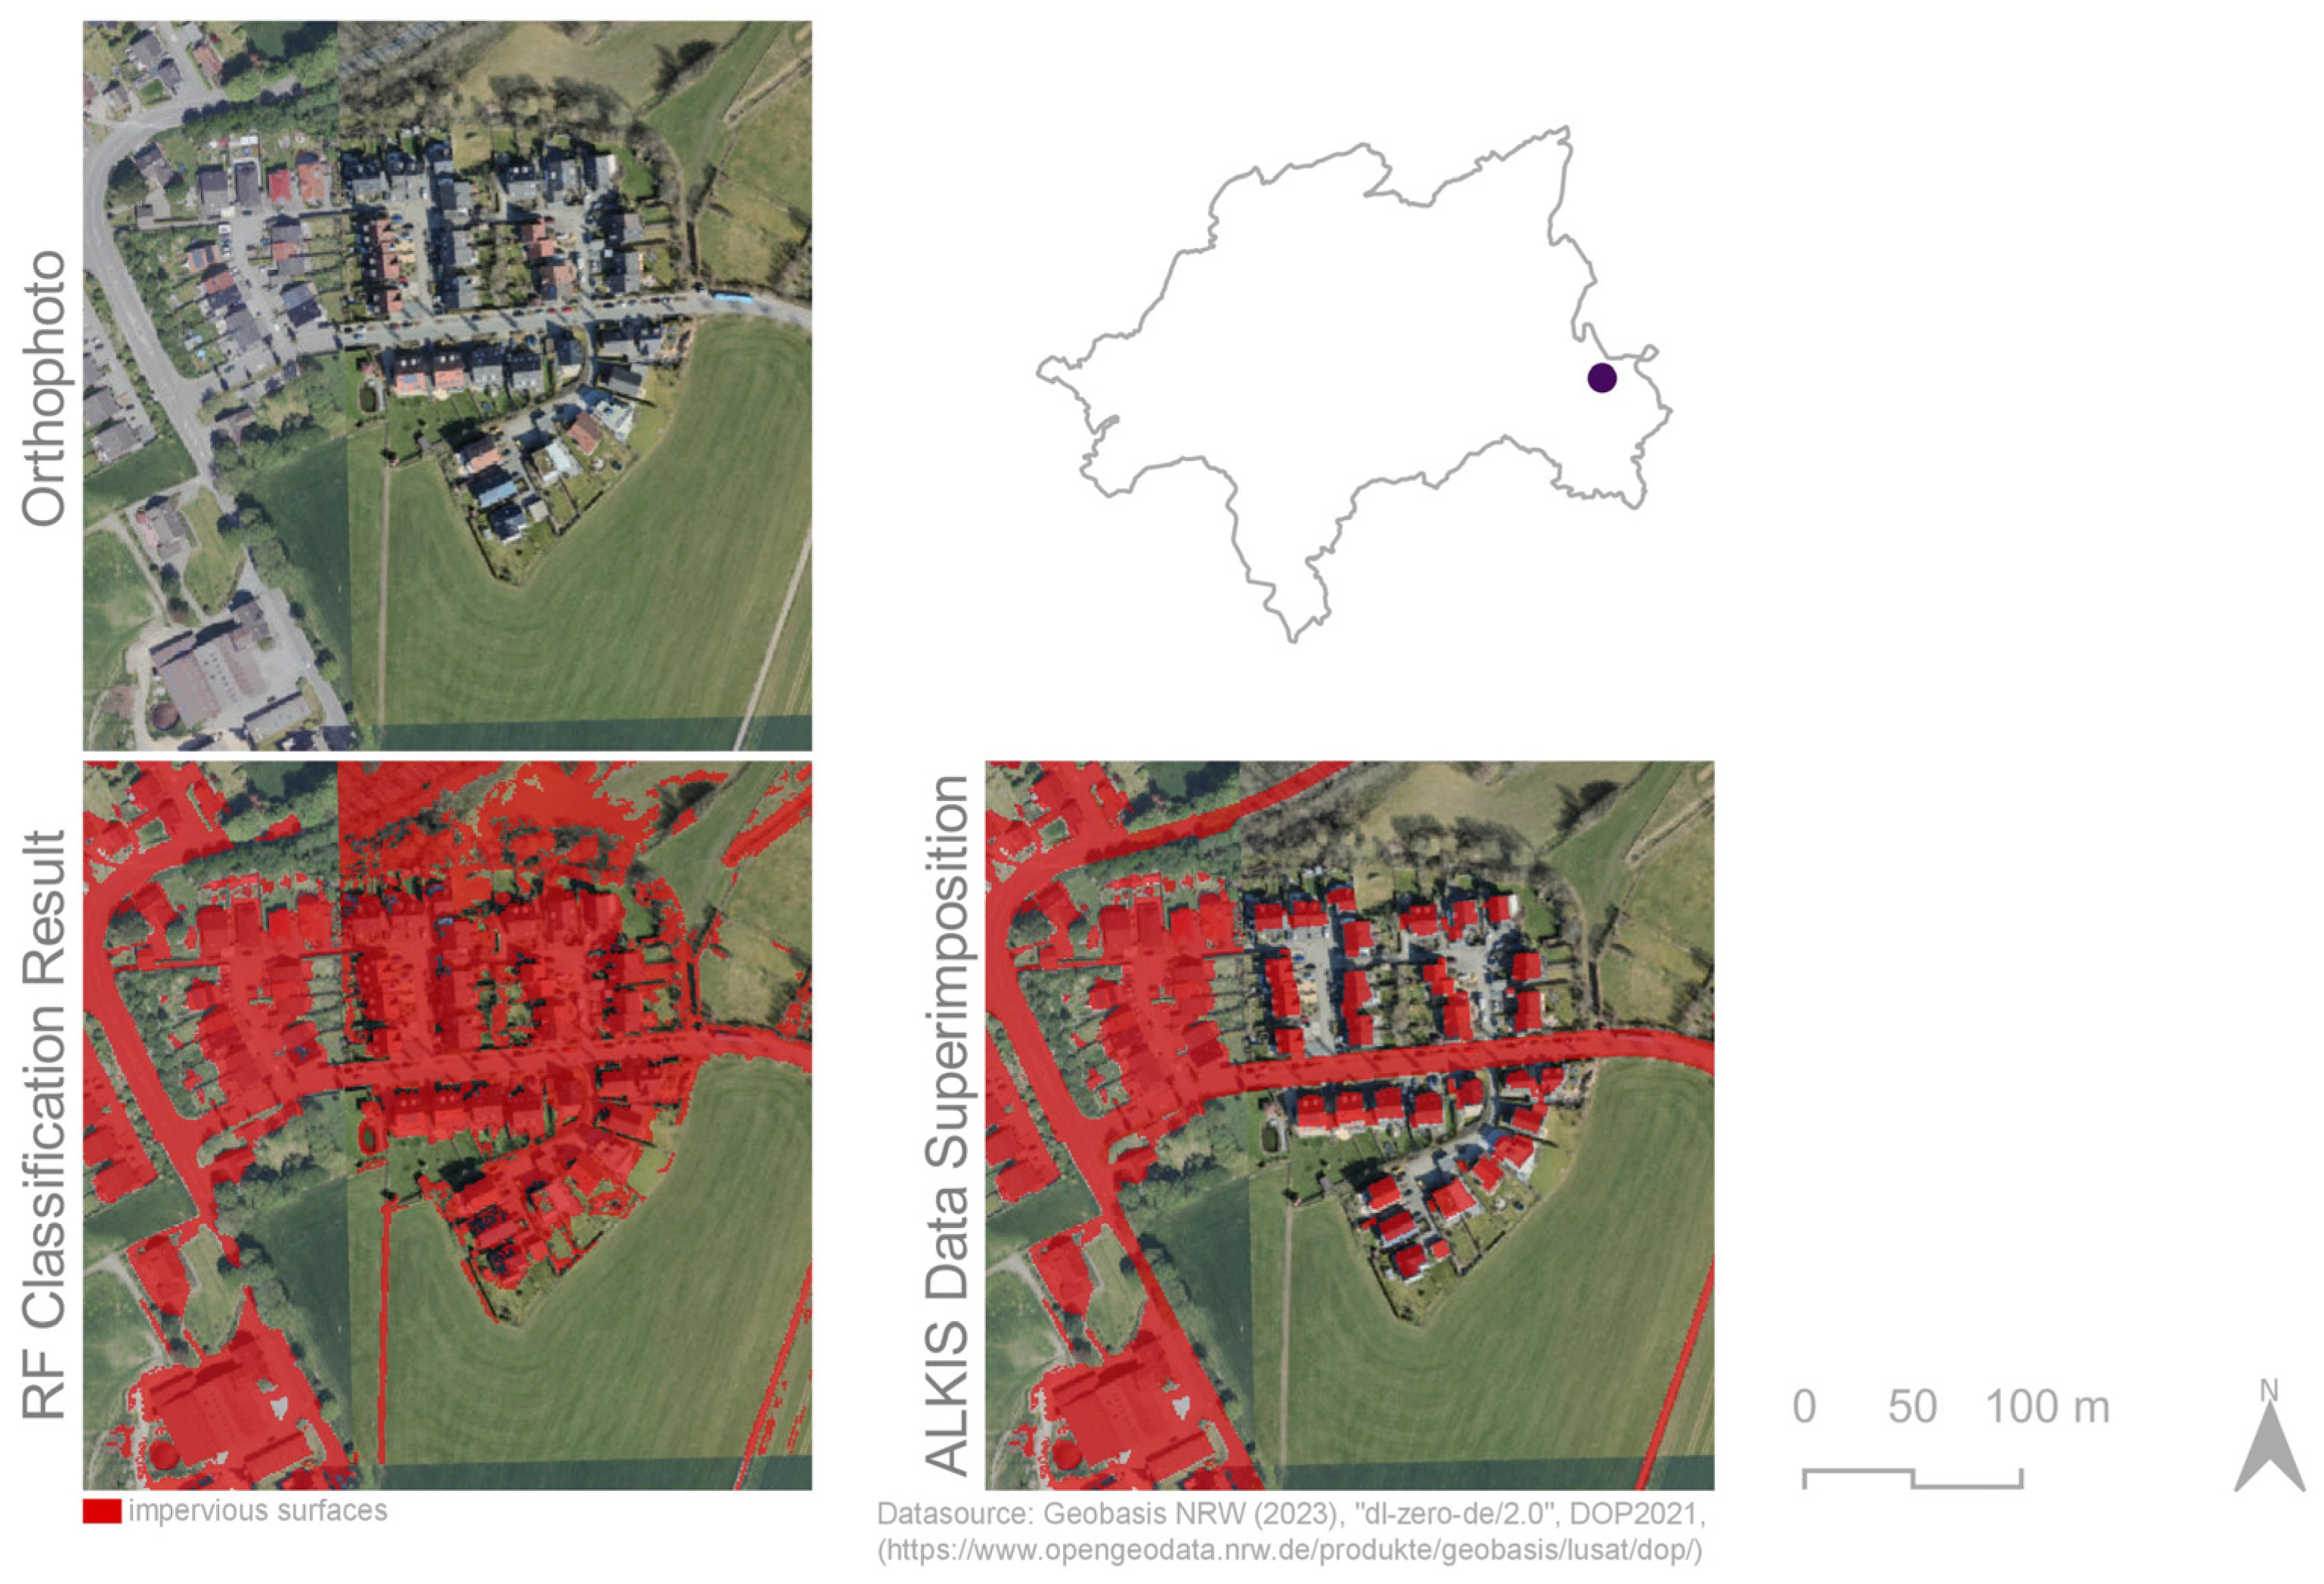
4.4. Visual Assessment of the Results

To further evaluate the accuracy of our method, we conducted an extensive visual analysis of our results in different spatial contexts. We have based our visual assessment on the categorization of urban to suburban settlement areas as specified by the city of Wuppertal [65]. In those categories, we visually compared the RF classification result and the ALKIS data superimposition result with the ground truth.
Figure 9 displays the results of the RF classification and data superimposition in suburban to semi-urban settlement areas. The RF classification result displays that small-scale impervious surface patterns such as isolated settlement areas (A) or allotments between settlement areas (B) were robustly mapped. This could also be observed in challenging heterogeneous residential areas (C,D). It became clear that the superimposition of the ALKIS data refined obscured roads, which were covered by tree canopies (A,C).
Figure 10 displays the RF classification and data superimposition in semi-urban to urban settlement areas. Impervious surfaces were also robustly mapped for residential, industrial, and urban areas. Allotments between residential areas (E,F) and high-density urban areas (G,H) were reliably replicated. It should be emphasized that roads, especially motorways and sharp-edged buildings have been captured with line definition. Nevertheless, shadows cast by buildings in urban areas (G,H) as well as in residential areas (E,F) influenced the RF classification results. Tree canopies and their shadows obstructed both settlement and traffic areas. The tree canopies in avenues played a significant role as they obscured the view on roads (A,E) almost entirely in multiple instances. The construction of the suspension railway, which was mapped as impervious, also obscured the view of the underlying Wupper river (H). Through the superimposition of the selected ALKIS data, these factors could be reliably reduced.

5. Discussion

As cities adapt to climate change, very high-resolution spatially explicit information about the distribution of impervious surfaces is crucial for urban planning and decision-making [12]. In this study, a methodology was developed that allows the detection of impervious surfaces with a spatial resolution of 0.9 m in GEE based on free governmental RS (TDOP, DEM, nDSM) and ground-based data (ALKIS land use data).

5.1. Classification Approach

In this study, we focused on creating a reproducible and low-cost method to map impervious surfaces on a local to regional scale, which could serve as a basis for further application and analysis purposes. Apart from the time needed to familiarize with GEE’s JavaScript programming interface, the proposed pixel-based method presents an alternative methodology to map impervious surfaces efficiently without fully relying on hardware restrictions.

5.1.1. Drivers of Inaccuracies in the Random Forest Classification Approach

As anticipated, pixel-based RF classification using the very high-resolution feature set has encountered challenges due to shaded or obscured impervious surfaces and high spectral variability. In addition, we have noticed further factors that lead to an over- or underestimation of impervious surfaces in the study area. The most decisive factors that occurred in the study area are quarry areas (I), shaded areas (J), obscured areas by tree canopy (K) or civil engineering structures, and green roofs (L) as represented in Figure 11.
The RF model was able to distinguish bare soil surfaces from impervious surfaces. Nevertheless, confusion appeared between impervious surfaces and especially gravel or crushed stone areas as well as sparsely vegetated forest areas in which bare soil surfaces stand out. This is exemplified in the quarry (I) in the west of our study area. Here, impervious surfaces were overestimated due to the high amount of gravel and crushed stone material. In very high-resolution images intra-class spectral variability increases [18], revealing the heterogeneity within similar land cover types. It becomes clear, that this heterogeneity was not captured representatively enough in the training data. Additionally, this confusion could be explained due to the spectral similarity of bare soil and impervious surfaces as Weng [25] described. Through the superimposition of ALKIS data referring to the quarry area this confusion between impervious surfaces and bare soil was expectedly reduced.
In urban areas of high shading (J), the RF model tended to underestimate impervious surfaces. Shadows obscured impervious surfaces and made the exact classification more difficult respectively impossible. This led to a decrease in the accuracy of the classification result. The literature describes that shaded areas are often assigned to water class [17,25], which explains occurred misclassifications in shaded areas. As described by Weng [25], RS images are prone to shadowing, especially in complex urban areas, which represents a general problem of this data and thus requires the development of specific methods for the extraction of shaded areas as Zhou et al. [66] proposed. Additionally, the use of TDOP taken in the summer period led to an underestimation of impervious surfaces due to dense tree canopies (K). The tree canopies led (1) to the direct masking of sealed surfaces and (2) to indirect masking through shadows, which has already been discussed in Weng [25]. Therefore, the consideration of TDOPs taken in the spring season could be considered due to the absence of leafy tree canopies. It should be noted that this absence of leafy tree canopies increases the proportion of bare soil areas and could lead to greater spectral confusion with impervious surfaces, which could be addressed in future work. However, the superimposition of ALKIS road information could effectively reduce shadow and tree canopy influences since the affected areas mostly occurred in settlement and traffic areas.
In the study area, a diverse range of rooftops (L) was present in the settlement areas. For instance, green roofs led to confusion between impervious surfaces with vegetation, as Schmidt and Barron [9] have discussed. In our study area, blue-appearing rooftops also led to confusion. Lu et al. [17] described that dark rooftops with low spectral signatures are often confused with water, which underlines our observation. Moreover, as discussed by Fang et al. [67], variations in the direction in which rooftops were illuminated by the sun, emphasized spectral variations within the same objects, and thus contributed to the underestimation of impervious surfaces. These underestimations could further be reduced with the superimposition of ALKIS building data.
Another factor for overestimations of impervious surfaces was civil engineering structures, specifically, the construction of the suspension railway (L) located directly above the Wupper river. This steel construction that is detached from the ground was classified as an impervious surface. Other than bridges, this construction was not comparable to impervious surfaces. Thus, we did not consider this construction as impervious surfaces. Despite the use of the NDWI and training data, which included the spectral signature of the Wupper river, misclassifications occurred in the classification result. This could be explained by the low NDWI values for the Wupper river and the high correlation of the GLCM texture feature mean with the original spectral information as Figure 12 indicates. Here, the Wupper river shows similarities with impervious surfaces, especially in the NIR band.
In this context, the following specific steps are suggested to further improve the classification approach. First, it would be useful to optimise the semi-automated process for extracting training data to cope with the heterogeneity of the land cover in the study area. Moreover, an augmentation of the land cover types considered for the data extraction would be appropriate to tackle the intra-class variability of land cover types more sufficiently. Furthermore, the change to an object-based classification method could tackle intra-class variability more appropriately [25]. However, this requires more sophisticated RS knowledge, especially in GEE. Additionally, other methods could be considered using GEE such as SVM in comparison to RF or linear spectral unmixing as Yang and He [14] described for the high-resolution mapping of impervious surface based on WorldView-3 images.

5.1.2. Challenges in the Application within City Boundaries

The proposed method is based on the utilization of TDOPs, which are updated every two years for NRW. It is worth mentioning that NRW is surveyed during both summer and spring, however, the federal state is surveyed asynchronously [43]. As a result, summer and spring images can overlap when observing city boundaries. In the case of Wuppertal, there was minimal overlap in the northern and eastern regions of the city. To address this issue, we only used summer images to train our RF model. In this regard, it was predictable that the model would produce incorrect classifications in the overlapping regions, primarily due to areas of leafless forests (Figure 13). Additionally, we only considered validation data in the summer images to produce a consistent accuracy assessment. To ensure a reliable output, we excluded the overlapping regions from the RF classification results, and instead, we superimposed only the ALKIS object types “road traffic” and “buildings” to represent impervious surfaces in these areas. Therefore, impervious surfaces were underestimated in overlapping areas.
Therefore, in future applications of this methodology, we do not recommend an area-based analysis, but rather a consideration of surveyed aerial image tiles. In this way, separate consideration of summer and spring TDOP can be ensured. In this regard, further research should evaluate our methodology using spring TDOP, where significant confusion with bare soil arises.

5.1.3. Usage of Multi-Features

The results are consistent with the RF classifier having the ability to successfully classify multi-source RS data [61] even in the case of correlation of multiple features [60]. Even though we used only 18 features for the RF classification, feature redundancies might not have been excluded [29]. However, to enhance the performance of our approach, it would be advisable to implement feature selection methods [29], particularly when expanding the feature space. For instance, this could be helpful when performing a complex texture analysis considering all available texture features in GEE.
By analysing the feature importance of all input features, we can conclude that in our study the most important features were the spectral indices, the elevation and the GLCM texture feature contrast of the blue band. Less important were the red and green spectral bands, their GLCM texture features and the slope.
Being the most important feature, the PISI already provided promising results, e.g., when used with Landsat 8 data [24] and multi-seasonal Sentinel-2 data [52]. Tian et al. [24] indicated that the maximum difference in reflectance between the NIR and blue bands exists for impervious surfaces, soil, and vegetation. Accordingly, the red and green spectral channels had a smaller influence on the result. Additionally, the combination of vegetation indices (NDVI, SAVI) and built-up indices (PISI) was beneficial, considering the negative correlation between built-up area and vegetation in the NIR band as discussed in Lu and Weng [49]. Since the study area was characterized by impervious surfaces and vegetation areas, the order of the resulting feature importance is consistent. These characteristics of the study area coincide with the importance of the GLCM texture feature contrast of the blue and NIR bands. As Hall-Beyer [26] highlighted, the contrast texture feature is useful in the presence of edge-like features. Regarding elevated objects such as trees or buildings, the importance of elevation is consistent. But, contrary to the findings of Chen et al. [54], the elevation did not have the greatest influence on the result. Being the least important feature, we can conclude that the slope was not decisive in the study area. This does not coincide with the findings of Verde et al. [20], who, however, considered a topographically more diverse study area.

5.1.4. Limitations in Further Applications

Our method employs the use of the GEE platform, which was specifically designed for the processing and analysis of large-scale geospatial data [37]. GEE offers a comprehensive data catalogue that contains a wide range of datasets. However, it is essential to highlight that our method relies on the utilization of external data sources that are not included in this data catalogue. It should be noted that the (free) GEE standard account only provides 10 GB of storage space for data import [68]. This also affects data export, which is dependent on the Google Drive standard account’s data storage capacity of 15 GB [69]. In addition, as the spatial resolution increases, the amount of data that needs to be processed also increases, requiring more storage capacity. Taking these limitations into account, we suggest that the proposed method be used at the local municipal to the regional level.
This study was conducted using the free data infrastructure provided by NRW. The applicability of this methodology beyond the borders of NRW would therefore require the availability of CIR TDOP, topographic information and ground-based real estate and cadastral information as data sources. Outside of Germany, the ALKIS data could be substituted e.g., by OSM, which has already been used in combination with very high-resolution images by Wan et al. [35].
Despite these limitations, our method yielded promising results for very high-resolution, yet efficient detection of impervious surfaces in the study area. These results suggest that GEE can be a viable alternative for providing such data on a local to regional level. It is important to consider the limitations discussed when applying this method in other regions or areas.

5.2. Selective ALKIS Data Fusion

The limited spectral resolution (R, G, B, NIR) and temporal resolution (updated every 2 years) of the TDOP used, as well as the problems of high-resolution images previously discussed, required additional steps to ensure the applicability of the impervious surface map for future use. To address these limitations, we superimposed selected ALKIS land use data with the results of the RS-based RF classification due to its cadastre accuracy.
It became clear that the fine spatial detail of the TDOP emphasized the heterogeneity in the study area mainly leading to misclassifications in shaded/obscured areas and within same land cover types. Considering the visual assessment, we can conclude that additional ground-based information refined our classification result which coincides with the findings of Wan et al. [35]. For this, only ground-based data which can exclusively be assumed impervious or pervious should be considered. Specifically, this could not be assumed for a large portion of the ALKIS land use data.
In this study, the ALKIS object type “road traffic” was particularly useful as it allowed the reduction of issues arising from shaded and obscured impervious surfaces that mostly appeared at buildings and avenues. This coincides with the results of Schmidt and Barron [9] and Wan et al. [35]. To further improve our results, one option would be to incorporate additional green cadastre data and remove roadside greenery from the ALKIS road network as conducted by Schmidt and Barron [9].
However, as Yin et al. [33] described, these data fusion approaches are highly dependent on data quality and timeliness. In this regard, Figure 14 serves as an example of this statement in the case of the ALKIS data used. Whilst combining both data sources, we discovered that in the ALKIS dataset, small buildings are sparsely captured (M) and building information revealed an actuality gap (N), although we used actual datasets.
This presence of data and actuality gaps in the fused ALKIS data could lead to inconsistencies and inaccuracies in the results. Therefore, for further application of this approach, it is crucial to thoroughly inspect the fused dataset and ensure temporal consistency before utilizing it for analysis.

6. Conclusions

The impacts of impervious surfaces on our environment are manifold [3]. As cities adapt to climate change spatially explicit very high-resolution information about the distribution of impervious surfaces is becoming increasingly important for urban planning and decision-making. However, sufficient datasets are still lacking. This paper presents a data fusion approach in GEE to map impervious surfaces with a spatial resolution of 0.9 m on a local to the regional level. We conducted a RF classification approach using spectral indices, GLCM texture features, and topographic features resulting in an OA of 92.31% and KC of 84.62%. To address challenges posed by high-resolution imagery, we superimposed the RF classification results with ALKIS land use data. According to our results, 25.26% of the city of Wuppertal is covered by impervious surfaces which coincides with a government-funded study result from 2020 based on Sentinel-2 Copernicus data that defined a proportion of 25.22% as built-up area.
Referring to research question (1), we can conclude that GEE can serve as a suitable alternative to map impervious surfaces efficiently based on external very high-resolution data sources. Yet, a certain reservation is needed as GEE restricts our method for local to regional use because only a limited amount of data could be handled. Additionally, apart from the time needed to familiarize with GEE, the proposed method can provide a free, reproducible, and transferable semi-automatic process. Yet, research question (1) can only be confirmed with a certain reservation as a transfer to other study areas is required to accomplish a more general statement. Referring to research question (2), we conclude that our pixel-based RF classification approach using spectral, texture, and topographic features produced promising results regarding difficulties in classifying very high-resolution imagery. Specifically, the spectral indices especially the PISI, the GLCM texture features mean and contrast, and the elevation significantly impacted the RF classification results. Regarding research question (3), the ALKIS object types “road traffic” and “building” can be considered to particularly refine misclassifications of shaded or obscured impervious surfaces.
In conclusion, the proposed method generated a highly detailed map of impervious surfaces in Wuppertal, improving the knowledge of their distribution in the city area. Therefore, this map and method could serve as a basis for future evaluations. For example, to improve statistical area evaluations or to support urban planning and urban hydrology issues. An opportunity for future research could be to introduce different impervious surface types to better differentiate the impact and severity of impervious surfaces. Additionally, the improvement of the methodology could be considered e.g., by using OBIA in GEE to better limit intra-class spectral variability. Furthermore, it would be reasonable to measure the performance of RF compared to other well-known supervised classification algorithms, such as SVM, or to investigate other methodologies, such as linear spectral unmixing. Despite these methodological adjustments, it may be advantageous to consider utilizing TDOPs taken during the spring season. This is because impervious surfaces are not obscured by tree canopies during this time, potentially leading to an increase in classification accuracy. Additionally, it may be of interest to use ancillary spectral indices and texture features due to their high feature importance obtained in this study. Regarding this, feature selection methods should be considered to prevent redundant information in classification processes.
In this study, an attempt was made to create an alternative method for very high-resolution mapping of impervious surfaces, which could supplement existing planning bases.

Author Contributions

Conceptualization, J.-P.L. and A.R.; methodology, J.-P.L.; software, J.-P.L.; validation, J.-P.L.; formal analysis, J.-P.L.; investigation, J.-P.L.; resources, J.-P.L.; data curation, J.-P.L.; writing—original draft preparation, J.-P.L.; writing—review and editing, J.-P.L. and A.R.; visualization, J.-P.L.; supervision, A.R.; funding acquisition, A.R. All authors have read and agreed to the published version of the manuscript.

Funding

The project “Vorstudie zum aktuellen Forschungsstand der Auswertung von Fernerkundungsdaten sowie weiterer Datenquellen zur Ermittlung des Indikators Versiegelung“ was funded with means of the State Office for Nature, Environment and Consumer Protection (LANUV) of North Rhine-Westphalia (funding code Az.: 32-364-14.11).

Data Availability Statement

The data presented in this study are available on request from the corresponding author.

Acknowledgments

We acknowledge support by the Open Access Publication Funds of the Ruhr-Universität Bochum. This study was conducted at the Institute of Geography at the Ruhr-University Bochum. The geodata used in this study were obtained from the Geobasis NRW (https://www.bezreg-koeln.nrw.de/brk_internet/geobasis/index.html (accessed on 20 February 2023)) which can be required via OpenGeodata.NRW (https://www.opengeodata.nrw.de/produkte/ (accessed on 28 March 2023)) or via Open.NRW (https://open.nrw/ (accessed on 20 February 2023)). We would also thank the project “Vorstudie zum aktuellen Forschungsstand der Auswertung von Fernerkundungsdaten sowie weiterer Datenquellen zur Ermittlung des Indikators Versiegelung” funded by the State Office for Nature, Environment and Consumer Protection (LANUV) of North Rhine-Westphalia for the provision of coarsened Digital Orthophotos—in this regard, special thanks to Heinz Neite (LANUV) and Matthias Herkt (LANUV) for their professional and technical support as well for the provision of data in cooperation with IT.NRW (https://www.it.nrw/ (accessed on 20 February 2023)).

Conflicts of Interest

The authors declare no conflict of interest.

References

  1. German Federal Government. German Sustainable Development Strategy: Update 2021. 2021. Available online: https://www.bundesregierung.de/breg-de/service/publikationen/german-sustainable-development-strategy-update-2021-summary-version-1942598 (accessed on 28 November 2022).
  2. Scalenghe, R.; Marsan, F.A. The anthropogenic sealing of soils in urban areas. Landsc. Urban Plan. 2009, 90, 1–10. [Google Scholar] [CrossRef]
  3. Arnold, C.L.; Gibbons, C.J. Impervious Surface Coverage: The Emergence of a Key Environmental Indicator. J. Am. Plan. Assoc. 1996, 62, 243–258. [Google Scholar] [CrossRef]
  4. Artmann, M. Institutional efficiency of urban soil sealing management—From raising awareness to better implementation of sustainable development in Germany. Landsc. Urban Plan. 2014, 131, 83–95. [Google Scholar] [CrossRef]
  5. Barnes, K.B.; Morgan, J.; Roberge, M. Impervious Surfaces and the Quality of Natural and Built Environments, Baltimore, Maryland. 2001. Available online: https://citeseerx.ist.psu.edu/document?repid=rep1&type=pdf&doi=f8a7d8f4148029dca5a37cce9f7b67552ad6a95a (accessed on 28 November 2022).
  6. Memon, R.A.; Leung, D.Y.C.; Chunho, L. A review on the generation, determination and mitigation of urban heat island. J. Environ. Sci. 2008, 20, 120–128. [Google Scholar] [CrossRef]
  7. Schmitz, J.; Fina, S.; Riembauer, G.; Hollen, M. Entwicklung der Siedlungs-und Verkehrsfläche nachgerechnet: Ein Plädoyer für frei zugängliche ALKIS-Daten. In Dresdner Flächennutzungssymposium; Rhombos: Berlin, Germany, 2021; Volume 79, pp. 161–169. [Google Scholar] [CrossRef]
  8. Frie, B.; Hensel, R. Schätzverfahren zur Bodenversiegelung: Ansatz der Umweltökonomischen Gesamtrechnungen der Länder. In Flächennutzungsmonitoring I. Konzepte—Indikatoren—Statistik; Meinel, G., Schumacher, U., Eds.; Shaker: Aachen, Germany, 2009; pp. 17–45. [Google Scholar]
  9. Schmidt, S.; Barron, C. Mapping Impervious Surfaces Precisely—A GIS-Based Methodology Combining Vector Data and High-Resolution Airborne Imagery. J. Geovisualization Spat. Anal. 2020, 4, 14. [Google Scholar] [CrossRef]
  10. Riembauer, G.; Weinmann, A.; Xu, S.; Eichfuss, S.; Eberz, C.; Neteler, M. Germany-wide Sentinel-2 based land cover classification and change detection for settlement and infrastructure monitoring. In Proceedings of the 2021 Conference on Big Data from Space, Virtual, 18–20 May 2021; pp. 53–56. [Google Scholar]
  11. Sandmann, S.; Hochgürtel, G.; Piroska, R.; Steffens, C. Cop4ALL NRW–Ableitung der Landbedeckung in Nordrhein-Westfalen mit Fernerkundung und künstlicher Intelligenz. Z. Geodäsie Geoinf. Und Landmanagement 2022. [Google Scholar] [CrossRef]
  12. Yuan, F.; Bauer, M.E. Mapping impervious surface area using high resolution imagery: A comparison of object-based and per pixel classification. In Proceedings of the ASPRS 2006 Annual Conference, Reno, NV, USA, 1–5 May 2006; pp. 1–5. [Google Scholar]
  13. Hu, X.; Weng, Q. Impervious surface area extraction from IKONOS imagery using an object-based fuzzy method. Geocarto Int. 2011, 26, 3–20. [Google Scholar] [CrossRef]
  14. Yang, J.; He, Y. Automated mapping of impervious surfaces in urban and suburban areas: Linear spectral unmixing of high spatial resolution imagery. Int. J. Appl. Earth Obs. Geoinf. 2017, 54, 53–64. [Google Scholar] [CrossRef]
  15. Dare, P.M. Shadow Analysis in High-Resolution Satellite Imagery of Urban Areas. In Photogrammetric Engineering & Remote Sensing; American Society for Photogrammetry and Remote Sensing: Baton Rouge, LA, USA, 2005; Volume 71, pp. 169–177. [Google Scholar]
  16. Yang, J.; He, Y.; Caspersen, J. Fully constrained linear spectral unmixing based global shadow compensation for high resolution satellite imagery of urban areas. Int. J. Appl. Earth Obs. Geoinf. 2015, 38, 88–98. [Google Scholar] [CrossRef]
  17. Lu, D.; Li, G.; Kuang, W.; Moran, E. Methods to extract impervious surface areas from satellite images. Int. J. Digit. Earth 2014, 7, 93–112. [Google Scholar] [CrossRef]
  18. Hsieh, P.-F.; Lee, L.C.; Chen, N.-Y. Effect of spatial resolution on classification errors of pure and mixed pixels in remote sensing. IEEE Trans. Geosci. Remote Sens. 2001, 39, 2657–2663. [Google Scholar] [CrossRef]
  19. Dubertret, F.; Le Tourneau, F.-M.; Villarreal, M.L.; Norman, L.M. Monitoring Annual Land Use/Land Cover Change in the Tucson Metropolitan Area with Google Earth Engine (1986–2020). Remote Sens. 2022, 14, 2127. [Google Scholar] [CrossRef]
  20. Verde, N.; Kokkoris, I.P.; Georgiadis, C.; Kaimaris, D.; Dimopoulos, P.; Mitsopoulos, I.; Mallinis, G. National Scale Land Cover Classification for Ecosystem Services Mapping and Assessment, Using Multitemporal Copernicus EO Data and Google Earth Engine. Remote Sens. 2020, 12, 3303. [Google Scholar] [CrossRef]
  21. Guo, X.; Zhang, C.; Luo, W.; Yang, J.; Yang, M. Urban Impervious Surface Extraction Based on Multi-Features and Random Forest. IEEE Access 2020, 8, 226609–226623. [Google Scholar] [CrossRef]
  22. Zha, Y.; Gao, J.; Ni, S. Use of normalized difference built-up index in automatically mapping urban areas from TM imagery. Int. J. Remote Sens. 2003, 24, 583–594. [Google Scholar] [CrossRef]
  23. Kaur, R.; Pandey, P. A review on spectral indices for built-up area extraction using remote sensing technology. Arab J Geosci 2022, 15, 1–22. [Google Scholar] [CrossRef]
  24. Tian, Y.; Chen, H.; Song, Q.; Zheng, K. A Novel Index for Impervious Surface Area Mapping: Development and Validation. Remote Sens. 2018, 10, 1521. [Google Scholar] [CrossRef] [Green Version]
  25. Weng, Q. Remote sensing of impervious surfaces in the urban areas: Requirements, methods, and trends. Remote Sens. Environ. 2012, 117, 34–49. [Google Scholar] [CrossRef]
  26. Hall-Beyer, M. Practical guidelines for choosing GLCM textures to use in landscape classification tasks over a range of moderate spatial scales. Int. J. Remote Sens. 2017, 38, 1312–1338. [Google Scholar] [CrossRef]
  27. Haralick, R.M.; Shanmugam, K.; Dinstein, I. Textural Features for Image Classification. IEEE Trans. Syst. Man Cybern. 1973, SMC-3, 610–621. [Google Scholar] [CrossRef] [Green Version]
  28. Bramhe, V.S.; Ghosh, S.K.; Garg, P.K. Extraction Of Built-Up Area By Combining Textural Features And Spectral Indices From LANDSAT-8 Multispectral Image. Int. Arch. Photogramm. Remote Sens. Spat. Inf. Sci. 2018, XLII-5, 727–733. [Google Scholar] [CrossRef] [Green Version]
  29. Rodriguez-Galiano, V.F.; Chica-Olmo, M.; Abarca-Hernandez, F.; Atkinson, P.M.; Jeganathan, C. Random Forest classification of Mediterranean land cover using multi-seasonal imagery and multi-seasonal texture. Remote Sens. Environ. 2012, 121, 93–107. [Google Scholar] [CrossRef]
  30. Puissant, A.; Hirsch, J.; Weber, C. The utility of texture analysis to improve per-pixel classification for high to very high spatial resolution imagery. Int. J. Remote Sens. 2005, 26, 733–745. [Google Scholar] [CrossRef]
  31. Ghamisi, P.; Gloaguen, R.; Atkinson, P.M.; Benediktsson, J.A.; Rasti, B.; Yokoya, N.; Wang, Q.; Hofle, B.; Bruzzone, L.; Bovolo, F.; et al. Multisource and Multitemporal Data Fusion in Remote Sensing: A Comprehensive Review of the State of the Art. IEEE Geosci. Remote Sens. Mag. 2019, 7, 6–39. [Google Scholar] [CrossRef] [Green Version]
  32. Guan, H.; Li, J.; Chapman, M.; Deng, F.; Ji, Z.; Yang, X. Integration of orthoimagery and lidar data for object-based urban thematic mapping using random forests. Int. J. Remote Sens. 2013, 34, 5166–5186. [Google Scholar] [CrossRef]
  33. Yin, J.; Fu, P.; Hamm, N.A.S.; Li, Z.; You, N.; He, Y.; Cheshmehzangi, A.; Dong, J. Decision-Level and Feature-Level Integration of Remote Sensing and Geospatial Big Data for Urban Land Use Mapping. Remote Sens. 2021, 13, 1579. [Google Scholar] [CrossRef]
  34. Yin, J.; Dong, J.; Hamm, N.A.; Li, Z.; Wang, J.; Xing, H.; Fu, P. Integrating remote sensing and geospatial big data for urban land use mapping: A review. Int. J. Appl. Earth Obs. Geoinf. 2021, 103, 102514. [Google Scholar] [CrossRef]
  35. Wan, T.; Lu, H.; Lu, Q.; Luo, N. Classification of High-Resolution Remote-Sensing Image Using OpenStreetMap Information. IEEE Geosci. Remote Sens. Lett. 2017, 14, 2305–2309. [Google Scholar] [CrossRef]
  36. Tucker, C.J. Red and photographic infrared linear combinations for monitoring vegetation. Remote Sens. Environ. 1979, 8, 127–150. [Google Scholar] [CrossRef] [Green Version]
  37. Gorelick, N.; Hancher, M.; Dixon, M.; Ilyushchenko, S.; Thau, D.; Moore, R. Google Earth Engine: Planetary-scale geospatial analysis for everyone. Remote Sens. Environ. 2017, 202, 18–27. [Google Scholar] [CrossRef]
  38. Prasai, R.; Schwertner, T.W.; Mainali, K.; Mathewson, H.; Kafley, H.; Thapa, S.; Adhikari, D.; Medley, P.; Drake, J. Application of Google earth engine python API and NAIP imagery for land use and land cover classification: A case study in Florida, USA. Ecol. Inform. 2021, 66, 101474. [Google Scholar] [CrossRef]
  39. Zhang, H.; Gorelick, S.M.; Zimba, P.V. Extracting Impervious Surface from Aerial Imagery Using Semi-Automatic Sampling and Spectral Stability. Remote Sens. 2020, 12, 506. [Google Scholar] [CrossRef] [Green Version]
  40. Stadt Wuppertal. Wuppertal/Wirtschaft & Stadtentwicklung: Daten und Fakten. Available online: https://www.wuppertal.de/wirtschaft-stadtentwicklung/daten_fakten/index.php (accessed on 19 March 2023).
  41. Stadt Wuppertal. Wuppertal/Wirtschaft & Stadtentwicklung: Kompetenter Standort. Available online: https://www.wuppertal.de/wirtschaft-stadtentwicklung/standort/index.php (accessed on 23 March 2023).
  42. ILS—Institut für Landes-und Stadtentwicklungsforschung gGmbH. Incora Fläche—Dashboard. Available online: https://incora-flaeche.de/?mdatensatz=incora-bodenbedeckung&mz=11.964&mc=7.153-51.256&mdatensatzview=klassen (accessed on 2 February 2023).
  43. Bezirksregierung Köln. Digitale Orthophotos. Available online: https://www.bezreg-koeln.nrw.de/brk_internet/geobasis/luftbildinformationen/aktuell/digitale_orthophotos/index.html (accessed on 6 January 2023).
  44. Bezirksregierung Köln. Digitales Geländemodell. Available online: https://www.bezreg-koeln.nrw.de/brk_internet/geobasis/hoehenmodelle/digitale_gelaendemodelle/gelaendemodell/index.html (accessed on 22 January 2023).
  45. Bezirksregierung Köln. bDOM und nDOM—Digitale Oberflächenmodelle aus Luftbildern. Available online: https://www.bezreg-koeln.nrw.de/brk_internet/geobasis/stage_bdom_ndom/index.html (accessed on 22 January 2023).
  46. Bezirksregierung Köln. ALKIS—Standard. Available online: https://www.bezreg-koeln.nrw.de/brk_internet/geobasis/liegenschaftskataster/alkis/index.html (accessed on 22 January 2023).
  47. AdV. ALKIS®—Grunddatenbestand und Länderspezifische Inhalte. 2012. Available online: https://www.adv-online.de/AdV-Produkte/Liegenschaftskataster/Download/binarywriterservlet?imgUid=b7144748-6046-5314-0825-f47072e13d63&uBasVariant=11111111-1111-1111-1111-111111111111&isDownload=true (accessed on 6 January 2023).
  48. ESRI. ArcGIS Data Interoperability Extension for Desktop—ArcGIS Pro|Documentation. Available online: https://pro.arcgis.com/en/pro-app/latest/help/data/data-interoperability/what-is-the-data-interoperability-extension.htm (accessed on 22 January 2023).
  49. Lu, D.; Weng, Q. Use of impervious surface in urban land-use classification. Remote Sens. Environ. 2006, 102, 146–160. [Google Scholar] [CrossRef]
  50. Huete, A. A soil-adjusted vegetation index (SAVI). Remote Sens. Environ. 1988, 25, 295–309. [Google Scholar] [CrossRef]
  51. Gao, B. NDWI—A normalized difference water index for remote sensing of vegetation liquid water from space. Remote Sens. Environ. 1996, 58, 257–266. [Google Scholar] [CrossRef]
  52. Li, C.; Shao, Z.; Zhang, L.; Huang, X.; Zhang, M. A Comparative Analysis of Index-Based Methods for Impervious Surface Mapping Using Multiseasonal Sentinel-2 Satellite Data. IEEE J. Sel. Top. Appl. Earth Obs. Remote Sens. 2021, 14, 3682–3694. [Google Scholar] [CrossRef]
  53. Qu, L.; Chen, Z.; Li, M.; Zhi, J.; Wang, H. Accuracy Improvements to Pixel-Based and Object-Based LULC Classification with Auxiliary Datasets from Google Earth Engine. Remote Sens. 2021, 13, 453. [Google Scholar] [CrossRef]
  54. Chen, J.; Du, P.; Wu, C.; Xia, J.; Chanussot, J. Mapping Urban Land Cover of a Large Area Using Multiple Sensors Multiple Features. Remote Sens. 2018, 10, 872. [Google Scholar] [CrossRef] [Green Version]
  55. Google Developers. ee.Image.glcmTexture. Available online: https://developers.google.com/earth-engine/apidocs/ee-image-glcmtexture (accessed on 13 January 2023).
  56. Dorigo, W.; Lucieer, A.; Podobnikar, T.; Čarni, A. Mapping invasive Fallopia japonica by combined spectral, spatial, and temporal analysis of digital orthophotos. Int. J. Appl. Earth Obs. Geoinf. 2012, 19, 185–195. [Google Scholar] [CrossRef]
  57. Ghazaryan, G.; Rienow, A.; Oldenburg, C.; Thonfeld, F.; Trampnau, B.; Sticksel, S.; Jürgens, C. Monitoring of Urban Sprawl and Densification Processes in Western Germany in the Light of SDG Indicator 11.3.1 Based on an Automated Retrospective Classification Approach. Remote Sens. 2021, 13, 1694. [Google Scholar] [CrossRef]
  58. Breiman, L. Random Forests. Mach. Learn. 2001, 45, 5–32. [Google Scholar] [CrossRef] [Green Version]
  59. Pal, M. Random forest classifier for remote sensing classification. Int. J. Remote Sens. 2005, 26, 217–222. [Google Scholar] [CrossRef]
  60. Belgiu, M.; Drăguţ, L. Random forest in remote sensing: A review of applications and future directions. ISPRS J. Photogramm. Remote Sens. 2016, 114, 24–31. [Google Scholar] [CrossRef]
  61. Gislason, P.O.; Benediktsson, J.A.; Sveinsson, J.R. Random Forests for land cover classification. Pattern Recognit. Lett. 2006, 27, 294–300. [Google Scholar] [CrossRef]
  62. Google Developers. ee.Classifier.smileRandomForest. Available online: https://developers.google.com/earth-engine/apidocs/ee-classifier-smilerandomforest (accessed on 13 January 2023).
  63. Congalton, R.G. A review of assessing the accuracy of classifications of remotely sensed data. Remote Sens. Environ. 1991, 37, 35–46. [Google Scholar] [CrossRef]
  64. Kattenborn, T.; Lopatin, J.; Förster, M.; Braun, A.C.; Fassnacht, F.E. UAV data as alternative to field sampling to map woody invasive species based on combined Sentinel-1 and Sentinel-2 data. Remote Sens. Environ. 2019, 227, 61–73. [Google Scholar] [CrossRef]
  65. Stadt Wuppertal. Zukunft Wuppertal: Ein Stadtentwicklungskonzept für Wuppertal. 2019. Available online: https://www.wuppertal.de/wirtschaft-stadtentwicklung/stadtentwicklung/stadtentwicklungskonzept.php (accessed on 3 February 2023).
  66. Zhou, T.; Fu, H.; Sun, C.; Wang, S. Shadow Detection and Compensation from Remote Sensing Images under Complex Urban Conditions. Remote Sens. 2021, 13, 699. [Google Scholar] [CrossRef]
  67. Fang, H.; Du, P.; Wang, X. A novel unsupervised binary change detection method for VHR optical remote sensing imagery over urban areas. Int. J. Appl. Earth Obs. Geoinf. 2022, 108, 102749. [Google Scholar] [CrossRef]
  68. Padarian, J.; Minasny, B.; McBratney, A.B. Using Google’s cloud-based platform for digital soil mapping. Comput. Geosci. 2015, 83, 80–88. [Google Scholar] [CrossRef]
  69. Google. Storage and Upload Limits for Google Workspace. Available online: https://support.google.com/a/answer/172541?hl=de (accessed on 13 January 2023).
Figure 1. The study area of Wuppertal is located in the federal state of North Rhine-Westphalia (NRW), Germany. The background map describes the land use/land cover of Wuppertal in 2020 based on the Sentinel-2 classification product of the government-funded INCORA project [10,42]. The original data source was colour-modified and overlaid with the Wupper river using ALKIS data.
Remotesensing 15 01818 g001
Figure 2. Conceptual workflow outlining the proposed methodology. The methodology is structured in three major steps feature extraction (1), pixel-based RF classification (2) and data superimposition (3).
Remotesensing 15 01818 g002
Figure 3. Schematic workflow for the generation of training samples for the classes “impervious” and “non-impervious”. Within representative ALKIS land use vector data of roads, buildings, vegetation, bare soil, and water, random training samples were generated and filtered by NDVI and NDWI thresholds. This figure was modified based on the Figure 2 of Zhang et al. [39].
Remotesensing 15 01818 g003
Figure 4. Distribution of generated training samples in the study area.
Remotesensing 15 01818 g004
Figure 5. Distribution of generated validation samples in the study area.
Remotesensing 15 01818 g005
Figure 6. Illustration of (a) the produced RF classification results indicating impervious surfaces in the study area and (b) the selected and rasterized ALKIS land use data for superimposition.
Remotesensing 15 01818 g006
Figure 7. Very high-resolution spatially explicit map of impervious surfaces in the city of Wuppertal.
Remotesensing 15 01818 g007
Figure 8. The feature importance of the RF classifier calculated in GEE.
Remotesensing 15 01818 g008
Figure 9. Comparison of RF classification results and data superimposition results in suburban to semi-urban settlement areas: isolated settlement areas (A), allotments between settlement areas (B), residential areas (C,D).
Remotesensing 15 01818 g009
Figure 10. Comparison of RF classification results and data superimposition results in semi-urban to urban settlement areas: allotments between residential areas (E,F), high-density urban areas (G,H).
Remotesensing 15 01818 g010
Figure 11. Factors of under- and overestimation of land sealing: quarry areas (I), shaded areas (J), obscured areas by tree canopy (K), green roofs and civil engineering structures (L).
Remotesensing 15 01818 g011
Figure 12. GLCM texture feature mean of the B and NIR spectral band.
Remotesensing 15 01818 g012
Figure 13. Overlapping of summer and spring TDOP inside Wuppertal’s city boundary.
Remotesensing 15 01818 g013
Figure 14. Visualisation of data gaps present in the ALKIS land use dataset.
Remotesensing 15 01818 g014
Table 1. An illustrative example of the ALKIS data model structure based on specific data used in this work that is categorized into object types, value types and corresponding Identifier Codes. The object types “opencast mine, pit, quarry (41005)” and “building (31001)” were solely considered on the object level. To provide an impression of the value types within these two object types, we have only listed individual value types due to the available quantity. This listing is intended to illustrate the complexity of the data model. A complete documentation of the ALKIS data model structure is provided by the AdV [47].
Area of Object TypeObject Type GroupObject Types
(Identifier Code)
Value Types
(Identifier Code)
Actual UseSettlementsOpencast Mine, Pit, Quarry (41005)Earths, Loose Rock (1000)
Clay (1001)
Bentonite (1002)
Etc.
TrafficRoad Traffic (42001)Building and Open Space to Traffic Facilities, Road (2311)
Road Drainage System (2313)
Pedestrian Zone (5130)
VegetationAgriculture (43001)Farmland (1010)
Grassland (1020)
Wasteland (1200)
Forest (43002)Deciduous Trees (1100)
Coniferous Trees (1200)
Mixed Trees (1300)
WaterRunning Waters (44001)Rivers (8200)
Canal (8300)
Standing Waters (44006)Lakes (8610)
Reservoirs (8630)
Storage Basins (8631)
Quarry Pond (8640)
BuildingsDetails of the BuildingBuilding (31001)Residential Building (1000)
Shopping Centre (2052)
Commercial and Industrial Buildings (2100)
Car Park (2461)
Etc.
Table 2. Spectral Indices used in this study and their corresponding formulas.
Spectral IndexFormulaSource
NDVI ( ρ n i r ρ r e d ) ( ρ n i r + ρ r e d ) Tucker [36]
NDWI ( ρ g r e e n ρ n i r ) ( ρ g r e e n + ρ n i r ) Gao [51]
SAVI ( ρ n i r ρ r e d ) ( ρ n i r + ρ r e d + L ) ( 1 + L ) Huete [50]
PISI 0.8192 ρ b l u e 0.5735 ρ n i r + 0.0750 Tian et al. [24]
Table 3. List of input features used for the RF classifier in conjunction with the corresponding data sources utilized for this purpose.
Number of Input DataDescriptionData Source
Spectral Bands (4)R, G, B, NIRTDOP [43]
Spectral Indices (4)PISI, NDVI, NDWI, SAVITDOP [43]
Texture Features (8)Mean (R, G, B, NIR)TDOP [43]
Contrast (R, G, B, NIR)
Topographic Features (2)Elevation, SlopenDSM [45]
DEM [44]
Table 4. Confusion matrix of the RF classification result.
ImperviousNon-ImperviousTotalUA *
Impervious1201013092.31%
Non-Impervious1012013092.31%
Total130130260
PA *92.31%92.31%
OA *92.31%
KC *84.62%
* PA: Producer’s Accuracy; UA: User’s Accuracy; OA: Overall Accuracy; KC: Kappa-Coefficient.
Table 5. Improvement requirements in areas of over- or underestimation of impervious surfaces and the corresponding ALKIS land use data for superimposition.
ObservationImprovement RequirementSelected ALKIS Data
(Identifier Code)
OverestimationQuarry
(e.g., gravel, crushed stone, high-density lanes)
Open Cast Mine, Pit, Quarry (41005)
Civil Engineering Structures
(e. g. suspension railway)
River (8200)
River
(e.g., dark-appearing water)
UnderestimationShaded Areas and Obscured Areas
(e.g., caused by buildings or trees)
Road Traffic (42001) *
Rooftops
(e.g., green roofs, dark-appearing rooftops)
Building (31001)
* Excluding Accompanying Greenery.
Disclaimer/Publisher’s Note: The statements, opinions and data contained in all publications are solely those of the individual author(s) and contributor(s) and not of MDPI and/or the editor(s). MDPI and/or the editor(s) disclaim responsibility for any injury to people or property resulting from any ideas, methods, instructions or products referred to in the content.

