
Spatial–Temporal and Driving Factors of Land Use/Cover Change in Mongolia from 1990 to 2021
 , , , ,
Abstract
:
1. Introduction
2. Materials and Methods
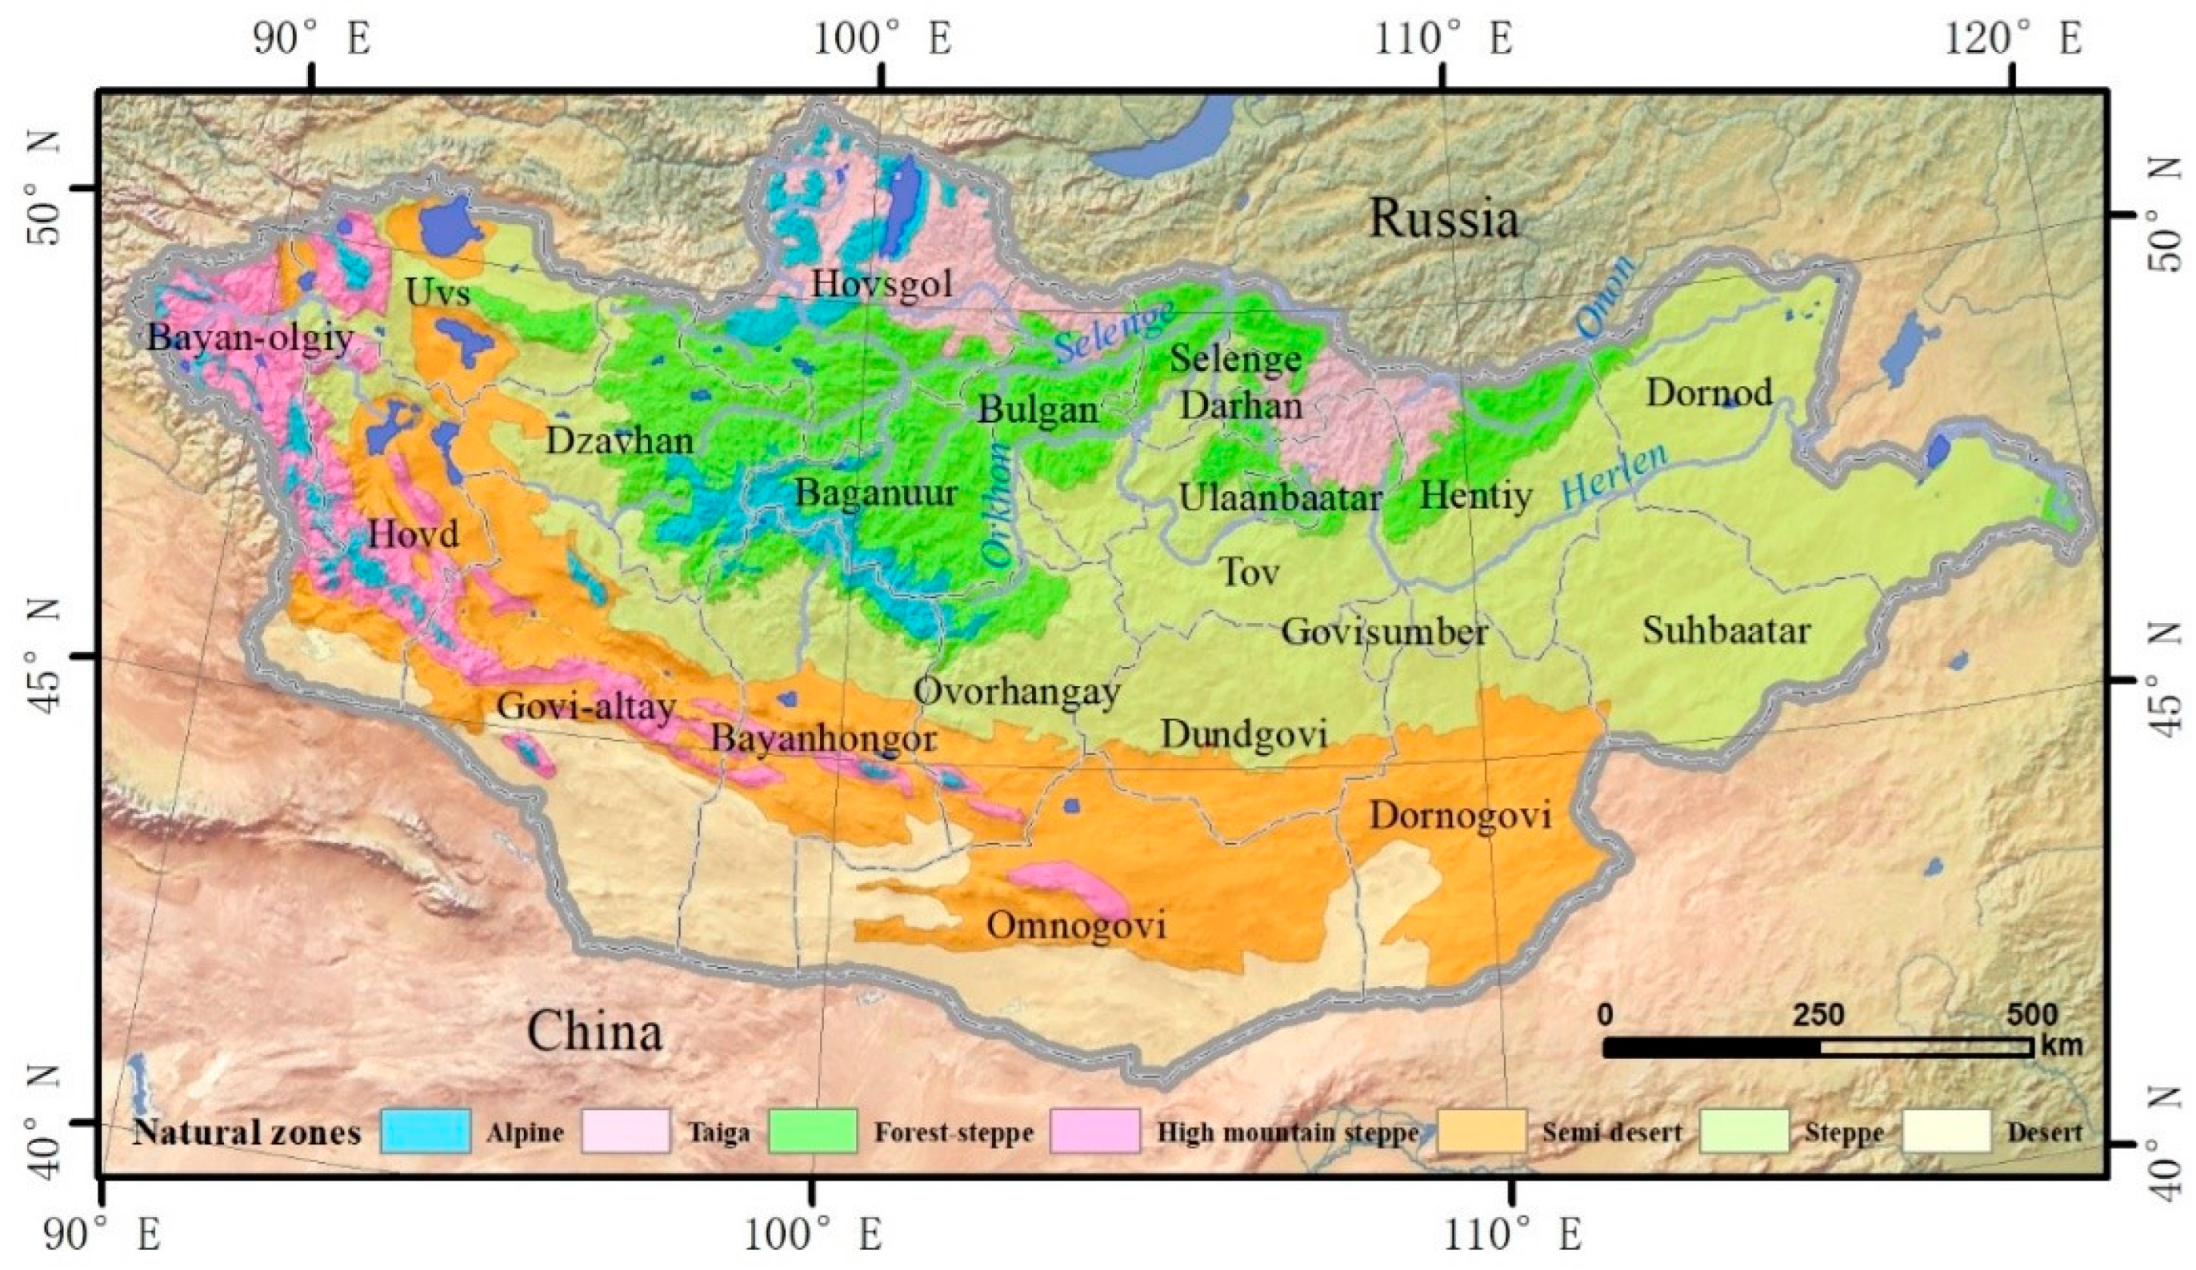
2.1. Study Area
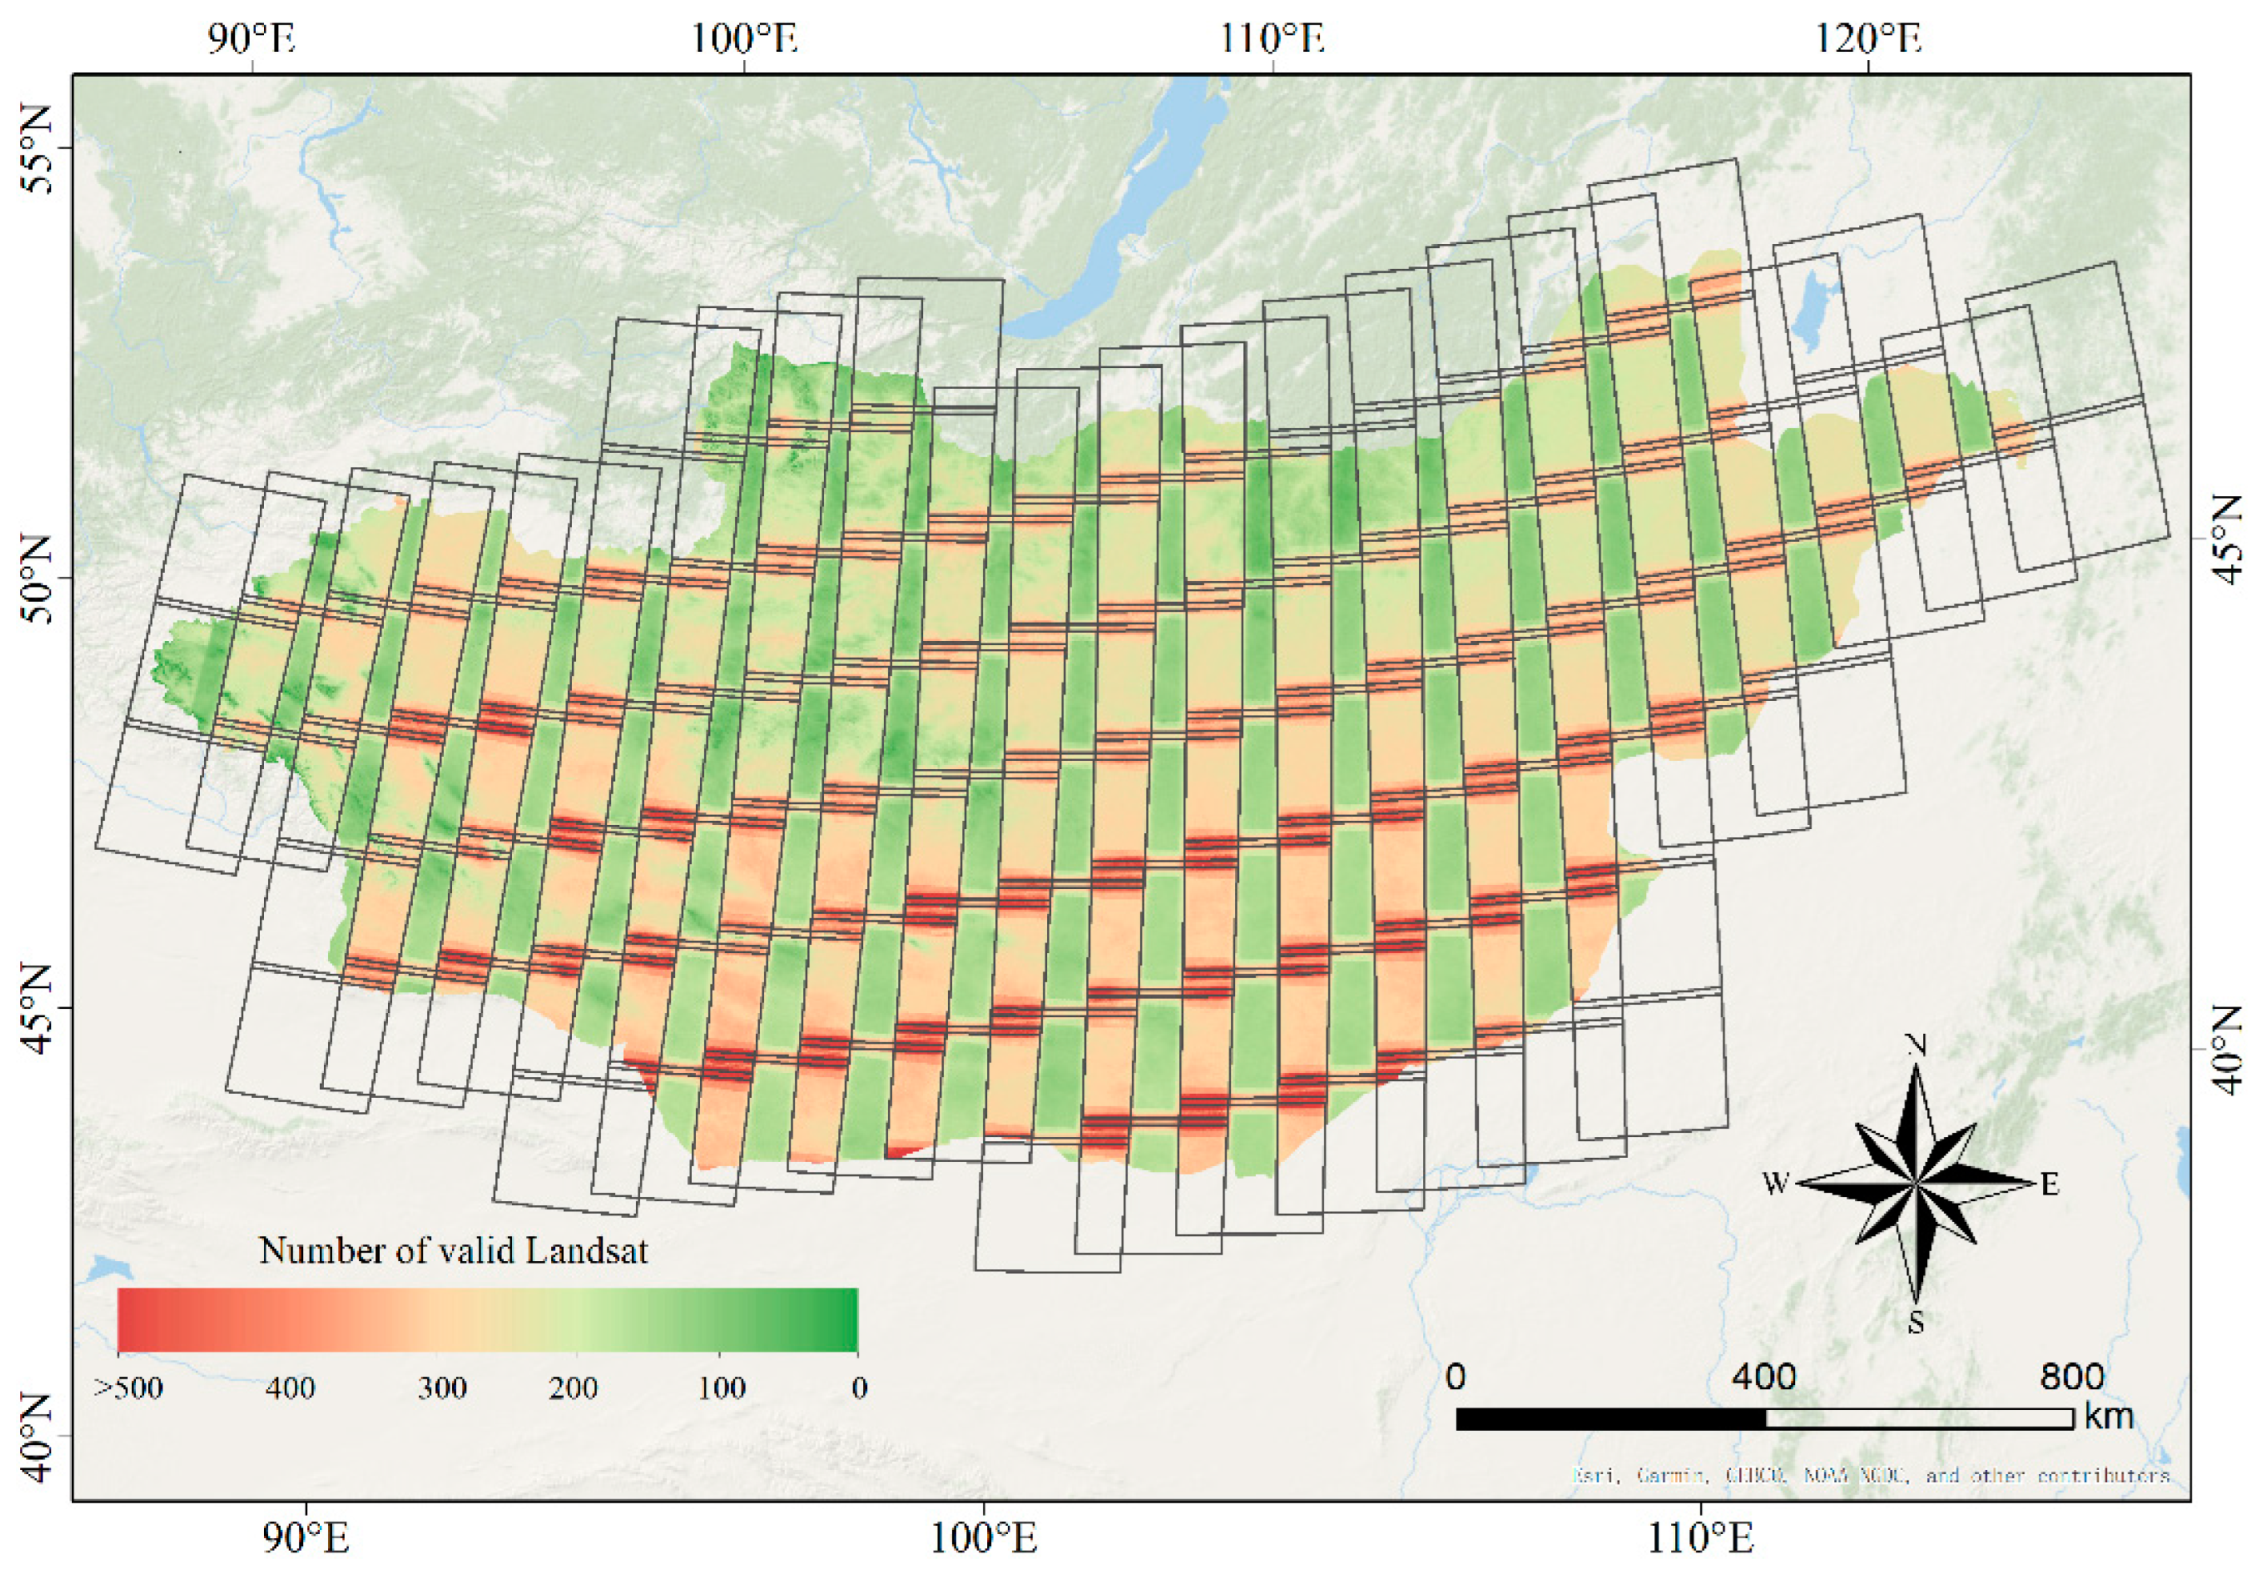
2.2. Data Source
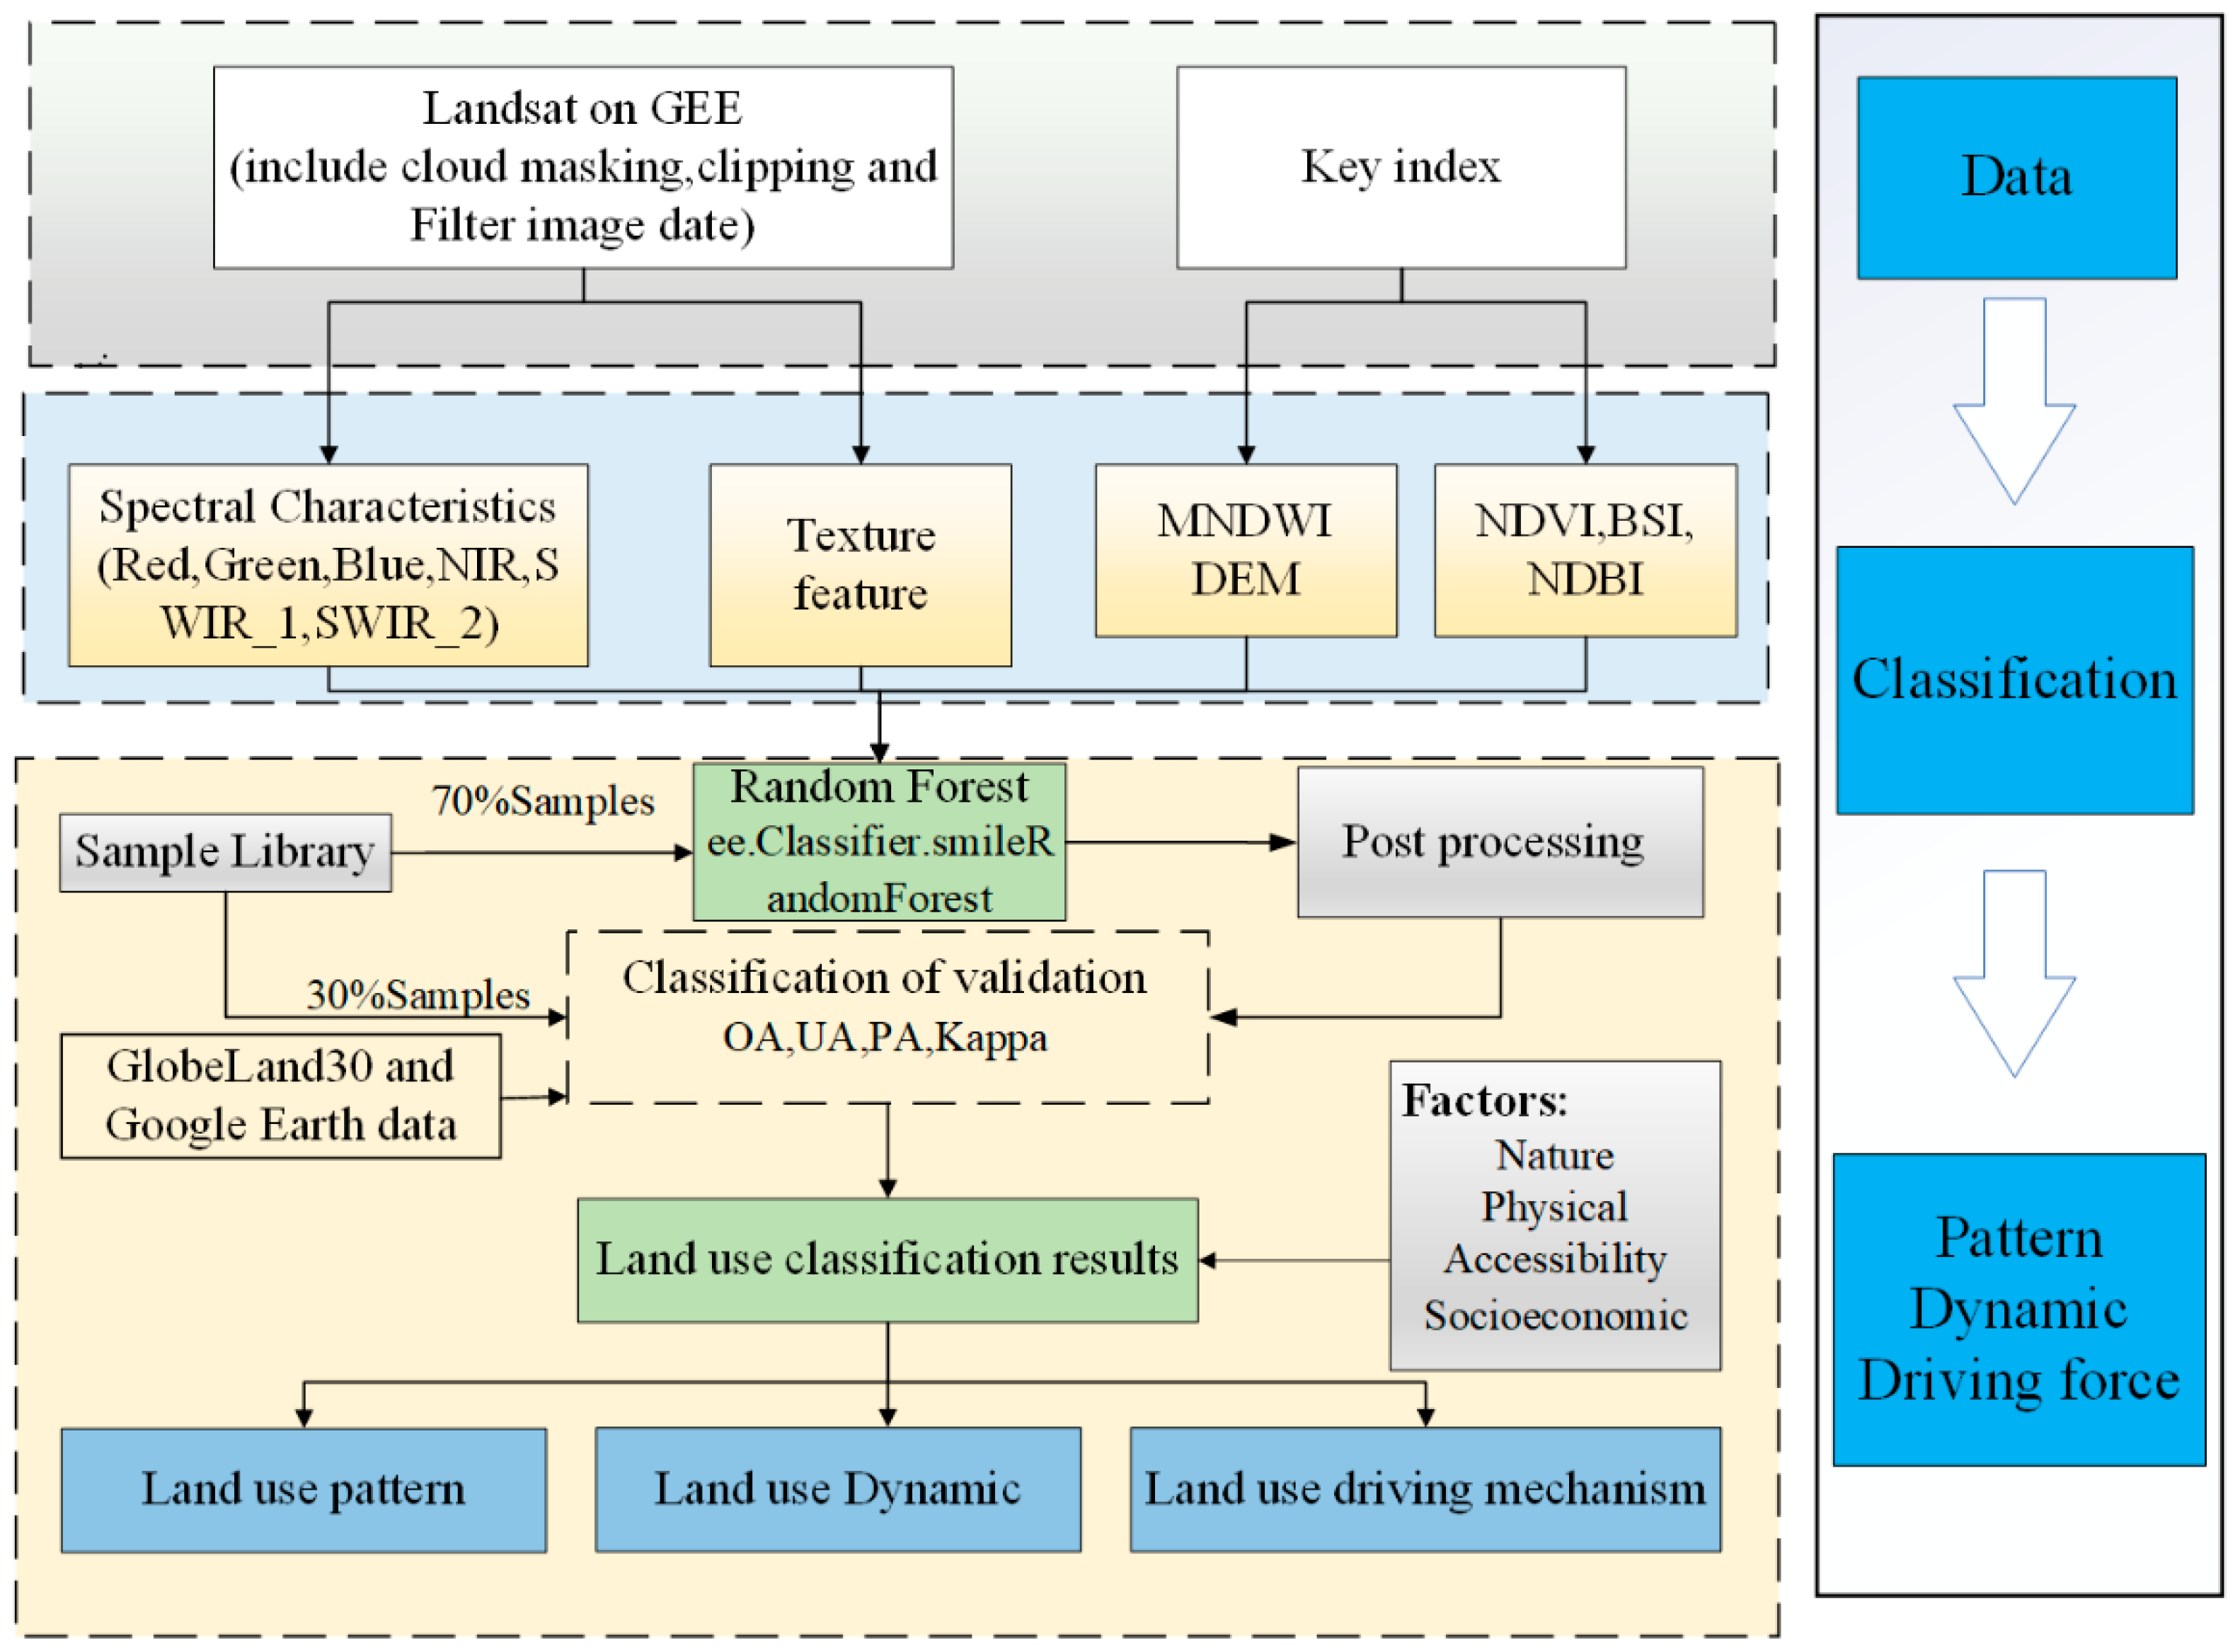
2.3. Extraction of Land Use/Cover Type
- Step I. Data pre-processing
- Step II. Creation of training and testing samples
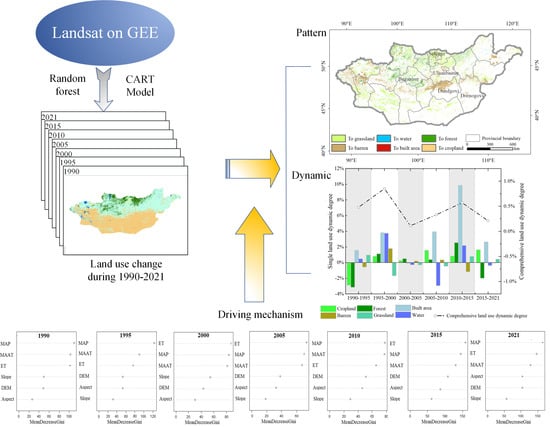
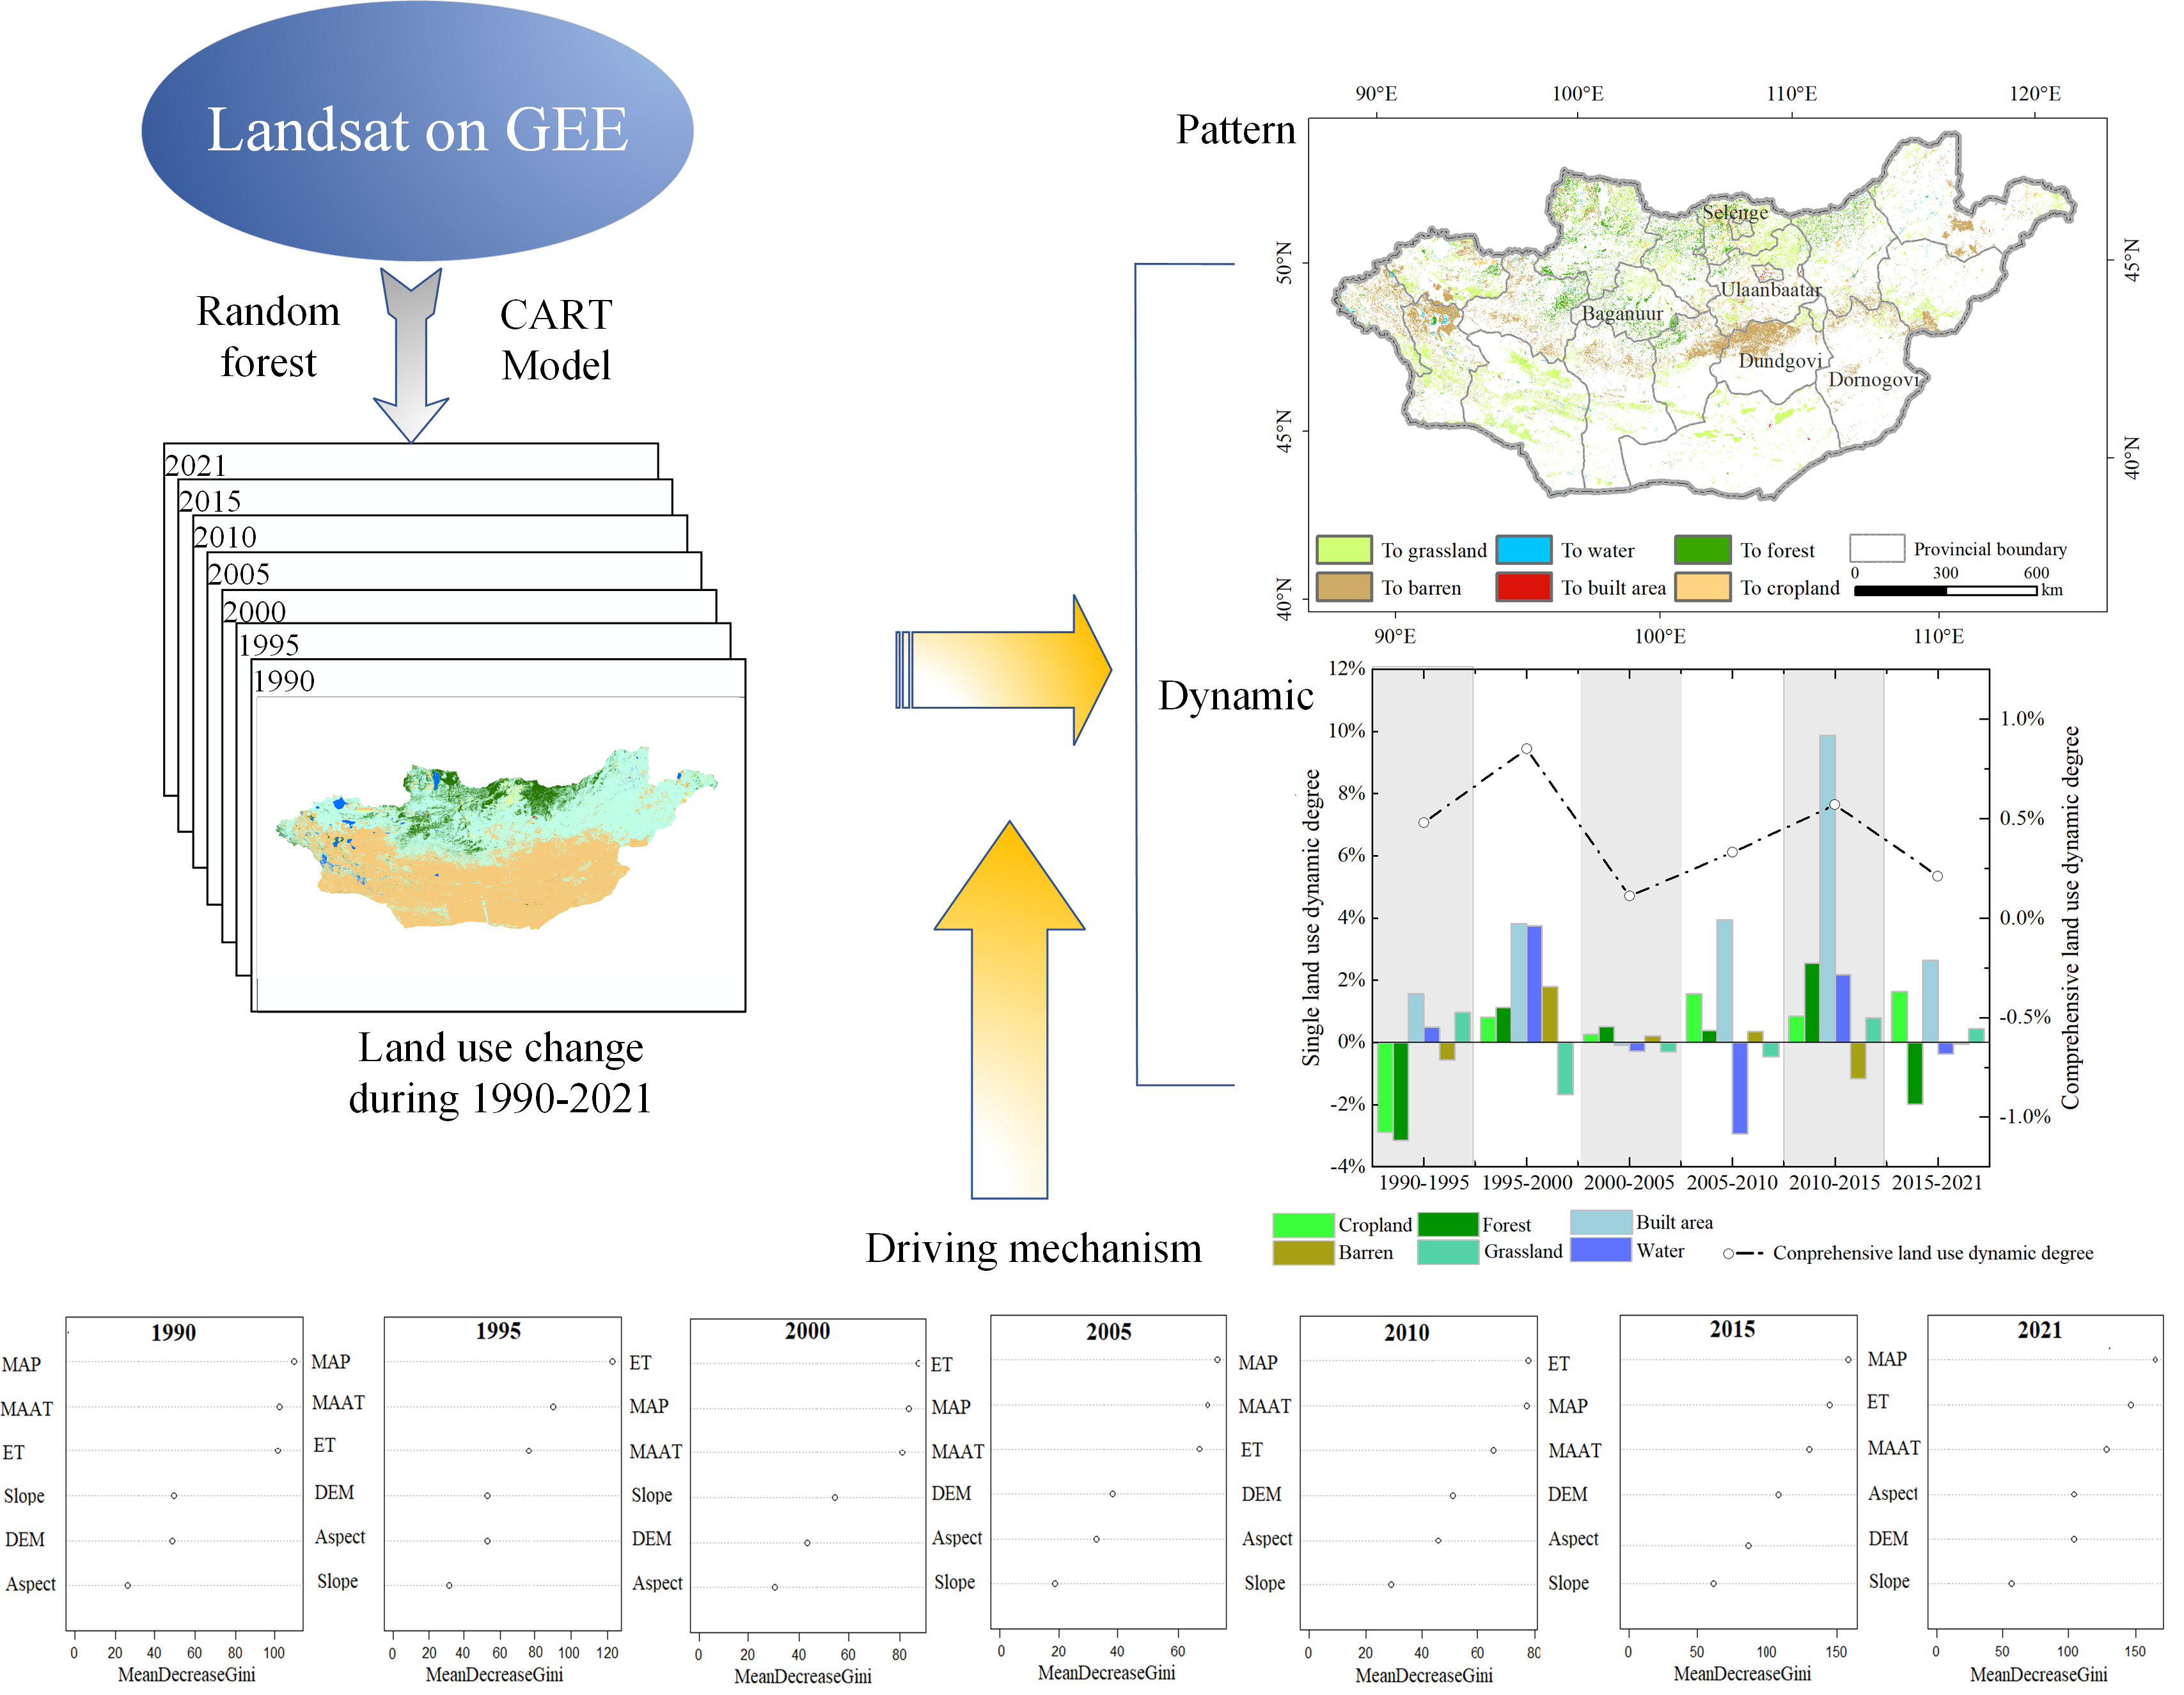
- Step III. Random forest
- Step IV. Post-processing of classification
2.4. Accuracy Evaluation
2.5. Land Use/Cover Change Dynamic Degree
3. Result
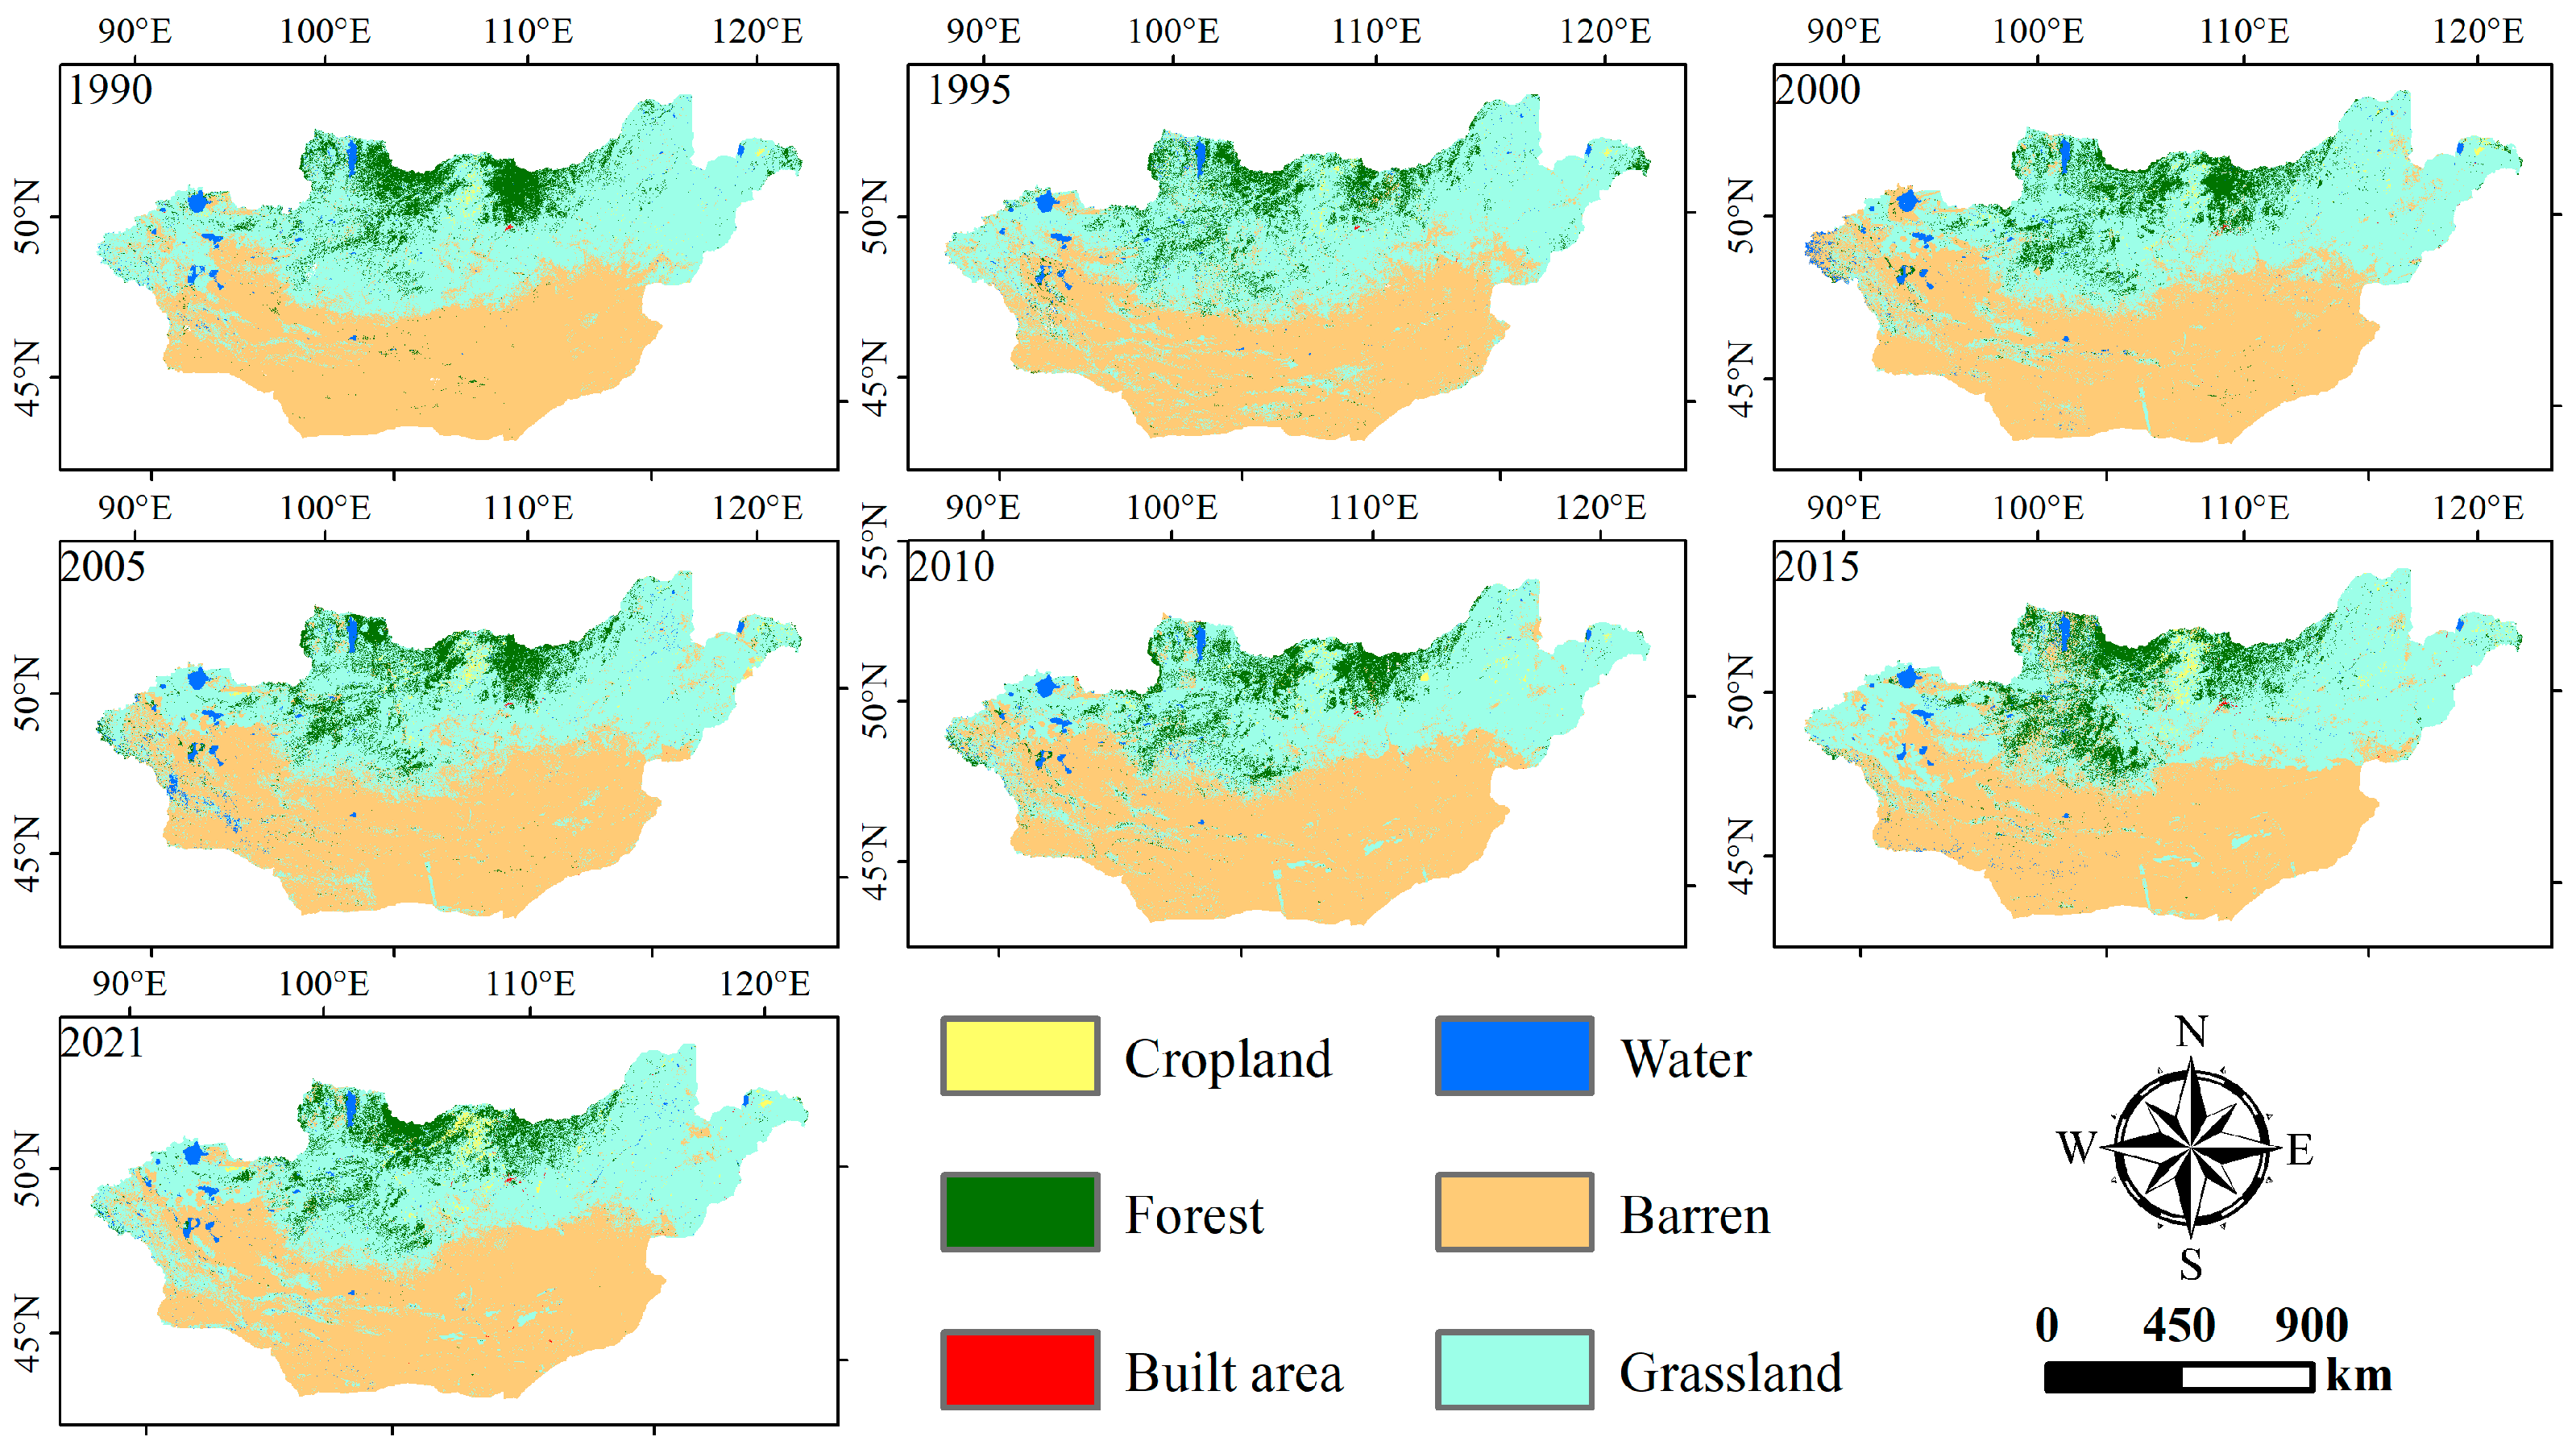
3.1. Land Use/Cover Pattern
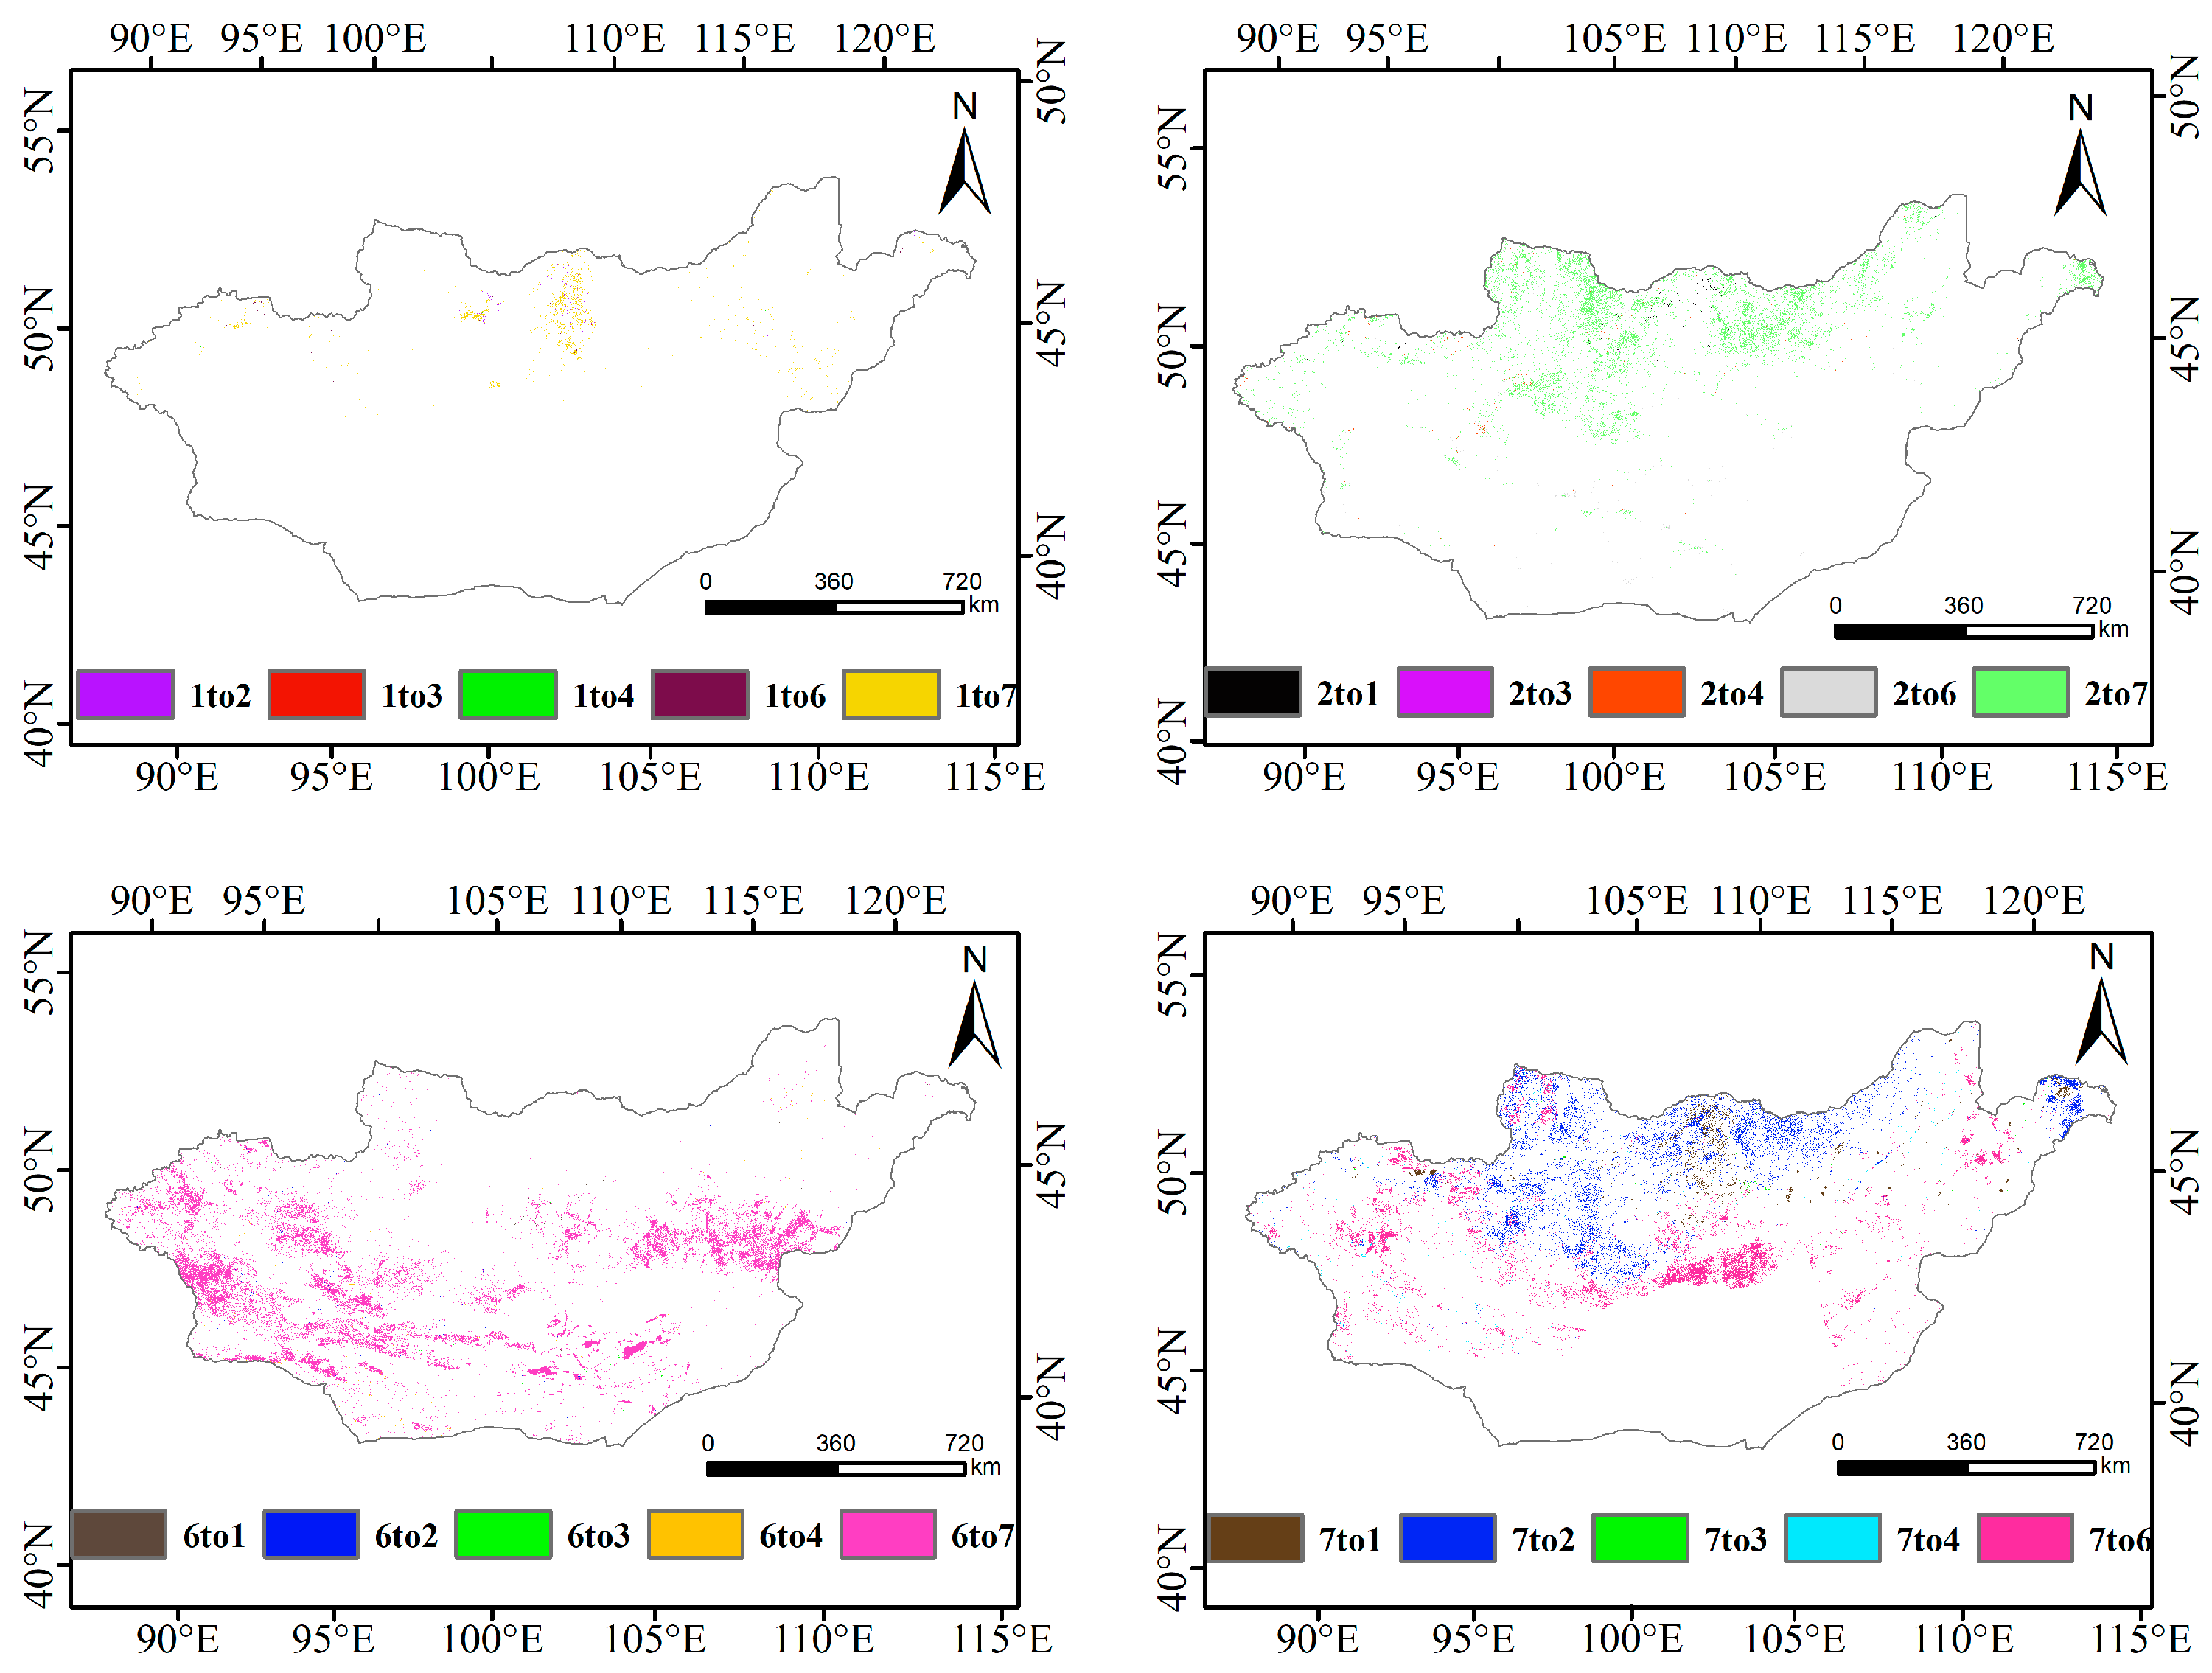
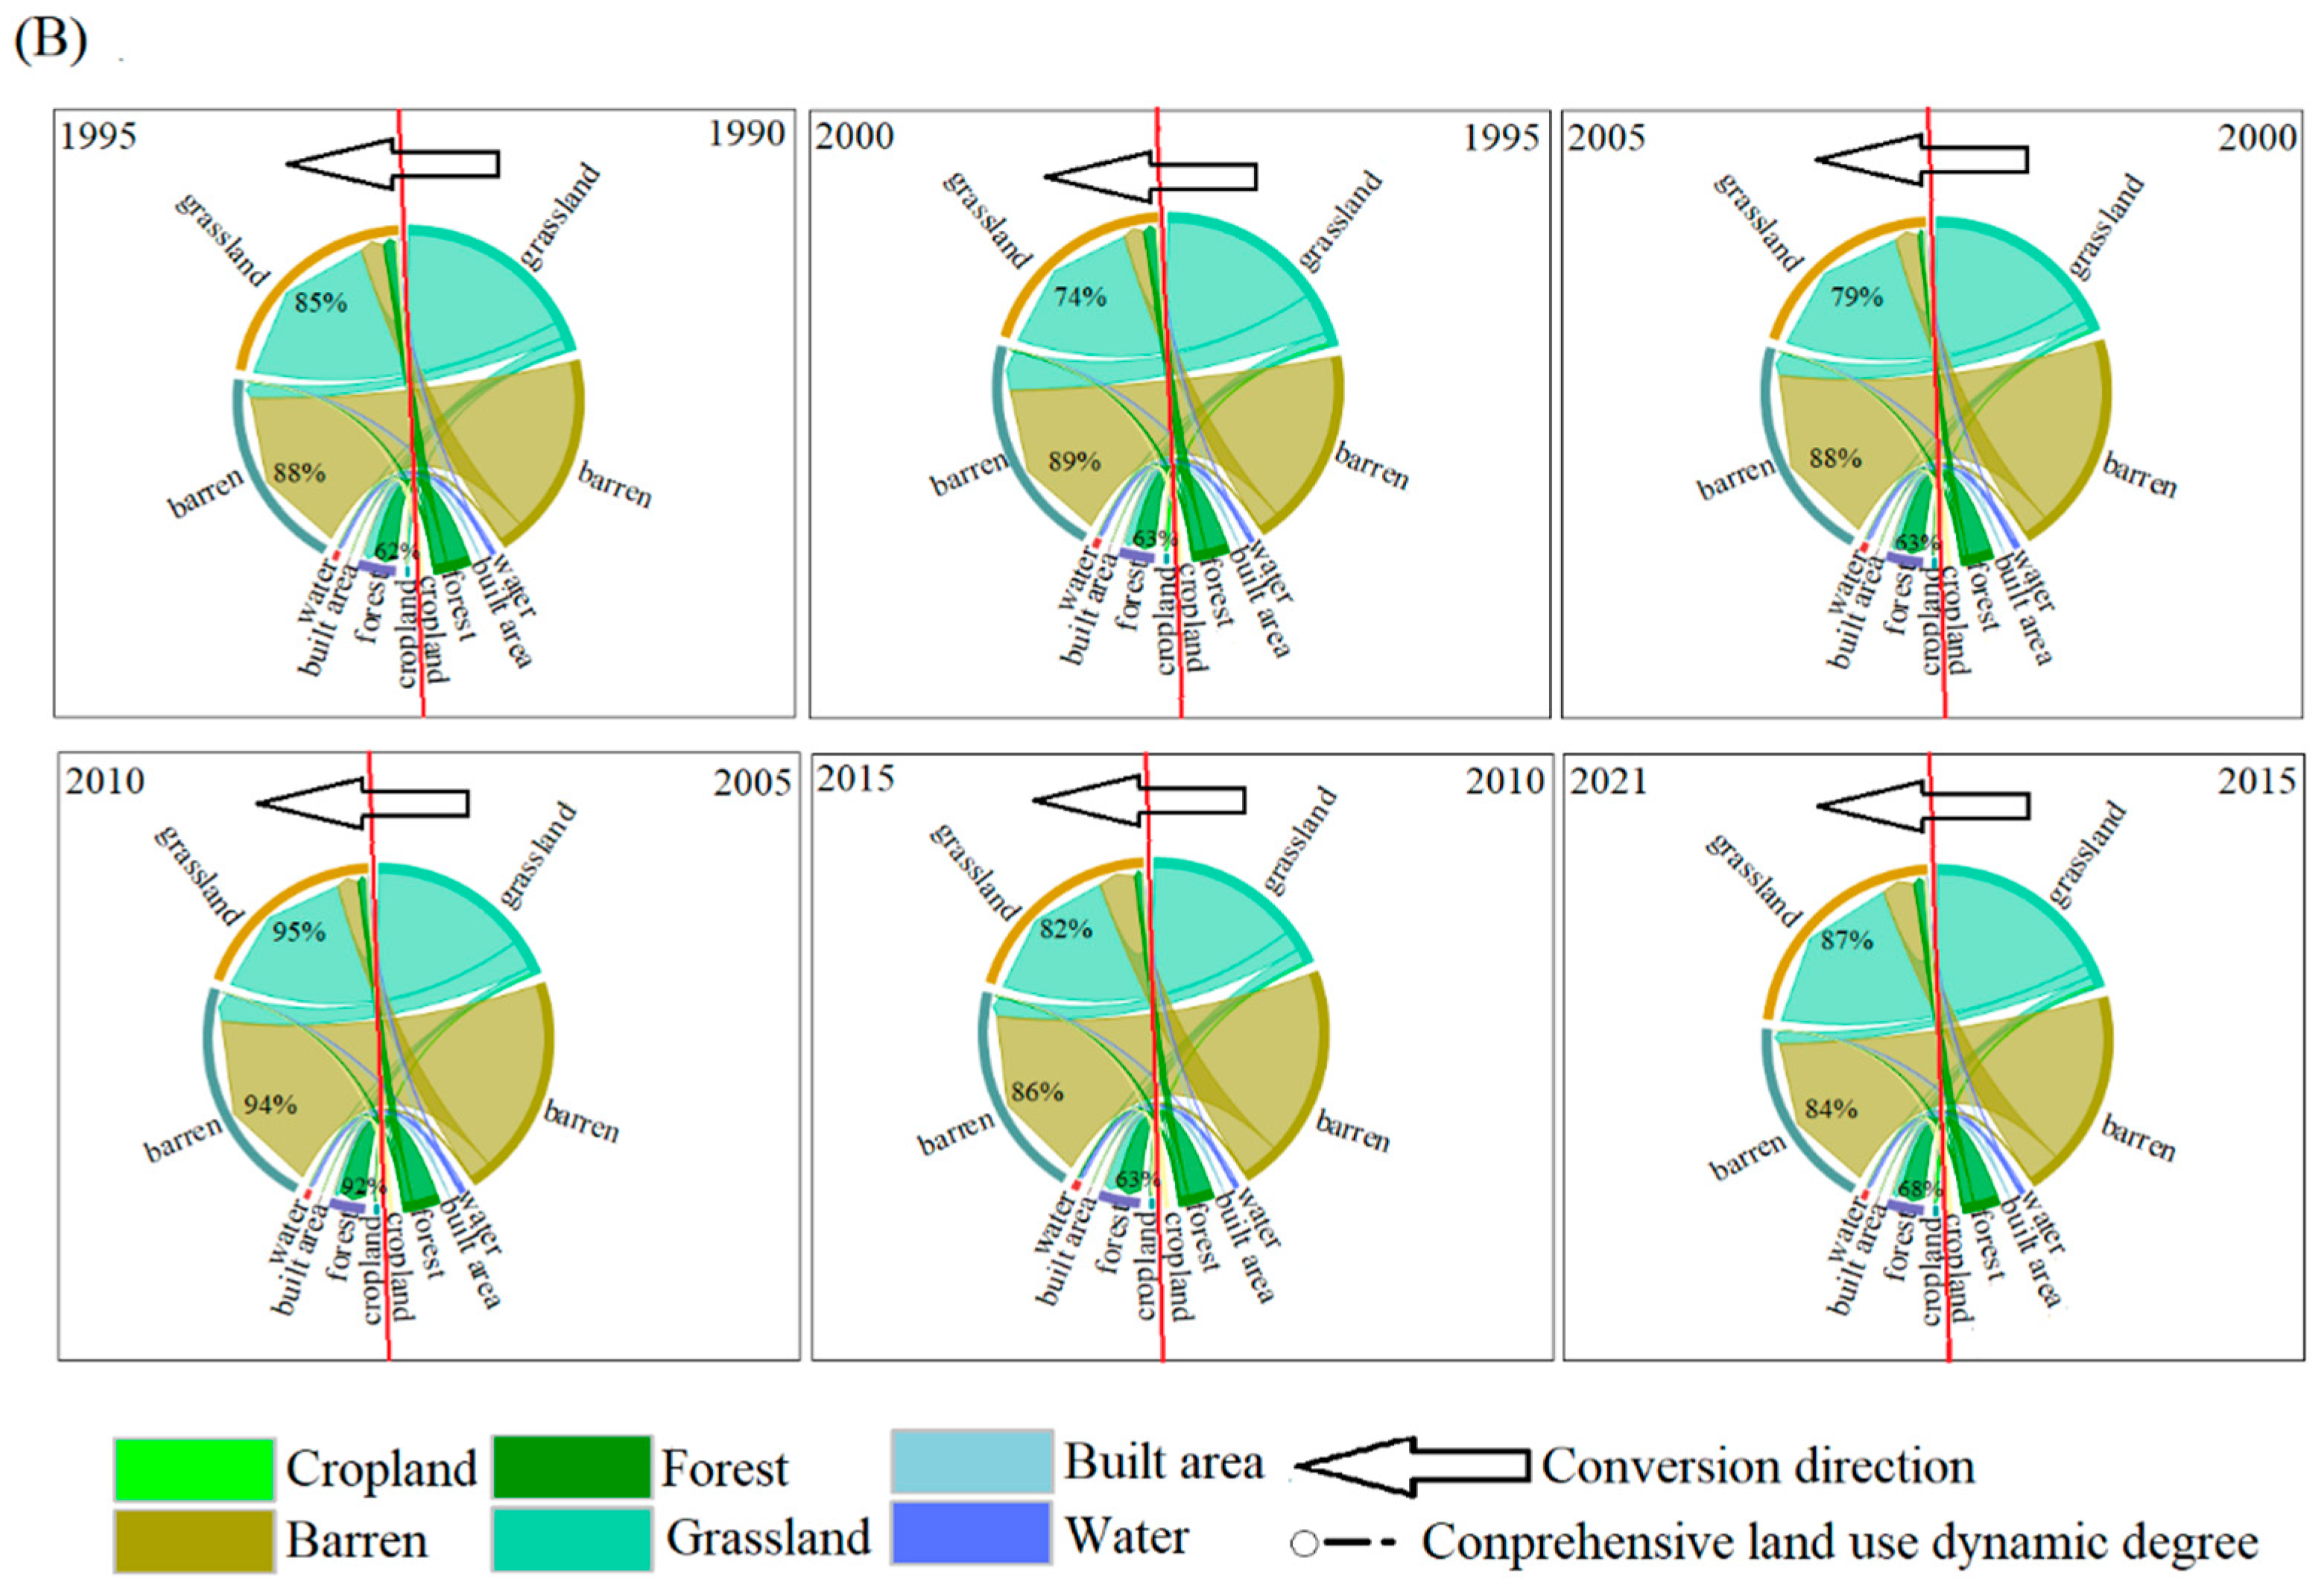
3.2. Land Use/Cover Change Dynamic
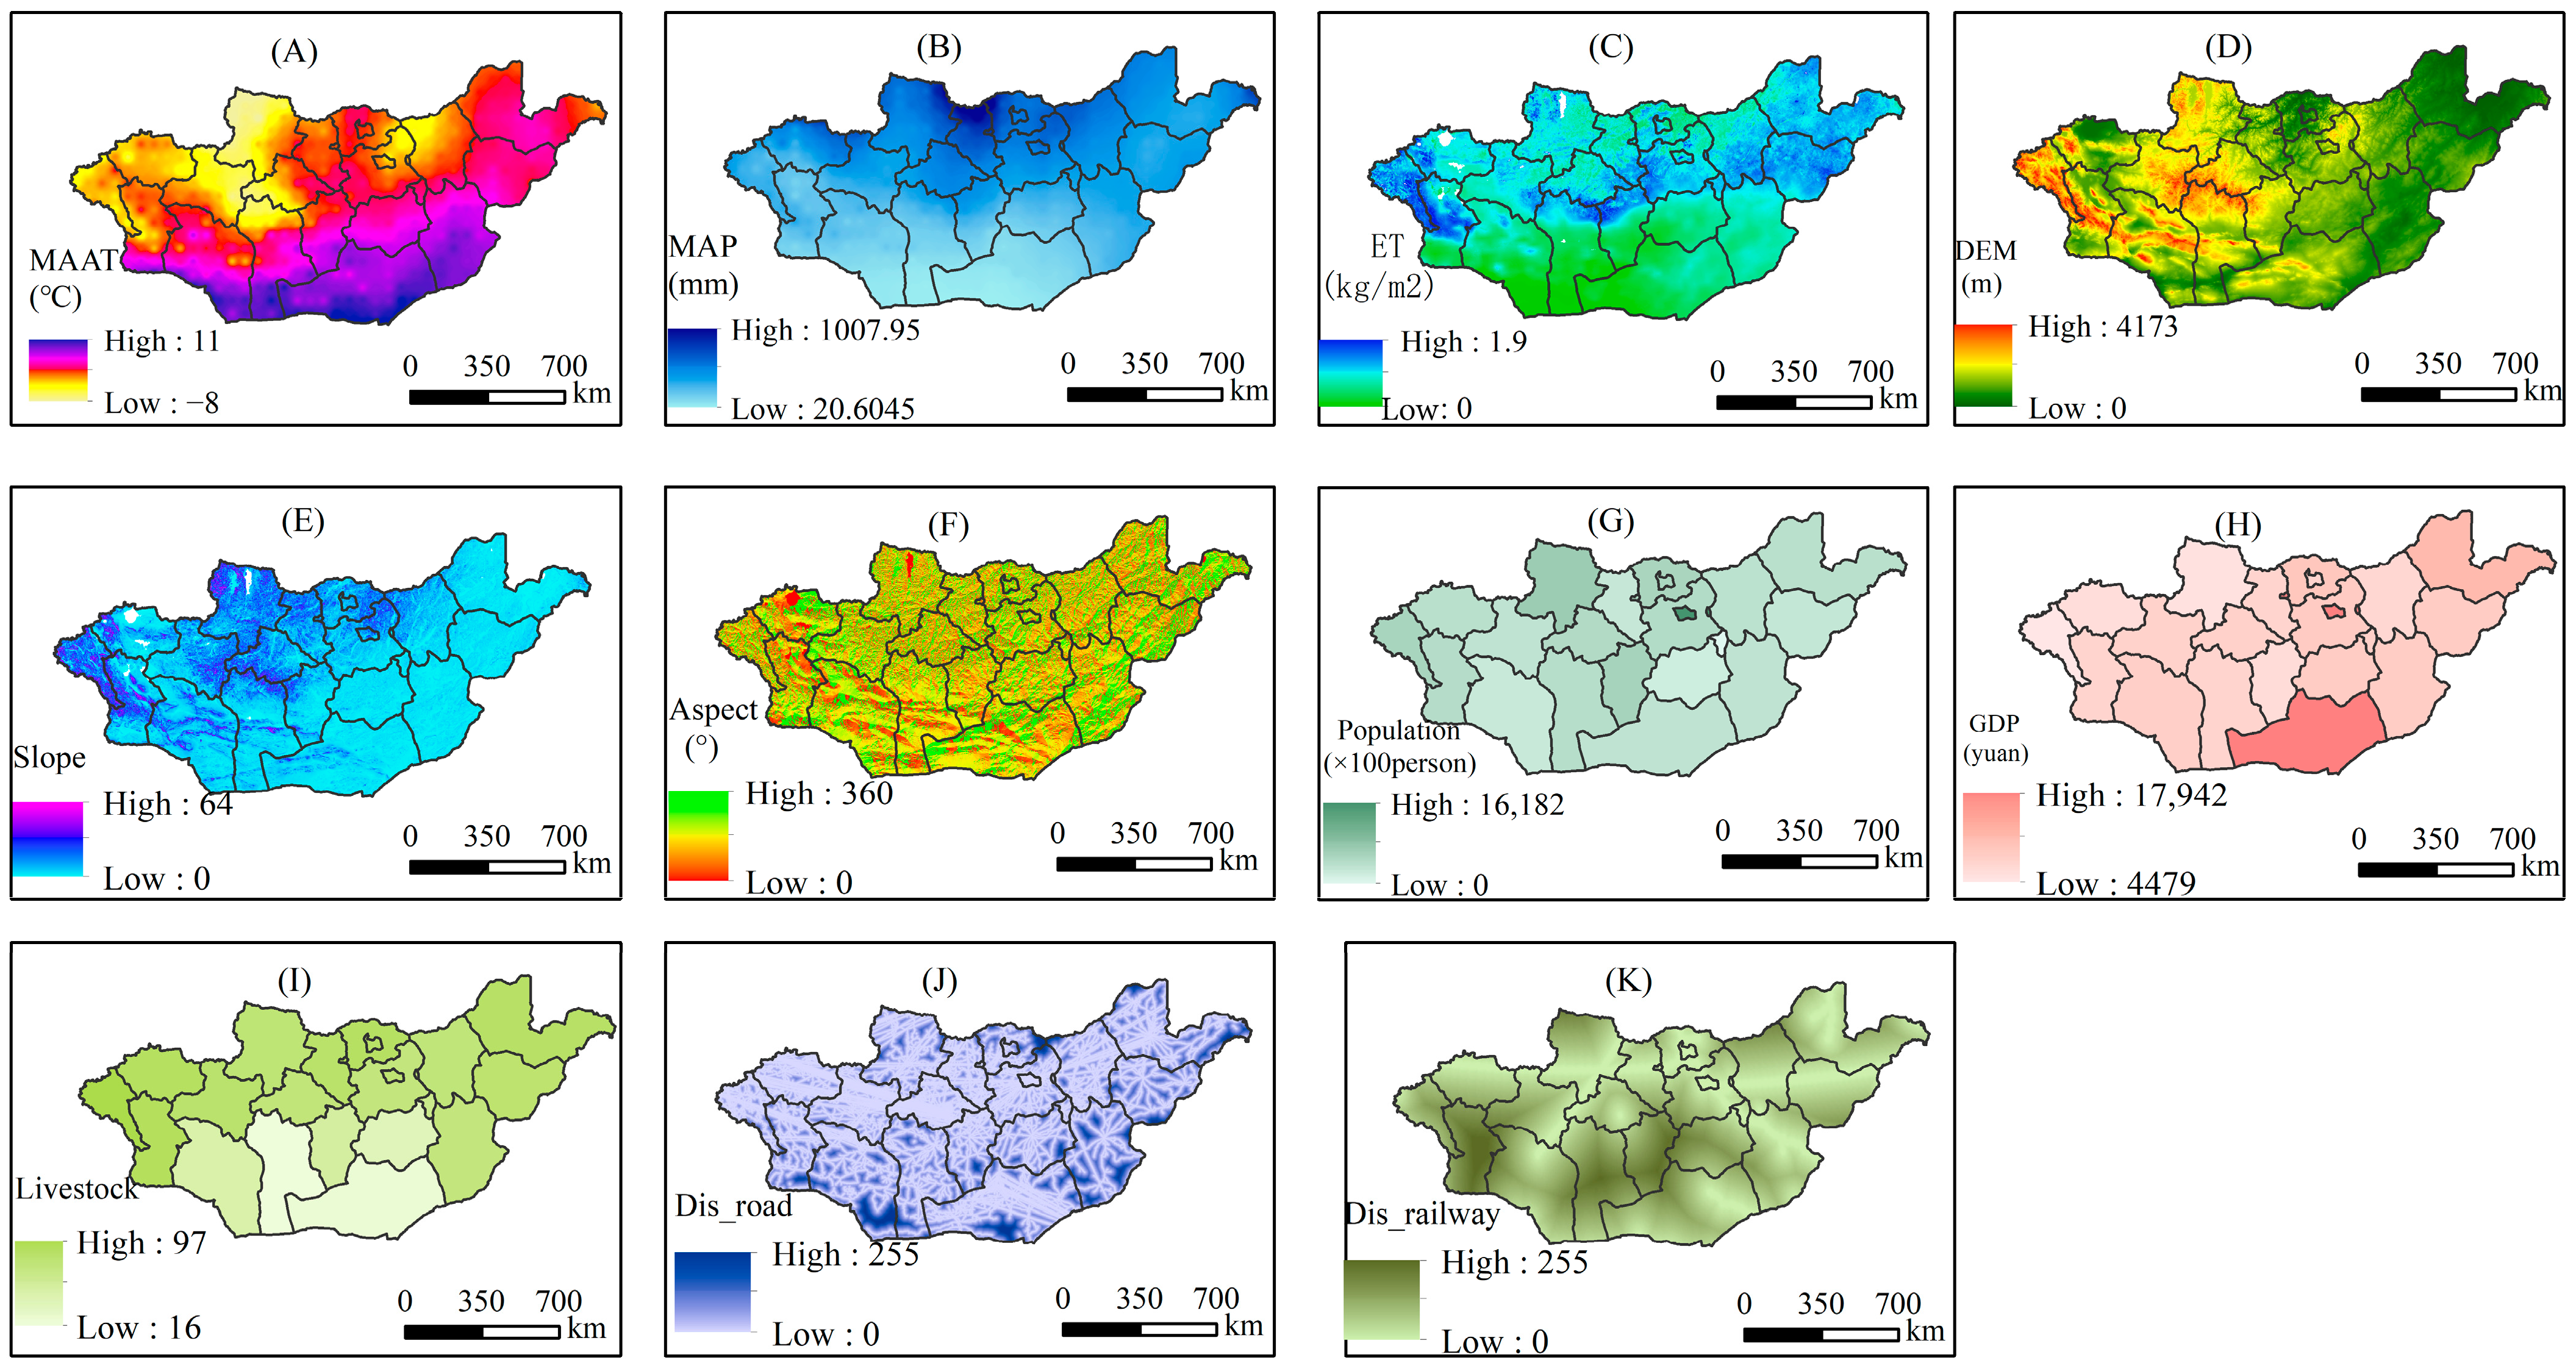
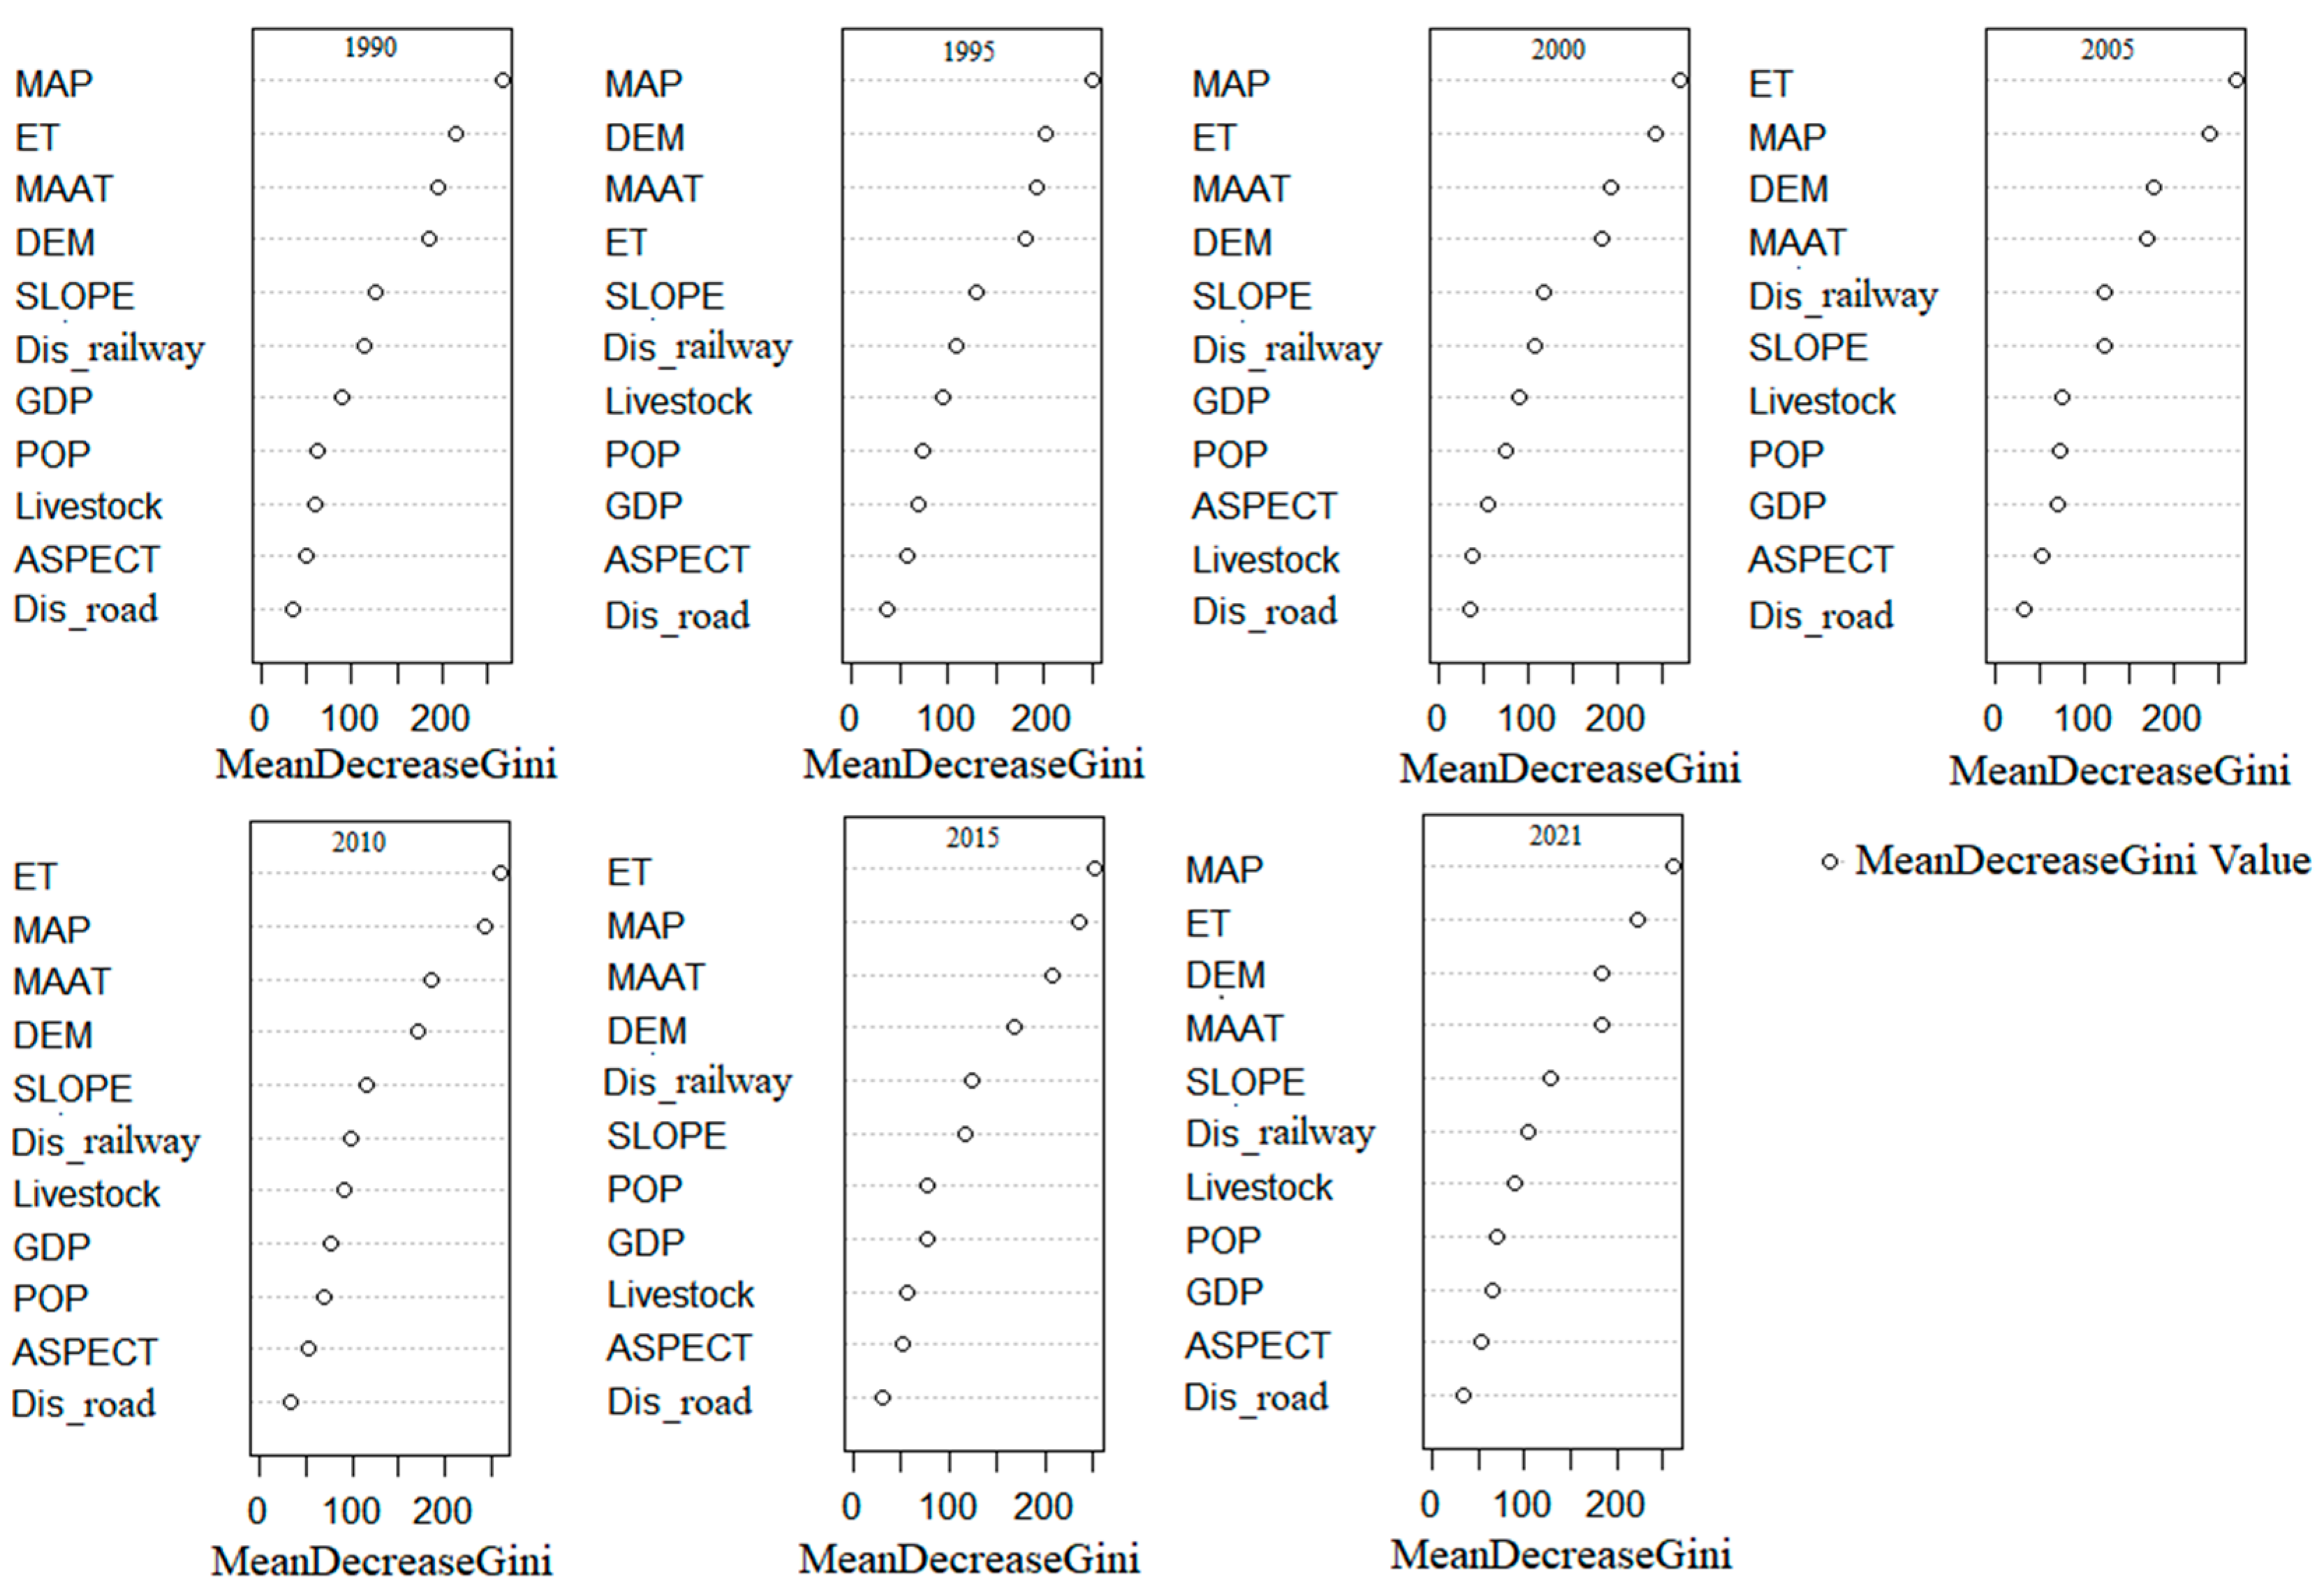
3.3. Influencing Factors of LUCC
4. Discussion
4.1. Validation
4.2. Reasons for Land Use Change
4.3. Analysis of the LUCC Pattern in Mongolia and Globally
5. Conclusions
Supplementary Materials
Author Contributions
Funding
Data Availability Statement
Acknowledgments
Conflicts of Interest
References
- Perminova, T.; Sirina, N.; Laratte, B.; Baranovskaya, N.; Rikhvanov, L. Methods for Land Use Impact Assessment: A Review. Environ. Impact Assess. Rev. 2016, 60, 64–74. [Google Scholar] [CrossRef]
- Affeld, K.; Wiser, S.K.; Payton, I.J.; DeCáceres, M. Using Classification Assignment Rules to Assess Land-Use Change Impacts on Forest Biodiversity at Local-to-National Scales. For. Ecosyst. 2018, 5, 162–176. [Google Scholar] [CrossRef] [Green Version]
- Stoerk, T.; Wagner, G.; Ward, R.E.T. Recommendations for Improving the Treatment of Risk and Uncertainty in Economic Estimates of Climate Impacts in the Sixth Intergovernmental Panel on Climate Change Assessment Report. Rev. Environ. Econ. Policy 2018, 12, 371–376. [Google Scholar] [CrossRef] [Green Version]
- Winkler, K.; Fuchs, R.; Rounsevell, M.; Herold, M. Global Land Use Changes Are Four Times Greater than Previously Estimated. Nat. Commun. 2021, 12, 2501. [Google Scholar] [CrossRef]
- Gilck, F.; Poschlod, P. The History of Human Land Use Activities in the Northern Alps since the Neolithic Age. A Reconstruction of Vegetation and Fire History in the Mangfall Mountains (Bavaria, Germany). Holocene 2021, 31, 579–591. [Google Scholar] [CrossRef]
- McGowan, P.J.K. Conservation: Mapping the Terrestrial Human Footprint. Nature 2016, 537, 172–173. [Google Scholar] [CrossRef] [Green Version]
- Chilukoti, N.; Xue, Y. An Assessment of Potential Climate Impact during 1948–2010 Using Historical Land Use Land Cover Change Maps. Int. J. Climatol. 2021, 41, 295–315. [Google Scholar] [CrossRef]
- He, X.; Liang, J.; Zeng, G.; Yuan, Y.; Li, X. The Effects of Interaction between Climate Change and Land-Use/Cover Change on Biodiversity-Related Ecosystem Services. Glob. Chall. 2019, 3, 1800095. [Google Scholar] [CrossRef] [PubMed] [Green Version]
- Yan, M.; Liu, J.; Wang, Z. Global Climate Responses to Land Use and Land Cover Changes over the Past Two Millennia. Atmosphere 2017, 8, 64. [Google Scholar] [CrossRef] [Green Version]
- Pongratz, J.; Dolman, H.; Don, A.; Erb, K.H.; Fuchs, R.; Herold, M.; Jones, C.; Kuemmerle, T.; Luyssaert, S.; Meyfroidt, P.; et al. Models Meet Data: Challenges and Opportunities in Implementing Land Management in Earth System Models. Glob. Chang. Biol. 2018, 24, 1470–1487. [Google Scholar] [CrossRef] [Green Version]
- Newbold, T.; Hudson, L.N.; Hill, S.L.L.; Contu, S.; Lysenko, I.; Senior, R.A.; Börger, L.; Bennett, D.J.; Choimes, A.; Collen, B.; et al. Global Effects of Land Use on Local Terrestrial Biodiversity. Nature 2015, 520, 45–50. [Google Scholar] [CrossRef] [PubMed] [Green Version]
- Grimm, N.B.; Faeth, S.H.; Golubiewski, N.E.; Redman, C.L.; Wu, J.; Bai, X.; Briggs, J.M. Global Change and the Ecology of Cities. Science 2008, 319, 756–760. [Google Scholar] [CrossRef] [PubMed] [Green Version]
- Findell, K.L.; Berg, A.; Gentine, P.; Krasting, J.P.; Lintner, B.R.; Malyshev, S.; Santanello, J.A.; Shevliakova, E. The Impact of Anthropogenic Land Use and Land Cover Change on Regional Climate Extremes. Nat. Commun. 2017, 8, 989. [Google Scholar] [CrossRef] [PubMed] [Green Version]
- Hessl, A.E.; Anchukaitis, K.J.; Jelsema, C.; Cook, B.; Byambasuren, O.; Leland, C.; Nachin, B.; Pederson, N.; Tian, H.; Hayles, L.A. Past and Future Drought in Mongolia. Sci. Adv. 2018, 4, 1–8. [Google Scholar] [CrossRef] [Green Version]
- Lamchin, M.; Lee, J.; Lee, W.; Lee, E.J.; Kim, M.; Lim, C.; Choi, H.; Kim, S.-R. Assessment of Land Cover Change and Desertification Using Remote Sensing Technology in a Local Region of Mongolia. Adv. Sp. Res. 2015, 57, 64–77. [Google Scholar] [CrossRef]
- Tsalis, T.A.; Malamateniou, K.E.; Koulouriotis, D.; Nikolaou, I.E. New Challenges for Corporate Sustainability Reporting: United Nations’ 2030 Agenda for Sustainable Development and the Sustainable Development Goals. Corp. Soc. Responsib. Environ. Manag. 2020, 27, 1617–1629. [Google Scholar] [CrossRef]
- Liang, X.; Li, P.; Wang, J.; Chan, F.K.S.; Togtokh, C.; Ochir, A.; Davaasuren, D. Research Progress of Desertification and Its Prevention in Mongolia. Sustainability 2021, 13, 6861. [Google Scholar] [CrossRef]
- FROM-GLC (10–30 m, 2015, 2017, China). Available online: http//data.ess.tsinghua.edu.cn/ (accessed on 3 February 2022).
- Esri Land Cover (10 m, 2017–2021, ESA). Available online: https//www.esri.com/en-us/home (accessed on 3 February 2018).
- Globe Land 30 (30 m, 2000, 2010, 2020, China). Available online: http//data.ess.tsinghua.edu.cn/ (accessed on 3 February 2022).
- Global Land Survey (30 m, 1975–2012, USGS). Available online: https//www.usgs.gov/ (accessed on 3 February 2022).
- Climate Change Initiative Land Cover V2 (300 m, 1992–2020, ESA). Available online: https//www.esa-landcover-cci.org/ (accessed on 3 February 2022).
- MODIS Land Cover Type/Dynamics (0.5–1 Km, 2001–2020, NASA). Available online: https//lpdaac.usgs.gov (accessed on 3 February 2022).
- Xu, L.; Herold, M.; Tsendbazar, N.-E.; Masiliunas, D.; Li, L.; Lesiv, M.; Fritz, S.; Verbesselt, J. Time Series Analysis for Global Land Cover Change Monitoring: A Comparison across Sensors. Remote Sens. Environ. 2022, 271, 112905. [Google Scholar] [CrossRef]
- Nasiri, V.; Deljouei, A.; Moradi, F.; Sadeghi, S.; Moein, M.; Borz, S.A. Land Use and Land Cover Mapping Using Sentinel-2, Landsat-8 Satellite Images, and Google Earth Engine: A Comparison of Two Composition Methods. Remote Sens. 2022, 14, 1977. [Google Scholar] [CrossRef]
- Choi, M.J.; Enkhbat, U. Distributional Effects of Ger Area Redevelopment in Ulaanbaatar, Mongolia. Int. J. Urban Sci. 2020, 24, 50–68. [Google Scholar] [CrossRef]
- Wei, Y.; Zhen, L.; Liu, X.; Batkhishig, O. Land Use Change and Its Driving Factors in Mongolia from 1992 to 2005. Chin. J. Appl. Ecol. 2008, 19, 1995–2002. [Google Scholar] [CrossRef]
- Vittek, M.; Brink, A.; Donnay, F.; Simonetti, D.; Desclée, B. Land Cover Change Monitoring Using Landsat MSS/TM Satellite Image Data over West Africa between 1975 and 1990. Remote Sens. 2013, 6, 658–676. [Google Scholar] [CrossRef] [Green Version]
- Liu, S.; Liu, X.; Yu, L.; Wang, Y.; Zhang, G.J.; Gong, P.; Huang, W.; Wang, B.; Yang, M.; Cheng, Y. Climate Response to Introduction of the ESA CCI Land Cover Data to the NCAR CESM. Clim. Dyn. 2021, 56, 4109–4127. [Google Scholar] [CrossRef]
- Ersi, C.; Bayaer, T.; Bao, Y.; Bao, Y.; Yong, M.; Zhang, X. Temporal and Spatial Changes in Evapotranspiration and Its Potential Driving Factors in Mongolia over the Past 20 Years. Remote Sens. 2022, 14, 1856. [Google Scholar] [CrossRef]
- Li, G.; Wang, J.; Wang, Y.; Wei, H.; Ochir, A.; Davaasuren, D.; Chonokhuu, S.; Nasanbat, E. Spatial and Temporal Variations in Grassland Production from 2006 to 2015 in Mongolia along the China-Mongolia Railway. Sustainability 2019, 11, 2177. [Google Scholar] [CrossRef] [Green Version]
- Tsalis, T.A.; Malamateniou, K.E.; Koulouriotis, D.; Nikolaou, I.E. Land Cover Change Analysis to Assess Sustainability of Development in the Mongolian Plateau over 30 Years. Sustainability 2022, 14, 6129. [Google Scholar] [CrossRef]
- Wang, J.; Cheng, K.; Liu, Q.; Zhu, J.; Ochir, A.; Davaasuren, D.; Li, G.; Wei, H.; Chonokhuu, S.; Namsrai, O.; et al. Land Cover Patterns in Mongolia and Their Spatiotemporal Changes from 1990 to 2010. Arab. J. Geosci. 2019, 12, 1–13. [Google Scholar] [CrossRef]
- Ma, L.; Li, M.; Ma, X.; Cheng, L.; Du, P.; Liu, Y. A Review of Supervised Object-Based Land-Cover Image Classification. ISPRS J. Photogramm. Remote Sens. 2017, 130, 277–293. [Google Scholar] [CrossRef]
- Xie, T.; Yuan, Z.; Yang, H.; Jiang, M.; Liao, Z.; Xu, C. Review of Land Use/Cover Change Classification Methods Based on Remote Sensing Image. Front. Earth Sci. 2020, 10, 500–507. [Google Scholar] [CrossRef]
- Hassan Khavarian Nehzak, M.A.; Mostafazadeh, R. Hamidreza Rabiei-Dastjerdi Chapter 5 - Assessment of Machine Learning Algorithms in Land Use Classification, Comput. Earth Environ. Sci. 2022, 97–104. [Google Scholar] [CrossRef]
- Alshari, E.A.; Gawali, B.W. Development of Classification System for LULC Using Remote Sensing and GIS. Glob. Transitions Proc. 2021, 2, 8–17. [Google Scholar] [CrossRef]
- Ettehadi Osgouei, P.; Kaya, S. Analysis of Land Cover/Use Changes Using Landsat 5 TM Data and Indices. Environ. Monit. Assess. 2017, 189, 1–11. [Google Scholar] [CrossRef]
- Rivera, S.; Lowry, J.H.; Hernandez, A.J.; Ramsey, R.D.; Lezama, R.; Velasquez, M.A. A Comparison between Cluster Busting Technique and a Classification Tree Algorithm of a Moderate Resolution Imaging Spectrometer (MODIS) Land Cover Map of Honduras. Geocarto Int. 2012, 27, 17–29. [Google Scholar] [CrossRef]
- Sang, X.; Guo, Q.; Wu, X.; Fu, Y.; Xie, T.; He, C.; Zang, J. Intensity and Stationarity Analysis of Land Use Change Based on CART Algorithm. Sci. Rep. 2019, 9, 12279. [Google Scholar] [CrossRef] [PubMed] [Green Version]
- Gislason, P.O.; Benediktsson, J.A.; Sveinsson, J.R. Random Forests for Land Cover Classification. Pattern Recognit. Lett. 2006, 27, 294–300. [Google Scholar] [CrossRef]
- Nguyen, L.H.; Joshi, D.R.; Clay, D.E.; Henebry, G.M. Characterizing Land Cover/Land Use from Multiple Years of Landsat and MODIS Time Series: A Novel Approach Using Land Surface Phenology Modeling and Random Forest Classifier. Remote Sens. Environ. 2020, 238. [Google Scholar] [CrossRef]
- Spinoni, J.; Barbosa, P.; Bucchignani, E.; Cassano, J.; Cavazos, T.; Cescatti, A.; Christensen, J.H.; Christensen, O.B.; Coppola, E.; Evans, J.P.; et al. Global Exposure of Population and Land-Use to Meteorological Droughts under Different Warming Levels and SSPs: A CORDEX-Based Study. Int. J. Climatol. 2021, 41, 6825–6853. [Google Scholar] [CrossRef]
- Sakamoto, K.; Tomonari, M.; Ariya, U.; Nakagiri, E.; Matsumoto, T.K.; Akaji, Y.; Otoda, T.; Hirobe, M.; Nachin, B. Effects of Large-Scale Forest Fire Followed by Illegal Logging on the Regeneration of Boreal Forests in Mongolia. Landsc. Ecol. Eng. 2021, 17, 267–279. [Google Scholar] [CrossRef]
- Xu, Y.; Zhang, Y.; Chen, J.; John, R. Livestock Dynamics under Changing Economy and Climate in Mongolia. Land Use Policy 2019, 88, 104120. [Google Scholar] [CrossRef]
- Mandakh, N.; Tsogtbaatar, J.; Dash, D.; Khudulmur, S. Spatial Assessment of Soil Wind Erosion Using WEQ Approach in Mongolia. J. Geogr. Sci. 2016, 26, 473–483. [Google Scholar] [CrossRef] [Green Version]
- Li, Y.; Wang, J.; Zhu, J. Landscape Pattern Analysis of Mongolia Based on the Geographical Partitions. Arid L. Geogr. 2016, 39, 817–827. [Google Scholar]
- Wang, J.; Wei, H.; Cheng, K.; Ochir, A.; Shao, Y.; Yao, J.; Wu, Y.; Han, X.; Davaasuren, D.; Chonokhuu, S.; et al. Updatable Dataset Revealing Decade Changes in Land Cover Types in Mongolia. Geosci. Data J. 2022, 9, 341–354. [Google Scholar] [CrossRef]
- Sanzheev, E.D.; Mikheeva, A.S.; Osodoev, P.V.; Batomunkuev, V.S.; Tulokhonov, A.K. Theoretical Approaches and Practical Assessment of Socio-Economic Effects of Desertification in Mongolia. Int. J. Environ. Res. Public Health 2020, 17, 4068. [Google Scholar] [CrossRef] [PubMed]
- Wang, J.; Wei, H.; Cheng, K.; Ochir, A.; Davaasuren, D.; Li, P.; Shun Chan, F.K.; Nasanbat, E. Spatio-Temporal Pattern of Land Degradation from 1990 to 2015 in Mongolia. Environ. Dev. 2020, 34, 100497. [Google Scholar] [CrossRef]
- The Climate in Mongolia. Available online: https//www.worlddata.info/asia/mongolia/climate.php (accessed on 3 February 2018).
- Vandandorj, S.; Munkhjargal, E.; Boldgiv, B.; Gantsetseg, B. Changes in Event Number and Duration of Rain Types over Mongolia from 1981 to 2014. Environ. Earth Sci. 2017, 76, 70. [Google Scholar] [CrossRef] [Green Version]
- Dugarsuren, N.; Lin, C.; Tsogt, H. Land Cover Change Detection in Mongolia in Last Decade Using Modis Imagery. Remote Sens. 2011, 4, 2750–2755. [Google Scholar]
- Punsantsogvoo, T. Implications of Rural Settlement Patterns for Development: Case Study in Central and Eastern Economic Region of Mongolia. Proc. Mong. Acad. Sci. 2019, 59, 14–20. [Google Scholar] [CrossRef]
- Map Cruzin Data Research & GIS Project Specialist. Available online: https//mapcruzin.com/ (accessed on 1 May 2022).
- Fang, X.; Zhao, W.; Zhang, C.; Zhang, D.; Wei, X.; Qiu, W.; Ye, Y. Methodology for Credibility Assessment of Historical Global LUCC Datasets. Sci. China Earth Sci. 2020, 63, 1013–1025. [Google Scholar] [CrossRef]
- Soni, P.K.; Rajpal, N.; Mehta, R.; Mishra, V.K. Urban Land Cover and Land Use Classification Using Multispectral Sentinal-2 Imagery. Multimed. Tools Appl. 2022, 81, 36853–36867. [Google Scholar] [CrossRef]
- Gorelick, N.; Hancher, M.; Dixon, M.; Ilyushchenko, S.; Thau, D.; Moore, R. Google Earth Engine: Planetary-Scale Geospatial Analysis for Everyone. Remote Sens. Environ. 2017, 202, 18–27. [Google Scholar] [CrossRef]
- Mas, J.F.; de Araújo, F.S. Assessing Landsat Images Availability and Its Effects on Phenological Metrics. Forests 2021, 12, 574. [Google Scholar] [CrossRef]
- Cao, R.; Feng, Y.; Chen, J.; Zhou, J. A Supplementary Module to Improve Accuracy of the Quality Assessment Band in Landsat Cloud Images. Remote Sens. 2021, 13, 4947. [Google Scholar] [CrossRef]
- Li, G.; Sun, S.; Fang, C. The Varying Driving Forces of Urban Expansion in China: Insights from a Spatial-Temporal Analysis. Landsc. Urban Plan. 2018, 174, 63–77. [Google Scholar] [CrossRef]
- Wu, X.; Liu, H.; Li, X.; Piao, S.; Ciais, P.; Guo, W.; Yin, Y.; Poulter, B.; Peng, C.; Viovy, N.; et al. Higher Temperature Variability Reduces Temperature Sensitivity of Vegetation Growth in Northern Hemisphere. Geophys. Res. Lett. 2017, 44, 6173–6181. [Google Scholar] [CrossRef]
- Li, X.; Guo, W.; Chen, J.; Ni, X.; Wei, X. Responses of Vegetation Green-up Date to Temperature Variation in Alpine Grassland on the Tibetan Plateau. Ecol. Indic. 2019, 104, 390–397. [Google Scholar] [CrossRef]
- Hansson, A.; Dargusch, P.; Shulmeister, J. A Review of Modern Treeline Migration, the Factors Controlling It and the Implications for Carbon Storage. J. Mt. Sci. 2021, 18, 291–306. [Google Scholar] [CrossRef]
- Bai, Y.; Wu, J.; Xing, Q.; Pan, Q.; Huang, J.; Yang, D.; Han, X. Primary Production and Rain Use Efficiency across a Precipitation Gradient on the Mongolia Plateau. Ecology 2008, 89, 2140–2153. [Google Scholar] [CrossRef]
- Bai, W.; Wan, S.; Niu, S.; Liu, W.; Chen, Q.; Wang, Q.; Zhang, W.; Han, X.; Li, L. Increased Temperature and Precipitation Interact to Affect Root Production, Mortality, and Turnover in a Temperate Steppe: Implications for Ecosystem C Cycling. Glob. Chang. Biol. 2010, 16, 1306–1316. [Google Scholar] [CrossRef]
- Miehe, G.; Schlütz, F.; Miehe, S.; Opgenoorth, L.; Cermak, J.; Samiya, R.; Jäger, E.J.; Wesche, K. Mountain Forest Islands and Holocene Environmental Changes in Central Asia: A Case Study from the Southern Gobi Altay, Mongolia. Palaeogeogr. Palaeoclimatol. Palaeoecol. 2007, 250, 150–166. [Google Scholar] [CrossRef]
- Miao, H.; Chen, S.; Chen, J.; Zhang, W.; Zhang, P.; Wei, L.; Han, X.; Lin, G. Cultivation and Grazing Altered Evapotranspiration and Dynamics in Inner Mongolia Steppes. Agric. For. Meteorol. 2009, 149, 1810–1819. [Google Scholar] [CrossRef]
- Horel, Á.; Zsigmond, T.; Farkas, C.; Gelybó, G.; Tóth, E.; Kern, A.; Bakacsi, Z. Climate Change Alters Soil Water Dynamics under Different Land Use Types. Sustainability 2022, 14, 3908. [Google Scholar] [CrossRef]
- Berihun, M.L.; Tsunekawa, A.; Haregeweyn, N.; Meshesha, D.T.; Adgo, E.; Tsubo, M.; Masunaga, T.; Fenta, A.A.; Sultan, D.; Yibeltal, M. Exploring Land Use/Land Cover Changes, Drivers and Their Implications in Contrasting Agro-Ecological Environments of Ethiopia. Land Use Policy 2019, 87, 104052. [Google Scholar] [CrossRef]
- Wu, F.; Mo, C.; Dai, X. Analysis of the Driving Force of Land Use Change Based on Geographic Detection and Simulation of Future Land Use Scenarios. Sustainability 2022, 14, 5254. [Google Scholar] [CrossRef]
- Ruan, X.; Qiu, F.; Dyck, M. The Effects of Environmental and Socioeconomic Factors on Land-Use Changes: A Study of Alberta, Canada. Environ. Monit. Assess. 2016, 188, 1–31. [Google Scholar] [CrossRef]
- Wang, Y.; Xia, T.; Shataer, R.; Zhang, S.; Li, Z. Analysis of Characteristics and Driving Factors of Land-Use Changes in the Tarim River Basin from 1990 to 2018. Sustainability 2021, 13, 10263. [Google Scholar] [CrossRef]
- Wilkin, S.; Ventresca Miller, A.; Miller, B.K.; Spengler, R.N.; Taylor, W.T.T.; Fernandes, R.; Hagan, R.W.; Bleasdale, M.; Zech, J.; Ulziibayar, S.; et al. Economic Diversification Supported the Growth of Mongolia’s Nomadic Empires. Sci. Rep. 2020, 10, 3916. [Google Scholar] [CrossRef] [Green Version]
- Wei, Y.; Zhen, L. The Dynamics of Livestock and Its Influencing Factors on the Mongolian Plateau. Environ. Dev. 2020, 34, 100518. [Google Scholar] [CrossRef]
- Reguzzoni, M.; Carrion, D.; De Gaetani, C.I.; Albertella, A.; Rossi, L.; Sona, G.; Batsukh, K.; Herrera, J.F.T.; Elger, K.; Barzaghi, R.; et al. Open Access to Regional Geoid Models: The International Service for the Geoid. Earth Syst. Sci. Data 2021, 13, 1653–1666. [Google Scholar] [CrossRef]
- Fu, Y.; Zhang, Y. Research on Temporal and Spatial Evolution of Land Use and Landscape Pattern in Anshan City Based on GEE. Front. Environ. Sci. 2022, 10, 1–17. [Google Scholar] [CrossRef]
- Giles, M. Foody Status of Land Cover Classification Accuracy Assessment. Remote Sens. Environ. 2002, 80, 185–201. [Google Scholar] [CrossRef]
- Paul, A.; Mukherjee, D.P.; Member, S.; Das, P.; Gangopadhyay, A. Improved Random Forest for Classification. IEEE Trans. Image Process. 2018, 7149, 1–13. [Google Scholar] [CrossRef]
- Naikoo, M.W.; Talukdar, S.; Ishtiaq, M.; Rahman, A. Modelling Built-up Land Expansion Probability Using the Integrated Fuzzy Logic and Coupling Coordination Degree Model. J. Environ. Manag. 2023, 325, 116441. [Google Scholar] [CrossRef] [PubMed]
- Belgiu, M.; Drăgu, L. Random Forest in Remote Sensing: A Review of Applications and Future Directions. ISPRS J. Photogramm. Remote Sens. 2016, 114, 24–31. [Google Scholar] [CrossRef]
- Ghorbanian, A.; Zaghian, S.; Asiyabi, R.M.; Amani, M.; Mohammadzadeh, A.; Jamali, S. Mangrove Ecosystem Mapping Using Sentinel-1 and Sentinel-2 Satellite Images and Random Forest Algorithm in Google Earth Engine. Remote Sens. 2021, 13, 2565. [Google Scholar] [CrossRef]
- Cui, J.; Zhu, M.; Liang, Y.; Qin, G.; Li, J.; Liu, Y. Land Use/Land Cover Change and Their Driving Factors in the Yellow River Basin of Shandong Province Based on Google Earth Engine from 2000 to 2020. ISPRS Int. J. Geo-Information 2022, 11, 163. [Google Scholar] [CrossRef]
- Zhang, D.D.; Zhang, L. Land Cover Change in the Central Region of the Lower Yangtze River Based on Landsat Imagery and the Google Earth Engine: A Case Study in Nanjing, China. Sensors 2020, 20, 2091. [Google Scholar] [CrossRef] [Green Version]
- Liu, C.; Li, W.; Zhu, G.; Zhou, H.; Yan, H.; Xue, P. Land Use/Land Cover Changes and Their Driving Factors in the Northeastern Tibetan Plateau Based on Geographical Detectors and Google Earth Engine: A Case Study in Gannan Prefecture. Remote Sens. 2020, 12, 3139. [Google Scholar] [CrossRef]
- Fitoka, E.; Tompoulidou, M.; Hatziiordanou, L.; Apostolakis, A.; Höfer, R.; Weise, K.; Ververis, C. Water-Related Ecosystems’ Mapping and Assessment Based on Remote Sensing Techniques and Geospatial Analysis: The SWOS National Service Case of the Greek Ramsar Sites and Their Catchments. Remote Sens. Environ. 2020, 245, 111795. [Google Scholar] [CrossRef]
- Zhang, M.; Du, H.; Mao, F.; Zhou, G.; Li, X.; Dong, L.; Zheng, J.; Zhu, D.; Liu, H.; Huang, Z.; et al. Spatiotemporal Evolution of Urban Expansion Using Landsat Time Series Data and Assessment of Its Influences on Forests. ISPRS Int. J. Geo-Information 2020, 9, 64. [Google Scholar] [CrossRef] [Green Version]
- Ghulam, A. Monitoring Tropical Forest Degradation in Betampona Nature Reserve, Madagascar Using Multisource Remote Sensing Data Fusion. IEEE J. Sel. Top. Appl. Earth Obs. Remote Sens. 2014, 7, 4960–4971. [Google Scholar] [CrossRef]
- Zou, D.; Zhao, L.; Liu, G.; Du, E.; Hu, G.; Li, Z.; Wu, T.; Wu, X.; Chen, J. Vegetation Mapping in the Permafrost Region: A Case Study on the Central Qinghai-Tibet Plateau. Remote Sens. 2022, 14, 232. [Google Scholar] [CrossRef]
- Cheng, K.; Wang, J. Forest Type Classification Based on Integrated Spectral-Spatial-Temporal Features and Random Forest Algorithm-A Case Study in the Qinling Mountains. Forests 2019, 10, 559. [Google Scholar] [CrossRef]
- Wickham, J.; Stehman, S.V.; Gass, L.; Dewitz, J.A.; Sorenson, D.G.; Granneman, B.J.; Poss, R.V.; Baer, L.A. The-matic Accuracy Assessment of the 2011 National Land Cover Database (NLCD). Remote Sens. Environ. 2017, 191, 328–341. [Google Scholar] [CrossRef] [PubMed] [Green Version]
- Pontius, R.G.; Huang, J.; Jiang, W.; Khallaghi, S.; Lin, Y.; Liu, J.; Quan, B.; Ye, S. Rules to Write Mathematics to Clarify Metrics Such as the Land Use Dynamic Degrees. Landsc. Ecol. 2017, 32, 2249–2260. [Google Scholar] [CrossRef]
- Jun, C.; Ban, Y.; Li, S. Open Access to Earth Land-Cover Map. Nature 2014, 514, 434. [Google Scholar] [CrossRef] [Green Version]
- Pluto-Kossakowska, J. Review on Multitemporal Classification Methods of Satellite Images for Crop and Arable Land Recognition. Agriculture 2021, 11, 999. [Google Scholar] [CrossRef]
- Li, M.; Li, X.; Liu, S.; Lyu, X.; Dang, D.; Dou, H.; Wang, K. Analysis of the Spatiotemporal Variation of Landscape Patterns and Their Driving Factors in Inner Mongolia from 2000 to 2015. Land 2022, 11, 1410. [Google Scholar] [CrossRef]
- Li, J.; Chen, H.; Zhang, C.; Pan, T. Variations in Ecosystem Service Value in Response to Land Use/Land Cover Changes in Central Asia from 1995-2035. PeerJ 2019, 7, e7665. [Google Scholar] [CrossRef] [Green Version]
- Henchiri, M.; Ali, S.; Essifi, B.; Kalisa, W.; Zhang, S.; Bai, Y. Monitoring Land Cover Change Detection with NOAA-AVHRR and MODIS Remotely Sensed Data in the North and West of Africa from 1982 to 2015. Environ. Sci. Pollut. Res. 2020, 27, 5873–5889. [Google Scholar] [CrossRef]
- De Rosa, M.; Vestergaard Odgaard, M.; Staunstrup, J.K.; Trydeman Knudsen, M.; Hermansen, J.E. Identifying Land Use and Land-Use Changes (LULUC): A Global LULUC Matrix. Environ. Sci. Technol. 2017, 51, 7954–7962. [Google Scholar] [CrossRef] [Green Version]
- Qin, F.; Jia, G.; Yang, J.; Na, Y.; Hou, M.; Narenmandula. Spatiotemporal Variability of Precipita-tion during 1961–2014 across the Mongolian Plateau. J. Mt. Sci. 2018, 15, 992–1005. [Google Scholar] [CrossRef]
- Yang, T.; Li, P.; Wu, X.; Hou, X.; Liu, P.; Yao, G. Assessment of Vulnerability to Climate Change in the Inner Mongolia Steppe at a County Scale from 1980 to 2009. Rangel. J. 2014, 36, 545–555. [Google Scholar] [CrossRef] [Green Version]
- Bliedtner, M.; Strobel, P.; Struck, J.; Salazar, G.; Szidat, S.; Nowaczyk, N.; Bazarradnaa, E.; Lloren, R.; Dubois, N.; Haberzettl, T.; et al. Holocene Temperature Variations in Semi-Arid Central Mongolia—A Chronological and Sedimentological Perspective From a 7400-Year Lake Sediment Record From the Khangai Mountains. Front. Earth Sci. 2022, 10, 910782. [Google Scholar] [CrossRef]
- Ojima, D.S.; Chuluun, T.; Bolortsetseg, B.; Tucker, C.J.; Hicke, J. Eurasian Land Use Impacts on Rangeland Productivity. Geophys. Monogr. Ser. 2004, 153, 293–301. [Google Scholar] [CrossRef]
- Hilker, T.; Natsagdorj, E.; Waring, R.H.; Lyapustin, A.; Wang, Y. Satellite Observed Widespread Decline in Mongolian Grasslands Largely Due to Overgrazing. Glob. Chang. Biol. 2014, 20, 418–428. [Google Scholar] [CrossRef] [Green Version]
- Yao, Z.; Zhang, L.; Tang, S.; Li, X.; Hao, T. The Basic Characteristics and Spatial Patterns of Global Cultivated Land Change since the 1980s. J. Geogr. Sci. 2017, 27, 771–785. [Google Scholar] [CrossRef] [Green Version]
- Buyanduureng. Chelger Agglomeration and Regional Differences of the Mongolia’s Agricultural Industry Based on the Space Economics. Inn. Mong. Soc. Sci. 2017, 38, 184–189. [Google Scholar] [CrossRef]
- Zandariya, B. Improving the Policy Framework for Financial Assurance for Mine Closure in Mongolia. Resour. Policy 2022, 77, 102628. [Google Scholar] [CrossRef]
- Wang, Z.; Wang, H.; Wang, T.; Wang, L.; Liu, X.; Zheng, K.; Huang, X. Large Discrepancies of Global Greening: Indication of Multi-Source Remote Sensing Data. Glob. Ecol. Conserv. 2022, 34, e02016. [Google Scholar] [CrossRef]
- Piao, S.; Wang, X.; Park, T.; Chen, C.; Lian, X.; He, Y.; Bjerke, J.W.; Chen, A.; Ciais, P.; Nemani, R.R.; et al. Characteristics, Drivers and Feedbacks of Global Greening Shilong. Nat. Rev. Earth Environ. 2019, 1, 14–27. [Google Scholar] [CrossRef] [Green Version]
- D’Odorico, P.; Bhattachan, A.; Davis, K.F.; Ravi, S.; Runyan, C.W. Global Desertification: Drivers and Feedbacks. Adv. Water Resour. 2013, 51, 326–344. [Google Scholar] [CrossRef]
- Funk, M.; Sugden, A.M. Degradation Exceeds Deforestation. Science 2013, 369, 1335–1336. [Google Scholar] [CrossRef]
- Zhang, Y.; Wang, Q.; Wang, Z.; Yang, Y.; Li, J. Impact of Human Activities and Climate Change on the Grassland Dynamics under Different Regime Policies in the Mongolian Plateau. Sci. Total Environ. 2020, 698, 134304. [Google Scholar] [CrossRef]
- Park, H.; Fan, P.; John, R.; Chen, J. Urbanization on the Mongolian Plateau after Economic Reform: Changes and Causes. Appl. Geogr. 2017, 86, 118–127. [Google Scholar] [CrossRef]
- Dashpurev, B.; Bendix, J.; Lehnert, L.W. Monitoring Oil Exploitation Infrastructure and Dirt Roads with Object-Based Image Analysis and Random Forest in the Eastern Mongolian Steppe. Remote Sens. 2020, 12, 144. [Google Scholar] [CrossRef] [Green Version]
- Krausmann, F.; Langthaler, E. Food Regimes and Their Trade Links: A Socio-Ecological Perspective. Ecol. Econ. 2019, 160, 87–95. [Google Scholar] [CrossRef]
- Yekimovskaya, O.A.; Lopatina, D.N. The Features of Development of Agricultural Land Use in the Republic of Buryatia and Mongolia (the Selenga River Basin). IOP Conf. Ser. Earth Environ. Sci. 2019, 320, 012007. [Google Scholar] [CrossRef]
- Shao, C.; Chen, J.; Li, L.; Dong, G.; Han, J.; Abraha, M.; John, R. Grazing Effects on Surface Energy Fluxes in a Desert Steppe on the Mongolian Plateau. Ecol. Appl. 2017, 27, 485–502. [Google Scholar] [CrossRef]
- Jin, L.; Zhang, J.; Wang, R.; Zhang, M.; Bao, Y.; Guo, E.; Wang, Y. Analysis for Spatio-Temporal Variation Characteristics of Droughts in Different Climatic Regions of the Mongolian Plateau Based on SPEI. Sustainability 2019, 11, 5767. [Google Scholar] [CrossRef] [Green Version]
- Meng, X.; Gao, X.; Li, S.; Li, S.; Lei, J. Monitoring Desertification in Mongolia Based on Landsat Images and Google Earth Engine from 1990 to 2020. Ecol. Indic. 2021, 129, 107908. [Google Scholar] [CrossRef]
- Kimura, R.; Moriyama, M. Use of a Modis Satellite-Based Aridity Index to Monitor Drought Conditions in Mongolia from 2001 to 2013. Remote Sens. 2021, 13, 2561. [Google Scholar] [CrossRef]


| Data Type | Time | Data Sources | Data Website Address | |
|---|---|---|---|---|
| Image data | Landsat 5 (TM)SR | 1990–2012 | USGS | www.usgs.gov |
| Landsat 8 (OLI)SR | 2013–2021 | USGS | www.usgs.gov | |
| DEM | 2000 | NASA | https://srtm.csi.cgiar.org | |
| Land use/cover | 2000–2020 | GlobeLand30 | http://www.globallandcover.com/ | |
| Basic geographic data | Livestock, Population | 1990–2020 | National Bureau of Statistics of Mongolia | http://en.nso.mn |
| ET | 1990–2020 | PML_V2, REA ET | http://poles.tpdc.ac.cn/zh-hans | |
| GDP | 2000–2021 | National Bureau of Statistics of Mongolia | http://en.nso.mn | |
| Road | 1990–2021 | GRIP global roads database | www.globio.info/download-grip-dataset | |
| MAAT, MAP | 1990–2021 | NOVA | www.ncei.noaa.gov | |
| Land use/cover area | 1990–2021 | Mongolian Statistical Yearbook, CAS | http://1212.mn | |
| ID | Land Type | Characteristic | Image Map | Spectrum Curve |
|---|---|---|---|---|
| 1 | Cropland | Land mainly planted with crops, including other economic trees |  |  |
| 2 | Forest | Coverage > 30%, mainly including arbors, bamboos, and other plants |  |  |
| 3 | Built area | Urban residential land, residential land, transportation facilities, and other buildings |  |  |
| 4 | Water | Natural lakes, depressions, rivers, and artificial water conservancy |  |  |
| 5 | Barren | Desert, rock, bare, Gobi, sandy land, and other areas with low vegetation coverage |  |  |
| 6 | Grassland | Coverage > 15%, including desert grassland, meadow grassland, prairie, and other areas |  |  |
| 1990 | 1995 | 2000 | |||||
|---|---|---|---|---|---|---|---|
| Area (km2) | Proportion (%) | Area (km2) | Proportion (%) | Area (km2) | Proportion (%) | ||
| Cropland | 11,985 | 0.73 | 9972 | 0.60 | 11,881 | 0.71 | |
| Forest | 129,645 | 7.93 | 141,098 | 8.56 | 120,431 | 7.36 | |
| Built area | 499 | 0.03 | 539 | 0.03 | 651 | 0.04 | |
| Water | 16,462 | 1.01 | 16,989 | 1.03 | 17,872 | 1.09 | |
| Barren | 723,413 | 44.25 | 696,490 | 42.26 | 770,983 | 47.14 | |
| Grassland | 752,708 | 46.05 | 783,298 | 47.52 | 710,830 | 43.47 | |
| 2005 | 2010 | 2015 | 2021 | ||||
| Area (km2) | Proportion (%) | Area (km2) | Proportion (%) | Area (km2) | Proportion (%) | Area (km2) | Proportion (%) |
| 10,901 | 0.67 | 10,761 | 0.66 | 11,703 | 0.71 | 12,720 | 0.77 |
| 116,992 | 7.15 | 116,854 | 7.15 | 129,406 | 7.91 | 124,524 | 7.61 |
| 647 | 0.04 | 800 | 0.05 | 1037 | 0.06 | 1242 | 0.08 |
| 16,649 | 1.02 | 16,425 | 1.01 | 17,860 | 1.09 | 17,469 | 1.07 |
| 777,381 | 47.50 | 754,526 | 46.10 | 725,936 | 44.35 | 661,066 | 40.40 |
| 714,031 | 43.62 | 737,004 | 45.03 | 751,015 | 45.88 | 819,205 | 50.07 |
| LUCC Type | Accuracy Type | 1990 | 1995 | 2000 | 2005 | 2010 | 2015 | 2021 |
|---|---|---|---|---|---|---|---|---|
| Cropland | PA (%) | 74 | 62 | 63 | 59 | 64 | 59 | 70 |
| UA (%) | 94 | 94 | 92 | 94 | 94 | 93 | 94 | |
| Forest | PA (%) | 80 | 75 | 78 | 75 | 75 | 82 | 86 |
| UA (%) | 88 | 83 | 89 | 84 | 85 | 90 | 85 | |
| Built area | PA (%) | 66 | 59 | 77 | 61 | 61 | 60 | 70 |
| UA (%) | 100 | 100 | 95 | 100 | 100 | 100 | 98 | |
| Water | PA (%) | 93 | 93 | 92 | 93 | 94 | 89 | 89 |
| UA (%) | 98 | 97 | 96 | 97 | 95 | 94 | 99 | |
| Barren | PA (%) | 88 | 83 | 87 | 89 | 89 | 85 | 83 |
| UA (%) | 95 | 89 | 84 | 88 | 89 | 88 | 91 | |
| Grassland | PA (%) | 91 | 88 | 83 | 87 | 87 | 87 | 87 |
| UA (%) | 73 | 66 | 68 | 68 | 69 | 67 | 71 | |
| OA (%) | −− | 84.63 | 78.32 | 80.01 | 79.94 | 80.63 | 79.83 | 82.42 |
| Kappa | −− | 0.7677 | 0.7127 | 0.7382 | 0.7349 | 0.7445 | 0.7332 | 0.7689 |
| Data Source | Classification Result Comparison | ||||
|---|---|---|---|---|---|
| Google Earth |  |  |  |  |  |
| Our paper |  |  |  |  |  |
| GlobeLand30 |  |  |  |  |  |
| Regions | Year | Interval | Land Use Change Rate (%) | Reference | |||||
|---|---|---|---|---|---|---|---|---|---|
| Cropland | Forest | Grassland | Water | Built | Barren | ||||
| Mongolia | 1990–2021 | 1 | +8.5 | −2.5 | +8.5 | +7.1 | +156.1 | −8.6 | This paper |
| Mongolia | 1990–2020 | 10 | −27.0 | −5.4 | +18.4 | −8.1 | +150.7 | −15.2 | [48] |
| Mongolian Plateau | 1990–2020 | 10 | +4.9 | −1.5 | +10.5 | −0.6 | +47.2 | −13.4 | [32] |
| Inner Mongolia | 2000–2015 | 5 | −0.2 | −1.0 | +0.7 | +2.3 | +22.5 | +0.4 | [95] |
| Central Asia | 1995–2015 | 10 | +16.1 | −0.1 | −3.0 | −0.2 | +223.5 | −4.0 | [96] |
| North and West Africa | 1985–1995 | 10 | +3.6 | −1.5 | +64.4 | +82.7 | +169.4 | +1.2 | [97] |
| Global | 2001–2012 | 12 | −0.5 | −1.2 | +2.0 | +1.0 | −0.1 | −6.2 | [98] |
Disclaimer/Publisher’s Note: The statements, opinions and data contained in all publications are solely those of the individual author(s) and contributor(s) and not of MDPI and/or the editor(s). MDPI and/or the editor(s) disclaim responsibility for any injury to people or property resulting from any ideas, methods, instructions or products referred to in the content. |
© 2023 by the authors. Licensee MDPI, Basel, Switzerland. This article is an open access article distributed under the terms and conditions of the Creative Commons Attribution (CC BY) license (https://creativecommons.org/licenses/by/4.0/).
Share and Cite
Hao, J.; Lin, Q.; Wu, T.; Chen, J.; Li, W.; Wu, X.; Hu, G.; La, Y. Spatial–Temporal and Driving Factors of Land Use/Cover Change in Mongolia from 1990 to 2021. Remote Sens. 2023, 15, 1813. https://doi.org/10.3390/rs15071813
Hao J, Lin Q, Wu T, Chen J, Li W, Wu X, Hu G, La Y. Spatial–Temporal and Driving Factors of Land Use/Cover Change in Mongolia from 1990 to 2021. Remote Sensing. 2023; 15(7):1813. https://doi.org/10.3390/rs15071813
Chicago/Turabian StyleHao, Junming, Qingrun Lin, Tonghua Wu, Jie Chen, Wangping Li, Xiaodong Wu, Guojie Hu, and Yune La. 2023. "Spatial–Temporal and Driving Factors of Land Use/Cover Change in Mongolia from 1990 to 2021" Remote Sensing 15, no. 7: 1813. https://doi.org/10.3390/rs15071813