Article

Assessment of the Urban Extreme Precipitation by Satellite Estimates over Mainland China

1
College of Water Sciences, Beijing Normal University, Beijing 100875, China
2
Beijing Key Laboratory of Urban Hydrological Cycle and Sponge City Technology, Beijing 100875, China
*
Author to whom correspondence should be addressed.
Remote Sens. 2023, 15(7), 1805; https://doi.org/10.3390/rs15071805
Submission received: 24 February 2023 / Revised: 20 March 2023 / Accepted: 23 March 2023 / Published: 28 March 2023

Abstract

:
The accurate estimation of urban extreme precipitation is essential for urban design and risk management, which is hard for developing countries, due to the fast urbanization and sparse rain gauges. Satellite precipitation products (SPPs) have emerged as a promising solution. Not only near real-time SPPs can provide critical information for decision making, but post-processed SPPs can also offer essential information for climate change adaption, risk management strategy development, and related fields. However, their ability in urban extreme precipitation estimation has not been examined in detail. This study presents a comprehensive evaluation of four recent SPPs that are post-processed, including IMERG, GSMaP_Gauge, MSWEP, and CMFD, for their ability to capture urban extreme precipitation in mainland China at the national, city, and inner-city scales. The performance of the four SPPs was assessed using daily observations from the 821 urban gauges from 2001 to 2018. The assessment includes: (1) the extreme precipitation estimates from the four SPPs in the total urbanized areas of mainland China were evaluated using correlation coefficients (CC), absolute deviation (AD), relative deviation (RB), and five extreme precipitation indices; (2) The extreme precipitation estimates over 21 Chinese major cities were assessed with the two most important extreme indices, namely the 99th percentile of daily precipitation on wet days (R99) and total precipitation when daily precipitation exceeding R99 (R99TOT); and (3) Bivariate Moran’s I (BMI) was adopted to assess the inner-city spatial correlation of R99 and R99TOT between SPPs and gauge observations in four major cities with most gauges. The results indicate that MSWEP has the highest CC of 0.79 and the lowest AD of 1.61 mm at the national scale. However, it tends to underestimate urban precipitation, with an RB of −8.5%. GSMaP_Gauge and IMERG performed better in estimating extreme values, with close extreme indices with gauge observations. According to the 21 major cities, GSMaP_Gauge also shows high accuracy in estimating R99 and R99TOT values, with the best RB and AD in these cities, while CMFD and MSWEP exhibit the highest CC values for R99 and R99TOT, respectively, indicating a strong correlation between their estimates and those obtained from gauge observations. At the inner-city scale, MSWEP shows advantages in monitoring the spatial distribution of urban extreme precipitation in most of cities. The study firstly provided the multiscale assessment of urban extreme precipitation by SPPs over mainland China, which is useful for their applications.

Graphical Abstract

1. Introduction

Due to the concentration of population and wealth, urban areas are highly vulnerable to extreme precipitation and its related disasters [1]. Some evidence also proved that the environment of urban areas, such as the urban heat island, will exacerbate the density of extreme precipitation [2,3]. With the climate change and fast urbanization, more and more cities are threatened by extreme precipitation. Extreme precipitation has been one of the most important things threatening urban security [4,5]. Therefore, the observation of urban extreme precipitation is critical for most of cities.
Extreme precipitation observation methods include rain gauge, weather radars, and satellite precipitation products (SPPs) [6]. The rain gauge is the most accurate and reliable method [7]. Rain gauges are often sparse for cities of developing countries, and the data lengths are often limited due to the fast urbanization [8]. Weather radar has been one important approach for urban extreme precipitation observations [9]. However, the limited spatial coverage and uncertainty, due to the complex terrain, signal attenuation, etc., restrict the application of weather radar datasets [10]. With their broad coverage and continuous data availability, SPPs have been an important option for urban extreme precipitation observation [11].
In recent years, many high spatial and temporal resolution SPPs have been developed through the fusion of remote sensing products, reanalysis datasets, and gauge observations. Examples of these products include the Integrated Multi-Satellite Retrievals for GPM (IMERG) [12], Global Precipitation Satellite Mapping Products (GSMaP) [13], China Meteorological Forcing Dataset (CMFD) [14], and Multi-Source Weighted-Ensemble Precipitation (MSWEP) [15]. These made the applications of SPPs in urban extreme precipitation possible, and they have been applied in cities worldwide.
Efforts have been made to evaluate the ability of SPPs on extreme rainfall estimation at various scales, including the continental, national, and basin scales [16,17,18,19,20,21,22,23]. However, the evaluation of urban extreme precipitation is still limited, with only a few studies conducted on individual cities, such as Guangdong, Louisiana, and Rio de Janeiro [24,25,26,27]. Therefore, a comprehensive evaluation of the urban extreme precipitation estimate capabilities of each SPP is crucial for their application in urban areas and for further improvement [28]. In addition, the high spatial variability of urban underlying surfaces and the uneven distribution of population and wealth make it crucial to accurately capture the spatial distribution of extreme precipitation for disaster prevention and risk management [29,30].
Several studies have evaluated the performance of various SPPs in individual Chinese cities. Ren et al. [31] assessed CMFD, CMORPH, TRMM 3B42, and TRMM 3B42-RT in Beijing and found that CMFD had a higher correlation coefficient and lower root mean squared difference. Li et al. [32] compared GSMaP_Gauge, TRMM 3B42, and GPCP in Shanghai and found that GSMaP_Gauge had the highest correlation coefficient, TRMM 3B42 had the lowest RMSE, and GPCP had the highest probability of detection. Li et al. [33] evaluated IMERG and radar QPE products in the Guangdong-Hong Kong-Macao Greater Bay Area and found that the IMERG early run (ER) has the advantages of a short lag time and high accuracy among the three IMERG products. Li et al. [34] compared IMERG, MSWEP, and CMFD in Beijing and found that MSWEP had the highest correlation coefficient and lowest absolute deviation with rainfall station observations. CMFD demonstrated the best ability to correctly detect daily precipitation events, while MSWEP and CMFD had a higher ability to capture the spatial distribution of two extreme storm events. Previous studies have identified IMERG, GSMaP_Gauge, CMFD, and MSWEP as SPPs with strong capabilities to capture precipitation in individual Chinese cities. Nonetheless, a comprehensive evaluation of these SPPs in Chinese urban areas, particularly for extreme precipitation, remains insufficient.
The objective of this study is to perform a comprehensive assessment of the extreme precipitation monitoring capabilities of four recent satellite precipitation products (SPPs), namely IMERG, GSMaP_Gauge, MSWEP, and CMFD, in the urbanized regions of mainland China. The daily precipitation observations from the 821 urban gauges over 18 years (2001–2018) are used for comparison. The specific objectives can be summarized as follows: (1) Evaluate the performance of the four SPPs on urban extreme precipitation estimation at the total urbanized areas in mainland China; (2) Assess the ability of the four SPPs in estimating extreme precipitation in the 21 major cities whose population exceed 5 million using the selected extreme precipitation indicators; (3) Analyze the spatial correlation between extreme precipitation indices of the four SPPs and gauge observations in the four cities with the most rain gauges using BMI.

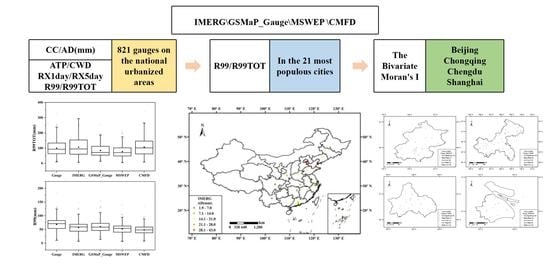
2. Materials and Methods
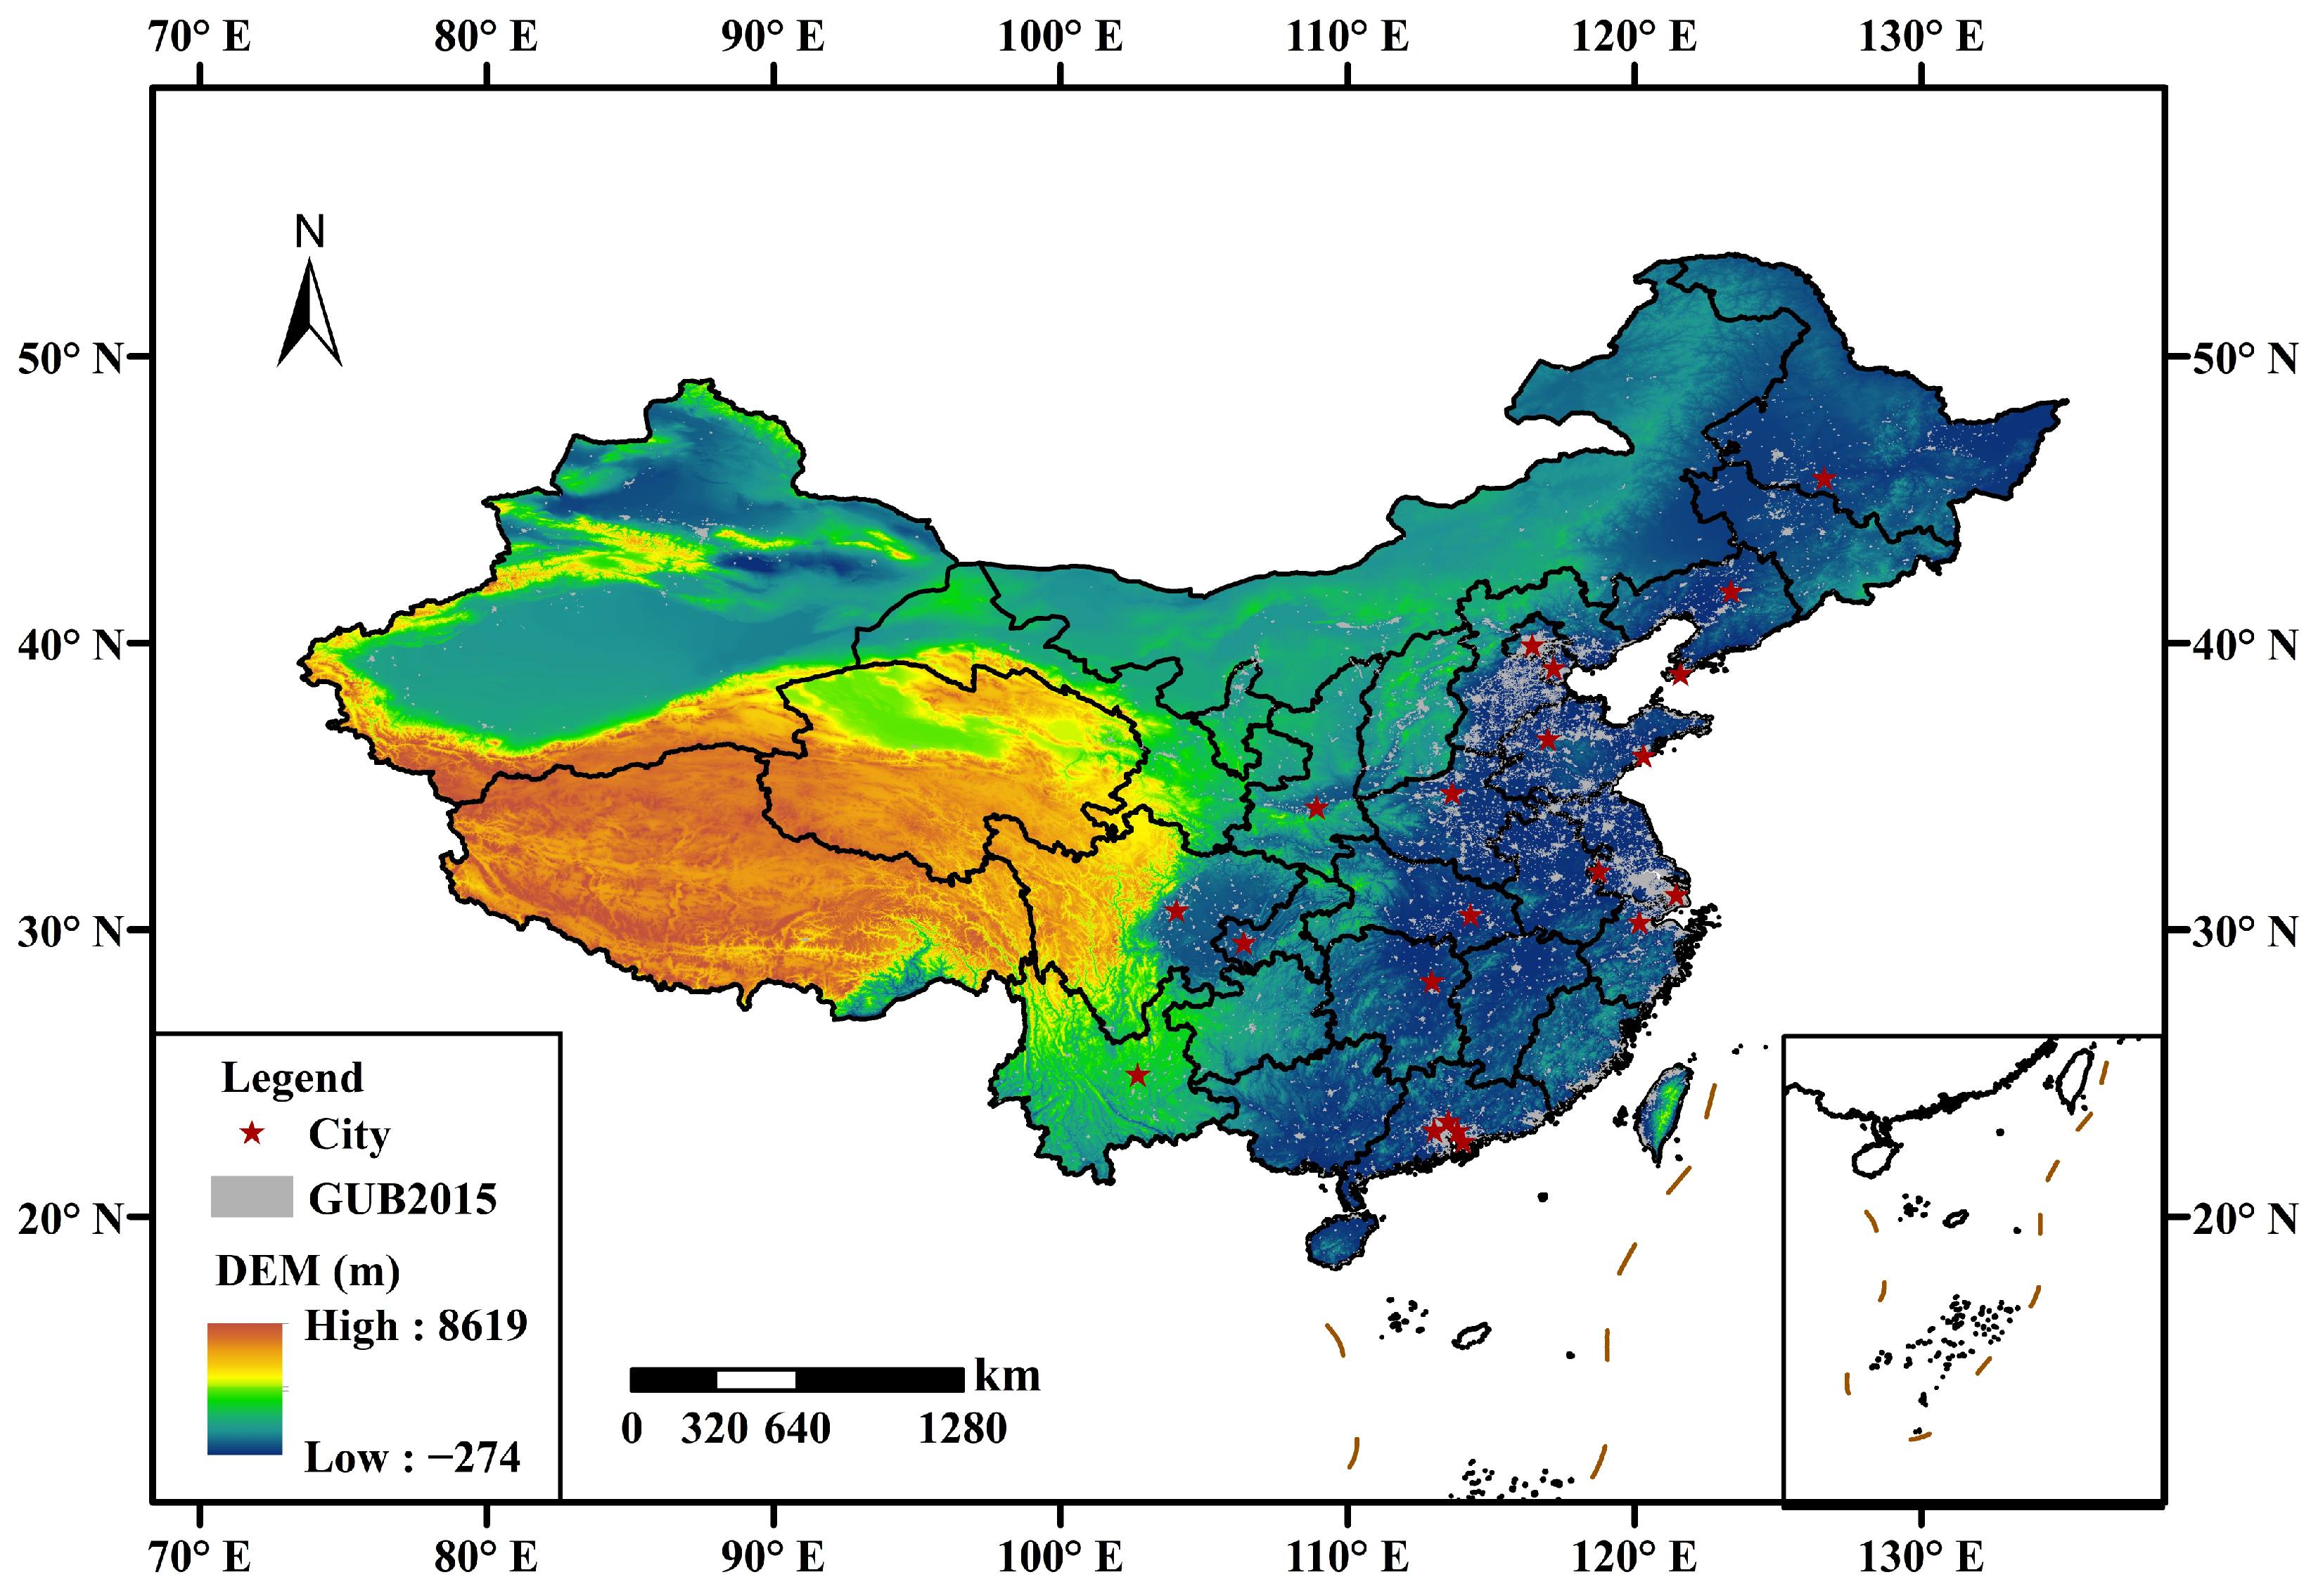
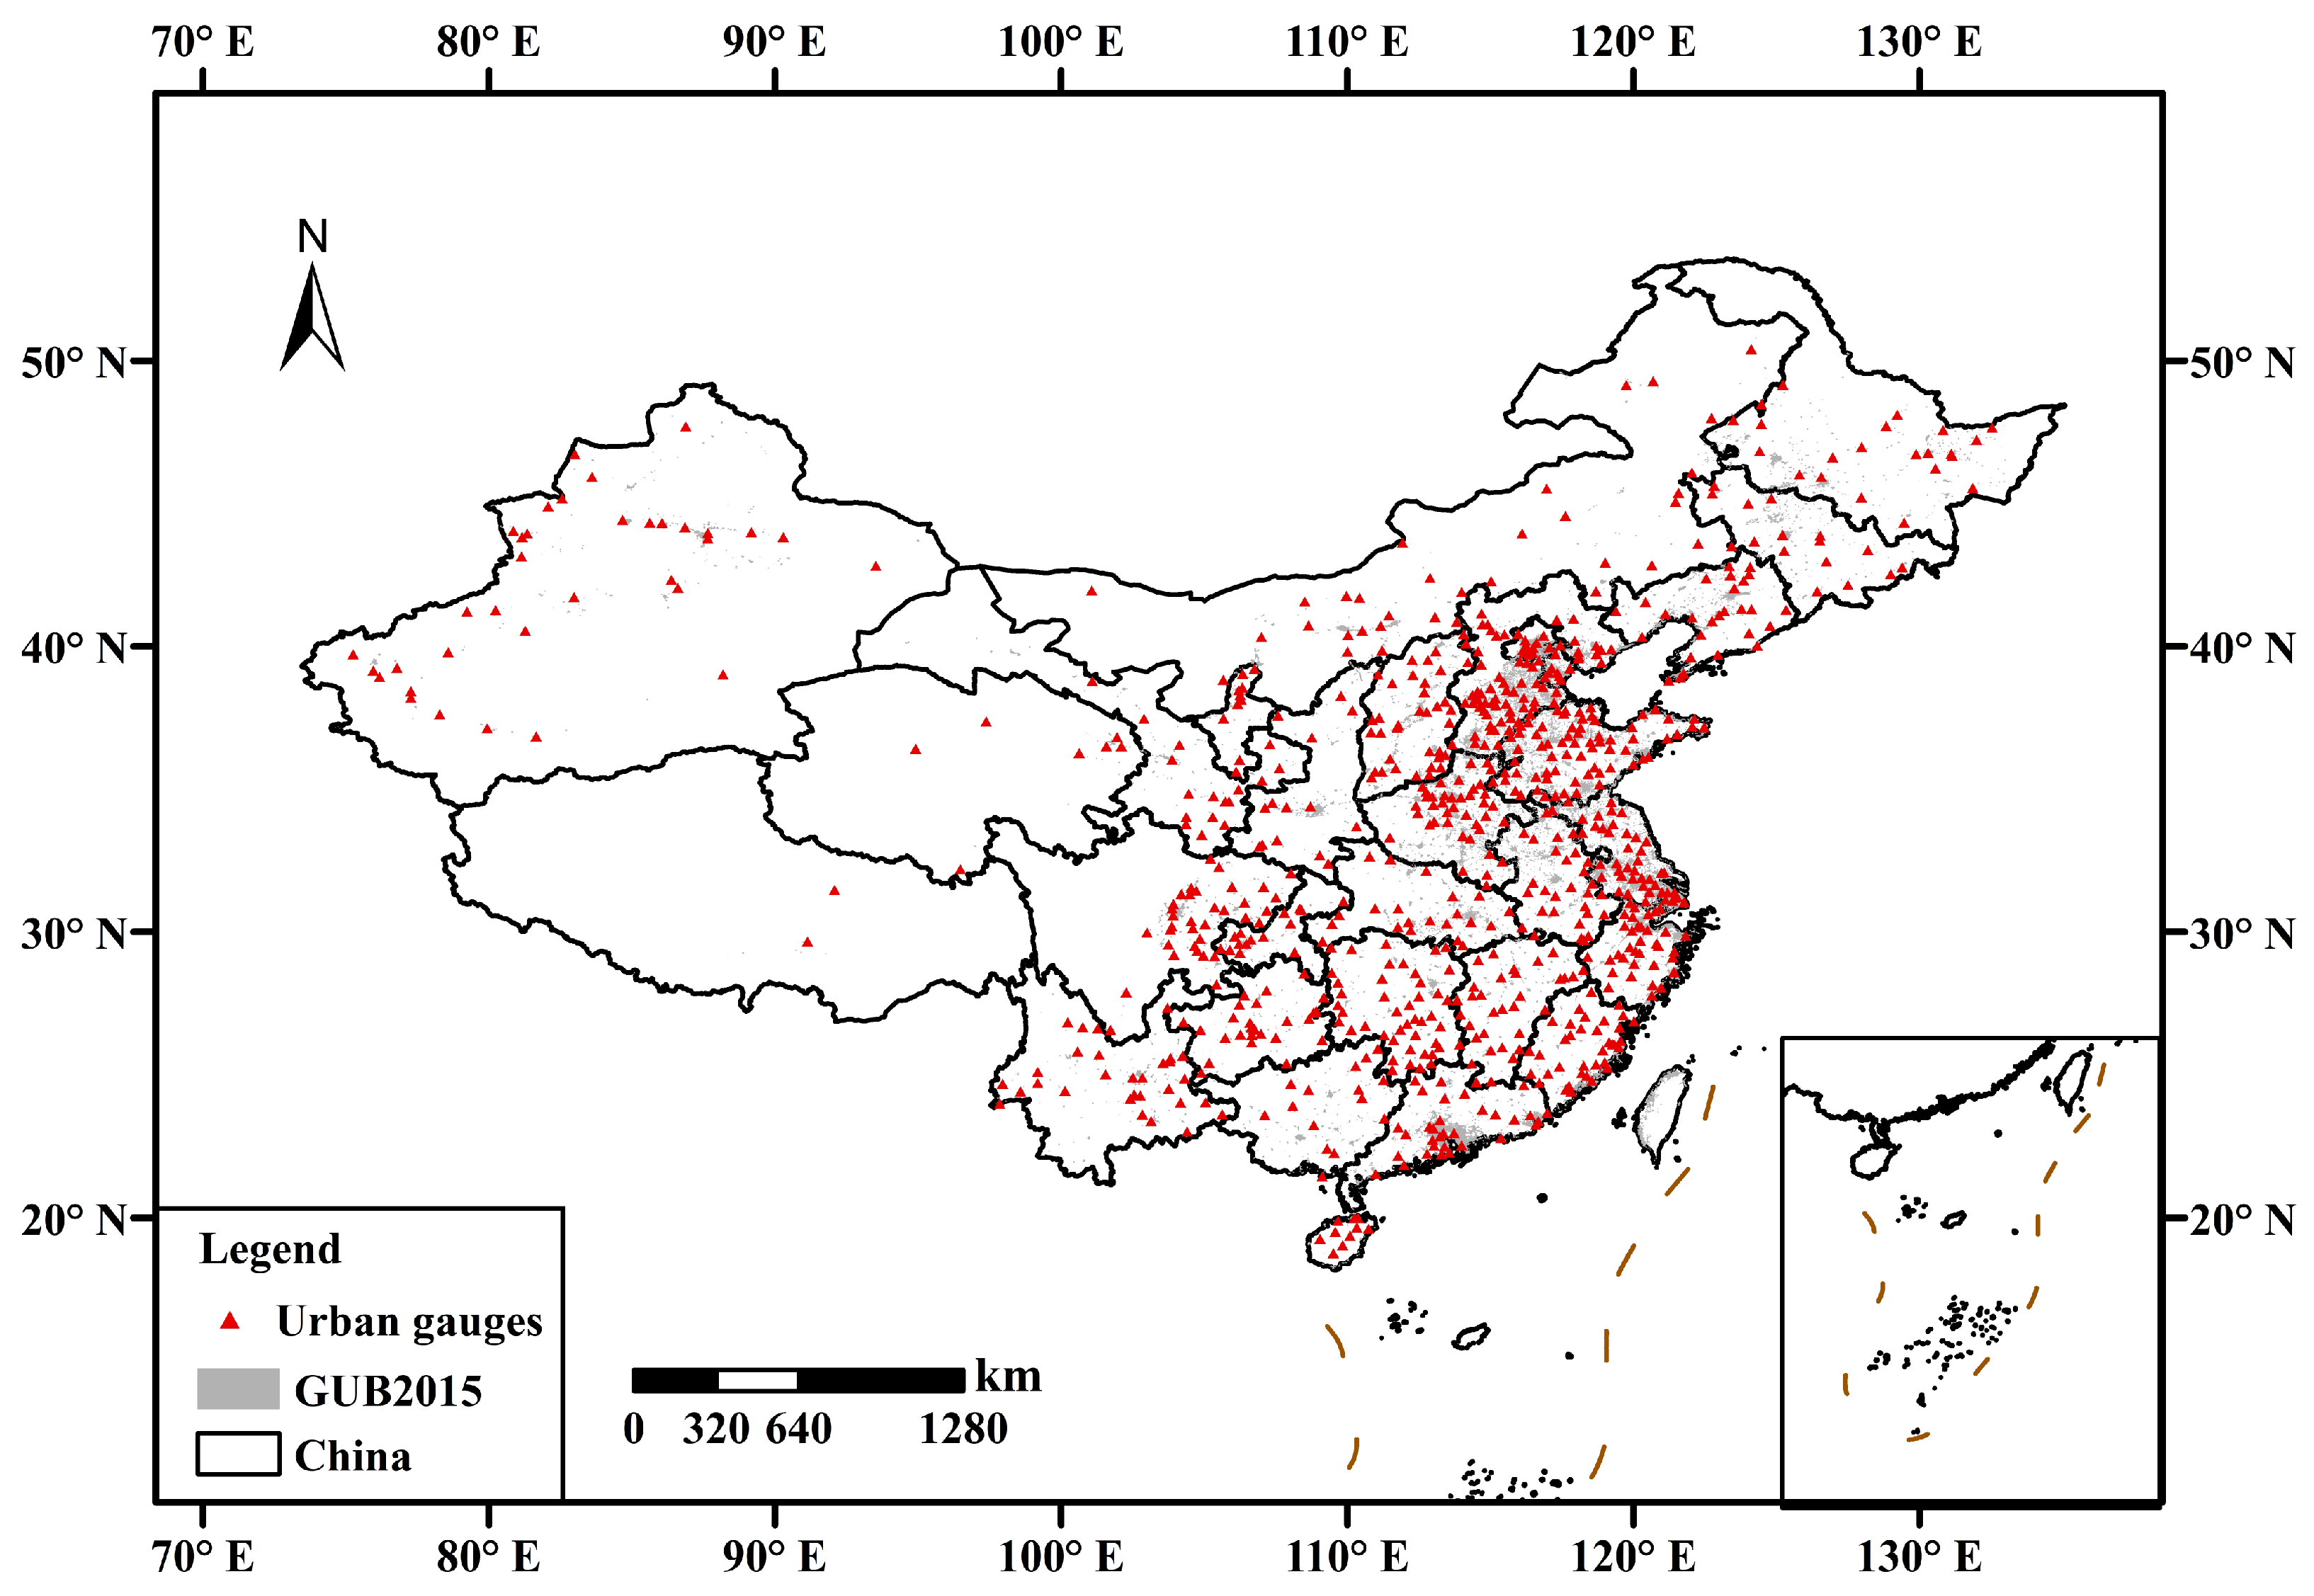
2.1. Study Area

China exhibits fast urbanization process in the past 30 years. According to the National Bureau of Statistics of China, the total urban land area in the country increased from 8000 square kilometers in 1952 to over 230,000 square kilometers in 2020. During the same period, the number of cities with a population over 1 million grew from 68 to 235. The urban resident population has also increased dramatically, reaching 1.39 billion in 2020, accounting for 59.58% of the total population. Li et al. developed an automatic delineation framework to generate a multi-temporal dataset of global urban boundaries (GUB) using 30 m global artificial impervious area (GAIA) data [35,36]. Considering the study period (2008–2018), the GUB in 2015 is adopted to define the urban areas of the research. The 21 major cities in China whose population exceed 5 million are then analyzed in detail. The urban areas and 21 major cities are marked in Figure 1.

2.2. Datasets

2.2.1. Four Satellite Precipitation Products

IMERG (Integrated Multi-satellite Retrievals for GPM) is a level 3 product of the Global Precipitation Measurement (GPM) mission. It leverages the data from multiple satellite sensors onboard the GPM platform and these of previous missions [37]. The IMERG algorithms take into account factors such as cloud cover, surface type, and atmospheric conditions to ensure its accuracy. The IMERG product suite includes the near-real-time early run and late run products, as well as the delayed final run products. In this study, the IMERG-V06 early run precipitation dataset, with a spatial resolution of 0.1° and temporal resolution of 1 day, was used.
GSMaP (Global Satellite Mapping of Precipitation) is a precipitation product developed by the Japan Precipitation Measurement Mission (PMM). It uses a joint passive microwave and infrared inversion algorithm based on the Kalman filter moving vector method to retrieve precipitation estimates [38]. The near-real-time GSMaP_NRT product, with a latency of about 3 h after observation, has gained popularity among data users. The GSMaP_Gauge product, obtained by correcting the GSMaP_MVK product using CPC rainfall station data, was also used in this study, with a resolution of 0.1° and 1 day.
MSWEP (Multi-Source Weighted Ensemble Precipitation) is a global precipitation dataset that incorporates global site data, multiple satellite observations, and reanalysis data. The dataset is revised with runoff and potential evapotranspiration data and improved with cloud top infrared temperature estimates from the pre-TRMM period. MSWEP V2, with a relatively high spatial resolution of 0.1° and strong data integrity, has gained international attention [39]. In this study, the daily precipitation dataset of MSWEP was obtained by aggregating the precipitation observations for 3 h.
China Meteorological Forcing Dataset (CMFD) is a gridded near-surface meteorological dataset, which are specifically for studies of land surface processes in China [14]. By incorporating remote sensing products, reanalysis dataset, and in-situ observation data, CMFD exhibits a period from 1979 to 2018, with a temporal resolution of 3 h and a spatial resolution of 0.1°. The daily CMFD is accumulated from 3 h.

2.2.2. Rain Gauge Data

We utilized daily precipitation data from 821 meteorological stations covering the period from 2001 to 2018 as reference data to assess the accuracy of SPPs. The data was from the China Meteorological Administration (CMA). The 821 stations are in urban areas, as derived by the GUB. The spatial distribution of the rain gauges is shown in Figure 2.

2.3. Methods

2.3.1. Conventional Indices

To assess the performance of four SPPs in the urban area of mainland China, we used the point-to-pixel method to calculate the absolute deviation (AD), correlation coefficient (CC), and relative deviation (RB) between each SPPs and rain gauges. Their calculation methods are as follows [40,41]:
AD = 1 N i = 1 N | S i R i | ,
CC = i = 1 N ( S i S ¯ ) ( R i R ¯ ) i = 1 N ( S i S ¯ ) 2 i = 1 N ( R i R ¯ ) 2 ,
RB = i = 1 n ( S i R i ) i = 1 n ( R i ) * 100 % ,
where S and R are the SPPs data and the gauges data, respectively;  S ¯  is the average of the SPPs data; and  R ¯  is the average of the gauge observations.

2.3.2. Extreme Precipitation Indices

Considering the characteristics of urban extreme precipitations, six widely used precipitation indicators, defined by the Expert Group on Climate Change Detection and Indices (ETCCDI) [42,43], were selected in this study, including annual total precipitation (ATP), maximum number of consecutive wet days (CWD), maximum daily precipitation amount of the year (R1Xday), precipitation of the wettest consecutive five days of the year (R5Xday), the 95th percentile of daily precipitation on wet days (R99), and total precipitation in wet days (R99TOT). The six indicators and their definitions are shown in Table 1.

2.3.3. Bivariate Moran’s I (BMI)

The Bivariate Moran’s I (BMI) [44], a widely used spatial correlation index, has high potential for evaluating the spatial distribution characteristics [45,46,47]. It is an extension of the concept of Moran’s I, which measures spatial autocorrelation in a univariate dataset. The Bivariate Moran’s I test evaluates the relationship between two variables by identifying their special correlations. The calculation of global BMI and local BMI can be expressed as follows:
I B = N i N j i N W i j Z i G Z j S ( N 1 ) i N j i N W i j ,
I i B = Z i G j = 1 N W i j Z j S ,
where  I B I i B  refer to the global and local BMI, respectively;  Z i G  and  Z j S  refer to the standardized value of gauge data for the i spatial unit and the standardized value of SPPs data for the j spatial unit, respectively; and  W i j  is the spatial weight between units i and j, which was generated from the Euclidean distance weight. The values of  I B I i B  range from −1 to 1. A positive value indicates a positive spatial correlation between the rainfall station data and the SPPs data, while a negative value indicates a negative spatial correlation [48]. In this study, the statistical significance of the BMI is assessed by permutation test [49], and the significance value of spatial correlation was set to 0.05.
The Local Moran’s I Statistic (LISA) cluster map, derived from local BMI, is a useful tool in identifying four types of spatial correlations at the gauge-level, including high-high (H-H), low-low (L-L), high-low (H-L), and low-high (L-H). H-H and L-L clusters indicate a positive correlation between the rain gauge observations and SPPs in a given region, while H-L and L-H clusters indicate a negative correlation between them.

3. Results

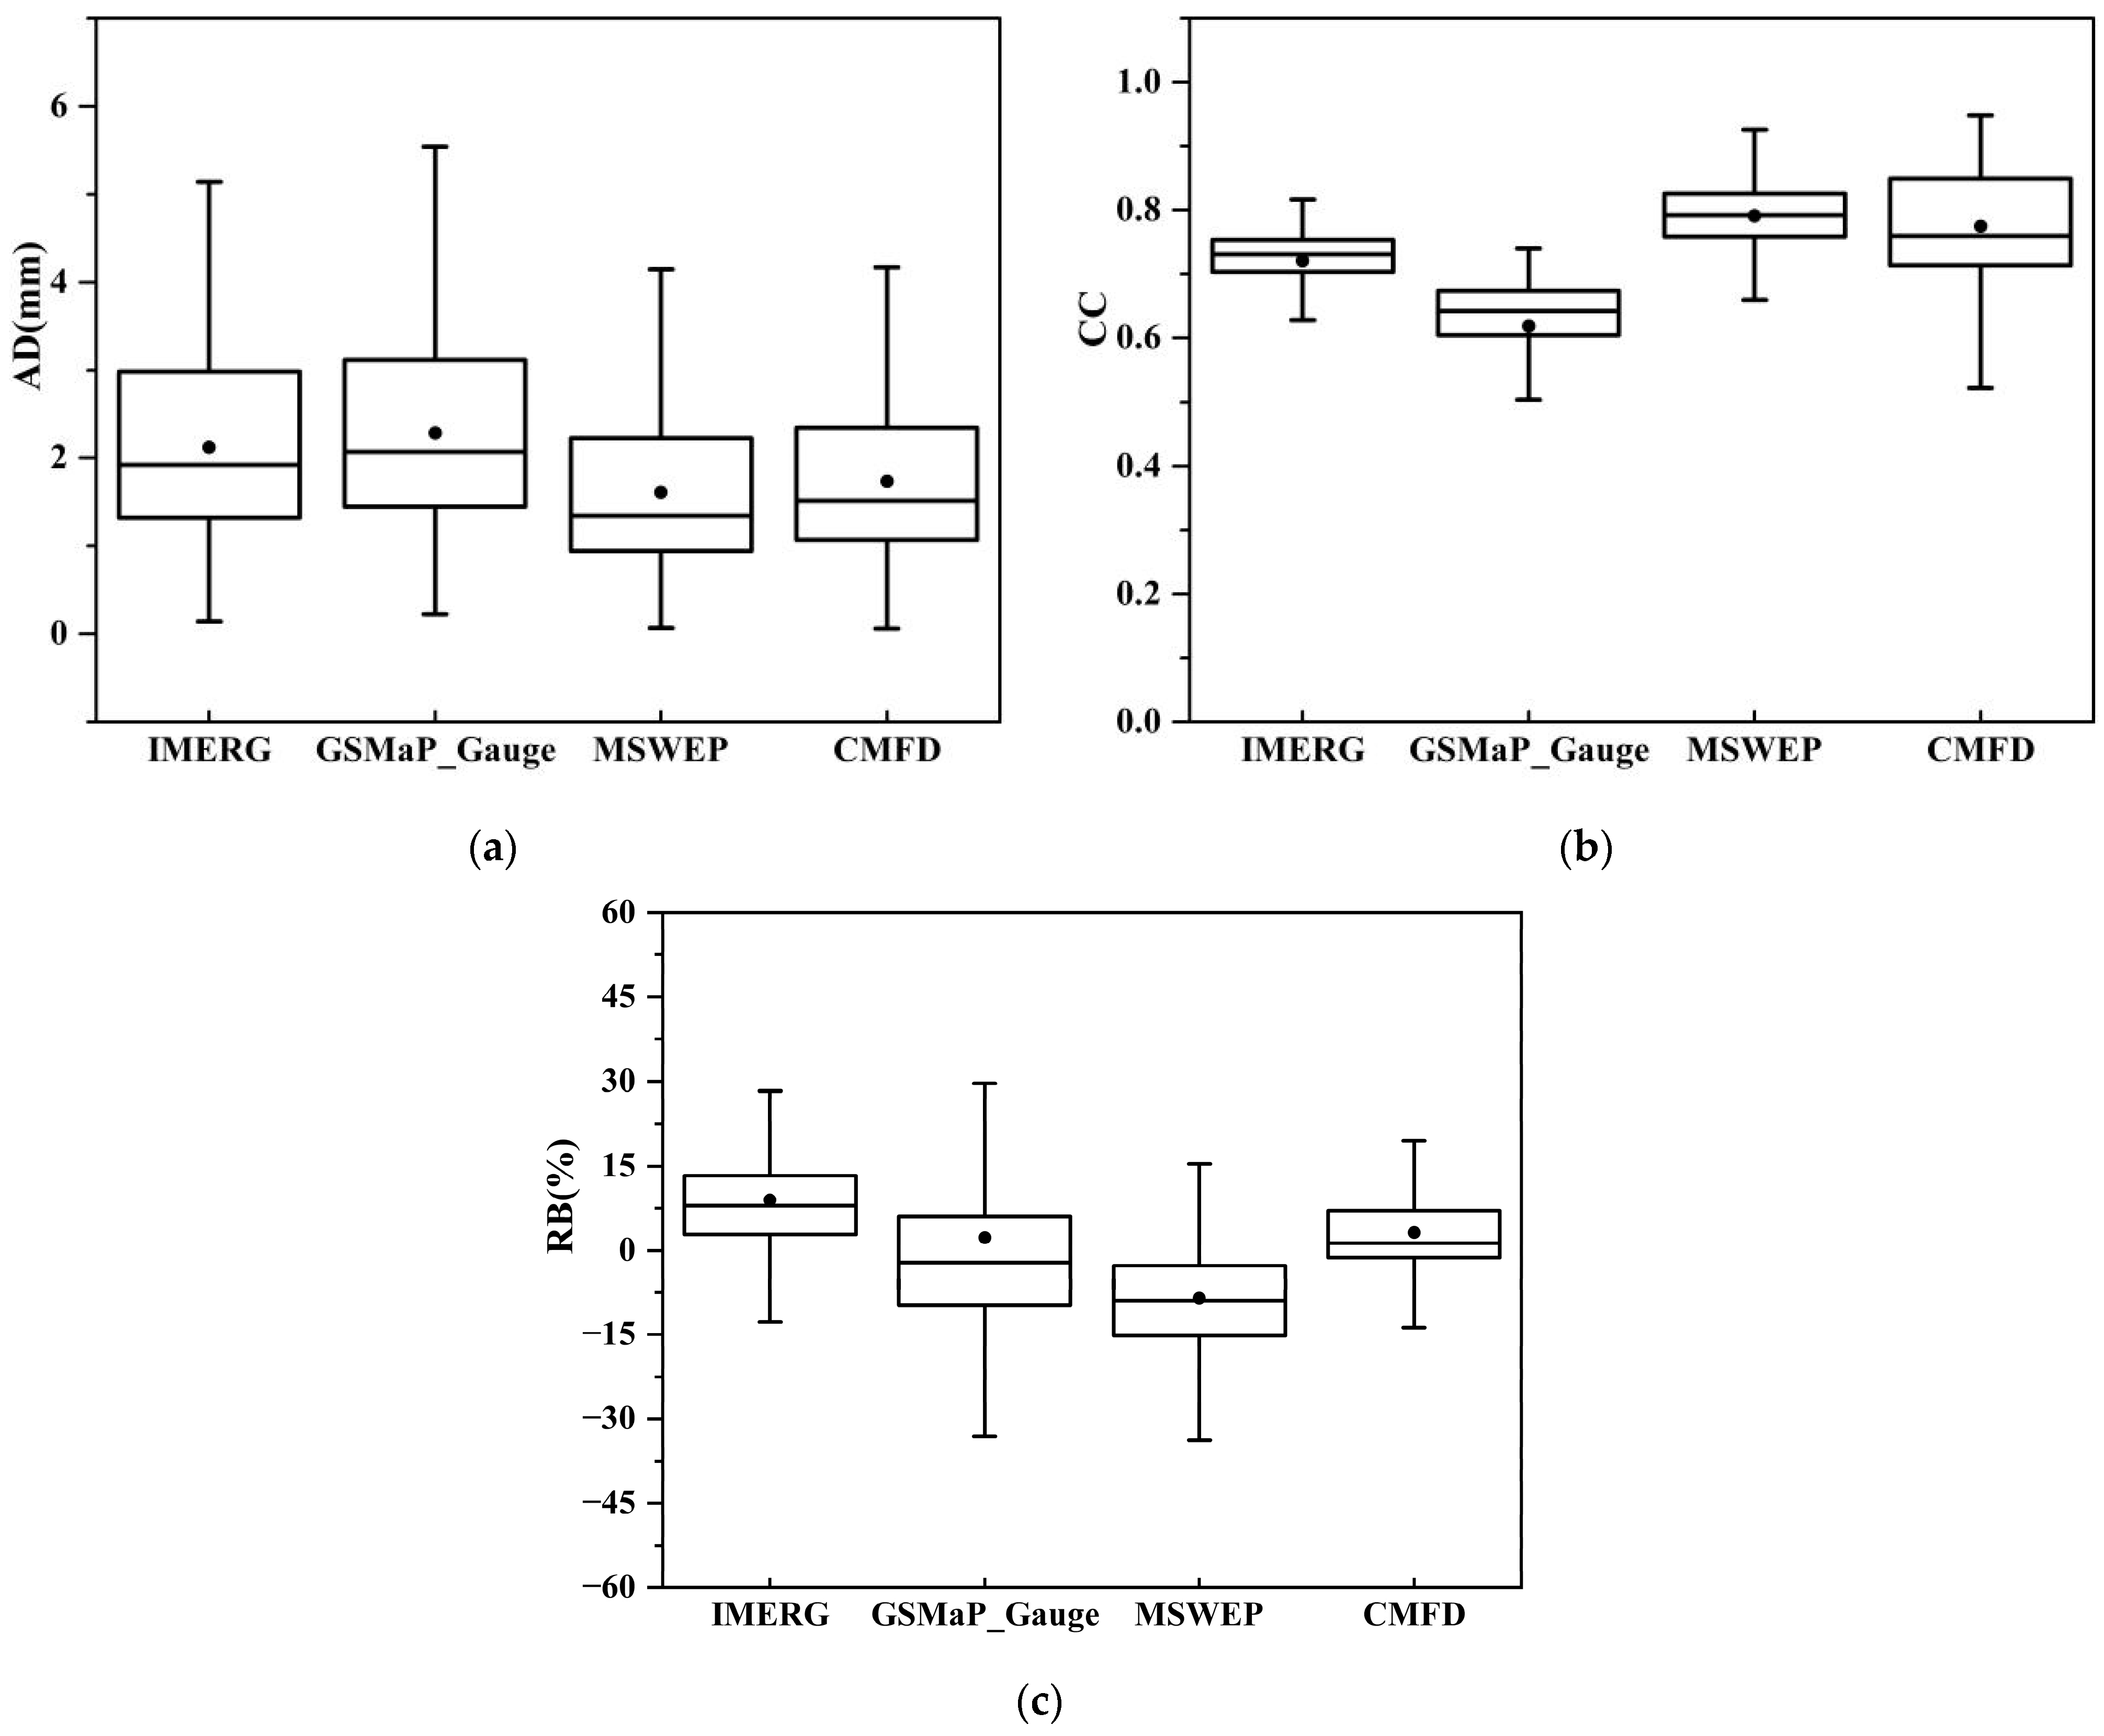
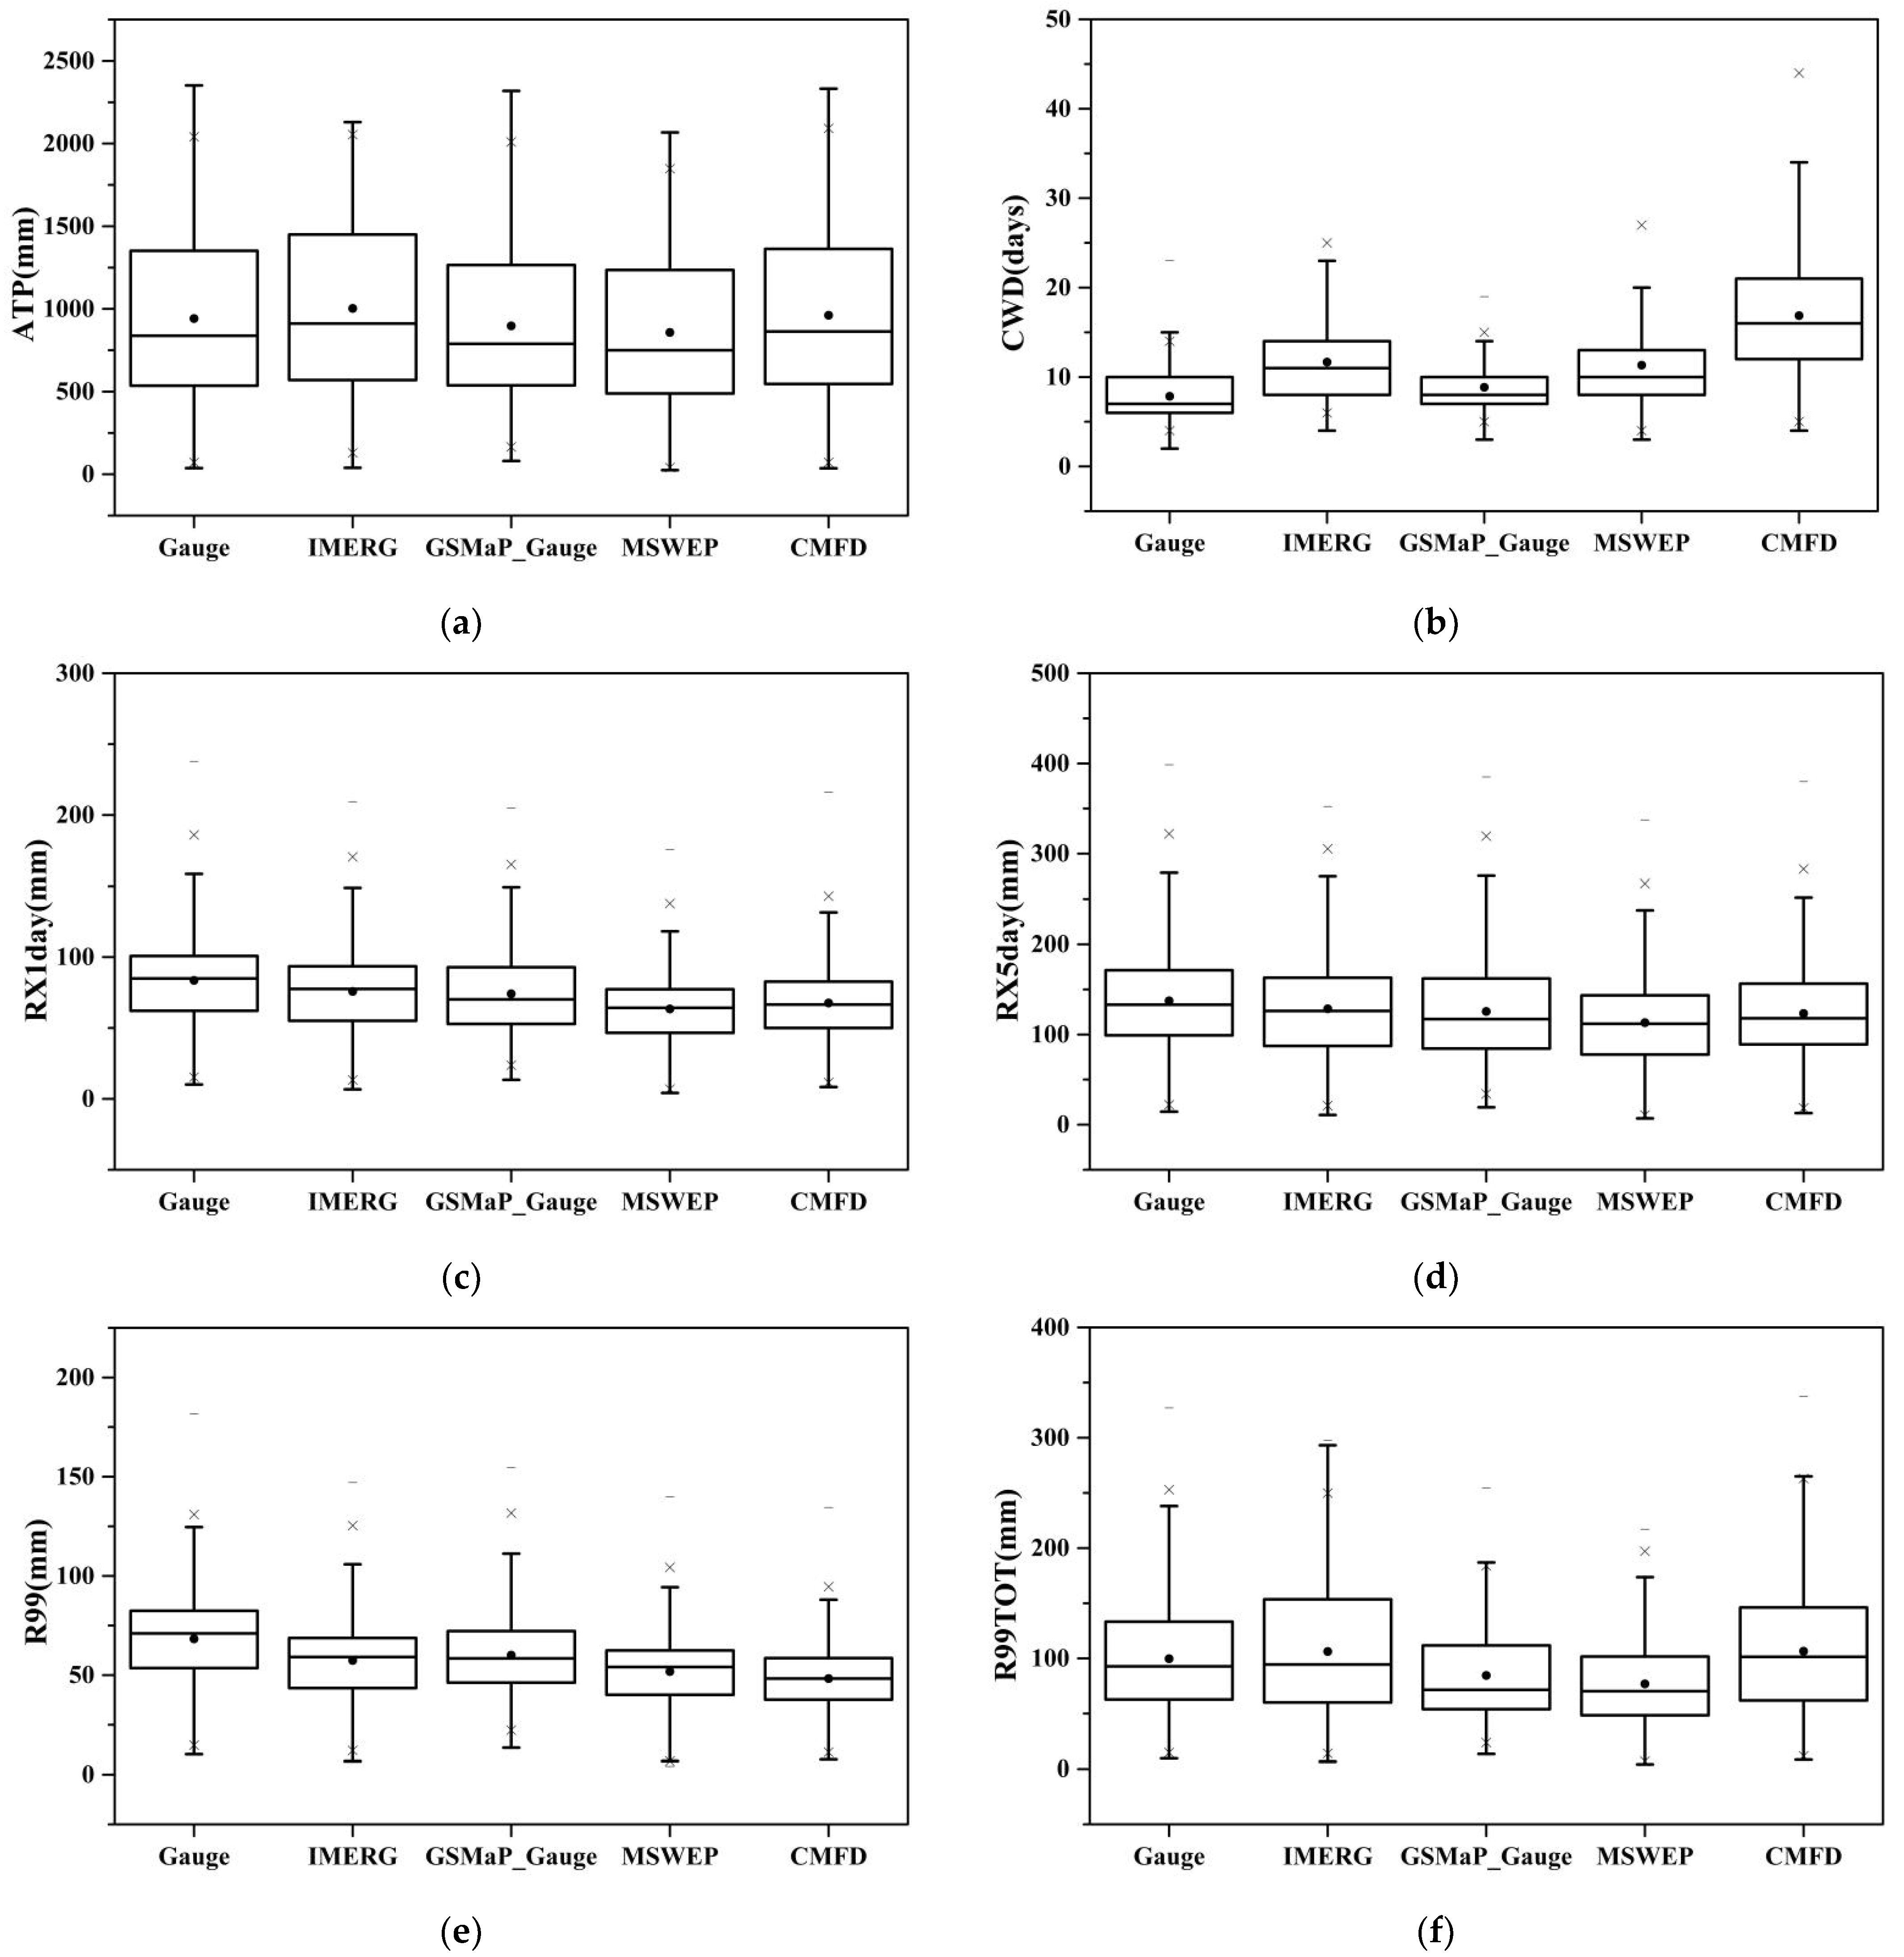
3.1. Performance of SPPs on Total Urban Area of Mainland China

Table 2 show the conventional indices of four SPPs in urban area of China. The results show that MSWEP has the best performance in four SPPs, with the highest CC of 0.79 and the lowest AD of 1.61 mm. CMFD also exhibits strong performance, with a CC of 0.77 and an AD of 1.73 mm. GSMaP_Gauge has the lowest CC of 0.62 and the highest AD of 2.28 mm. However, MSWEP tends to underestimate urban precipitation, showing an RB of −8.5%. IMERG over-estimates urban precipitation, with an RB of 9%. GSMaP_Gauge and CMFD demonstrate better performance in RB, with values of 2.3% and 3.2%, respectively.
Figure 3 show the boxplots of the conventional indices between urban gauge observation and four SPPs. As shown in Figure 3, MSWEP also show the best performance in AD and CC, which has not only the lowest AD median value and highest CC median value, but also low spatial variance of two indices. In comparison, CMFD and GSMaP_Gauge demonstrate better performance in RB, with median values close to 0. Notably, the RB variance of CMFD is significantly lower than that of GSMaP_Gauge.
To further assess the ability of SPPs to estimate extreme urban precipitation events, we calculated six extreme indices with gauge observations and four SPPs, as shown in Table 3. The results indicate that MSWEP underestimates all six indices, compared to urban gauge observations. IMERG and GSMaP_Gauge exhibit similar performances, while GSMaP_Gauge underestimates R99TOT and performs best in CWD. In contrast, CMFD underestimates R1Xday, R5Xday, and R99 and significantly overestimates CWD. Overall, IMERG and GSMaP_Gauge show better performance than the other SPPs, especially for R1Xday, R5Xday, and R99, which are significantly underestimated by MSWEP and CMFD.
Figure 4 presents box plots of the extreme precipitation indices for urban gauge data and the four SPPs. The results show that all four SPPs perform well in estimating ATP, but underestimate R1Xday, R5Xday, R99, and overestimate CWD. They also exhibit high variance in estimating R99TOT. Among the four SPPs, IMERG, and GSMaP_Gauge show better performance than MSWEP and CMFD. GSMaP_Gauge shows lower variance with higher spatial stability than IMERG.

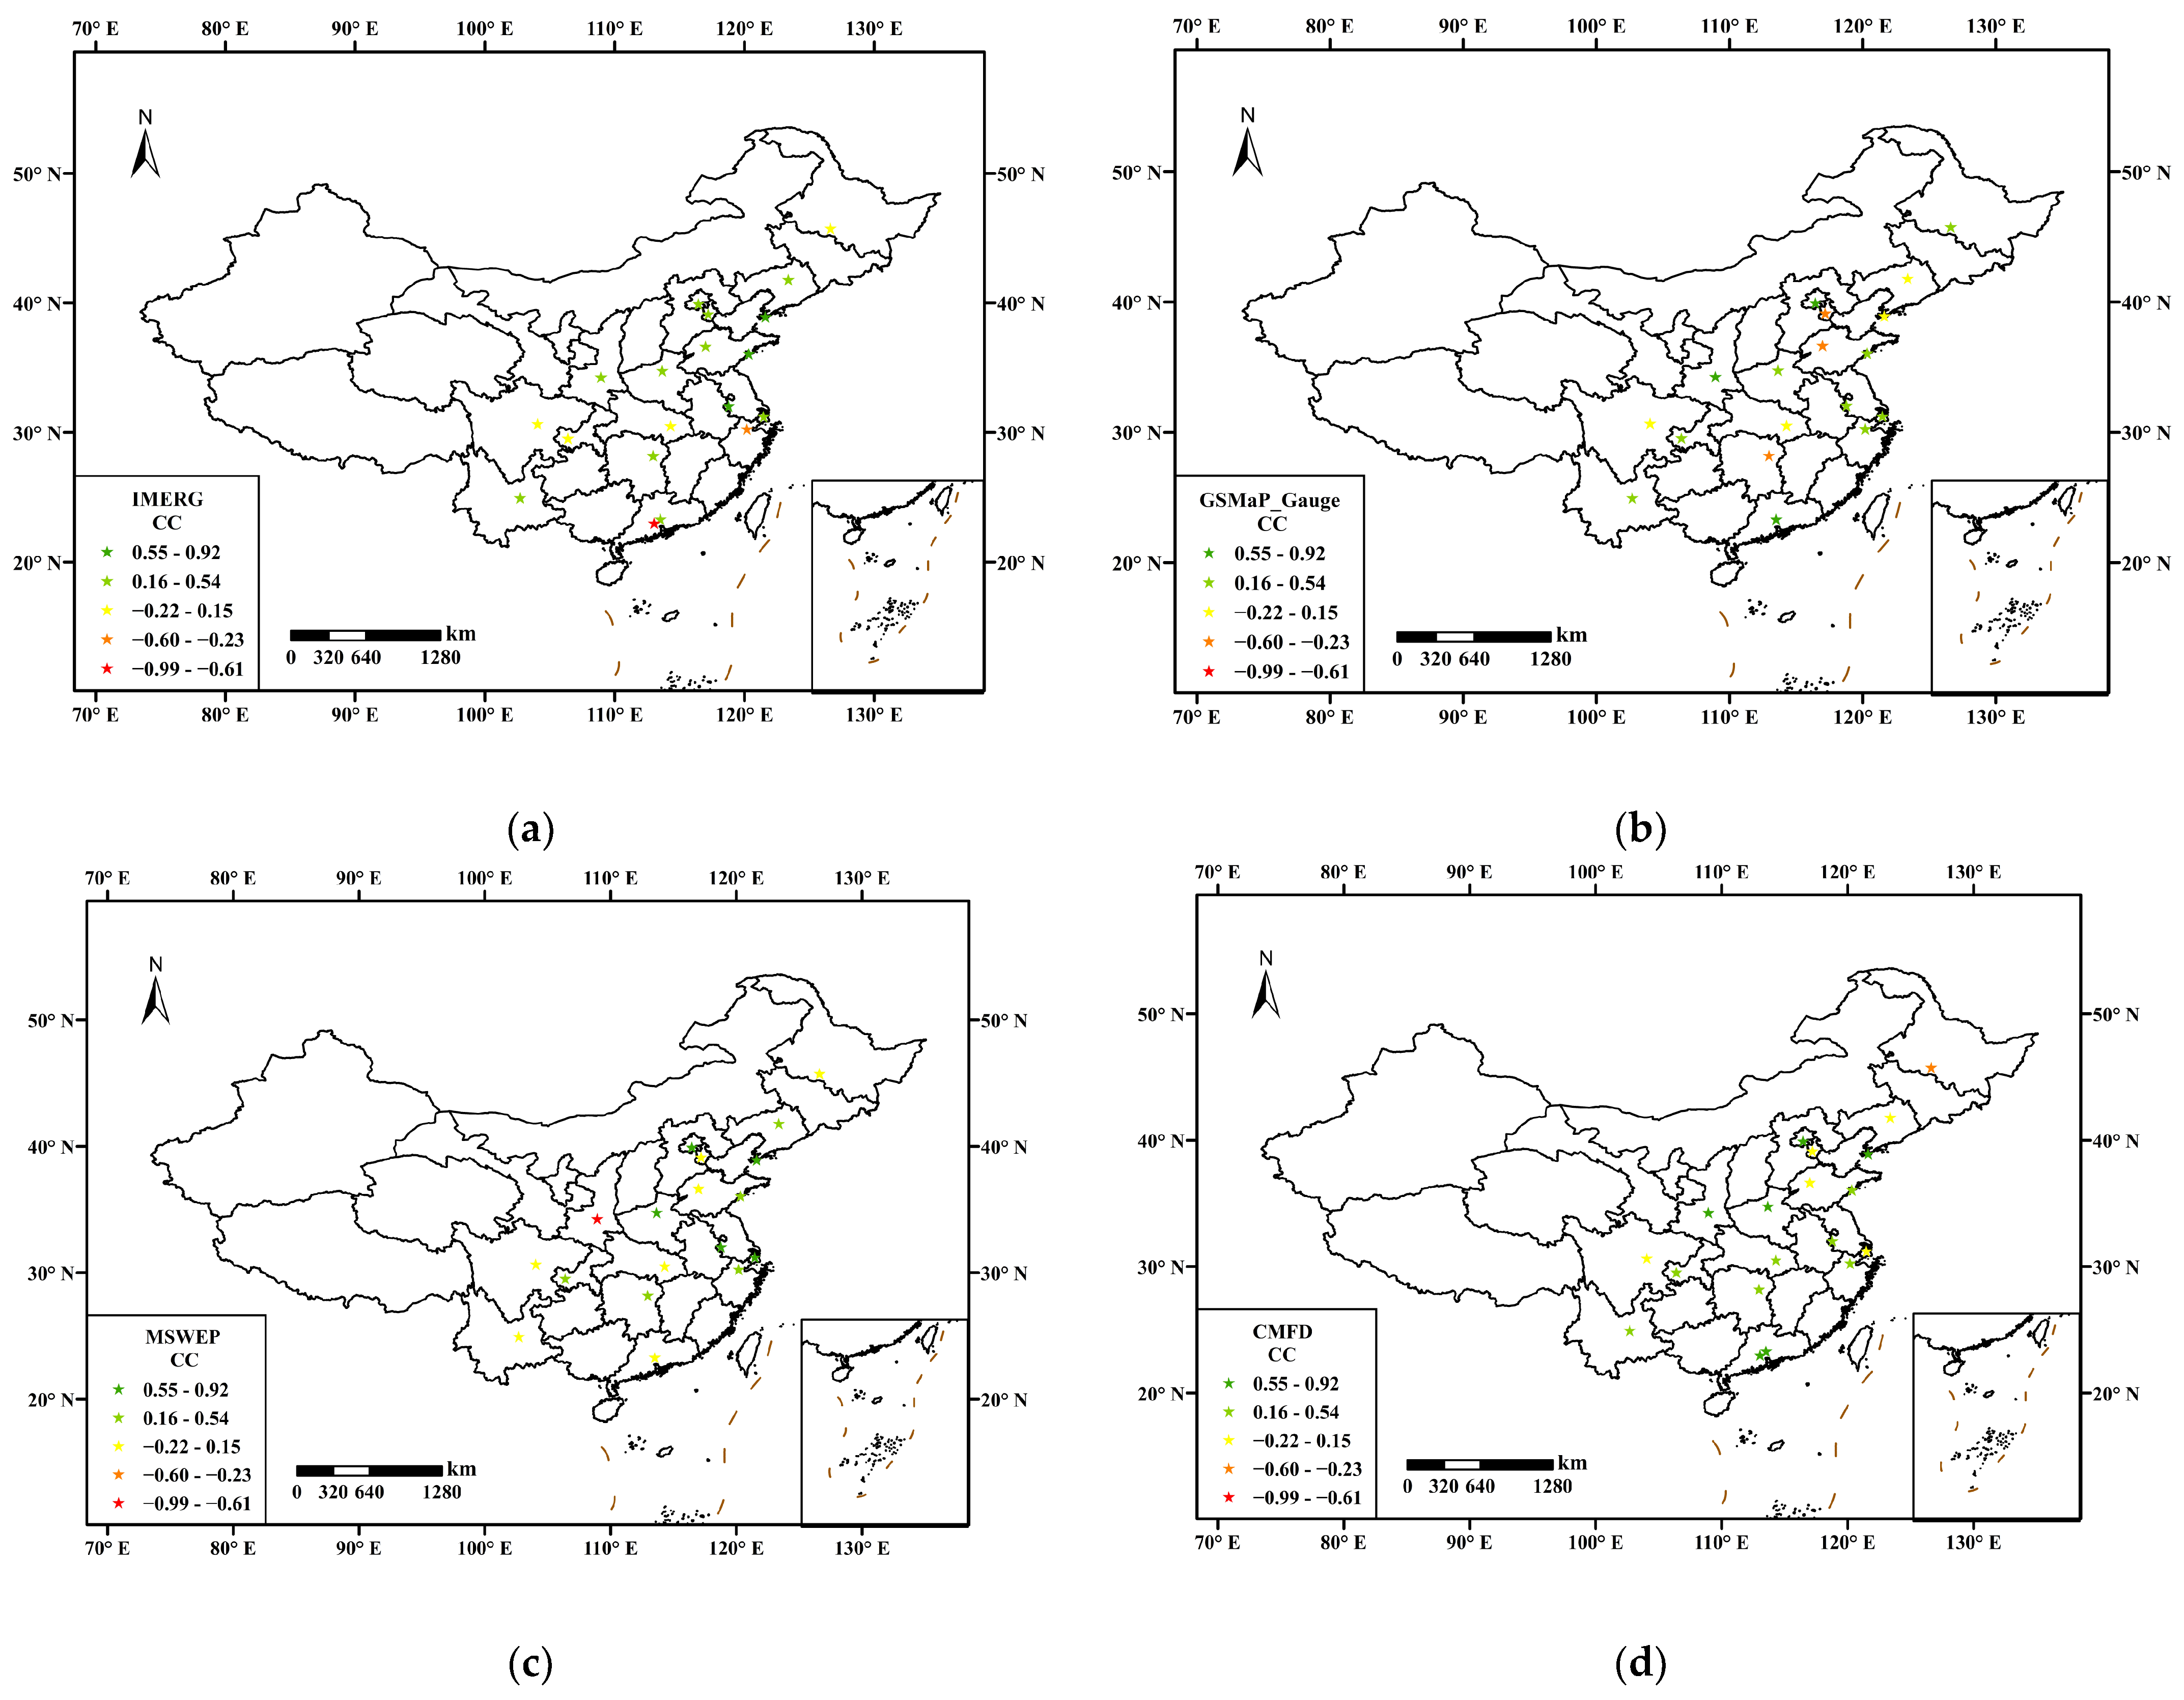
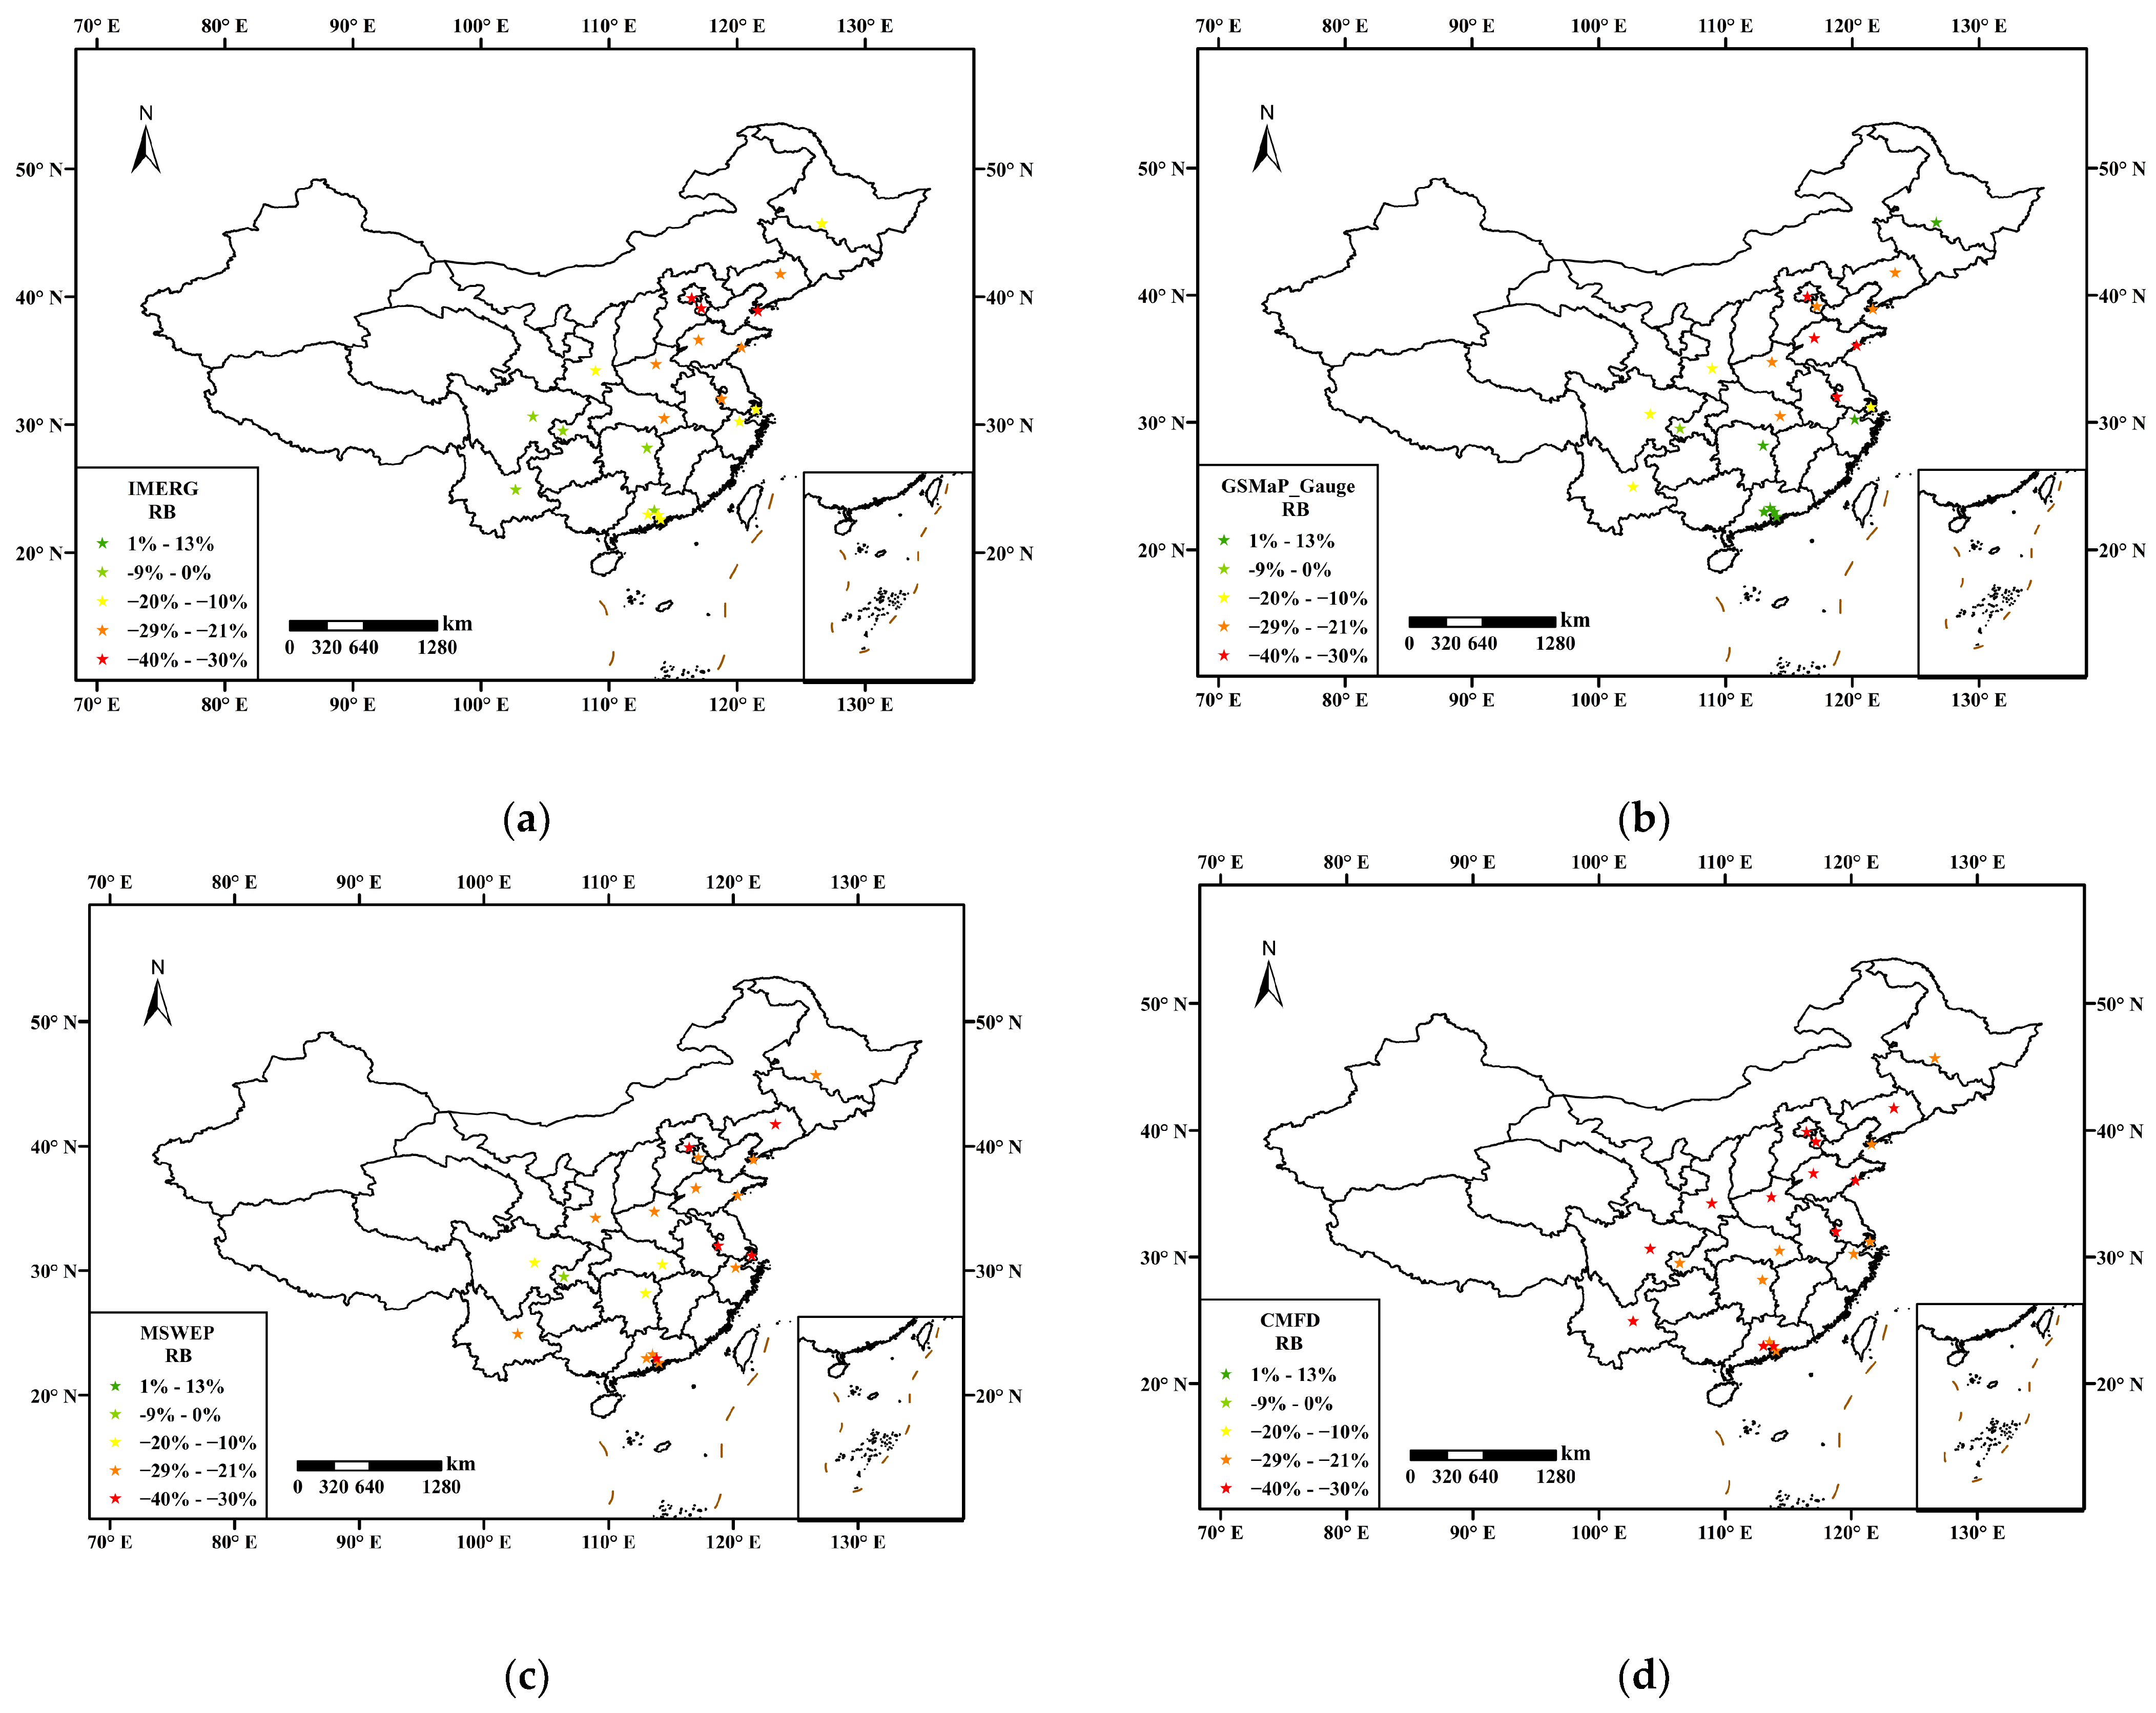
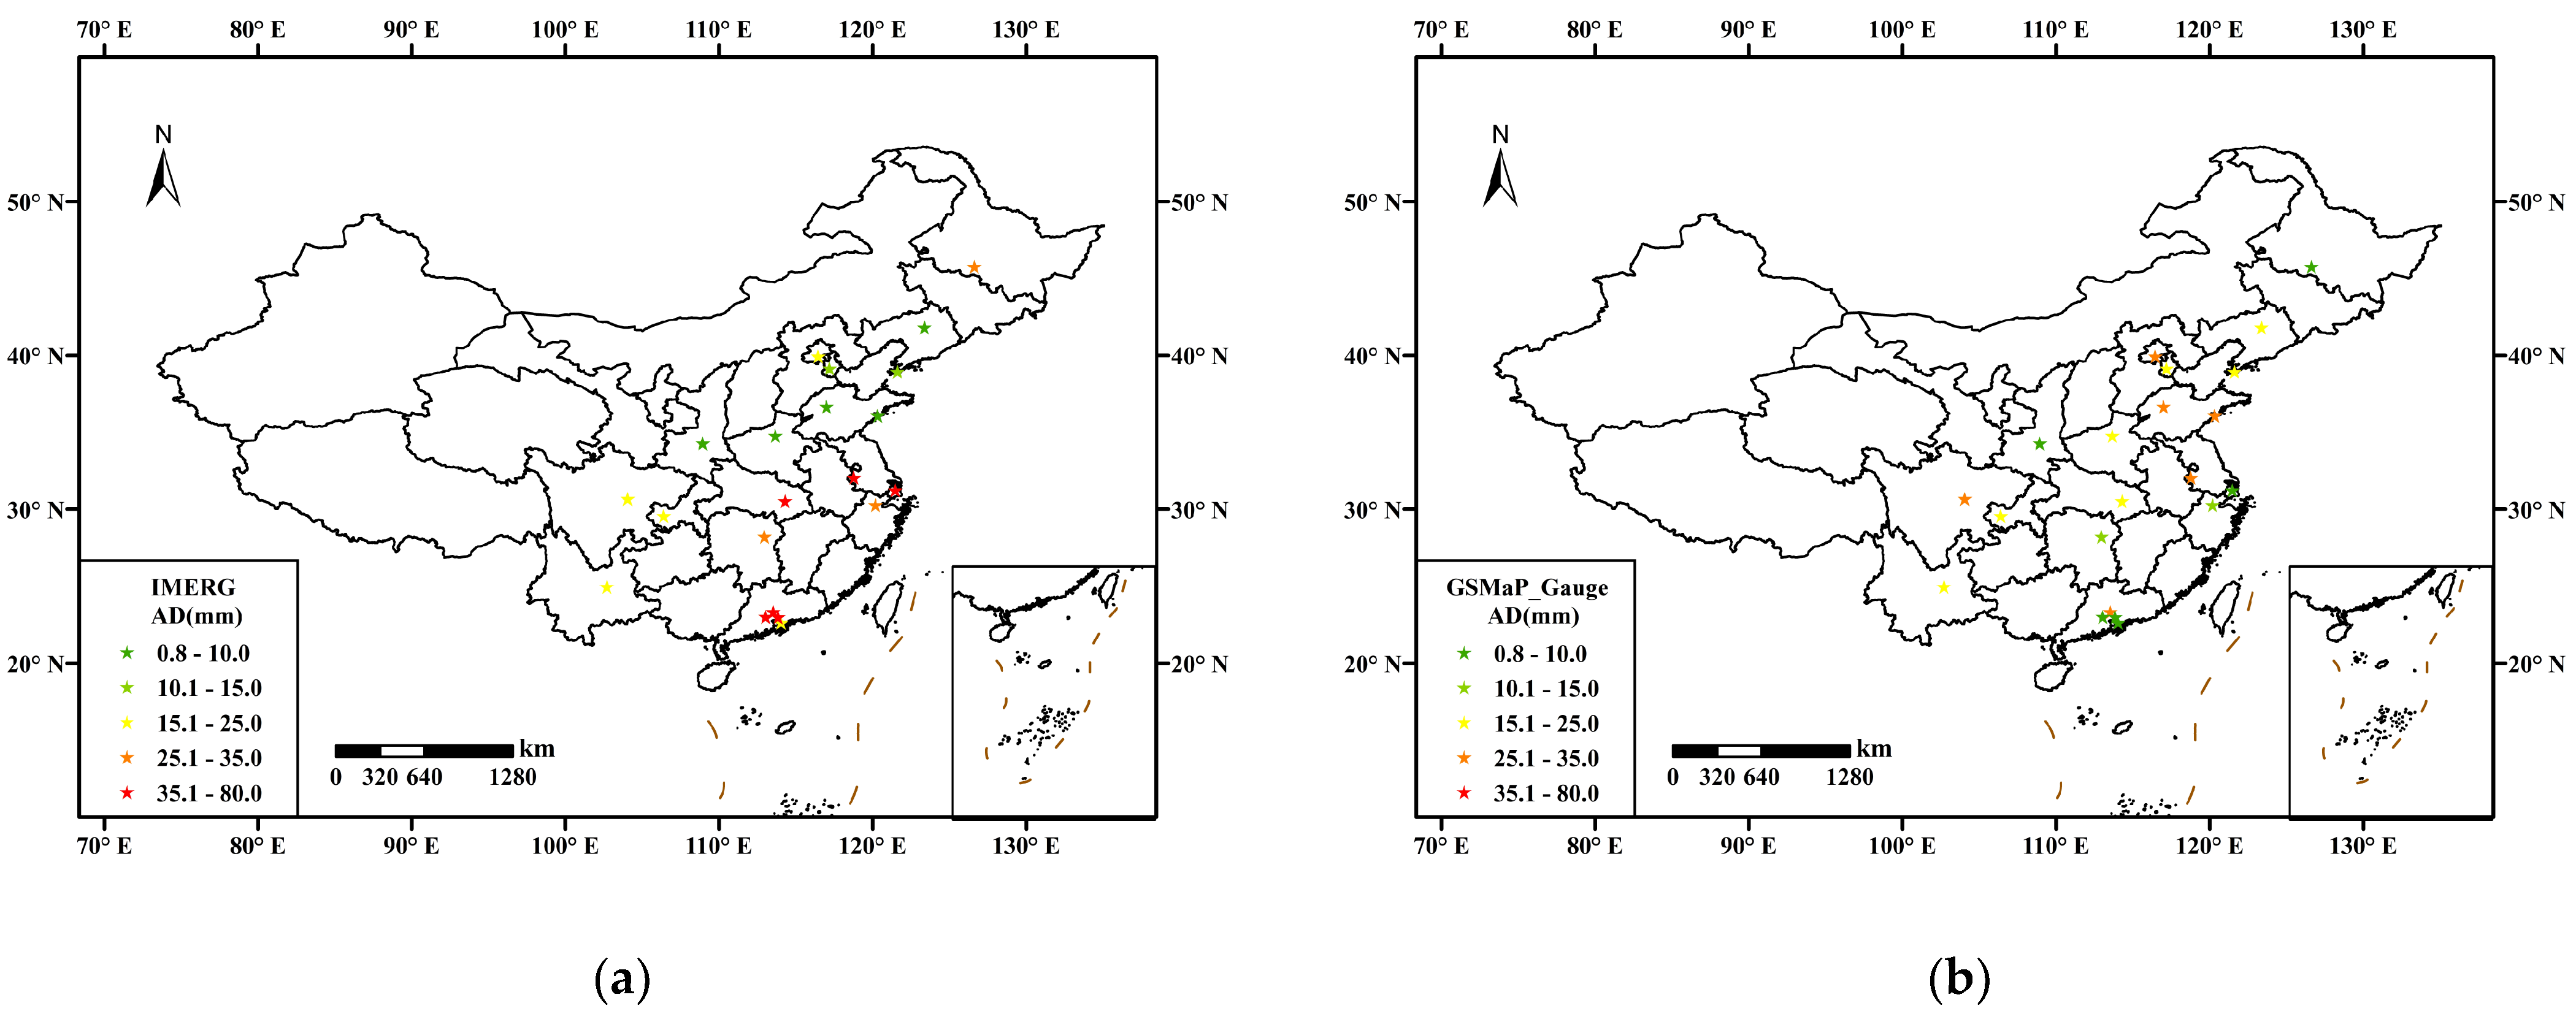
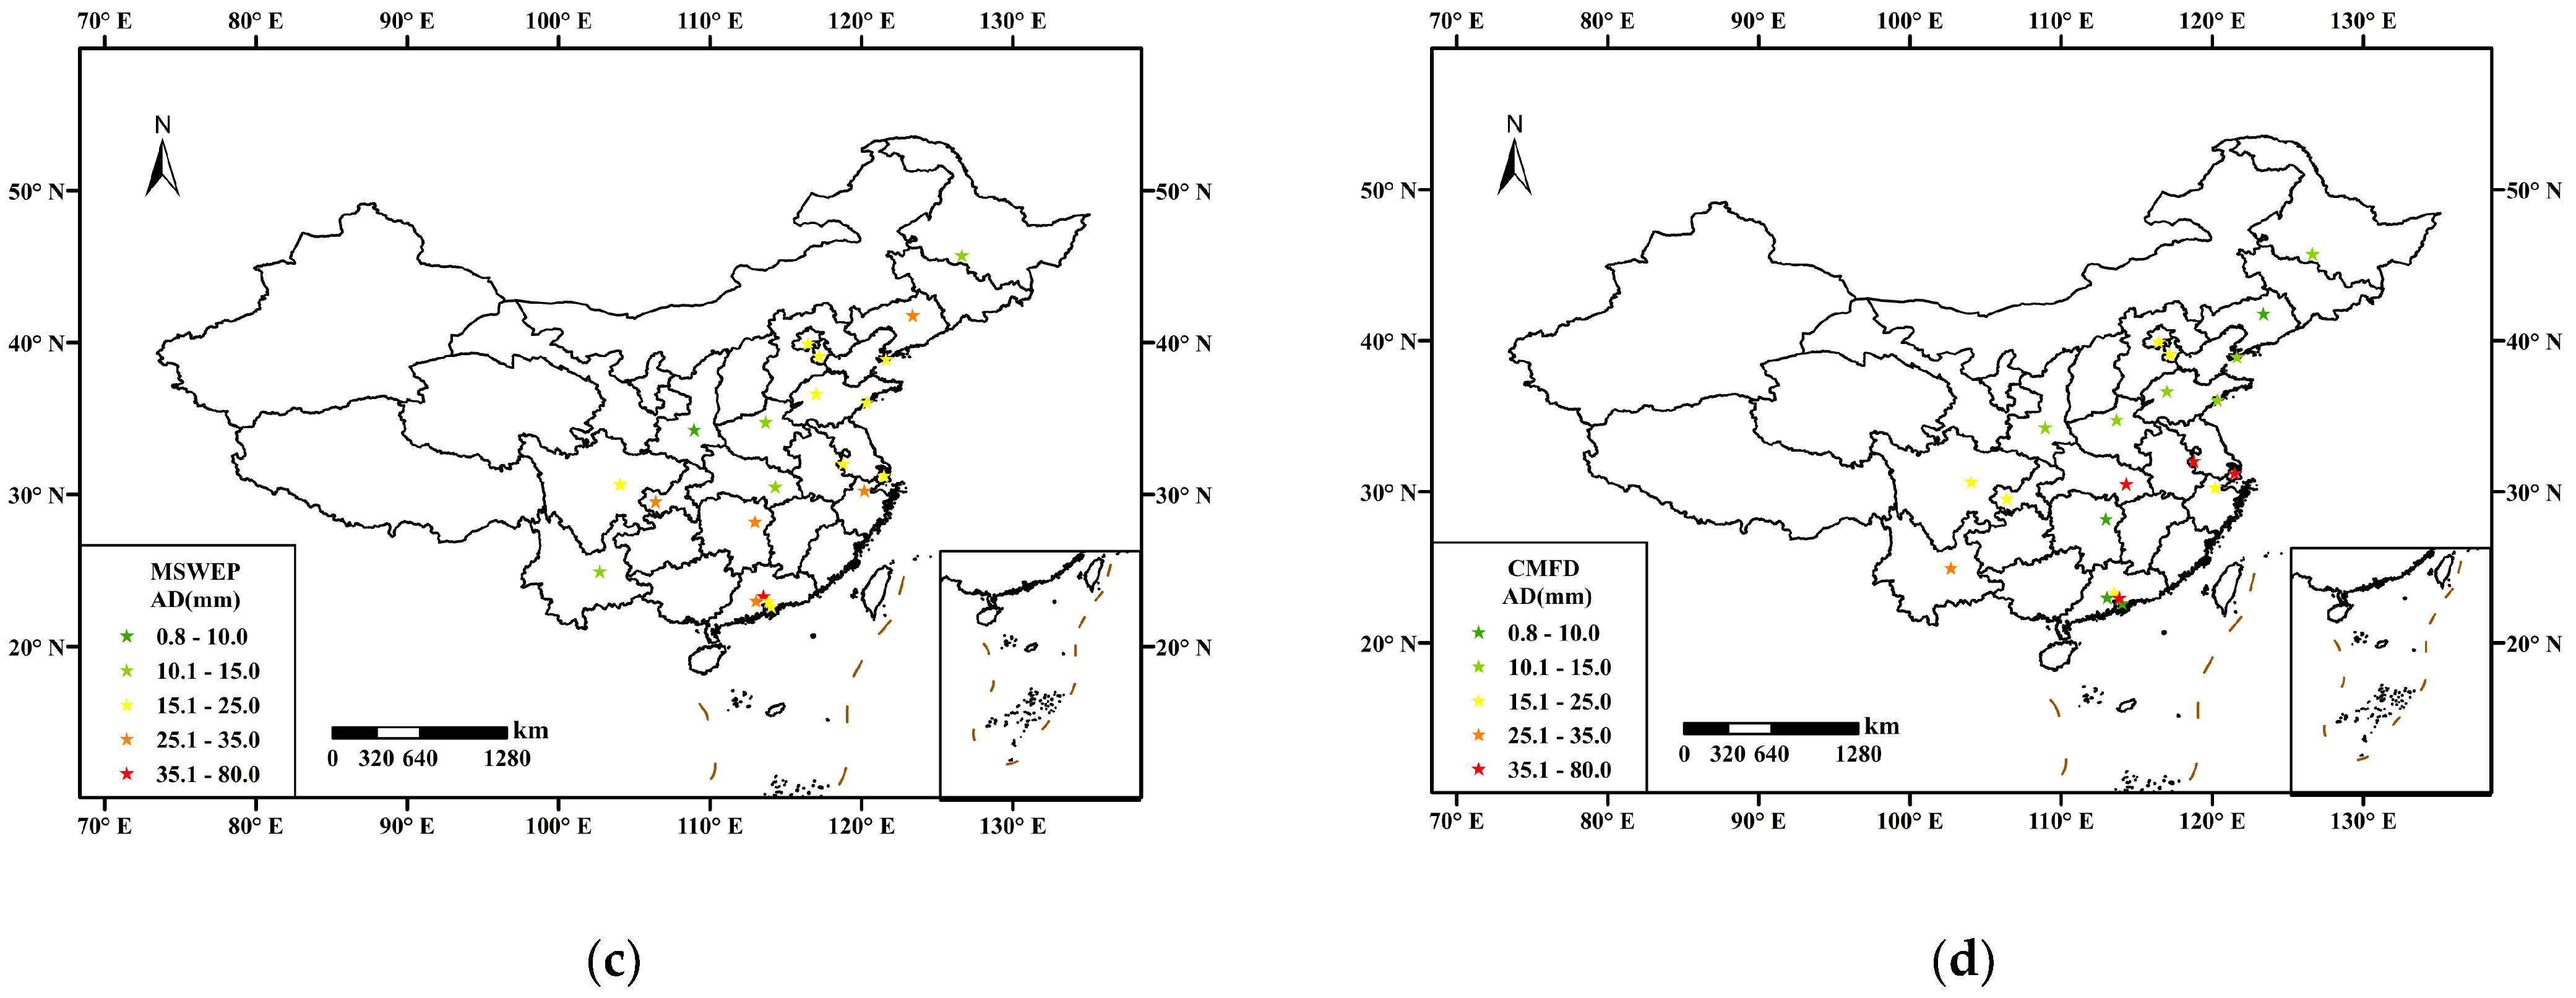
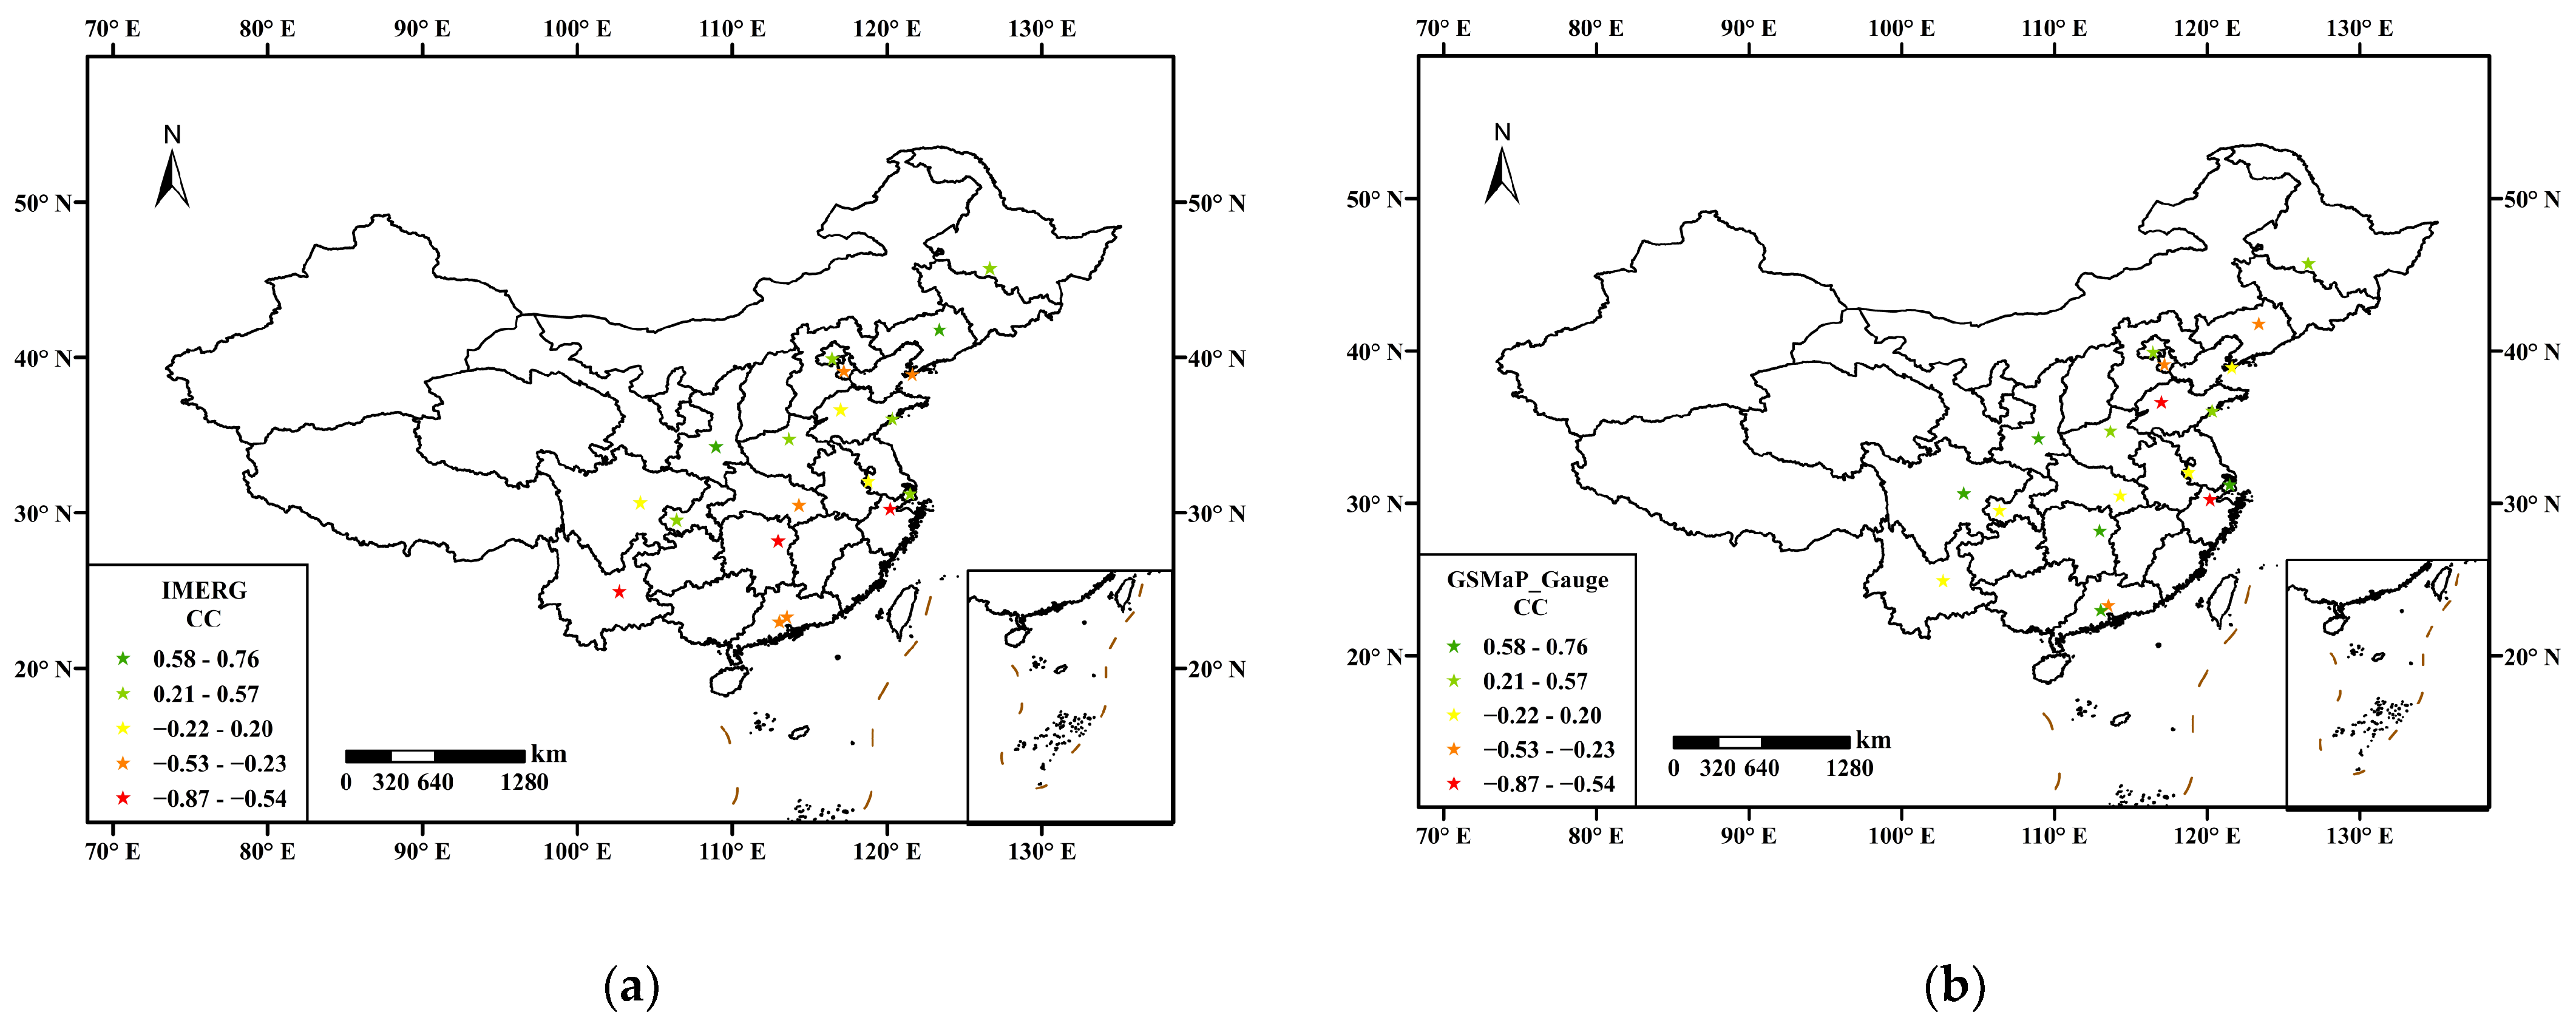
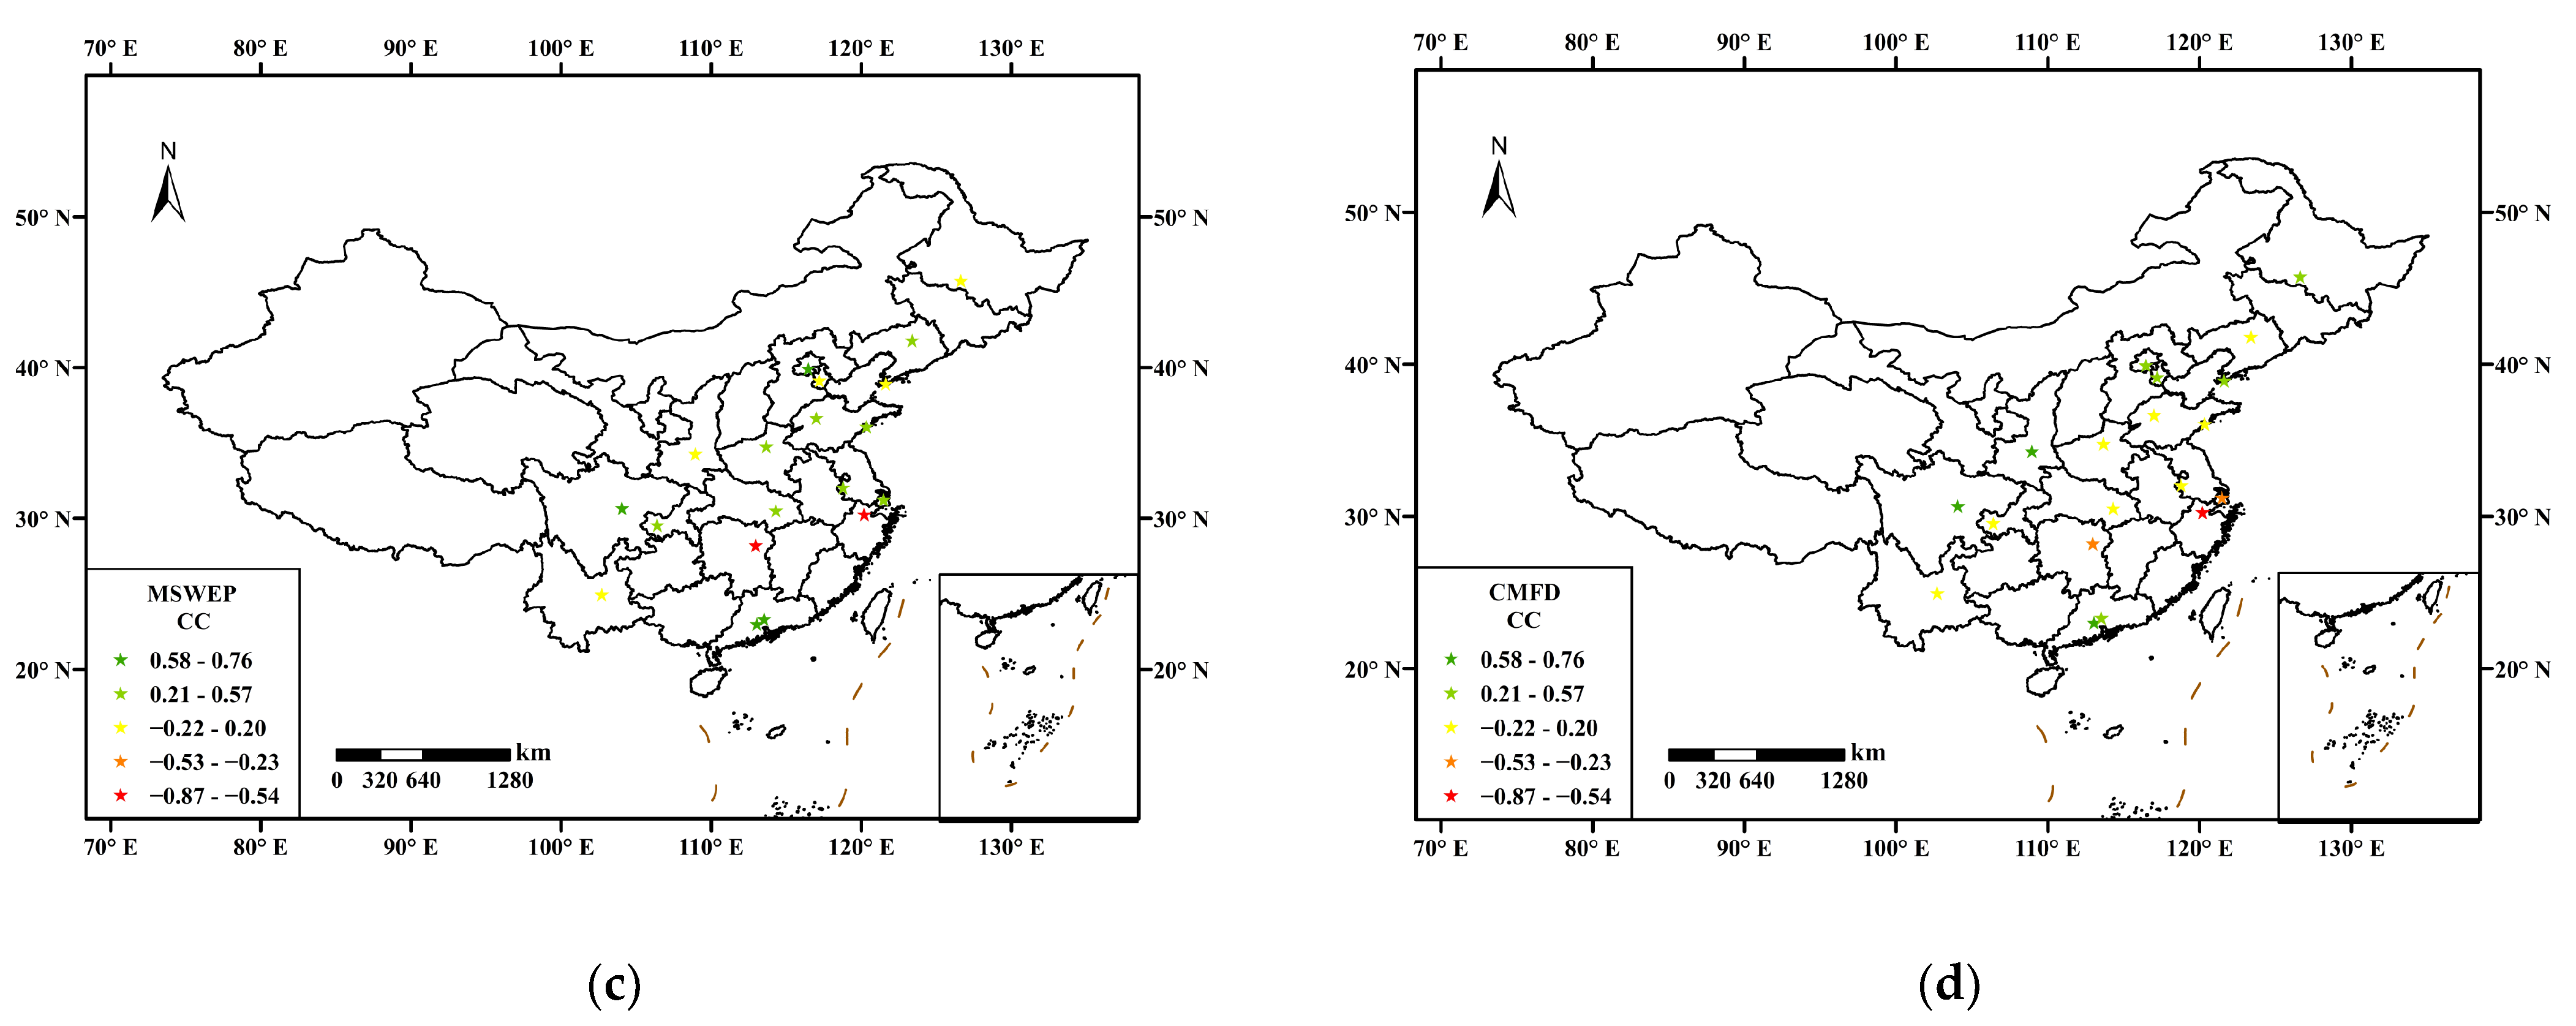
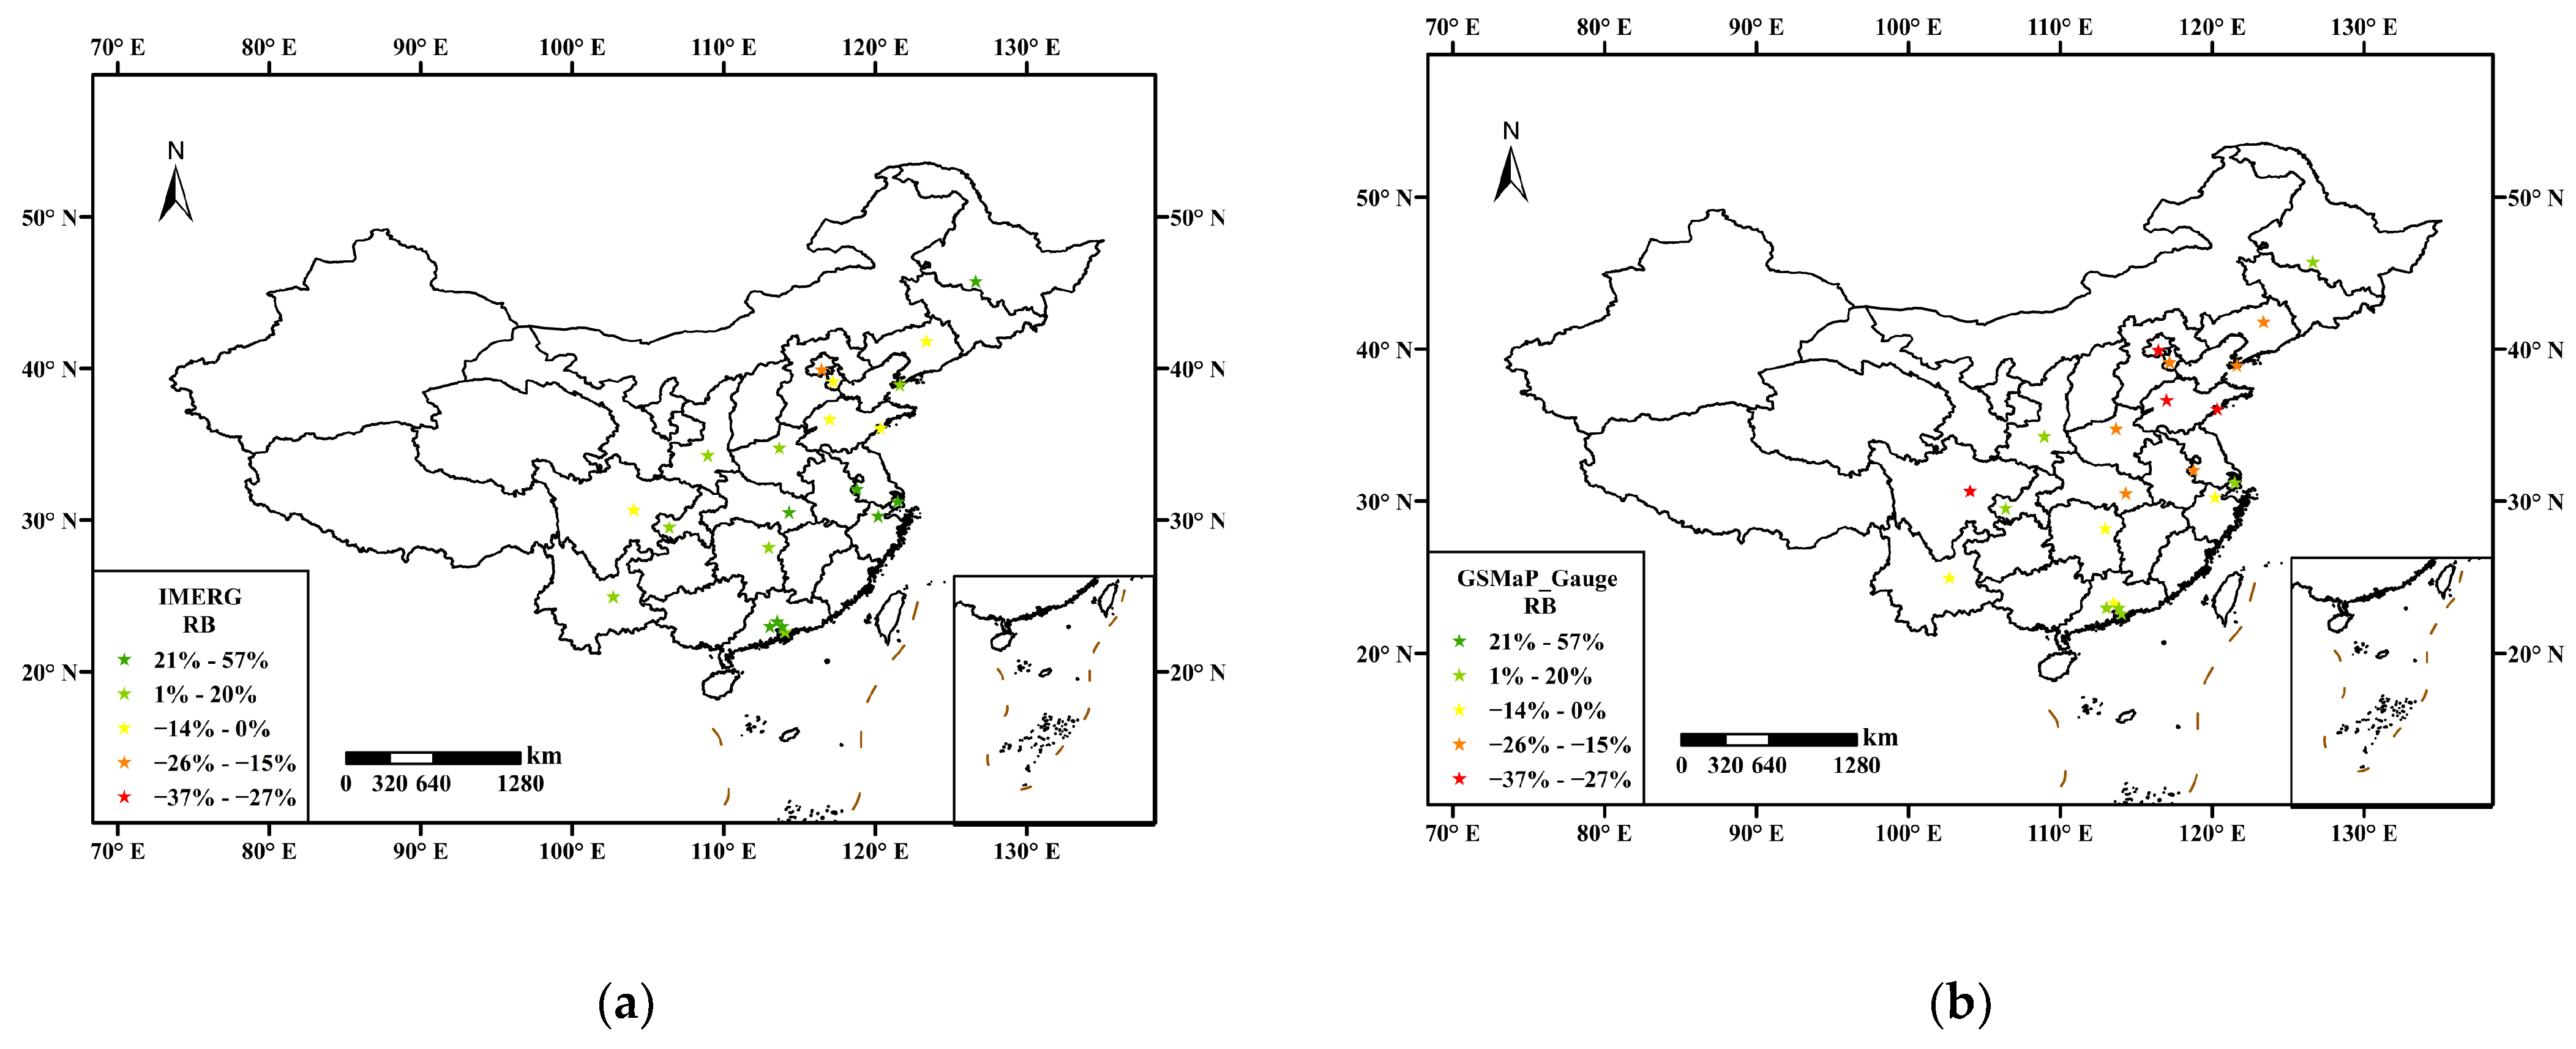
3.2. Performance of SPPs on 21 Major Cities

The abilities of four SPPs in estimating the urban extreme precipitation of 21 major cities are examined. Two most important indices for urban risk management, R99 and R99TOT, are selected from the six extreme precipitation indices. Because R99 is one of the most important criteria for extreme precipitation and R99TOT can reveal the precipitation volume that exceed R99. AD, CC, and RB of the two indices are calculated and compared. It is worth noting that the interpretation of AD, RB, and CC in this context differs from that in Section 3.1, where they denote the absolute deviation, relative bias, and correlation coefficient of R99 or R99TOT between the gauge and SPP estimations. In the case of Shenzhen and Dongguan, where only a single rain gauge is available, it is not possible to calculate the CC value, as there exists only one R99 or R99TOT estimate from the respective rain gauge in each city.
Table 4 shows the difference of R99 between the SPPs and gauge observations in 21 major cities. The results indicate that all four SPPs underestimate R99 in the selected cities generally. GSMaP_Gauge exhibits the best performance in estimating R99 values, with an average AD of 14.5 mm and an average RB of −13%. The highest CC value is observed for CMFD, suggesting a high degree of correlation between its R99 estimates and those obtained from gauge observations. Notably, the four SPPs all underestimate R99 in these cities with a negative RB, especially for MSWEP and CMFD. It is crucial to correct these biases before application.
Figure 5 shows AD of R99 values between SPPs data and urban gauges observations in 21 major cities. The results show that the absolute errors in R99 for the four SPPs are primarily concentrated in the North China Plain and the Pearl River Delta (PRD) region. Overall, GSMaP_Gauge shows the best performance in the selected cities and particularly outperforms the other three SPPs in the PRD region. However, it is important to note that GSMaP_Gauge exhibits significant absolute error in the North China Plain, which is higher than that of MSWEP.
Figure 6 presents the correlation coefficients of R99 values between SPP estimates and those obtained from rain gauges in 21 major cities. Among the four SPPs, CMFD exhibits the best performance, with positive correlations observed in most cities. However, there are still several cities exhibiting a strong negative correlation in the IMERG, GSMap_Gauge, and MSWEP. Notably, IMERG performs best in northern cities, which exhibit a significant positive correlation. However, IMERG does not perform well in southern cities, particularly in some coastal cities, which show a strong negative correlation.
Figure 7 shows relative bias of R99 values between SPPs data and urban gauges observations in 21 major cities. Overall, the relative errors of the four SPPs are more substantial in the northern cities than in the southern cities. This difference can be partly attributed to the greater precipitation in the southern cities. GSMaP_Gauge shows better performance in relative error, particularly in the southern cities, where it significantly outperforms the other SPPs. IMERG and GSMaP_Gauge show similar spatial patterns and perform slightly worse than GSMaP_Gauge. In contrast, MSWEP and CMFD exhibit consistently underestimation, particularly in the northern cities, where the underestimation is more pronounced.
Table 5 shows the difference of R99TOT between the SPPs data and gauge observations in 21 major cities. The results show that GSMaP_Gauge also exhibits the best performance in estimating R99TOT value, with an AD of 17.3 mm and RB of −13%. MSWEP exhibits the highest CC of 0.29, indicating a strong correlation between its R99TOT estimates and those obtained from gauge observations. IMERG and CMFD tend to overestimate R99TOT, whereas GSMaP_Gauge and MSWEP tend to underestimate it in these cities. Analysis of the AD and RB of R99TOT for these cities shows that MSWEP consistently underestimates R99TOT, but the error is relatively smooth. On the other hand, CMFD and IMERG have a higher tendency to overestimate R99TOT in some cities, with RB even exceeding 50%.
Figure 8 shows AD of R99TOT values between SPPs data and urban gauges observations in 21 major cities. The results indicate that the spatial distribution of absolute errors in R99TOT estimation varies significantly among the four SPPs. Specifically, errors in IMERG and CMFD are primarily concentrated in southern China, particularly in the Yangtze River Delta (YRD) and PRD regions. In contrast, the errors in GSMaP_Gauge are mainly located in the northern part of the country, particularly in the North China Plain. The performance of MSWEP is relatively smoother, with no significant spatial differences among these cities. However, MSWEP also show a consistent underestimation across all areas.
Figure 9 shows CC of R99TOT values between SPPs data and urban gauges observa-tions in 21 major cities. The results indicate that the MSWEP outperforms the other three SPPs. While the majority of cities demonstrate a positive correlation, a few cities still exhibit a significant negative correlation. The CC values for the IMERG and CMFD generally decrease from north to south, implying a stronger correlation between their R99TOT esti-mates and those obtained from gauge observations in northern cities. In contrast, the dis-tribution of negatively correlated cities in the GSMaP_Gauge is concentrated in the eastern regions.
Figure 10 shows the RB of the R99TOT values between SPPs data and urban gauges observations in 21 major cities. The spatial distribution of the RB from four SPPs shows a substantial disparity. Overall, GSMaP_Gauge shows the best performance among the four SPPs, but it still exhibits high RB of R99TOT in some cities, such as Beijing and Jinan. IMERG and CMFD show high spatial variability and exhibit high RB in several cities. Specifically, in IMERG, RB is higher than 50% in Shanghai and Harbin, and in CMFD, it exceeds 50% in Shenzhen, indicating a high risk of error in these areas. In contrast, MSWEP exhibits a consistently underestimation of R99TOT, similar to these of R99.

3.3. Performance of SPPs on Spatial Correlation

Four cities with most precipitation gauges, including Beijing, Shanghai, Chengdu, and Chongqing, are selected to compare the consistency of extreme precipitation distributions between the SPPs and gauge observations, which is important for risk management. The global BMI of R99 and R99TOT between the SPPs and gauge observations are calculated to explore their spatial correlation. The p-values of global BMI are also calculated to identify if the relationships are significant. The results are listed in Table 6.
The results indicates that R99 and R99TOT obtained from MSWEP and CMFD exhibit the best spatial correlation with gauge observations in the four cities. For R99, MSWEP shows the best spatial correlation in Beijing and Shanghai, with BMI values of 0.33 and 0.66 and p-values of 0.003 and 0.002, respectively. CMFD performs better in Chongqing and Chengdu, with BMI values of 0.33 and 0.1 and p-values of 0.001 and 0.13, respectively. Notably, the R99 values from all four SPPs exhibit poor spatial correlation with gauge observations in Chengdu. For R99TOT, MSWEP demonstrates the best spatial correlation in all four cities, with BMI values of 0.32, 0.33, 0.44, and 0.29 and p-values of 0.003, 0.001, 0.001, and 0.001, respectively.
It was found that, while MSWEP consistently underestimated R99 and R99TOT, it showed a strong spatial correlation with the gauge observations in the four selected cities.
The LISA cluster maps of R99 between the best SPP and gauge observations are presented in Figure 11. The results show that the R99 estimates from MSWEP and CMFD exhibit a significant positive spatial correlation with the gauge observations in Beijing, Chongqing, and Shanghai. Specifically, MSWEP effectively identifies the high R99 zones, such as central Beijing and east Shanghai, with H-H clusters, while CMFD identifies the high R99 zones in northeast Chongqing. However, the high R99 zone in east Chengdu is misidentified as a low R99 zone by CMFD. Although both MSWEP and CMFD accurately identify most of the low R99 zones with L-L clusters, MSWEP falsely identifies the east Beijing as a high R99 zone with L-H clusters.
The LISA cluster maps of R99TOT between MSWEP and gauge observations are presented in Figure 12. The results demonstrate that the R99TOT estimates from MSWEP exhibit a significant positive spatial correlation with the gauge observations in four cities. MSWEP effectively identifies most of the high R99TOT zones and low R99TOT zones, which are shown as H-H and L-L clusters in Figure 12. However, east Beijing still falsely identified as a high R99TOT zone with L-H clusters. Two rain gauges in Chongqing are also false identified.

4. Discussion

In this research, we evaluated the performance of four SPPs in estimating urban extreme precipitation at the national, city, and inner-city scales. Among these SPPs, MSWEP exhibited strong performance with the highest CC and the lowest AD at the national scale, while also showing advantages in describing extreme precipitation distributions at the inner-city scale. This can be attributed to its incorporation of a large number of gauge observations [39]. However, it should be noted that MSWEP tends to underestimate urban precipitation, including extreme indices, which can be found in similar studies [50,51]. Thus, correction should be made before using MSWEP for applications. GSMaP_Gauge demonstrated advantages in estimating urban extreme precipitation indices not only at the national scale, but also at the city scale. The combination of multi-satellite sensors and gauge observations enhances its ability to detect extreme precipitation events [52]. Although previous studies have shown its effectiveness in capturing heavy precipitation [53,54], our research further proves its ability to capture extreme precipitation in complex urban environments.
The performance of these SPPs in estimating urban extreme precipitation varies across regions. We found that the SPPs’ performance was weak in the cities of northern China in general. The finding is similar with relevant studies [55]. One reason may be the sparse precipitation gauge networks in the region, which limits the improvement of SPPs. Moreover, extreme precipitation events in northern China typically occur in short durations with high intensity, which may also contribute to the weak performance of the SPPs in the region. It is worth noting that IMERG demonstrated better performance in the area, particularly in estimating R99TOT. This may be due to its origin from high temporal resolution products, thus allowing it to capture short-duration precipitation events in the region.

5. Conclusions

Accurately estimating extreme precipitation is crucial for urban flood prevention and climate change adaptation, and SPPs offer a feasible solution to this challenge. This study presents a comprehensive evaluation of four recent SPPs, including IMERG, GSMaP_Gauge, MSWEP, and CMFD, by comparing their results with daily observations from the 821 urban gauges. Our analysis focuses on the ability of these SPPs to capture urban extreme precipitation in mainland China at the national, city, and inner-city scales. The main conclusions are as follows:
  • The extreme precipitation estimates from the four SPPs in total urbanized areas in mainland China were evaluated. As for conventional indices, MSWEP has the highest CC of 0.79 and the lowest AD of 1.61 mm. However, it tends to underestimate urban precipitation, with RB of −8.5%. GSMaP_Gauge and IMERG performed better in six extreme indices, with close values to the gauge observations.
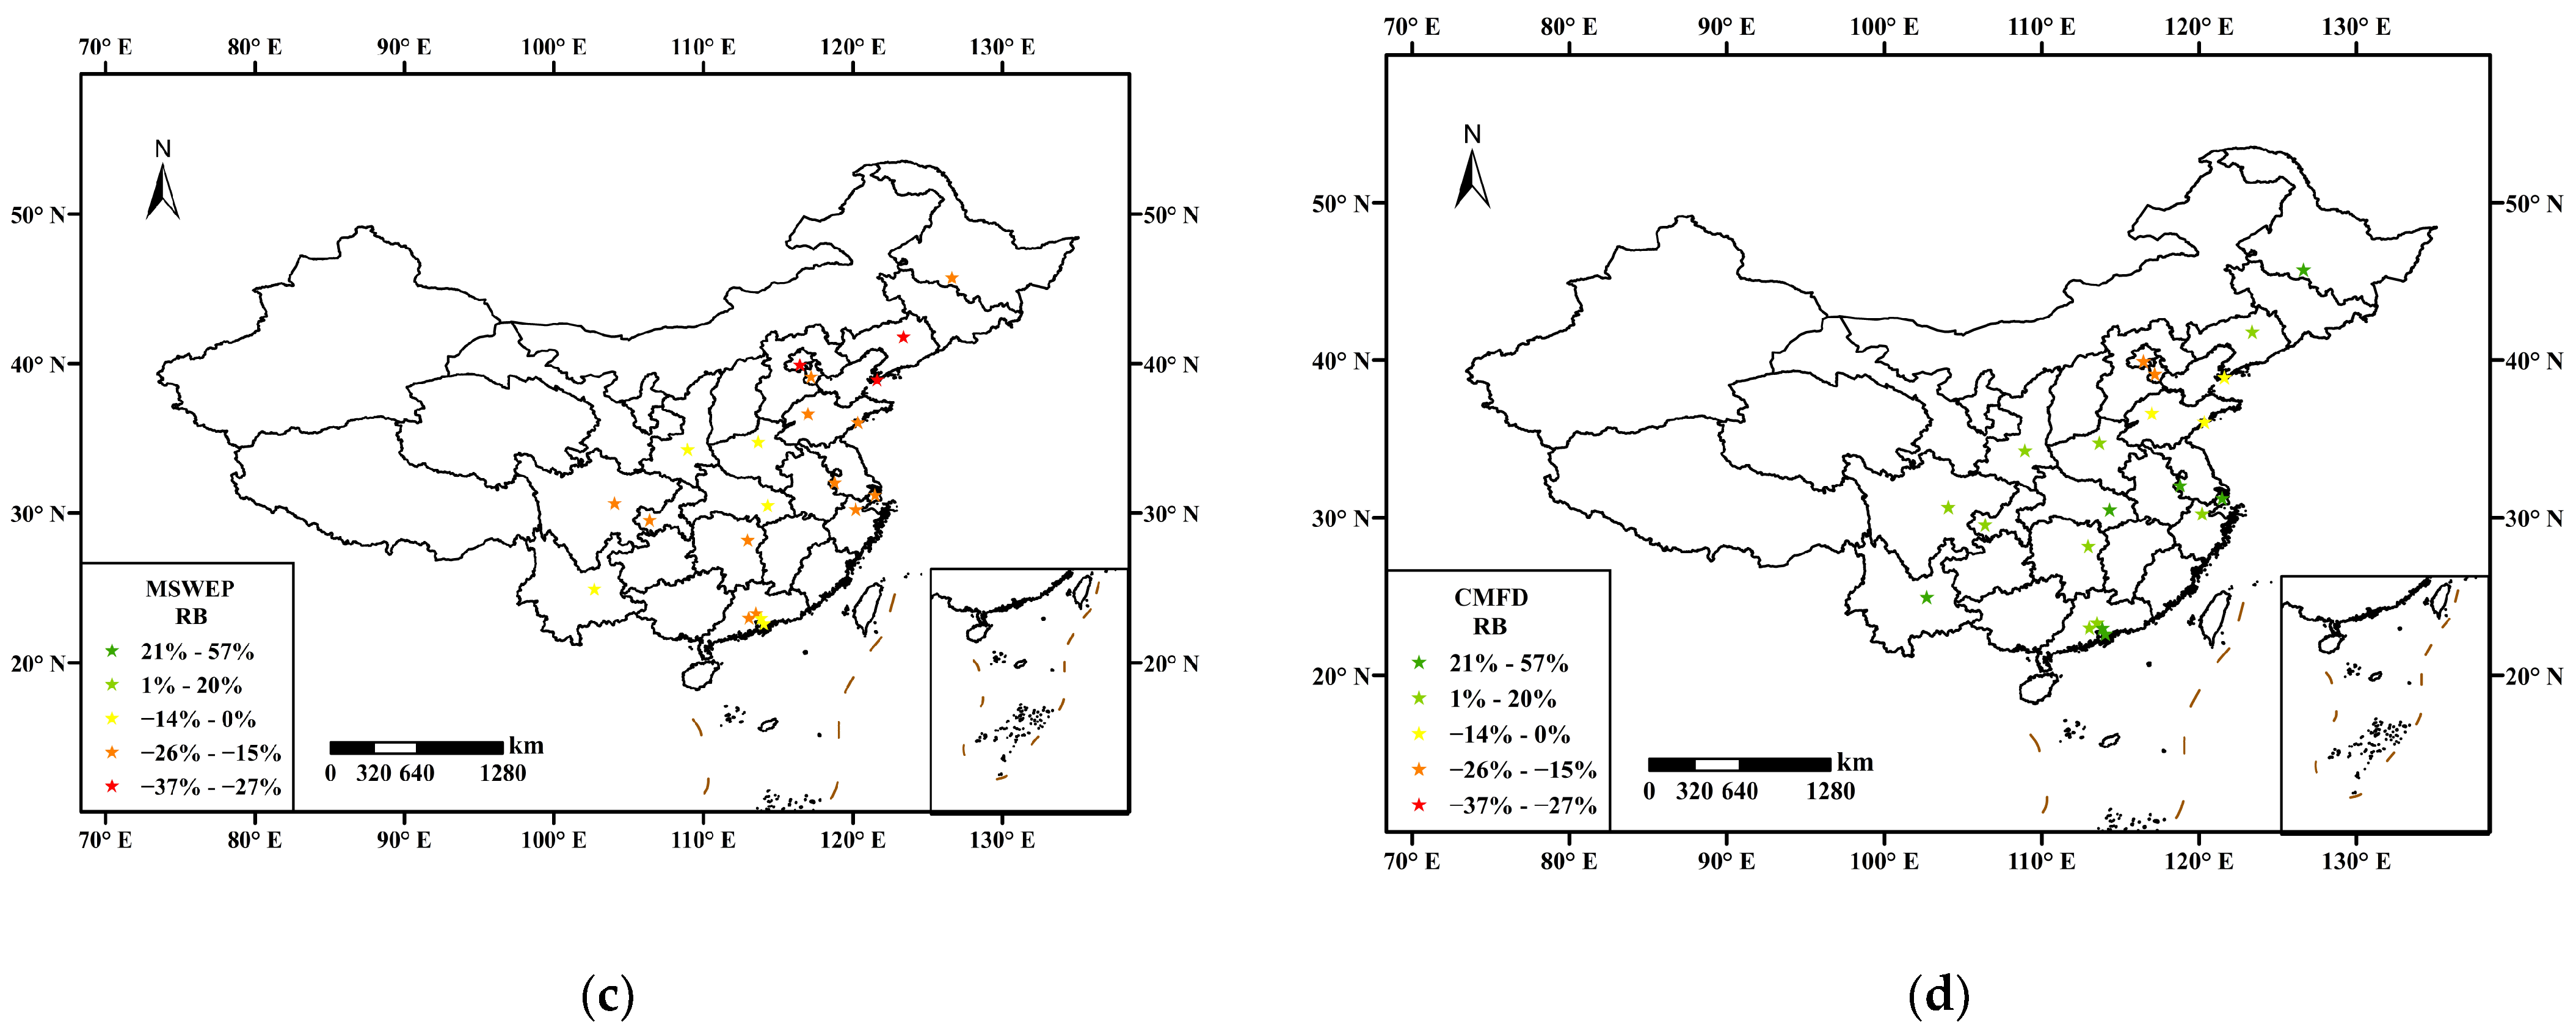
  • The extreme precipitation estimates over 21 Chinese major cities were assessed with R99 and R99TOT. GSMaP_Gauge demonstrates high accuracy in estimating R99 and R99TOT values, exhibiting the best RB and AD in these cities. On the other hand, CMFD and MSWEP exhibit the highest CC values for R99 and R99TOT, respectively, indicating a robust correlation between their estimates and gauge observations. It is found that MSWEP consistently underestimates R99 and R99TOT, but its RB of the two indices is relatively smooth. CMFD and IMERG tend to overestimate R99 and R99TOT in some cities significantly, which bring a risk in their application.
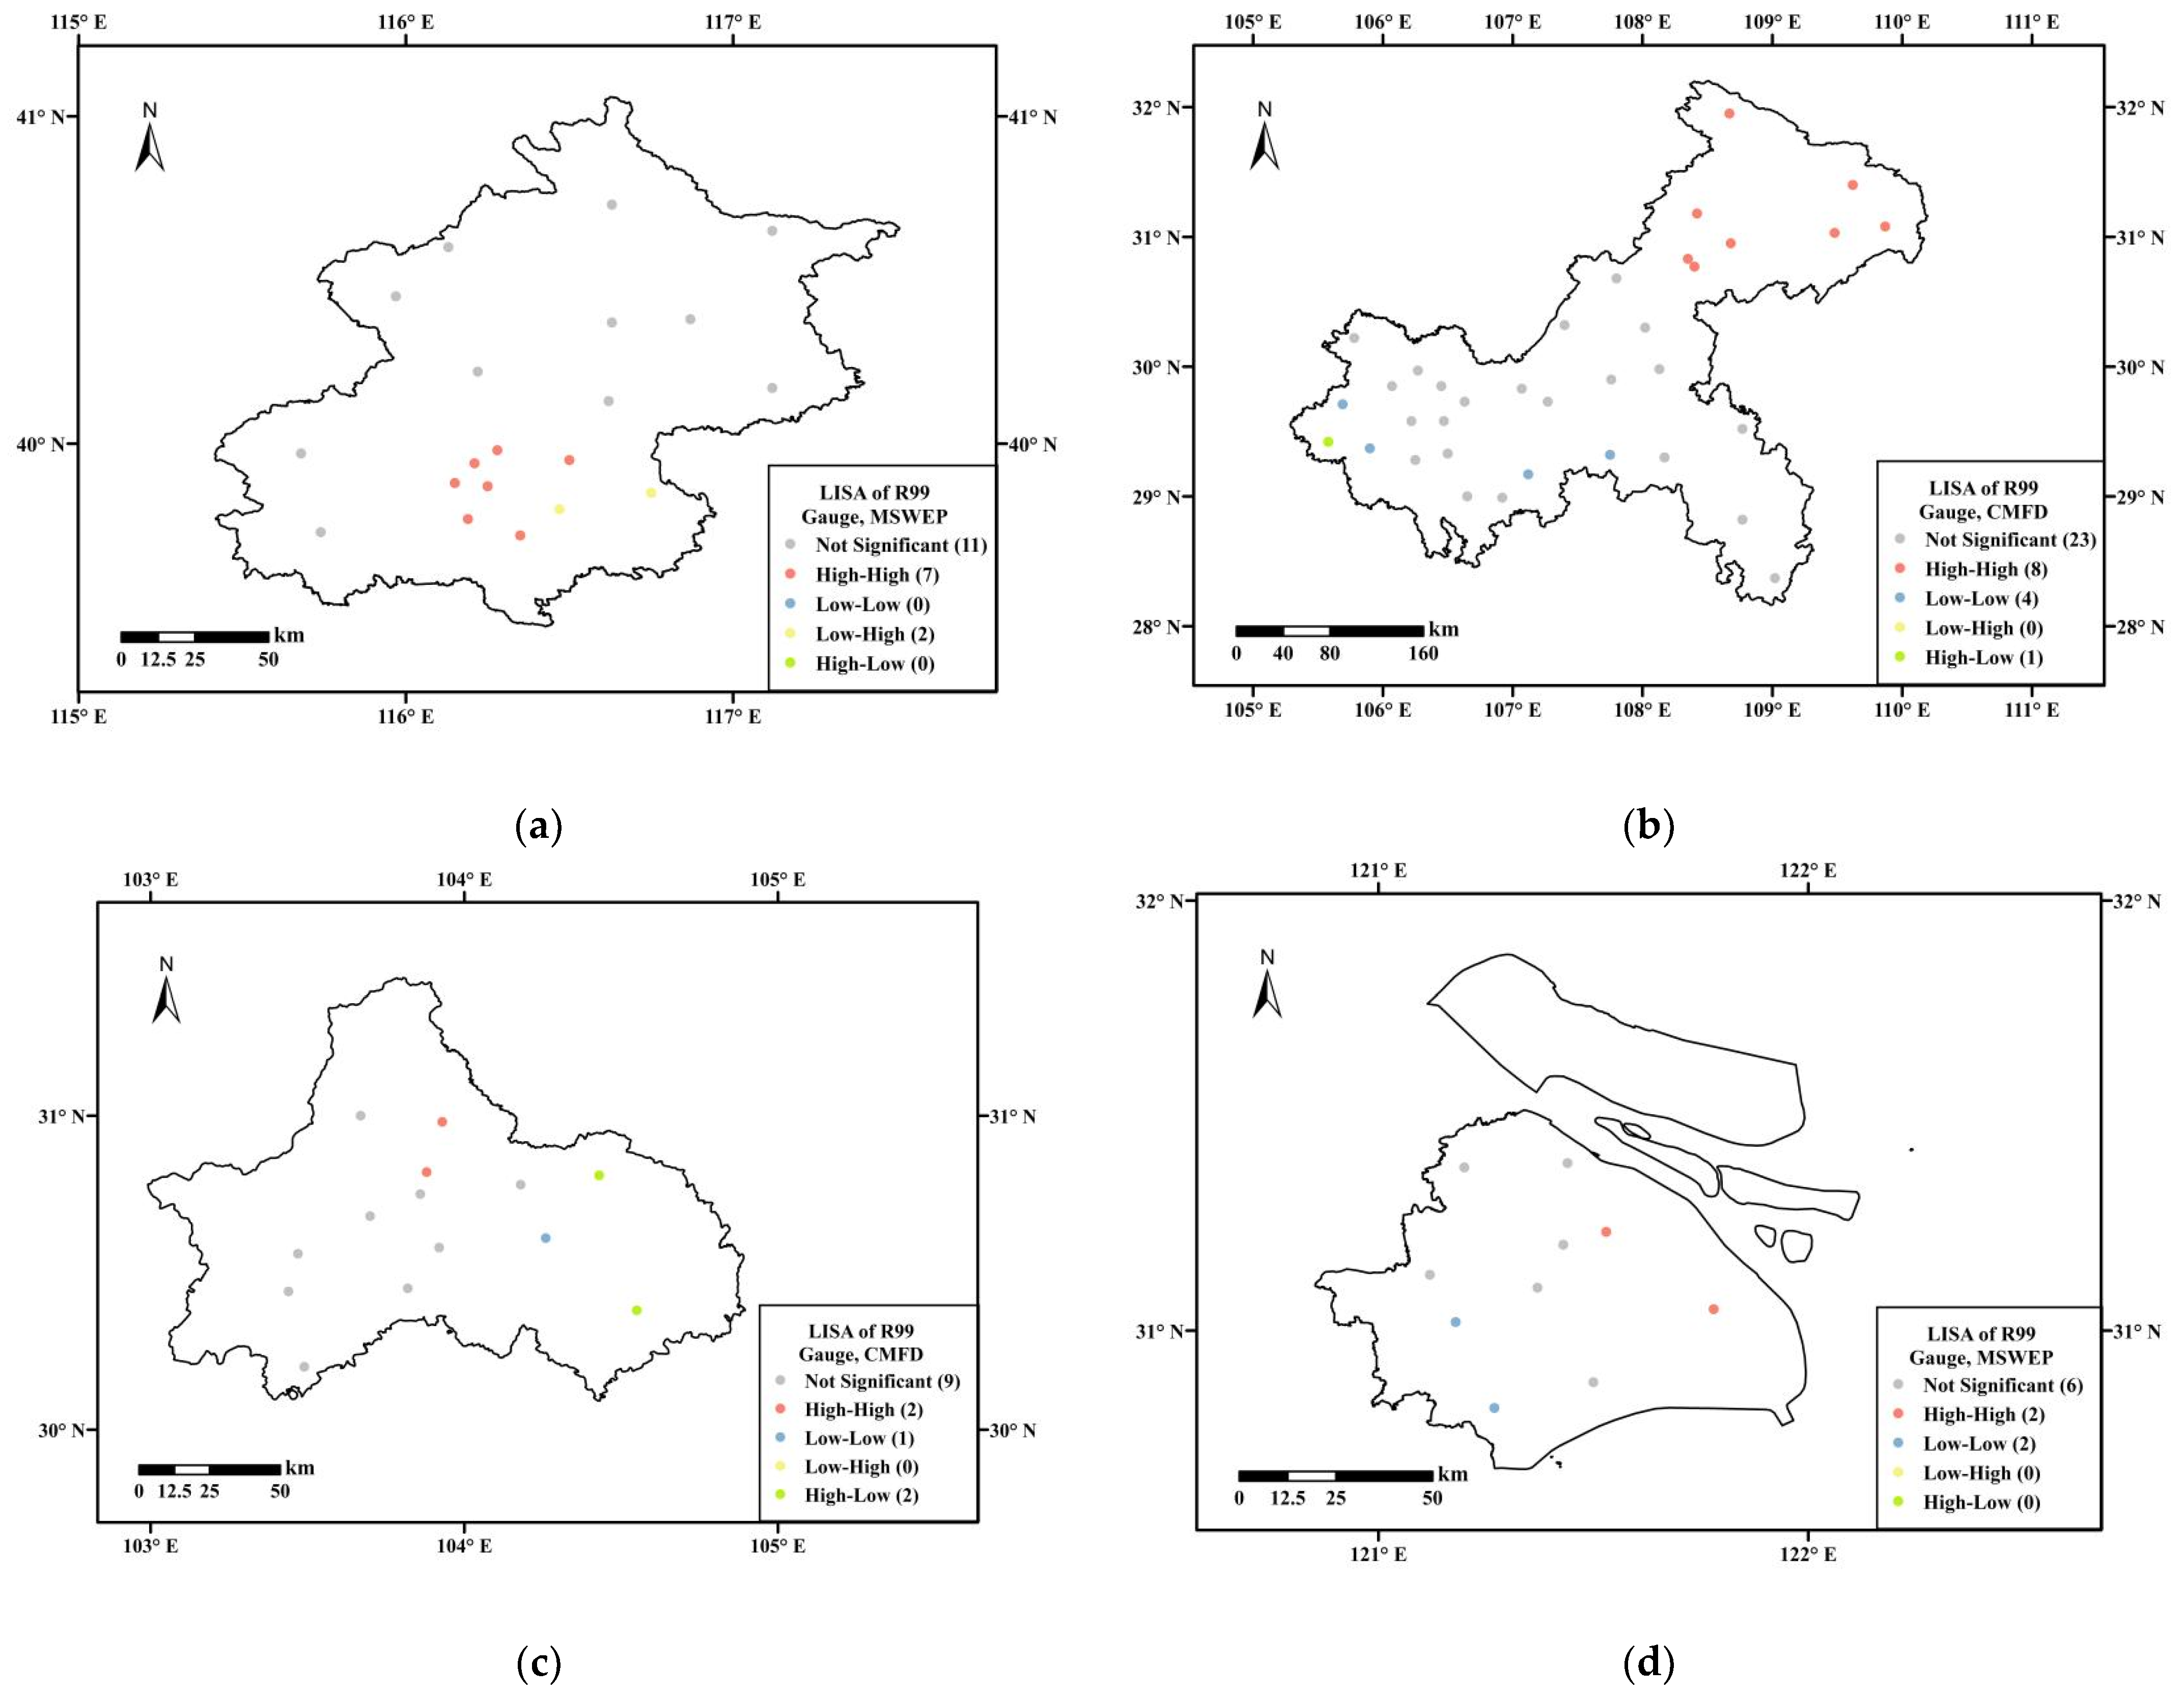
  • BMI is adopted to assess the inner-city spatial correlation of R99 and R99TOT between the SPPs and gauge observations in four major cities, including Beijing, Chongqing, Chengdu, and Shanghai. The R99 and R99TOT from MSWEP show the best spatial correlation with gauge observations in most of cities. CMFD also show an advantage in estimating the R99 distribution in Chongqing and Chengdu.
In conclusion, MSWEP show high accuracy in estimating the precipitation in urban areas according to conventional indices. Despite the consistently underestimated extreme values, such as R99 and R99TOT, MSWEP can estimate the spatial distribution of R99 and R99TOT with high accuracy in four selected cities. GSMaP_Gauge shows an advantage in estimating the urban extreme precipitation indices, while poor in describing their spatial distribution. The performance of IMERG and CMFD are generally lower than them in urban extreme precipitation estimation. The study provides a reference for SPPs application in urban areas. Although daily SPPs can also provide essential information for urban planning, climate change adaption, risk management strategies design, etc., their evaluation at sub-daily scales remains crucial for accurately assessing extreme precipitation events in urban areas. With the fast development of remote sensing technology, more high-precision SPPs with fine resolution are developed, such as CHIPRS and CHELSA. Further evaluations of their capabilities in finer scales will be conducted in our future work.

Author Contributions

Conceptualization, Y.L. and B.P.; data curation, Y.L. and B.P.; formal analysis, Y.L.; software, Y.L.; validation, Z.Z. (Ziqi Zheng), H.C. and D.P.; writing—original draft preparation, Y.L. and B.P.; writing—review and editing, B.P., H.C., Z.Z. (Zhongfan Zhu) and D.Z. All authors have read and agreed to the published version of the manuscript.

Funding

This research was funded by The National Natural Science Foundation of China (Project No., 52179003; 51879008).

Data Availability Statement

IMERG V06 dataset is publicly available (at https://gpm.nasa.gov/data/directory, accessed on 1 July 2021); GSMaP_Gauge dataset is publicly available (at http://sharaku.eorc.jaxa.jp/GSMaP/index.htm, accessed on 1 July 2021); MSWEP V2 dataset is publicly available (at http://www.gloh2o.org/mswep, accessed on 1 July 2021). CMFD dataset is publicly available (at http://data.tpdc.ac.cn/zh-hans/data/8028b944-daaa-4511-8769-965612652c49/, accessed on 1 July 2021). The rain gauge observations data used in this study is provided by the Institute of Geographic Sciences and Natural Resources Research, Chinese Academy of Sciences, and the data are not publicly available, due to privacy policy.

Acknowledgments

The authors appreciate the valuable comments and constructive suggestions from the anonymous referees and the editors who helped improve the manuscript.

Conflicts of Interest

The authors declare no conflict of interest.

References

  1. Marengo, J.A.; Alves, L.M.; Ambrizzi, T.; Young, A.; Barreto, N.J.C.; Ramos, A.M. Trends in extreme rainfall and hydrogeometeorological disasters in the Metropolitan Area of São Paulo: A review. Ann. N. Y. Acad. Sci. 2020, 1472, 5–20. [Google Scholar] [CrossRef] [PubMed]
  2. Huong, H.T.L.; Pathirana, A. Urbanization and climate change impacts on future urban flooding in Can Tho city, Vietnam. Hydrol. Earth Syst. Sci. 2013, 17, 379–394. [Google Scholar] [CrossRef] [Green Version]
  3. Li, Y.; Fowler, H.J.; Argüeso, D.; Blenkinsop, S.; Evans, J.P.; Lenderink, G.; Yan, X.D.; Guerreiro, S.B.; Lewis, E.; Li, X.F. Strong Intensification of Hourly Rainfall Extremes by Urbanization. Geophys. Res. Lett. 2020, 47, e2020GL088758. [Google Scholar] [CrossRef]
  4. Abiodun, B.J.; Adegoke, J.; Abatan, A.A.; Ibe, C.A.; Egbebiyi, T.S.; Engelbrecht, F.; Pinto, I. Potential impacts of climate change on extreme precipitation over four African coastal cities. Clim. Change 2017, 143, 399–413. [Google Scholar] [CrossRef]
  5. Gasper, R.; Blohm, A.; Ruth, M. Social and economic impacts of climate change on the urban environment. Curr. Opin. Environ. Sustain. 2011, 3, 150–157. [Google Scholar] [CrossRef]
  6. Tapiador, F.J.; Turk, F.J.; Petersen, W.; Hou, A.Y.; García-Ortega, E.; Machado, A.T.; Angelis, C.F.; Salio, P.; Kidd, C.; Huffman, G.J.; et al. Global precipitation measurement: Methods, datasets and applications. Atmos. Res. 2012, 104–105, 70–97. [Google Scholar] [CrossRef]
  7. Colli, M.; Pollock, M.; Stagnaro, M.; Lanza, L.G.; Dutton, M.; O’Connell, E. A Computational Fluid-Dynamics Assessment of the Improved Performance of Aerodynamic Rain Gauges. Water Resour. Res. 2018, 54, 779–796. [Google Scholar] [CrossRef]
  8. Hughes, D.A. Comparison of satellite rainfall data with observations from gauging station networks. J. Hydrol. 2006, 327, 399–410. [Google Scholar] [CrossRef]
  9. Thorndahl, S.; Einfalt, T.; Willems, P.; Nielsen, J.E.; Ten Veldhuis, M.C.; Arnbjerg-Nielsen, K.; Rasmussen, M.R.; Molnar, P. Weather radar rainfall data in urban hydrology. Hydrol. Earth Syst. Sci. 2017, 21, 1359–1380. [Google Scholar] [CrossRef] [Green Version]
  10. Crochet, P. Enhancing radar estimates of precipitation over complex terrain using information derived from an orographic precipitation model. J. Hydrol. 2009, 377, 417–433. [Google Scholar] [CrossRef]
  11. Yang, X.; Lu, Y.; Tan, M.L.; Li, X.; Wang, G.; He, R.M. Nine-Year Systematic Evaluation of the GPM and TRMM Precipitation Products in the Shuaishui River Basin in East-Central China. Remote Sens. 2020, 12, 1042. [Google Scholar] [CrossRef] [Green Version]
  12. Tan, J.; Huffman, G.J.; Bolvin, D.T.; Nelkin, E.J. IMERG V06: Changes to the Morphing Algorithm. J. Atmos. Ocean. Technol. 2019, 36, 2471–2482. [Google Scholar] [CrossRef]
  13. Okamoto, K.I.; Ushio, T.; Iguchi, T.; Takahashi, N.; Iwanami, K. The global satellite mapping of precipitation (GSMaP) project. In Proceedings of the 2005 IEEE International Geoscience and Remote Sensing Symposium, Seoul, Republic of Korea, 29–29 July 2005; Volume 5, pp. 3414–3416. [Google Scholar]
  14. He, J.; Yang, K.; Tang, W.; Lu, H.; Qin, J.; Chen, Y.; Li, X. The first high-resolution meteorological forcing dataset for land process studies over China. Sci. Data 2020, 7, 25. [Google Scholar] [CrossRef] [PubMed] [Green Version]
  15. Beck, H.E.; van Dijk, A.I.J.M.; Levizzani, V.; Schellekens, J.; Miralles, D.G.; Martens, B.; de Roo, A. MSWEP: 3-hourly 0.25° global gridded precipitation (1979–2015) by merging gauge, satellite, and reanalysis data. Hydrol. Earth Syst. Sci. 2017, 21, 589–615. [Google Scholar] [CrossRef] [Green Version]
  16. Wang, C.; Tang, G.; Han, Z.; Guo, X.; Hong, Y. Global intercomparison and regional evaluation of GPM IMERG Version-03, Version-04 and its latest Version-05 precipitation products: Similarity, difference and improvements. J. Hydrol. 2018, 564, 342–356. [Google Scholar] [CrossRef]
  17. Amjad, M.; Yilmaz, M.T.; Yucel, I.; Yilmaz, K.K. Performance evaluation of satellite- and model-based precipitation products over varying climate and complex topography. J. Hydrol. 2020, 584, 124707. [Google Scholar] [CrossRef]
  18. Chua, Z.W.; Kuleshov, Y.; Watkins, A. Evaluation of Satellite Precipitation Estimates over Australia. Remote Sens. 2020, 12, 678. [Google Scholar] [CrossRef] [Green Version]
  19. Gehne, M.; Hamill, T.M.; Kiladis, G.N.; Trenberth, K.E. Comparison of Global Precipitation Estimates across a Range of Temporal and Spatial Scales. J. Clim. 2016, 29, 7773–7795. [Google Scholar] [CrossRef]
  20. Guo, H.; Chen, S.; Bao, A.; Hu, J.; Gebregiorgis, A.S.; Xue, X.; Zhang, X. Inter-Comparison of High-Resolution Satellite Precipitation Products over Central Asia. Remote Sens. 2015, 7, 7181–7211. [Google Scholar] [CrossRef] [Green Version]
  21. Wang, D.; Wang, X.; Liu, L.; Wang, D.; Huang, H.; Pan, C. Evaluation of CMPA precipitation estimate in the evolution of typhoon-related storm rainfall in Guangdong, China. J. Hydroinform. 2016, 18, 1055–1068. [Google Scholar] [CrossRef] [Green Version]
  22. Xiong, W.T.; Tang, G.Q.; Wang, T.; Ma, Z.Q.; Wan, W. Evaluation of IMERG and ERA5 Precipitation-Phase Partitioning on the Global Scale. Water 2022, 14, 1122. [Google Scholar] [CrossRef]
  23. Zhang, L.; Chen, X.; Lai, R.; Zhu, Z. Performance of satellite-based and reanalysis precipitation products under multi-temporal scales and extreme weather in mainland China. J. Hydrol. 2022, 605, 127389. [Google Scholar] [CrossRef]
  24. Zhang, A.; Xiao, L.; Min, C.; Chen, S.; Kulie, M.; Huang, C.Y.; Liang, Z.Q. Evaluation of latest GPM-Era high-resolution satellite precipitation products during the May 2017 Guangdong extreme rainfall event. Atmos. Res. 2019, 216, 76–85. [Google Scholar] [CrossRef]
  25. Huang, Y.; Chen, S.; Cao, Q.; Hong, Y.; Wu, B.; Huang, M.; Qiao, L.; Zhang, Z.; Li, Z.; Li, W. Evaluation of Version-7 TRMM Multi-Satellite Precipitation Analysis Product during the Beijing Extreme Heavy Rainfall Event of 21 July 2012. Water 2014, 6, 32–44. [Google Scholar] [CrossRef] [Green Version]
  26. Habib, E.; Henschke, A.; Adler, R.F. Evaluation of TMPA satellite-based research and real-time rainfall estimates during six tropical-related heavy rainfall events over Louisiana, USA. Atmos. Res. 2009, 94, 373–388. [Google Scholar] [CrossRef]
  27. Getirana, A.; Kirschbaum, D.; Mandarino, F.; Ottoni, M.; Khan, S.; Arsenault, K. Potential of GPM IMERG Precipitation Estimates to Monitor Natural Disaster Triggers in Urban Areas: The Case of Rio de Janeiro, Brazil. Remote Sens. 2020, 12, 4095. [Google Scholar] [CrossRef]
  28. Zhang, Q.; Xu, C.Y.; Zhang, Z.; Chen, Y.D.; Liu, C.L. Spatial and temporal variability of precipitation over China, 1951–2005. Theor. Appl. Climatol. 2009, 95, 53–68. [Google Scholar] [CrossRef]
  29. Fang, J.; Yang, W.; Luan, Y.; Du, J.; Lin, A.; Zhao, L.; Zhao, L. Evaluation of the TRMM 3B42 and GPM IMERG products for extreme precipitation analysis over China. Atmos. Res. 2019, 223, 24–38. [Google Scholar] [CrossRef]
  30. Westra, S.; Fowler, H.J.; Evans, J.P.; Alexander, L.V.; Berg, P.; Johnson, F.; Kendon, E.J.; Lenderink, G.; Roberts, N.M. Future changes to the intensity and frequency of short-duration extreme rainfall. Rev. Geophys. 2014, 52, 522–555. [Google Scholar] [CrossRef] [Green Version]
  31. Ren, M.; Xu, Z.; Pang, B.; Liu, W.; Liu, J.; Du, L.; Wang, R. Assessment of Satellite-Derived Precipitation Products for the Beijing Region. Remote Sens. 2018, 10, 1914. [Google Scholar] [CrossRef] [Green Version]
  32. Li, W.; HE, X.; Sun, W.; Scaioni, M.; Yao, D.; Fu, J.; Chen, Y.; Liu, B.; Gao, J.; Li, X. Evaluating three satellite-based precipitation products of different spatial resolutions in Shanghai based on upscaling of rain gauge. Int. J. Remote Sens. 2019, 40, 5875–5891. [Google Scholar] [CrossRef]
  33. Li, X.; Chen, Y.; Wang, H.; Zhang, Y. Assessment of GPM IMERG and radar quantitative precipitation estimation (QPE) products using dense rain gauge observations in the Guangdong-Hong Kong-Macao Greater Bay Area, China. Atmos. Res. 2020, 236, 104834. [Google Scholar] [CrossRef]
  34. Li, Y.; Pang, B.; Ren, M.; Shi, S.; Peng, D.; Zhu, Z.; Zuo, D. Evaluation of Performance of Three Satellite-Derived Precipitation Products in Capturing Extreme Precipitation Events over Beijing, China. Remote Sens. 2022, 14, 2698. [Google Scholar] [CrossRef]
  35. Li, X.; Gong, P.; Zhou, Y.; Wang, J.; Bai, Y.; Chen, B.; Hu, T.; Xiao, Y.; Xu, B.; Yang, J. Mapping global urban boundaries from the global artificial impervious area (GAIA) data. Environ. Res. Lett. 2020, 15, 94044. [Google Scholar] [CrossRef]
  36. Gong, P.; Li, X.; Wang, J.; Bai, Y.; Chen, B.; Hu, T.; Liu, X.; Xu, B.; Yang, J.; Zhang, W. Annual maps of global artificial impervious area (GAIA) between 1985 and 2018. Remote Sens. Environ. 2020, 236, 111510. [Google Scholar] [CrossRef]
  37. Huffman, G.J.; Bolvin, D.T.; Braithwaite, D.; Hsu, K.; Joyce, R.J. Integrated Multi-satellite Retrievals for the Global Precipitation Measurement (GPM) Mission (IMERG). In Satellite Precipitation Measurement; Levizzani, V., Kidd, C., Kirschbaum, D.B., Kummerow, C.D., Nakamura, K., Turk, F.J., Eds.; Springer International Publishing: Cham, Switzerland, 2020; Volume 1, pp. 343–353. [Google Scholar]
  38. Ushio, T.; Kachi, M. Kalman Filtering Applications for Global Satellite Mapping of Precipitation (GSMaP). In Satellite Rainfall Applications for Surface Hydrology; Gebremichael, M., Hossain, F., Eds.; Springer: Dordrecht, The Netherlands, 2010; pp. 105–123. [Google Scholar]
  39. Beck, H.E.; Wood, E.F.; Pan, M.; Fisher, C.K.; Miralles, D.G.; van Dijk, A.I.J.M.; McVicar, T.R.; Adler, R.F. MSWEP V2 Global 3-Hourly 0.1° Precipitation: Methodology and Quantitative Assessment. Bull. Am. Meteorol. Soc. 2019, 100, 473–500. [Google Scholar] [CrossRef] [Green Version]
  40. Palharini, R.S.A.; Vila, D.A.; Rodrigues, D.T.; Quispe, D.P.; Palharini, R.C.; de Siqueira, R.A.; de Sousa Afonso, J.M. Assessment of the Extreme Precipitation by Satellite Estimates over South America. Remote Sens. 2020, 12, 2085. [Google Scholar] [CrossRef]
  41. Xie, W.; Yi, S.; Leng, C.; Xia, D.; Li, M.; Zhong, Z.; Ye, J. The evaluation of IMERG and ERA5-Land daily precipitation over China with considering the influence of gauge data bias. Sci. Rep. 2022, 12, 8085. [Google Scholar] [CrossRef] [PubMed]
  42. Frich, P.; Alexander, L.V.; Della-Marta, P.; Gleason, B.; Haylock, M.; Tank, A.M.; Peterson, T. Observed coherent changes in climatic extremes during the second half of the twentieth century. Clim. Res. 2002, 19, 193–212. [Google Scholar] [CrossRef] [Green Version]
  43. Zhang, X.B.; Alexander, L.; Hegerl, G.C.; Jones, P.; Tank, A.K.; Peterson, T.C.; Trewin, B.; Zwiers, F.W. Indices for monitoring changes in extremes based on daily temperature and precipitation data. Clim. Change 2011, 2, 851–870. [Google Scholar] [CrossRef]
  44. Czaplewski, R.L.; Reich, R.M. Expected Value and Variance of Moran’s Bivariate Spatial Autocorrelation Statistic for a Permutation Test; Research paper; US Department of Agriculture, Forest Service, Rocky Mountain Forest, Range Experiment Station: Fort Collins, CO, USA, 1993; p. 17.
  45. Cao, R.; Li, F.; Feng, P. Impact of Urbanization on Precipitation in North Haihe Basin, China. Atmosphere 2019, 11, 16. [Google Scholar] [CrossRef] [Green Version]
  46. Jia, X.; Hu, B.; Marchant, B.P.; Zhou, L.; Shi, Z.; Zhu, Y. A methodological framework for identifying potential sources of soil heavy metal pollution based on machine learning: A case study in the Yangtze Delta, China. Environ. Pollut. 2019, 250, 601–609. [Google Scholar] [CrossRef] [PubMed]
  47. Shirvani, Z.; Abdi, O.; Buchroithner, M.F.; Pradhan, B. Analysing Spatial and Statistical Dependencies of Deforestation Affected by Residential Growth: Gorganrood Basin, Northeast Iran. Land Degrad. Dev. 2017, 28, 2176–2190. [Google Scholar] [CrossRef]
  48. Zhang, Y.; Liu, Y.; Zhang, Y.; Liu, Y.; Zhang, G.; Chen, Y. On the spatial relationship between ecosystem services and urbanization: A case study in Wuhan, China. Sci. Total Environ. 2018, 637–638, 780–790. [Google Scholar] [CrossRef] [PubMed]
  49. Anselin, L. Local Indicators of Spatial Association—LISA. Geogr. Anal. 1995, 27, 93–115. [Google Scholar] [CrossRef]
  50. Xu, Z.; Wu, Z.; He, H.; Wu, X.; Zhou, J.; Zhang, Y.; Guo, X. Evaluating the accuracy of MSWEP V2.1 and its performance for drought monitoring over mainland China. Atmos. Res. 2019, 226, 17–31. [Google Scholar] [CrossRef]
  51. Xuan, D.; Hu, Q.; Wang, Y.; Yang, H.; Li, L.; Wang, L. Precipitation Characteristic Analysis of the Zhoushan Archipelago: From the View of MSWEP and Rainfall Merging. Water 2020, 12, 829. [Google Scholar] [CrossRef] [Green Version]
  52. Lu, D.; Yong, B. A Preliminary Assessment of the Gauge-Adjusted Near-Real-Time GSMaP Precipitation Estimate over Mainland China. Remote Sens. 2020, 12, 141. [Google Scholar] [CrossRef] [Green Version]
  53. Nepal, B.; Shrestha, D.; Sharma, S.; Shrestha, M.S.; Aryal, D.; Shrestha, N. Assessment of GPM-Era Satellite Products (IMERG and GSMaP) Ability to Detect Precipitation Extremes over Mountainous Country Nepal. Atmosphere 2021, 12, 254. [Google Scholar] [CrossRef]
  54. Weng, P.; Tian, Y.; Jiang, Y.; Chen, D.; Kang, J. Assessment of GPM IMERG and GSMaP daily precipitation products and their utility in droughts and floods monitoring across Xijiang River Basin. Atmos. Res. 2023, 286, 106673. [Google Scholar] [CrossRef]
  55. Zhou, Z.; Guo, B.; Xing, W.; Zhou, J.; Xu, F.; Xu, Y. Comprehensive evaluation of latest GPM era IMERG and GSMaP precipitation products over mainland China. Atmos. Res. 2020, 246, 105132. [Google Scholar] [CrossRef]
Figure 1. Locations of the 21 major cities in China and urban boundaries for 2015.
Remotesensing 15 01805 g001
Figure 2. Locations of the 821 urban gauges in China.
Remotesensing 15 01805 g002
Figure 3. Boxplots for the conventional indices: (a) AD (b) CC (c) RB between the rain gauge data and the four SPPs at 821 urban gauges.
Remotesensing 15 01805 g003
Figure 4. Boxplots for the extreme precipitation indices: (a) ATP, (b) CWD, (c) RX1day, (d) RX5day, (e) R99, and (f) R99TOT for the rain gauge data and the four SPPs data at 821 urban gauges.
Remotesensing 15 01805 g004
Figure 5. The absolute deviation between R99 values of SPPs data and rain gauges in 21 major cities:(a) IMERG, (b) GSMaP_Gauge, (c) MSWEP, and (d) CMFD.
Remotesensing 15 01805 g005
Figure 6. The correlation coefficient between R99 values of SPPs data and rain gauges in 21 major cities:(a) IMERG, (b) GSMaP_Gauge, (c) MSWEP, and (d) CMFD.
Remotesensing 15 01805 g006
Figure 7. The relative bias between R99 values of SPPs data and rain gauges in 21 major cities:(a) IMERG, (b) GSMaP_Gauge, (c) MSWEP, and (d) CMFD.
Remotesensing 15 01805 g007
Figure 8. The absolute deviation between R99TOT values of SPPs data and rain gauges in 21 major cities: (a) IMERG, (b) GSMaP_Gauge, (c) MSWEP, and (d) CMFD.
Remotesensing 15 01805 g008aRemotesensing 15 01805 g008b
Figure 9. The correlation coefficient between R99TOT values of SPPs data and rain gauges in 21 major cities: (a) IMERG, (b) GSMaP_Gauge, (c) MSWEP, and (d) CMFD.
Remotesensing 15 01805 g009aRemotesensing 15 01805 g009b
Figure 10. The relative bias between R99TOT values of SPPs data and rain gauges in 21 major cities: (a) IMERG, (b) GSMaP_Gauge, (c) MSWEP, and (d) CMFD.
Remotesensing 15 01805 g010aRemotesensing 15 01805 g010b
Figure 11. The LISA cluster maps of R99 between the gauge observations and SPPs with the highest BMI in four cities: (a) Beijing, (b) Chongqing, (c) Chengdu, and (d) Shanghai.
Remotesensing 15 01805 g011
Figure 12. The LISA cluster maps of R99TOT between the gauge observations and SPPs with the highest BMI in four cities: (a) Beijing, (b) Chongqing, (c) Chengdu, and (d) Shanghai.
Remotesensing 15 01805 g012
Table 1. Detailed information on precipitation indices.
IndexDefinitionUnits
ATPAnnual total precipitationmm
CWDMaximum number of consecutive wet daysdays
R1XdayMaximum daily precipitation amount of the yearmm
R5XdayPrecipitation of the wettest consecutive five days of the yearmm
R99The 95th percentile of daily precipitation on wet daysmm
R99TOTTotal precipitation when daily precipitation exceeded R99mm
Table 2. The conventional indices of the SPPs in urban area of China.
IndexIMERGGSMaP_GaugeMSWEPCMFD
AD (mm)2.122.281.611.73
CC0.720.620.790.77
RB9.0%2.3%−8.5%3.2%
Table 3. The extreme precipitation indices of the SPPs data in urban area of China.
SPPATPCWDR1XdayR5XdayR99R99TOT
Gauge941.3883.6137.368.399.7
IMERG1002.81275.9128.557.4106.2
GSMaP_Gauge897.7974.2125.560.084.5
MSWEP857.41163.4113.051.876.9
CMFD961.41767.6123.348.2106.5
Table 4. The difference of R99 between the SPPs data and gauge observations in 21 major cities.
CityIMERGGSMaP_GaugeMSWEPCMFD
ADCCRBADCCRBADCCRBADCCRB
Beijing28.70.22−39%29.10.66−40%24.00.72−33%30.00.54−41%
Shanghai13.30.18−17%9.60.37−12%27.70.87−35%20.30.14−26%
Guangzhou8.60.43−6%8.00.887%28.6−0.20−27%24.60.87−23%
Shenzhen15.8−13%16.213%25.4−21%29.3−24%
Chengdu5.9−0.21−2%10.90.15−16%10.6−0.10−16%22.00.13−33%
Dalian31.50.92−40%21.8−0.13−27%24.10.72−30%19.20.74−24%
Harbin6.7−0.13−15%5.50.3510%13.20.07−30%12.1−0.35−27%
Chongqing6.20.05−2%5.60.36−1%5.90.20−7%16.70.49−27%
Dongguan17.5−16%12.111%34.6−31%43.3−39%
Foshan17.0−0.99−17%6.20.986%23.61.00−24%32.50.88−33%
Nanjing23.40.61−27%26.30.46−30%27.60.83−32%27.40.17−32%
Hangzhou7.9−0.37−11%1.90.201%16.90.31−24%17.60.35−25%
Jinan19.80.39−25%30.5−0.35−38%23.50.13−29%28.1−0.03−35%
Shenyang16.60.44−25%14.3−0.16−22%21.90.16−34%21.30.07−33%
Kunming5.90.24−9%7.60.31−10%13.4−0.12−25%19.00.23−35%
Qingdao23.10.85−26%28.00.37−32%22.10.41−25%32.90.32−38%
Wuhan23.5−0.22−26%18.20.11−21%17.80.13−20%23.30.52−26%
Xian9.40.52−18%9.50.86−19%10.8−0.80−21%17.30.54−34%
Tianjin28.90.29−36%18.6−0.39−23%20.80.05−26%28.50.06−36%
Changsha4.40.35−6%5.1−0.387%9.80.43−14%16.80.28−23%
Zhengzhou19.30.35−29%18.50.44−28%16.60.76−25%24.20.66−37%
Average15.90.19−19%14.50.24−13%19.90.27−25%24.10.32−31%
Table 5. The difference of R99TOT between the SPPs data and gauge observations in 21 major cities.
CityIMERGGSMaP_GaugeMSWEPCMFD
ADCCRBADCCRBADCCRBADCCRB
Beijing21.40.21−27%28.90.57−37%23.40.69−30%18.50.37−23%
Shanghai60.50.3257%8.00.674%21.30.47−19%44.3−0.3442%
Guangzhou49.3−0.5426%28.0−0.29−12%43.80.58−24%24.80.4312%
Shenzhen22.0-14%0.8-1%19.5-−12%87.1-54%
Chengdu22.60.16−5%34.80.70−27%22.40.89−18%15.80.839%
Dalian14.8−0.436%21.00.18−25%23.20.87−27%10.50.27−3%
Harbin28.40.2455%5.60.328%10.80.07−21%13.60.5026%
Chongqing16.50.5710%15.80.156%27.00.48−20%18.0−0.052%
Dongguan59.0-38%3.6-2%16.5-−11%53.9-35%
Foshan72.8−0.2644%7.60.765%28.80.90−17%6.40.792%
Nanjing46.30.7842%28.0−0.15−26%24.80.24−23%44.90.2041%
Hangzhou29.7−0.6124%14.0−0.87−1%26.9−0.59−21%16.7−0.6310%
Jinan7.2−0.10−7%27.6−0.62−32%23.00.26−27%13.6−0.16−1%
Shenyang7.90.63−5%18.8−0.28−25%25.70.38−34%7.20.093%
Kunming15.6−0.821%15.5−0.22−5%13.2−0.19−11%25.30.0234%
Qingdao7.80.92−8%29.00.27−30%23.20.48−24%12.1−0.22−2%
Wuhan53.6−0.3048%24.3−0.19−22%10.00.54−9%54.6−0.1049%
Xian9.60.8317%4.00.704%7.90.19−13%10.70.8418%
Tianjin11.7−0.34−10%15.2−0.47−18%19.7−0.03−24%15.60.28−19%
Changsha25.6−0.6219%14.60.67−11%28.7−0.60−21%6.4−0.382%
Zhengzhou8.00.514%17.30.28−24%11.70.55−15%11.00.1612%
Average28.10.0516%17.30.10−13%21.50.29−20%24.30.1414%
Table 6. BMI of R99 and R99TOT in four cities.
IndexCitiesIMERGGSMaP_GaugeMSWEPCMFD
BMIp-ValuesBMIp-ValuesBMIp-ValuesBMIp-Values
R99Beijing0.030.280.320.0060.330.0030.180.02
Chongqing−0.060.170.210.0070.130.030.330.001
Chengdu0.090.23−0.120.13−0.110.100.100.13
Shanghai−0.070.290.160.020.260.0020.080.14
R99TOTBeijing0.080.140.290.0050.320.0030.140.04
Chongqing0.250.006−0.090.090.330.001−0.160.02
Chengdu0.080.150.390.0010.440.0010.400.002
Shanghai0.080.110.100.060.290.0010.210.02
Disclaimer/Publisher’s Note: The statements, opinions and data contained in all publications are solely those of the individual author(s) and contributor(s) and not of MDPI and/or the editor(s). MDPI and/or the editor(s) disclaim responsibility for any injury to people or property resulting from any ideas, methods, instructions or products referred to in the content.

