1. Introduction
Faults activation in volcanic areas is prevalently related to the stress variations generated by magma intrusion and/or injection of pressurized geothermal fluids in the crust during an unrest. These processes produce earthquakes associated with either frictional dislocation along rupture planes (volcano-tectonic events) or rock fracture characterized by significant volumetric source components (long-period and hybrid), which usually occur as low magnitude swarms at depths from a few to tens of kilometers below the volcano [
1,
2]. The occurrence of these events can be a potential precursor of volcanic eruptions [
1,
3,
4].
At the same time, faults’ dislocation can occur in response to several other volcano-tectonic processes, such as volcano spreading or sagging, subsidence and regional stress, not necessarily related to magma movements. In these circumstances, fault slip might also take place through aseismic processes, which occur by means of near-continuous or long-period movements along segments of faults, or by short-lived, pre- and post-seismic movements [
5,
6,
7,
8,
9]. In addition, heterogeneity of the volcanic structures and the presence of high-temperature–high-pressure geothermal fluids, relative high strain rates, and the occurrence of viscous processes in the deeper part of the volcano can also contribute to generate complex patterns of strain load and release, with possible aseismic creep and differential movements, even along relatively small faults [
10,
11].
In spite of its relatively small dimensions and its recent limited activity, the island of Ischia (Southern Italy) represents an evident case of intricate volcanic structure, where the concurrence of several processes creates the conditions for very complex dynamics, largely debated in the volcano science community. The occurrence of the recent 21 August 2017 earthquake further revived the discussion, with a considerable number of studies published in the past few years, focused on the dynamic processes active on the island and their interpretation (see [
12] and references therein).
The island of Ischia is a resurgent caldera that experienced an unusual, very large uplift of about 900 m of the caldera floor in its central sector. The uplift, started between 56 ka and 33 ka and going on up to about 5 ka [
13,
14], formed the central block of Mt. Epomeo (
Figure 1). The resurgence was caused by the intrusion of either sill-like magma body or a laccolith located at shallow depth, between 2 km and 3 km [
15,
16]. The present long-term dynamics of the island display generalized subsidence, characterized by an increasing rate with altitude, indicating a possible gravitative control on the process (e.g., [
17,
18]). However, data from levelling surveys [
17] and outcomes deriving from Synthetic Aperture Radar Interferometry (InSAR) methods [
19] are evidence of a significantly larger subsidence rate in the zone of Fango, in the northwestern sector of the island, in an area overlapping the landslide induced by the 1883 earthquake [
13]. The different subduction rate observed at Fango is commonly considered to be associated with surface processes and is interpreted as being due to active sliding phenomena on the surface [
19,
20].
Present signs of volcanic activity at the surface at Ischia are diffuse degassing and thermal waters’ emissions, in association with high geothermal gradients, in excess of 150 °C km
−1 [
21,
22]. In the Casamicciola Terme area, which is the most seismically active area on the island, hot fluids’ emissions are also recognized in the Mt. Cito site, and thermal springs discharge at Bagni, a few kilometers apart eastward (see orange and blue points in the inset of
Figure 1).
During the phase of volcanic quiescence and island subsidence (last eruption occurred in 1302 CE), recurrent damaging earthquakes have occurred in historical and recent times, even resulting in thousands of victims in a single event (
Figure 1 and
Supplementary Table S1) [
14,
15,
16,
17,
18,
19,
20,
21,
22,
23,
24,
25]. The most devastating seismic event struck the northern sector of the island in 1883, resulting in more than 2300 victims and the whole destruction of the town of Casamicciola Terme [
24,
26]. The high damage level of these events, in spite of their inferred relatively low magnitude, has been mainly ascribed to the shallowness of the seismogenic source, estimated in the upper 1–2 km of depth [
24,
25,
27]. The recent 2017 event, which also resulted in victims and damage, occurred after 134 years of almost complete seismic silence and represents the first significant earthquake recorded instrumentally at Ischia.
Figure 1.
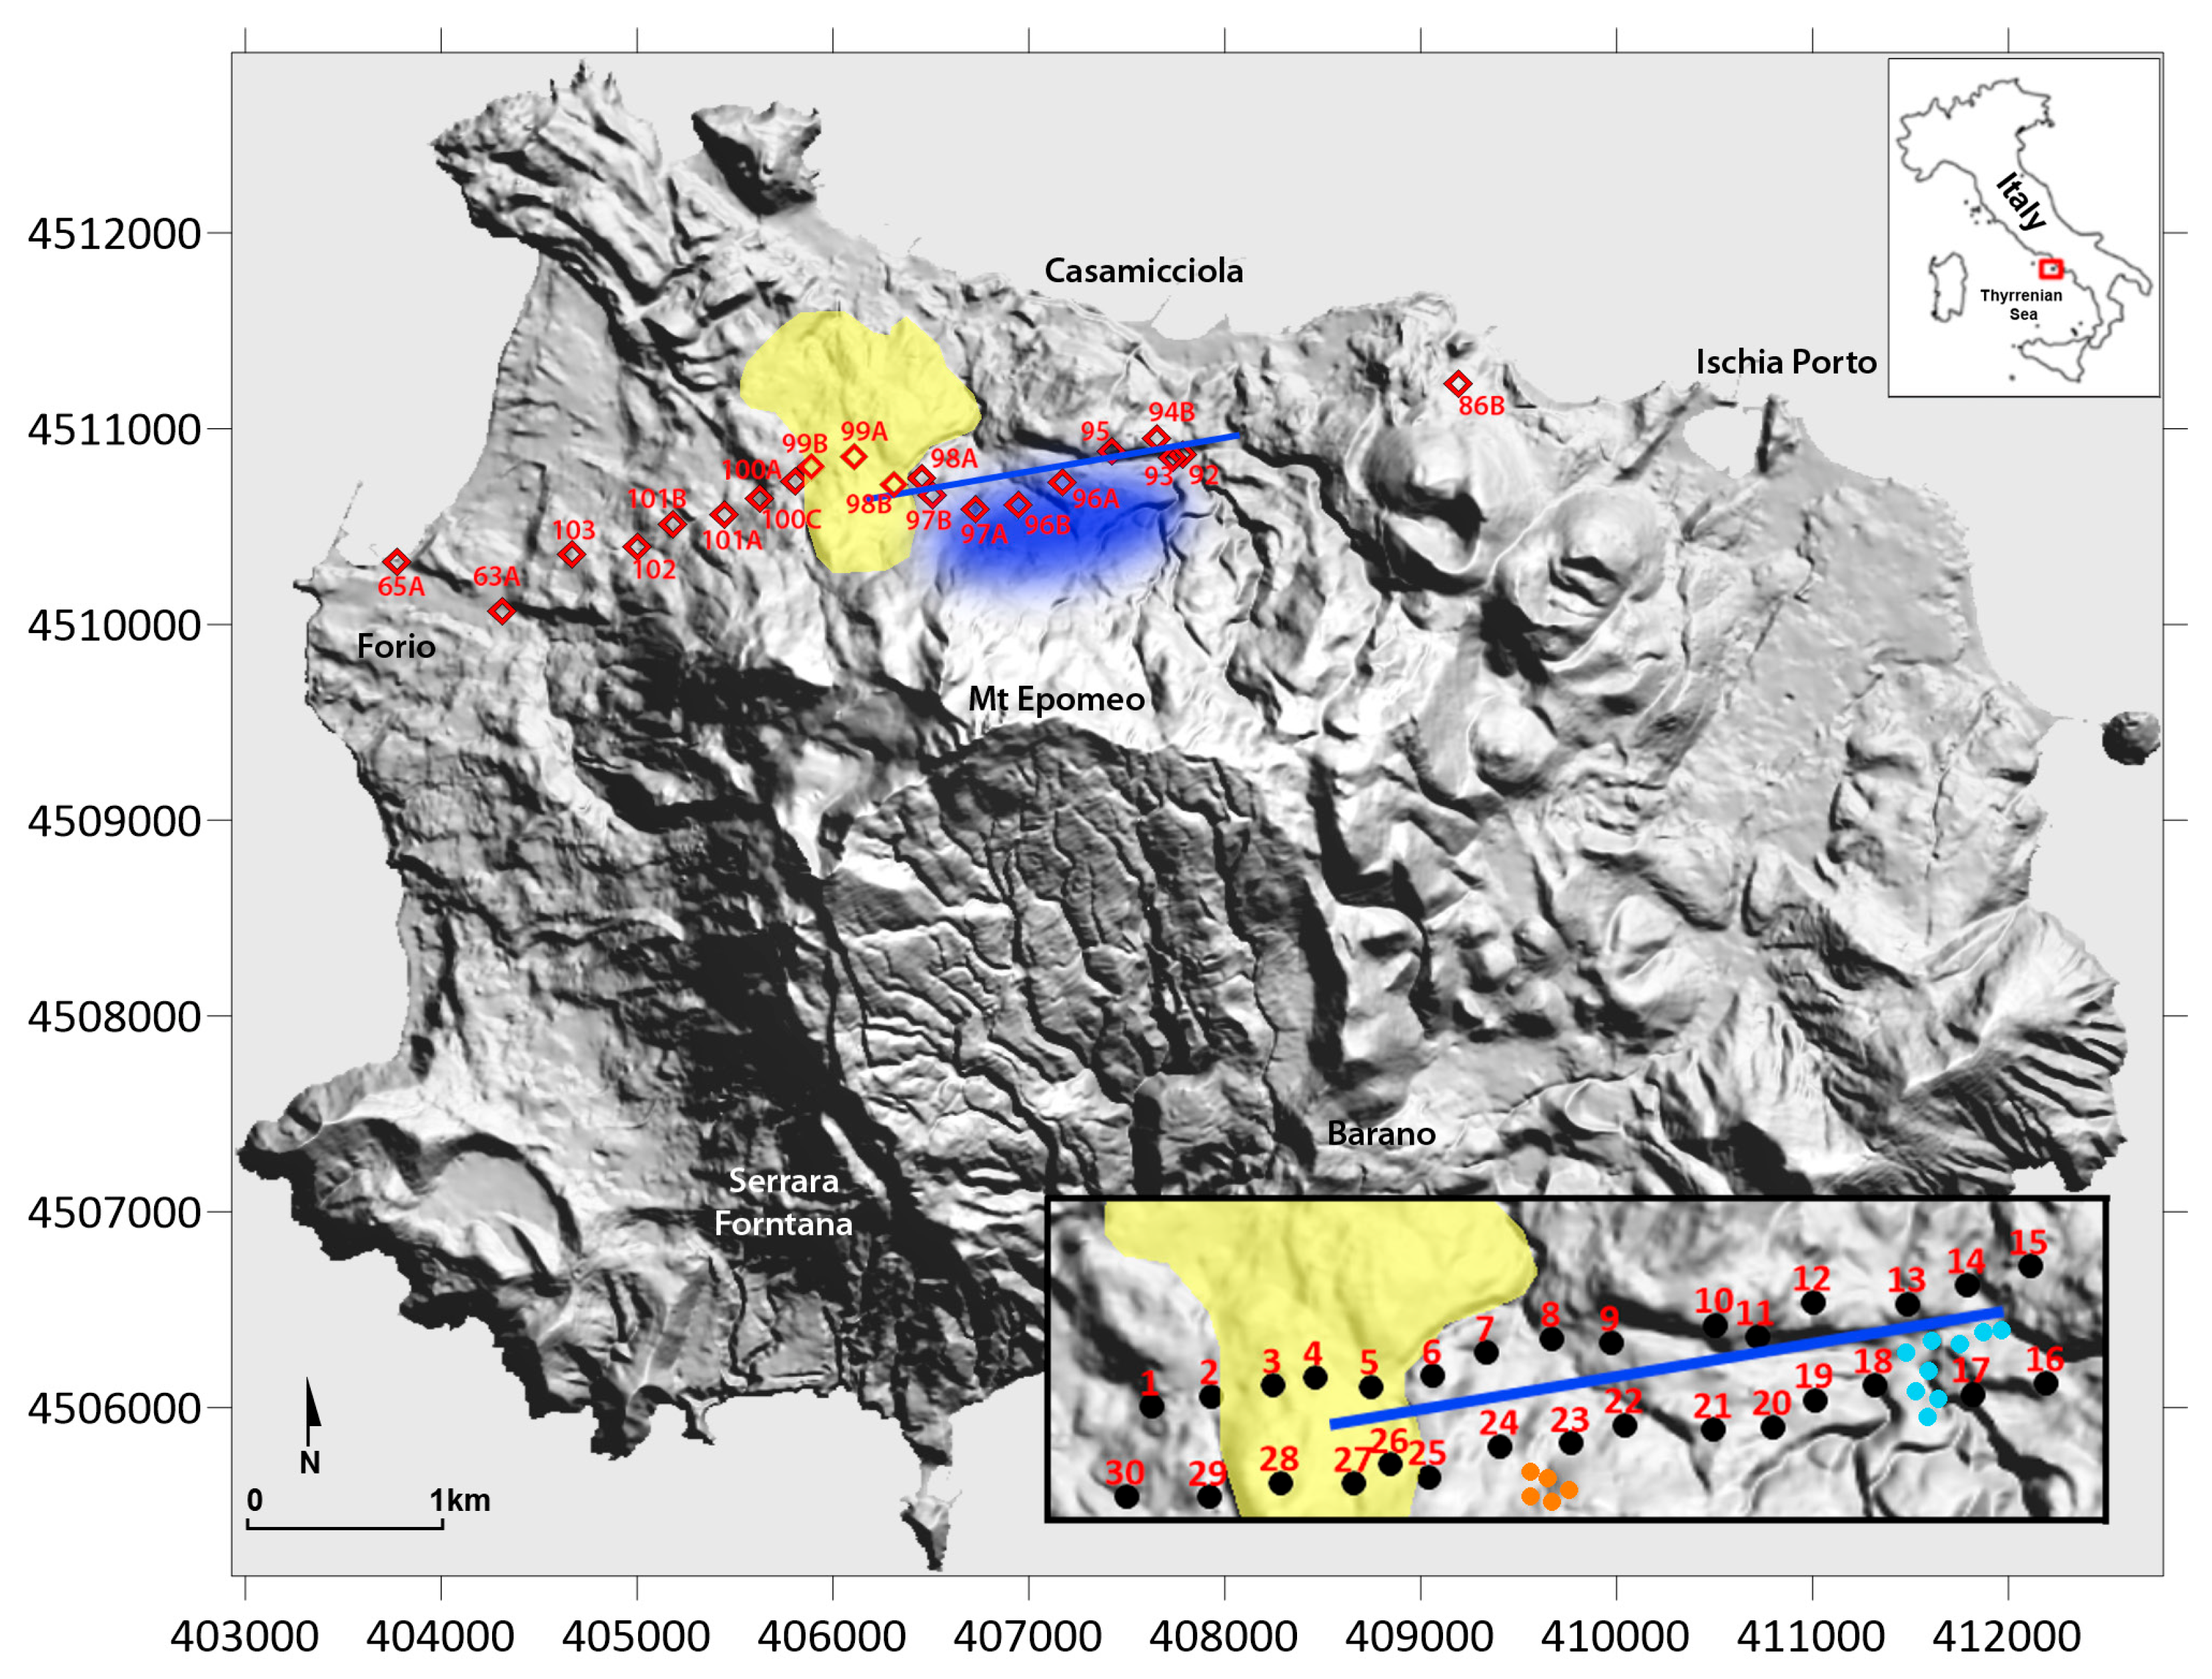
Digital Terrain Model (source INGV Laboratorio Geomatica) of Ischia Island with indication of: (i) surface fault trace [adapted with permission from [
25] (blue line); (ii) levelling benchmarks (red diamonds); (iii) area covered by the 1883 Casamicciola landslide (yellow area); area of maximum coseismic displacement (subsidence) for the 2017 earthquake inferred from DInSAR data [
25] (blue area). Inset: couples of points (15; 1 to 30 black points), located along the two sides of the fault, facing each other at distance of ~250 m, for which is calculated the differential vertical displacement for the period January 2015–December 2019. In the inset, fumaroles of Mt. Cito (orange points) and hot thermal springs of Bagni area (blue points) are also shown.
Figure 1.
Digital Terrain Model (source INGV Laboratorio Geomatica) of Ischia Island with indication of: (i) surface fault trace [adapted with permission from [
25] (blue line); (ii) levelling benchmarks (red diamonds); (iii) area covered by the 1883 Casamicciola landslide (yellow area); area of maximum coseismic displacement (subsidence) for the 2017 earthquake inferred from DInSAR data [
25] (blue area). Inset: couples of points (15; 1 to 30 black points), located along the two sides of the fault, facing each other at distance of ~250 m, for which is calculated the differential vertical displacement for the period January 2015–December 2019. In the inset, fumaroles of Mt. Cito (orange points) and hot thermal springs of Bagni area (blue points) are also shown.
The location and the geometry of the fault responsible for the 2017 earthquake, the Casamicciola fault (CSf), has been studied by various authors leading to different scenarios [
25,
28,
29,
30,
31,
32,
33]. A well-constrained fault model was proposed by De Novellis et al. (2018) [
25] using a joint analysis of the coseismic geophysical data. In particular, the InSAR and GPS measurements, along with the seismic recording at the close IOCA accelerometer, allowed the definition of a robust model for the fault plane, with dislocation distributed over a ~2.0 × 1.0 (length × width) km
2, almost-pure normal fault (dip 70° ± 7°), oriented N 86°, and reaching the maximum of ~15 cm at a depth of 0.8 km. This result is also supported by the ground-levelling data, which detected surface dislocation of 3.6 cm at the intersection between the levelling line and the western end of the predicted fault trace [
12,
34]. Trasatti et al. (2019) [
32] presented a similar fault model to explain the long-term deflation of the island deduced from ground-levelling data, but those authors also proposed a secondary fault, located NW of the main one, to account for local subsidence detected at a single benchmark and an almost co-located GPS site located in this area.
Although alternative solutions for the source of the 2017 earthquake (e.g., [
29,
31,
33]) propose significantly different rupture models—characterized by a northward dipping normal fault or even by a composite source including considerable non-double couple contributions—the fault model proposed by De Novellis et al. (2018) [
25] represents the most complete investigation of the 2017 event, considering all the available quantitative data and accounting for all the observations. By analyzing the felt reports of the major historical earthquakes at Ischia, Carlino et al. (2021) [
24] demonstrated that this fault is coincident with the source of the destructive 1881 and 1883 earthquakes and is also very likely related to Ischia’s previous large historical events, e.g., 1769 and 1828 [
27].
As for the recent surface dynamics, Beccaro et al. (2021) [
35] analyzed long-term (2002 to 2019) ground displacements, through multi-temporal and multi-sensor InSAR methods, and detected post-seismic effects related to the 2017 earthquake. Those authors highlighted subsidence acceleration immediately following the 2017 earthquake and lasting about 6 months, a few hundred meters southwest of the major surface coseismic displacement, in the area interested by the large Fango landslide.
The elements discussed above highlight the complex volcano-tectonic structural framework in which the CSf acts and the close link between the dynamic of this fault and the subsidence of the island. Understanding the long-term strain load and release on the CSf in response to the subsidence of the Mt. Epomeo block is crucial for the assessment of the hazard in this high exposure area and would also provide essential elements to understand the fault dynamic in subsiding calderas. Thus, to assess a possible mechanism leading to the activation of the Ischia main seismogenic fault (CSf) and its cyclic nature, we investigated the details of the possible surface expression of the 2017 causative fault and its behavior across the pre-, co- and post-seismic cycle. To this aim, we performed a joined analysis of the ground vertical movements around and on the CSf, by considering vertical displacement data from InSAR images (2015–2019) and ground-levelling surveys (1987–2010), and attempted the interpretation of the occurrence of the major historical earthquakes in light of the results.
2. InSAR Data Processing and Analysis
We gathered the available Synthetic Aperture Radar (SAR) data, which are commonly acquired at high density in space and short revisit time with respect to the ground-levelling surveys and are well appropriate to construct images of the surface deformation over a considerably long time period. Specifically, displacement time series and relative mean velocity maps over the Ischia island were obtained through the interferometric processing of Level-1 Single Look Complex SAR data acquired with the Interferometric Wide swath mode during Sentinel-1 satellite mission. Sentinel-1 data, distributed by the European Space Agency, were downloaded from the Copernicus Open Access Hub (
https://scihub.copernicus.eu (accessed on 24 March 2023)) and the elaborations were performed with the SARscape software (sarmap SA) operative on the ENVI platform (
https://www.l3harrisgeospatial.com (accessed on 24 March 2023)).
Two stacks of Sentinel-1A data (C-band), acquired along both descending and ascending tracks, were analyzed through the Small Baseline Subset (SBAS) [
36,
37,
38] InSAR multi-temporal method during the January 2015–December 2019 period. The adopted technique combines a large number of SAR differential interferograms characterized by short temporal and spatial baselines to minimize decorrelation effects and maximize the spatial coverage of the results. The first processing was carried out using 143 input images acquired in descending orbit along track
n° 22 during the 11 January 2015–28 December 2019 time span, while the second processing was performed with 147 data acquired in ascending orbit (track
n° 44) during the 12 January 2015–29 December 2019 period. The interferograms’ generation was computed by setting the spatial baseline not exceeding 216 meters to reduce spatial decorrelation and the maximum temporal baseline equal to 36 days in order to limit the effects of temporal decorrelation. Graphs showing the interferograms’ network computed for both descending and ascending processing are visible in
Supplementary Figure S1. In both processing, a multilooking operation was applied equal to 3 and 1 for the range and azimuth direction, respectively, obtaining a final ground resolution of 15 meters. The 30 meter Shuttle Radar Topography Mission (SRTM) Digital Elevation Model (DEM) was used to obtain precise ground deformations, removing the topography contribution from the interferograms generated using the aforementioned spatio-temporal constraints. The filtering approach is an extension of the Goldstein method [
39] and was applied to remove the interferometric noise, enhancing the interferometric fringes. The Delaunay MCF unwrapping method [
40] was used and the inversion of the interferometric phase was carried out using the Singular Value Decomposition algorithm. Points with a coherence threshold below 0.2 were not considered in the final results. The atmosphere phase contribution was estimated and removed, applying a double filtering in space and time, to properly reconstruct the surface movement at each considered date.
The availability of both Sentinel-1 ascending and descending acquisition geometries allowed the calculation also of the horizontal (East–West) and vertical components of the displacement [
41] during the processing common time period, from 12 January 2015 to 28 December 2019. For the purposes of this work, only the vertical displacement time series obtained from the InSAR processing was considered, and the following paragraph illustrates the detailed analysis performed in this contribution starting from these results.
Additional details regarding the InSAR elaborations, together with mean ground velocity maps and InSAR results’ validation (i.e., the comparisons between SAR and GPS displacement rates) can be consulted in [
35]. All of the produced datasets are located in a data repository managed by INGV and can be freely accessed via the following Digital Object Identifier:
https://doi.org/10.13127/insar/ts (accessed on 24 March 2023) [
42].
We firstly selected 36 sparse points, located along 6 profiles perpendicular to a 2 km long line corresponding to the theoretical fault trace predicted by the model of De Novellis et al. (2018) (
Supplementary Figures S2 and S3). Due to specific technical limitations of the SAR data, the choice of the points was strongly dependent on the presence of objects characterized through time by high stability with respect to the terrain. For each profile, we computed the difference between the vertical displacement obtained at all the couple of successive locations, throughout the whole available time period, searching for couples displaying a sudden surface break or at least some anomaly around the time of the earthquake. This preliminary analysis revealed that the continuous subsidence with time—consistent with the general deformation of the island—is interrupted by major discontinuities only at couples of points located respectively on the two sides of the theoretical fault trace.
Thus, aiming to define the details of the surface fault rupture and its lateral extension, we increased the sampling close to the theoretical fault trace by computing the difference between the vertical displacement at 15 couples of points, facing each other at a distance of ~250 m on the two sides of the line, with lateral spacing of ~150 m between the couples (
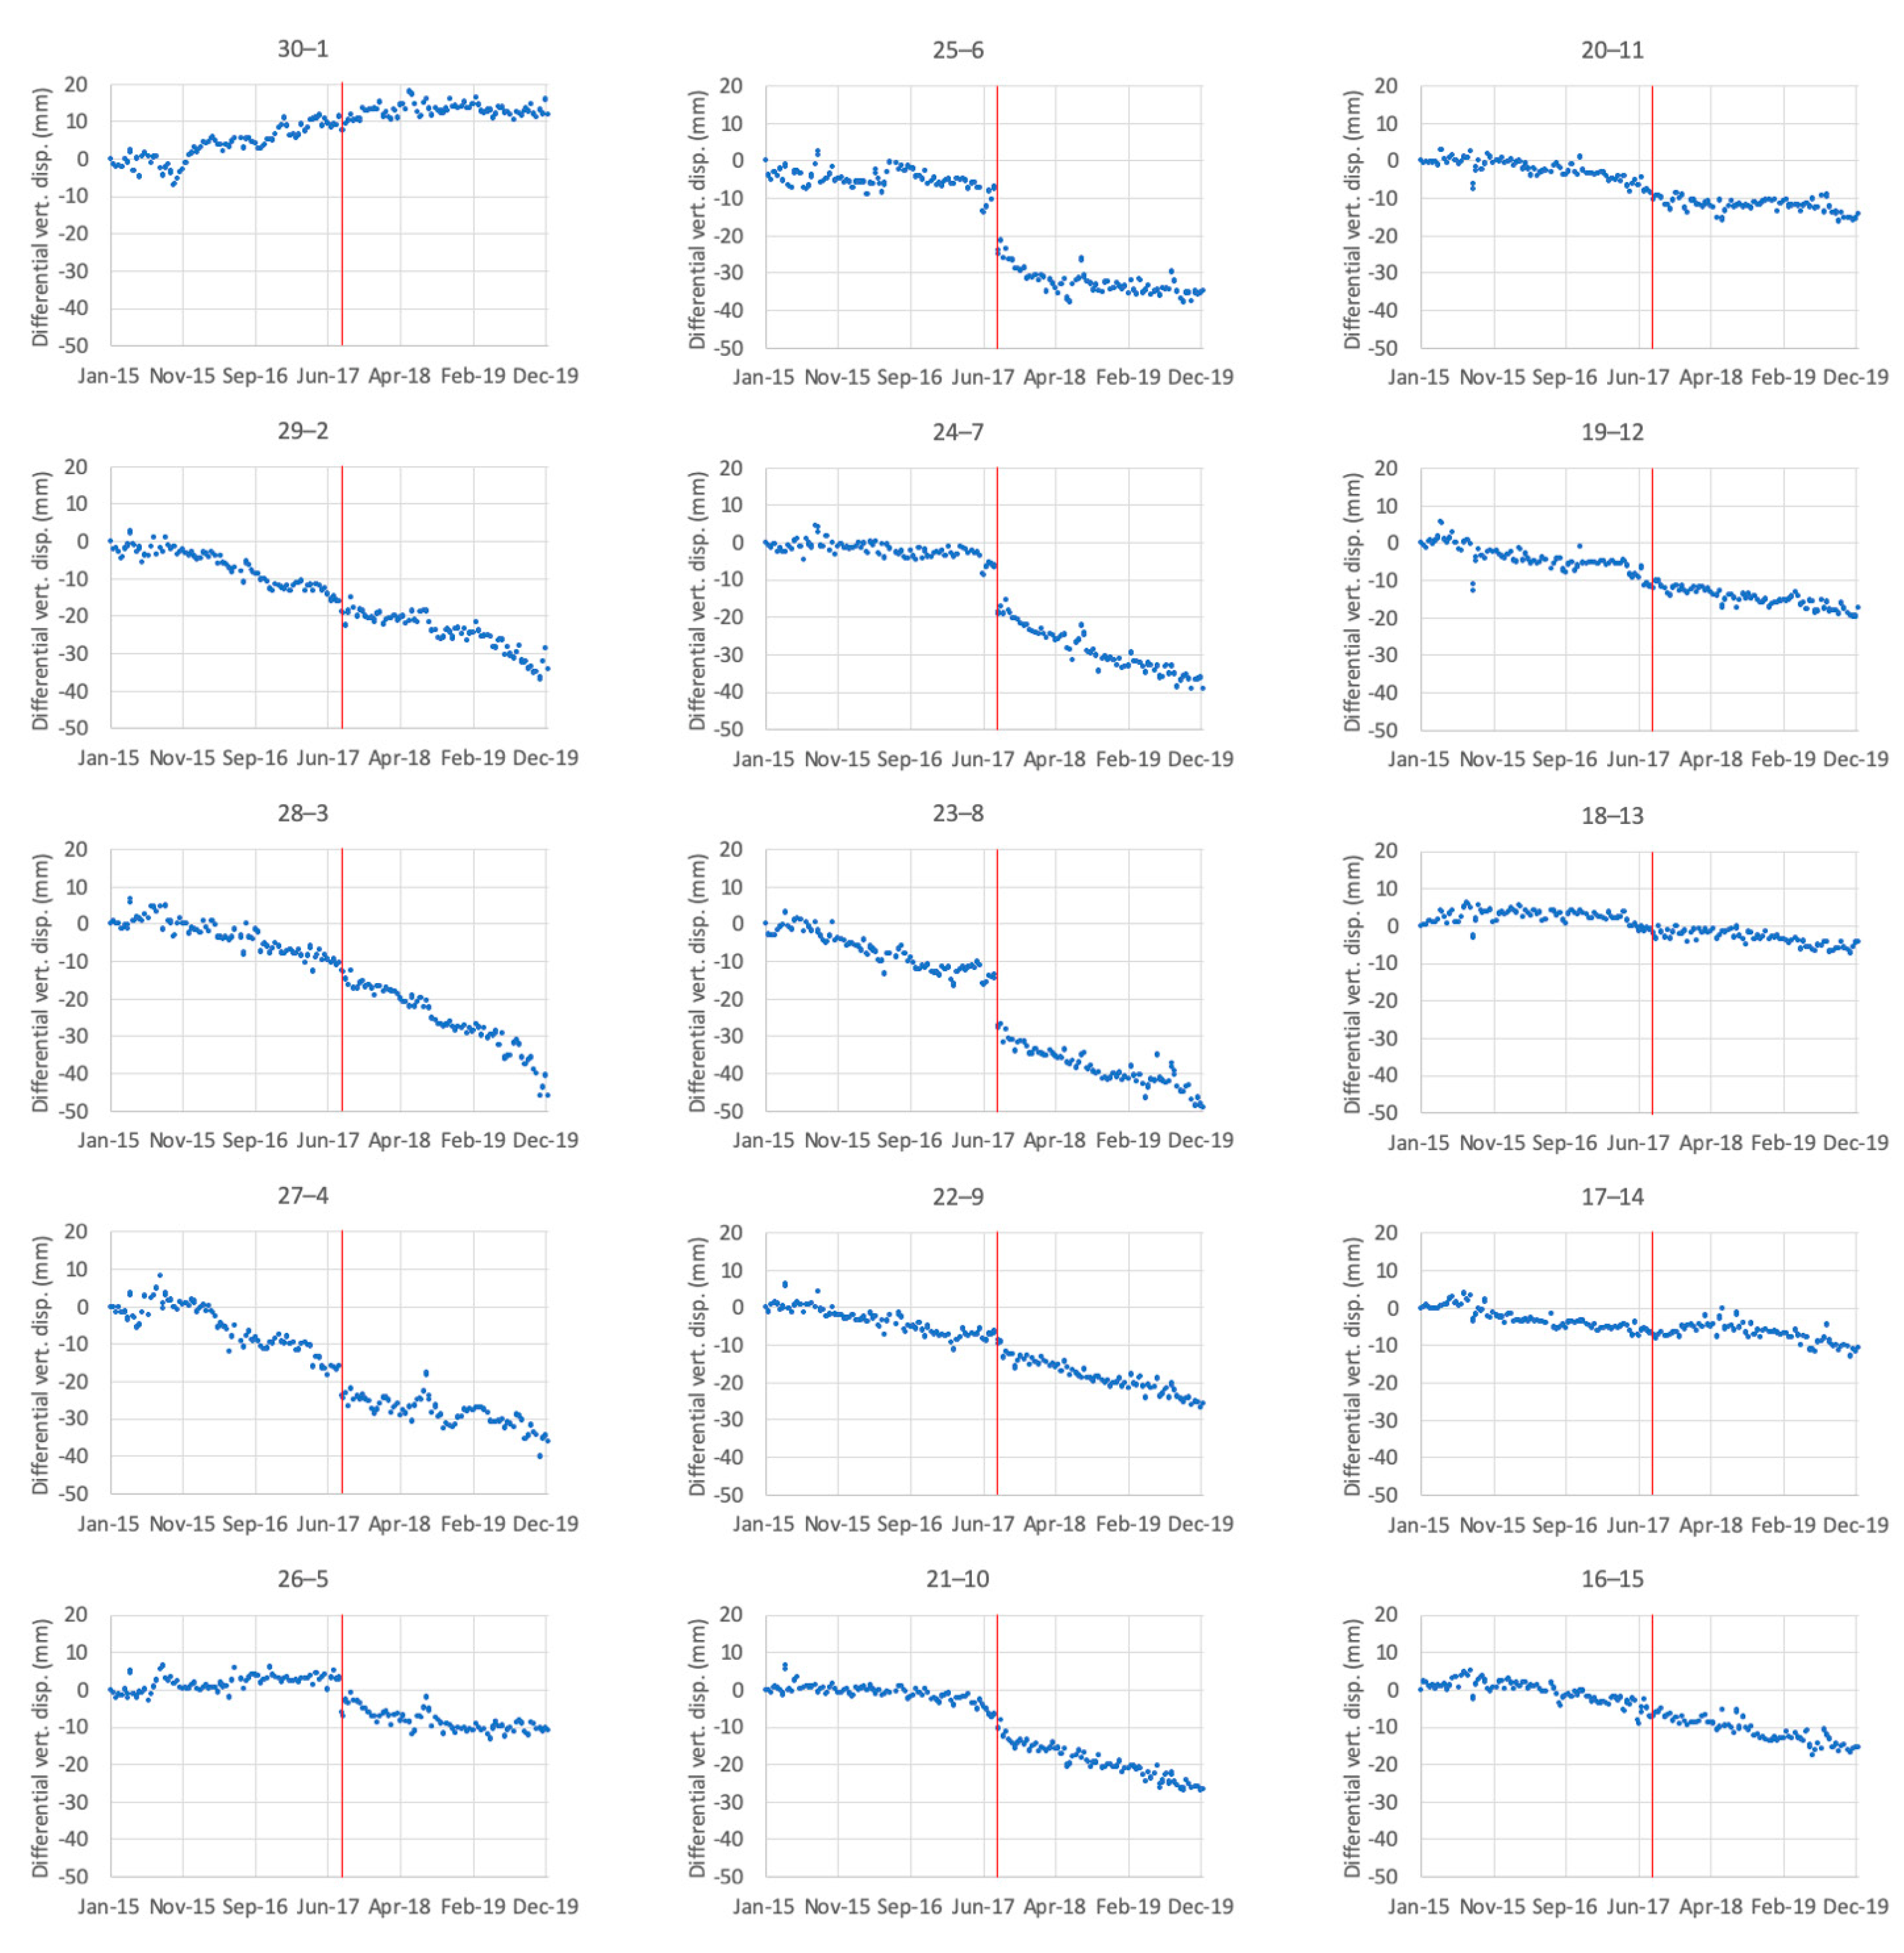
Figure 1). The differential vertical displacements demonstrating clear discontinuity (26-5, 25-6, 24-7, 23-8, 22-9)—with dislocation of ~1–2 cm—(
Figure 1 and
Figure 2) confirmed the WSW–ENE trend of the rupture, with a dropping of the Mt. Epomeo block, in agreement with the fault model of De Novellis et al. (2019) and consistent with the surface break detected by the levelling survey [
34].
3. Results
The results of the time series analysis definitely prove that source models implying a northward dipping normal fault are inconsistent with the coseismic ground deformation data. In addition to the coseismic break, the time series also display intriguing features that suggest a possible complex dynamic for the fault responsible for the major earthquakes on Ischia. At couples where the surface rupture is well evident, the differences in the vertical displacement exhibit the relative subsidence of the block on the southern side of the fault, lasting about 6 months with exponential decay. This particular behavior of the two sides of a fault is typical of post-seismic relaxation, often observed following crustal earthquakes (e.g., [
43]) and generally ascribed to viscous deformation in the lower crust. Typically, the stress relaxes to 1/e of its original value in a time indicated as viscoelastic relaxation time (τ
vs), equal to 2
η/E, where
η and E are respectively the viscosity and the Young’s modulus of the relaxing ductile layer [
44]. The exponential decay after the 2017 earthquake clearly appears at the couple 25-6 (
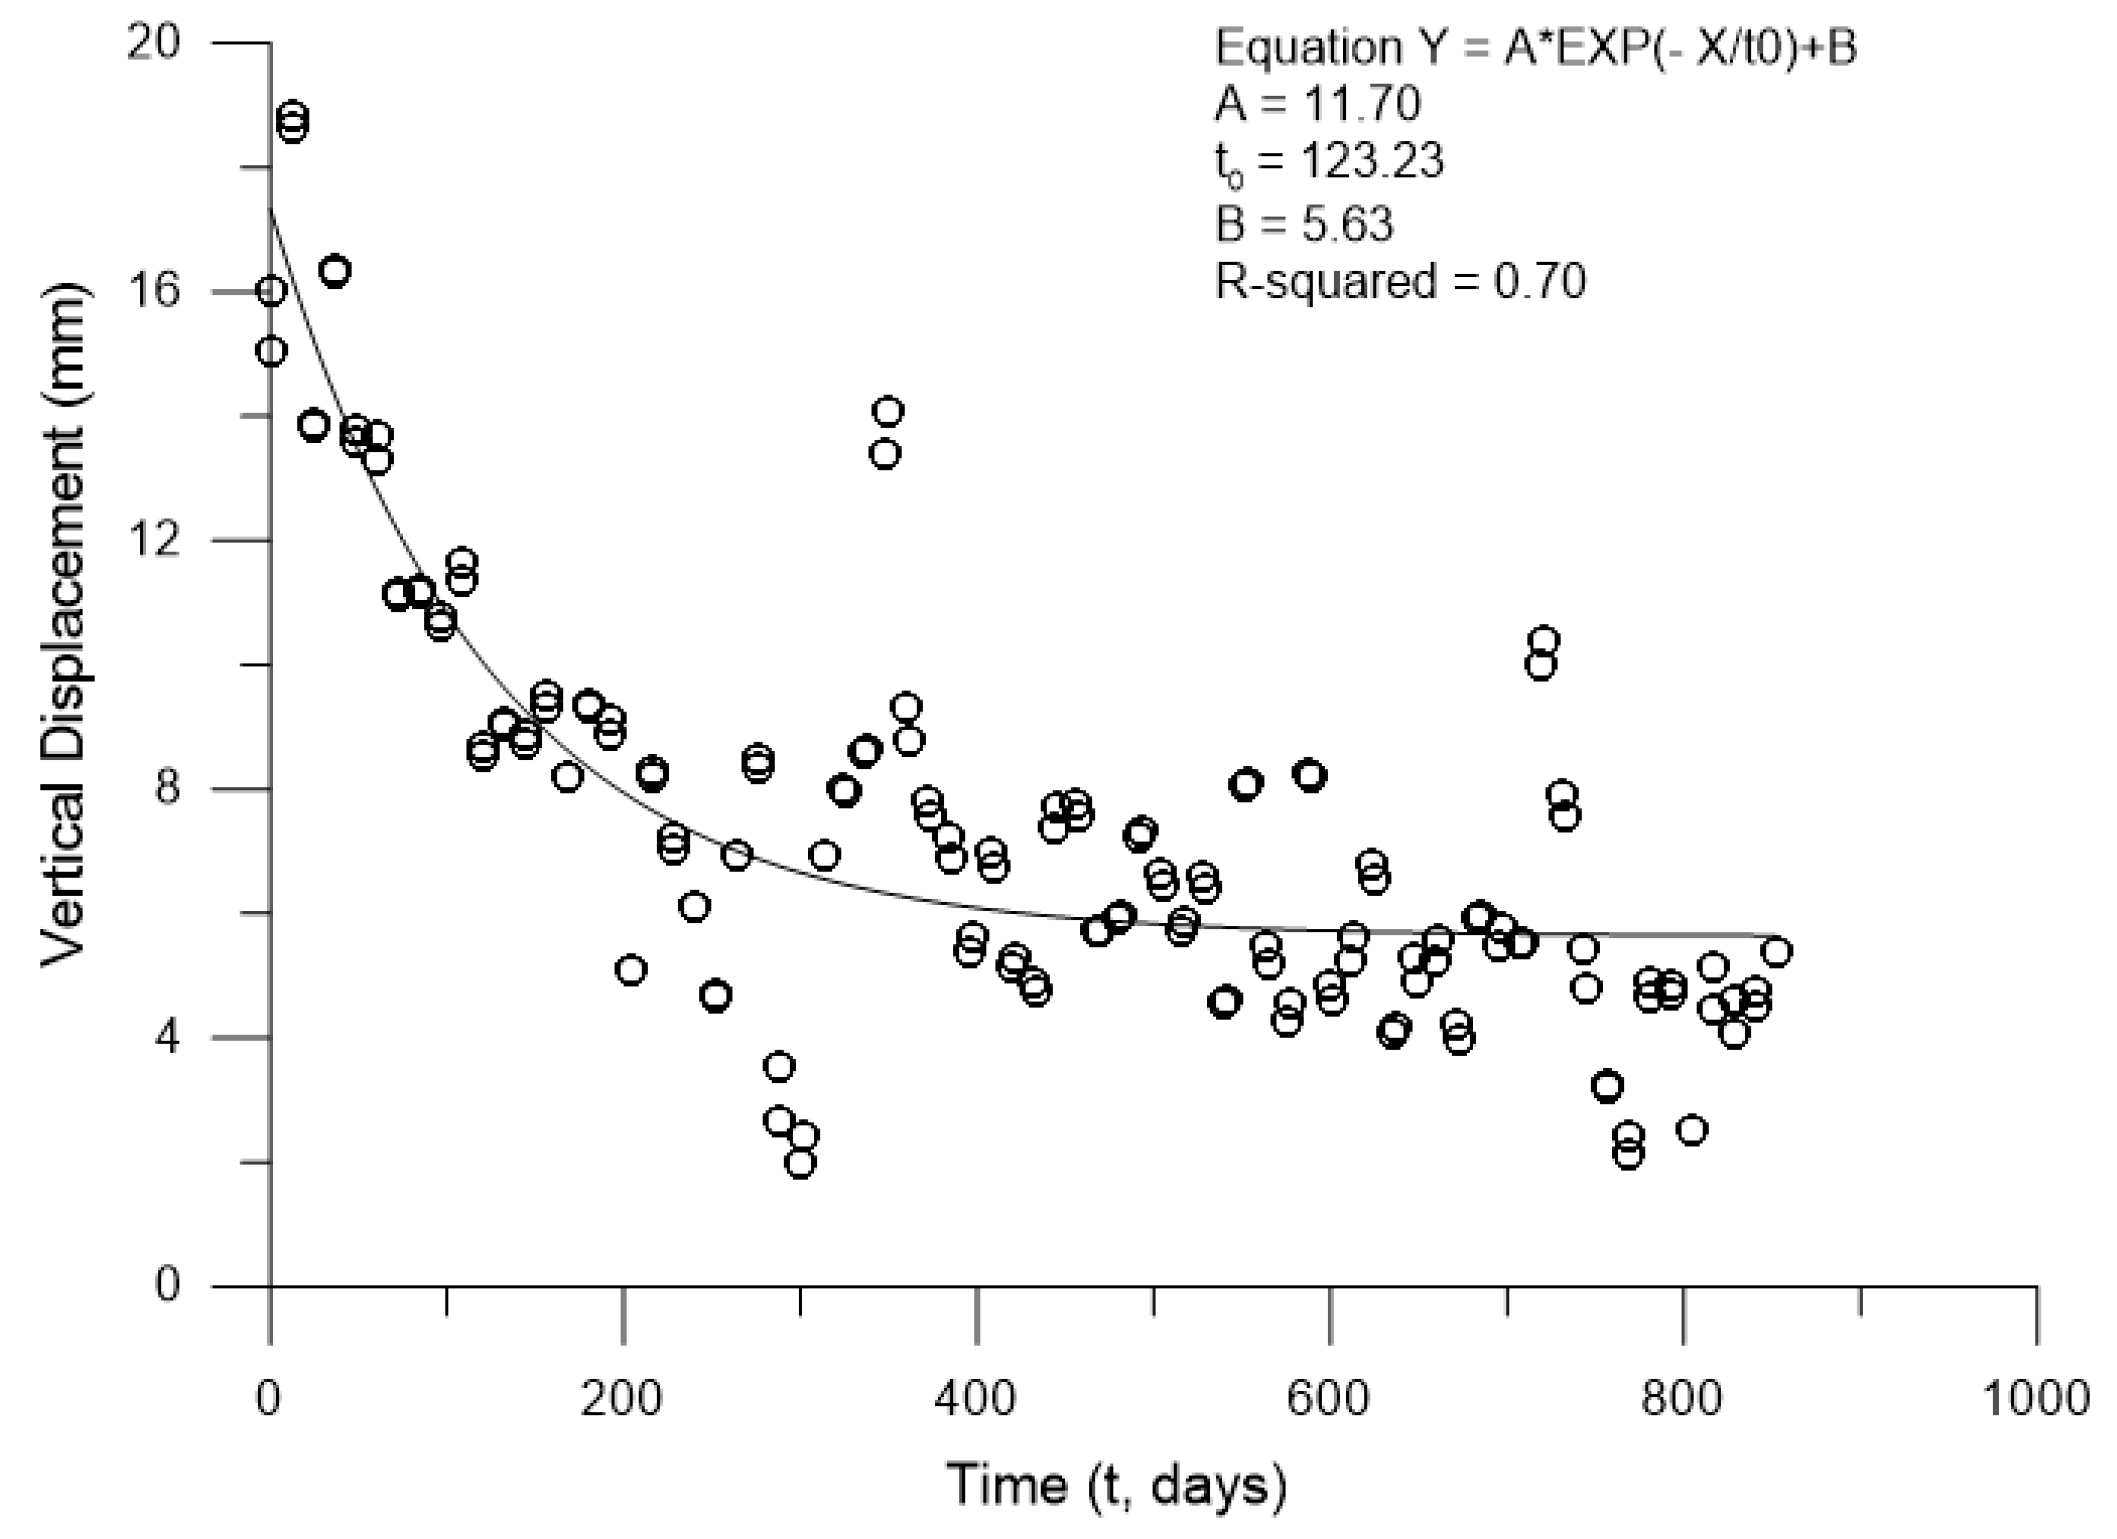
Figure 2). The southern part of the fault subsides (with a relative high rate) of about 1–2 cm during several tens of days following the event. After this time, the deformation rate returns to pre-seismic value. We reproduced the deformation pattern of the post-seismic period at the 25-6 couple with the exponential function e
−t/τvs (where t is the time from the earthquake), obtaining the relaxion time τ
vs = 123 days providing a reasonably good fit, with R
2 = 0.70 (
Figure 3). Considering an appropriate range 1 × 10
10 Pa to 5 × 10
10 Pa for E [
45], we obtained 0.5 × 10
17 ≤
η ≤ 2.7 × 10
17 Pa s, comparable to what was inferred by Castaldo et al. (2017) [
18] from the numerical model of the long-term subsidence of the island.
East of the fault area—where both surface break and post-seismic deformation are revealed by the differential vertical displacement—some of the time series (20-11, 19-12, 18-13) individuate a section where relative subsidence of the southern block occurred during the 3 months preceding the earthquake, with a faster rate than the general trend, while no post-seismic subsidence was detected (
Figure 2). The short sector (21-10) enclosed between these two fault segments exhibited both pre-seismic and post-seismic deformation, but no coseismic surface break.
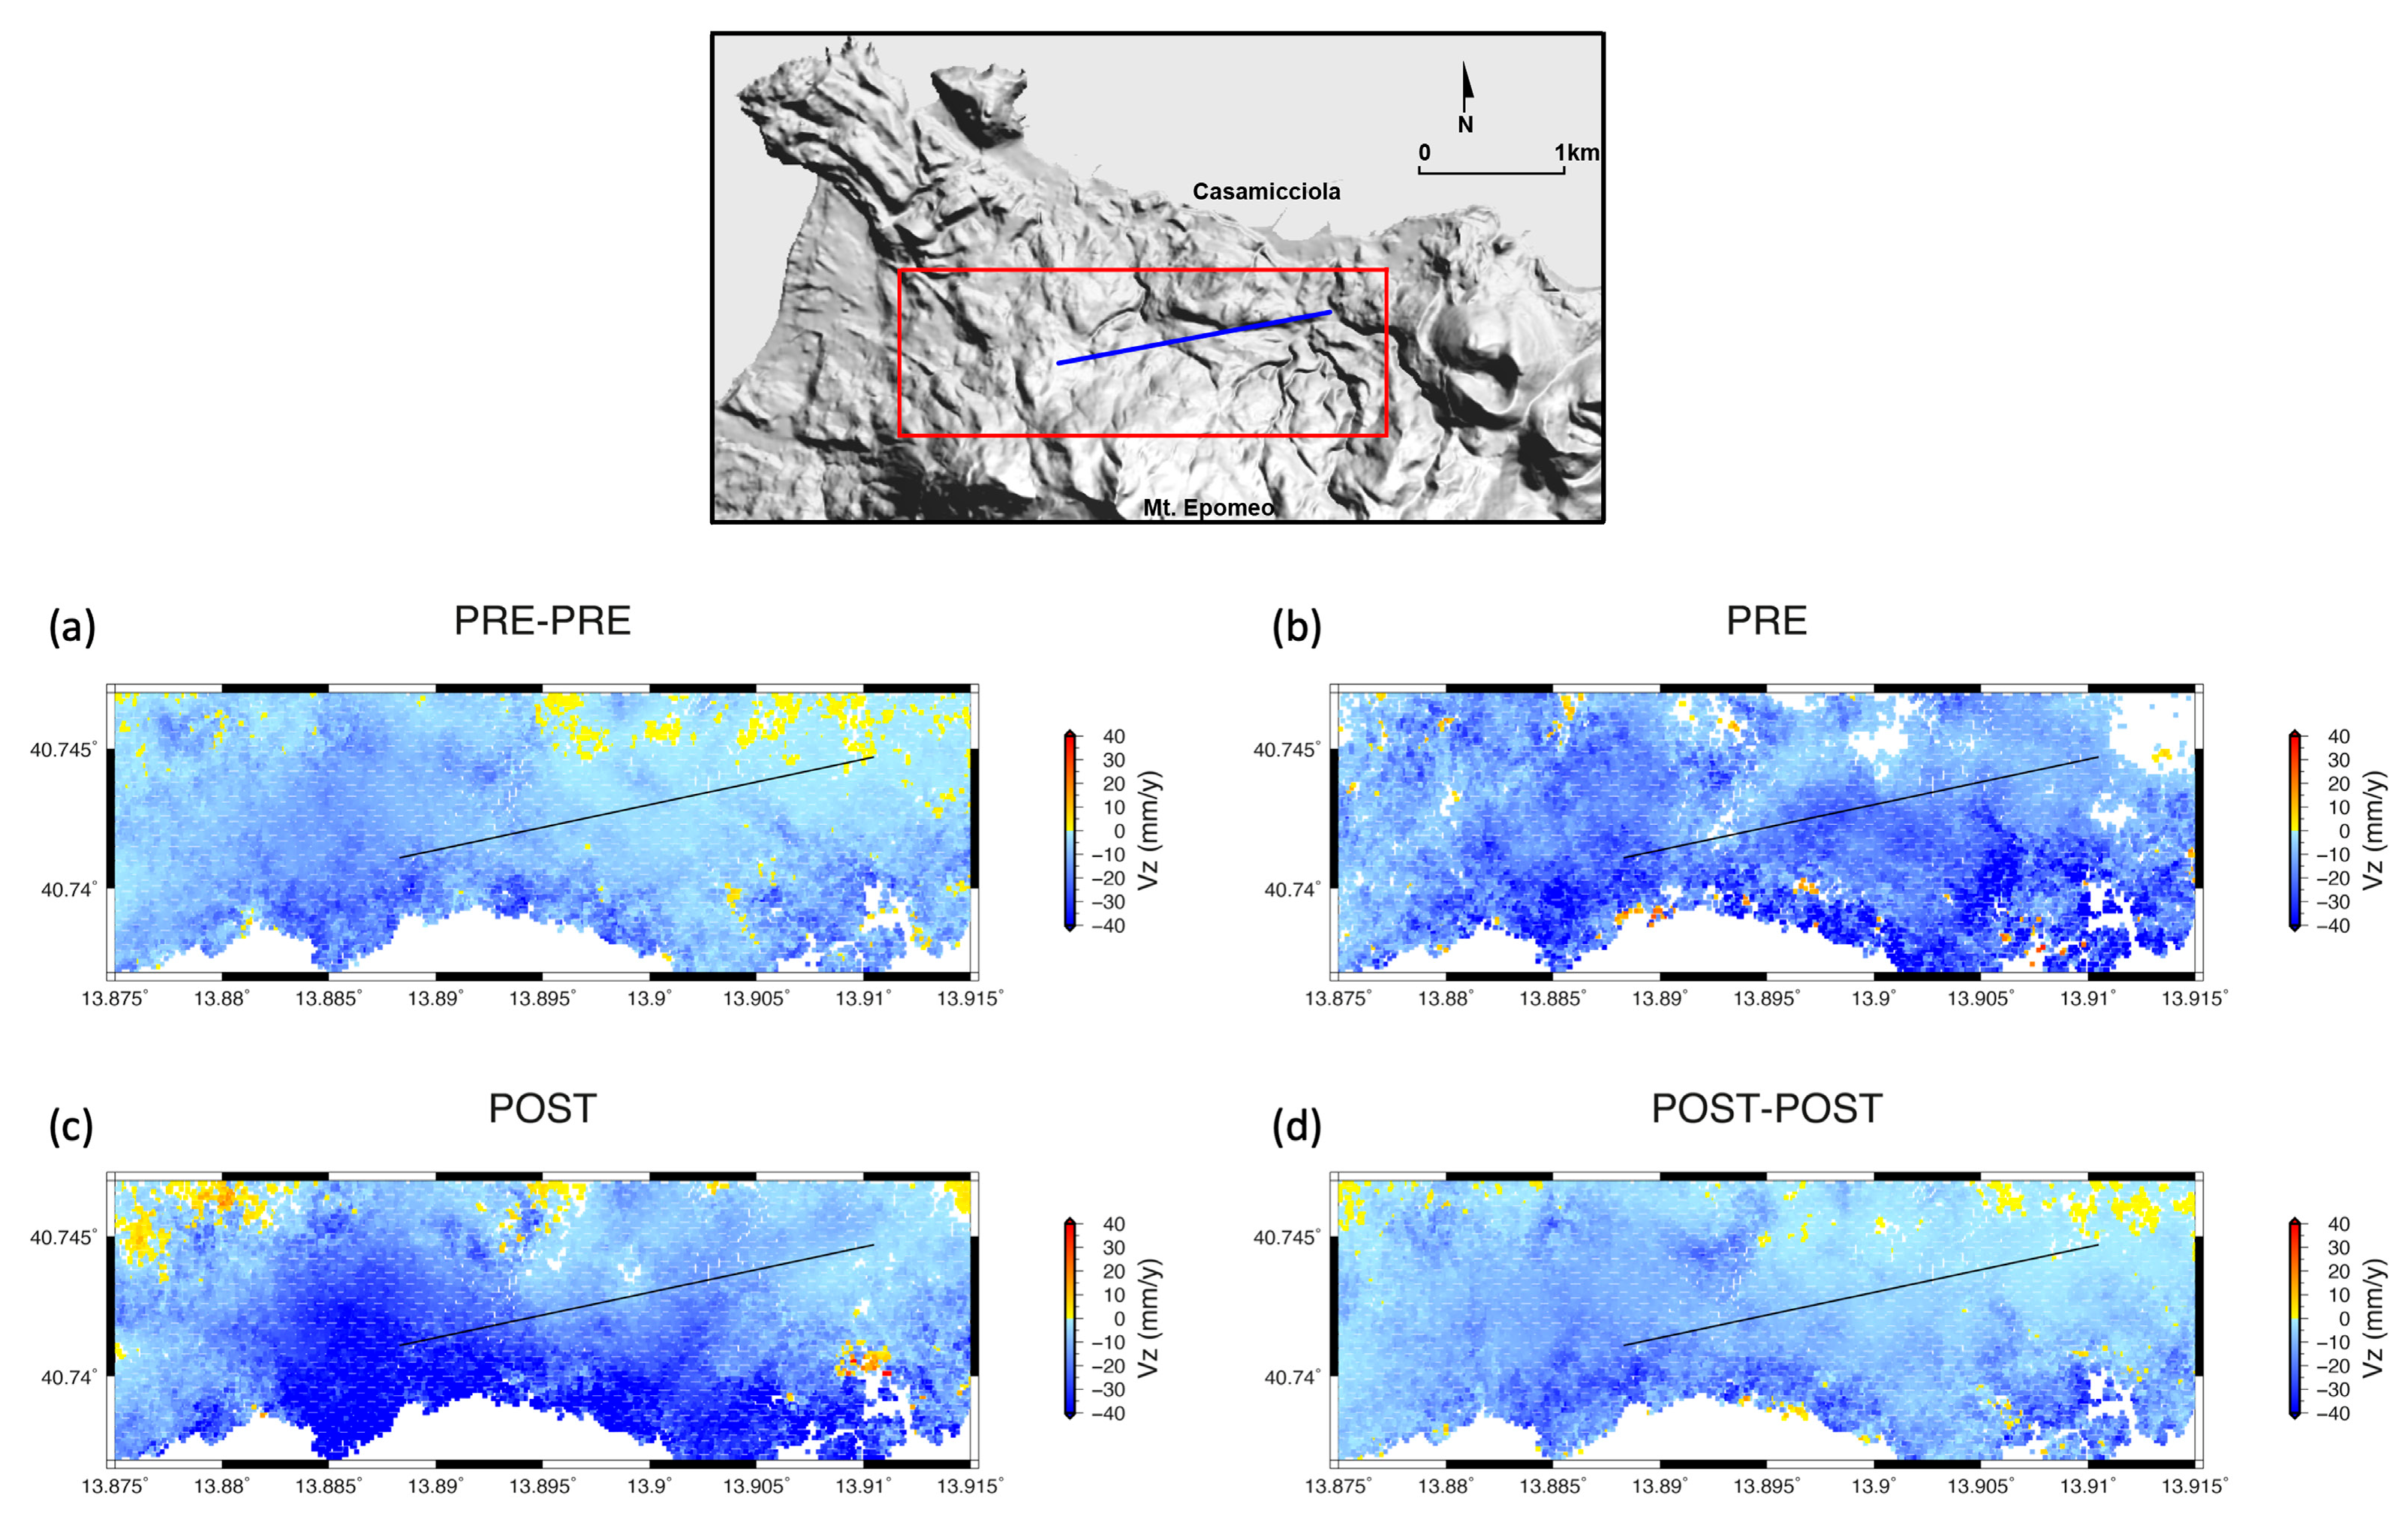
To examine in depth the spatial extension of the characteristics deduced from the analysis of the time series, we computed the velocity of the vertical ground motion at each available point, by segmenting the whole time period of observation in four intervals (
Table 1): two (PRE and POST) corresponding respectively to the interval of occurrence of the pre-, and post-seismic dislocation across the fault, as identified by the time series analysis; one (PRE–PRE) from the beginning of the whole dataset up to the start of the pre-seismic phase (3 months before the earthquake); one (POST–POST) from the end of the post seismic phase to the end of the whole dataset (6 months after the earthquake). The coseismic surface displacement has already been investigated extensively [
25], thus here we will not consider it further. For each one of the four time periods, we computed the velocity of the vertical ground motion at each available point, via the linear regression of the vertical InSAR time series. The associated error is the standard deviation σ of the residuals (
Supplementary Figures S4 and S5). Thus, we considered only the points with a velocity larger than the standard deviation (
Figure 4).
The results are evidence of very similar velocities of the ground subsidence in the PRE–PRE (
Figure 4a) and POST–POST (
Figure 4d) periods, indicating that, apart from 9 months across the earthquake, the vertical deformation in the sector north of Mt. Epomeo is remarkably stable. The geographical distribution of the velocity in these two periods is characterized by a general trend of subsidence of the whole area, superimposed by a large patch of faster velocity extending west and northwest of the fault line. This area corresponds to the well-assessed Fango landslide, triggered by the 1883 earthquake, and apparently still active [
19,
20]. Thus, any modeling of the surface deformation in this area not accounting for the sliding volume is highly unreliable. In this regard, the secondary fault deduced by Trasatti et al. (2019) [
32], mainly relying on the large subsidence observed at the single benchmark 100 A, located well inside the sliding area, appears to be questionable.
Focusing on the time around the earthquake, the vertical deformation during the months preceding the 2017 shock (
Figure 4b) is significantly different from the one immediately following (
Figure 4c). Before the event, the area south of the fault trace subsided faster on the eastern end than on its central sector, where the maximum coseismic subsidence was observed; the opposite holds in the post-seismic period. In addition, the whole area corresponding to the Fango landslide, enclosing the sites analyzed by Beccaro et al. (2021) [
35], appears to move faster than before the seismic event.
Thus, we subtracted the PRE velocity field from the POST, in order to highlight the differences. The results (POST–PRE) are displayed in
Figure 5, where hot/cold color (red/blue) pixels indicate the site subsiding faster/slower in the pre-seismic than in the post-seismic time. Focusing on the southern fault block, the pre-seismic faster subsidence of the eastern segment and the post-seismic faster subsidence of the central part clearly emerges in the picture. We remark that no seismicity was detected along the CSf during the months preceding the 2017 earthquake and only few, small aftershocks of this earthquake were recorded (27 events with magnitude generally between −0.1 and 1.9, for 10 days;
www.ov.ingv.it (accessed on 24 March 2023)).
A red spot is visible north of the fault line, where a small coseismic uplift occurred [
25]. This is an area of slower subsidence right after the quake with respect to what happened immediately before, possibly connected to and counterbalancing the afterslip of the southern block discussed above.
4. Discussion
Overall, the maps of the velocity fields for a 5-year period confirm and better detail the heterogeneities that are evidence in the differential vertical movement at a couple of points on the two sides of the fault. The distribution in space and time of the relative vertical displacement suggests that, in spite of the limited extension of the causative fault, the 21 August 2017 earthquake was part of a complex dynamic process involving apparently aseismic dislocation during a few months preceding the quake and occurring only on a small segment of the fault located on its eastern segment. Notably, this area experiences significant thermal spring discharge (
Figure 1), suggesting that it might be associated with hydrothermal processes playing some role in promoting aseismic slip on this segment of the CSf. In fact, during experiments of fluid injection at both natural faults and laboratory scale [
46,
47], it was observed that the increase in fluid pressure first induces accelerating aseismic creep and fault opening. This process can trigger small-to-moderate earthquakes. By considering the long-living presence of thermal springs in this area, we concluded that if a connection exists between the observed 2017 post-seismic creep and the thermal fluid activity, the occurrence of slow aseismic dislocation along this segment of the CSf could be not be sporadic.
The elaborated InSAR data cover about 5 years, not allowing the investigation of the fault behavior over long time periods. Thus, in order to extend the analysis as much as possible in time, we analysed the available ground-levelling data gathered in the study area over three decades (
https://doi.pangaea.de/10.1594/PANGAEA.909710 (accessed on 24 March 2023). Although less dense in space, these data also provide more precise measurements with respect to SAR data, due to the different acquisition technique.
High precision levelling surveys were carried out in 1984, 1987, 1990, 1994, 1997, 2001, 2003, 2010 and 2017, but not all the benchmarks relevant to the present analysis were included in all the surveys; thus, we only considered data acquired later than 1987. We focused on sites in proximity of the CSf (
Figure 1), searching for differential behavior among benchmarks located on the two sides of the fault line.
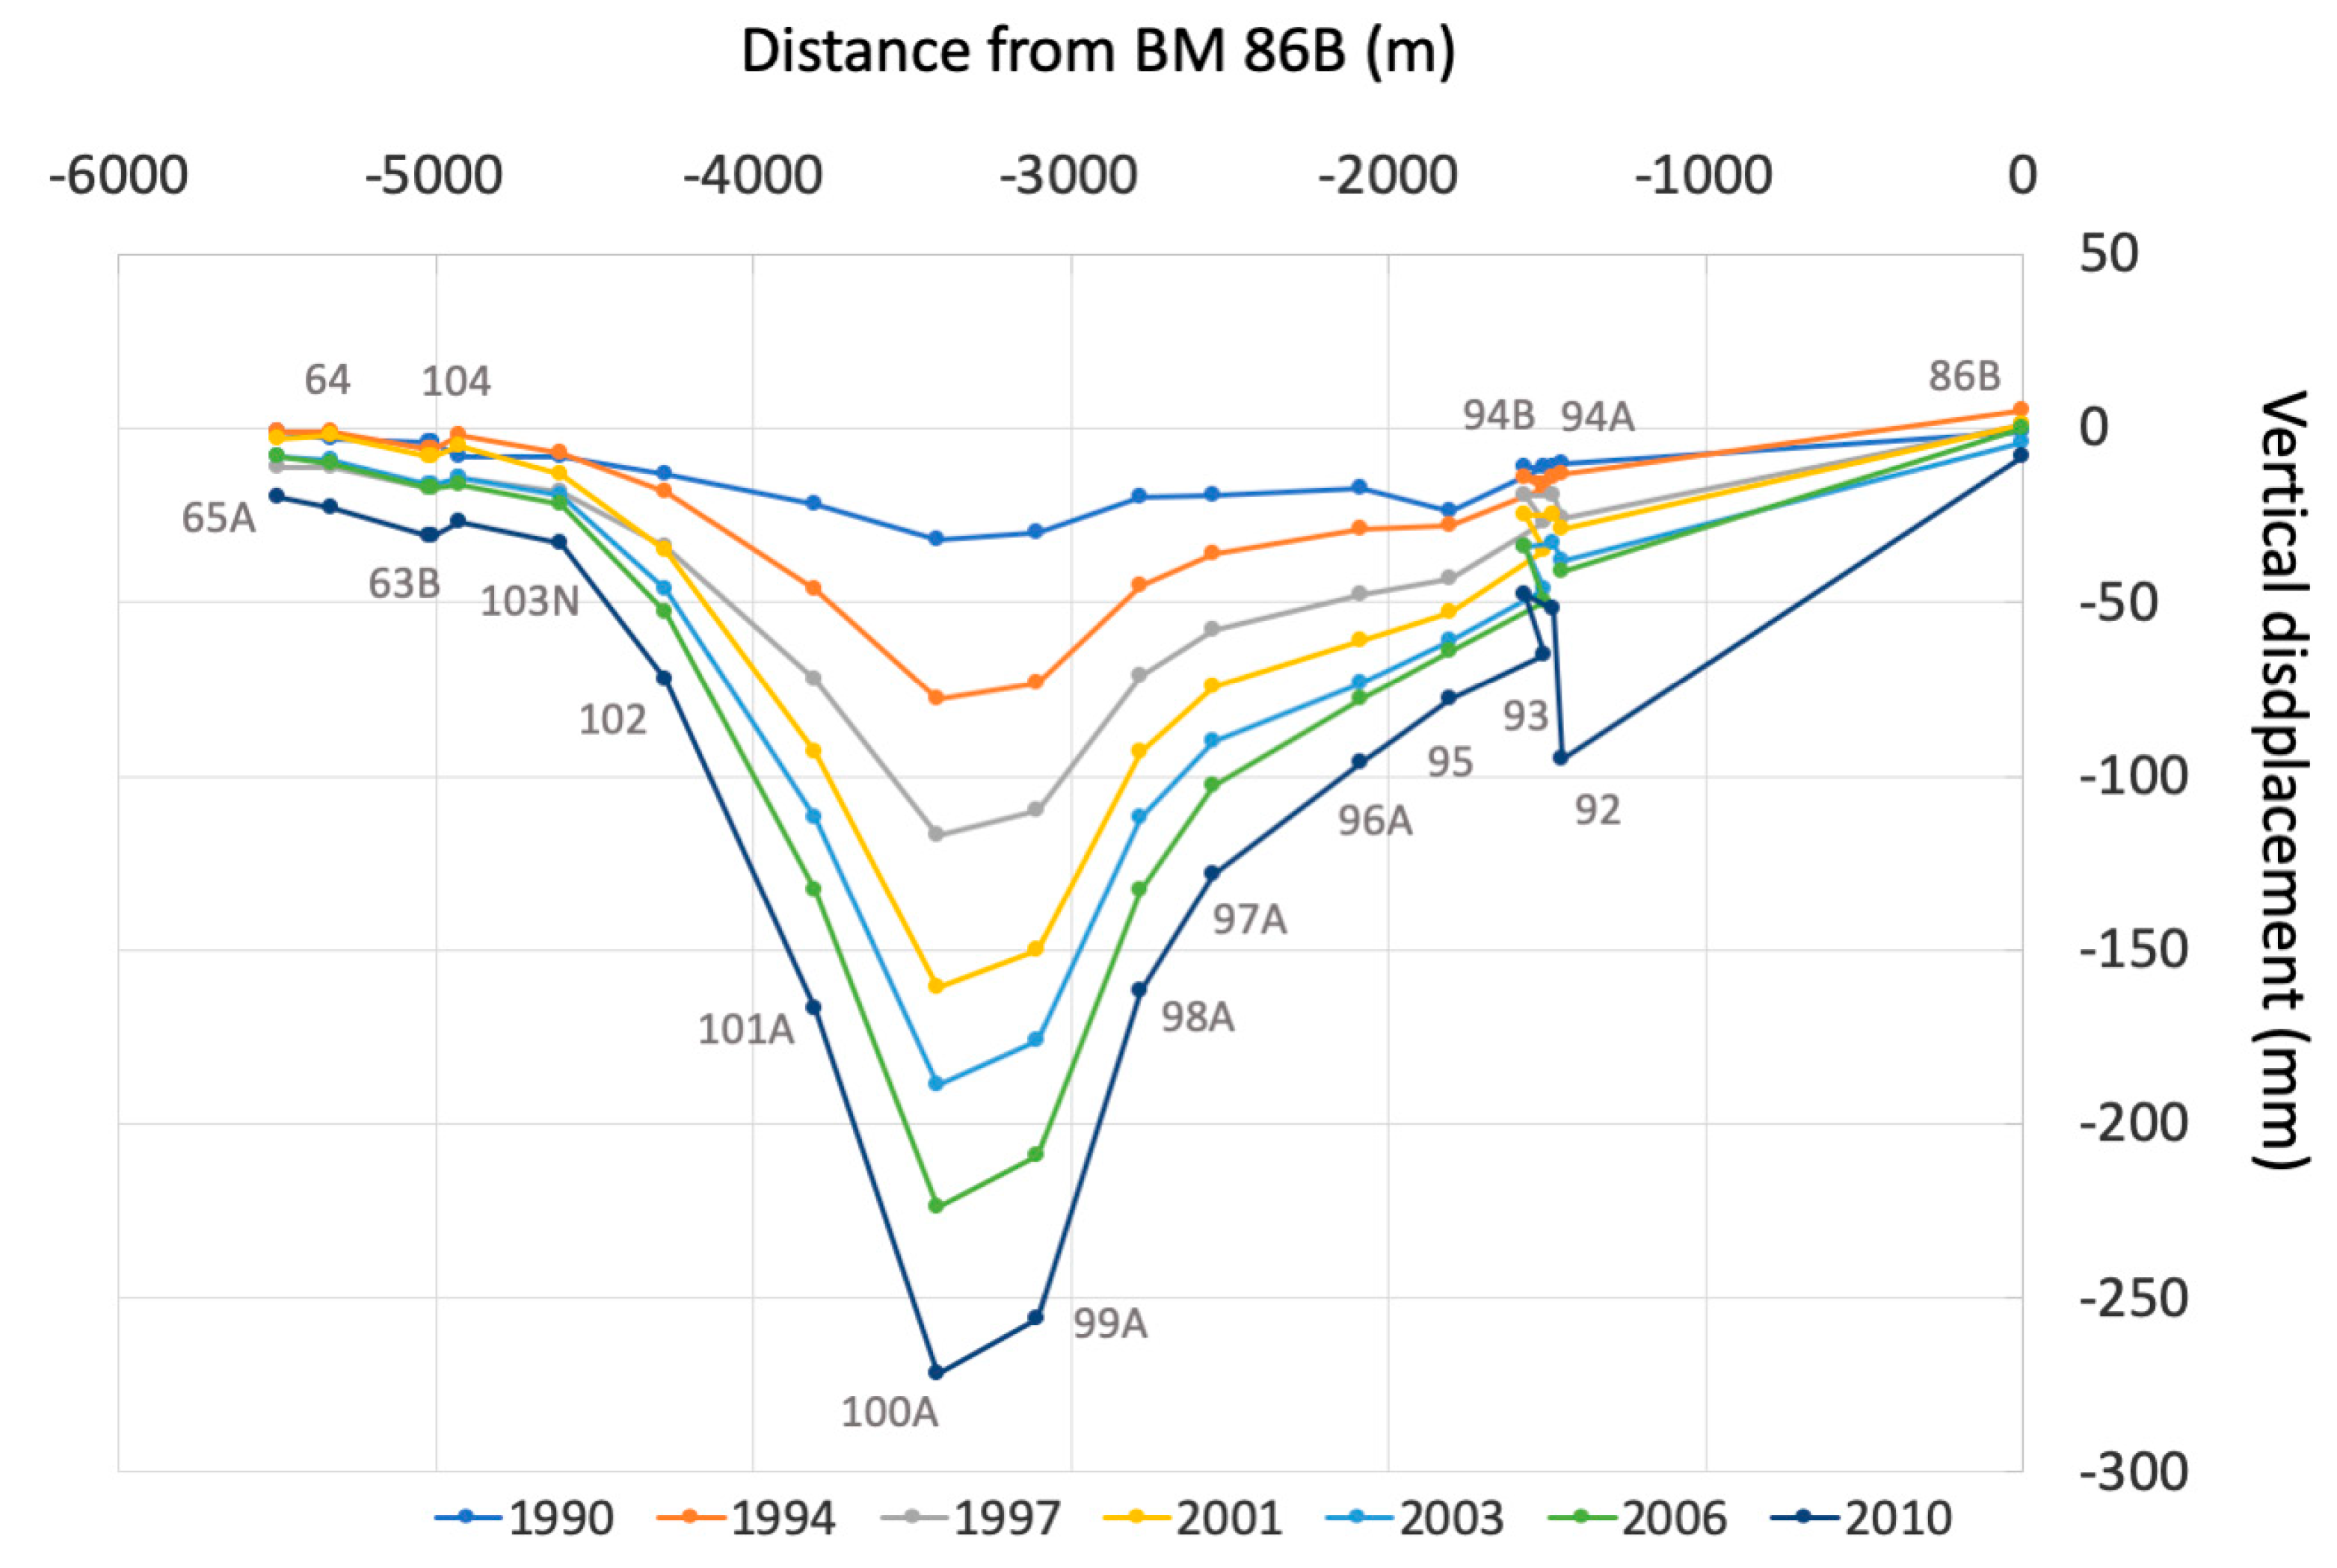
The differences between the vertical displacement of successive surveys are evidence of the general subsidence over the whole period, with significantly faster velocity in the area of the Fango landslide (
Figure 6). No evident discontinuity is present to the west, whereas the measurements on the eastern sites of the line display a marked break for each time period between successive surveys, i.e., persistently throughout the whole measured period. The discontinuity is detected at benchmarks located in the area where the InSAR analysis revealed differential aseismic subsidence, in correspondence of the benchmarks 93 and 94 B, very close each other, but on opposite sides of the fault line. By excluding the coseismic displacement, we computed the subsidence velocity at these two benchmarks from 1987 to 2010. To get homogeneous results with InSAR displacement velocities, we derived a linear fit to the levelling data to obtain the velocity of the subsidence and computed the residual standard deviation to estimate the associated error.
The results indicate −2.70 (±0.13) mm/y and −1.88 (±0.15) mm/y for 93 and 94 B, respectively. Thus, the long-term average of the differential velocity between the blocks on the two sides of the CSf is 0.82 mm/y. This observation indicates that the creep silently dislocating the eastern sector of the fault during a few months preceding the 2017 earthquake has also occurred in the previous 30 years. However, considering the results of the InSAR analysis, this process is likely to be intermittent, with creep episodes repeating in time at a higher velocity. Over decades or even centuries, this differential dislocation is able to concentrate a significant strain load on the main asperity of the CSf, which finally breaks when the cumulated stress overcomes the faults’ strength, taking the fault surface back to equilibrium.
The analysis of the macroseismic intensities reveals that the known historical earthquakes ruptured the western sector of the fault segments [
24]. On the other hand, no substantial topographical inhomogeneity is evident along the fault trace. Thus, over long periods of time, the slip rate over the creeping segment of the fault should be of the same order of magnitude as the rate of coseismic dislocation on the fault asperity or, at least, considering that stronger earthquakes (e.g., 1883) might produce some dislocation on the whole fault surface, the rate of aseismic creep deduced above can be considered a minimum estimate for the long-term coseismic slip rate.
The strain on the CSf is primarily driven by the steady subsidence of the central sector of the island, which occurred at least during the last 2 ky. Thus, we considered that a constant slip rate can be assumed for the fault in the past few centuries, at least. Based on these observations, we investigated the recurrence of the historical earthquakes in Casamicciola in relation to the slip rate deduced for the CSf. To this aim, we used the earthquakes’ magnitude to derive estimates of the coseismic dislocation. We considered all the earthquakes that occurred in the Casamicciola area (
Table S1). For each event, we used the equivalent moment magnitude reported by the historical catalogue, obtaining an estimate of the average dislocation
from the corresponding seismic moment
. In this computation, we used shear modulus μ = 1.0 × 10
10 N/m
2 and assumed the fault area A resulting from the published empirical relation [
48].
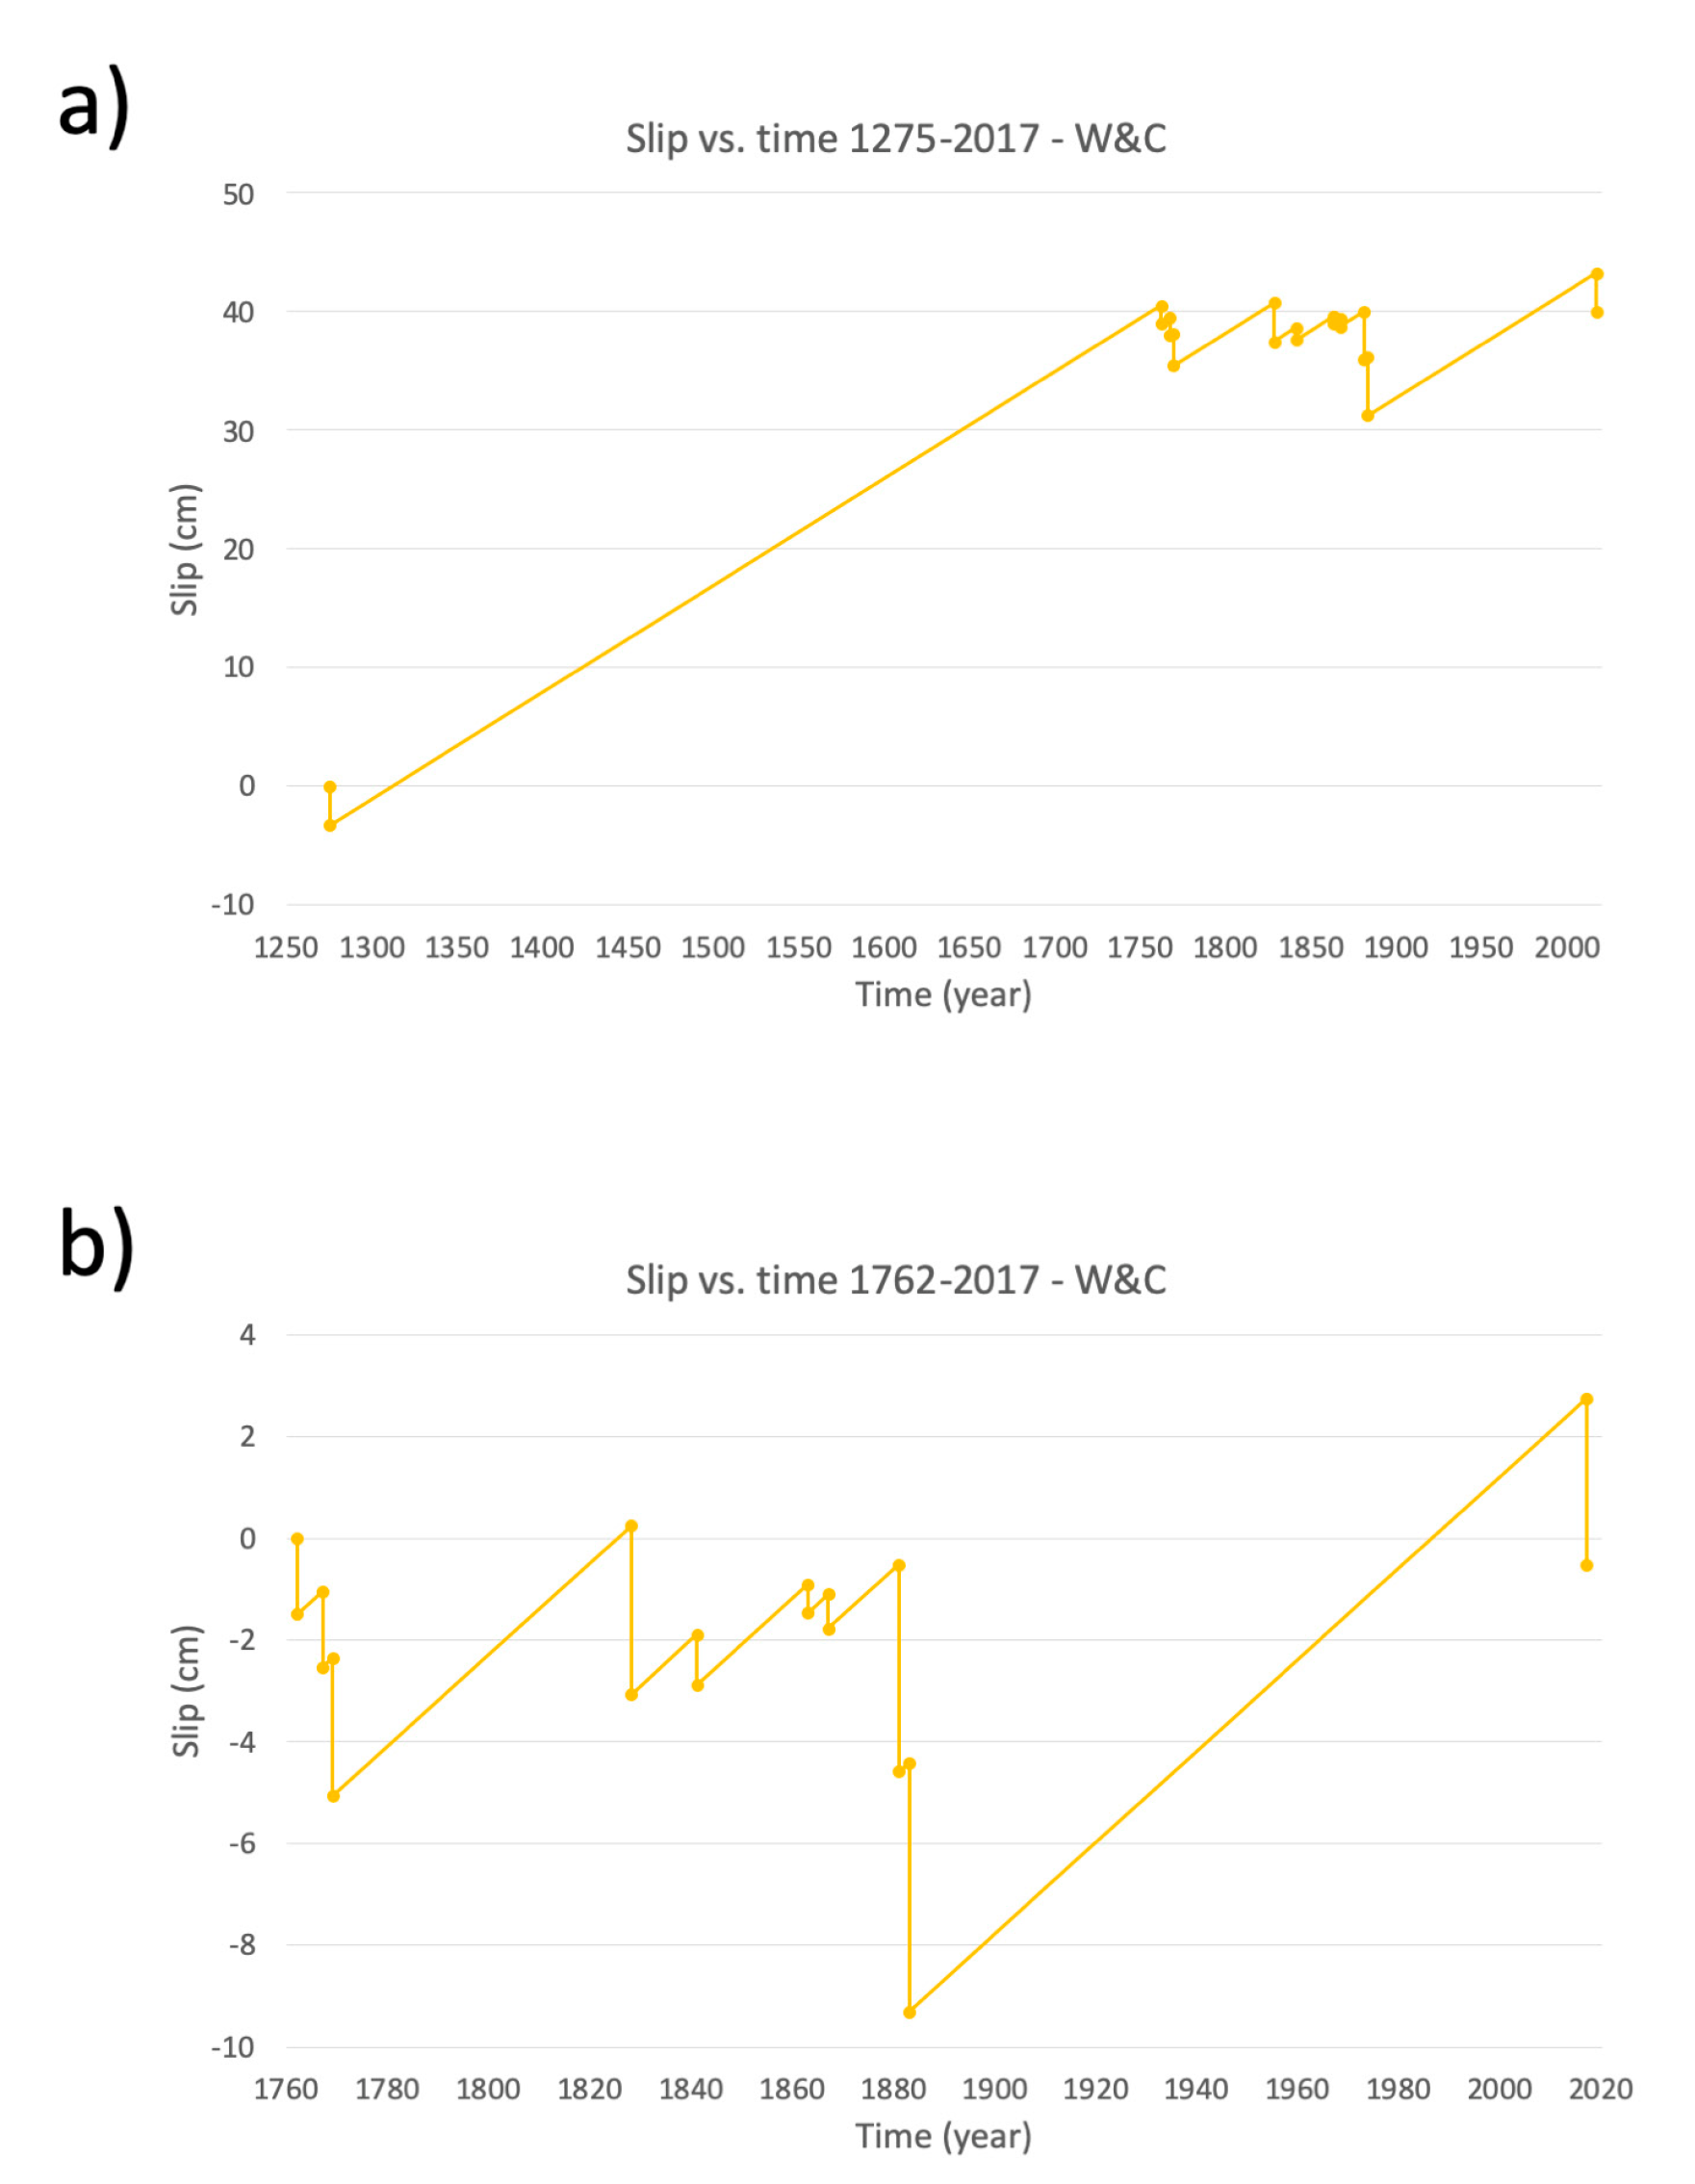
By using the creep velocity and the coseismic dislocation, respectively, as load rate and coseismic release, we tracked a time function describing the repeated occurrence of events on the CSf as a consequence of the subsidence of the Mt. Epomeo block (
Figure 7). We first tested the possibility of including in the list the 1228 earthquake (that is an uncertain event) (
Figure 7a), obtaining an inconsistent picture, evidence that either the magnitude of this event could be significantly higher than what was reported or several not-negligible earthquakes might be missing in the catalogue, or even both alternatives. Whatever the case, apparently the seismic energy release during the centuries preceding 1762 is largely underestimated by the current catalogue.
By excluding the uncertain 1228 event, the results depict a coherent image for the CSf over more than 250 years, with the slip vs. time function oscillating around an approximately constant level, somehow supporting the hypotheses and also defining a reference trend for the earthquake recurrence at Casamicciola (
Figure 7b). Considering the uncertainties associated with the computation, the slip function appears to outline a trend with earthquakes occurring approximately when a maximum stress level is reached on the fault (time-predictable recurrence model), rather than dropping the stress to a common value (slip-predictable recurrence model). The whole picture suggests that the time to the next relevant earthquake at Casamicciola might be relatively short, on the order of a few decades, but also that it is not possible to image its magnitude, which potentially could be comparable to 2017 or even reach the level of 1883.
Furthermore, the resulting slip function is evidence of an irregular behavior, compatible with the characteristics of a Poissoninan process, recently proposed for the seismicity of Ischia island [
49]. We suggest that – in concurrence with the main loading mechanism—the seismic cycle at Ischia might be modulated by other processes, such as variations of the fluid pressure in the hydrothermal system, located in the depth range of the CSf [
16]. A rise in fluid pressure can either lower the normal stress on the fault, favoring the fracture [
50] or facilitate an aseismic slip on the creeping sector of the fault, concentrating the stress on the main asperity [
51,
52,
53]. Indeed, the eastern segment of CSf is affected by water circulation (flowing as hot thermal springs at the Bagni locality), which can lubricate this sector experiencing repeated aseismic slip episodes, giving long-term average creep velocity of 0.82 mm/y.
5. Conclusions
By applying a joint multitemporal and multiscale analysis of ground deformation, based on InSAR and levelling data, we showed that the stress accumulated on the CSf is released through a complex dynamic including seismic and aseismic creep, which in turn are possibly both facilitated by fluids’ circulation. The stress is accumulated as a consequence of differential gravitational loading of the resurgent block of Mt. Epomeo.
We unequivocally traced the surface trace of the very shallow CSf, associated with the 2017 earthquake. This event was preceded by aseismic deformation on the eastern sector, not dislocating coseismically, and was followed by viscous relaxation affecting differently the segment that slipped during the quake. The post-seismic deformation curve with time allowed us to extract a reasonable value for the viscosity of the ductile region at the bottom of the fault, on the order of 1017 Pa s.
The observed spatial and temporal pattern of creep around the CSf can be reconciled with a model of asperity rupture forced by relaxation creep. We suggest that the creeping eastern segment of the CSf contributes to concentrate the stress on a stronger fault patch located on the western part and representing the main asperity.
The reconstruction of a slip/time function (that appears to outline a time-predictable recurrence model,
Figure 7) suggests that the stress accumulated on the fault since the 1883 earthquake might not have been released completely in 2017 and, anyway, the time to the next seismic event at Casamicciola might be of a few decades. This evaluation should be an incentive for local authorities to push them to undertake effective actions for mitigating the considerable seismic risk of this area.
Finally, we suggest that a punctual monitoring of the distribution in space and time of the aseismic creep could provide clues on the state of strain of the CSf. Further integrated multianalytes obtained from geophysical, geodetic and geochemical monitoring of the island should contribute to a better understanding of the coupling between transient fluid flow, creep and seismic activity in volcanic regions.


