Article

Assessing the Impact of Land Use and Land Cover Changes on Aflaj Systems over a 36-Year Period

by
Khalifa M. Al-Kindi
1,*,
Abdullah F. Alqurashi
2,
Abdullah Al-Ghafri
1 and
Dennis Power
1
1
UNESCO Chair of Aflaj Studies, Archaeohydrology, University of Nizwa, Nizwa P.O. Box 33, Oman
2
Department of Geography, Umm Al-Qura University, Makkah 21955, Saudi Arabia
*
Author to whom correspondence should be addressed.
Remote Sens. 2023, 15(7), 1787; https://doi.org/10.3390/rs15071787
Submission received: 22 January 2023 / Revised: 6 March 2023 / Accepted: 14 March 2023 / Published: 27 March 2023

Abstract

:
The aflaj systems represent unique irrigation technologies that have been implemented in the Sultanate of Oman. This innovative system, referred to as “falaj” in the singular form, is composed of a sophisticated network of underground tunnels and open-air channels designed to access shallow subterranean water tables, thereby providing water for residential and agricultural use. The aflaj systems have played a significant role in supporting sustainable water resource management in arid and semiarid regions, making a notable contribution to the socioeconomic development of the country. The alteration of land use and land cover (LULC) in arid and semiarid regions can have significant consequences for hydrological systems, affecting the ability of local ecosystems to manage fresh surface and groundwater resources. These changes are often caused by both natural and anthropogenic factors. To investigate the impact of LULC changes on aflaj systems in the northern part of Oman, we utilized satellite imagery, aflaj data, and spatial analytical and image processing techniques within the framework of geographic information systems (GIS) and remote sensing. In the first part of the study, we quantified the changes in LULC and their impact on aflaj systems in seven cities in Oman due to urban expansion. In the second part, we evaluated the effect of LULC on groundwater for four major aflaj between 1985 and 2021. The study area was divided into four primary LULC classifications: vegetation, bodies of water, metropolitan areas, and bare soil. The classification maps demonstrated a high overall accuracy of 90% to 95%, indicating satisfactory performance. Our results revealed a significant reduction in vegetation areas between 1985 and 2021, primarily shifting from bare soil (BS) to urban areas (UAs) and from vegetation cover (VC) to BS, due to the reduction of groundwater resources. Over the four study periods (1985–1990, 1990–2000, 2000–2013, and 2013–2021), the percentages of the total area of Falaj Al-Muyasser, Falaj Daris, Falaj Al-Maliki, and Falaj Al-Khatmeen that transformed from agricultural lands to UAs were 40%, 39%, 32%, and 8%, respectively. Our study highlights the need for appropriate land management and planning to ensure the most effective solutions are utilized to meet social and economic sustainability requirements. In conclusion, our study presents a comprehensive analysis of LULC changes and their impact on aflaj systems over a 36-year period, providing new insights into the potential effects of LULC changes on groundwater resources and offering a basis for informed decision making on land management in arid and semiarid areas.

1. Introduction

Changes in land use/land cover (LULC), particularly in arid and semiarid areas, have a geographic and temporal impact on hydrological systems [1]. Both natural and anthropogenic activities have significant impacts on LULC, affecting the phenology of the local ecosystem and its ability to regulate surface and underground water resources. The increase in LULC is projected to significantly enhance the rates of evaporation and groundwater depletion [2]. The influence of LULC changes on the regional water balance is the subject of intensive research in hydrological areas worldwide, and most studies suggest that large-scale LULC changes are major factors causing regional climatic and hydrological cycle changes [1,3,4]. The proliferation of impervious surfaces presents a significant risk to the hydrological cycle, as it has the potential to greatly diminish infiltration, groundwater storage, and recharge. Given the scarcity and erratic distribution of water sources across varying temporal and spatial dimensions, securing a reliable water supply for irrigation poses a formidable obstacle. Accordingly, tackling this multifaceted predicament necessitates a holistic comprehension of the hydrological mechanisms governing the interplay between the built environment and natural water resources [5].
The impact of urbanization on groundwater has become a pressing concern for many metropolitan areas in recent decades, particularly those interested in groundwater quantity and observational methods [6]. In regions that are prone to drought, such as the Sultanate of Oman (Oman), water supplies are scarce and mostly derived from groundwater sources [7]. These sources rely on precipitation as the primary means of recharge for the local aquifers. Groundwater is extracted through wells that tap into various water-bearing formations, providing much-needed freshwater to meet the ever-increasing demand for water supply and agriculture. However, this practice has had a detrimental impact on the hydrogeological setting of the basins [8]. The extraction of water from these sources without adequate replenishment has led to a decrease in water availability, resulting in groundwater depletion. Oman experiences little and erratic rainfall, with an average of only 100 mm per year. As a result, this arid climate further exacerbates the depletion of the already limited groundwater resources, putting pressure on the sustainability of the region’s water supply [9]. Recent climate trends indicate that daily maximum and minimum temperatures are continuously rising [10]. Oman, in particular, has experienced a predominant climate trend of decreasing rainfall and infrequent, but devastating cyclones over the last few decades [11,12]. These changes in precipitation patterns and recharge rates, coupled with the limited availability of water resources, are likely to exacerbate groundwater pumping and agrochemical use. Furthermore, rising sea levels are expected to interact with groundwater, leading to increased salinity levels in the aquifers. Such extreme weather events pose a significant threat to urban areas (UAs), especially given their high dependency on groundwater resources. As climate change continues to alter precipitation patterns and increase temperatures, the sustainability of Oman’s groundwater resources will be further challenged, and it will become crucial to develop and implement effective groundwater management strategies to ensure a reliable and sustainable water supply for the region’s growing population and economy.
Oman is renowned for its distinctive irrigation technology referred to as “aflaj,” with “falaj” being its singular form. This traditional irrigation method serves as the primary mechanism for transporting water from the shallow subterranean water table to the surface, for both residential and irrigation purposes. Falajs are essentially trenches or tunnels that transport groundwater from its source to the point of consumption, with traditional building methods varying across different falaj types [13]. The most sophisticated type is the Daudi falaj, which draws groundwater from 10–30 m below ground for usage at the surface without pumping. Like the Daudi falaj system, it can be found in many countries around the world [14,15]. The falaj channel begins in the continually flooded zone and goes underground in a downhill direction until it reaches the earth’s surface. The ability to use rudimentary tools to conduct hydraulic leveling and excavate the falaj tunnels beneath the earth on rough terrain demonstrates the ingenuity of aflaj building [16]. The two methods, Ainiy and Ghaily aflaj, are simple canalizations of groundwater streaming on the surface naturally or flowing out of a spring and carrying it until it reaches a suitable region for agriculture [17]. Water flowing from the falaj is properly regulated through these systems by a committee representing the owners of that particular falaj.
For millennia, the aflaj irrigation systems have provided water for home and agricultural usage in a harsh desert climate. There are roughly 3000 falaj systems still in use today, accounting for approximately 30% of Oman’s groundwater [18]. These one-of-a-kind water systems boosted agriculture in Oman, which, together with fishing, symbolized a heritage that enabled Omanis to develop a steadfast civilization over millennia and provided subsistence for generations who withstood a difficult climate and environmental conditions. However, even though they have survived, many of the remaining aflaj systems are now considered endangered. Many aflaj are no longer operable due to channel collapse or water level drop caused by excessive pumping and climate change [19]. It is crucial to develop sustainable water management strategies that balance the needs of the population with the preservation of these unique cultural heritage sites, especially as Oman’s population and economy continue to grow.
The rapid growth of agriculture and urban development in Oman following the nation’s renaissance in 1970 has created an imbalance in groundwater resources [20]. With the introduction of high-capacity water pumps and modern equipment, people have started establishing new farms outside traditional farming zones. While aflaj are primarily found in highland areas, wells are situated in inland plains and along the shore. The unplanned and unsustainable agricultural development during the 1980s resulted in the creation of non-productive farms and increased the water deficit [21,22]. As the population grows and living standards improve, the demand for water resources is increasing, resulting in a daily decrease in the per capita availability of water resources [23]. The majority of Oman’s towns and cities are experiencing disorganized and unplanned expansion due to rapid urbanization. The excessive extraction of groundwater has depleted groundwater resources, and saltwater intrusion has affected coastal aquifers. Climate change is also expected to impact rainfall and water supply [24]. Moreover, the impact of land use and land cover (LULC) changes on aflaj systems and processing settings is not entirely clear. Therefore, simulations on the effects of LULC modifications on aflaj systems provide ambiguous results.
Satellite-based observation of Earth is becoming increasingly critical for understanding the influence of human activities on the natural environment [25]. Remote sensing technology enhances the current institutional capability for detecting LULC changes [26,27]. The use of remote sensing and GIS technologies has become increasingly prevalent in studying LULC changes and their impact on groundwater resources. Utilizing various methodologies, numerous studies have been conducted on LULC categorization and change detection [28,29], as well as their implications for groundwater levels and quality [30]. For instance, one study used remote sensing data to classify LULC categories and determine changes in those categories over time [31]. The study found that there was a significant increase in agricultural land use, which resulted in a decrease in natural vegetation cover and a reduction in groundwater recharge. Another study used a combination of GIS and remote sensing data to assess the impact of LULC changes on groundwater quality [32]. The study found that the expansion of UAs and the increased use of fertilizers and pesticides in agriculture had a significant impact on groundwater quality, leading to increased nitrate contamination. Remote sensing and GIS have proven to be valuable tools for studying LULC changes and their impact on groundwater resources [33,34]. These techniques can provide policymakers and water resource managers with critical information to help make informed decisions about land use planning and management, ultimately helping to preserve groundwater resources for future generations.
Despite the importance of Oman’s aflaj systems, few studies have investigated the impact of land use and land cover (LULC) changes on their sustainability [35]. Buerkert et al., 2021 [36], investigated LULC changes in the Jebel Akhdar aflaj and found that the shift towards more market-oriented requirements could jeopardize the sustainability of these systems. Another study examined LULC changes in the wilayat of Nizwa, which included modifications in vegetation across the study area [37]. Although the region had a variety of aflaj and flourishing farms, this study did not focus on changes in LULC within a particular falaj system. Moreover, it only covered a few aflaj systems and did not provide a comprehensive view of Oman’s aflaj systems. The previous literature has mostly focused on case studies, resulting in a lack of comprehensive data on the extent to which the aflaj systems have been affected by environmental concerns and how the aflaj institutions have responded to these threats. In addition, the rapid expansion of urban and agricultural areas in developing countries, including Oman, is likely to put intense social pressure on the aflaj-related biosphere, leading to increased groundwater extraction and contamination. Uncontrolled groundwater resource development and protection have severe negative effects on aquatic flora and fauna due to groundwater flow and quality changes. Some aquifers in arid and densely populated areas have already lost their ecological functions due to excessive exploitation, further highlighting the need to examine the impact of LULC changes on the aflaj systems [38,39].
The purpose of this study is to investigate the impact of LULC changes on the aflaj systems, which are traditional irrigation systems used in Oman. While some studies have been conducted on the aflaj systems, this study is one of the first to specifically focus on the impact of LULC changes on the systems at a large scale. The aflaj are unique irrigation systems that have been used for centuries and are an integral part of Oman’s culture and heritage. By examining the impact of LULC changes on the aflaj systems, this study will provide valuable insights into the sustainability of the systems and their ability to adapt to changing environmental conditions. The present paper fills this gap in the literature by using current and past satellite images from 1985–2021 to detect changes in LULC over time and thus identify the extent to which the farmland has declined in the study period and the type of LULC to which it has been transferred. This study aims to analyze Landsat images of a large representative sample of 1268 aflaj in the first part of the study, while the second part of the study focuses on 4 key aflaj systems (a small scale) to assess how LULC has impacted groundwater (aflaj systems).

2. Materials and Methods
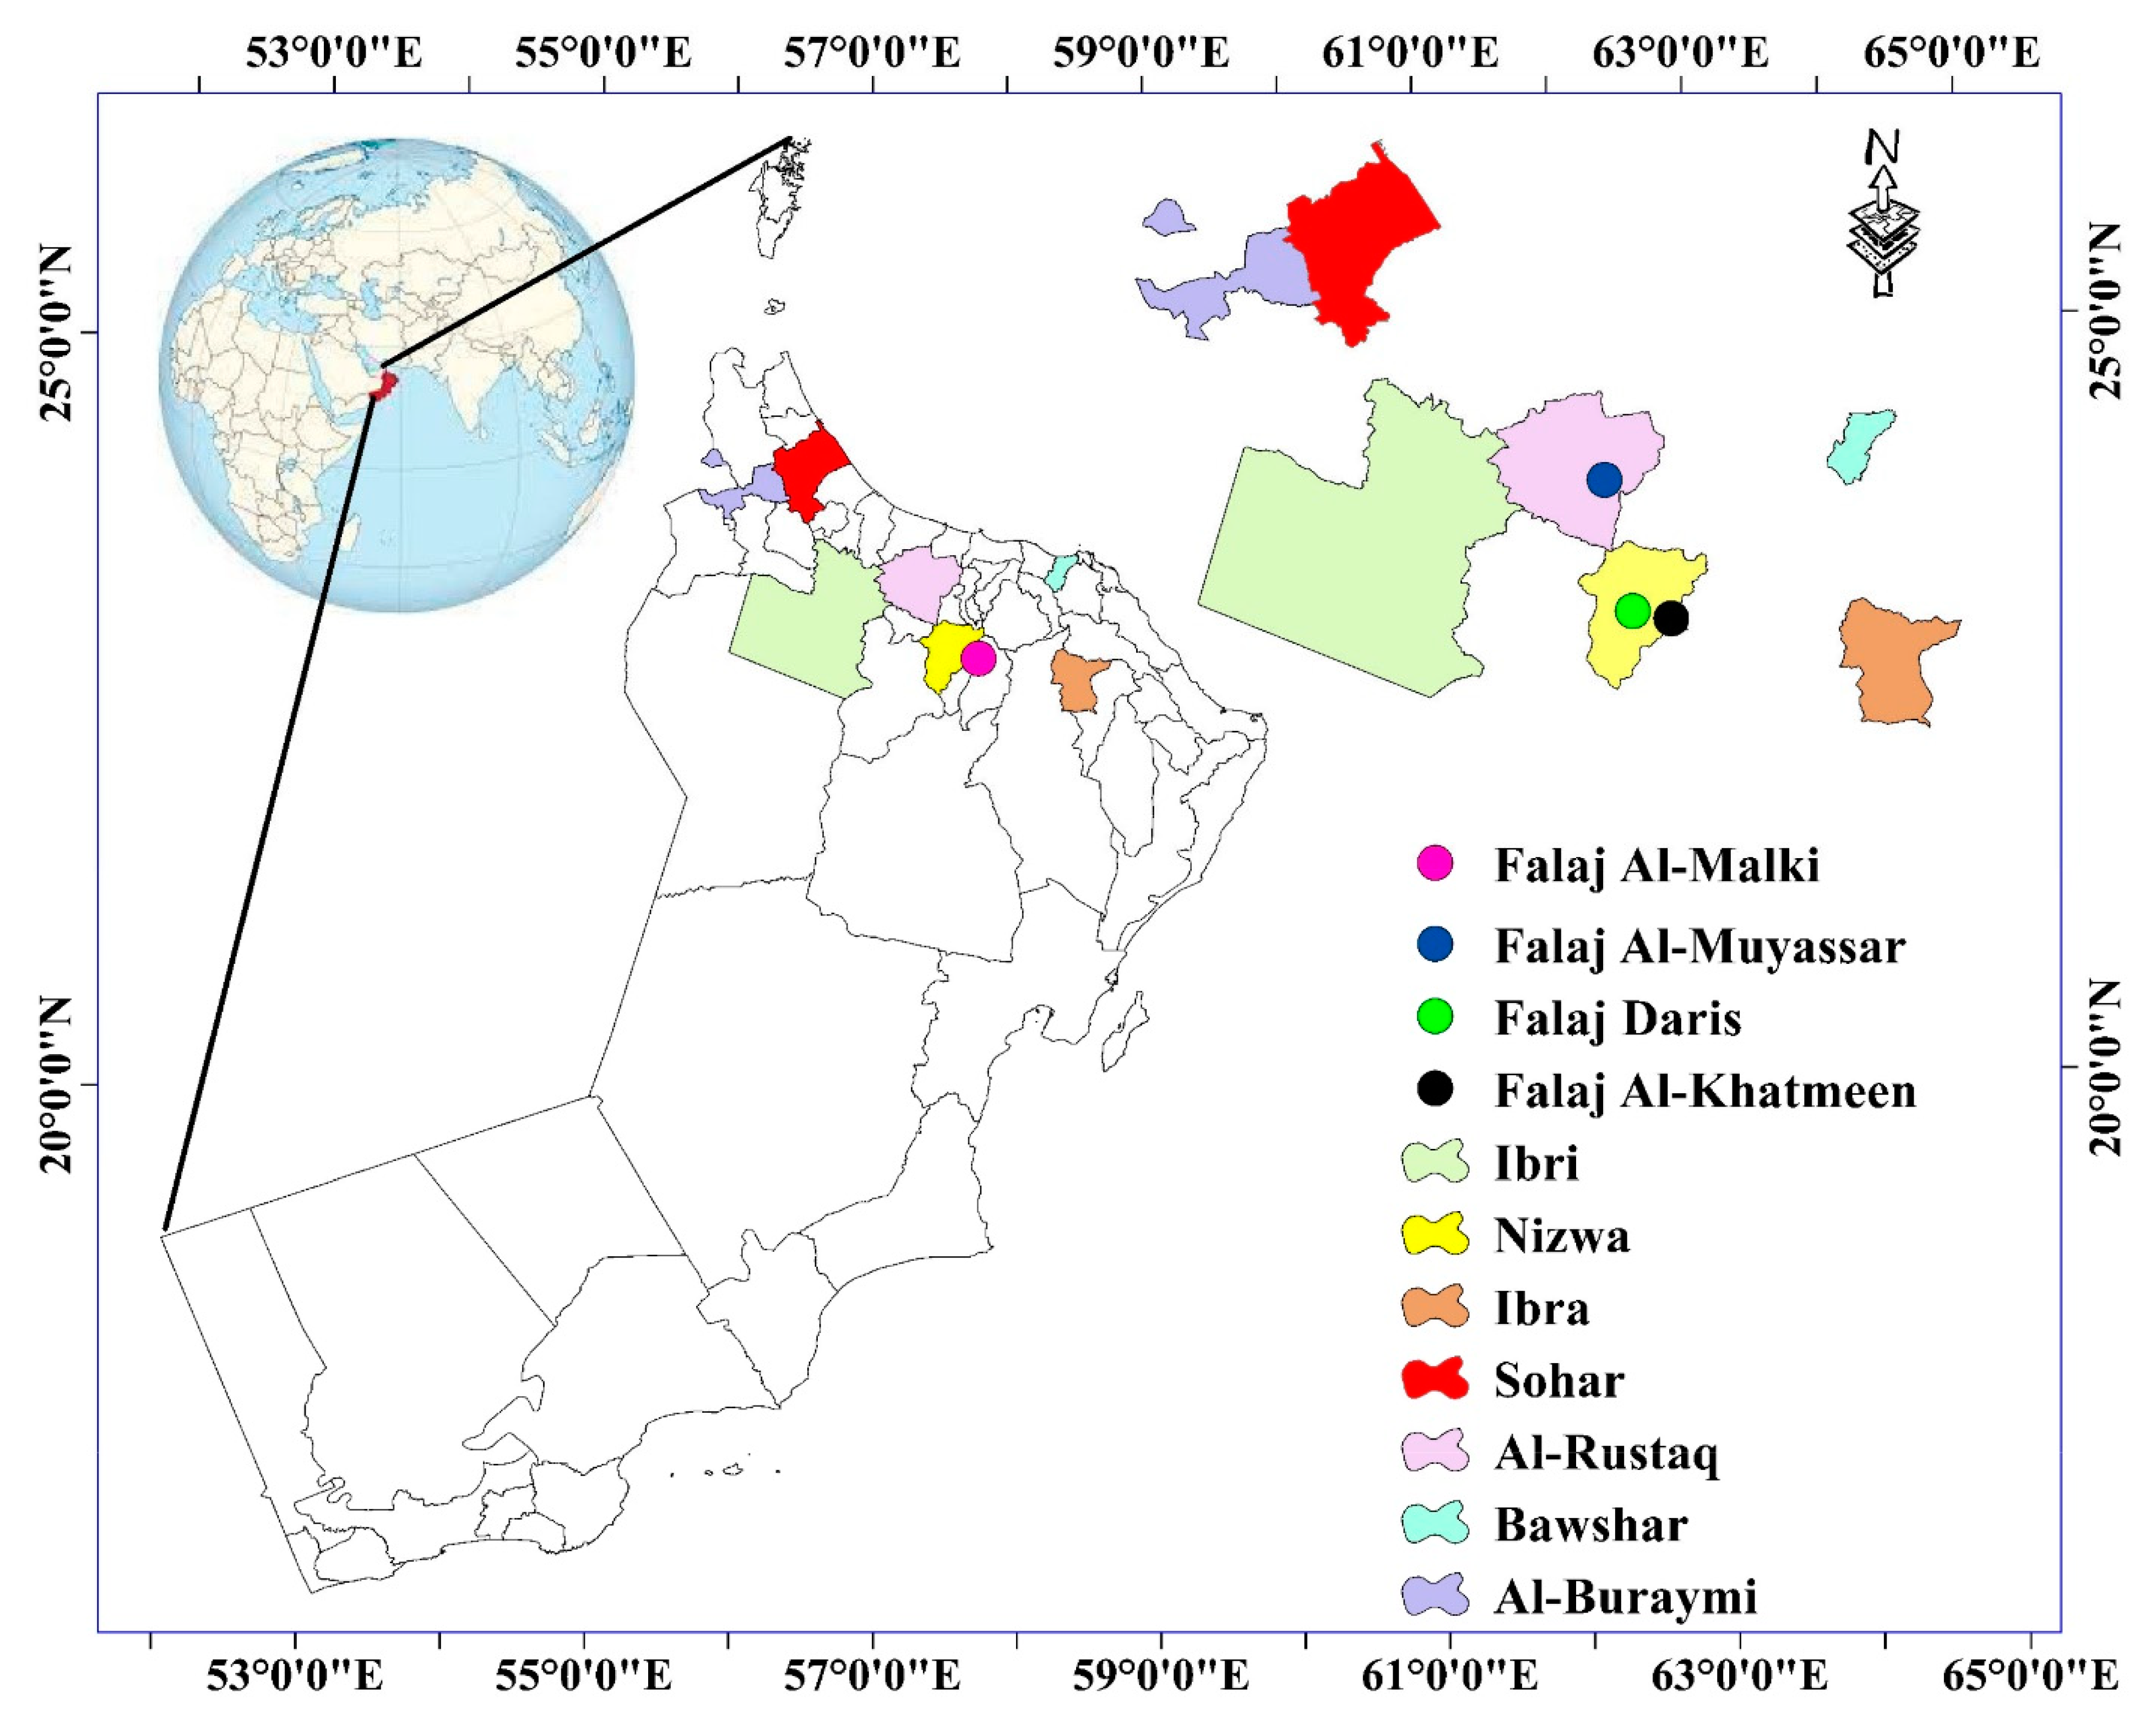
2.1. Study Area

Oman is situated amid arid and semiarid conditions in the southernmost region of the Arabian Peninsula. It features a subtropical, dry, hot desert climate with little annual precipitation, scorching summer temperatures, and significant temperature swings, especially in its interior regions [40]. However, Oman has a wide range of climatic conditions as a result of its varied geography. From May to September, the average temperature in northern Oman is between 32 °C and 48 °C, and from October to April, it ranges between 26 °C and 36 °C. Governorates along the coast experience high summer temperatures of 46 °C and humidity levels greater than 90%. Summertime highs in the interior governorates can exceed 50 °C. Wintertime temperatures range from 15 °C to 23 °C, which is pleasant. With daytime highs between 25 °C and 35 °C and nighttime lows between 15 °C and 22 °C, spring and fall are mild, mainly dry, and pleasant. The major rainy season in northern Oman lasts from December to April and is characterized by brief and intense cloudbursts and thunderstorms. The months of February and March have the highest rainfall rates (35.3–42%). This study covers seven Omani cities: Bawsher, Nizwa, Ibra, Ibri, Sohar, Al-Buraymi, and Al-Rustaq (Figure 1). The most populous, urbanized, and aflaj-rich cities in Oman are located in the north. To determine how LULC affects aflaj systems in the 7 cities within the study area, 1268 samples of the 3 types of aflaj were selected in the first part of the current study.

2.2. Dataset Preparation for Spatial Modeling
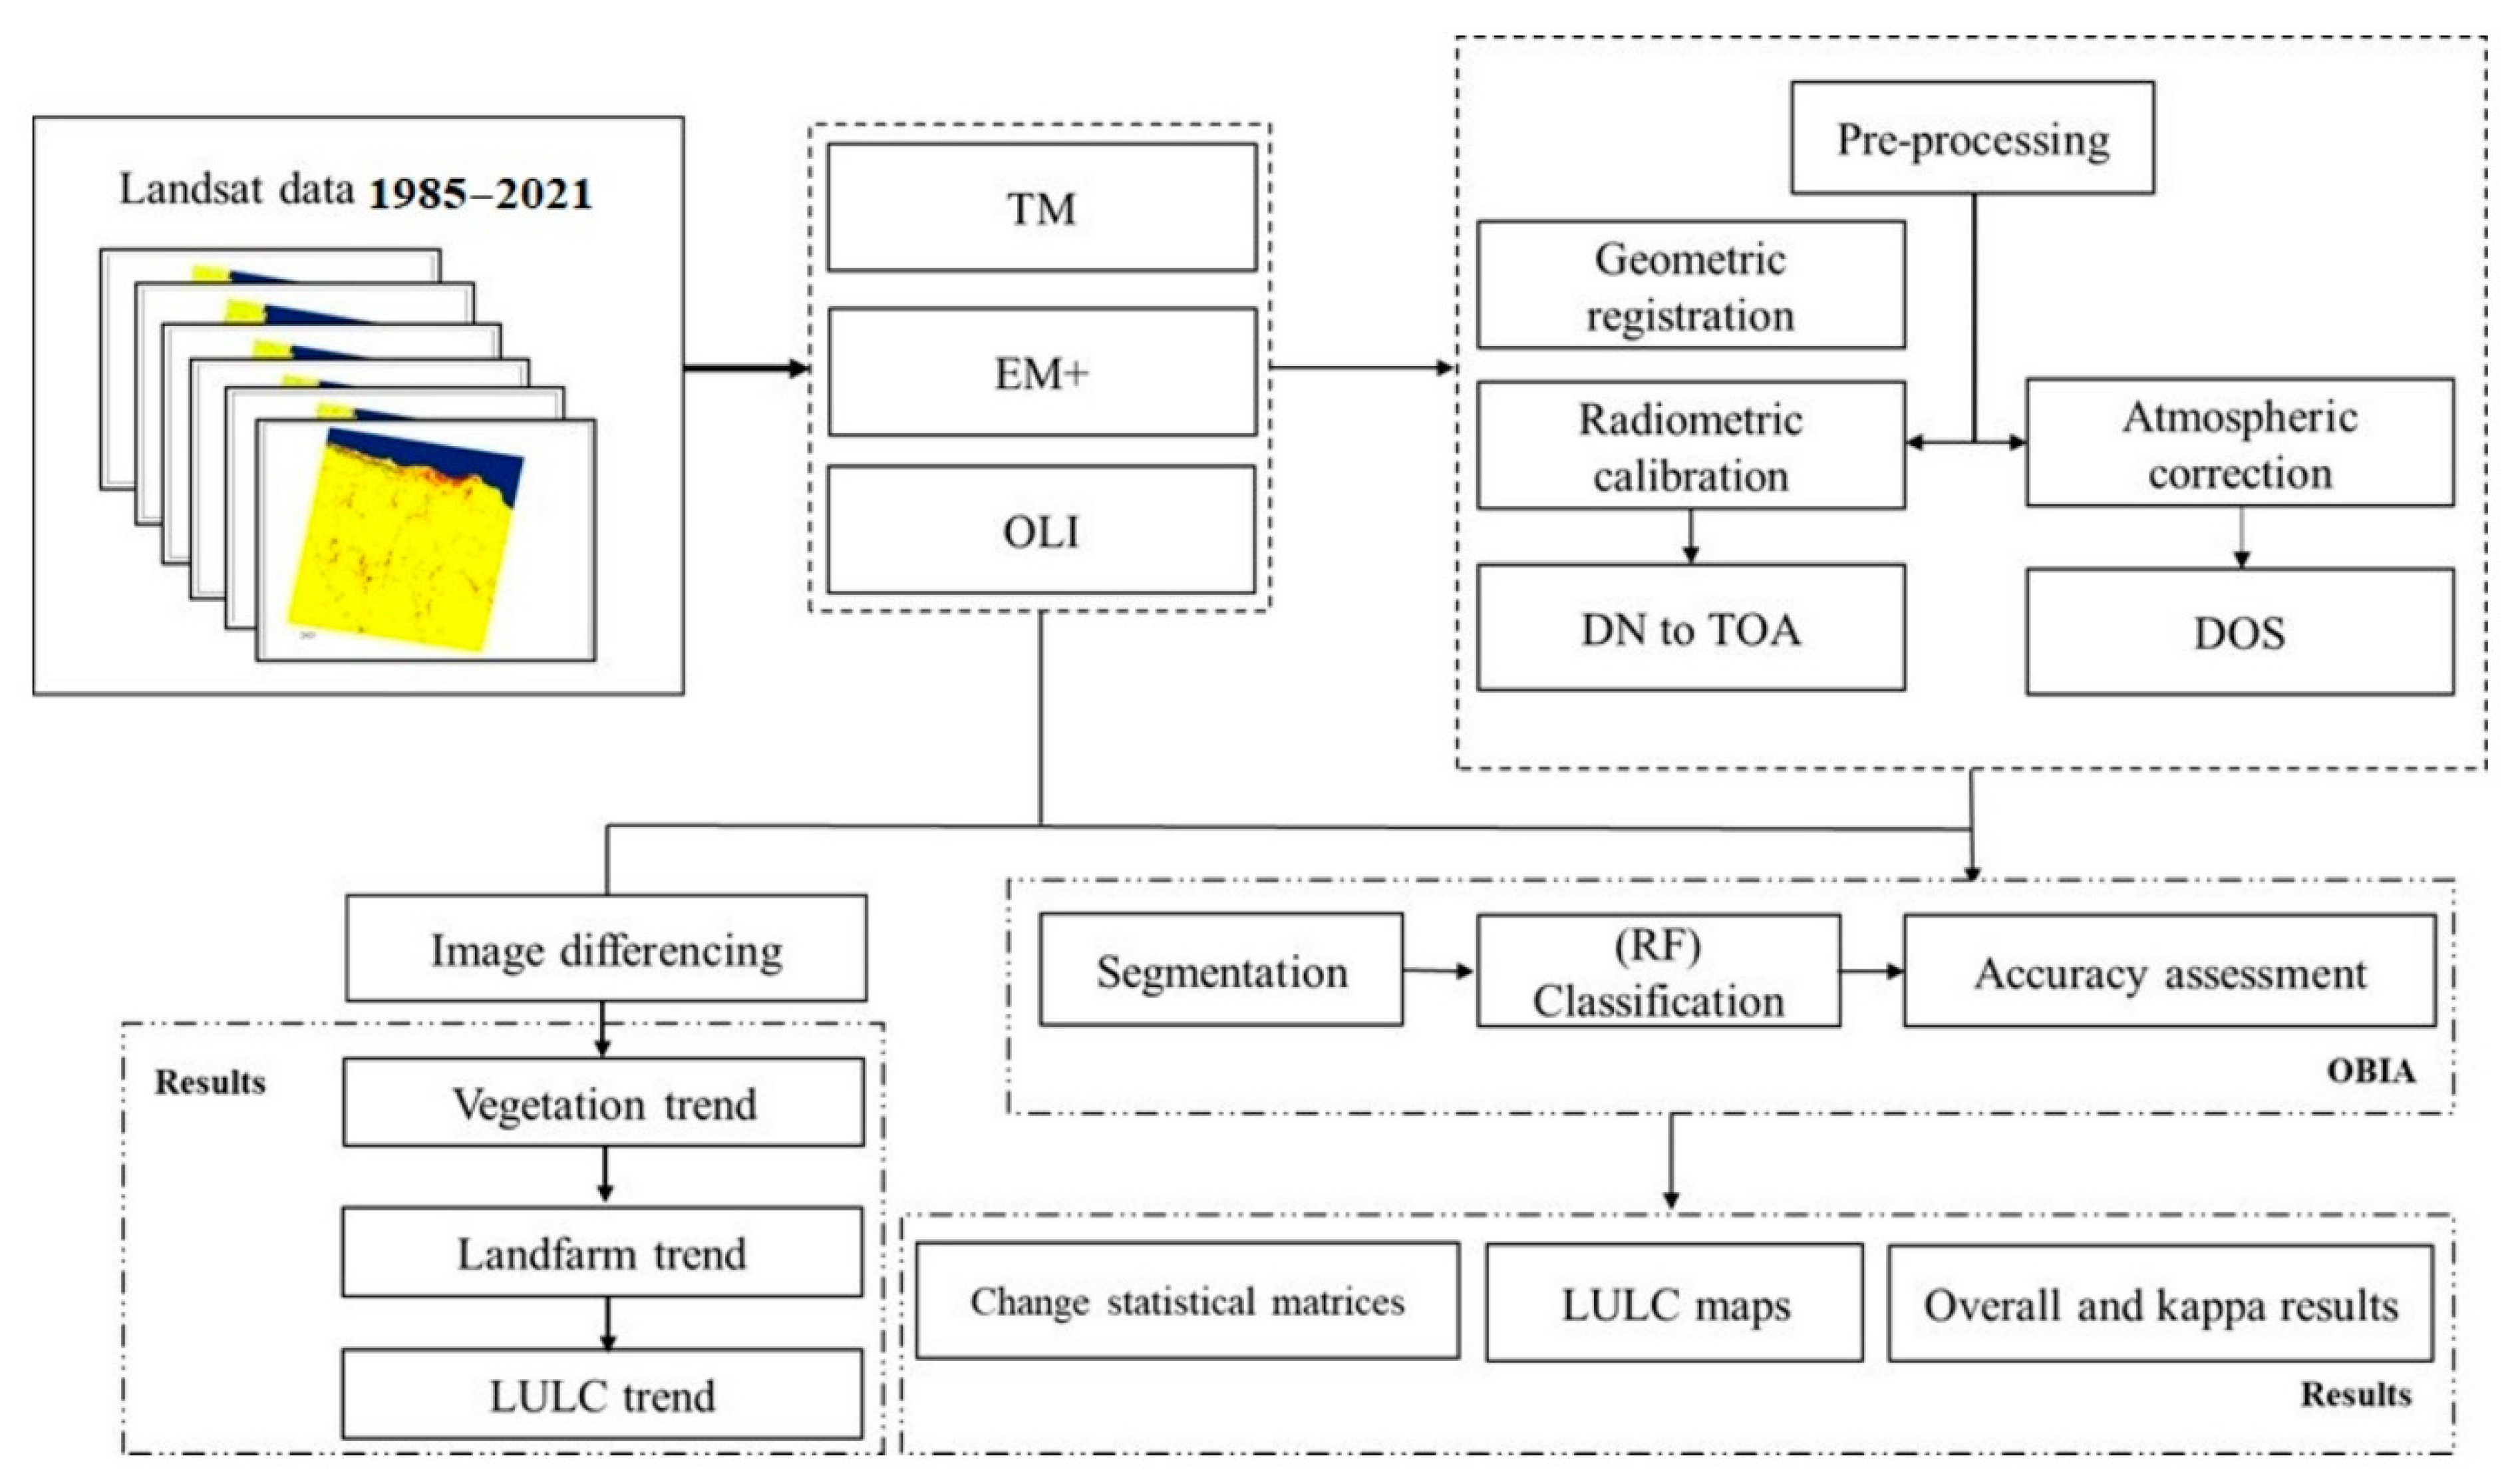
2.2.1. Landsat Data

Figure 2 depicts the sequence of satellite data analyses carried out in the study area. The process involved several stages, including data acquisition, pre-processing, image classification, accuracy assessment, and change detection analysis. These steps were performed to extract relevant information on LULC changes and their impact on the aflaj systems in northern Oman. The flowchart provides a visual representation of the methodology utilized in the study, highlighting the key stages of analysis undertaken to accomplish the research objectives. Landsat images are widely used to quantify urban spatial changes and their impact on groundwater resources [41,42]. The data used in this research were Landsat images selected from 1985, 1990, 2000, 2013, and 2021 (Table 1). The 15 images, including the thematic mapper (TM), enhanced thematic mapper plus (ETM+), and operational land imager (OLI), covered approximately 95,000 km2, which constituted the total study area. The Landsat images were collected and downloaded from the United States Geological Survey (USGS) Global Visualization (GloVis) site (https://glovis.usgs.gov/) (accessed on 20 January 2022).
All images, as level-1 products, were already georeferenced and rectified to WGS 1984 UTM Zone 40N (https://www.nsaom.org.om) (accessed on 30 December 2021). In change detection analysis, it is important to collect images that fall within the same date per year [43,44]. However, clouds and cloud shadows constantly impede the capture of Landsat images [45] in the region. Therefore, efforts were made to collect images within the same weather conditions in the study area. Thus, the collected images were selected during winter (December to February), spring (March to May), and autumn (September to November), during which periods the cloud cover is less than 2% (Table 1). Radiometric corrections, such as Top of Atmosphere (TOA) and dark object correction (DOC), were implemented prior to the analysis using ENVI 5.6 software (https://www.l3harrisgeospatial.com/) (accessed on 10 February 2022).

2.2.2. Image Segmentation and Classification

The object-based image analysis (OBIA) approach was used to classify LULC classes. The initial step of the OBIA approach started with image segmentation, which is a process that divides remotely sensed images into discrete objects based on several elements, such as texture, color, and spatial and spectral characteristics [46]. A multi-resolution algorithm was applied to create objects that delineated the LULC classes. This algorithm used a bottom-up region-merging technique where the groups of similar pixels were merged into large objects based on a scale factor and a heterogeneity criterion [47]. The scale parameter setting for all images was adjusted to 5, whereas the shape and compactness settings were 0.1 and 0.8, respectively. Random forest (RF) classification was used to classify the segmented images. The RF approach is an ensemble classifier that creates a collection of decision trees, by which a subset of training samples and variables is randomly selected [48,49]. RF shows robustness in terms of considering outliners and noise in the classification process. For that reason, the RF classifier has gained acceptance among remote sensing researchers due to its ability to provide accurate land cover classification [50,51,52,53,54]. The RF approach contains three steps: training datasets, bagging setting, and selection of features to create LULC classifications. The training datasets were performed manually for all land cover classes based on the visual interpretation of each image for each land cover class. ArcGIS Pro 3.0 software (https://pro.arcgis.com/) (accessed on 30 March 2022) was used to delineate and label the training samples. Four land cover classes were created: vegetation, water, bare soil, and built-up area. The created sample layer was brought into Developer as a thematic layer for the four classes, which in turn was assigned to the objects using the class name in the attribute table of the thematic layer. Approximately 70% of the samples were used for training, while 30% were utilized for the validation of the model performance. The bagging procedure, as a default approach in Developer, is applied where each classifier in the ensemble is trained on a random subset of a training samples set. The reason for the increase in the number of validation samples is due to the expansion of the study area over time. In 1985, our study area was limited to a specific region, and therefore, the number of validation samples was relatively low. However, as our study expanded to cover a larger area in 2021, the number of validation samples increased accordingly. The selected features were Landsat TM, ETM+, and OLI spectral channels, that is, Channels 1–5 and 7 for TM and ETM+ and Channels 1–7 for OLI images (Figure 2). In addition to Landsat spectral channels, the Normalized Different Vegetation Index (NDVI) was [55] calculated and added as a feature in the classification processes. Image segmentation and classification were performed using eCognition Developer 9.0 software (https://geospatial.trimble.com/ecognition) (accessed on 30 March 2022).

2.2.3. Accuracy Assessment

An accuracy assessment [56,57] was carried out for each land cover classification. Accurate samples were created independently for each class. The validation samples were selected using a stratified random sampling method. For each date, several samples were created: 900 samples for 1985, 1039 for 1990, 1428 for 2000, 1800 for 2013, and 2113 for 2021. The confusion matrices of all classified images were calculated and presented for each land cover class for 1985, 1990, 2000, 2013, and 2021 (Figure 2).

2.2.4. Change Detection

Change detection analysis was performed using the post-classification comparison approach. Post-classification comparison is a widely used technique for detecting LULC changes using either pixel-based image analysis or an object-based approach [58,59,60]. It can produce a complete matrix of changes and provide a detailed ‘from-to’ change analysis. It can also minimize the atmospheric effects, sun angle, environmental effects, and sensor differences between the two dates of observation. Four-time intervals—1985–1990, 1990–2000, 2000–2013, and 2013–2021—were compared and analyzed for LULC change detection (Figure 2).

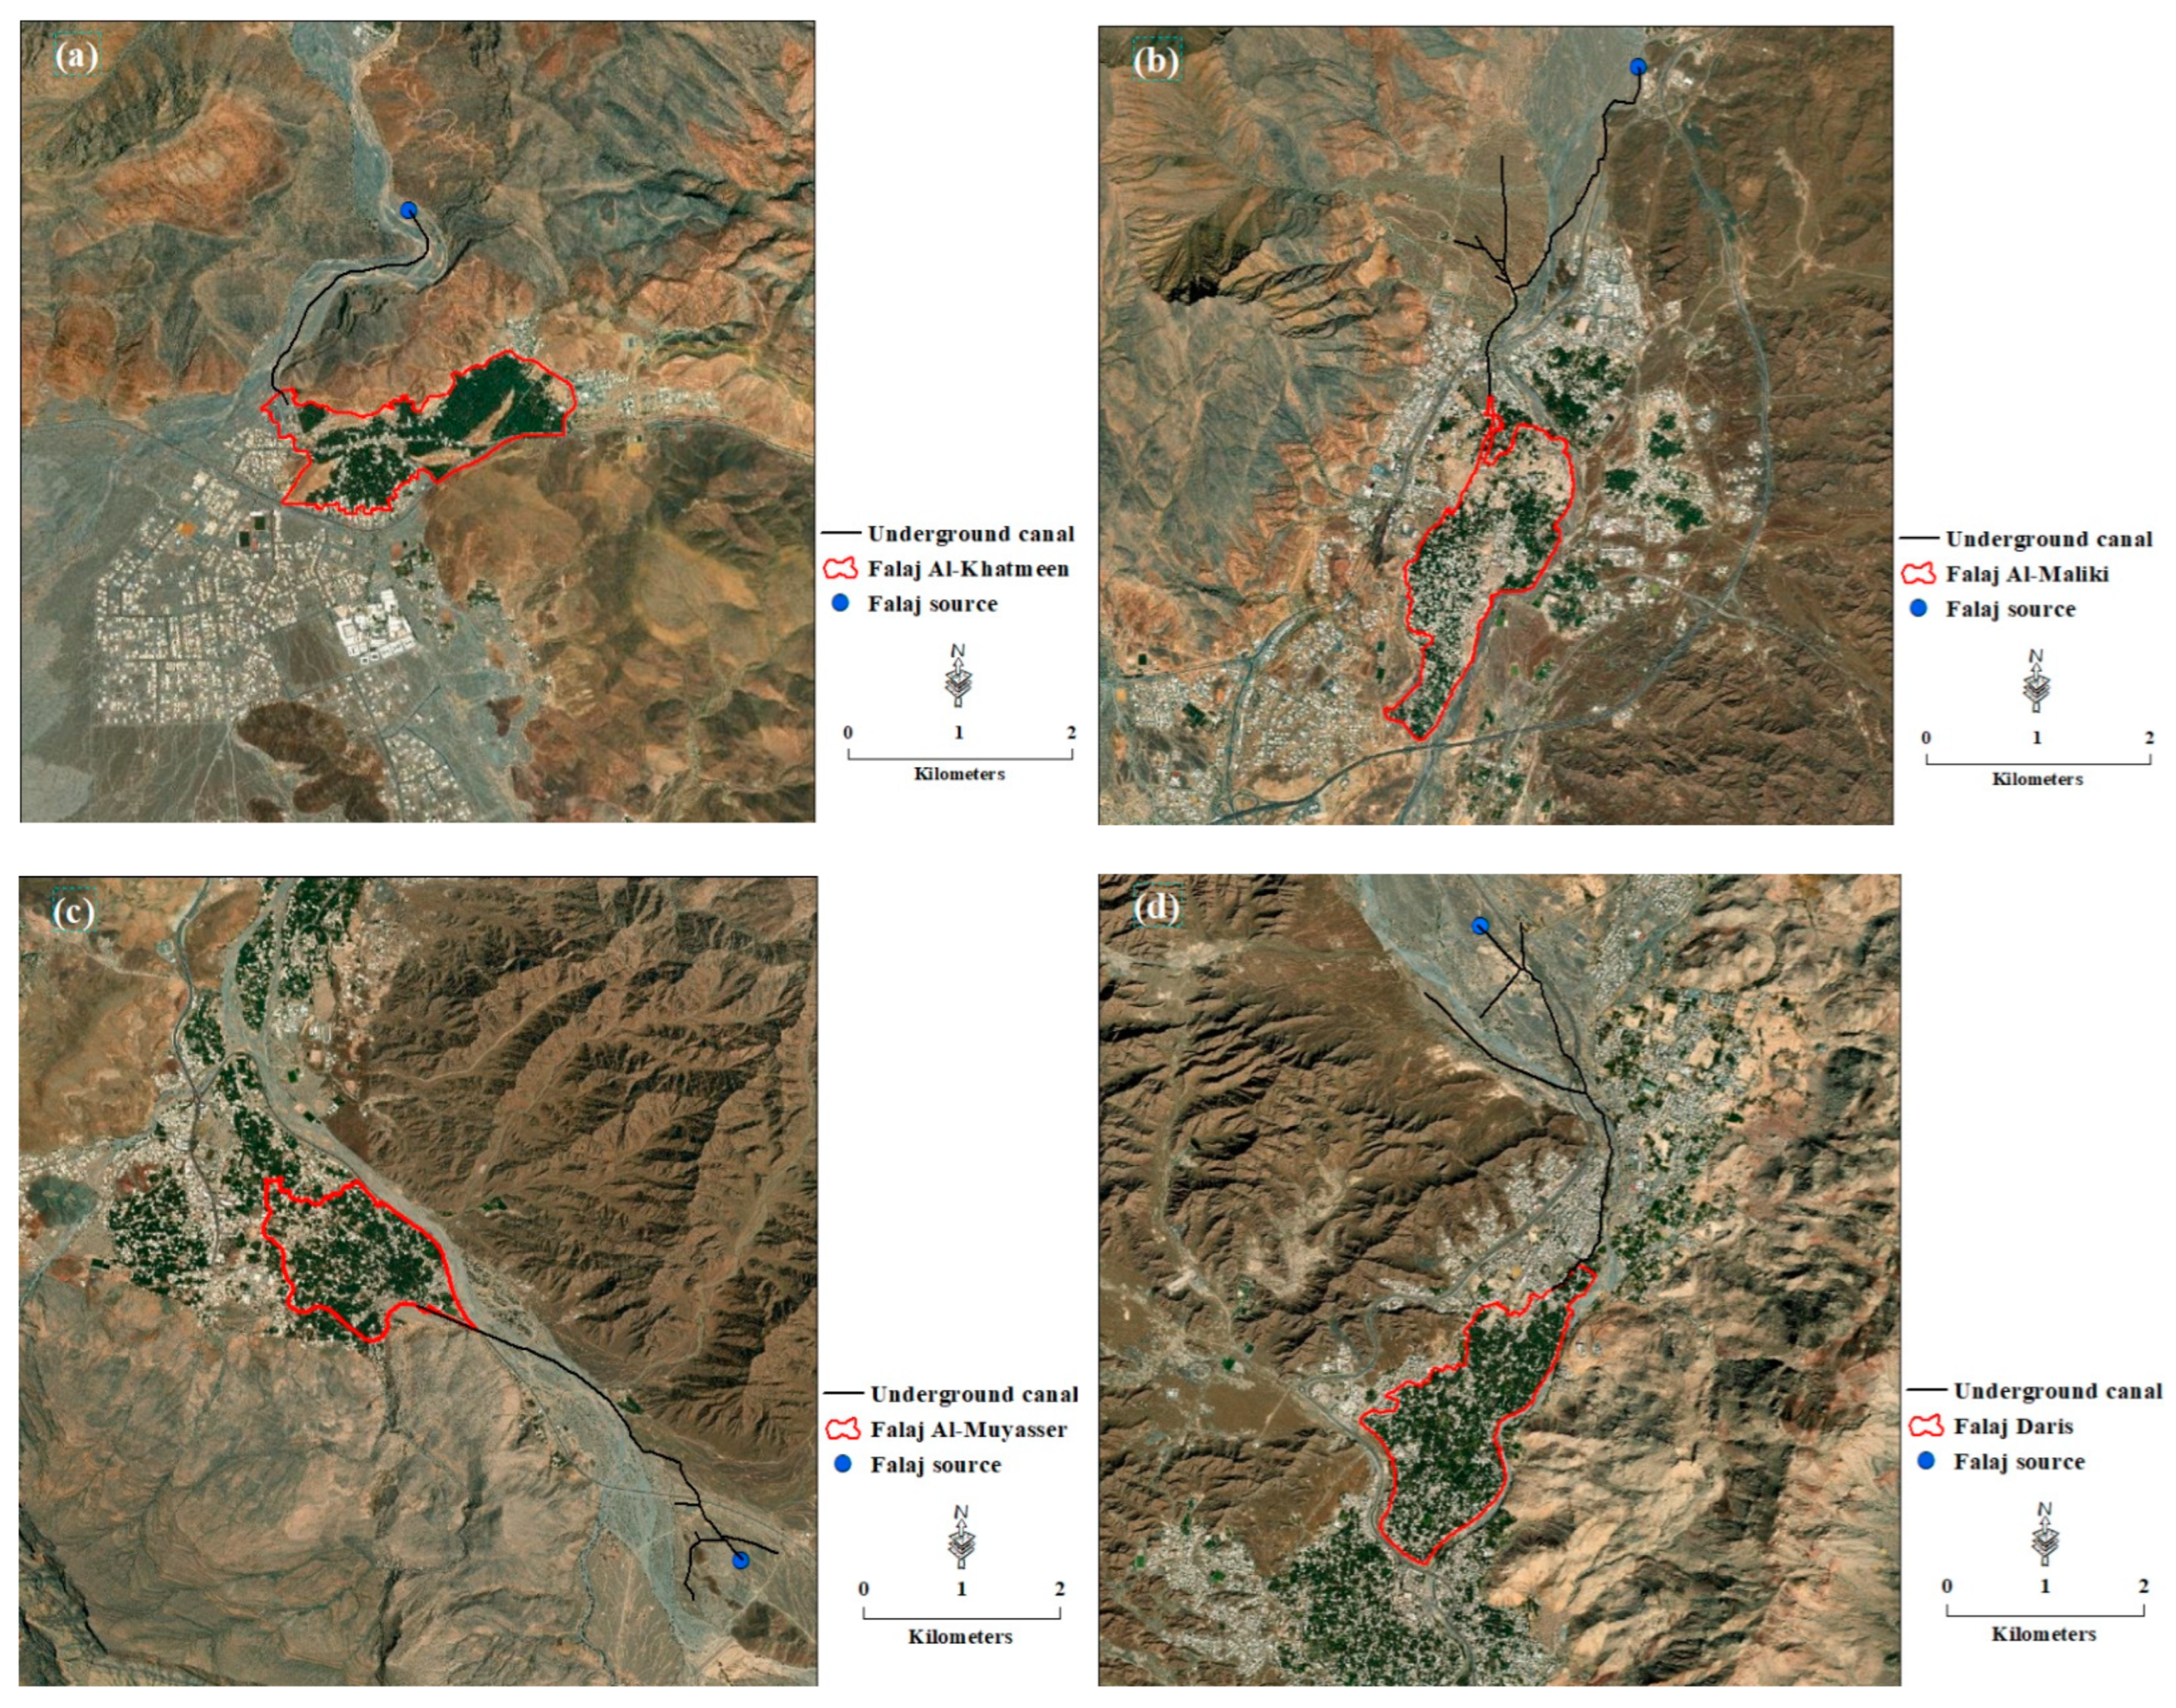
2.2.5. Changes in LULCs and Their Impact on Four Key Dawoodi Falajs

Since the aflaj were historically utilized for permanent date palm cultivation, we identified the land areas for date palm canopy, urban regions, and soil in 1985 to assess how LULC altered in this area between 1990, 2000, 2013, and 2021. The selection of falaj for the study was based on essential data points, including the falaj source; whether underground, open, or covered canals; the areas for agricultural and domestic utilization; ground truth data; the coverage area of the falaj; the total cultivated area irrigated by the falaj; high-quality and dense data for palm plantations in these areas; and the total length of its branches. Consequently, we chose four aflaj, namely, Al-Khatmeen (Figure 3a), Al-Maliki (Figure 3b), Al-Muyasser (Figure 3c), and Daris (Figure 3d), to quantify how much has changed within each selected falaj in the study area. These aflaj are listed in the World Heritage List [61] and are considered dawoodi aflaj in the interior region (see Figure 3).
In terms of their structure, these aflaj are quite old, with water channels and beams carrying them and engineering techniques used to excavate them. Furthermore, water was extracted from considerable depths, a process that is currently costly and can only be achieved through advanced technology. These aflaj were instrumental in creating an ancient civilization comprising residential settlements surrounding the falaj vicinity. This civilization developed an agricultural system that involved cultivating diverse food crops and vocational industries that have persisted to this day.

2.2.6. Euclidean Distance Function and the Direction of Urban Expansion Tools

The Euclidean distance function (EDF) calculates the straight-line distance from each cell to the nearest source. EDF can be used to determine allocation and to calculate distance and direction to the nearest source [62]. The mothers of the aflaj sources (bounds) were used to determine the starting points for the distance surface. The EDF tool was used to determine how much urban activity occurred within each of the mother falaj bounds in the study area. The mother falaj bound is a circle with a radius of 3500 m (https://www.maf.gov.om, accessed on 7 December 2022). A falaj is a channel cut into the ground or on its surface to collect groundwater, spring water, or natural springs or to intercept and collect surface water runoff and distribute it through subchannels to be used for various purposes. A falaj can run as long as several kilometers, and the depth of the aflaj systems is built to carry groundwater from elevated areas down to the target sites. The EDF analysis tool can be used to delineate the vulnerable areas or zones of high risk (i.e., hotspots) in a region. It can also be used to identify an emerging new region around a known feature. The direction of urban expansion in the seven cities was measured between 1985 and 2021 using a compass of cardinal and intercardinal directions and distance from the city center. In ArcGIS Pro 3.0, the cardinal and intercardinal directions were drawn using a bearing distance. Starting from the north and working clockwise, the lines extended from the city center at 45° intervals. Buffer zones were created for each city at 5 km intervals from the city center. Topographic maps were used to establish the city center of each city.

3. Results

3.1. Accuracy Assessments

The results of the accuracy assessments revealed high overall accuracies, ranging from 95% to 97% for all the classified images. Among the classified images, the 1985 image exhibited the lowest overall accuracy (95%), while the 2000 classified image had the highest overall accuracy (98%), as demonstrated in Table 2. With respect to individual classes, the urban areas (UAs) exhibited the lowest producer accuracy (81.5%). However, during 1985, the user accuracy was 100%, indicating that all pixels classified as urban area (UA), or build-up represented UAs in the ground truth. All the other classified images displayed high user and producer accuracies for all classes, as presented in Table 2. Accurate identification of UAs from other LULC categories poses a significant challenge owing to the inherent heterogeneity of urban landscapes. Urban regions exhibit a complex mixture of diverse land cover types, including buildings, roads, and green spaces, which often manifest as intricate patterns that are difficult to discern from one another using remote sensing data alone [63]. Furthermore, urban areas’ spectral signatures are prone to rapid fluctuations over prolonged durations due to changes in building materials, vegetation cover (VC), and other dynamic factors, thereby impeding the accurate classification of UAs.
In our study, we investigated the efficacy of using remote sensing data to identify urban areas and compared the accuracy of different LULC categories over an extended time period. We found that the accuracy of identifying urban areas improved slightly when using a more recent image obtained in 2021, compared to an image acquired in 1985. This finding could potentially be attributed to the changes in building materials and vegetation cover over time that contribute to the variability in spectral signatures. Despite this slight improvement, the overall accuracy of identifying urban areas remained lower than that of other LULC categories. Our results suggest that identifying urban areas from remote sensing data remains a challenging task, and additional efforts are required to develop more robust techniques that can account for the heterogeneity and dynamics of urban landscapes.

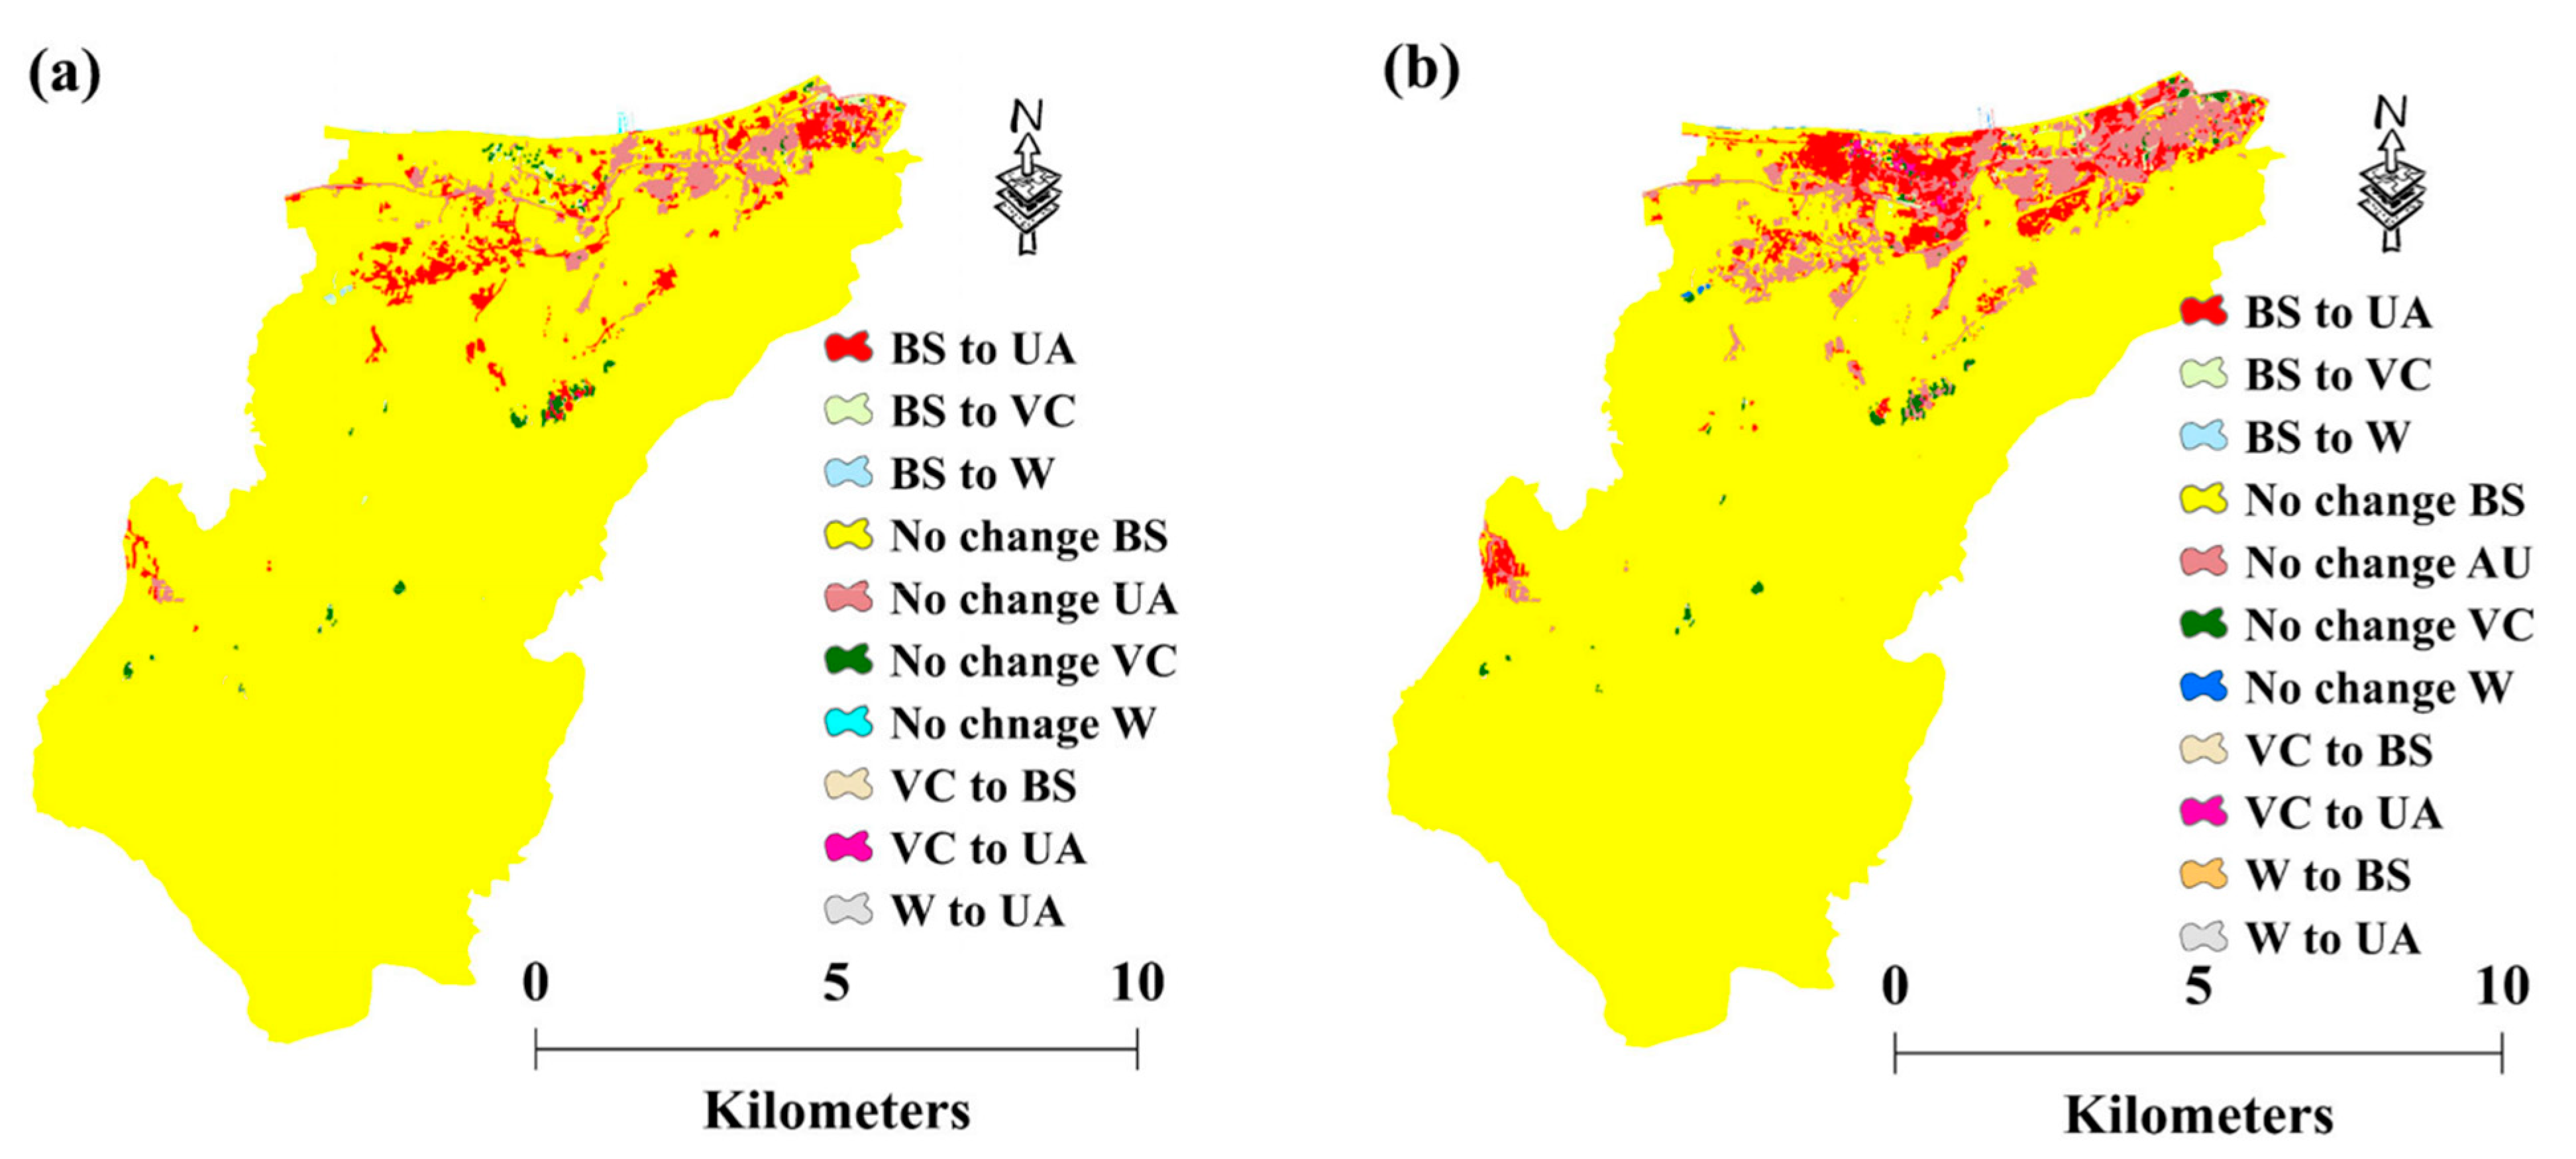
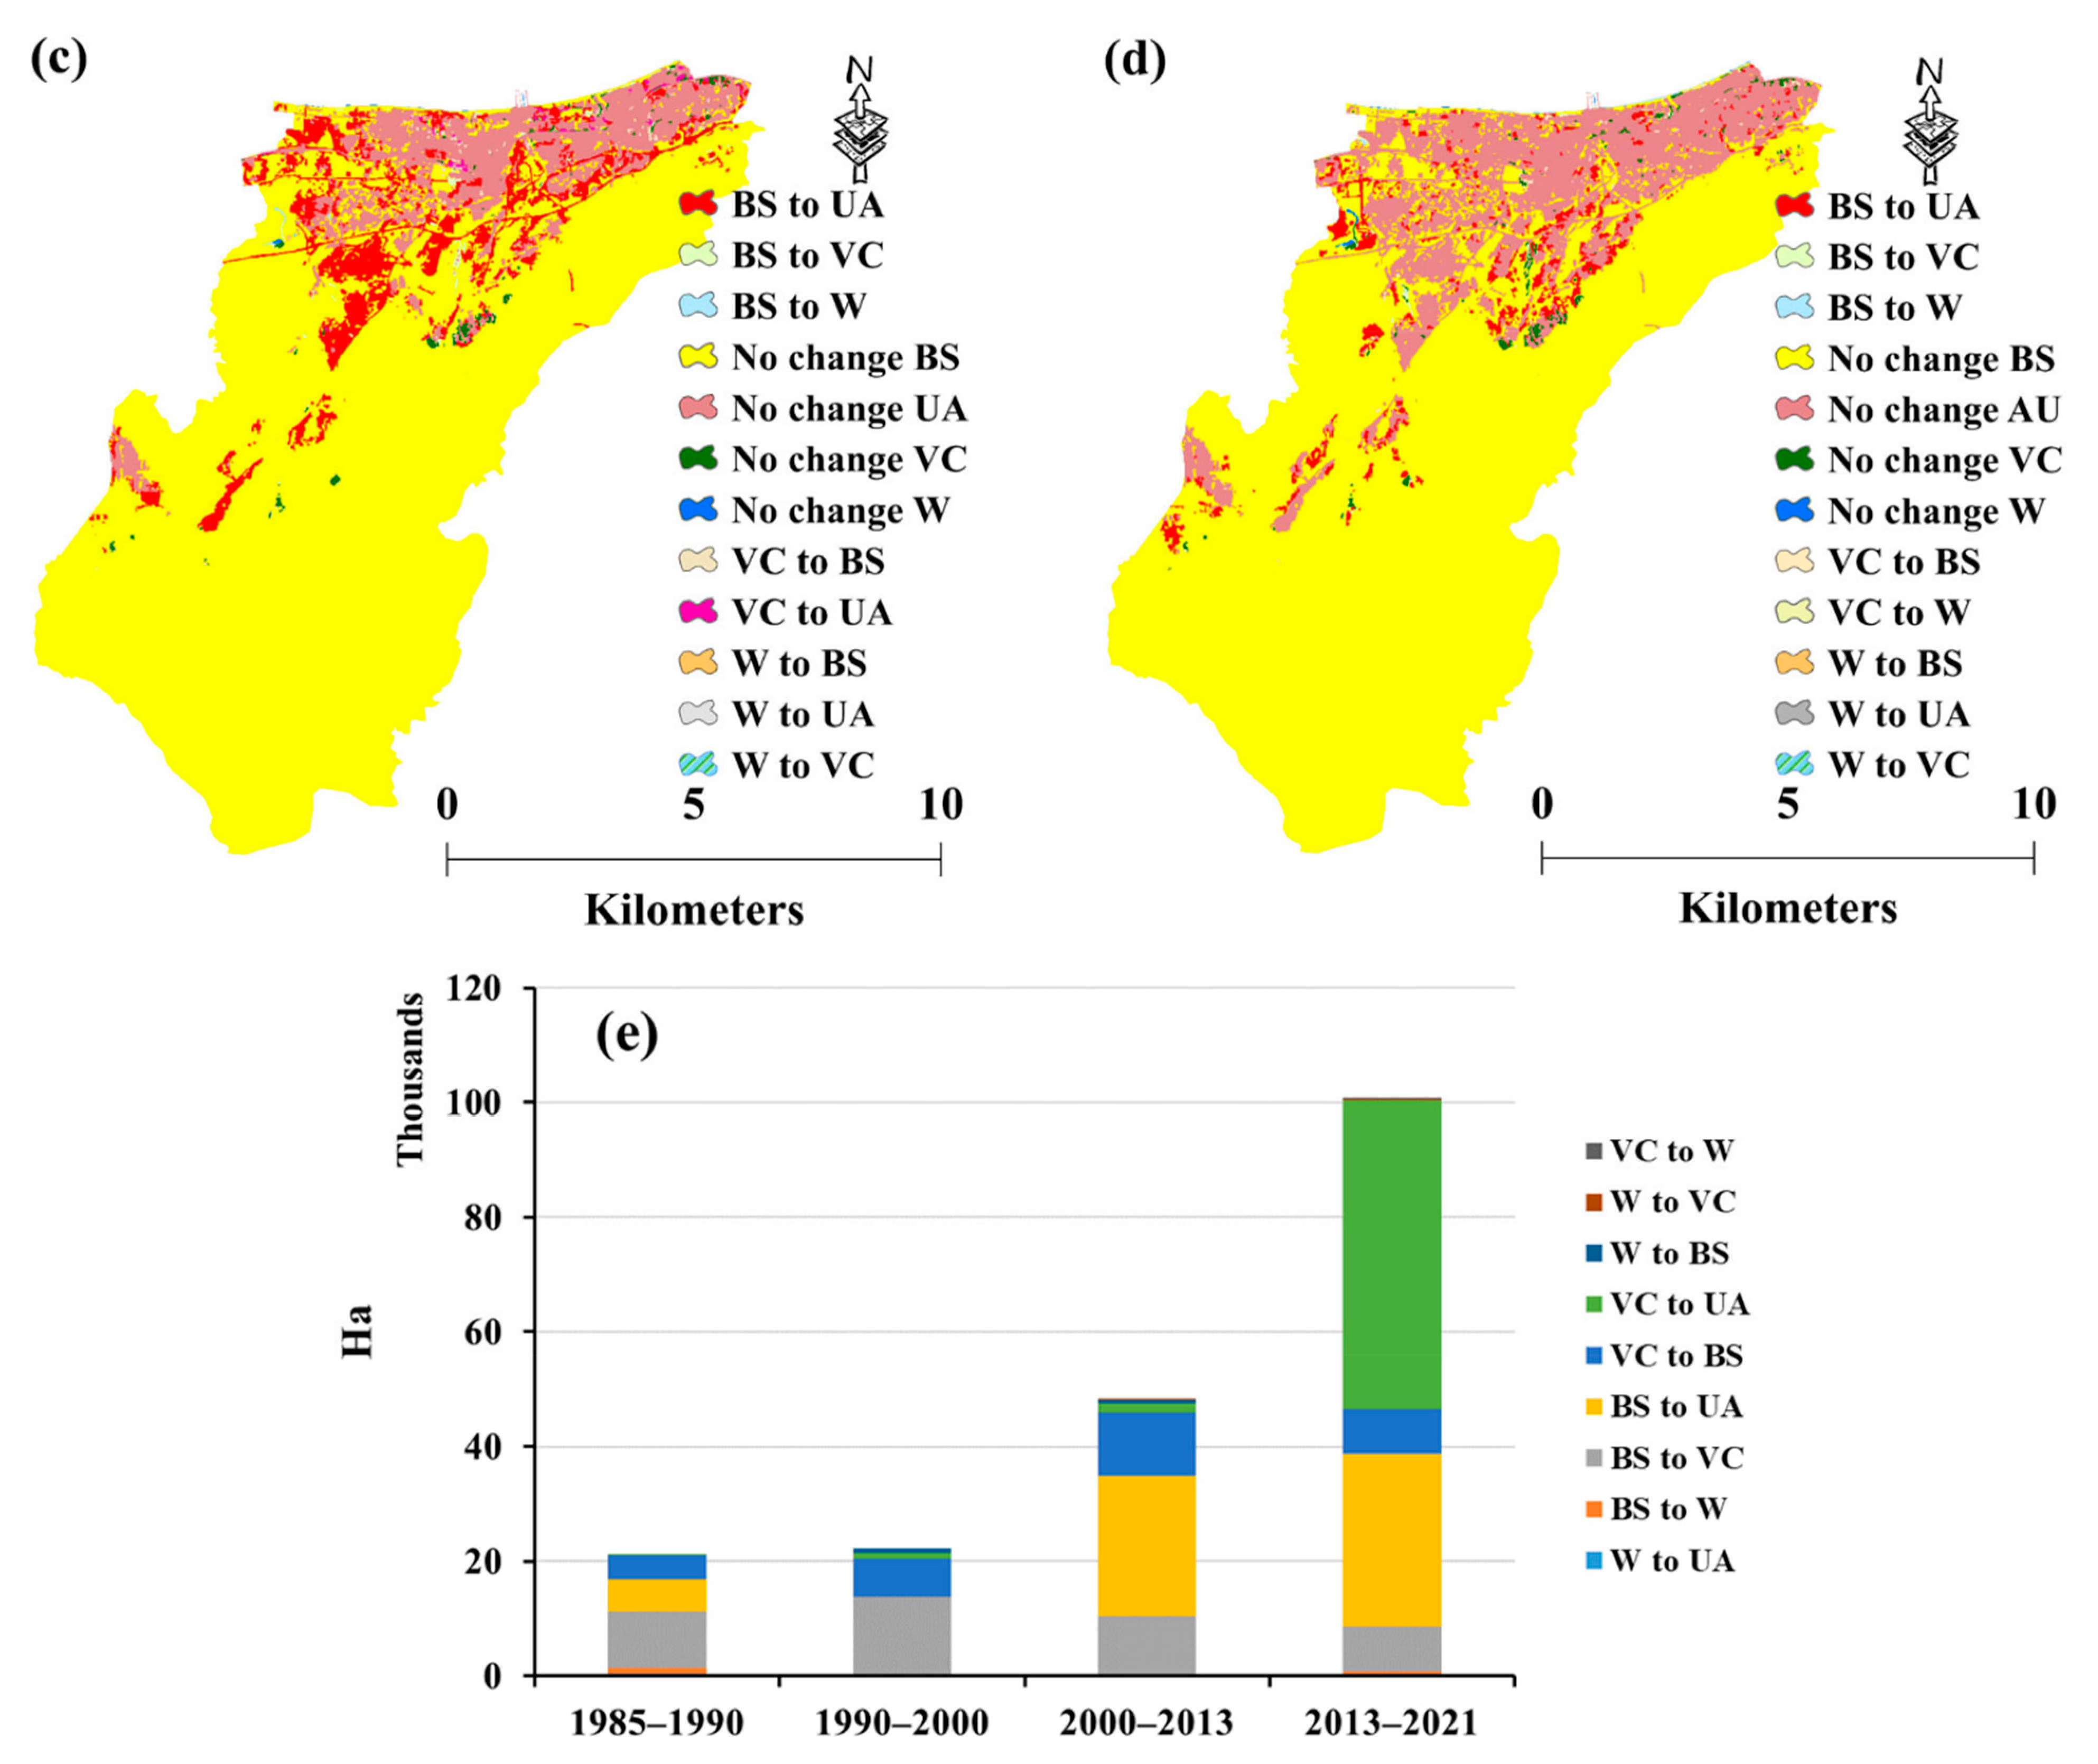
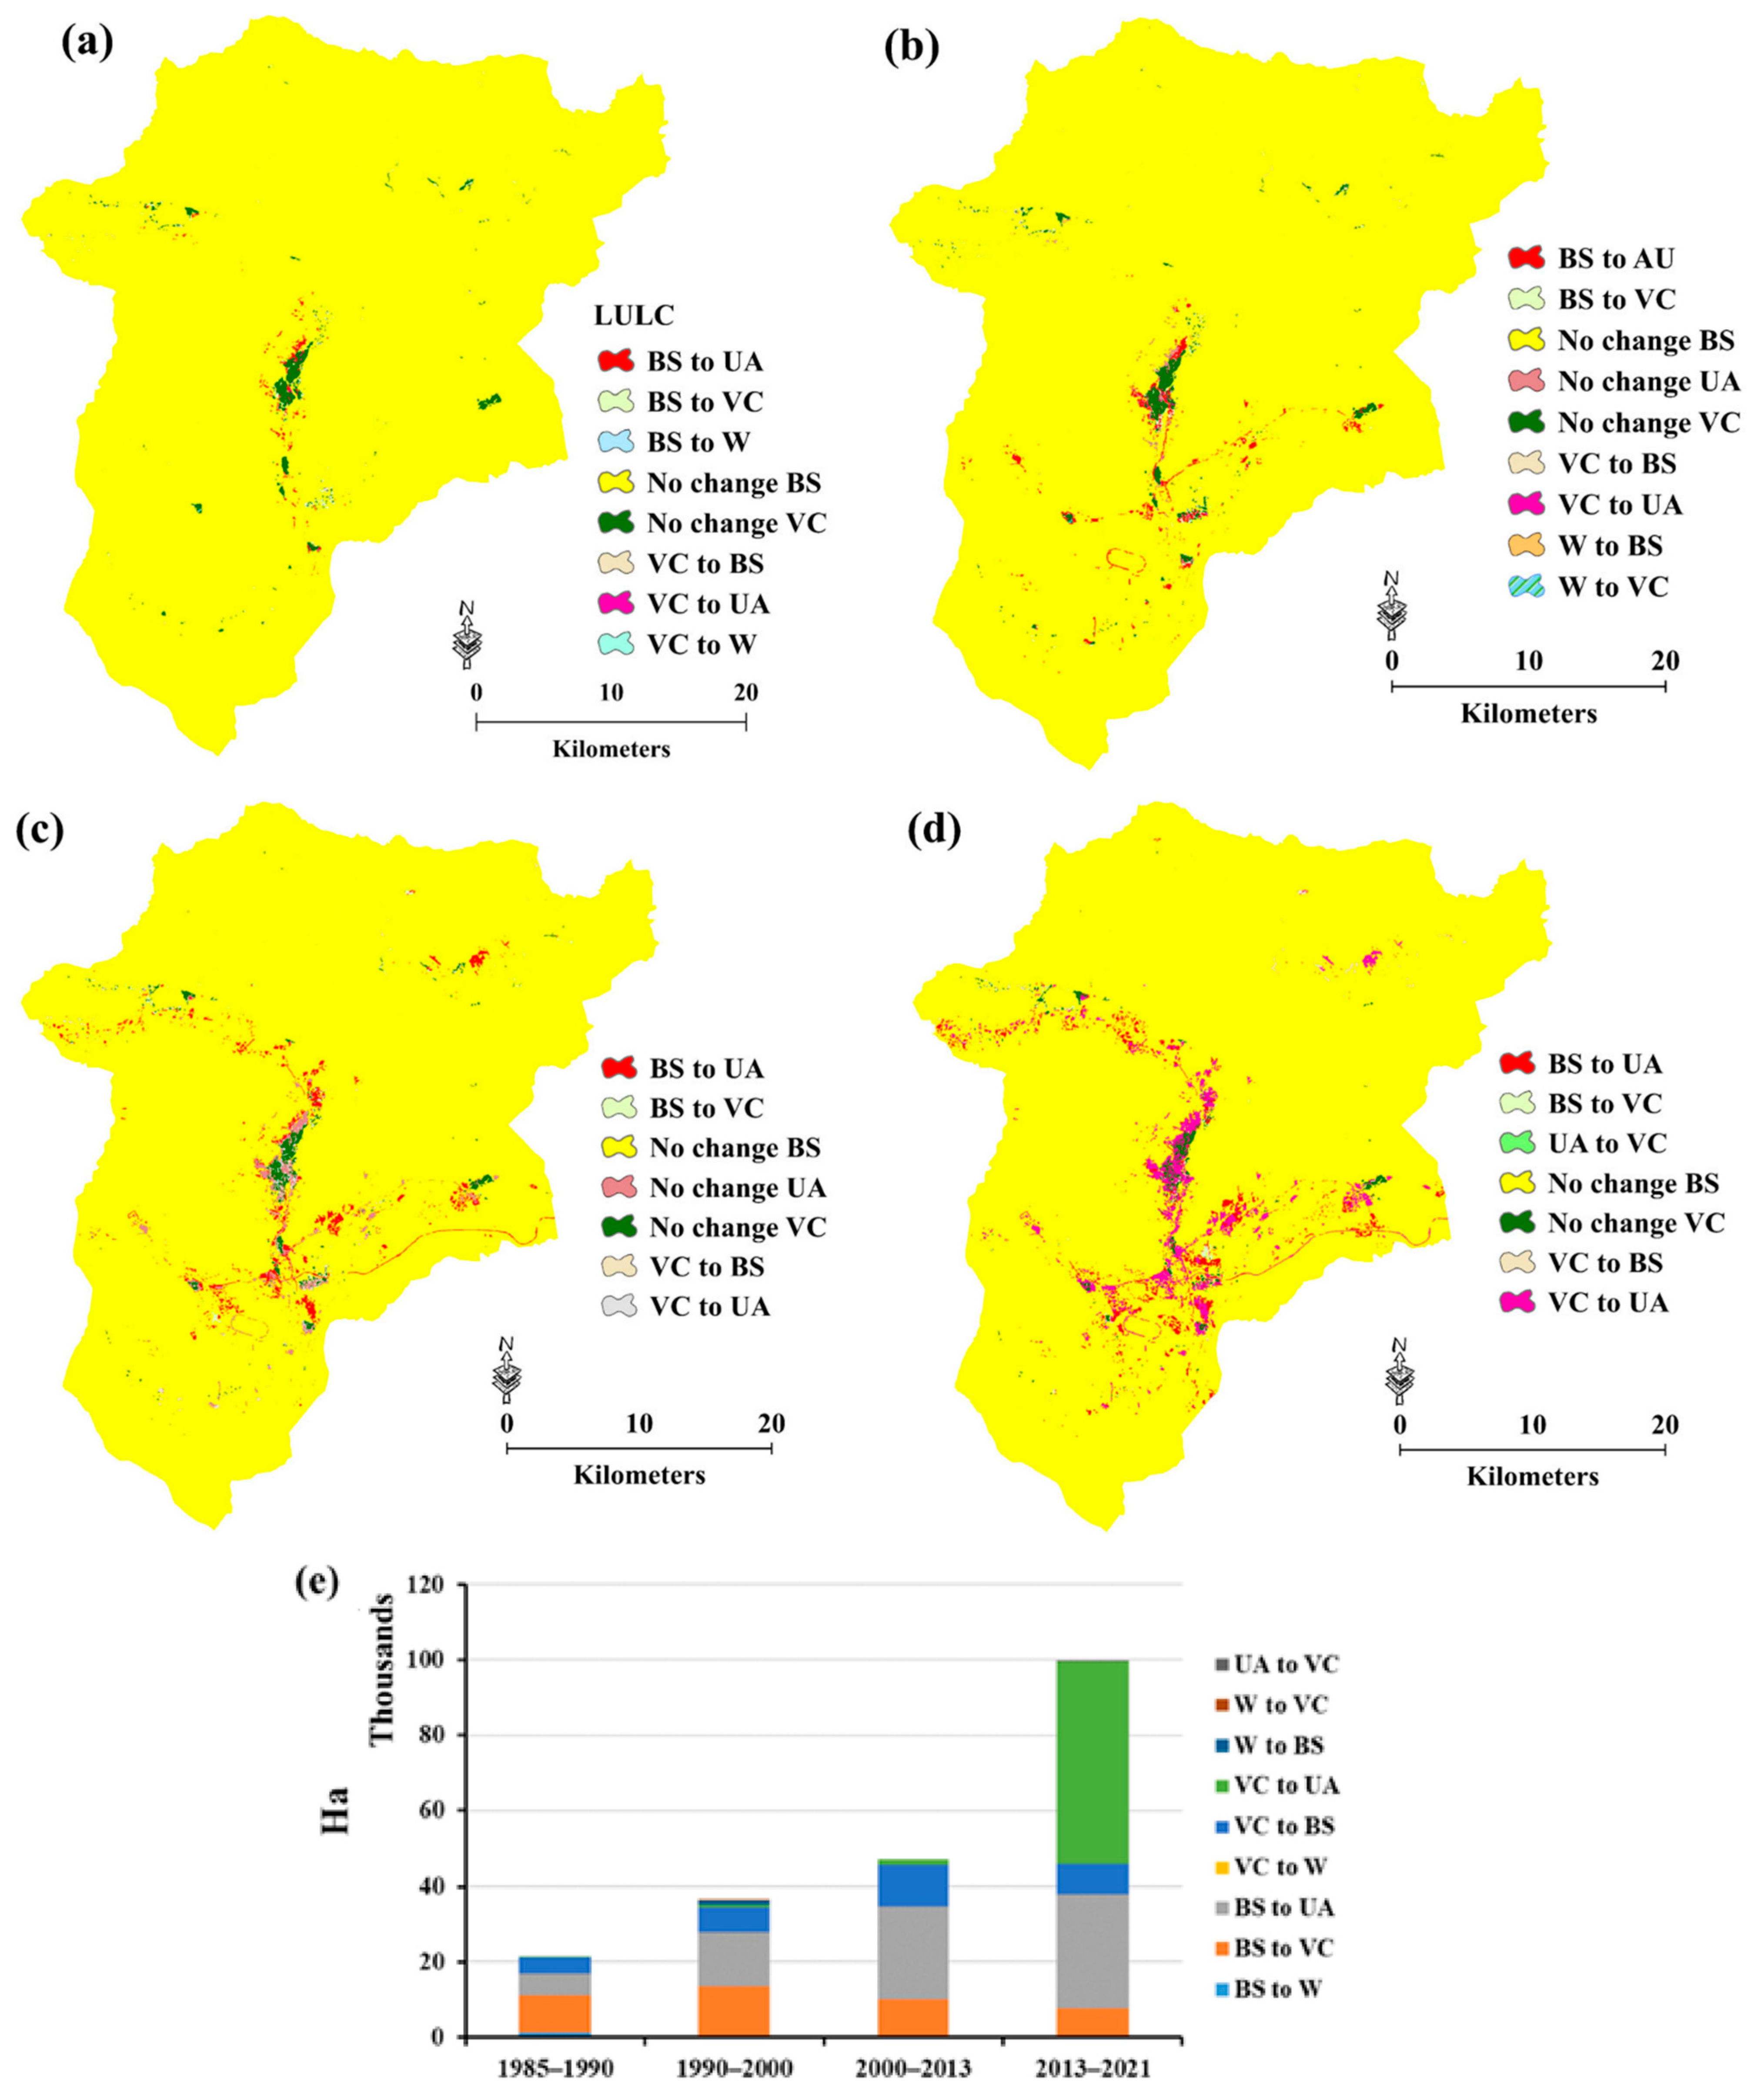
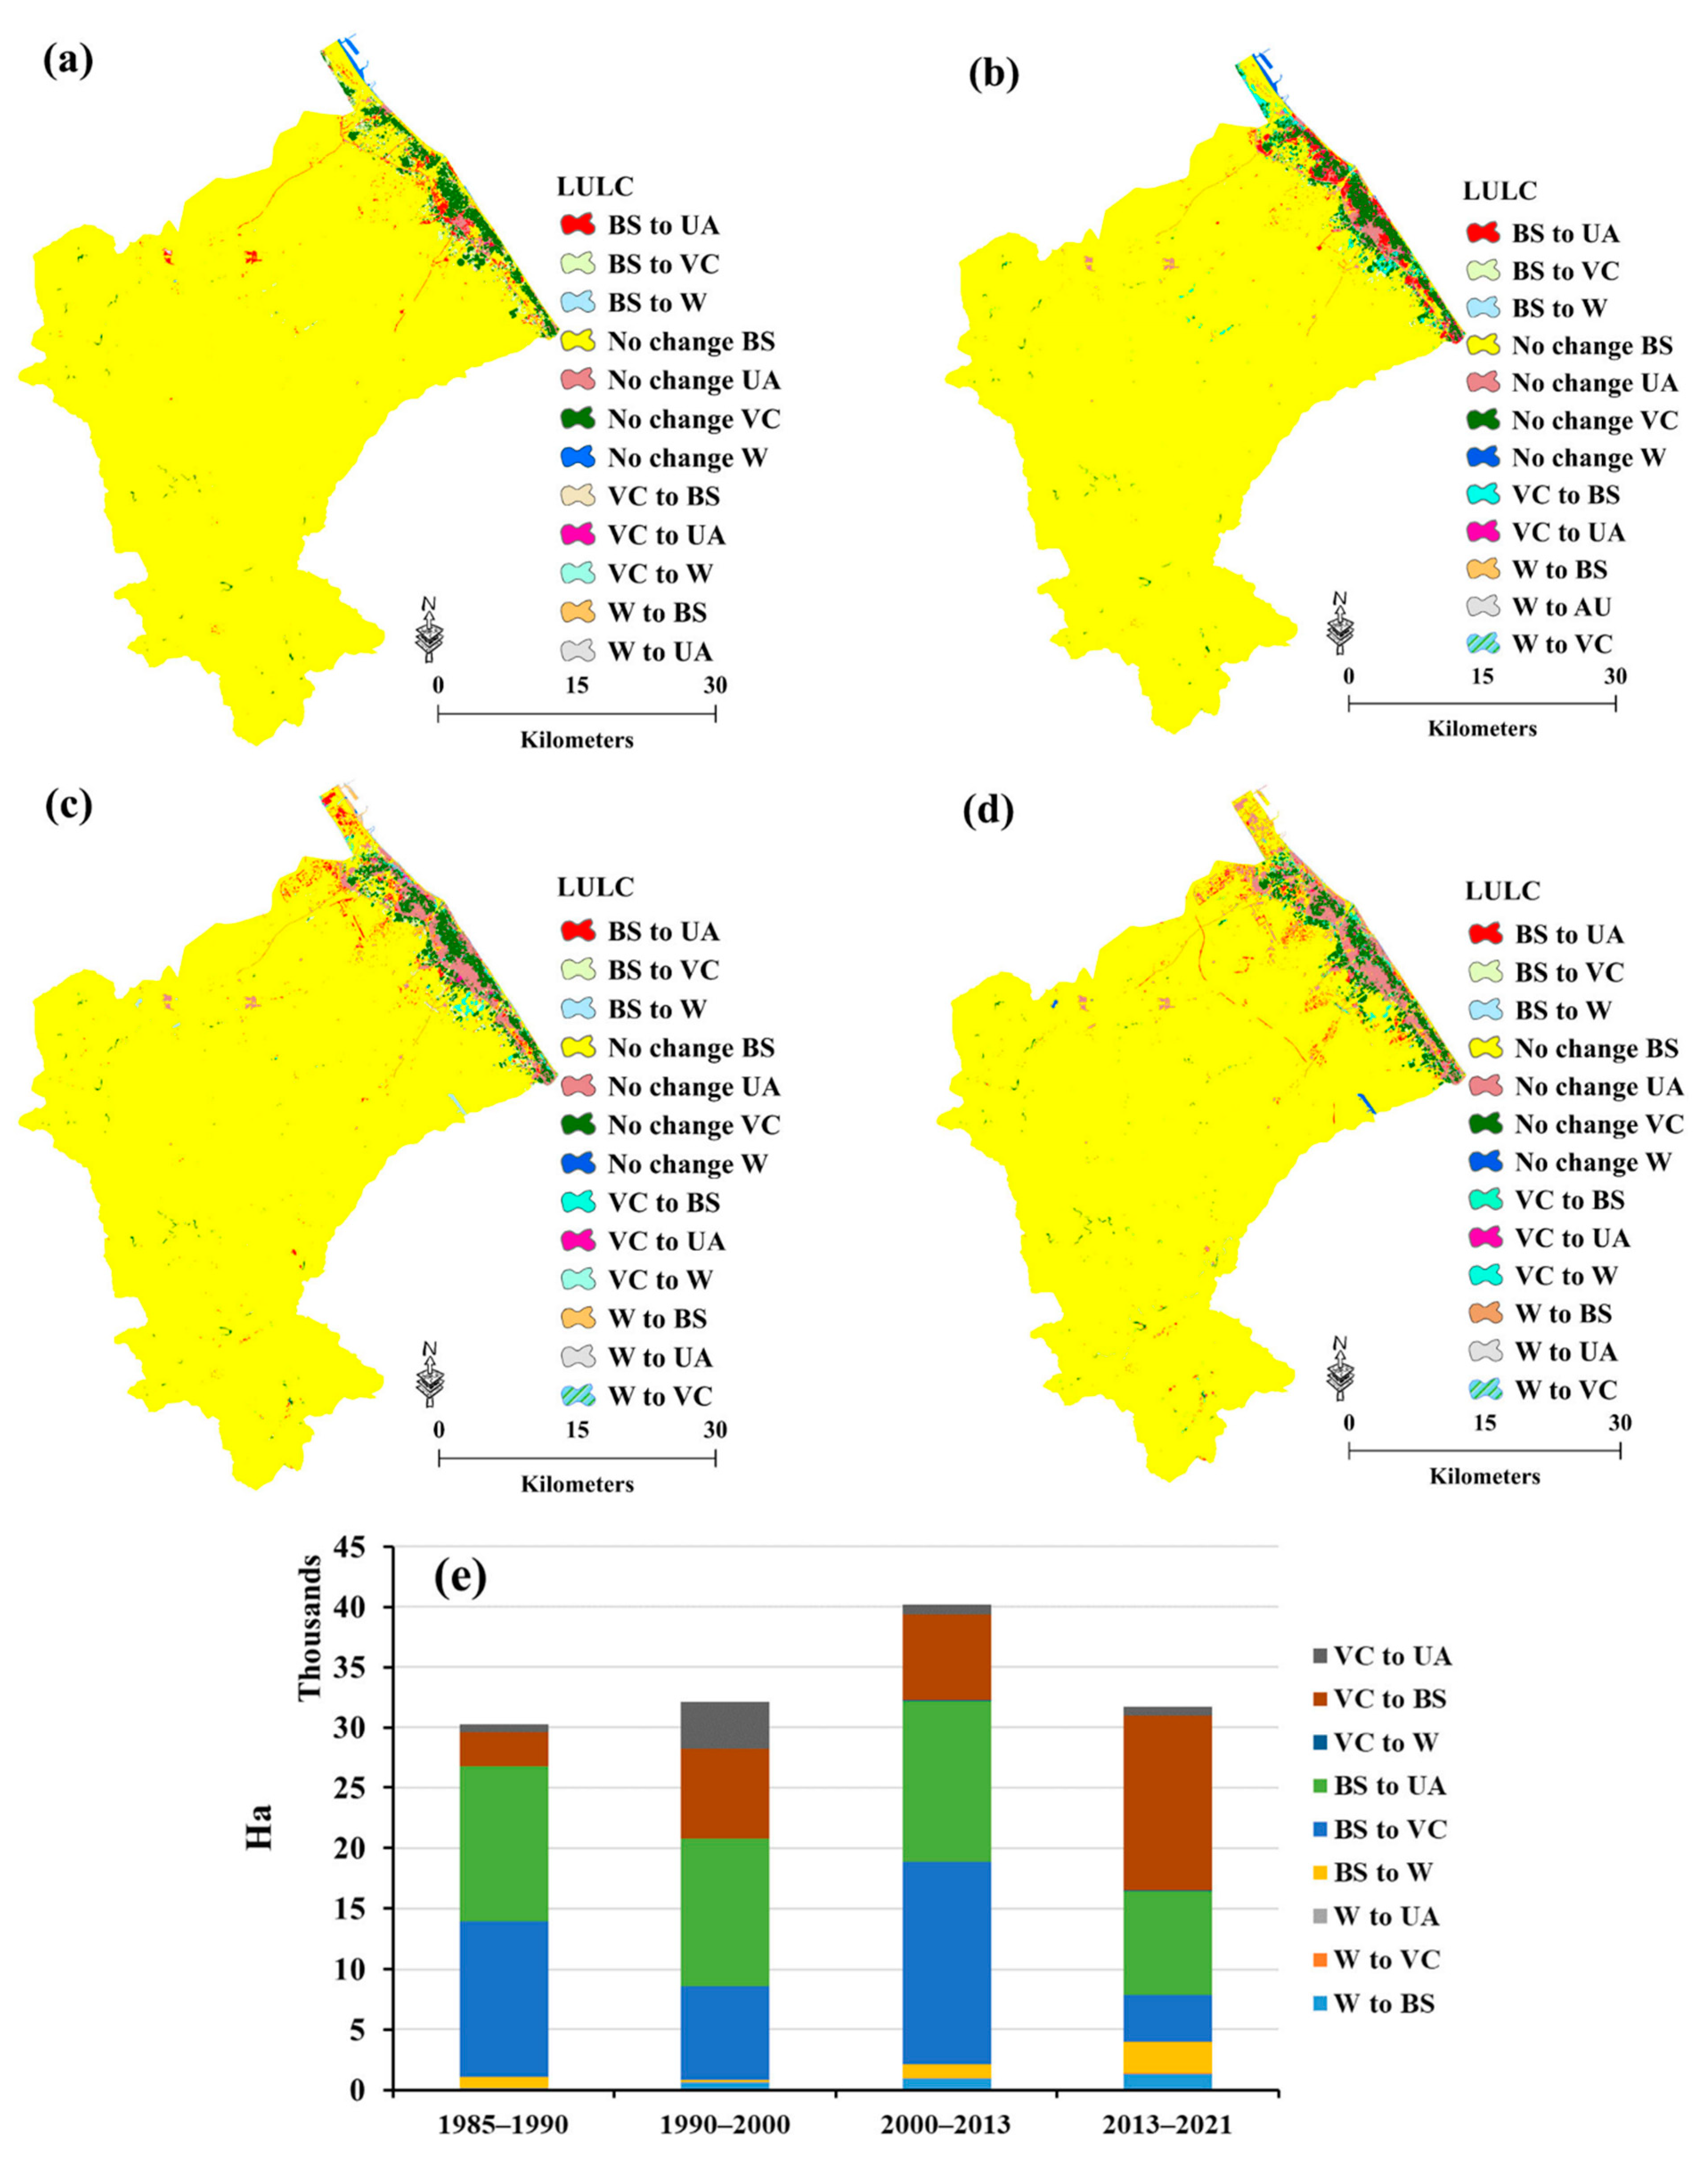
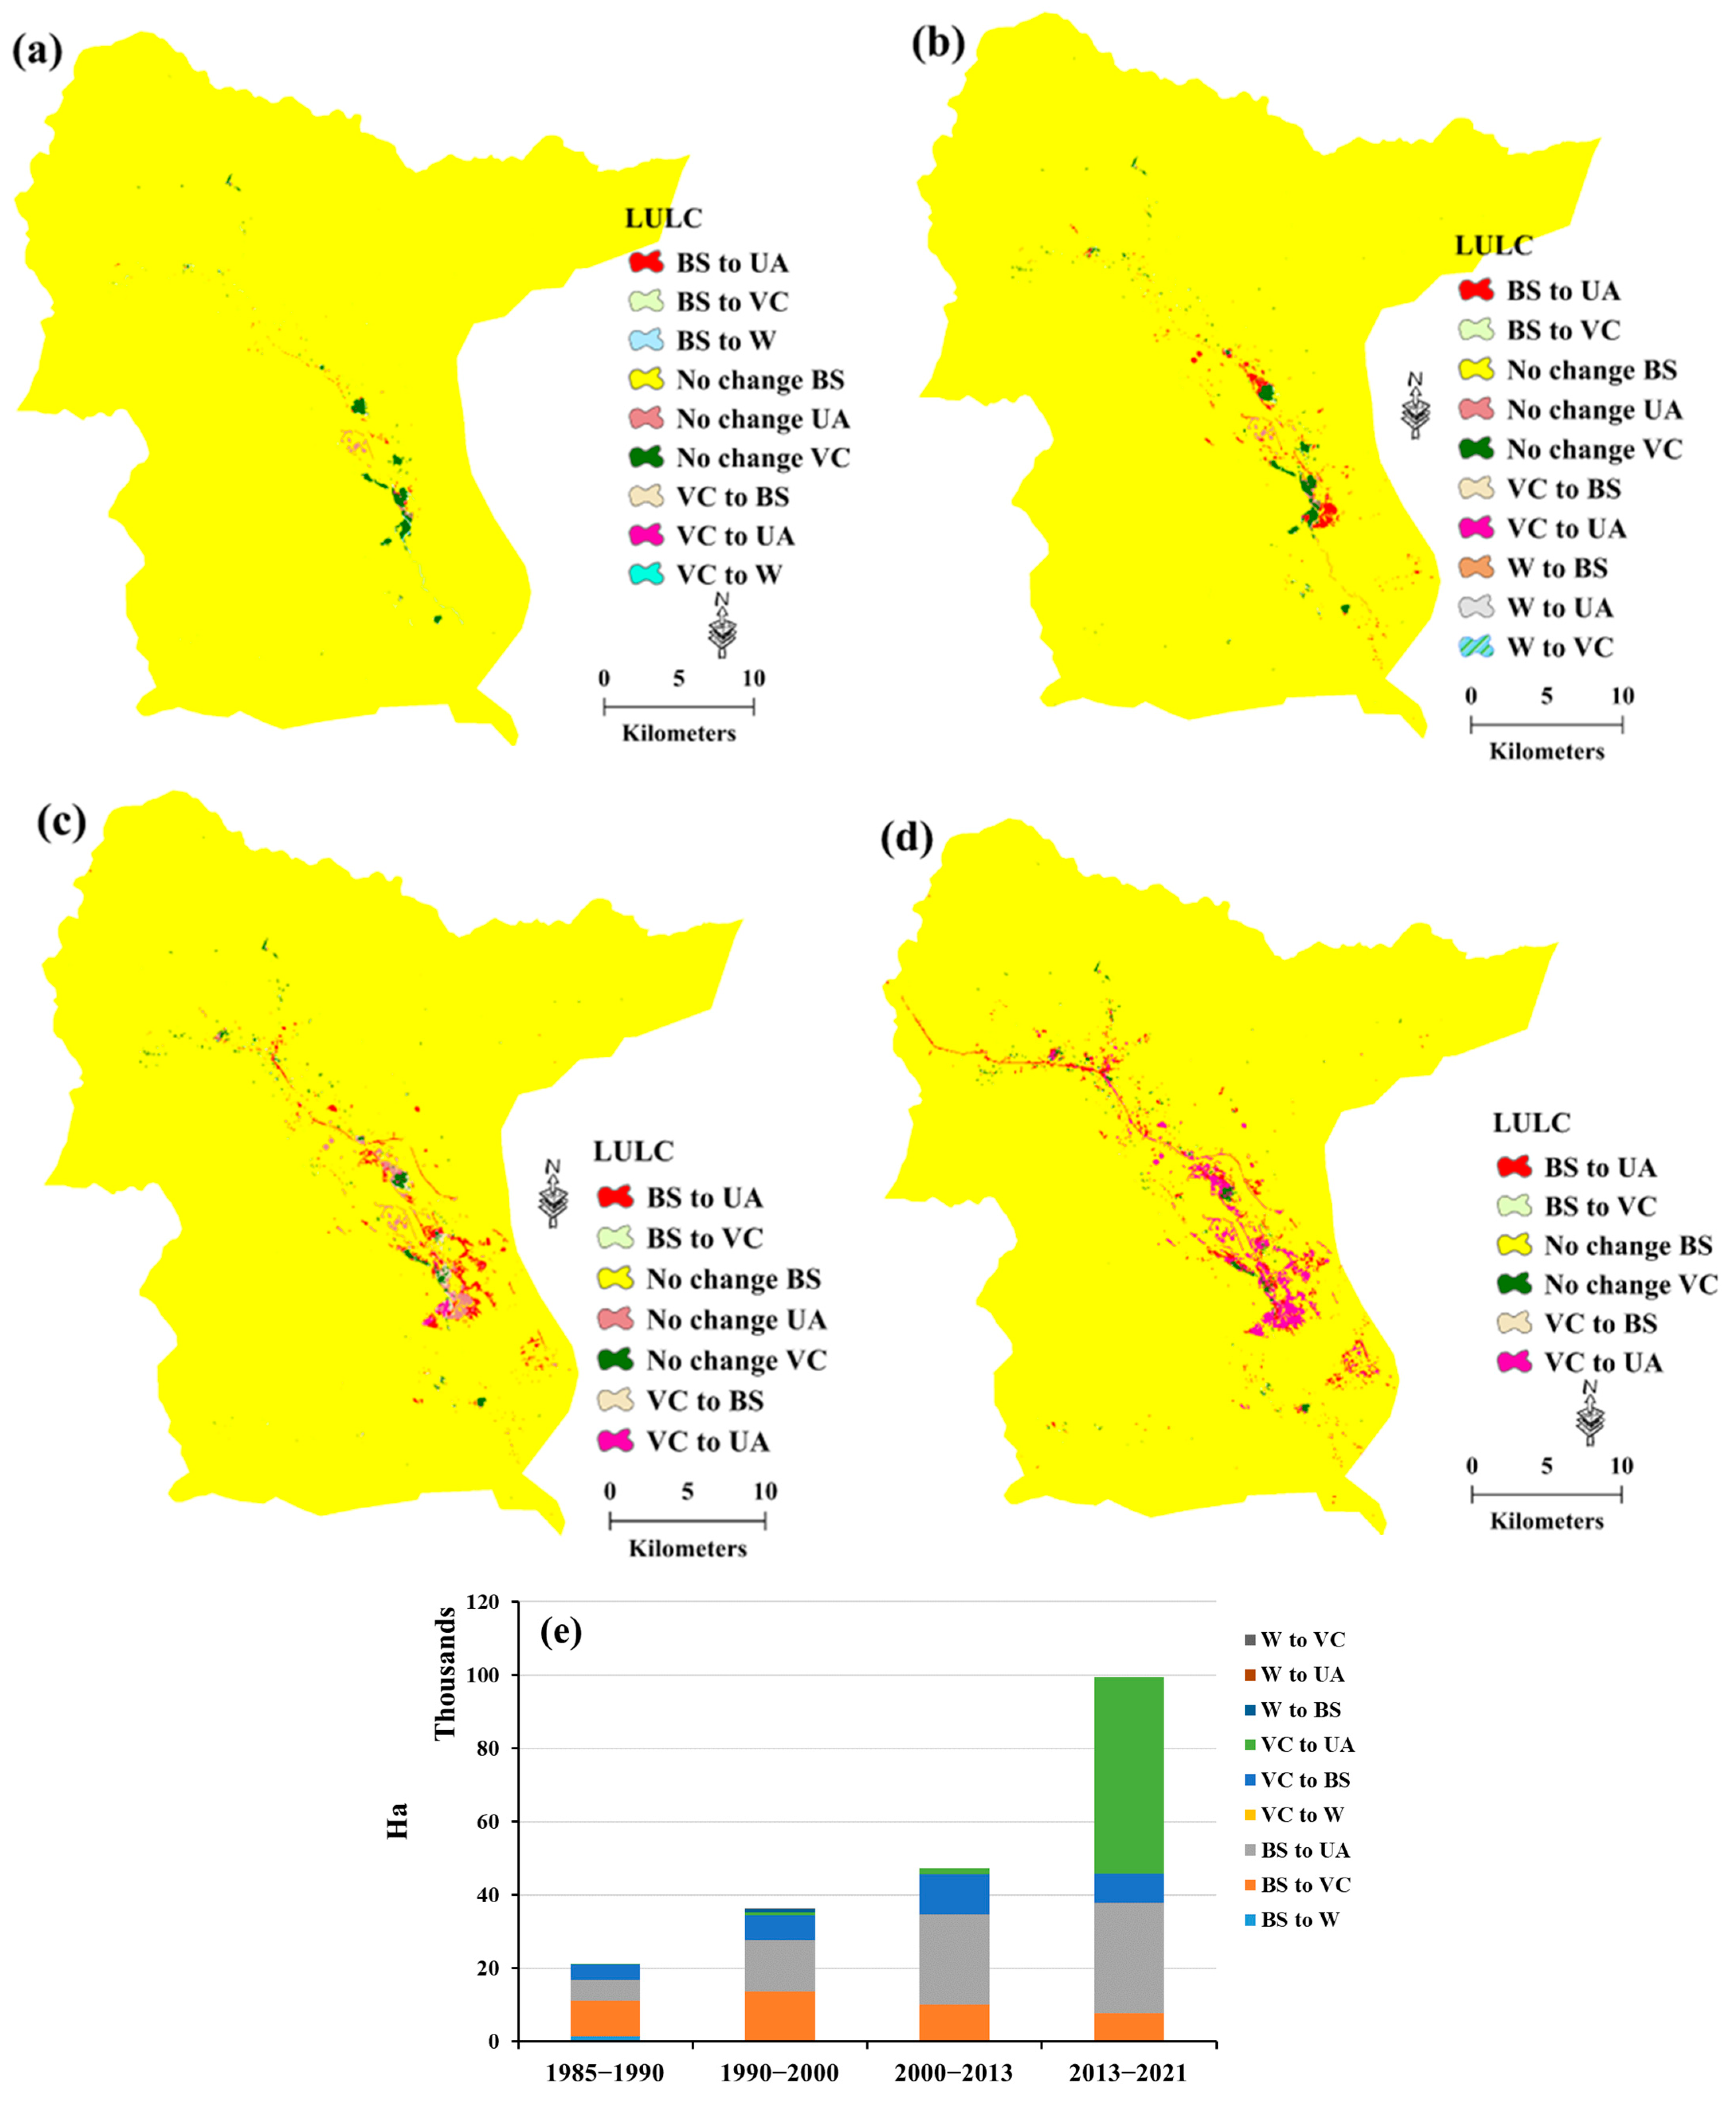
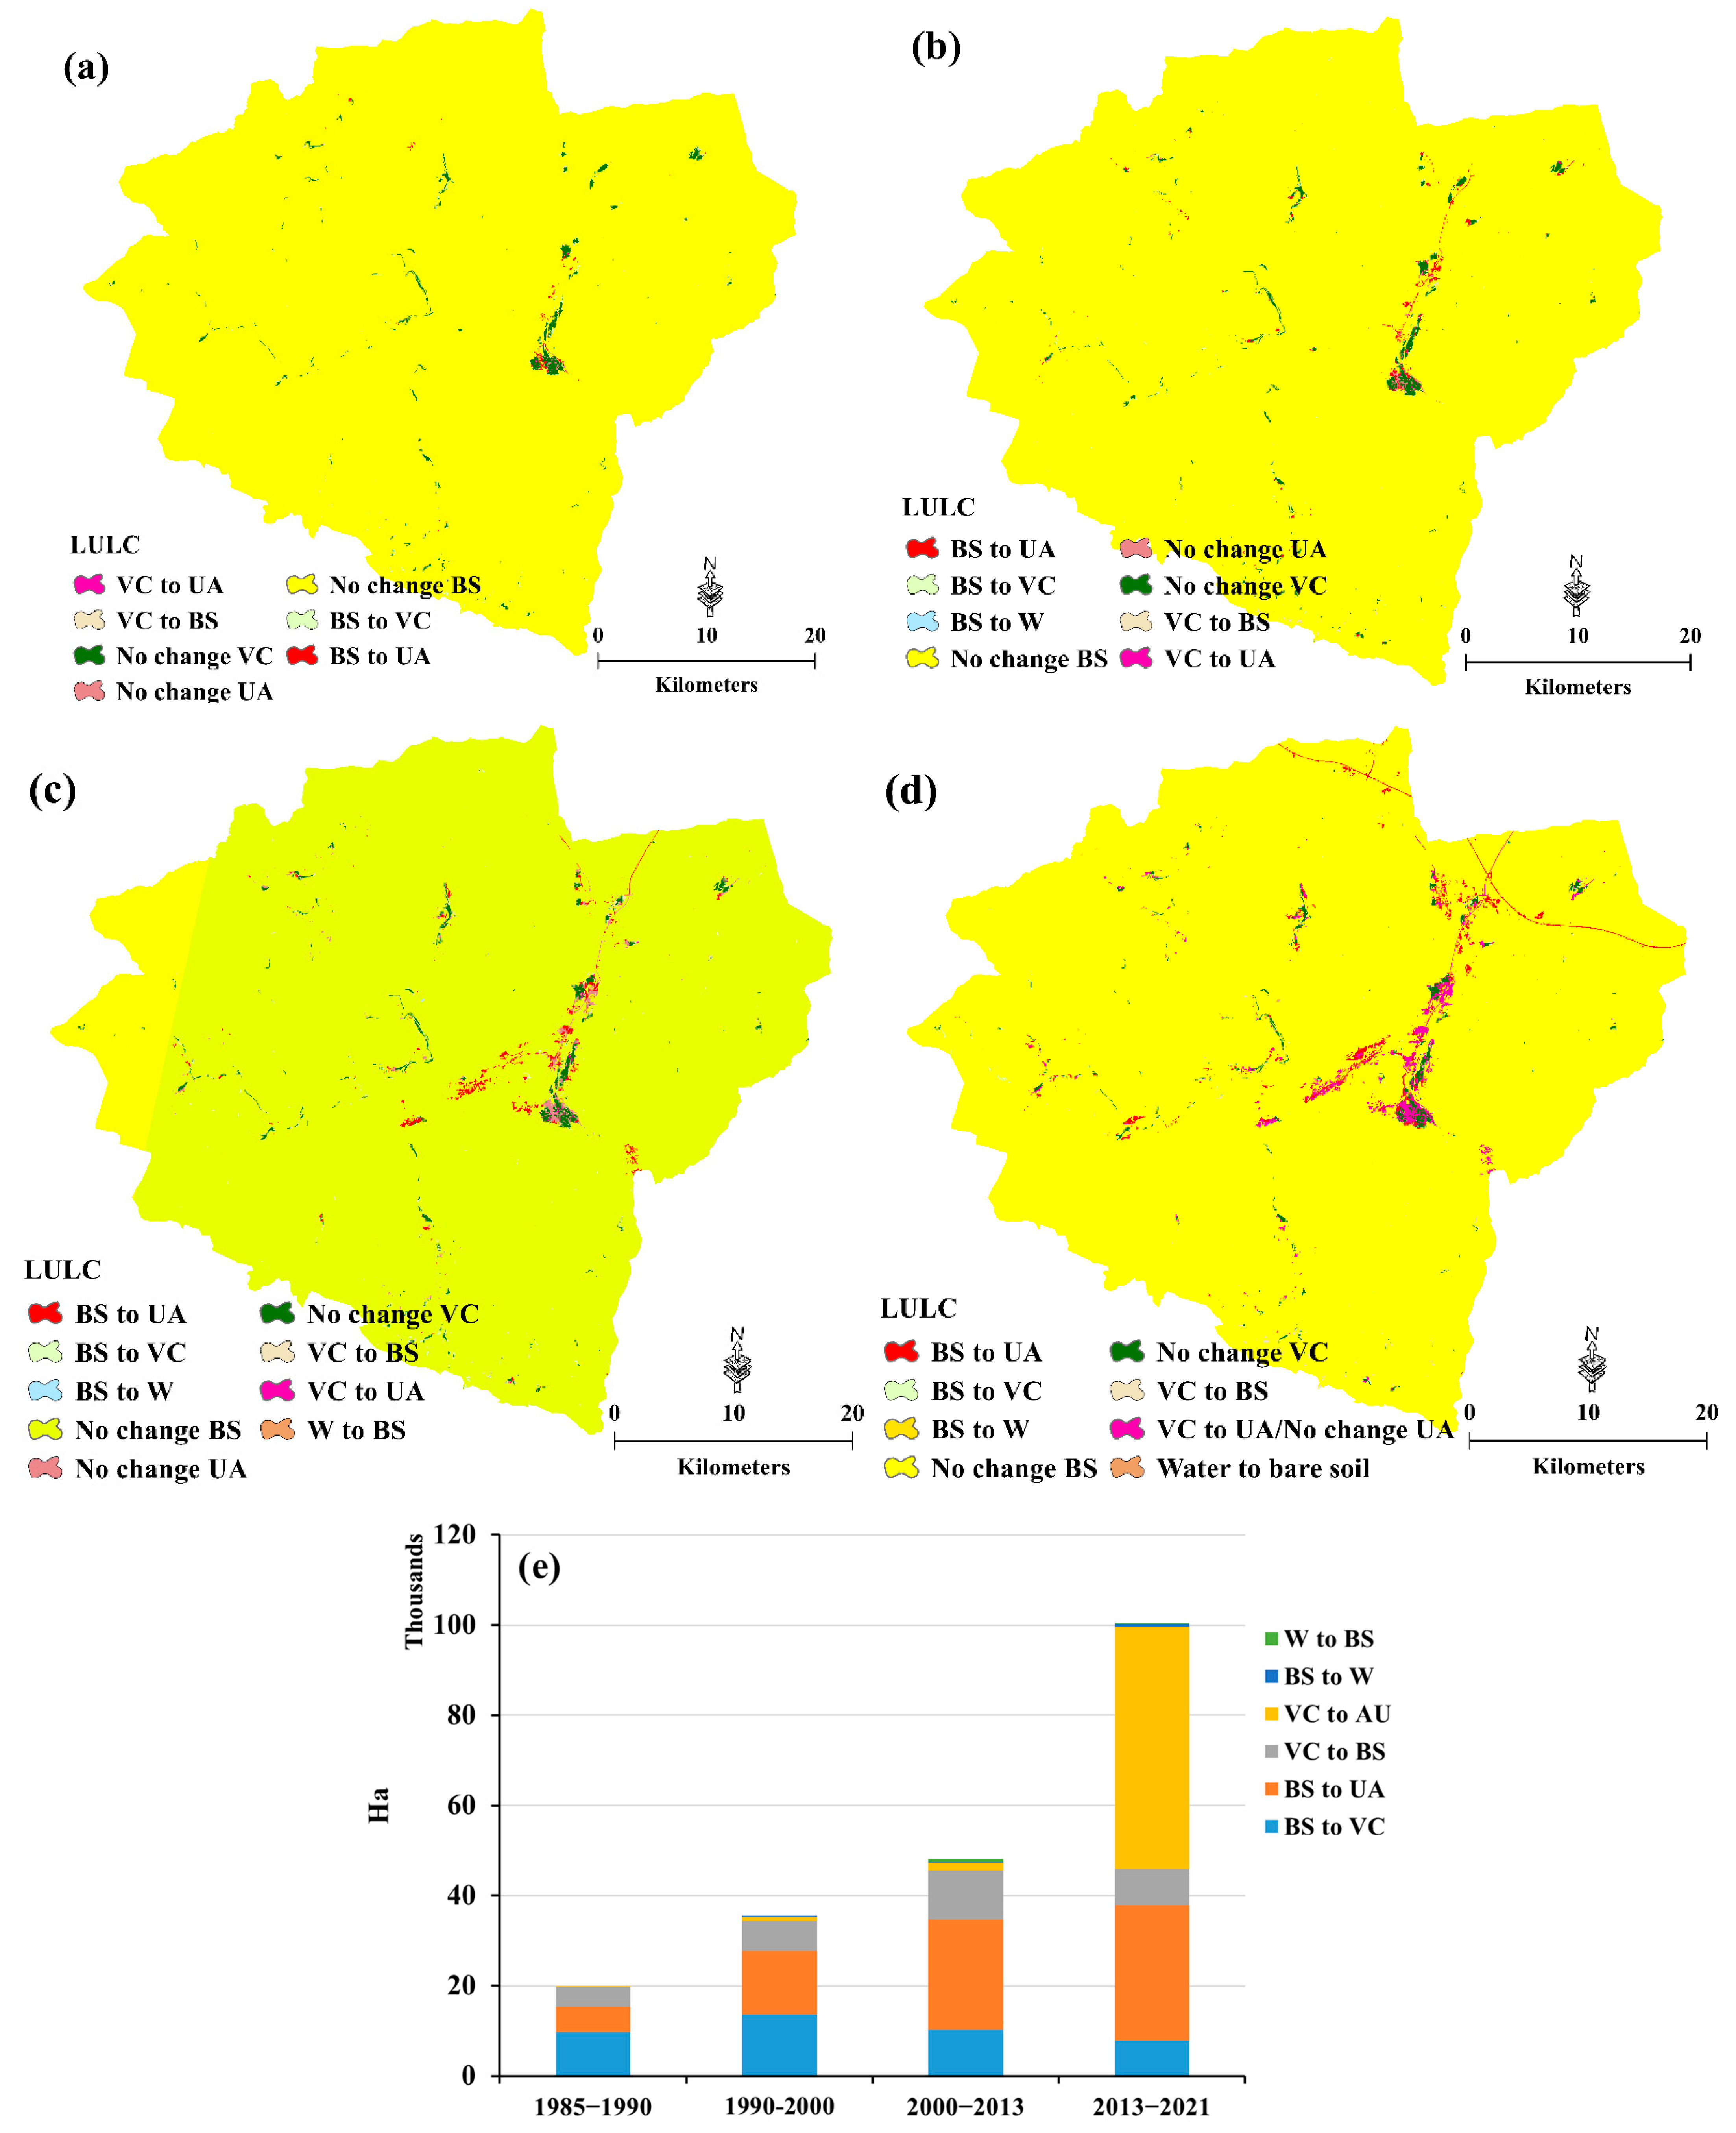
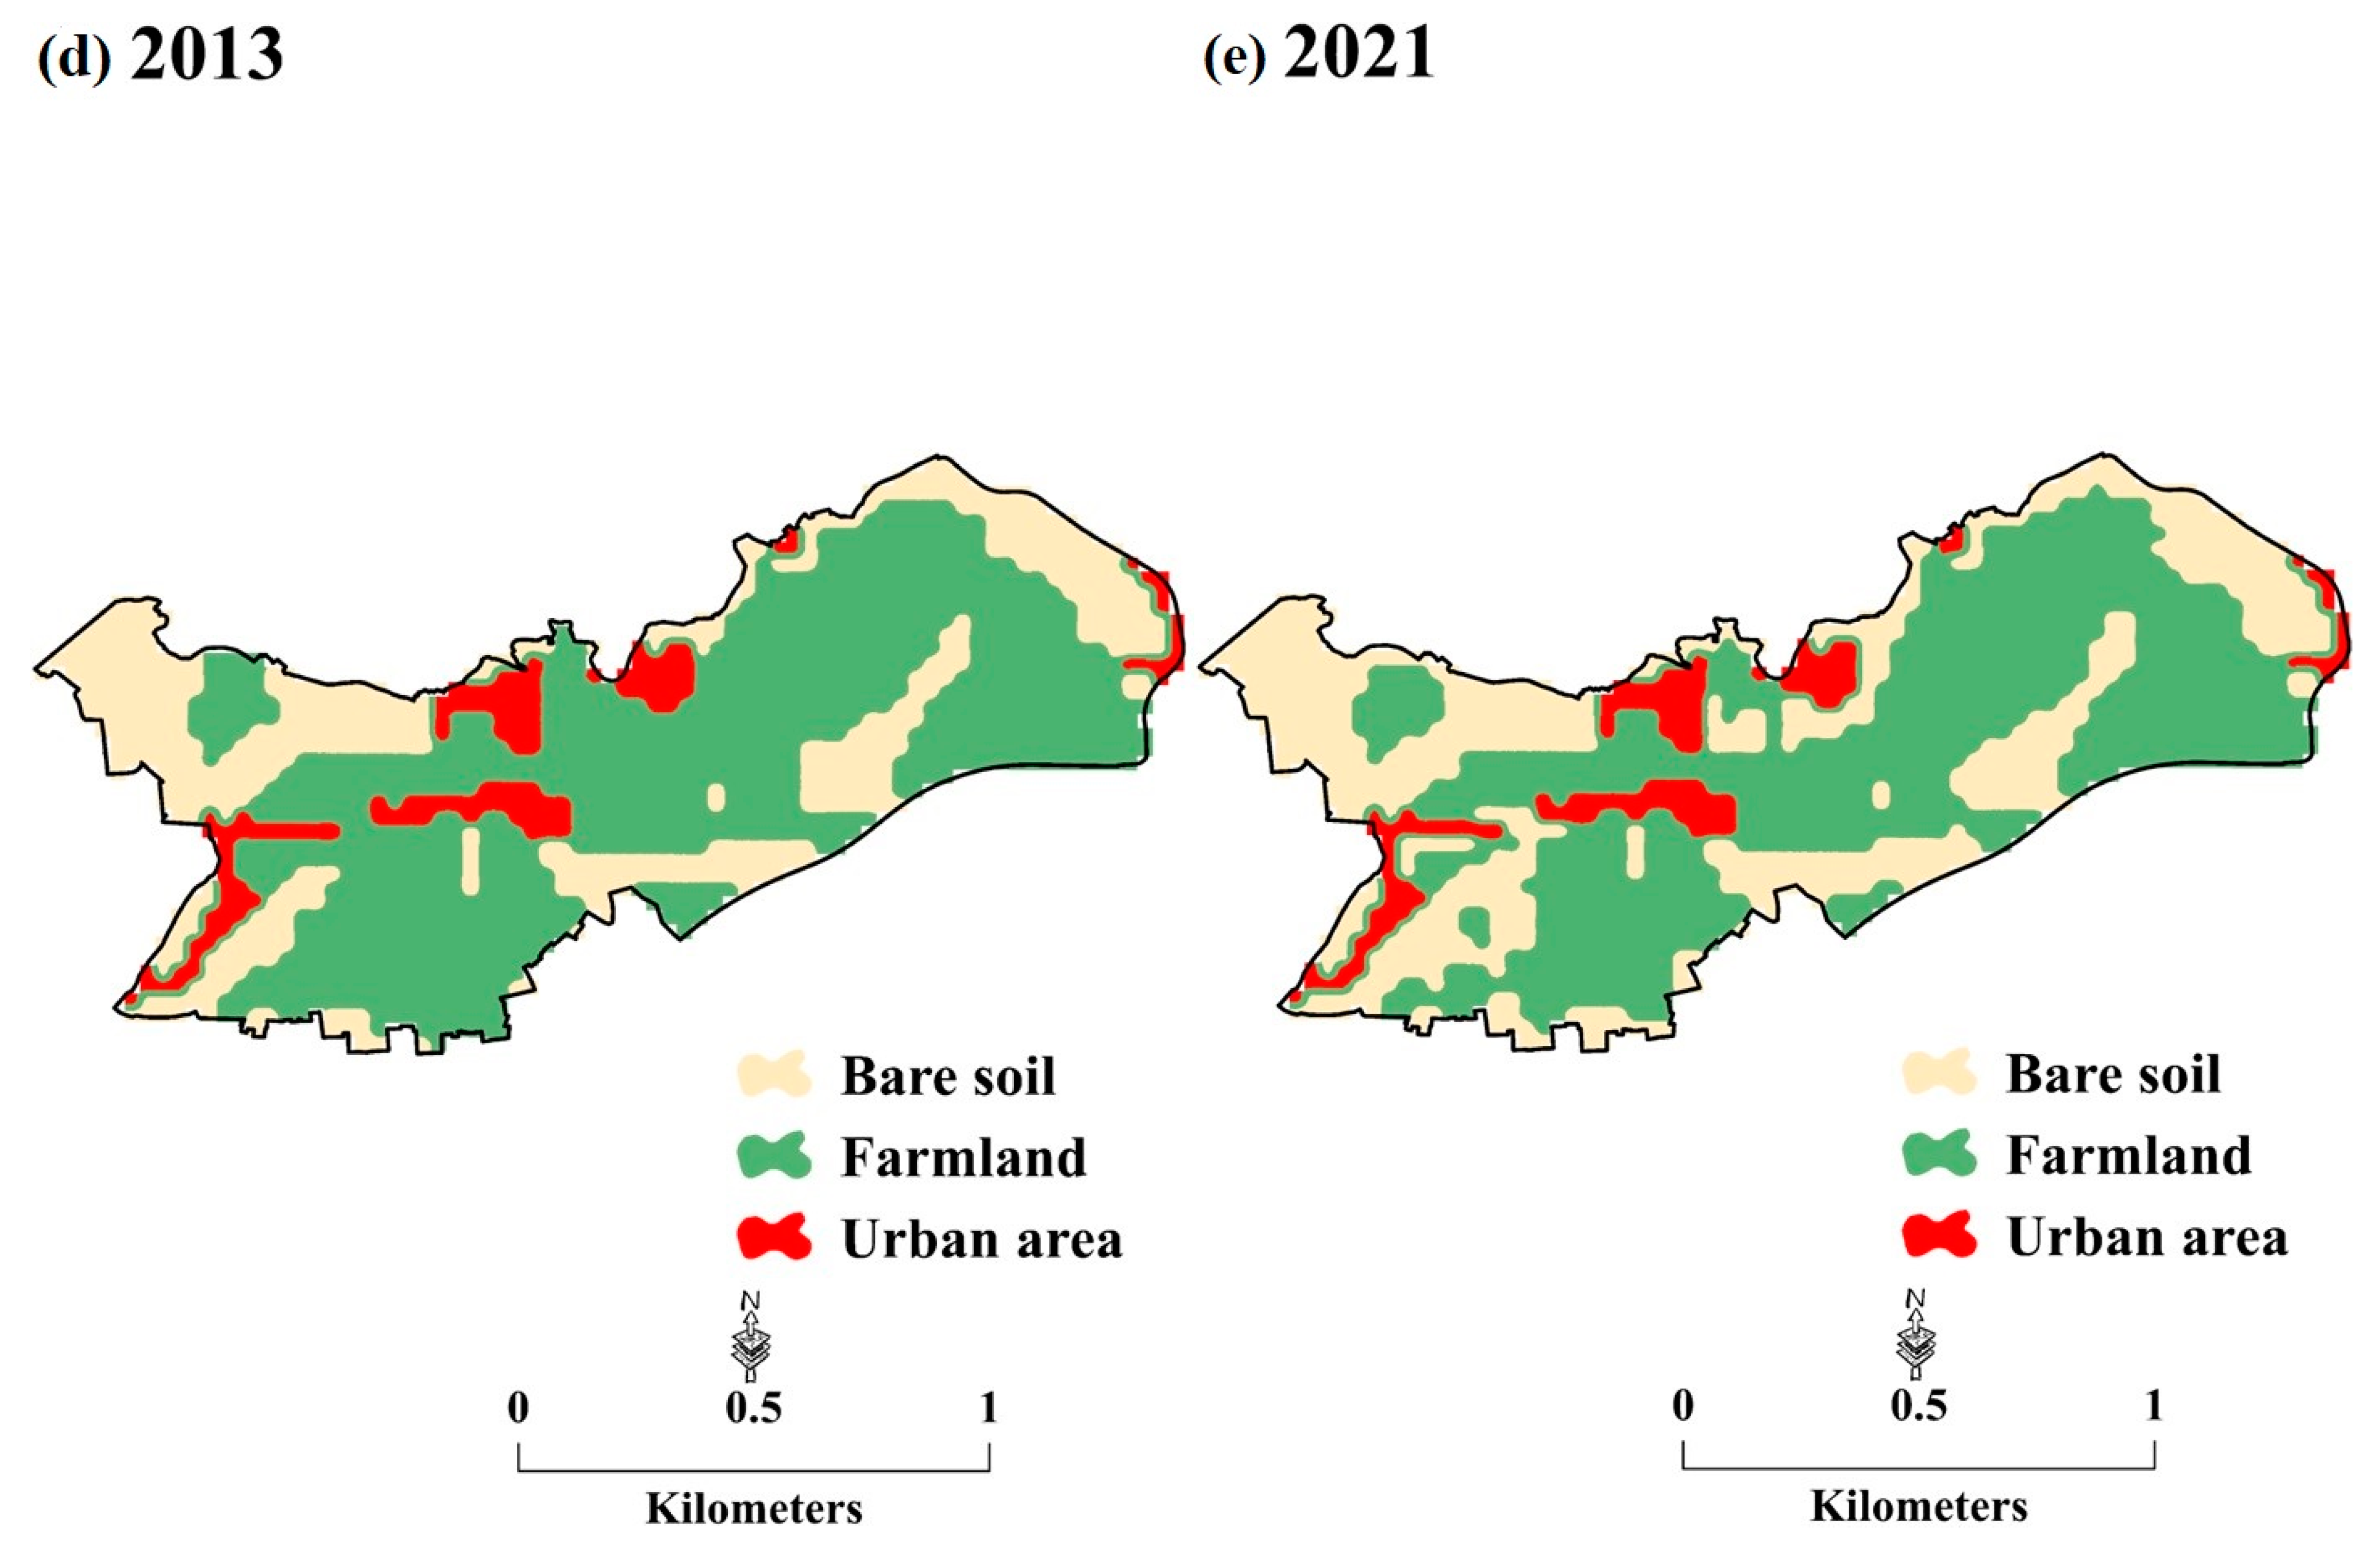
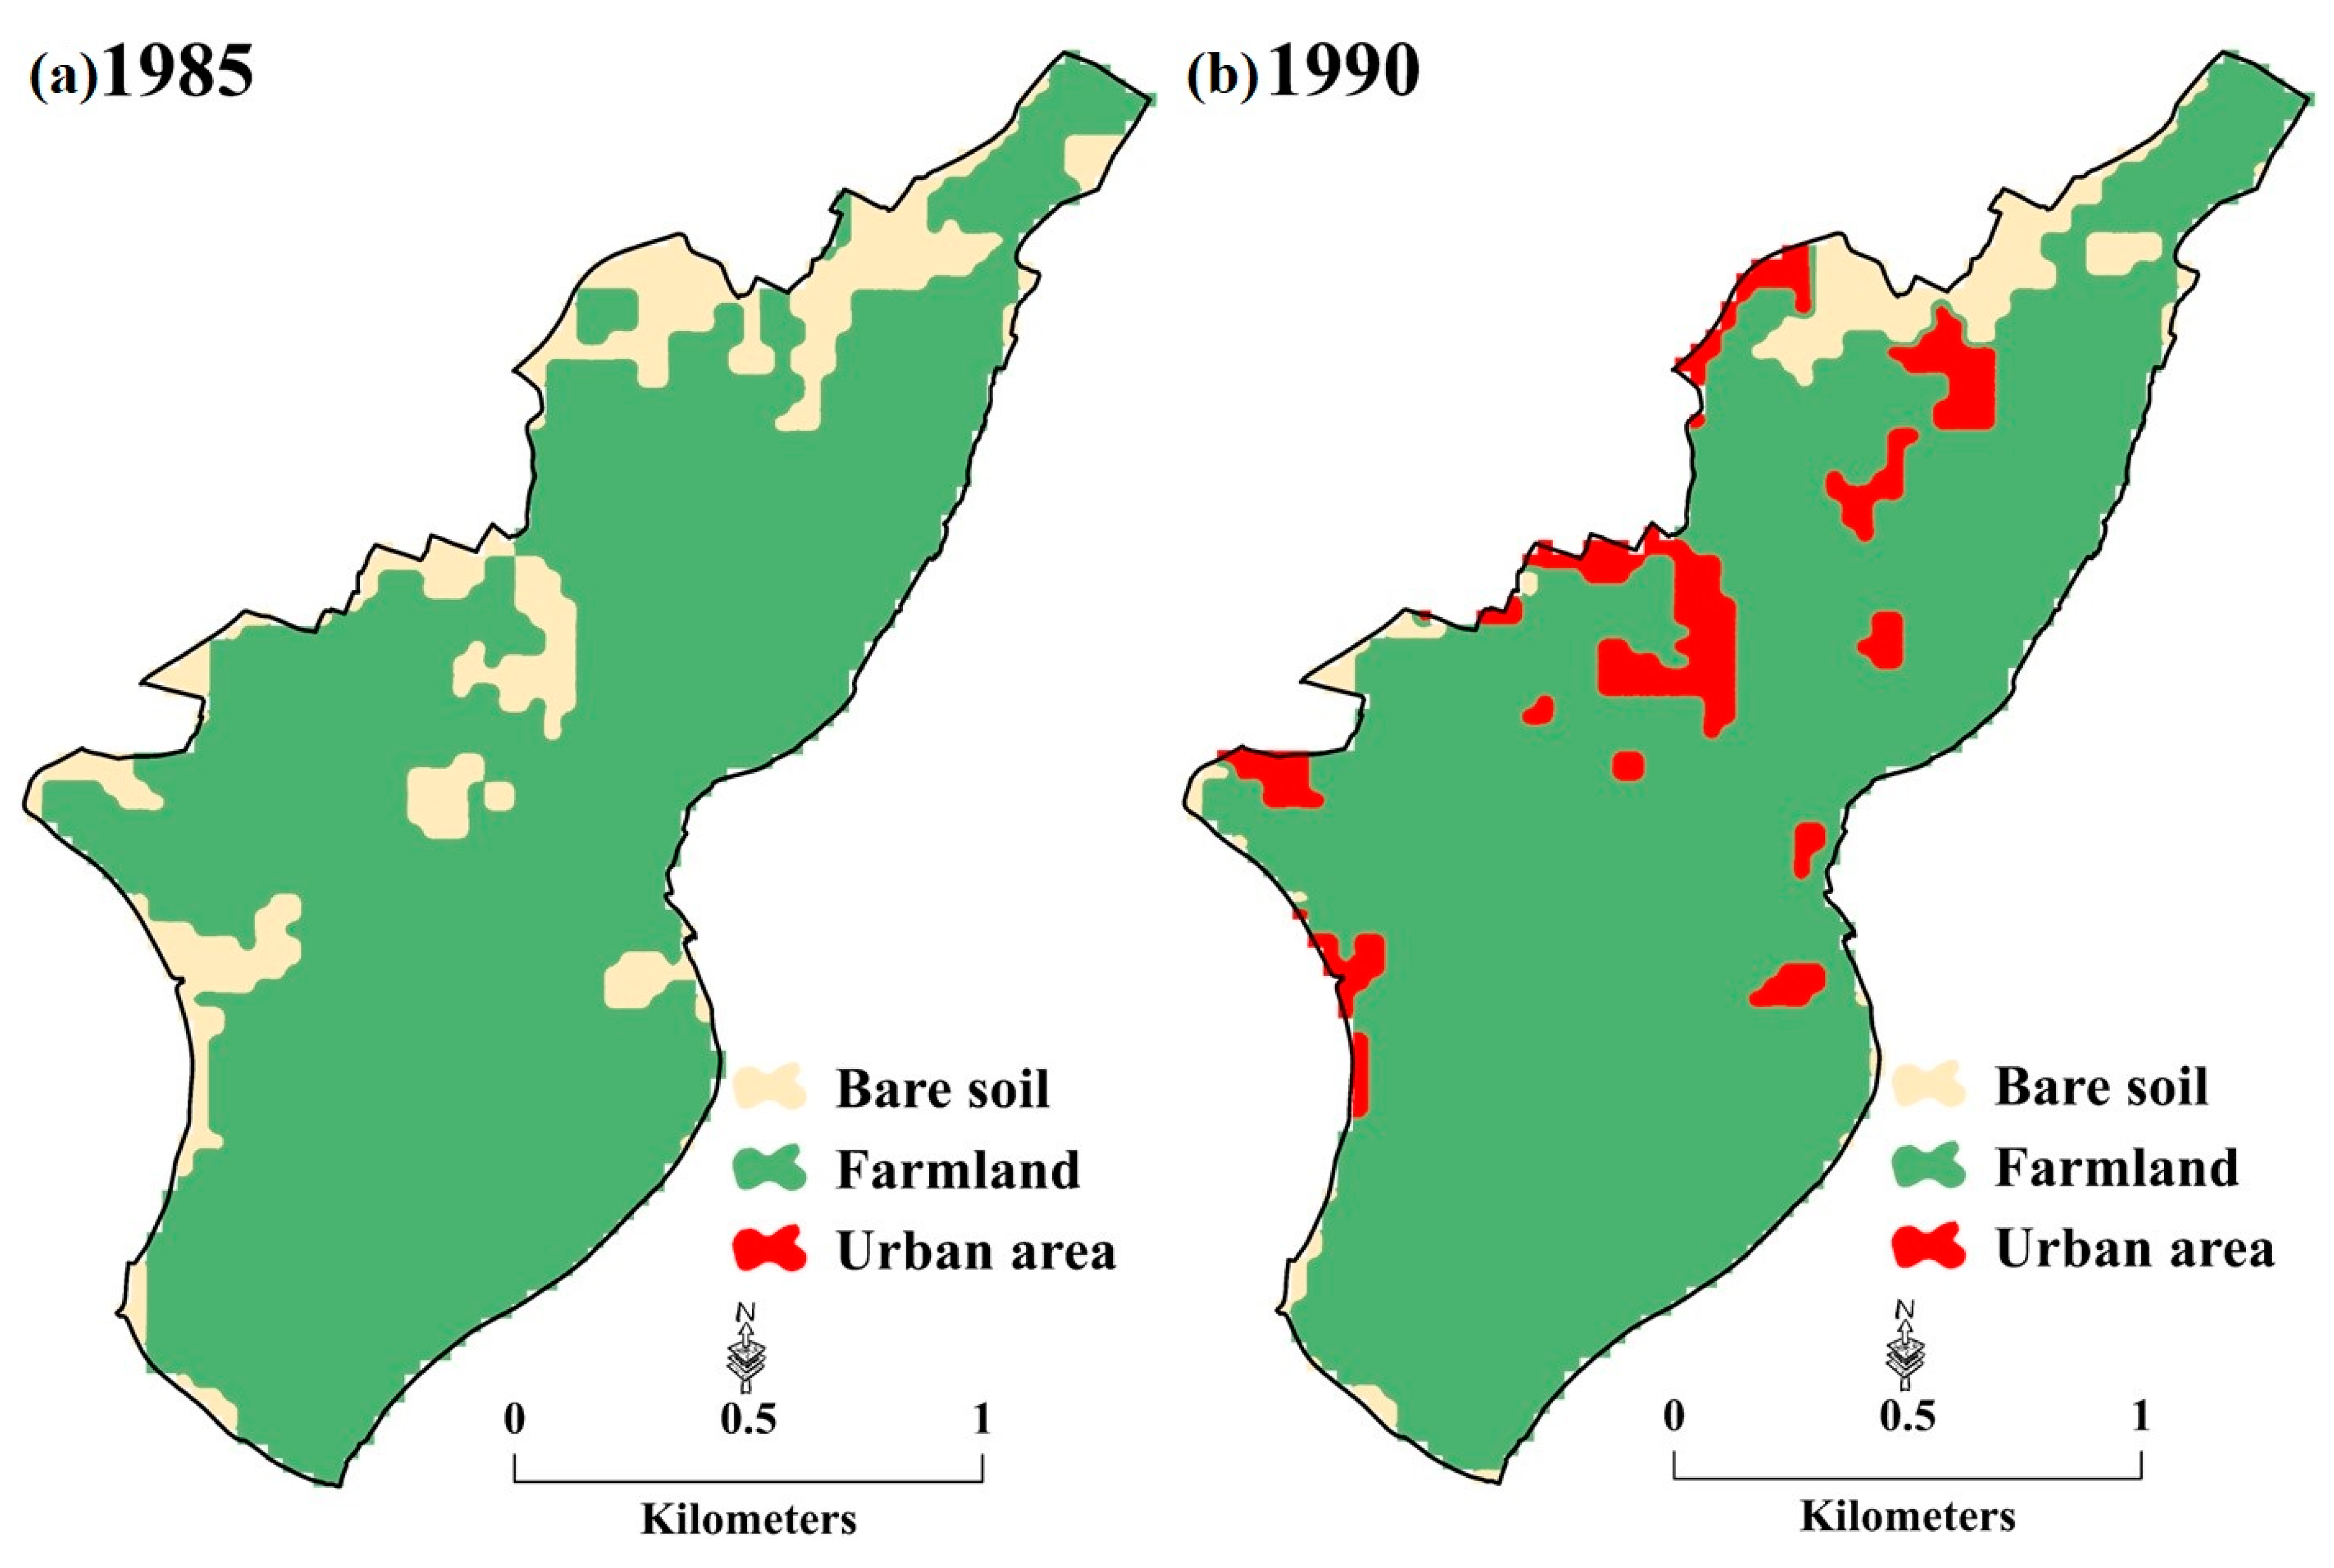
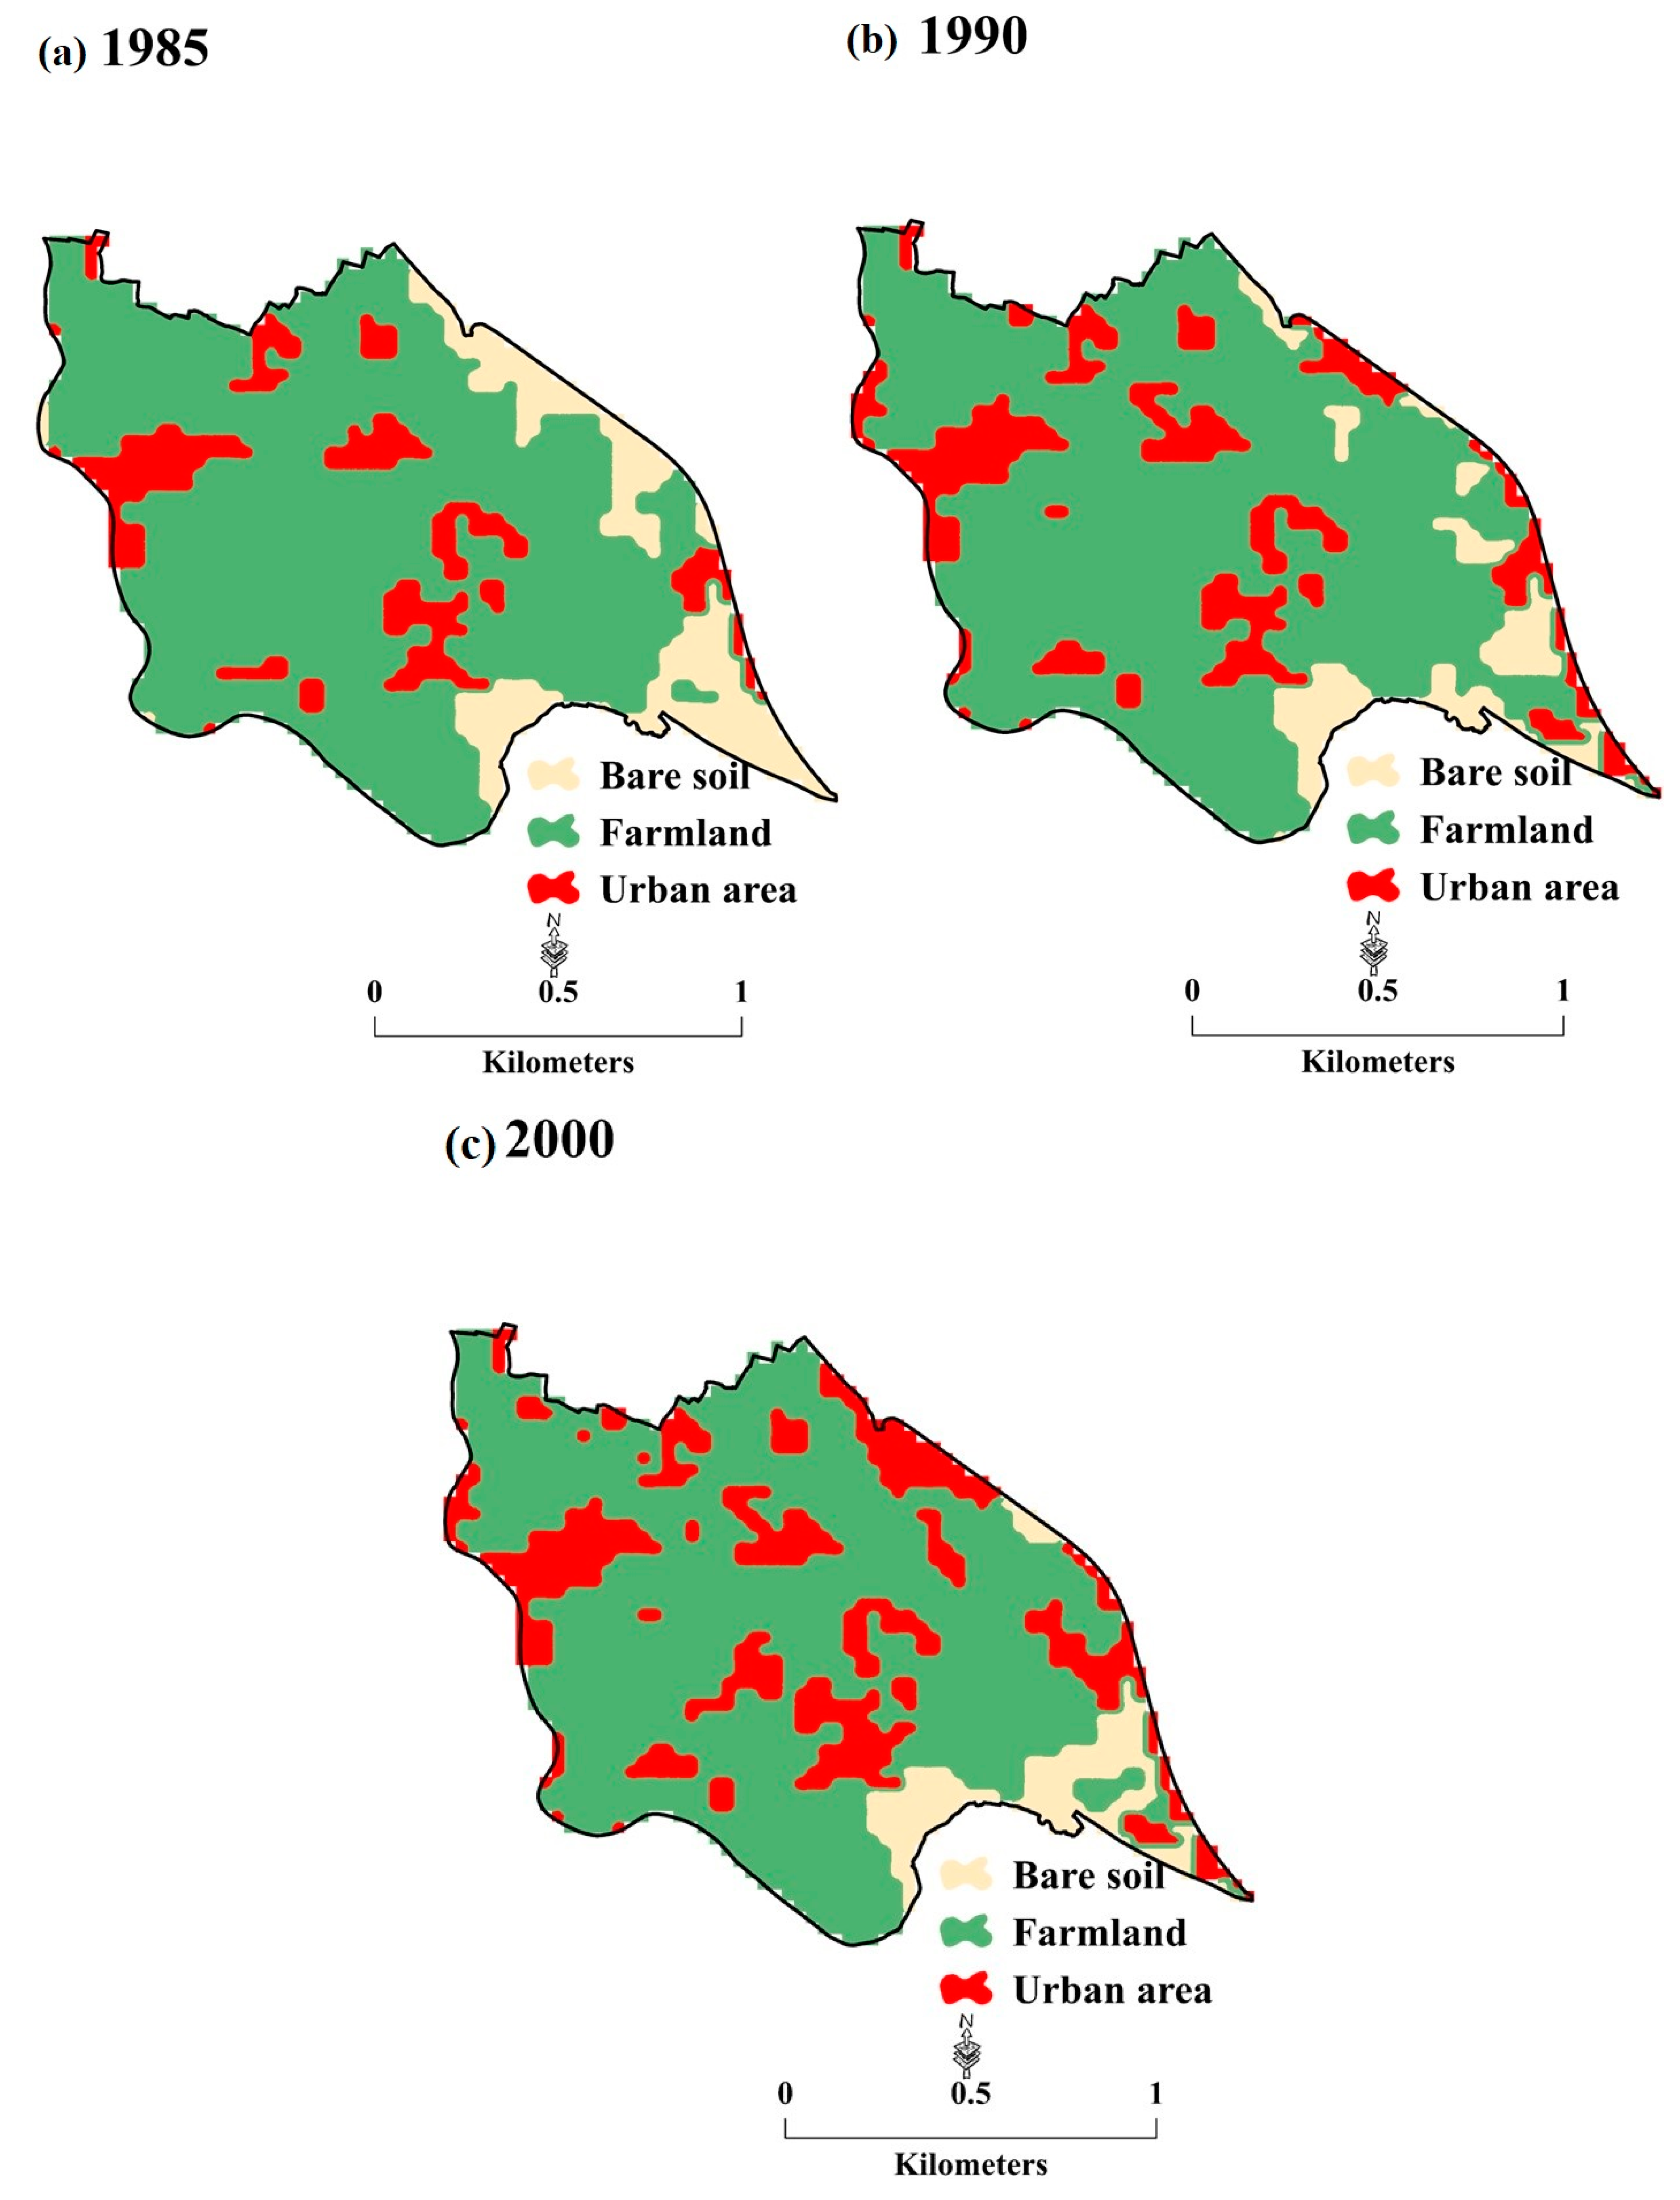
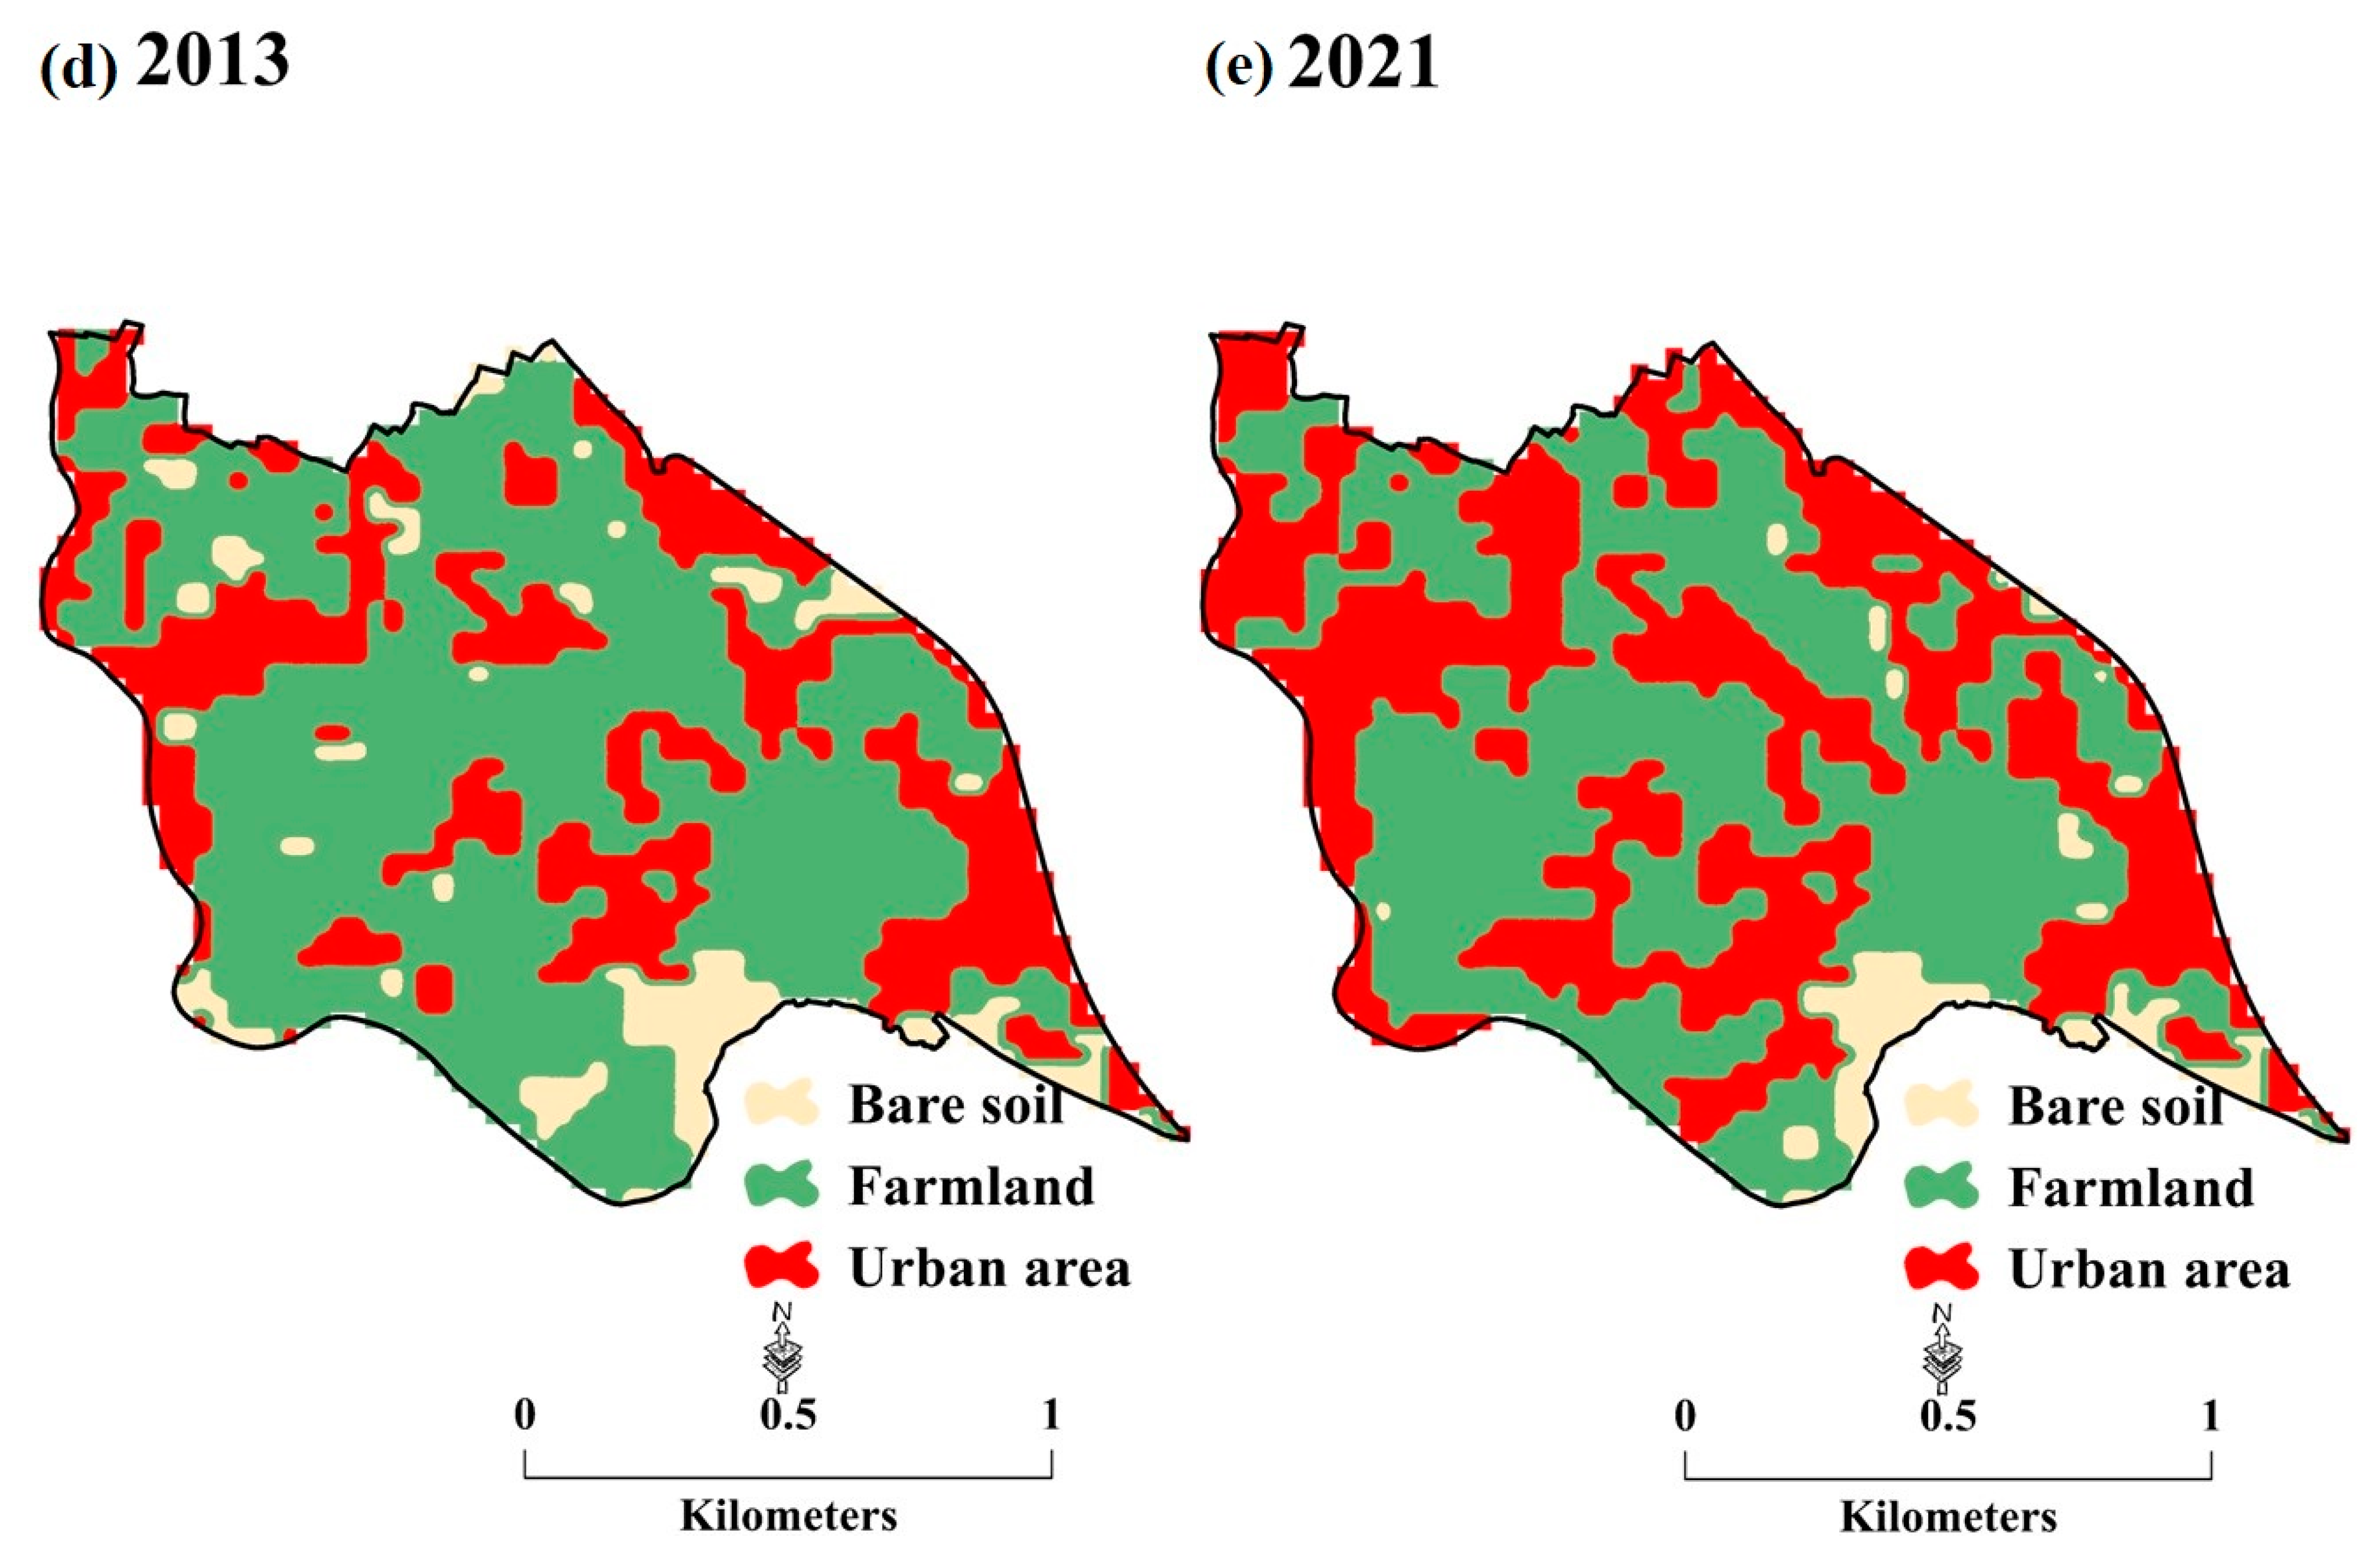
3.2. LULC Change Detections

Figure 4, Figure 5, Figure 6, Figure 7, Figure 8, Figure 9 and Figure 10 demonstrate the LULC changes that occurred in Bawsher (Figure 4), Nizwa (Figure 5), Sohar (Figure 6), Ibri (Figure 7), Al-Buraymi (Figure 8), Ibra (Figure 9), and Al-Rustaq (Figure 10) during four time periods (i.e., 1985–1990, 1990–2000, 2000–2013, and 2013–2021). The primary land cover type transition in Bawsher and Nizwa was from VC to UA, whereas in Sohar, Al-Rustaq, Ibri, Ibra, and Al-Buraymi, the major transition was from BS to UA. The inventory of aflaj was once heavily utilized for agricultural purposes, but experienced a significant decline due to intensified agricultural use. Notably, the transitions from bare soil (BS) to vegetation cover (VC) were more pronounced during the 1985–1990 period in Bawsher (Figure 4a), Nizwa (Figure 5a), Ibri (Figure 7a), Ibra (Figure 9a), and Al-Rustaq (Figure 10a). In contrast, the transitions from VC to BS and VC to urban areas (UAs) were more prevalent during the 1985–2000 period in Sohar (Figure 6a) and Al-Buraymi (Figure 8a). However, from 2000–2021, the major land cover type transitions in these regions shifted towards VC to BS and VC to UA, as depicted in Figure 4, Figure 5, Figure 6, Figure 7, Figure 8, Figure 9 and Figure 10. The statement posits a notion that VC lands in the Ibri region are likely to be hampered by constraints concerning aflaj or groundwater resources, thus providing a signal for their probable unsuitability for certain water-intensive agricultural practices. In spite of the BS to VC land cover transition being predominant in the region, significant alterations were also observed for other land cover types, such as BS to UA, VC to BS, and VC to UA, during the period spanning 1985 to 2021, as evinced by Figure 7. This attests to the fact that the landscape of Ibri underwent significant transformations, with some areas transmuting from arid and desolate terrains to urban conurbations or the reverse, and others undergoing changes in vegetation cover. These vicissitudes may have extensive ecological and socioeconomic implications for the local populace.
The LULC trends for the years 1985 to 2021 are evident in Figure 4e, Figure 5e, Figure 6e, Figure 7e, Figure 8e, Figure 9e and Figure 10e, revealing that UA expansion has occurred across all cities in the study area, albeit at different rates. The growth of urban areas in Bawsher, Nizwa, Ibra, Al-Buraymi, Sohar, Ibri, and Al-Rustaq amounted to approximately 6240.06 ha, 4443.3 ha, 2564.1 ha, 2484.09 ha, 7396.11 ha, 5477.94 ha, and 3092.31 ha, respectively, over the past 36 years.
This pattern underscores the interplay between urbanization, population growth, and the consequential abandonment of agricultural land, as well as the intensification of desertification, all of which have far-reaching impacts on groundwater resources. Furthermore, the observed increase in vegetation cover in the cities under study between 1985 and 2000, followed by a drastic decline between 2013 and 2021, underscores the complexity of LULC dynamics and the need for nuanced approaches to urban planning that balance development with environmental conservation.
Taken together, these findings highlight the urgency of monitoring and understanding LULC trends and their impacts on natural resources, as well as the need to formulate policies and interventions that safeguard these resources for future generations. As such, a more holistic and integrated approach to urban planning and management is necessary to ensure sustainable development that balances the needs of both present and future generations.

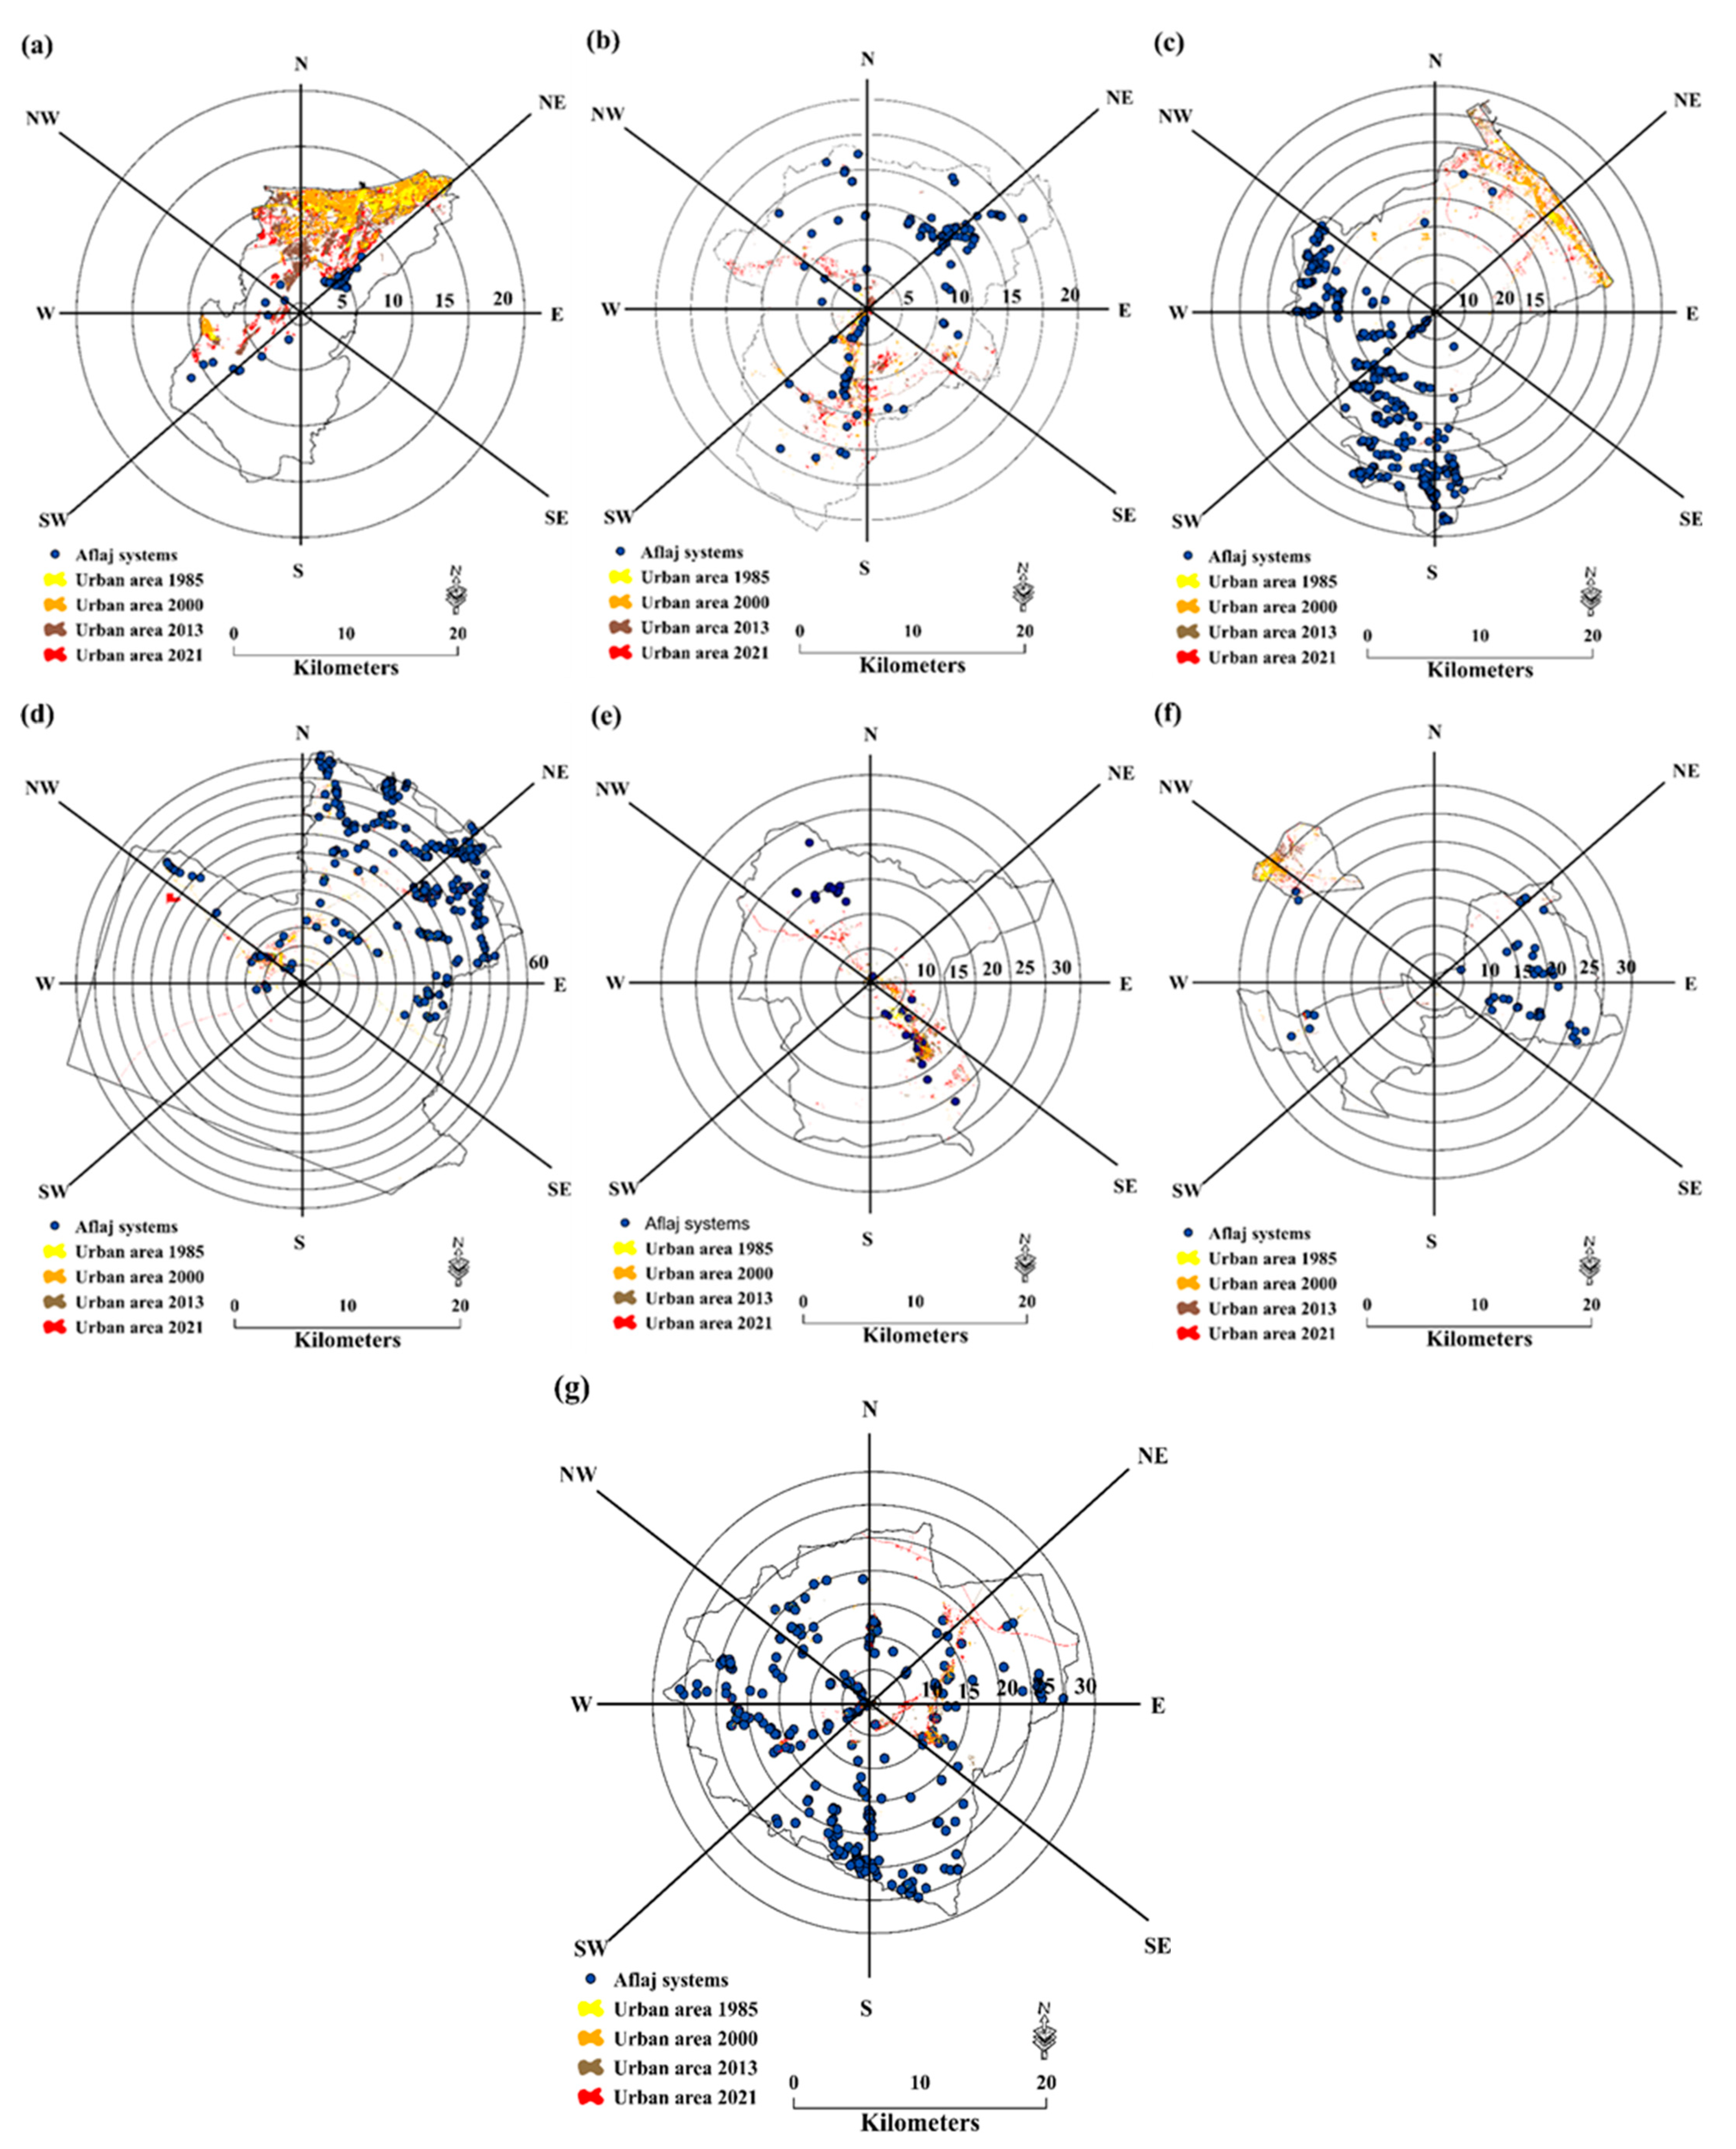
3.3. Urban Expansion Direcions

Figure 11 depicts the direction of urban expansion in the seven cities from 1985 to 2000, 2000 to 2013, and 2000 to 2021. For Bawsher (Figure 11a), the expansion in 1985 was centered in the northeast, and the development extended more in the northwest, south, and southeast directions than in any other directions, that is, precisely towards the aflaj systems in 2000, 2013, and 2021. Because of the high elevations and high degree of distributed slopes, the development has not extended in the eastern part of Bawsher City. For Nizwa (Figure 11b), the 1985 expansion was concentrated in roughly all directions near the city center. In 2000, 2013, and 2021, the development extended to the northwest, southwest, south, and southeast. Similarly to the Bawsher urban expansion, the Nizwa city expansion is restricted to the aflaj systems. For Sohar (Figure 11c), the LULC maps showed that the urban and vegetated areas are concentrated in the eastern and western coastal areas. From 1985 to 2021, two expansions were clearly observed in onshore and offshore areas. In onshore areas, three expansions in the urban area were observed: the first one in the northeast to the northwest directions and the second in the south and southeast directions (Figure 10c). Although the urban expansion remained far from the aflaj systems until now, the trend of urban expiation indicates that Sohar city will expand towards the aflaj systems in the future. For Ibri (Figure 11d), the 1985 expansion was concentrated in approximately all directions near the city center. The development was extended to the northwest, southwest, south, and southeast towards the aflaj systems (Figure 11d). For Ibra (Figure 11e), urban expansion in 1985 was centered close to the city center, and the urban areas were 923.4 ha. However, the development extended in approximately all directions towards the mother sources of the aflaj systems. For Al-Buraymi (Figure 11f), the urban expansion from 1985 was concentrated in the northwest of the city. From 2000 to 2021, the development was extended from northwest to south, southeast, and east.

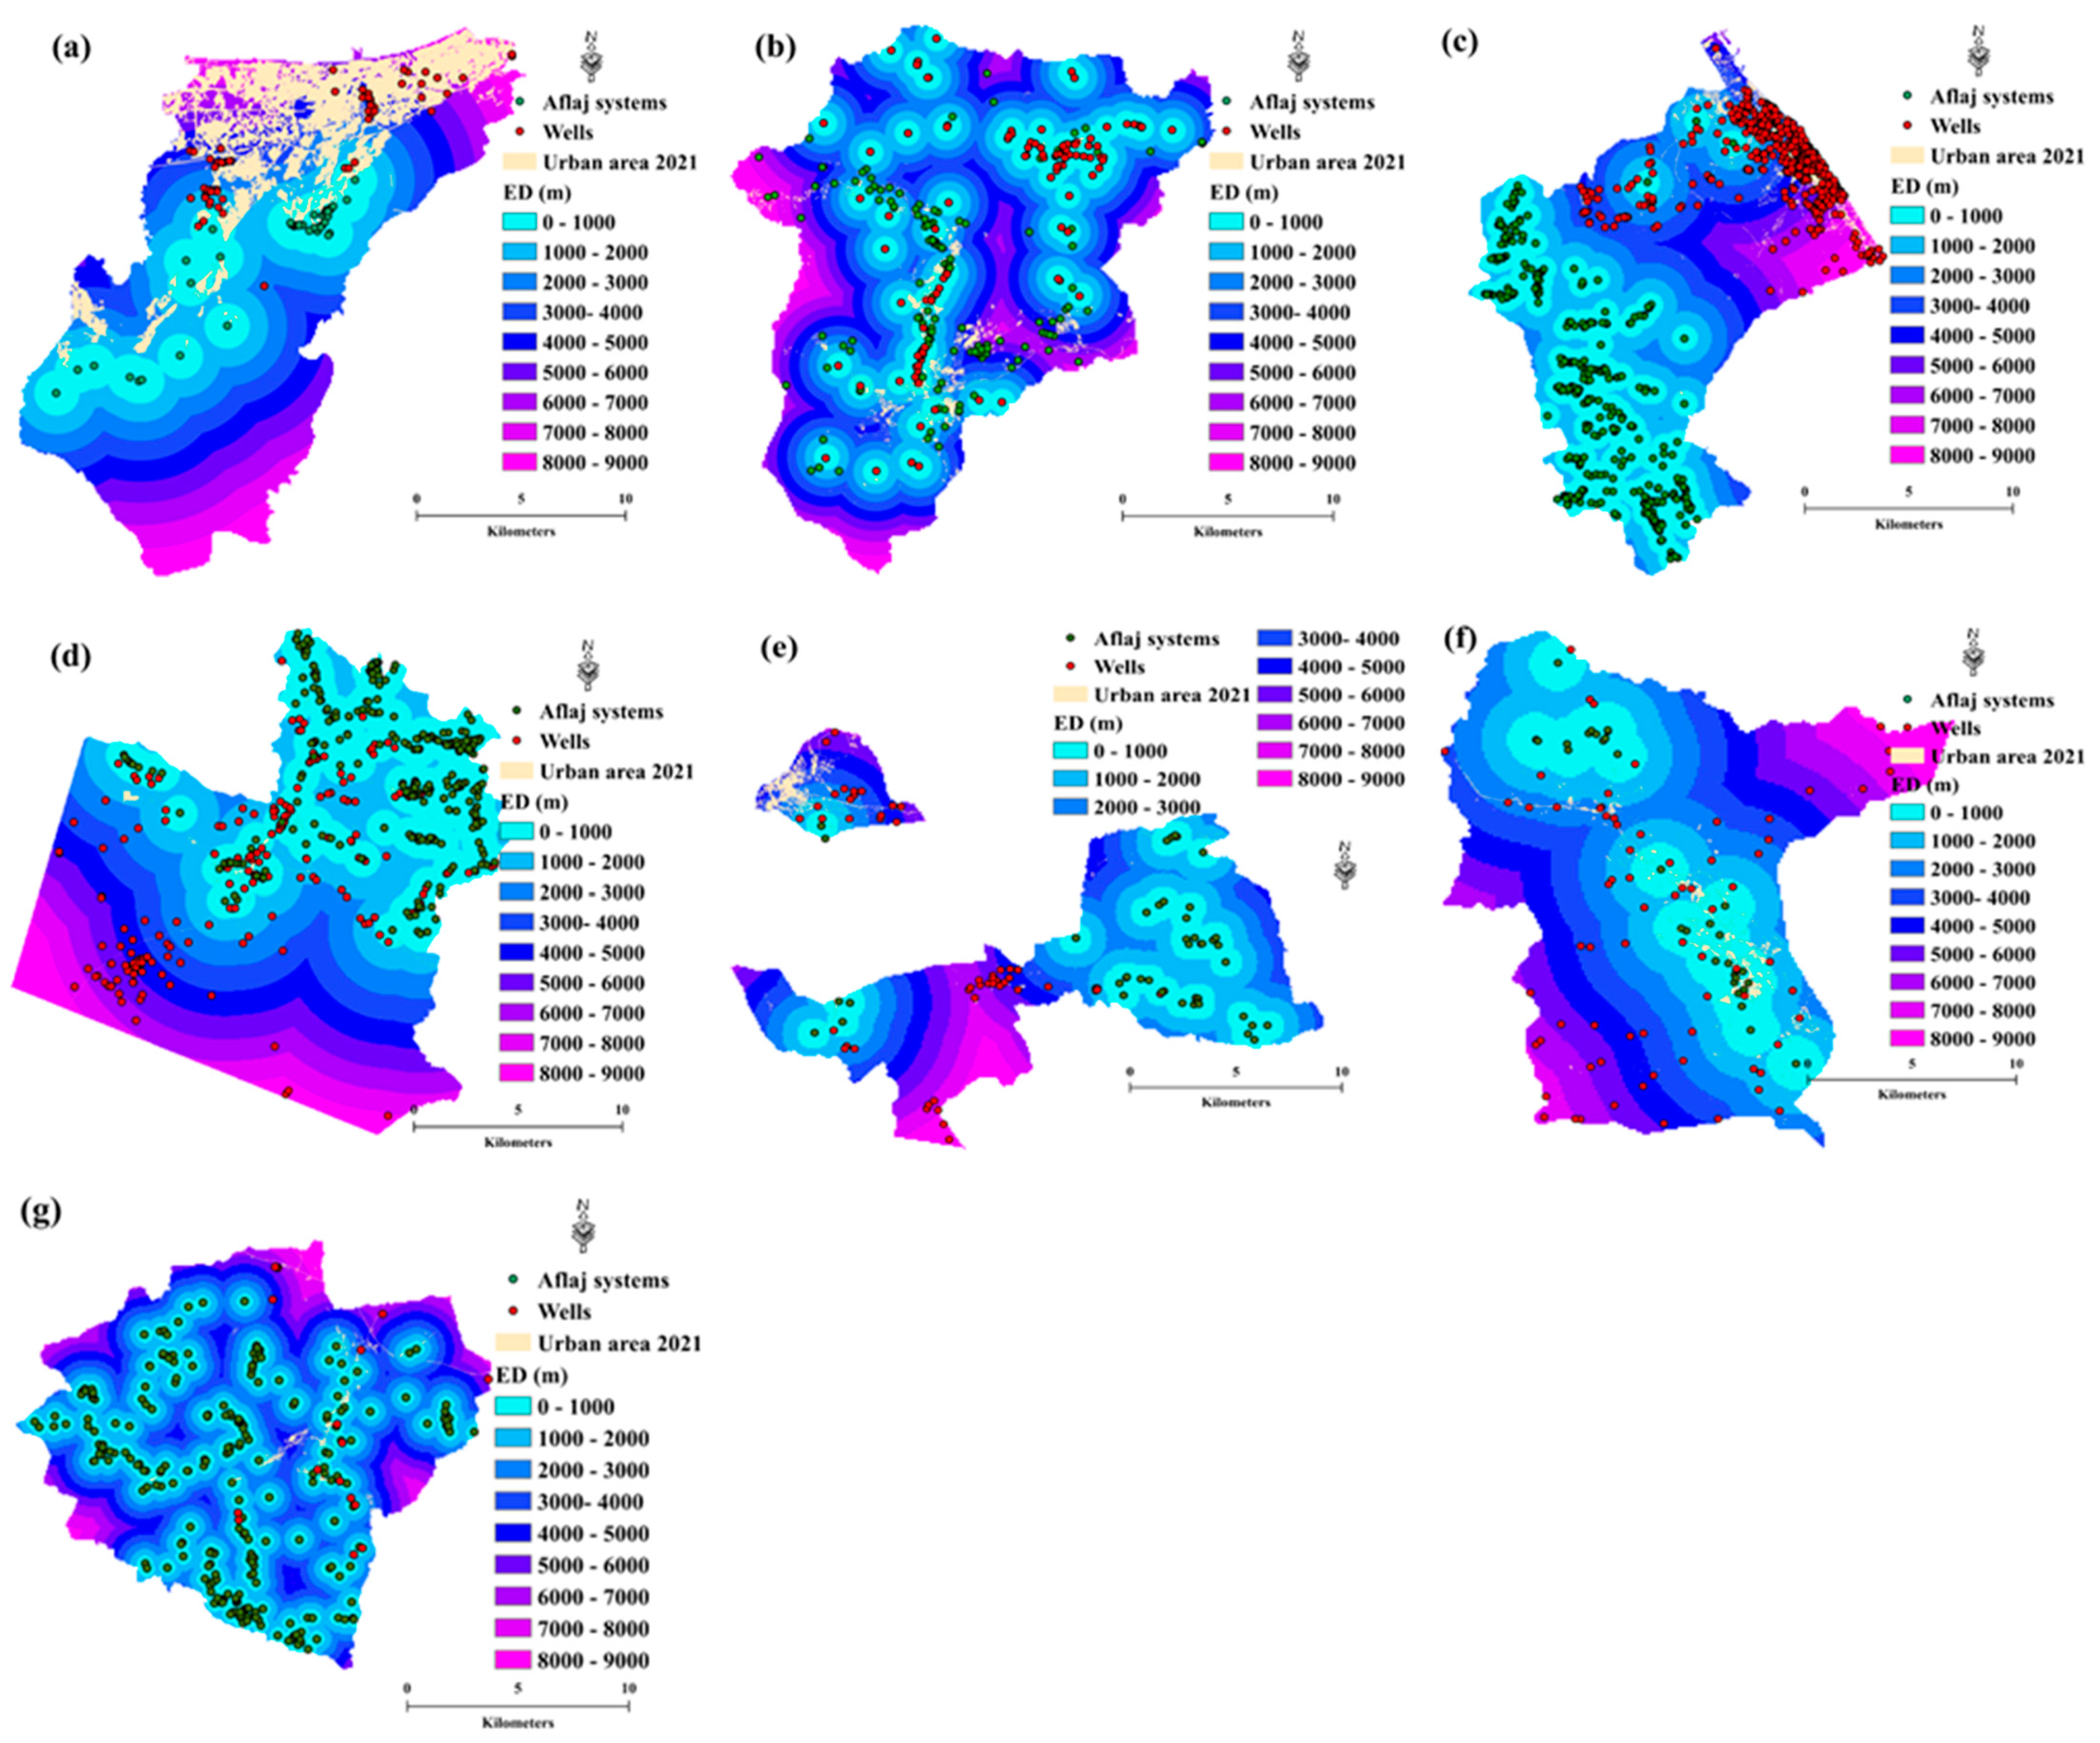
3.4. Euclidean Distance

The amount of UA distribution in 2021 within the boundaries of protected areas of aflaj mother sources over the study region are depicted in Figure 11. Based on the data collected about wells that have been established within the aflaj areas, 30 out of 52 aflaj in Bawsher (Figure 12a), 115 out of 134 aflaj in Nizwa (Figure 12b), 3 out of 402 aflaj in Sohar (Figure 12c), 155 out of 363 aflaj in Ibri (Figure 12d), 11 out of 45 aflaj in Al-Buraymi (Figure 12e), 34 out of 54 aflaj in Ibra (Figure 12f), and 39 out of 325 aflaj in Al-Rustaq (Figure 12g) were found to be at high risk of drying out, and many of them are found dried out because of urban expansion.

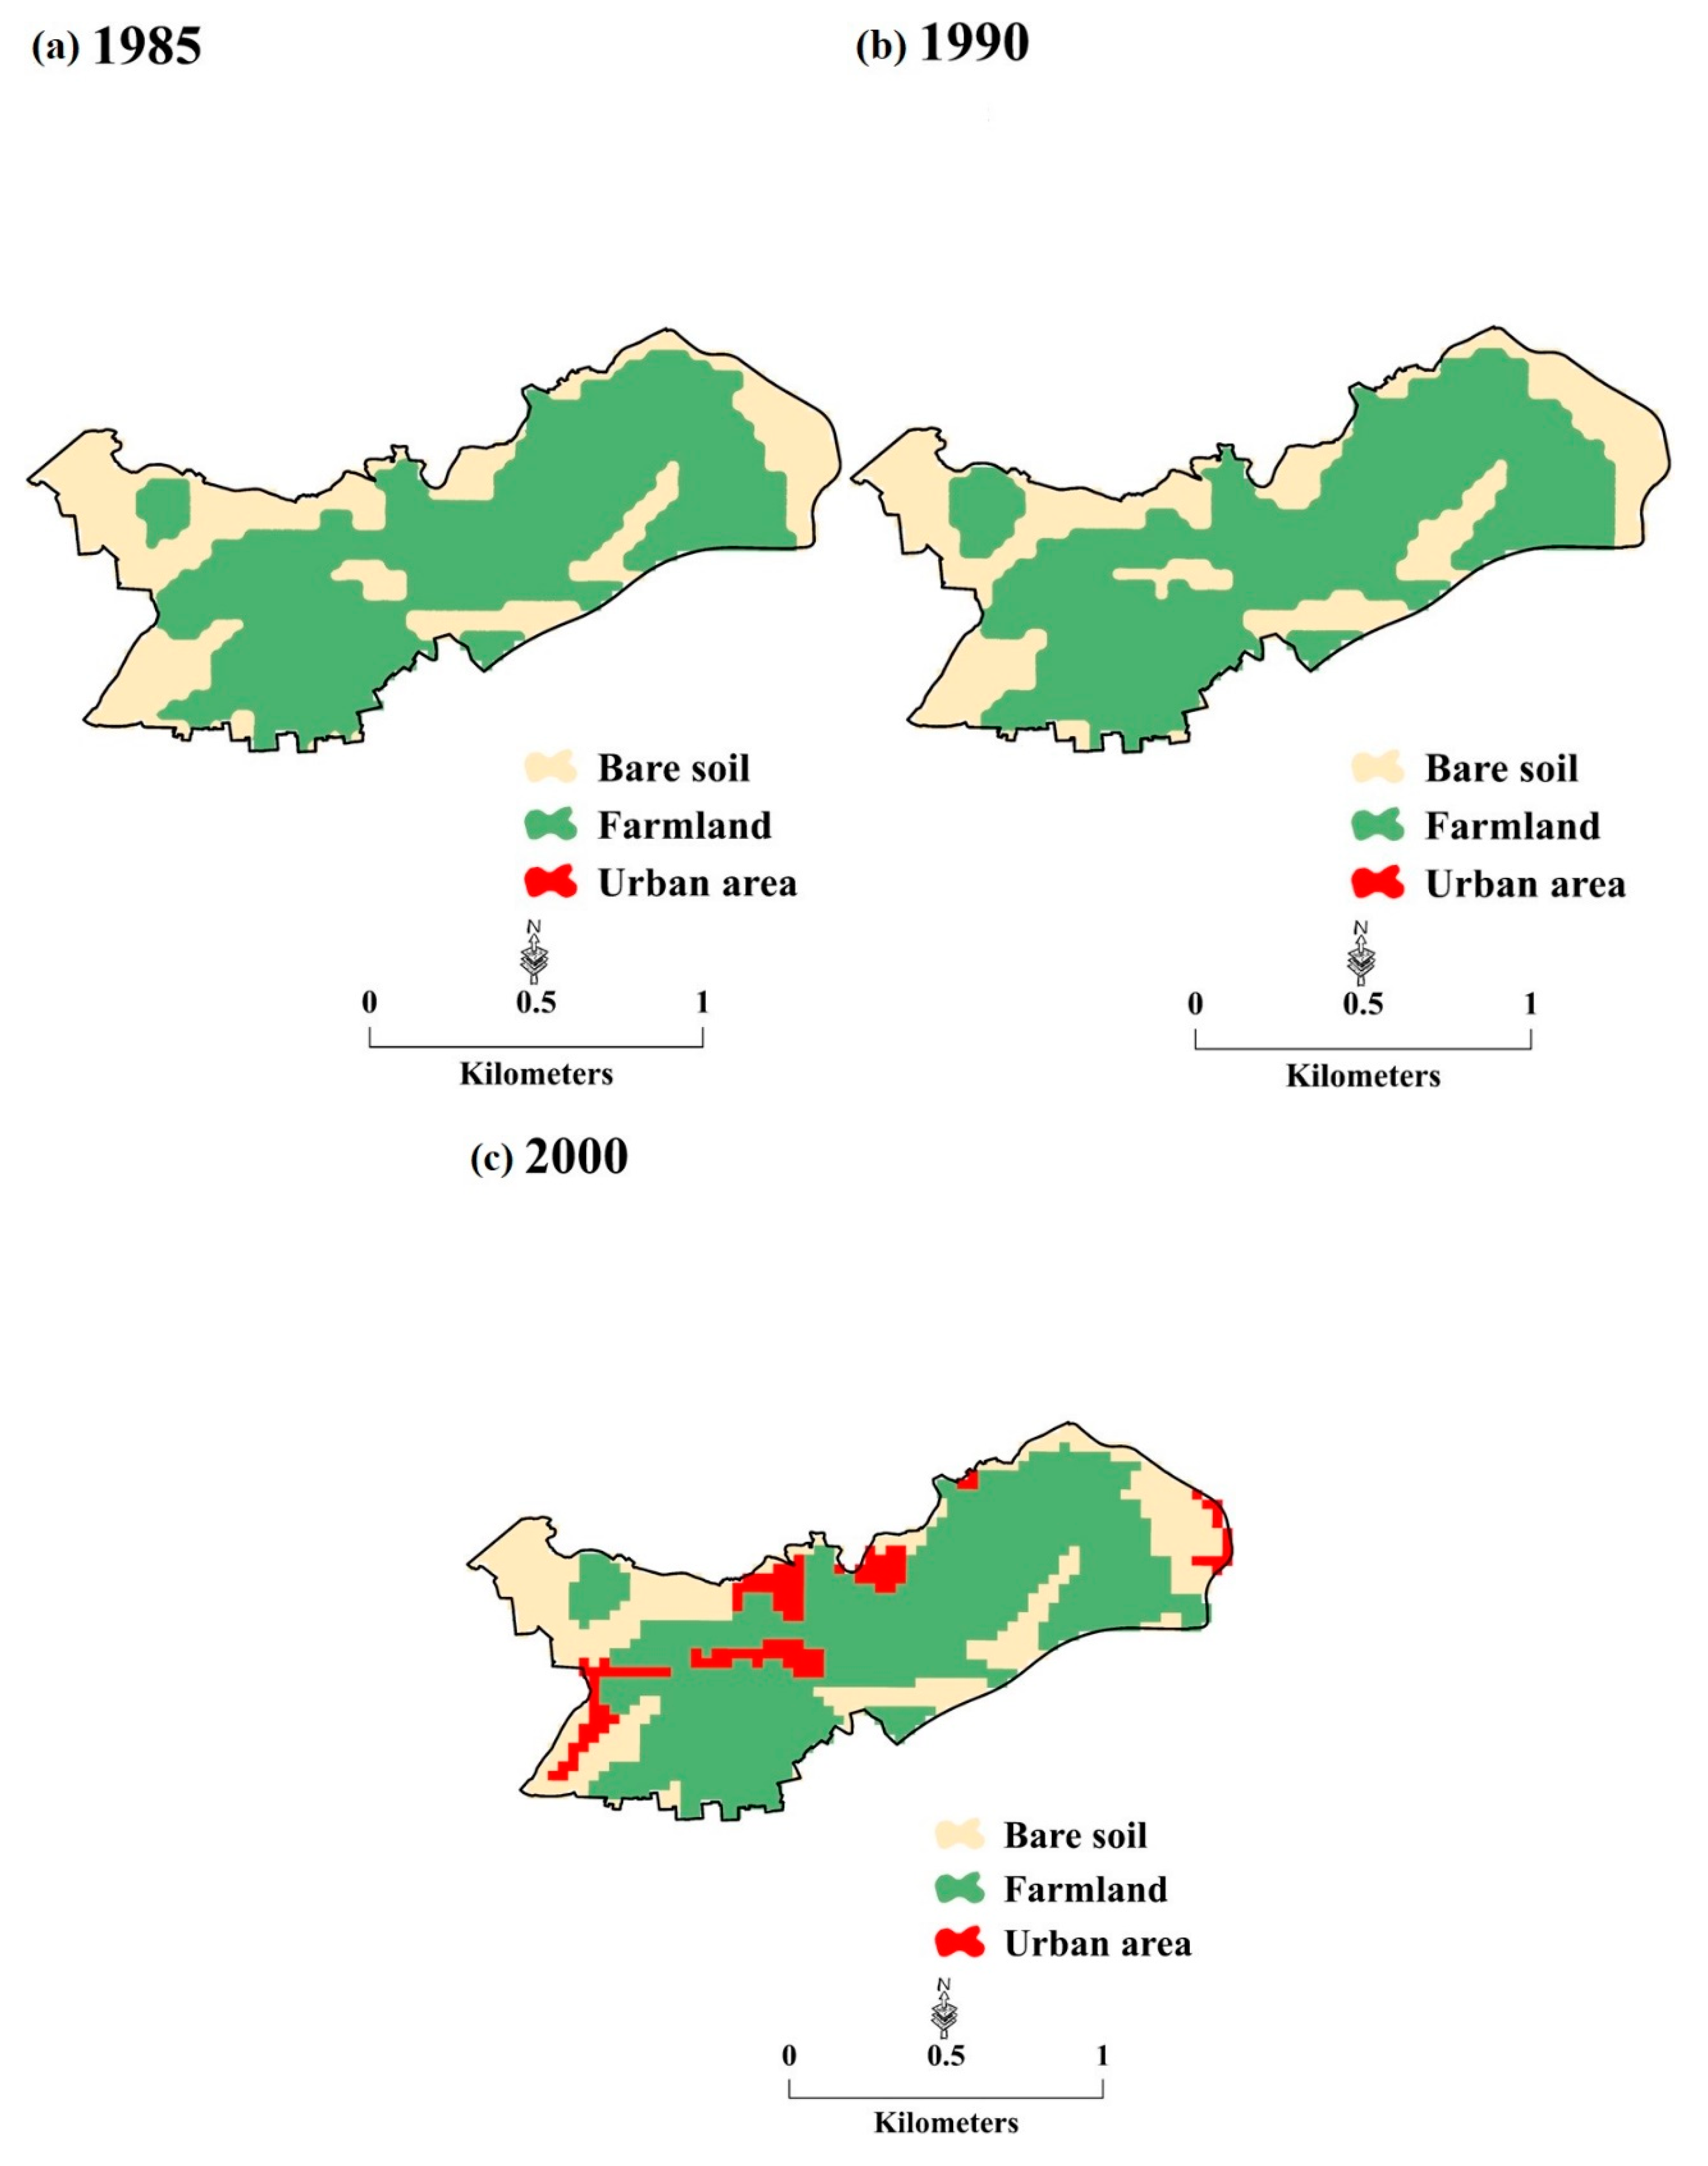
3.5. LULC Detection of Aflaj

Figure 13(a–d), Figure 14(a–d), Figure 15(a–d) and Figure 16(a–d) show the LULC classification of Falaj Al-Khatmain (Figure 13), Falaj Al-Maliki (Figure 14), Falaj Al-Muyasser (Figure 15), and Falaj Daris (Figure 16) for the years 1985, 1990, 2000, 2013, and 2021. Three LULC classes were developed, as shown in Figure 13, Figure 14, Figure 15 and Figure 16. These three classes (urban area, farmland, and bore soil) were represented with different colors to see and feature the direction of changes in the study areas. The total area of Falaj Al-Khatmeen was 135.99 ha. The estimated agricultural (farmland) was 88.74 ha (65%) in 1985, 88.92 ha (65%) in 1990, 85.41 ha (63%) in 2000, 82.35 ha (61%) in 2013, and 72.63 ha (53%) in 2021. The total area of Falaj Daris was 259.92 ha. The estimated farmland was 223.02 ha (86%) in 1985, 224.19 ha (86%) in 1990, 223.2 ha (86%) in 2000, 189.36 ha (73%) in 2013, and 153.45 ha (53%) in 2021. The total area of Falaj Al- Muyasser was 183.24 ha. The estimated farmland was 136.35 ha in 1985, 136.44 ha in 1990, 128.61 ha in 2000, 112.77 ha in 2013, and 93.29 ha in 2021. The total area of Falaj Al-Maliki was 248.94 ha. The estimated farmland was 140.13 ha (56%) in 1985, 146.88 ha (59%) in 1990, 144.63 ha (58%) in 2000, 51 ha (21%) in 2013, and 59 ha (24%) in 2021.
Figure 17a–d depict the LULC changes in Falaj Al-Khatmeen, Falaj Al-Maliki, Falaj Al-Muyasser, and Falaj Daris over four time periods (1985–1990, 1990–2000, 2000–2013, and 2013–2021). In Falaj Al-Khatmeen, the major land cover type transitions were from VC (agriculture land/croplands) to BS and from VC to UA (Figure 17a). It should be noted that 58% of the transition from VC to UA in Falaj Al-Khatmeen occurred between 2000 and 2013. In Falaj Al-Maliki, the major land cover type transitions were from VC to UA and from VC to BS (Figure 17b). The major land cover type transition in Falaj Al-Maliki was from VC to UA and from VC to BS (Figure 17b). The major land cover type transitions in Falaj Al-Muyasser were from VC to UA and from BS to UA (Figure 15c). The major land cover transition in Falaj Daris was from VC to UA (Figure 17d). This study suggests that there was a significant reduction in farmland areas not only in the aflaj systems of the current study, but throughout Oman’s entire aflaj systems. The abrupt transition to barren land implies either a permanent shift in the flow of the falaj or the abandonment of the land for economic reasons. Because of the decline in land farms used for urban areas during the study period, there was also a significant shift towards structures.

4. Discussion

In this study, the impact of LULC changes on aflaj systems in northern Oman was examined using Landsat remote sensing data. The study covered a period of 36 years, from 1985 to 2021, and focused on 7 cities in the region. The use of Landsat remote sensing data allowed for the detection and analysis of LULC changes that occurred over the 35-year period. The object-based image analysis technique was used to extract information from satellite data, and the post-classification change detection method was employed to detect and monitor LULC changes. This study indicated that the urban expansion of the seven study cities resulted in a considerable reduction of wetlands, groundwater cultivated areas, vegetation cover, and water bodies. The results showed that UA increased from 3460 ha in 1985 to 39,727 ha in 2021, while vegetation lands decreased by 7618 ha (see Figure 4, Figure 5, Figure 6, Figure 7, Figure 8, Figure 9 and Figure 10). The growth of the BS category was the highest for the 1985–2021 period (see Figure 4e, Figure 5e, Figure 6e, Figure 7e, Figure 8e, Figure 9e and Figure 10e). Thus, the most significant increase was observed in the BS category, which is a cause for concern given its implications for the sustainability of the aflaj systems. It is worth noting that despite the rising urbanization, the seven studied cities can still accommodate additional populations (see Figure 10). However, the significant growth in UAs is alarming, especially for the groundwater sources, particularly the aflaj systems. The implications of these changes on the sustainability of the aflaj systems and their potential consequences for local communities are discussed in the subsequent sections.
The phenomenon of BS growth or land degradation is attributable to a diverse array of causal factors, ranging from anthropogenic activities, such as deforestation, unsustainable farming practices, and overgrazing by livestock, to natural elements, such as climate change and extreme weather events [64,65]. In Oman, the escalation of BS coverage between 1985 and 2021 could be linked to a range of contributory factors, including the expansion of agriculture and urbanization, overgrazing by livestock, and the impacts of climate change, such as heightened temperatures and prolonged droughts. Nevertheless, it is crucial to acknowledge that the current response is reliant on broad trends and factors that may be linked to bare soil growth worldwide, as there is no access to Oman’s bare soil-specific data.
To elaborate on the impact of LULC changes on aflaj systems, it is important to note that these traditional irrigation systems rely heavily on groundwater resources. Changes in LULC can significantly affect the quantity and quality of groundwater resources available for the aflaj systems, thereby threatening their sustainability. The reduction in VC, for example, can lead to increased runoff, reduced infiltration, and ultimately decreased groundwater recharge, which are critical for the functioning of the aflaj systems. Similarly, the expansion of UAs can increase the demand for groundwater resources, leading to overextraction and depletion of the aquifers. This situation can have severe consequences for local communities, especially in arid and semiarid regions where water resources are limited. The loss of the aflaj systems can lead to a significant reduction in agricultural productivity, which can have far-reaching implications for the economy and the livelihoods of local communities.
Despite legislation regulating well drilling and protecting the aflaj from pollution [66,67], our findings indicate that many wells were drilled within the aflaj mothers’ boundaries (see Figure 12). As a result, many aflaj systems experienced low flow rates, dryness, and pollution, while others remained exposed to these issues due to the rapid urban expansion towards the aflaj and the drilling of numerous wells within their boundaries. This situation has exerted pressure on the aflaj systems, reducing their capacity to provide water to the communities that rely on them. Furthermore, the increasing pollution in the aflaj systems due to the discharge of untreated waste from UAs is a significant concern, as it affects the quality of water and has a negative impact on the health of the communities that rely on these systems. Therefore, it is crucial to regulate the drilling of wells and protect the aflaj from pollution to ensure the sustainability of the systems and the wellbeing of local communities.
Our results showed that VC increased between 1990 and 2000 in most of the study area. The reasons may be due to the greater availability of money (people’s income has risen in recent years as a result of increased oil revenues) to dig wells and the desire to expand their cultivation lands. Another explanation lies in the fact that in response to these threats to the aflaj systems, the government of Oman enacted a series of laws in 1990–2000 to protect aflaj [68]. These laws restrict wells from being sunk in the vicinity of aflaj and prohibit converting falaj agricultural lands to other purposes, such as houses. It should also be noted that globalization and its effects on the transformation of many Omani families from extended families to nuclear families were not highly influential at that time, particularly for those families living in agricultural and rural locations. Further research is needed to fully understand the complex interactions between sociocultural and environmental factors and their impact on land use and vegetation cover in the study area.
Our research found that LULC change patterns were likely to have a significant impact on watershed hydrology because mined and reclaimed areas have lower infiltration capacity and thus cause more repaid runoff than unmined forest watersheds. A previous study found that cyclones impacted several aflaj systems in Oman [69]. Therefore, the country experiences both drought syndrome and flood problems as a result of the spatiotemporal variability in precipitation. Groundwater overuse causes drainage low flows to decrease, groundwater resources to deteriorate, and saltwater intrusion in aquifers in coastal regions like wilayat Sohar [70]. Another study discovered that when the watershed’s UA changed from mostly agricultural to mixed rural and urban lands, velocity, sediments, and nutrients decreased [71]. This would increase the likelihood of extreme flooding during heavy rainfall events.
Therefore, our study suggests that the massive range of transitions from VC to UA could be the reason behind the decline of aflaj levels or their drying out for the particular period of study from 2000 to 2021. Although the overall population does not surpass 5 million people living in an area of 309,501 km2 (https://www.ncsi.gov.om/) (accessed on 30 December 2020), the majority of urbanization occurred at the expense of agricultural land, which accounted for approximately 7.07% of the total land in Oman. Previous research found that, since 1970, aggressive groundwater pumping has depleted the aquifers on which the aflaj rely [16,72]. As a result, many members of the younger generation are looking for work in other fields [73]. Furthermore, because each falaj is governed locally, a drop in the falaj’s economic value results in a decline in the revenue the falaj can generate to fund its upkeep [74] (Powers et al., 2018). Another reason that might be considered to be behind this disparity is based on cultural practices in dealing with aflaj systems [10,13]. Additionally, because each falaj is run locally, a decline in its economic value reduces the amount of money it can bring in to pay for its upkeep. As a result, over time, the falaj’s flow rate would be negatively impacted by a lack of maintenance, posing a threat to their viability.
The second part of this study, Landsat data were used to examine the LULCs and their impact on Falaj Al-Khatmeen, Falaj Al-Maliki, Falaj Al-Muyasser, and Falaj Daris over four time periods (1985–1990, 1990–2000, 2000–2013, and 2013–2021). As the date palm tree is the main crop in the four aflaj study areas, Landsat data were linked to calculate the amount of changes in date palm cultivation. Our findings found that the major land cover type transitions were from VC (agricultural/date palm cultivation) to BS and from VC to UA (see Figure 13, Figure 14, Figure 15, Figure 16 and Figure 17). An earlier study, Al-Kindi and Janizadeh, 2022 [75], found that LULC changes are one of the human factors that play an important role in impacting the groundwater aflaj potential mapping in Nizwa using Sentinel-2, GIS, and LiDAR data and analysis. Previous studies also indicated that the regional vegetation ecosystem change caused by LULC changes remarkably affect the regional hydrological cycle [41,76]. This study recommends the need to stop urbanization in the areas designated for the mothers of the aflaj, that is, stopping urban expansion at the expense of arable soil. Other recommendations include refusing to grant licenses to convert agricultural land into residential land; the distribution of residential land in places far from valley estuaries, which will give an opportunity to slow down the runoff and the deposition of water to the underground reserve; and imposing fees on owners of funds, real estate, and farms near the mothers of the aflaj to contribute to the repair and maintenance of the farms and preserve them for future generations. Although formal measures existed, these violations had a significant impact on groundwater reserves and the flow rate of aflaj water.
This study suggests the Landsat images from 1985 to 2021 were adequate to determine various types of LULC in terms of VC, UA, BS, water bodies, and farmland or date palm canopy, which represent permanently cropped area. Changes in land use thus correspond to how the past decades have witnessed changes in date palm canopy in the study area.
Our future research endeavors will involve the use of cutting-edge technology, such as remote sensing, GIS, and machine learning techniques, to comprehensively examine the spatial patterns and flow rates of aflaj systems on a large scale. By identifying the most important spatial factor permutations, we aim to safeguard aflaj systems from external provocations. We propose that a holistic understanding of environmental, hydrogeological, climatic, cultural, and socioeconomic indicators is crucial in determining the distribution and longevity of aflaj systems, as well as in comprehending LULC changes and their impact on these systems. In this context, exploring links between the geographical distribution of aflaj systems and various environmental conditions, such as water quality, altitude, aspect, slope aspect, aflaj flow velocity, water type, soil type, soil salinity, geomorphology, hill shade, and solar radiation, can offer valuable insights. To further investigate these correlations, we suggest analyzing the relationships between independent variables, such as temperature, soil moisture, weather patterns, global warming, and the dependent variable of the geographical distribution of aflaj systems. In addition to environmental factors, cultural practices associated with falaj systems and socioeconomic factors, such as aflaj maintenance costs, the transition of agricultural land to housing or industrial areas, globalization and its impact on aflaj systems, and the depth of the aquifer, can also play a critical role in comprehending aflaj systems. By establishing such links, we aim to deepen our understanding of aflaj systems and develop measures to preserve and protect these critical components of Oman’s cultural and ecological heritage.

5. Conclusions

This study employs a comprehensive spatiotemporal analysis of remote sensing data from 1985 to 2021 to assess the land use and land cover (LULC) transformations and their impacts on aflaj systems in the Sultanate of Oman. Our investigation demonstrates that, across the four observation periods (1985–1990, 1990–2000, 2000–2013, and 2013–2021), a substantial proportion of the total areas of Falaj Al-Muyasser, Falaj Daris, Falaj Al-Maliki, and Falaj Al-Khatmeen, namely, 40%, 39%, 32%, and 8%, respectively, have been converted from agricultural lands to urban zones. This urban expansion trend poses a major threat to the sustainability of the aflaj systems, as it encroaches upon the lands utilized for agriculture, negatively impacts the soil quality, and jeopardizes social cohesion. Based on our findings, we propose the implementation of agricultural and hydrological policies that encourage the use of GIS and remote sensing tools for the regular monitoring and evaluation of aflaj systems at a daily or monthly frequency. Such policies could facilitate the surveillance of the aflaj systems, lead to better intervention and control, and promote the long-term sustainability of groundwater resources in the Sultanate of Oman. Additionally, it is imperative to regulate the drilling of wells and safeguard the aflaj systems from pollution to ensure their sustained capacity to supply water to the communities that rely on them.

Author Contributions

Conceptualization, K.M.A.-K. and A.F.A.; methodology, K.M.A.-K. and A.F.A.; software, K.M.A.-K., and A.F.A.; validation, K.M.A.-K., A.A.-G. and D.P.; formal analysis, K.M.A.-K.; investigation, K.M.A.-K., A.F.A., A.A.-G.; resources, K.M.A.-K. and A.F.A.; data curation, K.M.A.-K. and A.F.A.; writing—original draft preparation, K.M.A.-K. and A.F.A.; writing—review and editing, K.M.A.-K.; visualization, K.M.A.-K.; supervision, K.M.A.-K. and A.F.A.; project administration, K.M.A.-K., A.A.-G. and D.P; funding acquisition, K.M.A.-K. All authors have read and agreed to the published version of the manuscript.

Funding

This project is funded by the Sultanate of Oman’s Ministry of Higher Education Innovation and Research (BFP/RGP/EBR/22/010) and the Sultan Qaboos Higher Center for Culture and Science—Diwan of the Royal Court (ARU/SOHCCS/2016/17/1).

Institutional Review Board Statement

Not applicable.

Informed Consent Statement

Not applicable.

Data Availability Statement

Contact information for the researchers who collected the data, in case additional information or access is needed.

Acknowledgments

We thank the Sultan Qaboos Higher Center for Culture and Science—Diwan of Royal Court, Oman, for their assistance and the instruments used in this study. We would like also to thank Oman’s Ministry of Agriculture, Fisheries Wealth, and Water Resources in Oman for their assistance and for providing the aflaj systems data.

Conflicts of Interest

The authors declare no conflict of interest.

References

  1. Schilling, K.E.; Jha, M.K.; Zhang, Y.-K.; Gassman, P.W.; Wolter, C.F. Impact of Land Use and Land Cover Change on the Water Balance of a Large Agricultural Watershed: Historical Effects and Future Directions. Water Resour. Res. 2008, 44. [Google Scholar] [CrossRef]
  2. Nigatu, Z.M.; Fan, D.; You, W.; Melesse, A.M.; Pu, L.; Yang, X.; Wan, X.; Jiang, Z. Crop Production Response to Soil Moisture and Groundwater Depletion in the Nile Basin Based on Multi-Source Data. Sci. Total Environ. 2022, 825, 154007. [Google Scholar] [CrossRef] [PubMed]
  3. Bisselink, B.; Bernhard, J.; Gelati, E.; Adamovic, M.; Guenther, S.; Mentaschi, L.; De Roo, A. Impact of a Changing Climate, Land Use, and Water Usage on Europe’s Water Resources; A Model Simul. Study; Joint Research Centre (JRC): Karlsruhe, Germany, 2018. [Google Scholar]
  4. Dunn, S.M.; Brown, I.; Sample, J.; Post, H. Relationships between Climate, Water Resources, Land Use and Diffuse Pollution and the Significance of Uncertainty in Climate Change. J. Hydrol. 2012, 434, 19–35. [Google Scholar] [CrossRef]
  5. Elmahdy, S.; Mohamed, M.; Ali, T. Land Use/land Cover Changes Impact on Groundwater Level and Quality in the Northern Part of the United Arab Emirates. Remote Sens. 2020, 12, 1715. [Google Scholar] [CrossRef]
  6. Schilling, K.E.; Chan, K.-S.; Liu, H.; Zhang, Y.-K. Quantifying the Effect of Land Use Land Cover Change on Increasing Discharge in the Upper Mississippi River. J. Hydrol. 2010, 387, 343–345. [Google Scholar] [CrossRef]
  7. Rajmohan, N.; Al-Futaisi, A.; Jamrah, A. Evaluation of Long-Term Groundwater Level Data in Regular Monitoring Wells, Barka, Sultanate of Oman. Hydrol. Process. 2007, 21, 3367–3379. [Google Scholar] [CrossRef]
  8. Al-Nasri, A.-M.; Gunawardhana, L.N.; Al-Rawas, G.A.; Baawain, M.S.; Sana, A. Multi-Layer Groundwater Flow Simulation in Al-Khoud Lower Catchment in Oman. J. Appl. Water Eng. Res. 2022, 10, 250–260. [Google Scholar] [CrossRef]
  9. S. Choudri, B.; Al-Busaidi, A.; Ahmed, M. Climate Change, Vulnerability and Adaptation Experiences of Farmers in Al-Suwayq Wilayat, Sultanate of Oman. Int. J. Clim. Chang. Strateg. Manag. 2013, 5, 445–454. [Google Scholar] [CrossRef]
  10. Remmington, G. Transforming Tradition: The Aflaj and Changing Role of Traditional Knowledge Systems for Collective Water Management. J. Arid Environ. 2018, 151, 134–140. [Google Scholar] [CrossRef]
  11. Al-Zadjali, S.; Al-Rawahi, Z.; Al-Brashdi, H. Bader. Adv. Meteorol. 2021, 2021, 5543205. [Google Scholar] [CrossRef]
  12. Al-Kindi, K.M.; Al Nadhairi, R.; Al Akhzami, S. Dynamic Change in Normalised Vegetation Index (NDVI) from 2015 to 2021 in Dhofar, Southern Oman in Response to the Climate Change. Agriculture 2023, 13, 592. [Google Scholar] [CrossRef]
  13. Al-Marshoudi, A.S.; Bin Sibly, S.; Khelghat-Doost, H. Successfully Mutual Cooperative Collective Action: Principle of Institutional Arrangement of the Aflaj Irrigation System in Sultanate of Oman BT-Water Resources in Arid Lands: Management and Sustainability; Al-Maktoumi, A., Abdalla, O., Kacimov, A., Zekri, S., Chen, M., Al-Hosni, T., Madani, K., Eds.; Springer International Publishing: Cham, Switzerland, 2021; pp. 175–184. [Google Scholar]
  14. Alsharhan, A.S.; Rizk, Z.E. Aflaj Systems: History and Factors Affecting Recharge and Discharge BT-Water Resources and Integrated Management of the United Arab Emirates; Alsharhan, A.S., Rizk, Z.E., Eds.; Springer International Publishing: Cham, Switzerland, 2020; pp. 257–280. ISBN 978-3-030-31684-6. [Google Scholar]
  15. Zekri, S.; Powers, D.; Al-Ghafri, A. Century Old Water Markets in Oman BT-Water Markets for the 21st Century: What Have We Learned? Easter, K.W., Huang, Q., Eds.; Springer Netherlands: Dordrecht, The Netherlands, 2014; pp. 149–162. ISBN 978-94-017-9081-9. [Google Scholar]
  16. Norman, W.R.; Shayya, W.H.; Al-Ghafri, A.S.; McCANN, I.R. Aflaj Irrigation and on-Farm Water Management in Northern Oman. Irrig. Drain. Syst. 1997, 12, 35–48. [Google Scholar] [CrossRef]
  17. Ghrefat, H.A.; Jamarh, A.; Al-Futaisi, A.; Al-Abri, B. Water Quality Mapping and Assessment, and Weathering Processes of Selected Aflaj in Oman. Environ. Monit. Assess. 2011, 181, 509–524. [Google Scholar] [CrossRef]
  18. Al-Marshudi, A.S. Traditional Irrigated Agriculture in Oman. Water Int. 2001, 26, 259–264. [Google Scholar] [CrossRef]
  19. Alsharhan, A.S.; Rizk, Z.E. Challenges Facing Water Resources BT-Water Resources and Integrated Management of the United Arab Emirates; Alsharhan, A.S., Rizk, Z.E., Eds.; Springer International Publishing: Cham, Switzerland, 2020; pp. 501–529. ISBN 978-3-030-31684-6. [Google Scholar]
  20. Deadman, M.L.; Al-Sadi, A.M.; Al-Wardi, M.M.; Al-Kiyumi, K.S.M.; Deadman, W.M.; Al Said, F.A. Spatio-Temporal Dynamics of Land Use Changes in Response to External Pressures in Oman: Greenhouse Cropping as an Example. J. Agric. Mar. Sci. 2016, 21, 33–46. [Google Scholar] [CrossRef] [Green Version]
  21. Harris, R. Remote Sensing of Agriculture Change in Oman. Int. J. Remote Sens. 2003, 24, 4835–4852. [Google Scholar] [CrossRef]
  22. Schütze, N.; Kloss, S.; Lennartz, F.; Al Bakri, A.; Schmitz, G.H. Optimal Planning and Operation of Irrigation Systems under Water Resource Constraints in Oman Considering Climatic Uncertainty. Environ. Earth Sci. 2012, 65, 1511–1521. [Google Scholar] [CrossRef]
  23. Kotagama, H.; Zekri, S.; Al Harthi, R.; Boughanmi, H. Demand Function Estimate for Residential Water in Oman. Int. J. Water Resour. Dev. 2017, 33, 907–916. [Google Scholar] [CrossRef]
  24. Kumar, C.P. Climate Change and Its Impact on Groundwater Resources. Int. J. Eng. Sci. 2012, 1, 43–60. [Google Scholar]
  25. Li, P.; Tian, R.; Xue, C.; Wu, J. Progress, Opportunities, and Key Fields for Groundwater Quality Research under the Impacts of Human Activities in China with a Special Focus on Western China. Environ. Sci. Pollut. Res. 2017, 24, 13224–13234. [Google Scholar] [CrossRef] [PubMed]
  26. Viana, C.M.; Girão, I.; Rocha, J. Long-Term Satellite Image Time-Series for Land Use/Land Cover Change Detection Using Refined Open Source Data in a Rural Region. Remote Sens. 2019, 11, 1104. [Google Scholar] [CrossRef] [Green Version]
  27. Chughtai, A.H.; Abbasi, H.; Karas, I.R. A Review on Change Detection Method and Accuracy Assessment for Land Use Land Cover. Remote Sens. Appl. Soc. Environ. 2021, 22, 100482. [Google Scholar] [CrossRef]
  28. Allam, M.; Bakr, N.; Elbably, W. Multi-Temporal Assessment of Land Use/land Cover Change in Arid Region Based on Landsat Satellite Imagery: Case Study in Fayoum Region, Egypt. Remote Sens. Appl. Soc. Environ. 2019, 14, 8–19. [Google Scholar] [CrossRef]
  29. Onilude, O.O.; Vaz, E. Urban Sprawl and Growth Prediction for Lagos Using GlobeLand30 Data and Cellular Automata Model. Science 2021, 3, 23. [Google Scholar] [CrossRef]
  30. Pulido-Velazquez, M.; Peña-Haro, S.; García-Prats, A.; Mocholi-Almudever, A.F.; Henriquez-Dole, L.; Macian-Sorribes, H.; Lopez-Nicolas, A. Integrated Assessment of the Impact of Climate and Land Use Changes on Groundwater Quantity and Quality in the Mancha Oriental System (Spain). Hydrol. Earth Syst. Sci. 2015, 19, 1677–1693. [Google Scholar] [CrossRef] [Green Version]
  31. Butt, A.; Shabbir, R.; Ahmad, S.S.; Aziz, N. Land Use Change Mapping and Analysis Using Remote Sensing and GIS: A Case Study of Simly Watershed, Islamabad, Pakistan. Egypt. J. Remote Sens. Sp. Sci. 2015, 18, 251–259. [Google Scholar] [CrossRef] [Green Version]
  32. Leh, M.; Bajwa, S.; Chaubey, I. Impact of Land Use Change on Erosion Risk: An Integrated Remote Sensing, Geographic Information System and Modeling Methodology. Land Degrad. Dev. 2013, 24, 409–421. [Google Scholar] [CrossRef]
  33. Allafta, H.; Opp, C.; Patra, S. Identification of Groundwater Potential Zones Using Remote Sensing and GIS Techniques: A Case Study of the Shatt Al-Arab Basin. Remote Sens. 2020, 13, 112. [Google Scholar] [CrossRef]
  34. Rai, P.K.; Chandel, R.S.; Mishra, V.N.; Singh, P. Hydrological Inferences through Morphometric Analysis of Lower Kosi River Basin of India for Water Resource Management Based on Remote Sensing Data. Appl. Water Sci. 2018, 8, 15. [Google Scholar] [CrossRef] [Green Version]
  35. Luedeling, E.; Buerkert, A. Effects of Land Use Changes on the Hydrological Sustainability of Mountain Oases in Northern Oman. Plant Soil 2008, 304, 1–20. [Google Scholar] [CrossRef]
  36. Buerkert, A.; Dix, B.A.; Al Rawahi, M.N.; Schlecht, E. Agro-Ecological Landuse Transformation in Oasis Systems of Al Jabal Al Akhdar, Northern Oman. Sci. Rep. 2021, 11, 7709. [Google Scholar] [CrossRef] [PubMed]
  37. Mansour, S.; Al-Belushi, M.; Al-Awadhi, T. Monitoring Land Use and Land Cover Changes in the Mountainous Cities of Oman Using GIS and CA-Markov Modelling Techniques. Land Use Policy 2020, 91, 104414. [Google Scholar] [CrossRef]
  38. Burri, N.M.; Weatherl, R.; Moeck, C.; Schirmer, M. A Review of Threats to Groundwater Quality in the Anthropocene. Sci. Total Environ. 2019, 684, 136–154. [Google Scholar] [CrossRef]
  39. Han, D.; Currell, M.J. Review of Drivers and Threats to Coastal Groundwater Quality in China. Sci. Total Environ. 2022, 806, 150913. [Google Scholar] [CrossRef]
  40. Al-Kindi, K.M.; Kwan, P.; Andrew, N.R.; Welch, M. Remote Sensing and Spatial Statistical Techniques for Modelling Ommatissus Lybicus (Hemiptera: Tropiduchidae) Habitat and Population Densities. PeerJ 2017, 2017, e3752. [Google Scholar] [CrossRef] [PubMed] [Green Version]
  41. Nath, B.; Ni-Meister, W.; Choudhury, R. Impact of Urbanization on Land Use and Land Cover Change in Guwahati City, India and Its Implication on Declining Groundwater Level. Groundw. Sustain. Dev. 2021, 12, 100500. [Google Scholar] [CrossRef]
  42. Liaqat, M.U.; Mohamed, M.M.; Chowdhury, R.; Elmahdy, S.I.; Khan, Q.; Ansari, R. Impact of Land Use/land Cover Changes on Groundwater Resources in Al Ain Region of the United Arab Emirates Using Remote Sensing and GIS Techniques. Groundw. Sustain. Dev. 2021, 14, 100587. [Google Scholar] [CrossRef]
  43. Lu, D.; Mausel, P.; Brondízio, E.; Moran, E. Change Detection Techniques. Int. J. Remote Sens. 2004, 25, 2365–2401. [Google Scholar] [CrossRef]
  44. Vicente-Serrano, S.M.; Pérez-Cabello, F.; Lasanta, T. Assessment of Radiometric Correction Techniques in Analyzing Vegetation Variability and Change Using Time Series of Landsat Images. Remote Sens. Environ. 2008, 112, 3916–3934. [Google Scholar] [CrossRef]
  45. Asner, G.P. Cloud Cover in Landsat Observations of the Brazilian Amazon. Int. J. Remote Sens. 2001, 22, 3855–3862. [Google Scholar] [CrossRef]
  46. Hossain, M.D.; Chen, D. Segmentation for Object-Based Image Analysis (OBIA): A Review of Algorithms and Challenges from Remote Sensing Perspective. ISPRS J. Photogramm. Remote Sens. 2019, 150, 115–134. [Google Scholar] [CrossRef]
  47. Benz, U.C.; Hofmann, P.; Willhauck, G.; Lingenfelder, I.; Heynen, M. Multi-Resolution, Object-Oriented Fuzzy Analysis of Remote Sensing Data for GIS-Ready Information. ISPRS J. Photogramm. Remote Sens. 2004, 58, 239–258. [Google Scholar] [CrossRef]
  48. Breiman, L. Random Forests. Mach. Learn. 2001, 45, 5–32. [Google Scholar] [CrossRef] [Green Version]
  49. Belgiu, M.; Drăguţ, L. Random Forest in Remote Sensing: A Review of Applications and Future Directions. ISPRS J. Photogramm. Remote Sens. 2016, 114, 24–31. [Google Scholar] [CrossRef]
  50. Smith, A. Image Segmentation Scale Parameter Optimization and Land Cover Classification Using the Random Forest Algorithm. J. Spat. Sci. 2010, 55, 69–79. [Google Scholar] [CrossRef]
  51. Duro, D.C.; Franklin, S.E.; Dubé, M.G. A Comparison of Pixel-Based and Object-Based Image Analysis with Selected Machine Learning Algorithms for the Classification of Agricultural Landscapes Using SPOT-5 HRG Imagery. Remote Sens. Environ. 2012, 118, 259–272. [Google Scholar] [CrossRef]
  52. Stefanski, J.; Mack, B.; Waske, B. Optimization of Object-Based Image Analysis With Random Forests for Land Cover Mapping. IEEE J. Sel. Top. Appl. Earth Obs. Remote Sens. 2013, 6, 2492–2504. [Google Scholar] [CrossRef]
  53. Promper, C.; Puissant, A.; Malet, J.-P.; Glade, T. Analysis of Land Cover Changes in the Past and the Future as Contribution to Landslide Risk Scenarios. Appl. Geogr. 2014, 53, 11–19. [Google Scholar] [CrossRef]
  54. Liu, X.; Kang, C.; Gong, L.; Liu, Y. Incorporating Spatial Interaction Patterns in Classifying and Understanding Urban Land Use. Int. J. Geogr. Inf. Sci. 2016, 30, 334–350. [Google Scholar] [CrossRef]
  55. Tucker, C.J.; Pinzon, J.E.; Brown, M.E.; Slayback, D.A.; Pak, E.W.; Mahoney, R.; Vermote, E.F.; El Saleous, N. An Extended AVHRR 8-km NDVI Dataset Compatible with MODIS and SPOT Vegetation NDVI Data. Int. J. Remote Sens. 2005, 26, 4485–4498. [Google Scholar] [CrossRef]
  56. Lyons, M.B.; Keith, D.A.; Phinn, S.R.; Mason, T.J.; Elith, J. A Comparison of Resampling Methods for Remote Sensing Classification and Accuracy Assessment. Remote Sens. Environ. 2018, 208, 145–153. [Google Scholar] [CrossRef]
  57. Congalton, R.G. A Review of Assessing the Accuracy of Classifications of Remotely Sensed Data. Remote Sens. Environ. 1991, 37, 35–46. [Google Scholar] [CrossRef]
  58. Serra, P.; Pons, X.; Saurí, D. Post-Classification Change Detection with Data from Different Sensors: Some Accuracy Considerations. Int. J. Remote Sens. 2003, 24, 3311–3340. [Google Scholar] [CrossRef]
  59. Thakkar, A.K.; Desai, V.R.; Patel, A.; Potdar, M.B. Post-Classification Corrections in Improving the Classification of Land Use/Land Cover of Arid Region Using RS and GIS: The Case of Arjuni Watershed, Gujarat, India. Egypt. J. Remote Sens. Space Sci. 2017, 20, 79–89. [Google Scholar] [CrossRef] [Green Version]
  60. Alqurashi, A.F.; Kumar, L. An Assessment of the Impact of Urbanization and Land Use Changes in the Fast-Growing Cities of Saudi Arabia. Geocarto Int. 2019, 34, 78–97. [Google Scholar] [CrossRef]
  61. Megdiche-Kharrat, F.; Moussa, M.; Rejeb, H. Aflaj’ Water Management in Oman: The Case of Falaj Al-Khatmeen in Birkat Al-Mouz, Wilayat Nizwa BT-Water and Land Security in Drylands: Response to Climate Change; Ouessar, M., Gabriels, D., Tsunekawa, A., Evett, S., Eds.; Springer International Publishing: Cham, Switzerland, 2017; pp. 119–128. ISBN 978-3-319-54021-4. [Google Scholar]
  62. Behrens, T.; Schmidt, K.; Viscarra Rossel, R.A.; Gries, P.; Scholten, T.; MacMillan, R.A. Spatial Modelling with Euclidean Distance Fields and Machine Learning. Eur. J. Soil Sci. 2018, 69, 757–770. [Google Scholar] [CrossRef]
  63. Zhang, J. Multi-Source Remote Sensing Data Fusion: Status and Trends. Int. J. Image Data Fusion 2010, 1, 5–24. [Google Scholar] [CrossRef] [Green Version]
  64. Rockström, J.; Steffen, W.; Noone, K.; Persson, Å.; Chapin III, F.S.; Lambin, E.; Lenton, T.M.; Scheffer, M.; Folke, C.; Schellnhuber, H.J. Planetary Boundaries: Exploring the Safe Operating Space for Humanity. Ecol. Soc. 2009, 14. [Google Scholar] [CrossRef]
  65. Lal, R. Soil Degradation by Erosion. Land Degrad. Dev. 2001, 12, 519–539. [Google Scholar] [CrossRef]
  66. Abdulbaqi, A.K.; Suleyman, M.A.; Thamer, A.M.; Nassereldeen, K.A. Integrated Water Resource Management Plan (IWRMP) in Oman: Way Forward. Water Policy 2007, 9, 457–473. [Google Scholar] [CrossRef]
  67. Zekri, S.; Al-Marshudi, A.S. A Millenarian Water Rights System and Water Markets in Oman. Water Int. 2008, 33, 350–360. [Google Scholar] [CrossRef]
  68. Ahmed, M.; Victor, R.; Jashoul, M.; Choudri, B.S. Utilization of Low Quality Water of Mountain Reservoirs: A Case Study from Al Jabal Al Akhdar, Oman. J. Mt. Sci. 2016, 13, 1423–1430. [Google Scholar] [CrossRef]
  69. Abdulrab, M.; Al-Mamary, Y.H.S.; Alwaheeb, M.A.; Alshammari, N.G.M.; Balhareth, H.; Al-Shammari, S.A. Mediating Role of Strategic Orientations in the Relationship between Entrepreneurial Orientation and Performance of Saudi SMEs. Braz. J. Oper. Prod. Manag. 2021, 18, 1–15. [Google Scholar] [CrossRef]
  70. Choudri, B.S.; Baawain, M.; Ahmed, M.; Al-Sidairi, A.; Al-Nadabi, H. Relative Vulnerability of Coastal Wilayats to Development: A Study of Al-Batinah North, Oman. J. Coast. Conserv. 2015, 19, 51–57. [Google Scholar] [CrossRef]
  71. Wilson, C.O.; Weng, Q. Simulating the Impacts of Future Land Use and Climate Changes on Surface Water Quality in the Des Plaines River Watershed, Chicago Metropolitan Statistical Area, Illinois. Sci. Total Environ. 2011, 409, 4387–4405. [Google Scholar] [CrossRef] [PubMed]
  72. Dutton, R.W. Towards a Secure Future for the Aflaj in Oman. In Proceedings of the Conference Proceedings Water-Resources Management in Arid Countries, Muscat, Oman, 12–16 March 1995; Volume 2, pp. 16–24. [Google Scholar]
  73. Norman, W.R.; McCann, I.; Al-Ghafri, A. On-Farm Labour Allocation and Irrigation Water Use: Case Studies among Smallholder Systems in Arid Regions. Irrig. Drain. Syst. 2008, 22, 79–92. [Google Scholar] [CrossRef]
  74. Powers, D. The Choice of the Provision Mechanism in the Aflaj of Oman; University of Nizwa: Nizwa, Oman, 2020. [Google Scholar]
  75. Al-Kindi, K.M.; Janizadeh, S. Machine Learning and Hyperparameters Algorithms for Identifying Groundwater Aflaj Potential Mapping in Semi-Arid Ecosystems Using LiDAR, Sentinel-2, GIS Data, and Analysis. Remote Sens. 2022, 14, 5425. [Google Scholar] [CrossRef]
  76. He, S.; Li, P.; Wu, J.; Elumalai, V.; Adimalla, N. Groundwater Quality under Land Use/land Cover Changes: A Temporal Study from 2005 to 2015 in Xi’an, Northwest China. Hum. Ecol. Risk Assess. Int. J. 2020, 26, 2771–2797. [Google Scholar] [CrossRef]
Figure 1. Geographical locations of seven selected cities (Bawsher, Nizwa, Ibra, Ibri, Sohar, Al-Buraymi, and Al-Rustaq) and four important aflaj, namely, Falaj Al-Khatmeen, Falaj Al-Maliki, Falaj Al-Muyasser, and Falaj Daris, in Oman.
Remotesensing 15 01787 g001
Figure 2. Flowchart illustrating the steps of satellite data analyses in the study area.
Remotesensing 15 01787 g002
Figure 3. LULC case studies of a drawing of (a) Falaj Al-Khatmeen, (b) Falaj Al-Maliki, (c) Falaj Al- Muyasser, and (d) Falaj Daris, including the aflaj sources, underground canal, and the area irrigated by the falaj.
Remotesensing 15 01787 g003
Figure 4. LULC in Bawsher (a) 1985–1990, (b) 1990–2000, (c) 2000–2013, (d) 2013–2021, and (e) the overall LULC changes for 1985–2021 (BS = Bare; VC = Vegetation Cover Soil; UA = Urban Area; W = Water).
Remotesensing 15 01787 g004aRemotesensing 15 01787 g004b
Figure 5. LULC in Nizwa (a) 1985–1990, (b) 1990–2000, (c) 2000–2013, (d) 2013–2021, and (e) the overall LULC changes for 1985–2021 (BS = Bare Soil; VC = Vegetation Cover Soil; UA = Urban Area; W = Water).
Remotesensing 15 01787 g005
Figure 6. LULC in Sohar (a) 1985–1990, (b) 1990–2000, (c) 2000–2013, (d) 2013–2021, and (e) the overall LULC changes for 1985–2021 (BS = Bare Soil; VC = Vegetation Cover Soil; UA = Urban Area; W = Water).
Remotesensing 15 01787 g006
Figure 7. LULC in Ibri (a) 1985–1990, (b) 1990–2000, (c) 2000–2013, (d) 2013–2021 and (e) the overall LULC changes for 1985–2021 (BS = Bare Soil; VC = Vegetation Cover Soil; UA = Urban Area; W = Water).
Remotesensing 15 01787 g007
Figure 8. LULC in Al-Buraymi (a) 1985–1990, (b) 1990–2000, (c) 2000–2013, (d) 2013–2021, and (e) the overall LULC changes for 1985–2021 (BS = Bare Soil; VC = Vegetation Cover Soil; UA = Urban Area; W = Water).
Remotesensing 15 01787 g008
Figure 9. LULC in Ibra (a) 1985–1990, (b) 1990–2000, (c) 2000–2013, (d) 2013–2021, and (e) the overall LULC changes for 1985–2021 (BS = Bare Soil; VC = Vegetation Cover Soil; UA = Urban Area; W = Water).
Remotesensing 15 01787 g009
Figure 10. LULC in Al-Rustaq (a) 1985–1990, (b) 1990–2000, (c) 2000–2013, (d) 2013–2021, and (e) the overall LULC changes for 1985–2021 (BS = Bare Soil; VC = Vegetation Cover Soil; UA = Urban Area; W = Water).
Remotesensing 15 01787 g010
Figure 11. Directions of urban expansion between 1985–2021 in (a) Bawsher, (b) Nizwa, (c) Sohar, (d) Ibri, (e) Ibra, (f) Al-Buraymi, and (g) Al-Rustaq.
Remotesensing 15 01787 g011
Figure 12. Euclidean distance results overlayed with urban area in 2021 aflaj systems and well locations in seven cities: (a) Bawsher, (b) Nizwa, (c) Sohar, (d) Ibri, (e) Al-Buraymi, (f) Ibra, and (g) Al-Rustaq.
Remotesensing 15 01787 g012
Figure 13. Bare soil (BS), urban area (UA), and farmland LULC classifications in Falaj Al-Khatmeen between 1985–2021.
Remotesensing 15 01787 g013aRemotesensing 15 01787 g013b
Figure 14. Bare soil (BS), urban area (UA), and farmland LULC classifications in Falaj Daris between 1985–2021.
Remotesensing 15 01787 g014aRemotesensing 15 01787 g014b
Figure 15. Bare soil (BS), urban area (UA), and farmland (FL) LULC classifications in Falaj Al- Muyasser between 1985–2021.
Remotesensing 15 01787 g015aRemotesensing 15 01787 g015b
Figure 16. Bare soil (BS), urban area (UA), and farmland (FL) LULC classifications in Falaj Al-Maliki for 1985–2021.
Remotesensing 15 01787 g016aRemotesensing 15 01787 g016b
Figure 17. Percentage of LULC changes from vegetation cover/land farms (VC) to urban area (UA), VC to bare soil (BS), BS to VC, and BS to UA in Falaj Al-Khatmeen, Falaj Al-Maliki, Falaj Al-Muyasser, and Falaj Daris over four time periods (1985–1990, 1990–2000, 2000–2013, and 2013–2021).
Remotesensing 15 01787 g017
Table 1. Information from Landsat images used in this research.
PathRowDateSensorCloud Cover (%)
1584428–January–1985TM0
16–April–1990TM0
30–January–2000ETM+0
09–November–2013OLI0.02
31–January–2021OLI0.03
1594323–February–1985TM1
07–April–1990TM0
14–February–2000TM0
02–December–2013OLI0.08
05–October–2021OLI1.77
1594419–January–1985TM1
07–April–1990TM0
14–February–2000TM0
24–May–2013OLI0
06–November–2021OLI0.05
Table 2. Confusion matrices for 1985, 1990, 2000, 2013, and 2021 classified images.
(1985)
Class
WBSVCUATotalUser’s Accuracy (%)
Water (W)110000110100
Bare soil (BS)1145602749492.3
Vegetation cover (VC)01165216898.2
Urban area (UA)000128128100
Total121457165157900
Producer’s accuracy (%)90.999.810081.5
Overall accuracy (%)95.4
Kappa0.93
(1990)
Class
WBSVCUATotalUser’s accuracy (%)
Water (W)10702010998.2
Bare soil (BS)055811557497.2
Vegetation cover (VC)011471015893.0
Urban area (UA)31119319897.5
Total1105601512181039
Producer’s accuracy (%)97.399.697.488.5
Overall accuracy (%)96.7
Kappa0.95
(2000)
Class
WBSVCUATotalUser’s accuracy (%)
Water (UA)135000135100
Bare soil (BS)070102072197.2
Vegetation cover (VC)00311831997.5
Urban area (UA)00424925398.4
Total1357013152771428
Producer’s accuracy (%)10010098.789.9
Overall accuracy (%)97.7
Kappa0.96
(2013)
Class
WBSVCUATotalUser’s accuracy (%)
Water (W)14400114599.3
Bare soil (BS)1978033101296.6
Vegetation cover (VC)002910291100
Urban area (UA)12934035296.6
Total1469803003741800
Producer’s accuracy (%)98.699.897.090.9
Overall accuracy (%)97.3
Kappa0.96
(2021)
Class
WBSVCUATotalUser’s accuracy (%)
Water (W)132000132100
Bare soil (BS)2610441121110294.7
Vegetation cover (VC)22380038499.0
Urban area121647649596.2
Total16110484074972113
Producer’s accuracy (%)8210093.495.8
Overall accuracy (%)96.2
Kappa0.94
Disclaimer/Publisher’s Note: The statements, opinions and data contained in all publications are solely those of the individual author(s) and contributor(s) and not of MDPI and/or the editor(s). MDPI and/or the editor(s) disclaim responsibility for any injury to people or property resulting from any ideas, methods, instructions or products referred to in the content.

