Article

Synergistic Change and Driving Mechanisms of Hydrological Processes and Ecosystem Quality in a Typical Arid and Semi-Arid Inland River Basin, China

1
College of Geographical Science, Inner Mongolia Normal University, Hohhot 010022, China
2
Key Laboratory of Remote Sensing and Geographic Information System, Inner Mongolia Autonomous Region, Hohhot 010022, China
3
Key Laboratory of Disaster and Ecological Security on the Mongolia Plateau, Inner Mongolia Autonomous Region, Hohhot 010022, China
4
Grassland Research Institute, Chinese Academy of Agricultural Sciences, Hohhot 010010, China
*
Author to whom correspondence should be addressed.
Remote Sens. 2023, 15(7), 1785; https://doi.org/10.3390/rs15071785
Submission received: 7 February 2023 / Revised: 16 March 2023 / Accepted: 23 March 2023 / Published: 27 March 2023
(This article belongs to the Topic Hydrology and Water Resources in Agriculture and Ecology)

Abstract

:
Global warming and human activities are complicating the spatial and temporal relationships between basin hydrologic processes and ecosystem quality (EQ), especially in arid and semi-arid regions. Knowledge of the synergy between hydrological processes and ecosystems in arid and semi-arid zones is an effective measure to achieve ecologically sustainable development. In this study, the inland river basin Ulagai River Basin (URB), a typical arid and semi-arid region in Northern China, was used as the study area; based on an improved hydrological model and remote-sensing and in situ measured data, this URB-focused study analyzed the spatial and temporal characteristics of hydrological process factors, such as precipitation, evapotranspiration (ET), surface runoff, lateral flow, groundwater recharge, and EQ and the synergistic relationships between them. It was found that, barring snowmelt, the hydrological process factors such as precipitation, ET, surface runoff, lateral flow, and groundwater recharge had a rising trend in the URB, since the 20th century. The rate of change was higher in the downstream areas when compared with what it was in the upstream and midstream areas. The multi-year average of EQ in the basin is 53.66, which is at a medium level and has an overall improving trend, accounting for 95.14% of the total area, mainly in the upstream, downstream southern, and downstream northern areas of the basin. The change in relationship between the hydrological process factors and EQ was found to have a highly synergistic effect. Temporally, EQ was consistent with the interannual trends of precipitation, surface runoff, lateral flow, and groundwater recharge. The correlation between the hydrological process factors and EQ was found to be higher than 0.7 during the study period. Spatially, the hydrological process factors had a synergistic relationship with EQ from strong to weak upstream, midstream, and downstream, respectively. In addition, ecosystem improvements were accelerated by government initiatives such as the policy of Returning Grazing Land to Grassland Project, which has played an important role in promoting soil and water conservation and EQ. This study provides theoretical support for understanding the relationship between hydrological processes and ecological evolution in arid and semi-arid regions, and it also provides new ideas for related research.

Graphical Abstract

1. Introduction

Global climate change and human-activity-induced changes in water resources have had a tremendous consequence on the ecological environment and socioeconomics, thus attracting attention from the international community [1,2]. This is particularly obvious in arid and semi-arid regions with fragile regional ecosystems [3,4,5]. The evolution and relationship between hydrological processes and ecosystems in arid and semi-arid regions in a continuously changing environment is not clearly understood. The present research on hydrology–ecology mainly focuses on the relationship between a certain hydrological process factor and an ecological indicator, without focusing on the relationship between the linkage between the whole hydrological process factor and the ecosystem quality. Therefore, it is particularly important to understand the relationship between the whole hydrological processes and ecosystem quality (EQ) in arid and semi-arid regions and to design related policies. The results of the study can deepen the understanding of the relationship between hydrological processes and ecosystems in arid and semi-arid regions and provide a reference for the sustainable use of water resources and environmental protection in the region.
As arid and semi-arid regions are deeply inland and far from the ocean, not only is data about them deficient but the measurement data from meteorological and hydrological stations in regions such as the Ulagai River Basin and Xilin River Basin are lacking, [6]. Therefore, hydrological models and remote-sensing monitoring have become important monitoring tools. The Soil and Water Assent Tool (SWAT) model is a semi-distributed hydrological model developed by the United States Department of Agriculture and the Agricultural Research Service. The SWAT model can simulate the hydrological cycle of a basin and quantify the response of basin hydrological processes to changing environments [7]. This model is popular given its systematic and precise simulation and computational capabilities. Forecast simulations have been performed in several basins around the world, and they have achieved excellent results [6,8]. For example, Idrees et al. [9] used a modified SWAT model to simulate the extent of changes in hydrological process factors for different land-use types. The results of their study showed that the conversion of barren land to agricultural land had resulted in a decrease in surface runoff and water production, whereas the groundwater flow, lateral flow, and evapotranspiration (ET) had increased. Luan et al. [10] used the SWAT model to evaluate the impact of land use on hydrological processes (ET and streamflow) in the river suite irrigation area. They also evaluated dispersion and river flow, using the SWAT model.
Being a major data source for the study of several ecological and environmental issues, such as grassland degradation and soil sanding, remote-sensing data facilitate the quick identification of spatial and temporal changes as they relate to environmental quality [9]. Xiao et al. [11] used remote-sensing data concerning biomass and vegetation cover to study if and how the status of EQ in Inner Mongolia changed from 2000 to 2010 and explore whether and how it was affected by climate change and human activities. Wei et al. [12] explored the spatial and temporal characteristics of environmental evolution in inland river basins in the arid regions of Northwest China with the help of integrated remote-sensing-related indicators. However, previous studies have mostly focused on specific years and mostly taken into account aspects such as ecosystem service function, stability evaluation, ecosystem health evaluation, and ecosystem pattern. Only a few of these studies have carried out an integrated evaluation of EQ changes in arid and semi-arid regions over a long period. Recently, national and international researchers conducted several studies on the relationship between the hydrological cycle and EQ [13,14]. Zhang et al. [15] conducted a quantitative study of the relationships among soil, groundwater depth, and vegetation in terms of how these relationships have implications for EQ changes and found that the community cover, community height, leaf projection cover, and leaf area index (LAI) had all decreased significantly with increasing groundwater depth. Hao et al. [16] analyzed the different ecosystems of Inner Mongolia to which different grazing ban policies applied and found that the trend of positive influences of precipitation on these ecosystems had begun to weaken because of overgrazing. Liu et al. [17] analyzed the effect of different vegetation-change scenarios on ET in the Mongolian Plateau and discovered that ET increased with an improvement in vegetation. It was also found that changes in terrestrial ecosystem quality are strongly related to the relevant hydrological process factors such as precipitation, ET, and groundwater [18,19,20]. However, most of the existing studies have focused on the relationship between singular hydrological process factors and ecosystems. The research on the synergistic evolution of overall hydrological processes and ecosystems in arid and semi-arid regions is scarce.
Located in XilinGol League, Inner Mongolia, China, the Ulagai River Basin (URB) is a typical inland river basin in an arid and semi-arid region. As the second largest inland river basin in China, it is also an important livestock base and green ecological barrier [20]. The URB is subject to natural conditions and has a fragile ecological system, which is particularly sensitive to changing environmental conditions [21]. Due to climate change causing an increase in precipitation, temperature, and ET and the continuing influence of reclamation, irrigation, and grazing, a gradual increase has been observed in water shortage, river disruption, sanding of grasslands, and salinization in the URB. This poses a great threat to extant water resources and ecological balance in arid and semi-arid regions [21,22]. Moreover, some studies have shown that arid and semi-arid regions, such as the Mongolian Plateau, may experience more pronounced rises in temperature and more frequent droughts, leading to further water scarcity and deteriorating EQ [23,24]. Against the backdrop of global warming and the impact of human activities, the synergistic evolution of hydrological processes and EQ in the URB needed to be analyzed, for such an analysis could provide a basis for the conservation of water resources and sustainable ecological development of inland river basins in arid and semi-arid regions.
Although some progress has been made in the study of a certain hydrological process factor and ecosystem, relatively few studies have been conducted on the synergistic relationship between the whole hydrological cycle process and EQ. Specifically, this study aimed to achieve the following: characterize the evolution of the hydrological process factors in the inland river basins of arid and semi-arid regions from 2001 to 2019; comprehensively evaluate EQ of inland river basins in arid and semi-arid zones from 2001 to 2019; and explore the characteristics and differences in the synergistic evolution of the hydrological process factors and EQ in different river sections in the inland river basins of arid and semi-arid zones. The findings of this study can deepen the awareness of eco-hydrological processes and evolution patterns in semi-arid inland river basins, thereby providing an empirical basis for the sustainable use of water resources and ecological protection in semi-arid inland river basins.

2. Materials and Methods
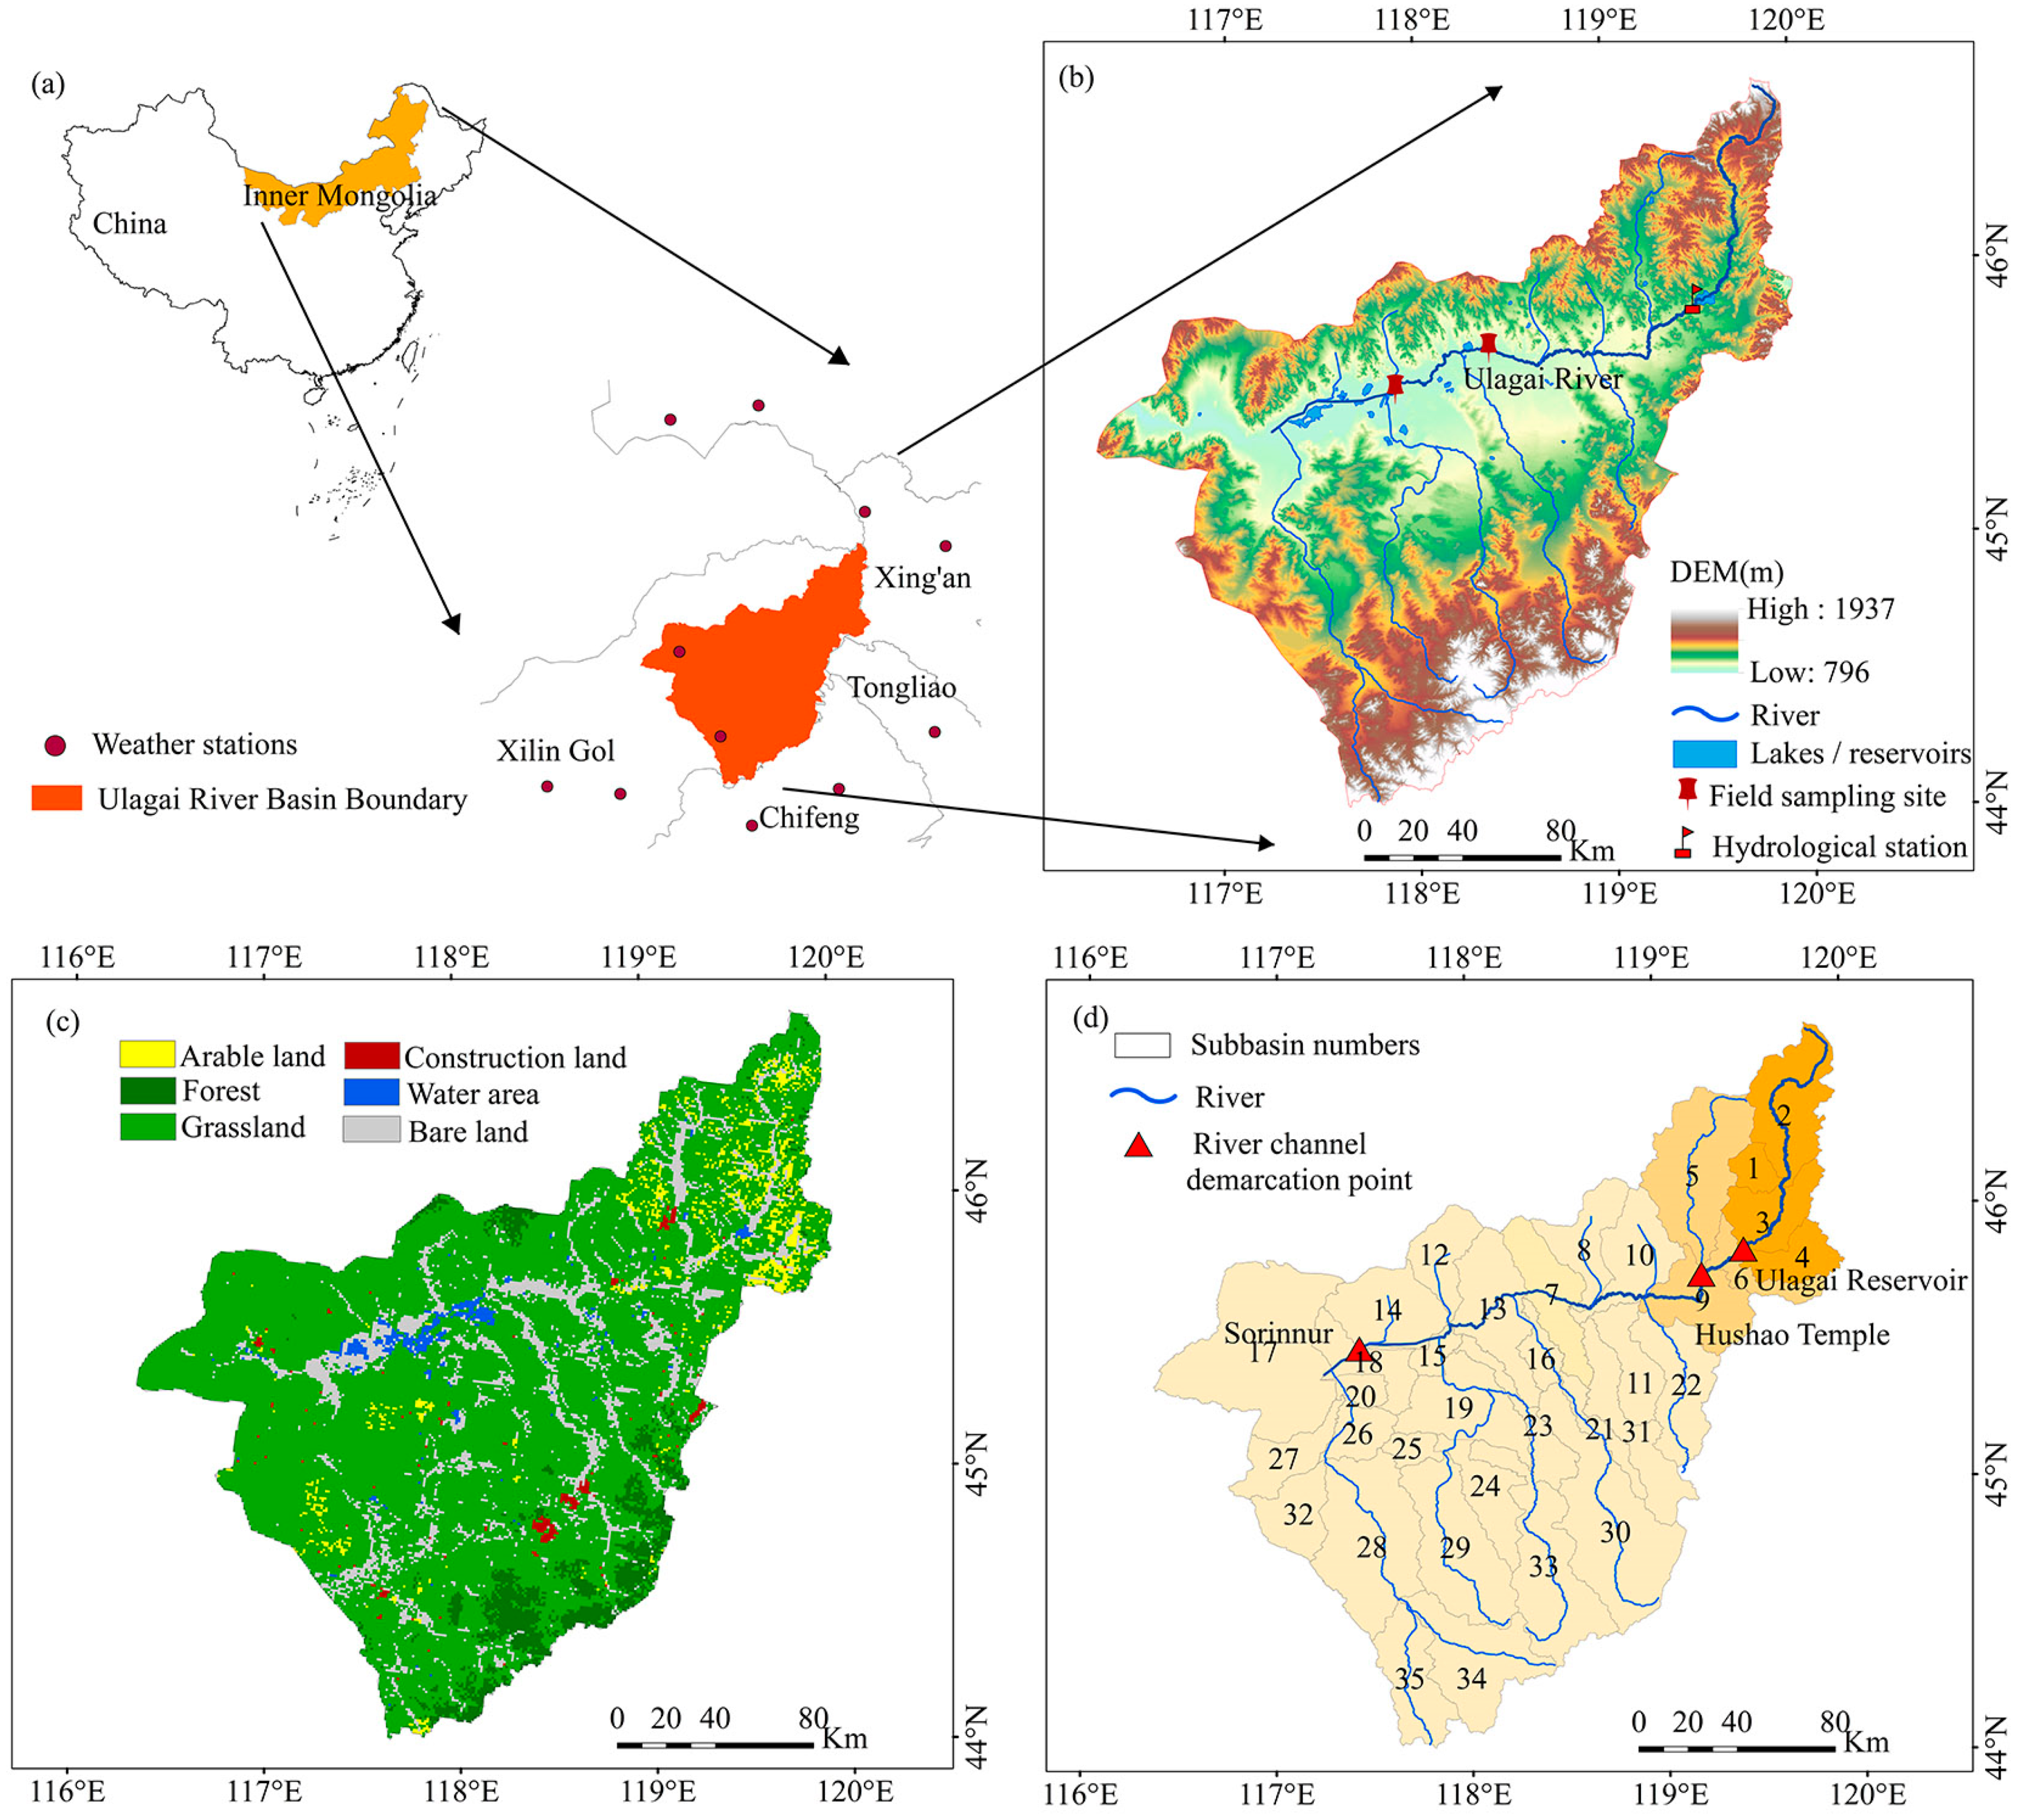
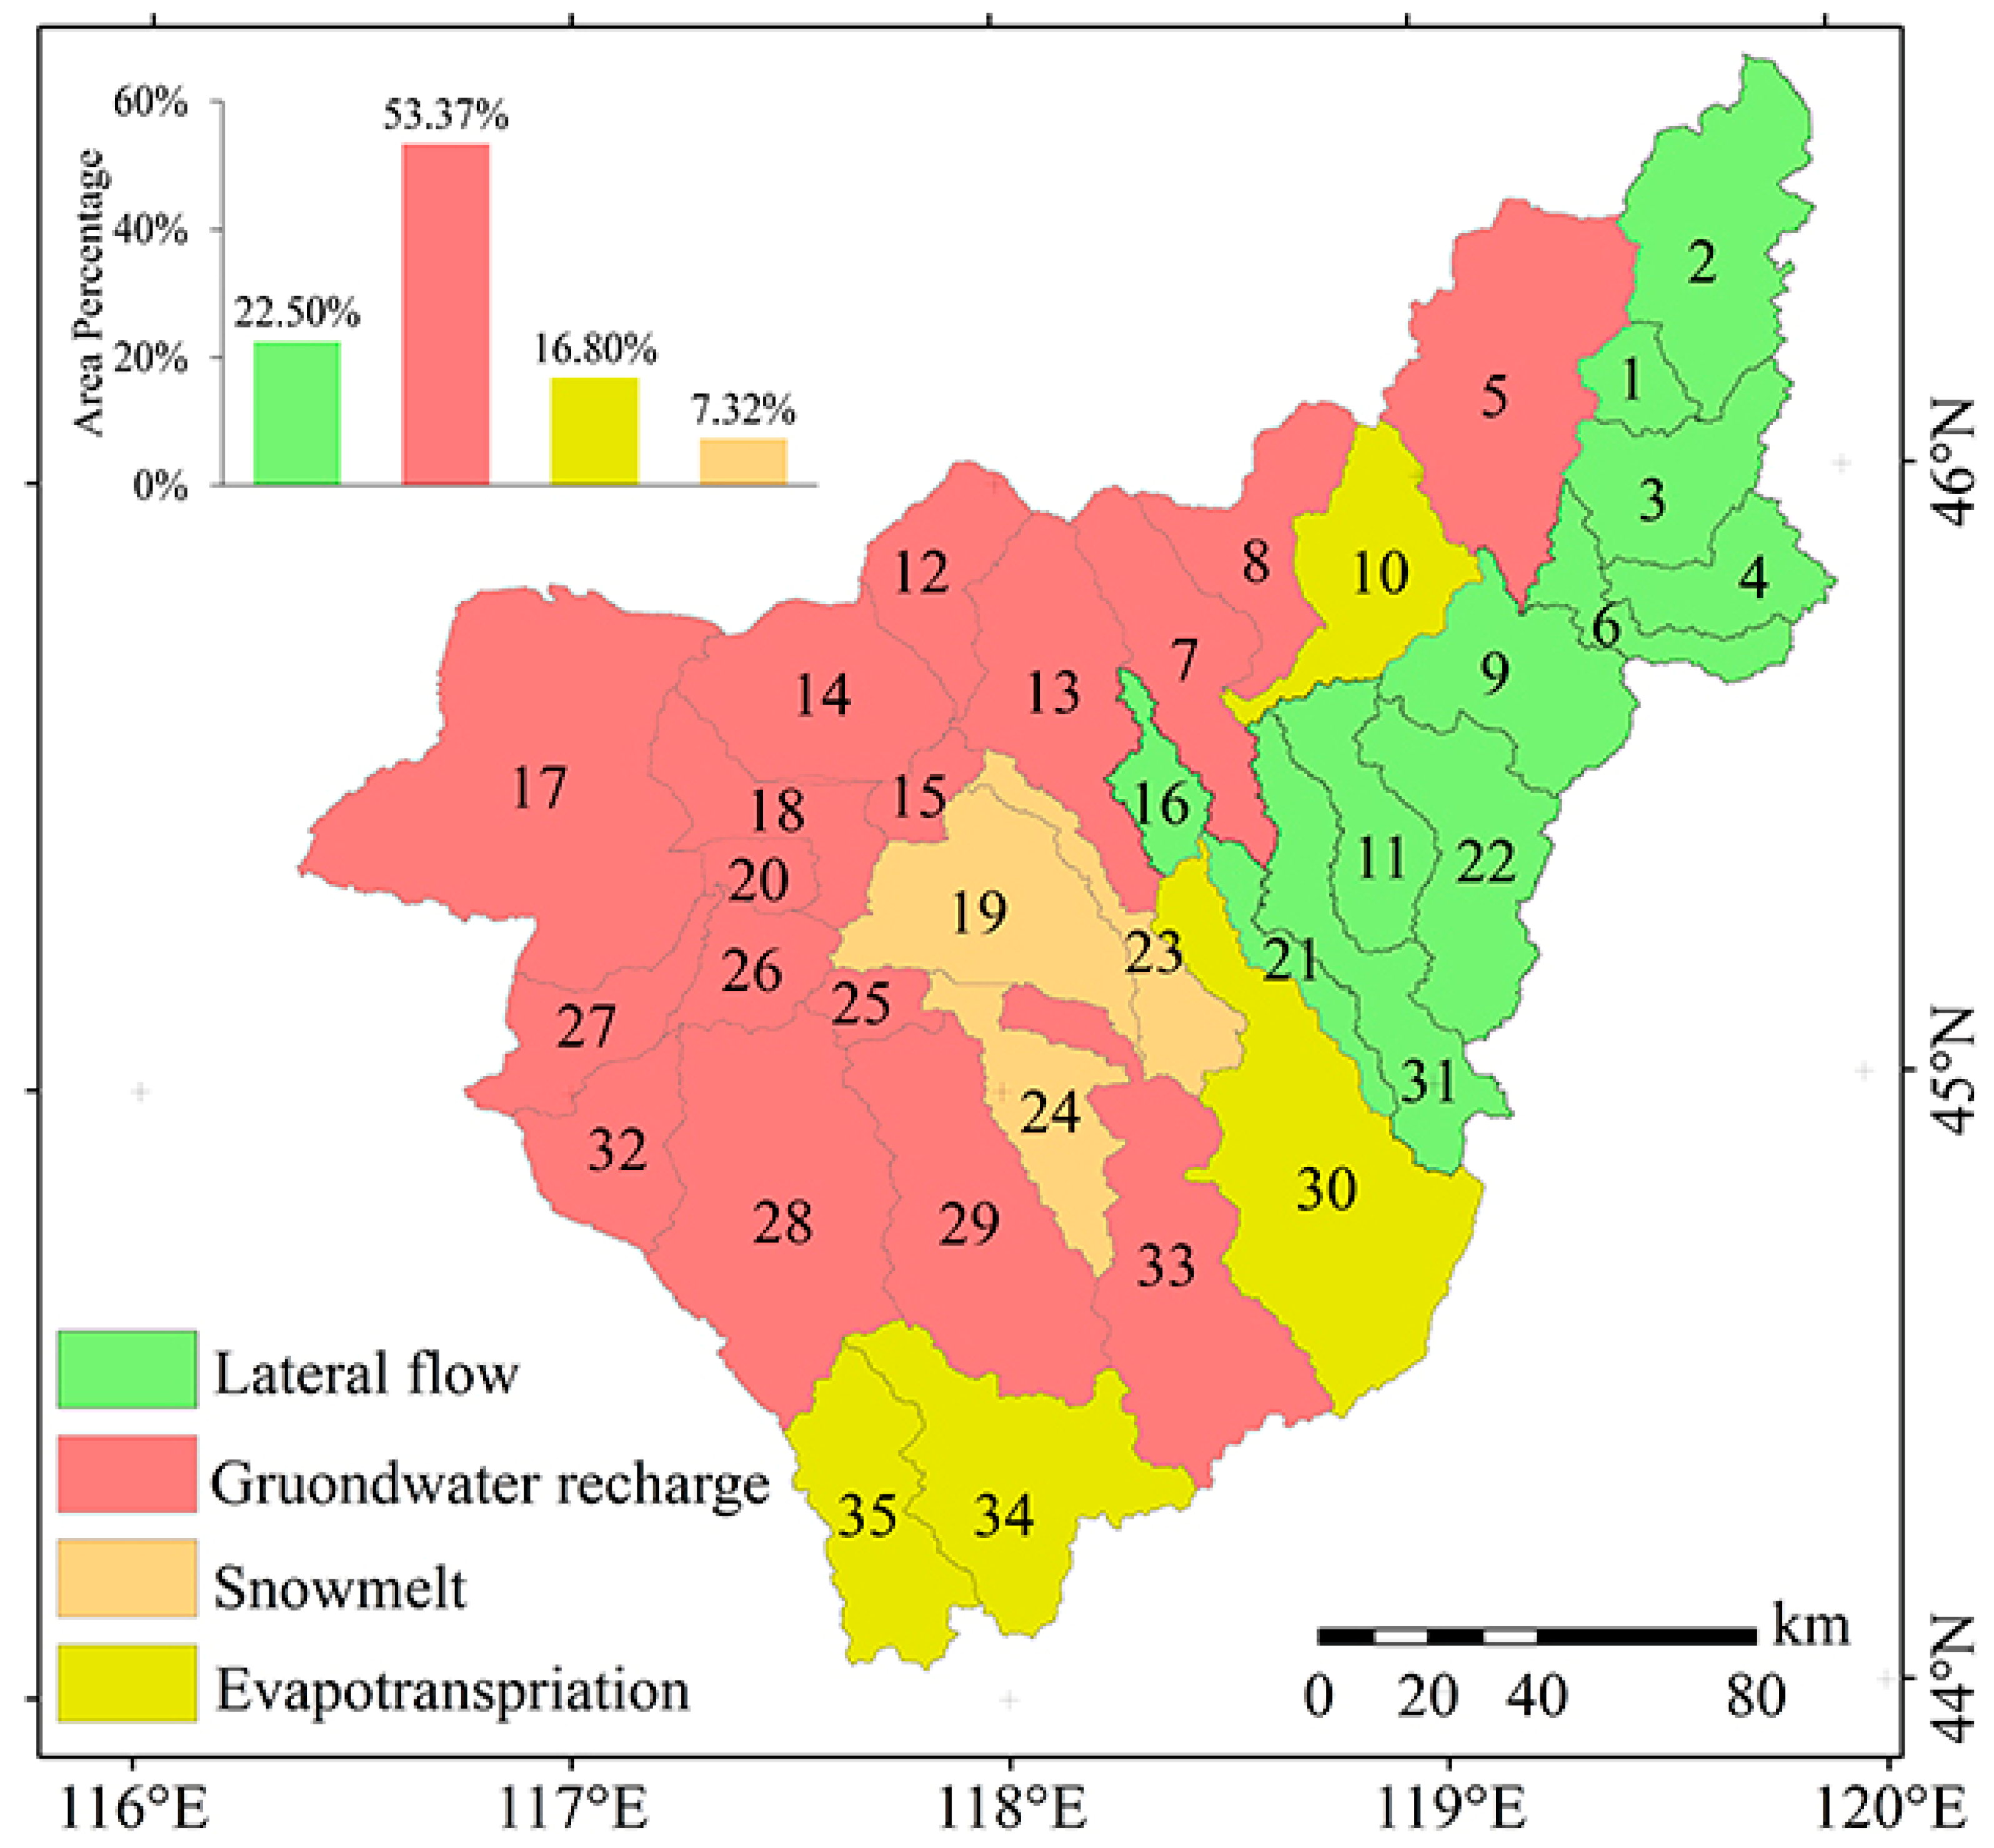
2.1. Study Area

The URB is located at the junction of three leagues: XilinGol League, Xing’an League, and Tongliao City in Inner Mongolia in China. Its geographical location falls between 116°20′ and 119°59′E and 44°02′ and 46°42′N. The total basin area is 38,549.25 km2, making it the largest inland river basin in Inner Mongolia and the second largest in China [25]. The annual average temperature here is about −0.9 °C, and the annual average precipitation is 250–400 mm, with the precipitation showing a decreasing trend from east to west. The URB terrain is at a higher elevation on its southern side than it is on its northern side, sloping from southeast to northwest, whereas the basin’s average elevation is 990 m. The basin is composed of the Ulagai River, Gori Khan River, and Sayarchen Gorak River, and the multi-year average runoff from 2001 to 2019 was 1.28 m3/s. The URB’s vegetation type is mainly grassland, with meadow grassland in the northeast, typical grassland in the southwest, and a transition zone between the two parts [25,26,27]. To analyze the hydrological situation and EQ of the URB’s different river sections, the river was divided into the following three sections: upstream (above the Ulagai reservoir), midstream (Ulagai reservoir to Hushao Temple), and downstream (Hushao Temple to Solinnur, Figure 1b). The 35 subbasins (sub) divided by the SWAT model are defined as upstream, midstream, and downstream by location (Figure 1d).

2.2. Data Sources

In this study, the Digital Elevation Model (DEM), land use/cover, soil, meteorology, and in situ measured runoff data were used to construct the SWAT hydrological model for the URB (Table 1). The DEM data were obtained from NASA with a spatial resolution of 30 m. Furthermore, to effectively characterize the surface cover changes—for instance, the degradation of grassland caused by overgrazing—the land-use/cover data were obtained via a secondary classification system for 2000, 2010, and 2020, with a spatial resolution of 1 km. The data were downloaded from the Environmental Resources and Data Center of the Chinese Academy of Sciences. Soil data were obtained from the Harmonized World Soil Database, with a spatial resolution of 1 km. Weather data were provided by the China Meteorological Data Network, with regard to daily precipitation, maximum/minimum temperatures, wind speeds, and relative humidity from 1981 to 2020 for the URB and 12 adjoining meteorological stations. The SWAT model employed multi-objective calibration, using measured runoff, field sampling, and Moderate Resolution Imaging Spectroradiometer (MODIS) snow cover and ET data. The measured runoff data were monthly runoff data, which were obtained by collating data between 1981 and 2000 from the Nunaimiao hydrological station and between 2004 and 2012 from the Ulagai reservoir inlet hydrological station. Field sampling data were converted into runoff based on the field measurements of water level and cross-section. The remote-sensing snow cover and ET data were selected from MODIS MOD10A1 and MOD16A2 products from 2001 to 2019, respectively, both having a spatial and temporal resolution of 8 days/500 m.
Additionally, remote-sensing data, basic geographic information, and socioeconomic data were selected to evaluate the spatial and temporal variation characteristics of EQ in the URB from 2001 to 2019 (Table 1). Among these, remote-sensing data mainly included gross primary productivity (GPP), normalized difference vegetation index (NDVI), LAI, and land-cover type (LCT) data from 2001 to 2019. The MODIS MOD17A2, MOD13A3, MOD15A2, and MCD12Q1 products were selected and downloaded free of charge from the NASA Land Processes Distributed Data Archive Center, respectively. The spatiotemporal resolutions of MOD17A2, MOD13A3, and MOD15A2 products were 8 days/500 m, 30 days/1 km, and 8 days/500 m, respectively. The basic geographic-information data were vector boundary layers of the URB, and the socioeconomic data focused on population density, based on the population data network, with a spatial resolution of 1 km.

2.3. Methods

2.3.1. SWAT Model

The SWAT model is a long-time basin-distributed hydrological model [18]. It has been extensively used for the simulation and prediction of hydrological processes at the basin scale, with excellent simulation results [28]. In this study, the improved SWAT model by Meng [29] and Luo [30], including an improved snowmelt module and subbasin partitioning, was used to enhance the model simulation accuracy by adding cumulative temperature determination conditions to separate rainfall and snowfall types, while also adding land-use/cover-change nodes to the basin partitioning. The SWAT model automatically divides the URB into 35 subbasins and 76 hydrological response units. The model warm-up period for this study area was 1976–1980, the calibration period was 1981–2000, and the validation period was 2001–2012.
The SWAT model can be used to simulate hydrological processes at three times scales, such as daily, monthly, and annual, and the monthly scale is used in this study. The SWAT model determines the basin boundary and divides subbasins by analyzing the slope, slope direction, and elevation of the DEM (Digital Elevation Model) of the study area. On this basis, the hydrological processes under different land-use types and different soil types under climate change are simulated based on the input hydrometeorological data, land-use types, and soil data [10]. To improve the model accuracy, the SUFI-2 algorithm of SWAT-CUP software was used in this study for analyzing model parameter sensitivity and uncertainty [10]. The Nash–Sutcliffe efficiency (NSE), percentage bias (PBIAS), and coefficient of determination (R2) were used to evaluate the model simulation accuracy. The evaluation index equations are as follows [10]:
N S E = 1 ( Q i o b s Q i s i m ) 2 ( Q i o b s Q m e a n ) 2
P B I A S = ( Q i o b s Q i s i m ) Q i o b s 100
R 2 = n ( Q i o b s Q i s i m Q i o b s Q i s i m ) 2 [ n ( Q i o b s ) 2 ( Q i o b s ) 2 ] [ n ( Q i s i m ) 2 ( Q i s i m ) 2 ]
where Q i o b s is the measured value in m3/s, Q i s i m is the simulated value in m3/s, Q m e a n is the measured average value in m3/s, and n is the measured data amount.
The simulation results were again validated with MODIS snow cover and ET data to meet multiple objectives. These results were also evaluated using PBIAS and R2.

2.3.2. Ecosystem Quality Assessment

In this study, ecosystem quality (EQ) was comprehensively assessed through three components: ecosystem productivity index (EPI), ecosystem stability index (ESI), and ecosystem bearing capacity index (EBCI). The EPI, ESI, and EBCI were constructed based on multisource data, such as remote-sensing data and socioeconomic data from 2001 to 2019, and were later assigned weights of 0.40, 0.28, and 0.32, respectively, using the entropy value weighting method [31]. A comprehensive EQ evaluation model for the URB was established by the weighted summation method [32]. To better reflect the spatial and temporal variation characteristics of EQ caused by the hydrological process factors and external factors, EQ was normalized, and the range of values was delineated at (10,100). Its computation is in Equations (4)–(7), which are as follows:
E P I t , k = { 10 G t , k G m i n 10 + ( G t , k G m i n ) × a G m i n < G t , k < G m a x 100 G t , k G m a x a = ( 100     10 ) / ( G m a x G m i n )
where E P I t , k is the dimensionless index of productive capacity in year t of image k, and its larger value indicates a higher level of ecosystem productive capacity; G t , k is the total GPP in year t of image k; G m a x and G m i n are the upper and lower limits of the GPP multi-year average, respectively; and a is the stretching constant.
E S I t , k = { 10 c v t , k c v m a x 10 + ( c v m a x c v t , k ) × a c v m i n <   c v t , k < c v m a x 100 c v t , k c v m i n a = ( 100 10 ) / ( c v m a x c v m i n )
where E S I t , k is the stability index of the image element k in year t—the larger the value, the higher is the stability of the region; c v t , k denotes the coefficient of variation of the annual mean value of GPP in year t of the image element k; c v m a x and c v m i n are the upper and lower limits of the multi-year mean coefficient of variation of GPP, respectively; and a is the stretching constant.
E B C I t , k = { 10 E H I t , k E H I m i n 10 + ( E H I t , k E H I m i n ) × a E H I m i n < E H I t , k < E H I m a x 100 E H I t , k E H I m a x a = ( 100 10 ) / ( E H I m a x E H I m i n )
where E B C I t ,   k is the stability index of the image element k in year t—the larger the value, the higher is the stability of the region; E H I t , k denotes the coefficient of variation of the annual mean value of GPP in year t of the image element k; E H I m a x and E H I m i n are the upper and lower limits of the multi-year mean coefficient of variation of GPP, respectively; and a is the stretching constant.
E Q = i = 1 n w i × y i
where EQ is the EQ index; yi represents EPI, ESI, and EBCI indices; and wi is the weight of each index.
The Natural Break clustering method was then used to classify EQ into the following five levels: (I) 0–45 as the lowest level, (II) 45–50 as the lower level, (III) 50–55 as the medium level, (IV) 55–65 as the higher level, and (V) 65–100 as the highest level, taking into account the URB’s actual situation and the degree of influence of each index on the ecosystem.

2.3.3. Trend Analysis

This study employed the unidimensional linear regression method to analyze the spatial and temporal trends of the URB’s hydrological processes and EQ from 2001 to 2019. The calculation equation [33] is shown below:
S l o p e = n i = 1 n ( i E Q i ) i = 1 n i i = 1 n E Q i n i = 1 n i 2 ( i = 1 n i ) 2
where n is the length of study, E Q i is the mean value of EQ in year i, and Slope indicates the trend of change. If Slope > 0, the EQ is increasing; otherwise, it is decreasing. If Slope = 0, the EQ remains unchanged.

2.3.4. Analysis of Synergistic Effects

(a)
Gray correlation analysis
The gray correlation analysis determines whether the relationship between sequences is close or not, mainly through the similarity of their curve geometries [34]. If the curves are more similar, the correlation between the series is greater, and if it is the other way around, the correlation is lower. This method is frequently used in the analysis of influence factors because it is less demanding and less computationally intensive than the mathematical and statistical methods. This method was used in this study to calculate the correlation between the hydrological process factors and EQ. The calculation formula is as follows:
γ o i = 1 n k = 1 n ξ o i ( k )
ξ o i ( k ) = m i n i m i n k Δ o i ( k ) + ρ m a x i m a x k Δ o i ( k ) Δ o i ( k ) + ρ m a x i m a x k Δ o i ( k ) Δ o i = | x o ( k ) x i ( k ) | ,   i = 1 , 2 , , m ;   k = 1 , 2 , , n
where γ o i is the gray correlation degree, ξ o i is the gray correlation coefficient, and ρ is the discrimination coefficient.
(b)
Pearson correlation analysis
The Pearson correlation analysis between the URB’s EQ and hydrological process factors from 2001 to 2019 was conducted at the subbasin scale. Moreover, the correlation coefficients were tested for significance to reflect the degree of spatial and temporal correlation between EQ changes and hydrological process factors and identify the response of EQ to changes in the hydrological process factors. The calculation equation [35] is as follows:
r = i = 1 n ( E Q i E Q ¯ ) ( y i y ¯ ) i = 1 n ( E Q i E Q ¯ ) 2 i = 1 n ( y i y ¯ ) 2
where r is the correlation coefficient between EQ and the hydrological process factors; E Q i and y i are the mean values of EQ and the hydrological process factors in year i, respectively; E Q ¯ and y ¯ are the mean values of EQ and the hydrological process factors in 19 years, respectively; and i represents the number of years. If r > 0, the EQ and the hydrological process factors are positively correlated and vice versa; the larger the r, the stronger the correlation between them.

3. Results

3.1. SWAT Model’s Performance in the URB

As shown by analyzing the SWAT model simulation results, the evolutionary trends of runoff simulated values and measured values were generally consistent (Figure 2a). The model captured the seasonal variation characteristics of runoff, which are higher in summer and absent in winter, in the basin. The runoff from 1981 to 2000 was much higher than that from 2001 to 2012. The highest value, up to 134 m3/s, was generated in 1998. The NSE, R2, and percentage bias (PBIAS) for the calibration periods were 0.62, 0.62, and 18.8%, and for the validation periods, they were 0.71, 0.72, 8.5%, respectively. In this study, the validation period captured the peak runoff better compared to the calibration period. This may be due to the fact that the runoff variation in the study area during the calibration period is more drastic and the runoff process is more complex than that in the validation period, so the simulation results in the validation period are better than those in the calibration period. Moreover, the model-extracted snow area and ET matched the curve trend of MODIS snow and ET, and the correlation coefficients of both were higher than 0.8 (Figure 2b,c).

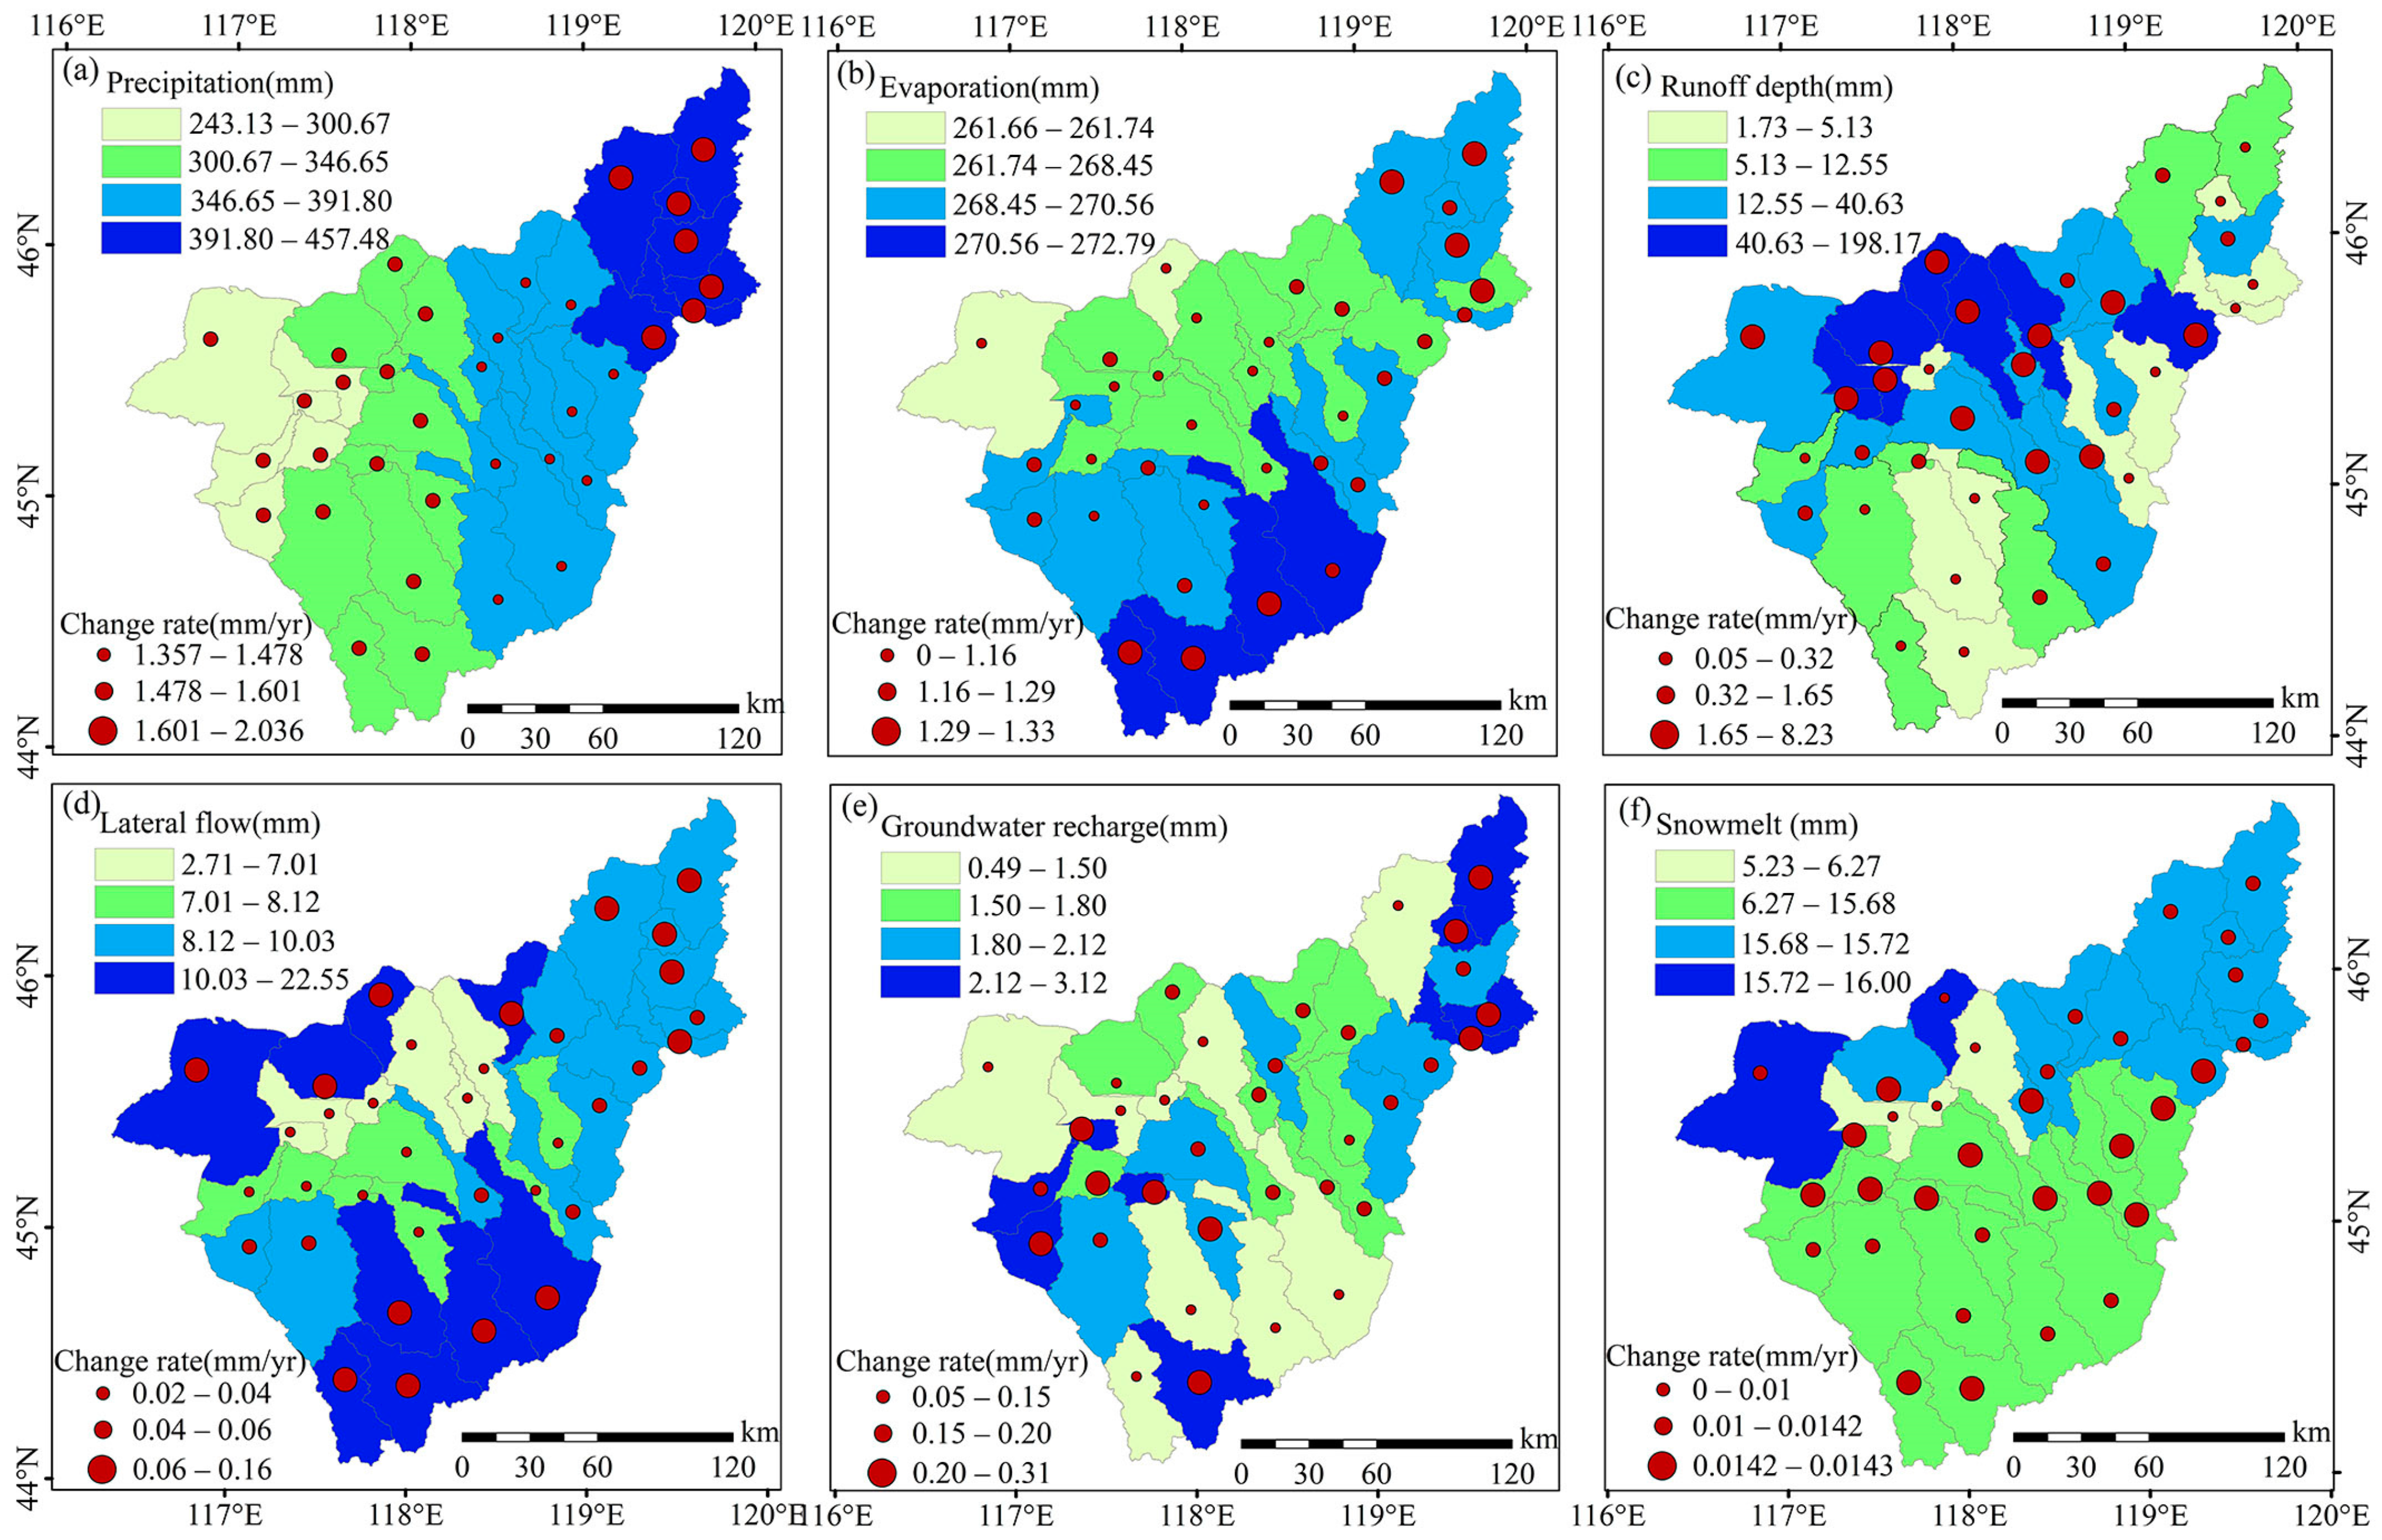
3.2. Spatiotemporal Change Characteristics in the URB’s Hydrological Process Factors

Upon analyzing the changes in the URB’s hydrological process factors during 2001–2019, it was found that precipitation, ET, surface runoff, and lateral flow showed a non-significant increasing trend at the rates of 1.24 mm/yr, 1.66 mm/yr, 0.47 mm/yr, and 0.056 mm/yr, respectively (Figure 3a–d). Groundwater recharge showed a significant increasing trend at a rate of 0.18 mm/yr (p < 0.1), while snowmelt showed a non-significant decreasing trend at a rate of 0.01 mm/yr (Figure 3e). Precipitation, surface runoff, lateral flow, and groundwater recharge all peaked in 2012, while evaporation and snowmelt peaked in 2013.
Great spatial heterogeneity was observed in the spatial distribution and variation rates of the URB’s different hydrological process factors (Figure 4). The annual total precipitation in the upstream region of the basin was 457.48 mm, and it gradually decreased from east to west; the overall precipitation variation rate was high, with the fastest variation reaching up to 2.033 mm/yr in the upstream, followed by that in the downstream (1.601 mm/yr; see Figure 4a). The ET in the southern part of URB reached 272.79 mm, while the ET in the northwestern part was lower at 261.74 mm, showing a decreasing trend from south to north. The rate of change was faster in the URB’s upstream and southern parts and slower in its northern and downstream parts (Figure 4b). The runoff deep high value of the URB’s runoff was mainly concentrated in the wetland area, decreasing from the wetland to the surrounding area. The rate of change varied similarly, with the downstream wetland area increasing at a rate of 8.23 mm/yr (Figure 4c). The lateral flow in the high-elevation area was higher than that in the low-elevation area; the lateral flow gradually increased from the URB’s wetland to the surrounding area, and the change rate showed the same spatial distribution characteristics as the lateral flow did (Figure 4d). Groundwater recharge reached 3.12 mm in the URB’s upper and western parts and was lower in the URB’s southern and northern parts (1.5 mm); the rate of change was also faster in the higher groundwater recharge areas (Figure 4e). Snowmelt was observed more in the URB’s upper and middle reaches, with the highest value being up to 16 mm. Snowmelt in the middle and south of the lower reaches was less than 6.27 mm. This shows a distribution pattern of gradual decrease from the URB’s northeast to southwest, with the rate of decrease of snowmelt being higher in the middle (Figure 4f). Overall, the precipitation and snowmelt in the URB’s upper and middle reaches were high and the runoff depth was small; for the downstream region, it was just the opposite, and the rate of change in the downstream was higher than that in the upstream.

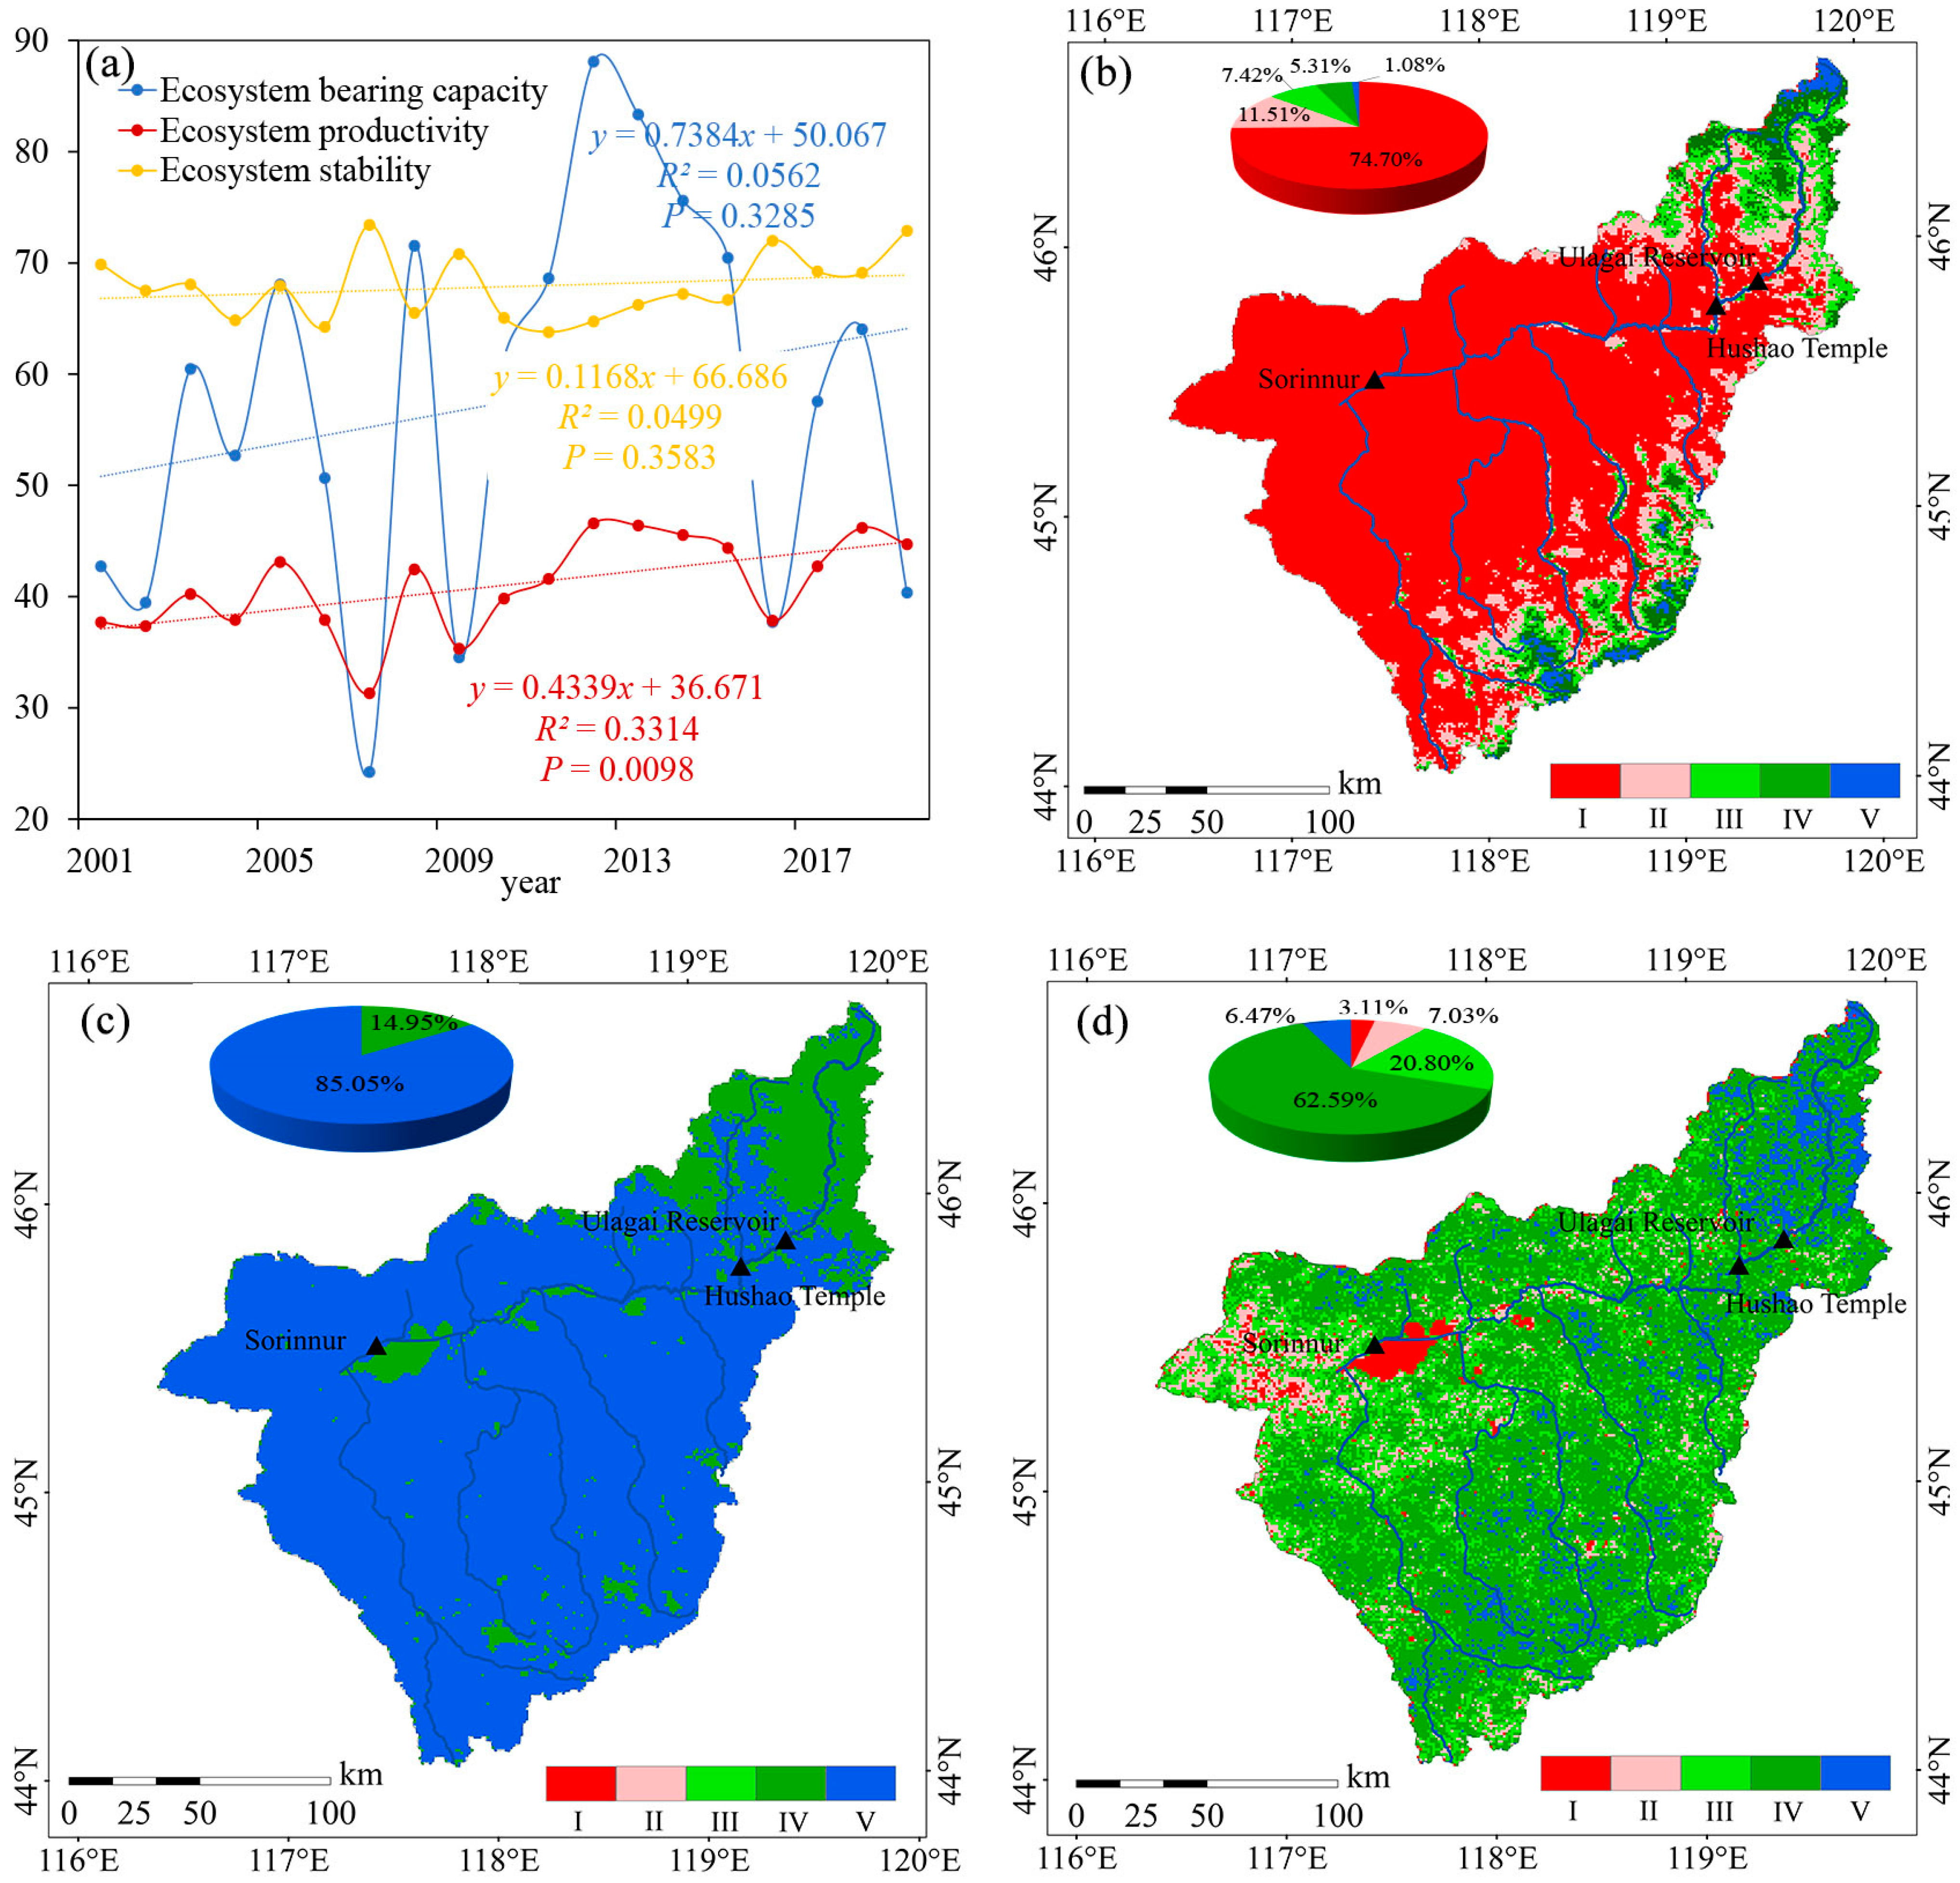
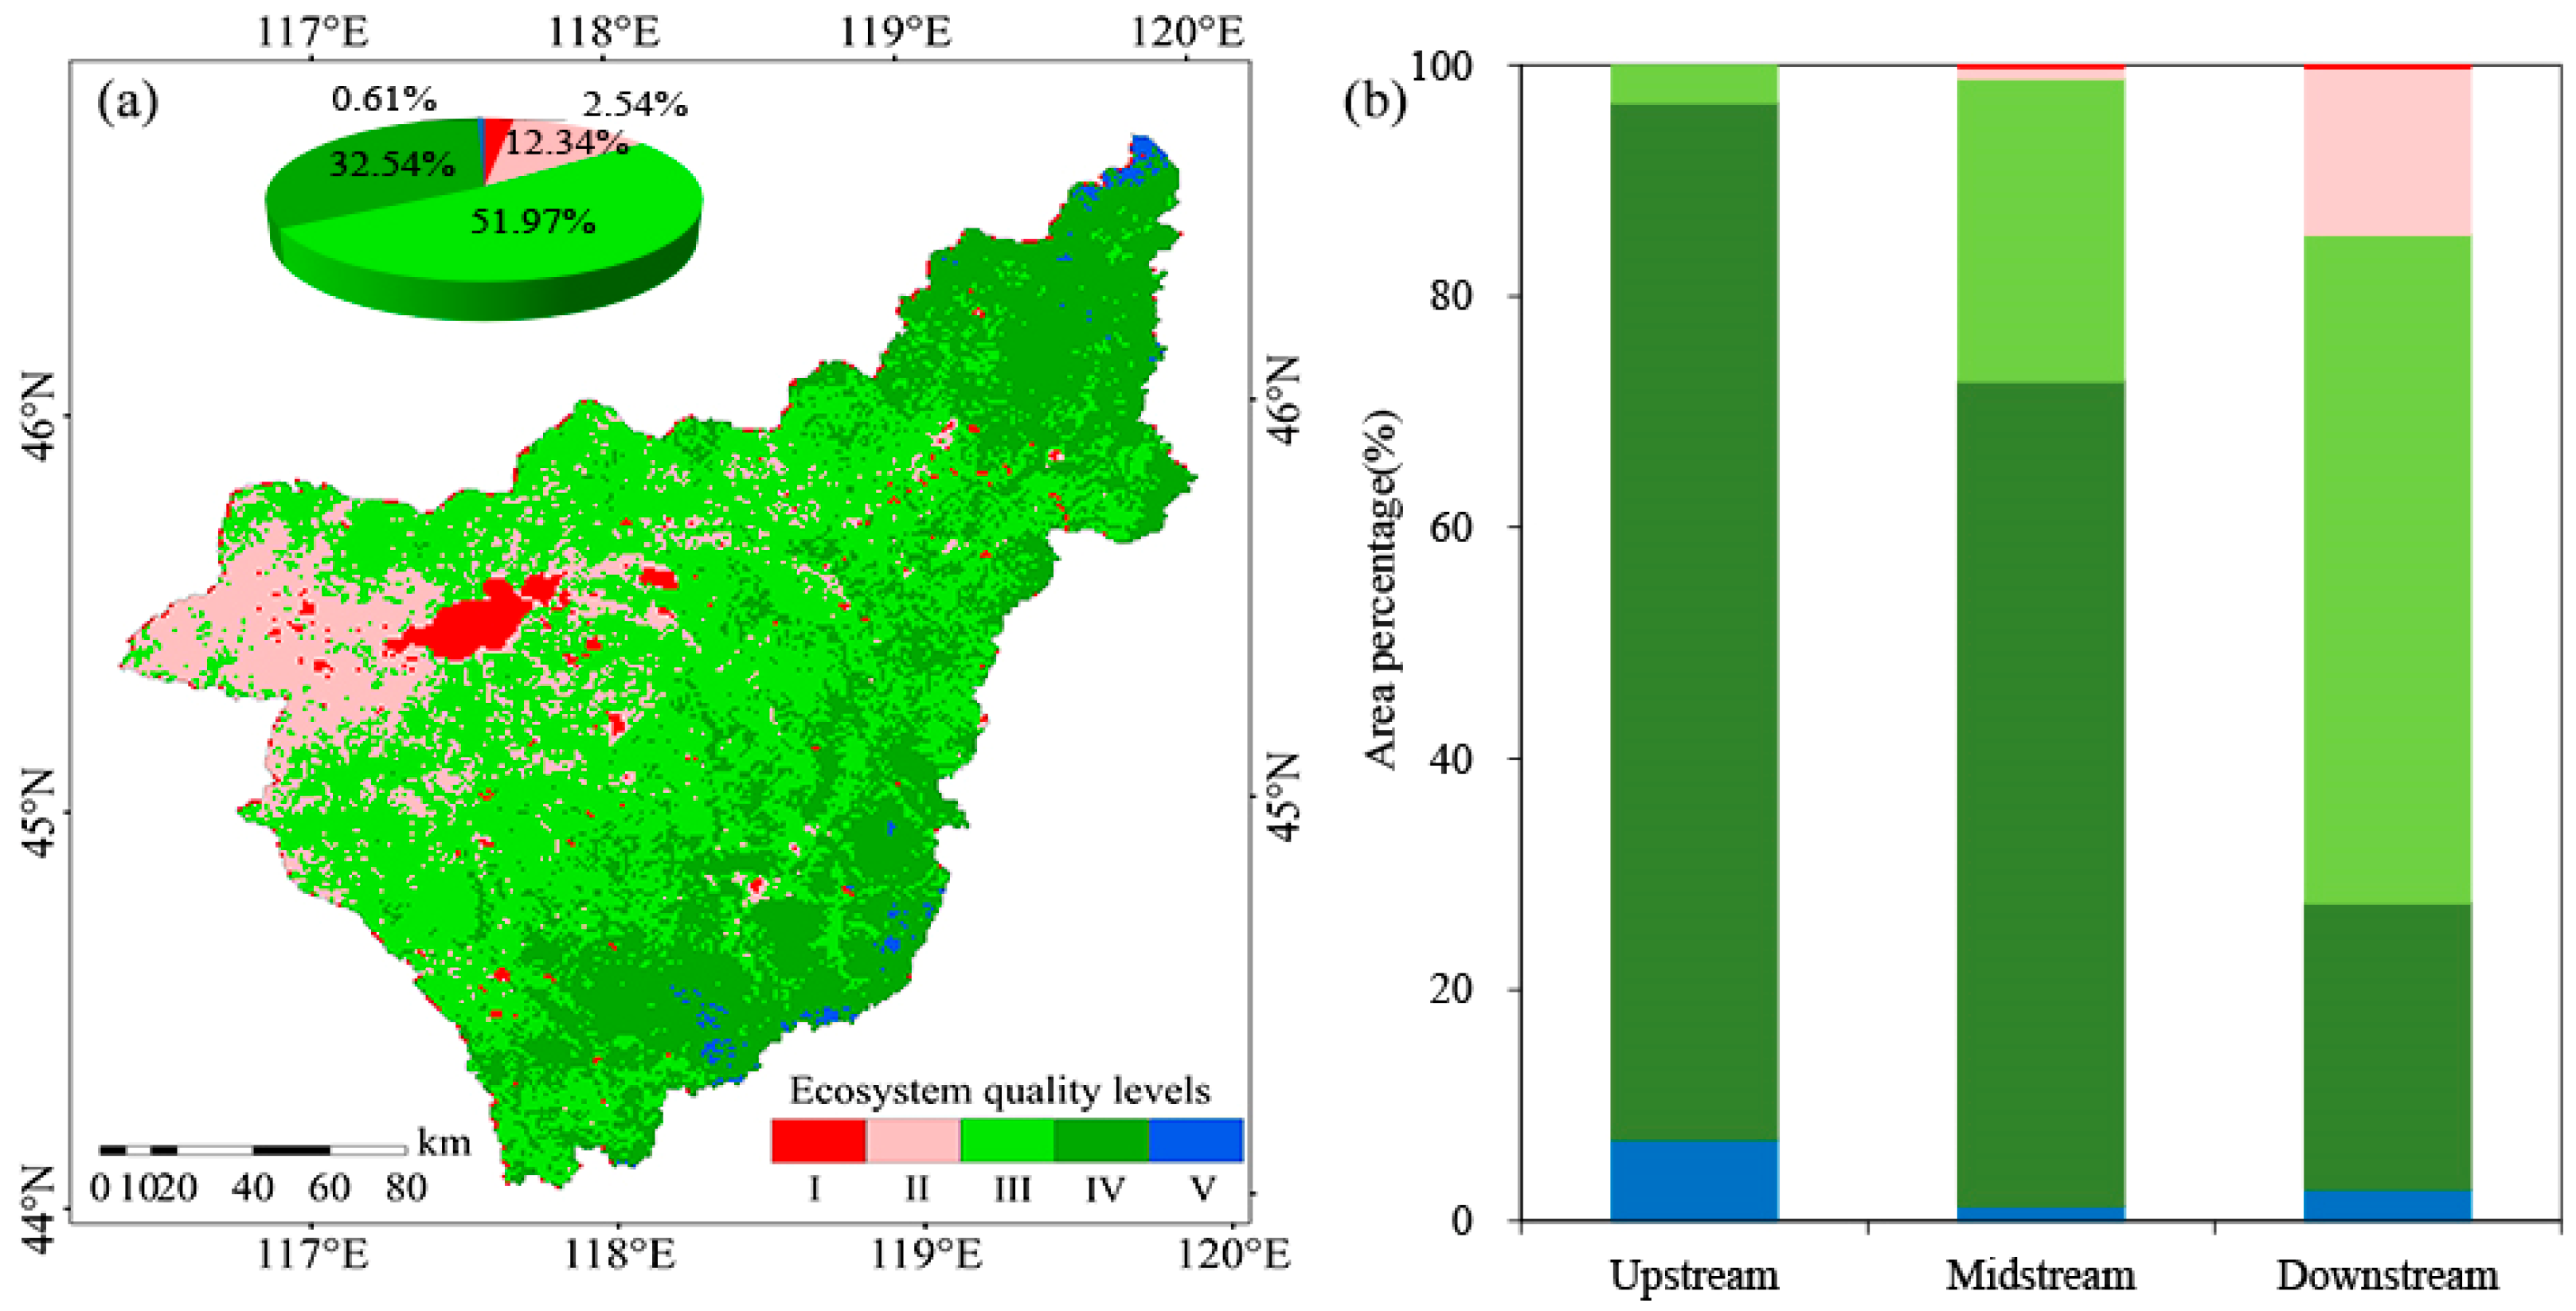
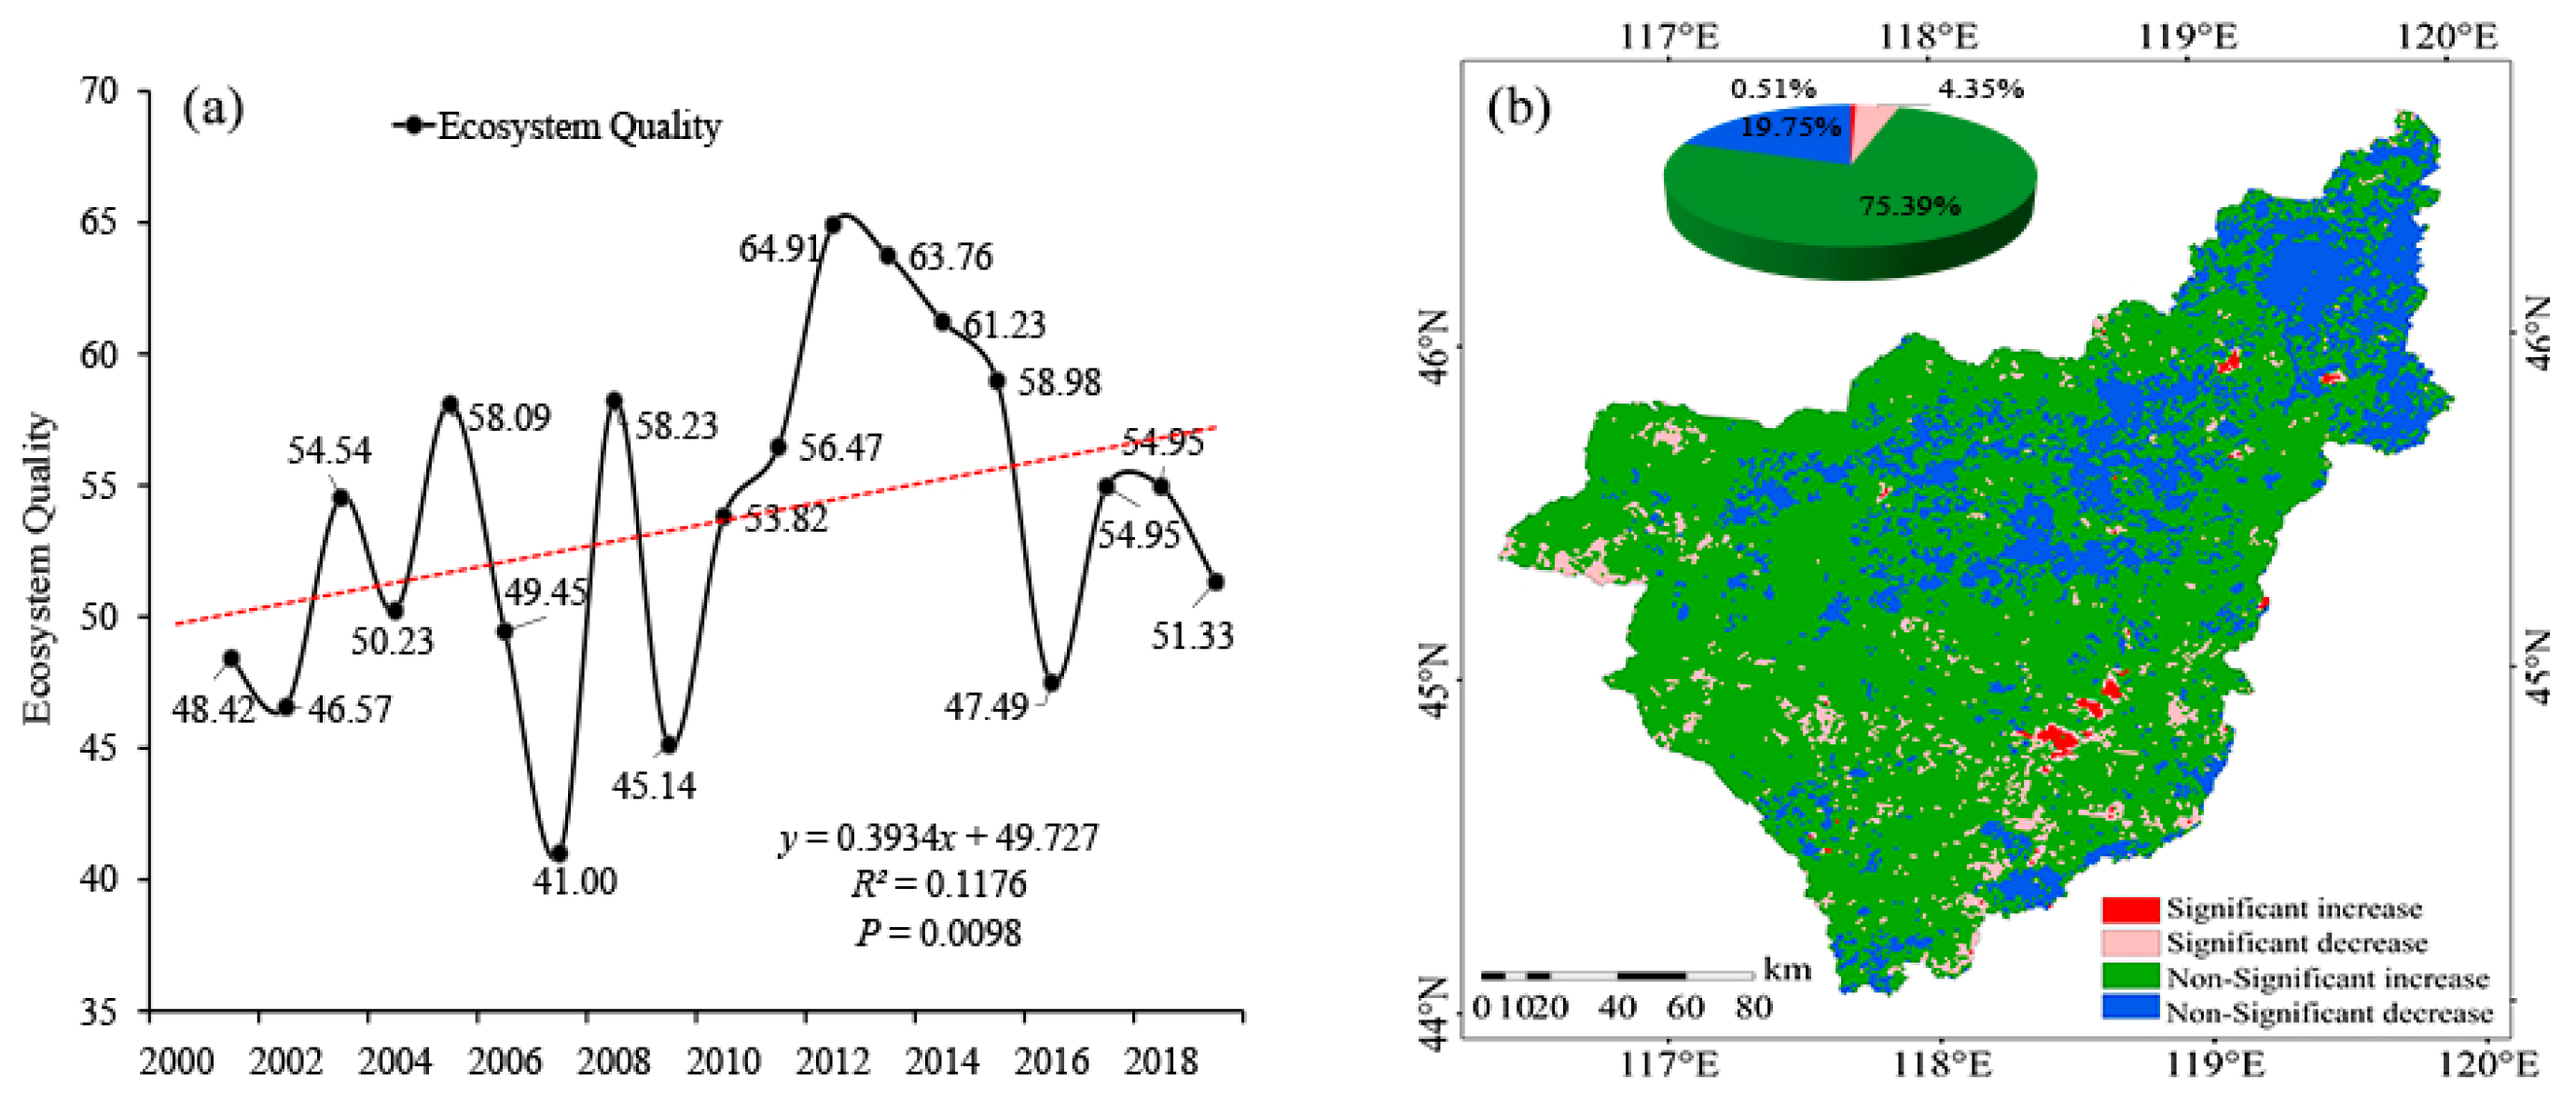
3.3. Spatiotemporal Change Characteristics of the URB’s EQ

The URB’s EPI showed a significant increasing trend, at a rate of 0.43/yr from 2001 to 2019 (p < 0.01). EPI’s highest and lowest values were 46.60 and 31.33, which appeared in 2012 and 2007, respectively (Figure 5a). The multi-year mean value was 41.01, indicating that the URB’s overall EPI was low. The higher EPI areas were mainly distributed across the arable land dominant upstream and the downstream southern woodland coverage areas. Most areas in the middle and downstream areas had a lower EPI. The area of Level I accounted for 74.7% of the total area; Level II accounted for 11.51%; and Levels III, IV, and V accounted for 7.42%, 5.31%, and 1.08%, respectively (Figure 5b).
The URB’s ESI showed a non-significant increasing trend at a rate of 0.12/yr during the study period. The ESI was the highest in 2007, with a value of 73.43, and lowest in 2011, with a value of 63.79 (Figure 5a). The multi-year average ESI value reached 67.85, which is at a high level overall. As seen in Figure 5c, the URB’s ESI from 2001 to 2019 had only two levels, Levels IV and V, with area ratios of 14.95% and 85.05%, respectively. Level V was mainly distributed in the downstream area, where grassland cover chiefly prevailed, whereas Level IV was mainly distributed in the upstream area, where arable land chiefly prevailed.
The URB’s EBCI showed a non-significant increasing trend at a rate of 0.74/yr. Over the last 19 years, the highest value of EBCI was 88.09, which occurred in 2012, and the lowest value was 24.24 in 2007 (Figure 5a). The multi-year average value was 57.45, which is at a higher level. The higher EBCI areas were mainly spread over the upstream and downstream southern areas. On the other hand, the EBCI value in the downstream northwestern area was lower, which is similar to the spatial distribution characteristics of the EPI (Figure 5d).
As shown in Figure 6a, the EQ of the URB from 2001 to 2019 showed an overall distribution pattern of high in the northeast and southwest and low in the northwest. The best EQ levels were concentrated in the upstream and downstream southern areas of the URB, whereas the worst EQ areas lay in and around the wetlands of the downstream area. The highest area percentage at the medium level (III) was 51.97%, mainly in the central part of the URB downstream dominated by grass cover, which was followed by the higher level (IV) area percentage of 32.54, mainly in the upstream and midstream areas of the basin and the southern downstream parts.
Statistics about area percentages at different EQ levels, across different reaches of the basin, revealed that levels III and IV have been dominant over the last 19 years. However, the difference in EQ among the reaches was relatively significant (Figure 6b). The areas of levels III and IV decreased gradually from the upstream to the downstream of the URB, whereas the areas of levels I and II increased subsequently. Moreover, the level IV area in the URB upstream had the highest proportion of 89.96%, whereas the level III area in the downstream region occupied the highest proportion of 54.80%. Thus, the upstream and midstream areas are at a high level, whereas the downstream area is at an intermediate level.
The URB’s EQ showed a significant increasing trend at a rate of 0.39/yr from 2001 to 2019 (p < 0.01; see Figure 7a). EQ was the highest in the year 2012 at 64.91, fluctuating widely before and after. It was the lowest in 2007, at 40.99. The overall EQ was seen to be at a higher level between 2012 and 2017. Its multi-year average was 53.66, indicating that the URB’s overall EQ is at a medium level. The URB’s overall EQ showed an increasing trend (slope > 0) over the last 19 years, accounting for 95.14% of the total study area. Within this area, 19.75% was dominated by a significant increase (p < 0.05), mainly in the upstream and northern parts of the downstream. On the other hand, 4.86% of the URB showed a decreasing trend (p < 0.05), scattered across the southern and western parts of the downstream. On account of various river channels, EQ in the URB upstream increased significantly, whereas downstream EQ increased non-significantly, but a few downstream areas still showed decreasing trends (Figure 7b).

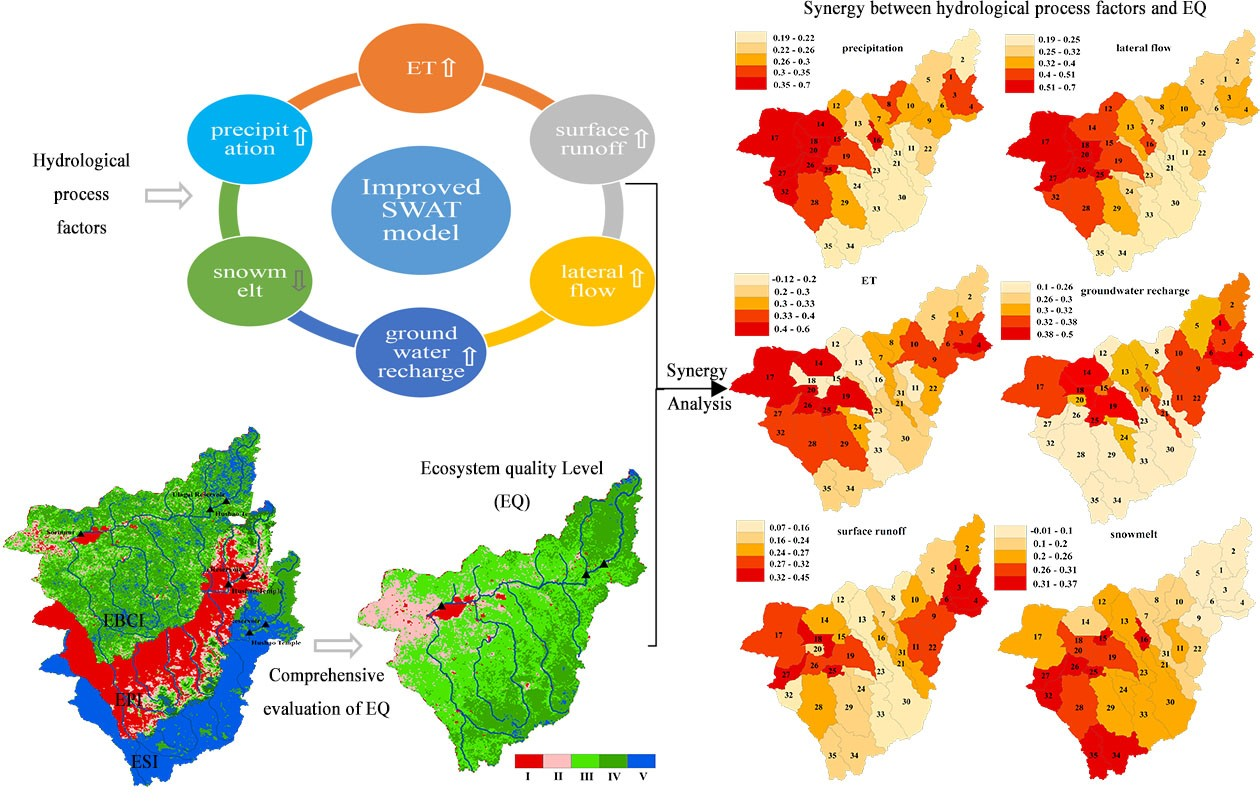
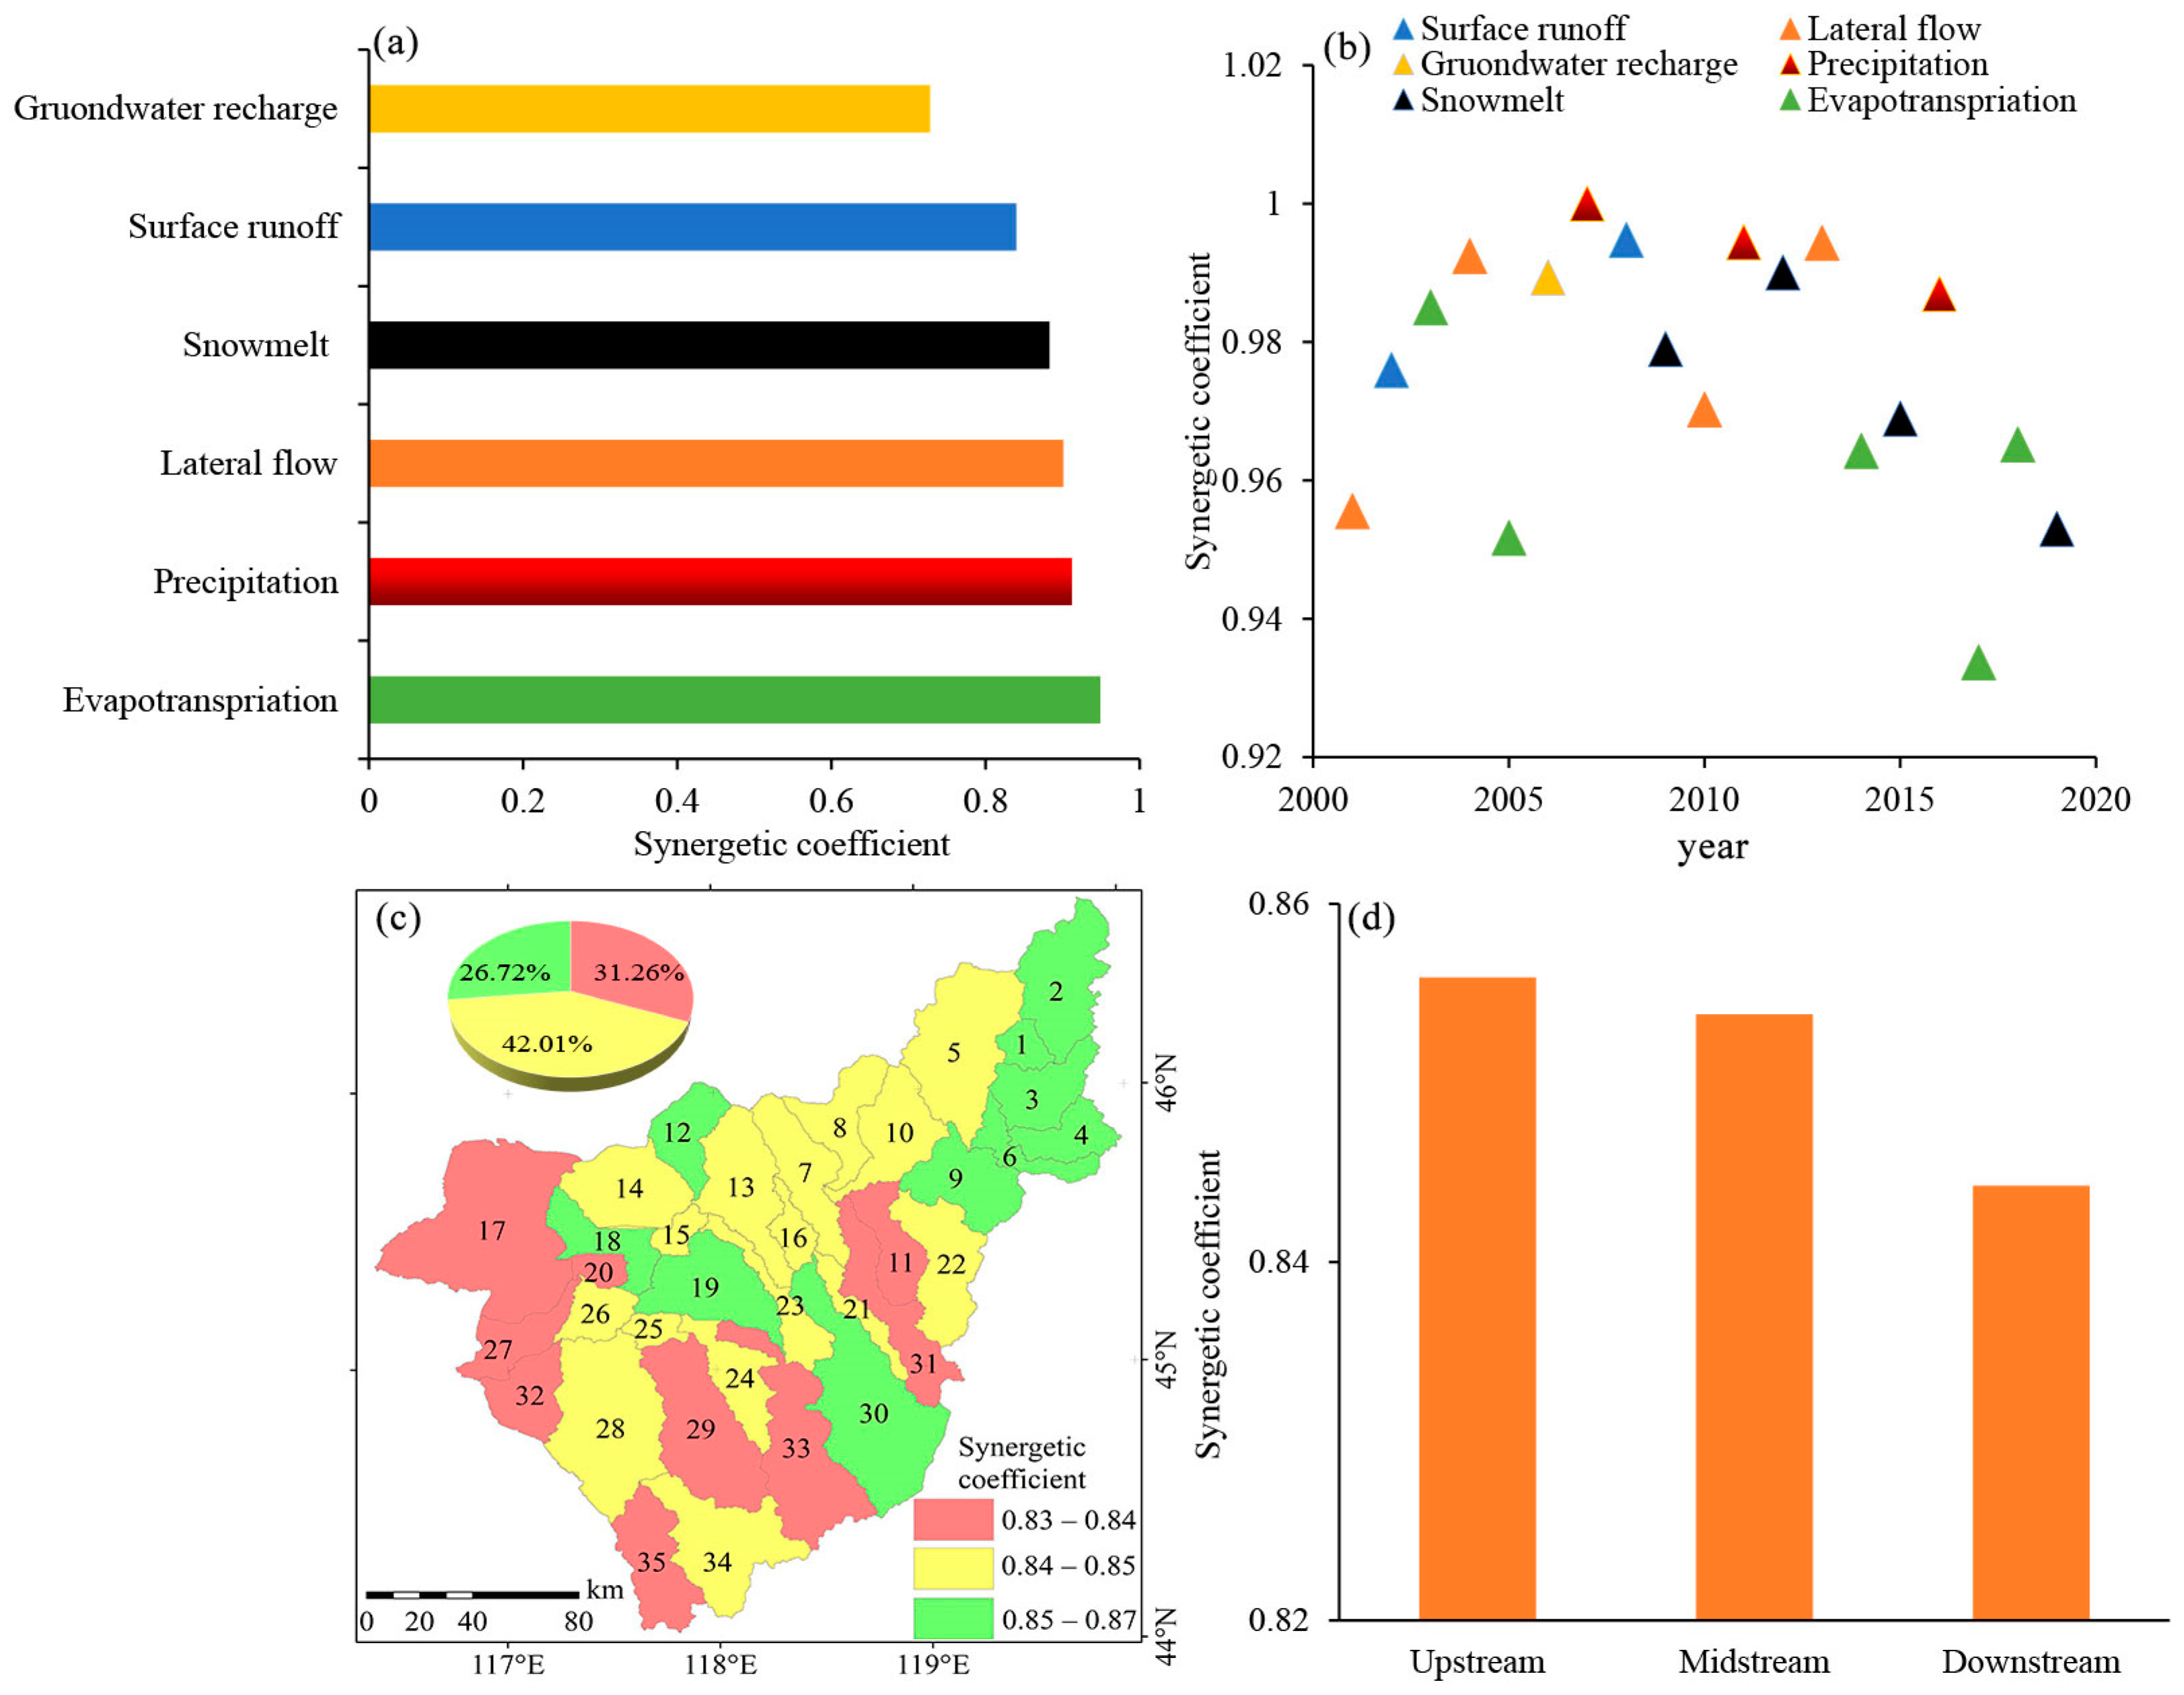
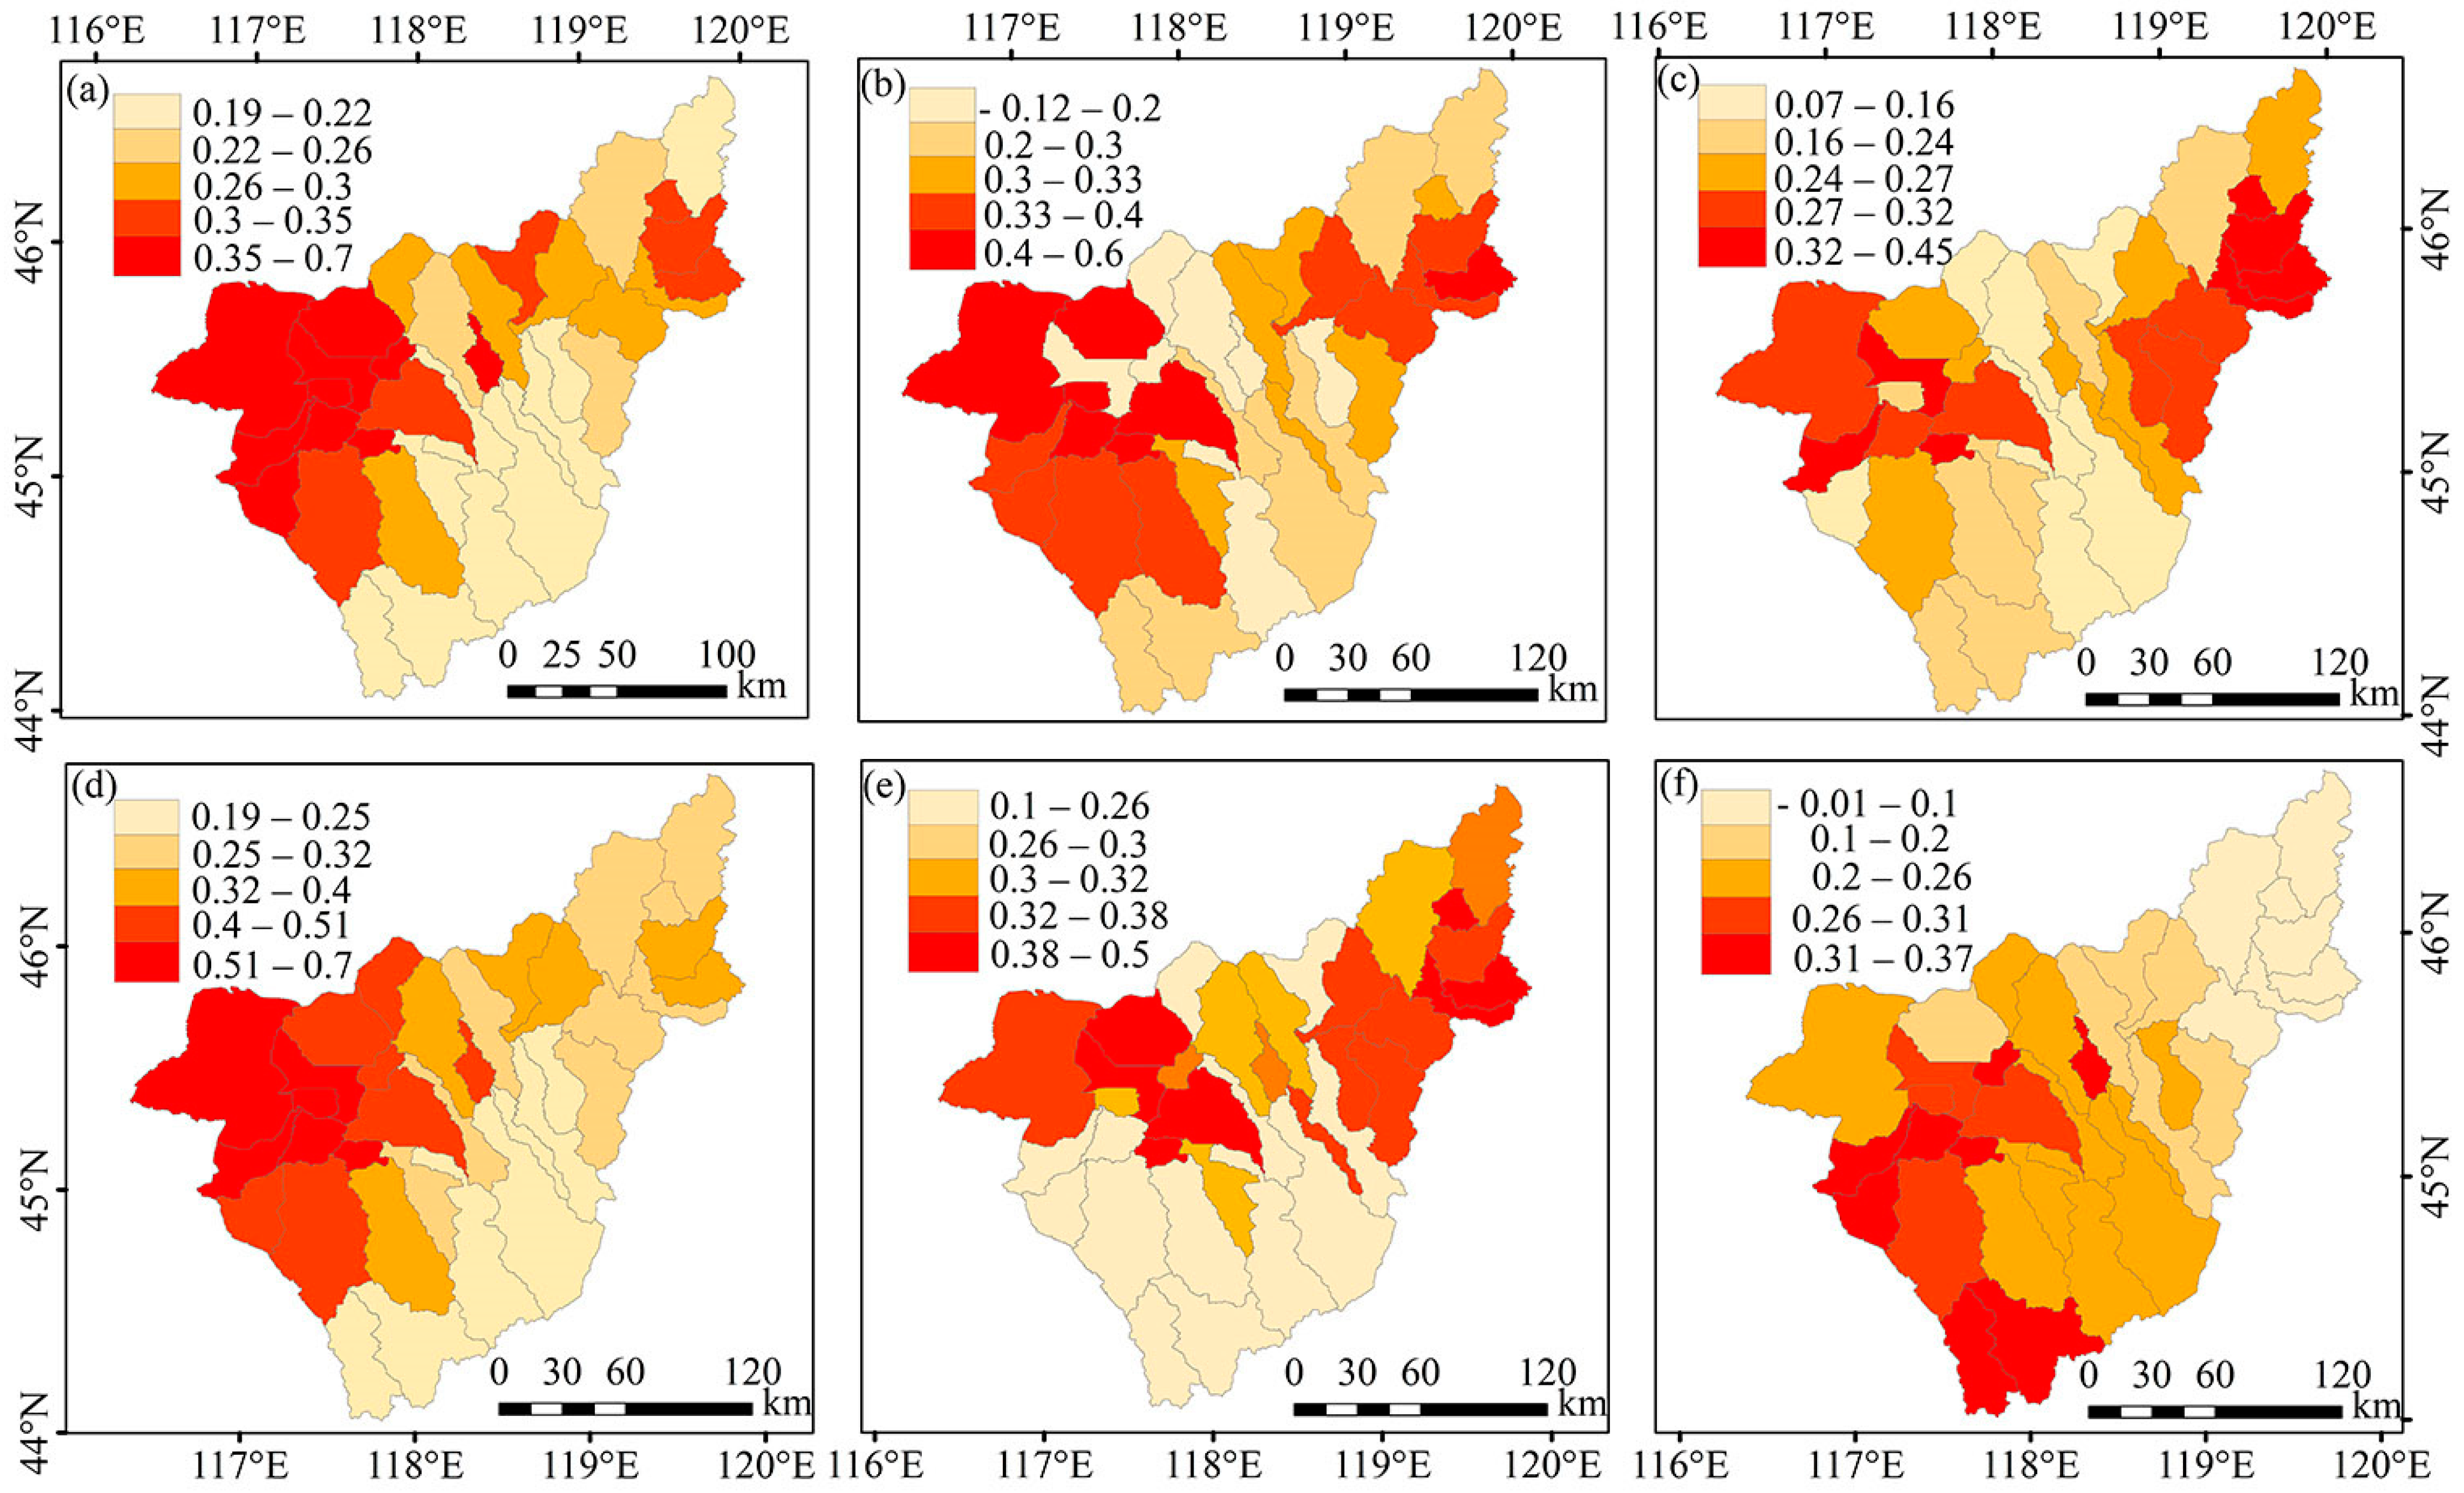
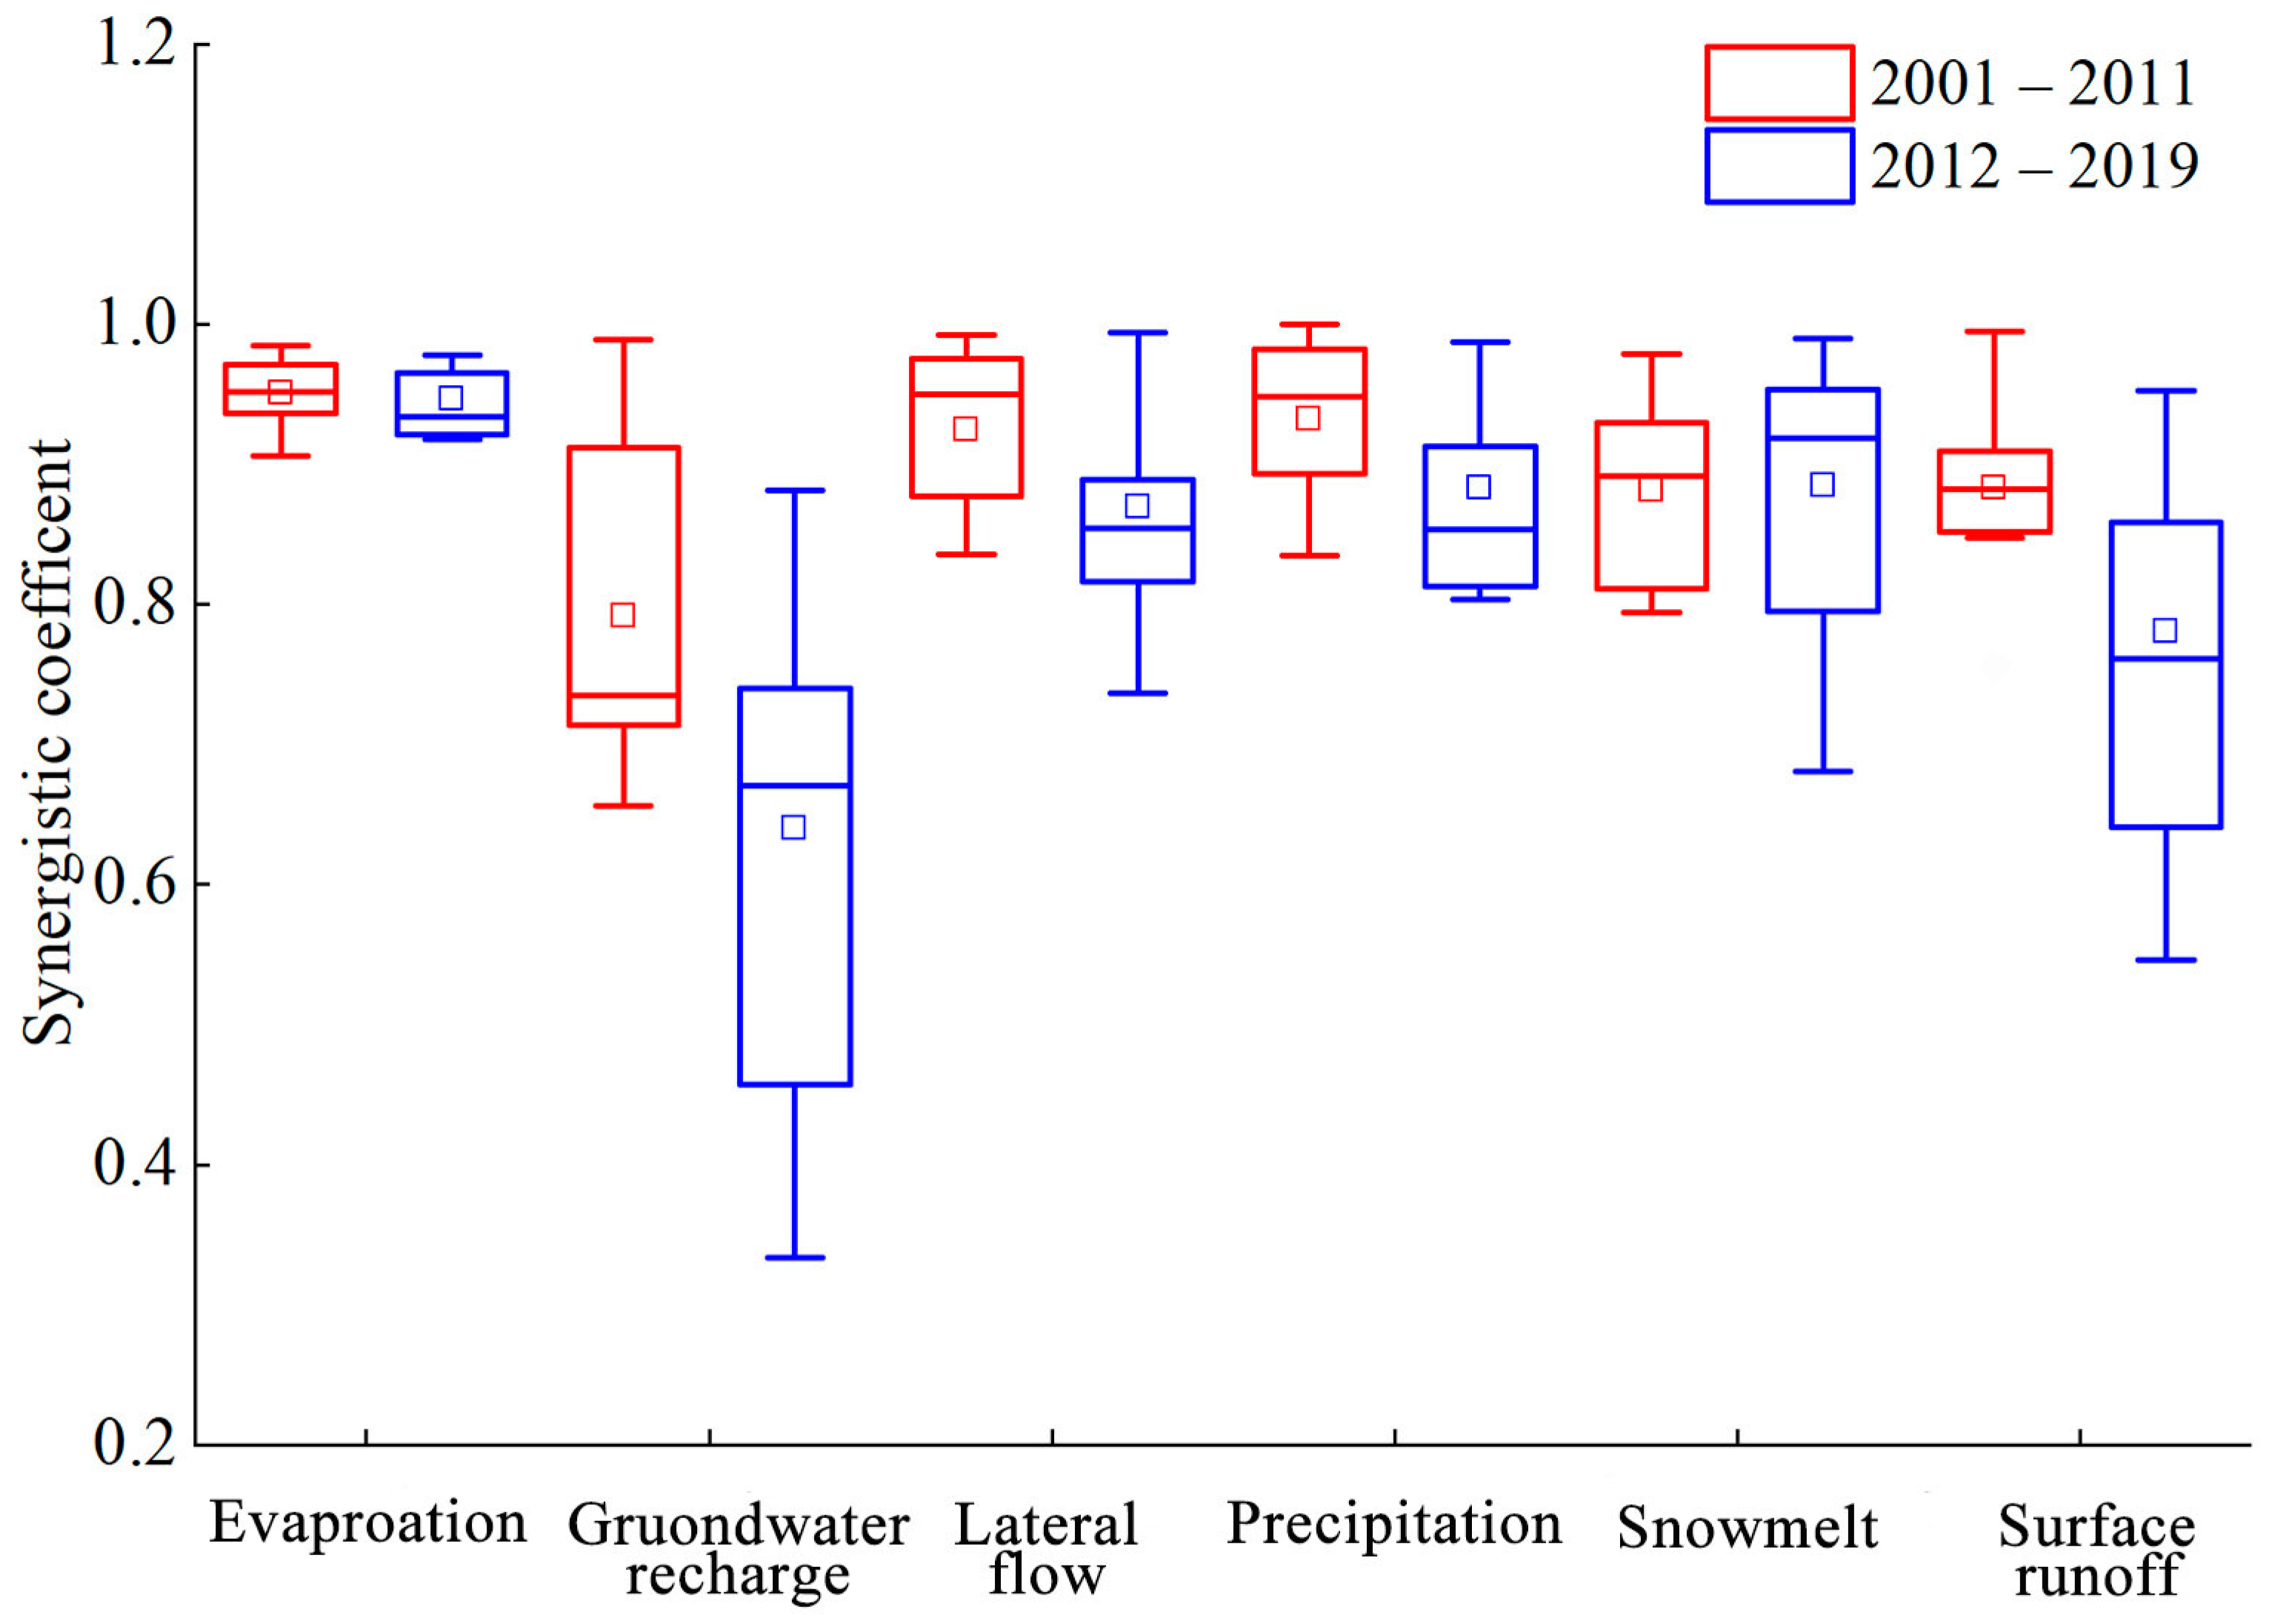
3.4. Synergy Relationships between the URB’s Hydrological Process Factors and EQ

First, we analyzed the synergy between the hydrological process factors and EQ, using the gray correlation method. It was found that a high synergy existed between the URB’s hydrological process factors and EQ during the study period, with correlations ranging between 0.7 and 0.95, along with large differences between different river sections (Figure 8a). The correlations of ET, precipitation, and lateral flow with EQ in the last 19 years were 0.95, 0.91, and 0.90, respectively. Taking 2012, the year with the largest EQ fluctuations, as a reference point, the synergy between EQ and the hydrological process factors was found to be high until 2012, with a mean value of 0.89, but decreased later, with a mean value of 0.83. The synergy between EQ and precipitation was found to be the highest in 2007 and the lowest in 2017 for ET. Moreover, surface runoff, lateral flow, and groundwater recharge mainly occurred during the early part of the study period; snowmelt was mainly concentrated toward the latter part (Figure 8b). The synergy between the hydrological process factors and EQ at the subbasin scale is in Figure 8c, with synergy coefficients higher than 0.8. The areas with lower synergy were mainly located west and south of the downstream regions. The synergy between the hydrological process factors and EQ decreased from the upstream to the downstream regions, according to varied river sections (Figure 8d).
Second, we analyzed the synergistic effects of the hydrological process factors and EQ through Pearson correlation analysis. Between 2001 and 2019, except for individual subbasins where ET was negatively correlated with EQ (e.g., Subbasins 11 and 13), all ET-EQ correlations were positive. Moreover, a large spatial heterogeneity was observed in the synergy (Figure 9). The synergistic relationships between precipitation, evapotranspiration, surface runoff, lateral flow, and groundwater recharge and EQ are stronger in the northwestern part of the downstream of the basin and in the southern part of the upstream—both around 0.5. However, the synergistic effect of the two is weaker in the southern part of the downstream. The synergistic coefficient between lateral flow and EQ in the lower reaches of the basin reached around 0.7. The synergy between snowmelt and EQ in the northwest region of the downstream basin was 0.37, while that in the upstream was only 0.1. In general, the synergy between the hydrological process factors and EQ was found to be stronger in the downstream basin and weaker in the upstream basin during 2001–2019.
To gain deeper insights into the key hydrological process factors that account for EQ improvements in the URB, we further compared the synergistic coefficients of the hydrological process factors with EQ in each subbasin. As seen in Figure 10, EQ had the highest synergy with groundwater, lateral flow, ET, and snowmelt in the basin. The synergy between EQ and lateral flow is high in most parts of the basin, with the highest value of 0.626. It passed the significance test, accounting for 53.37% of the total basin area, mainly concentrated downstream. This was followed by groundwater, which accounts for 22.5% of the total basin area, and is mainly concentrated in the Southeastern URB. ET was most synergistic in the central part of the downstream area. The strongest synergy with snowmelt was mainly seen in the southern part of the downstream area. In general, the strongest synergistic hydrological process factors in the URB’s upstream and midstream areas were relatively singular and mainly related to groundwater. However, the strongest synergistic factors in the URB downstream area were more diverse.

4. Discussion

4.1. Intrinsic Mechanisms of Change in the Synergistic Relationship between the URB’s Hydrological Process Factors and EQ

Regional climatic changes and surface cover can effectively alter the distribution and balance of water and energy at the surface, thus affecting hydrological processes [3]. Precipitation, as the main source of hydration in arid and semi-arid regions, has a self-evident influence on hydrological processes [15]. The URB has experienced a warming and wetting trend from 2001 to 2019, with an increase in precipitation and that peaked in 2012 [36]. ET, surface runoff, lateral flow, and groundwater recharge also showed an increasing trend, and all of them peaked during the peak precipitation year or the year after.
The overall EQ trend in the URB is improving, showing an increasing trend from 2001 to 2012 and a decreasing trend from 2012 to 2019. Taking 2012, the year with large fluctuations in EQ, as the point, it was found that the synergy between EQ and hydrological process factors was high until 2012, with a mean value of 0.89, and then the synergy decreased, with a mean value of 0.83. As shown in the figure, from 2012 to 2019, the average correlations between ET, groundwater recharge, lateral flow, precipitation, and surface runoff and EQ have all decreased compared to 2001–2011. In particular, the average changes in lateral flow, precipitation, and surface runoff are large (Figure 11). This suggests that the climate and hydrology condition are not the only forces affecting EQ that were improved in this inland river basin and that there may be external drivers as well. Over the entire study period, EQ was consistent with the trends of the hydrological process factors such as precipitation, surface runoff, lateral flow, groundwater recharge, and snowmelt. In the arid and semi-arid regions, where water resources are scarce, increased precipitation results in a rise in the hydrological process factors such as surface runoff and groundwater recharge. This, in turn, provides more water for vegetation growth and can appropriately alleviate the stress caused earlier by water scarcity [35,37,38]. Additionally, the acceleration of the water circulation increases the activity of soil microorganisms to a certain extent, promotes vegetation nutrient absorption, and provides better growth conditions for vegetation [36]. In spatial terms, the URB’s EQ is consistent with the spatial distribution characteristics of the precipitation changes there; thus, the precipitation in the region influences its EQ [36].
The URB is covered mainly by grassland cover types, which are strongly dependent on hydrological processes [37]. The degree of synergy between the URB’s hydrological process factors and EQ over the last 19 years was higher than 0.7. The synergy between the two was lower in the western and southern parts of downstream URB. This synergy coincides chiefly with EQ decline areas, indicating that EQ decline is influenced by external factors other than the hydrological process factors. The synergy between the hydrological process factors and EQ gradually decreased from upstream to downstream areas, indicating that the URB’s EQ is affected more by external disturbances in the downstream areas than those in the upstream areas. The highest synergy was seen between the improvement of EQ and the groundwater, lateral flow, ET, and snowmelt. The increasing trend of ET, a water-consumptive state in the hydrological cycle, may harm vegetation [15,39]. However, the increase in precipitation, runoff, and groundwater recharge in the URB was larger than the increase in ET during the study period, thus offsetting the water loss while still increasing the amount of water available for vegetation [40,41].

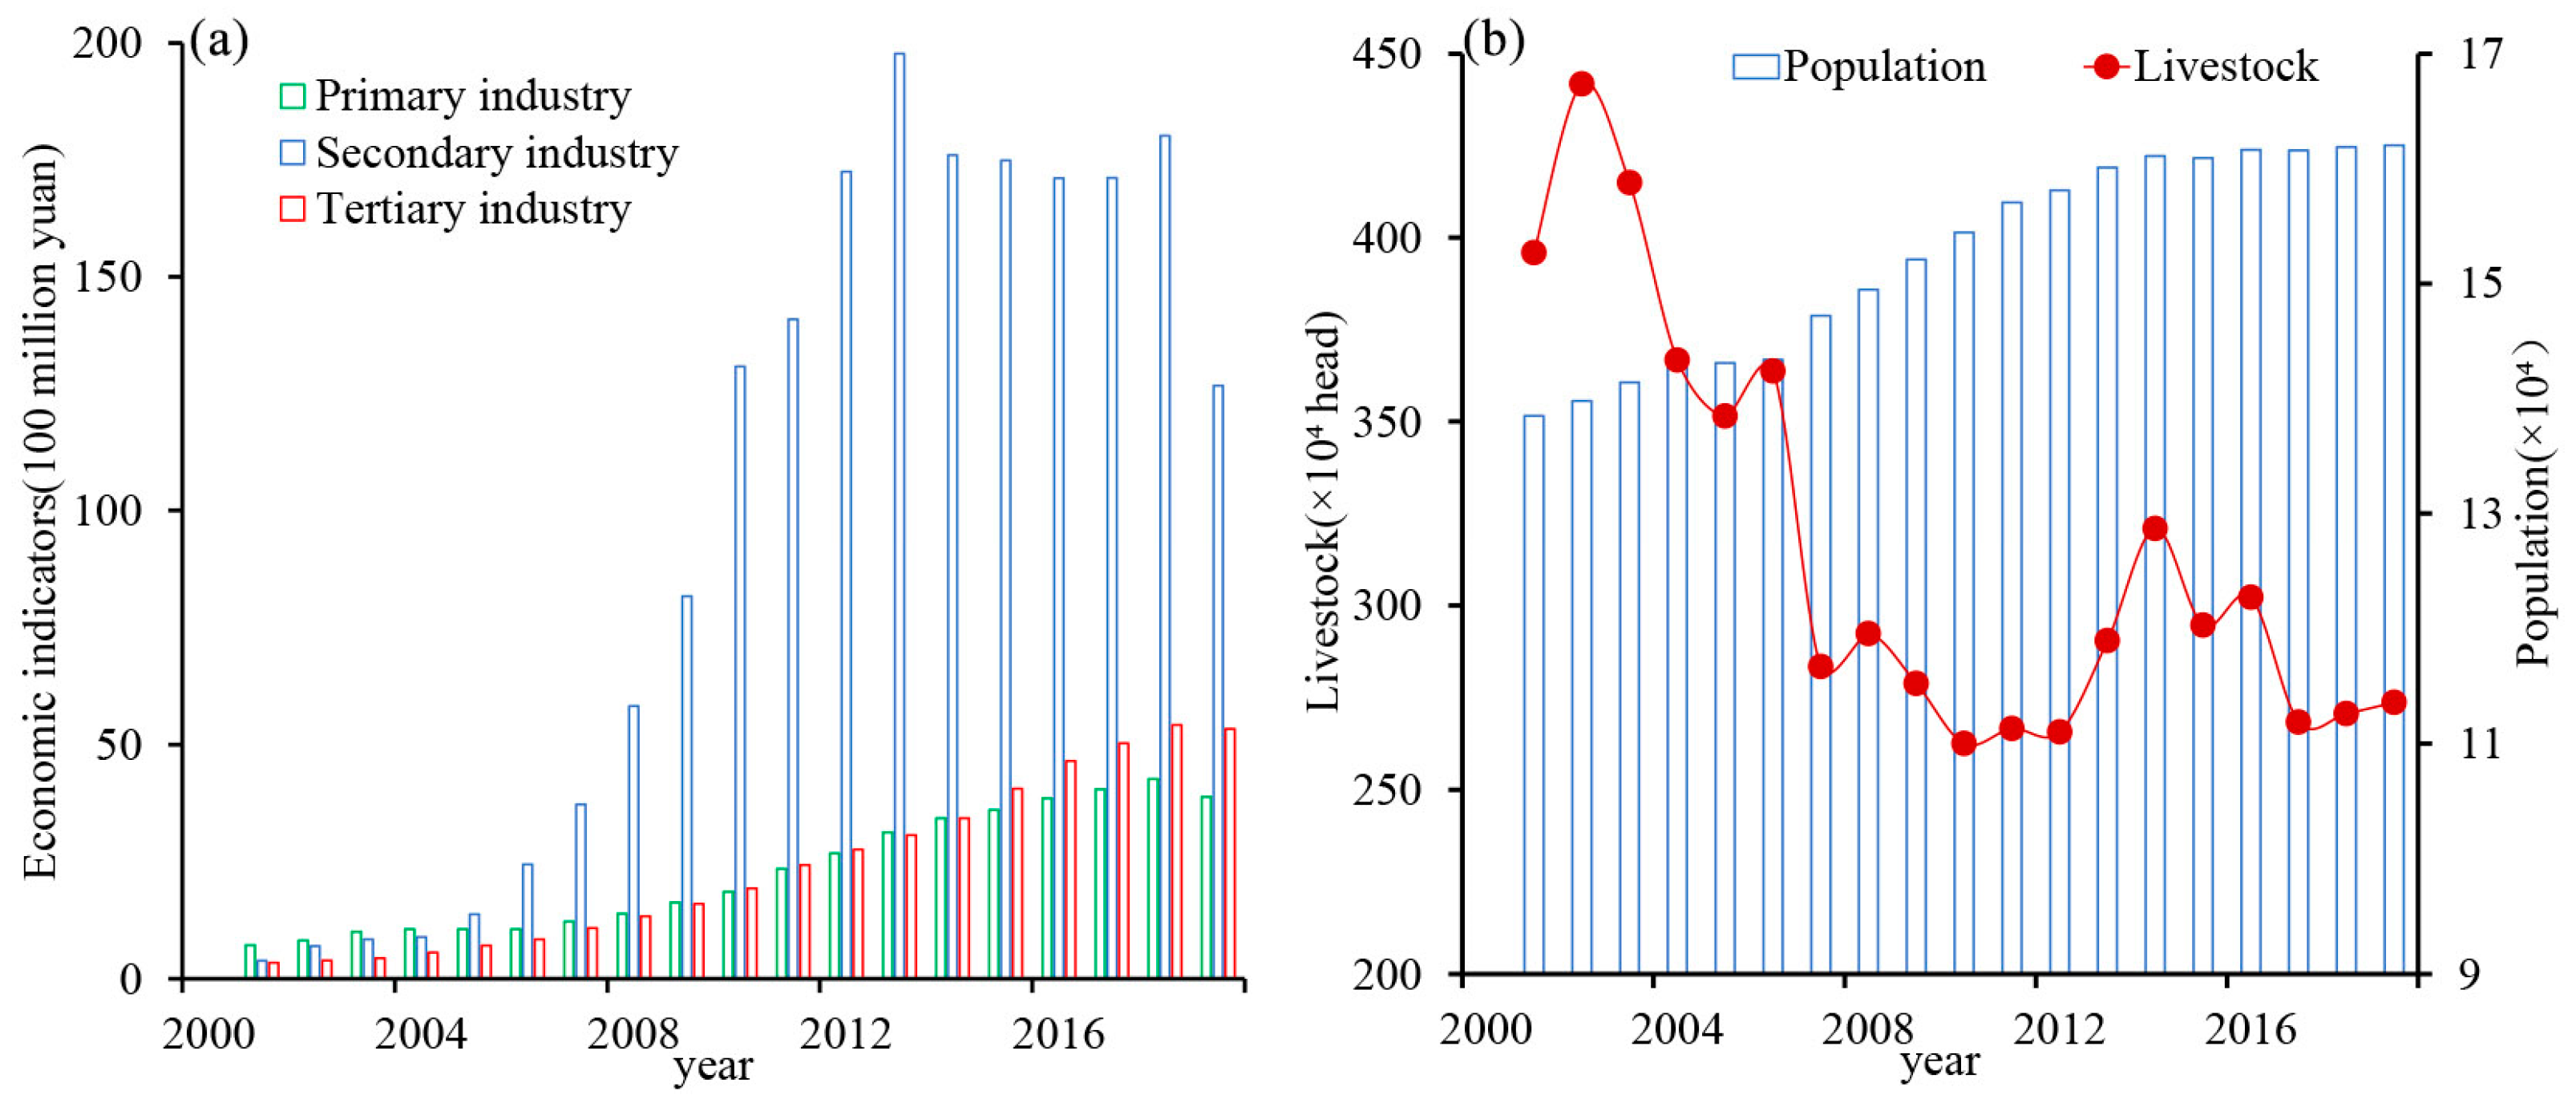
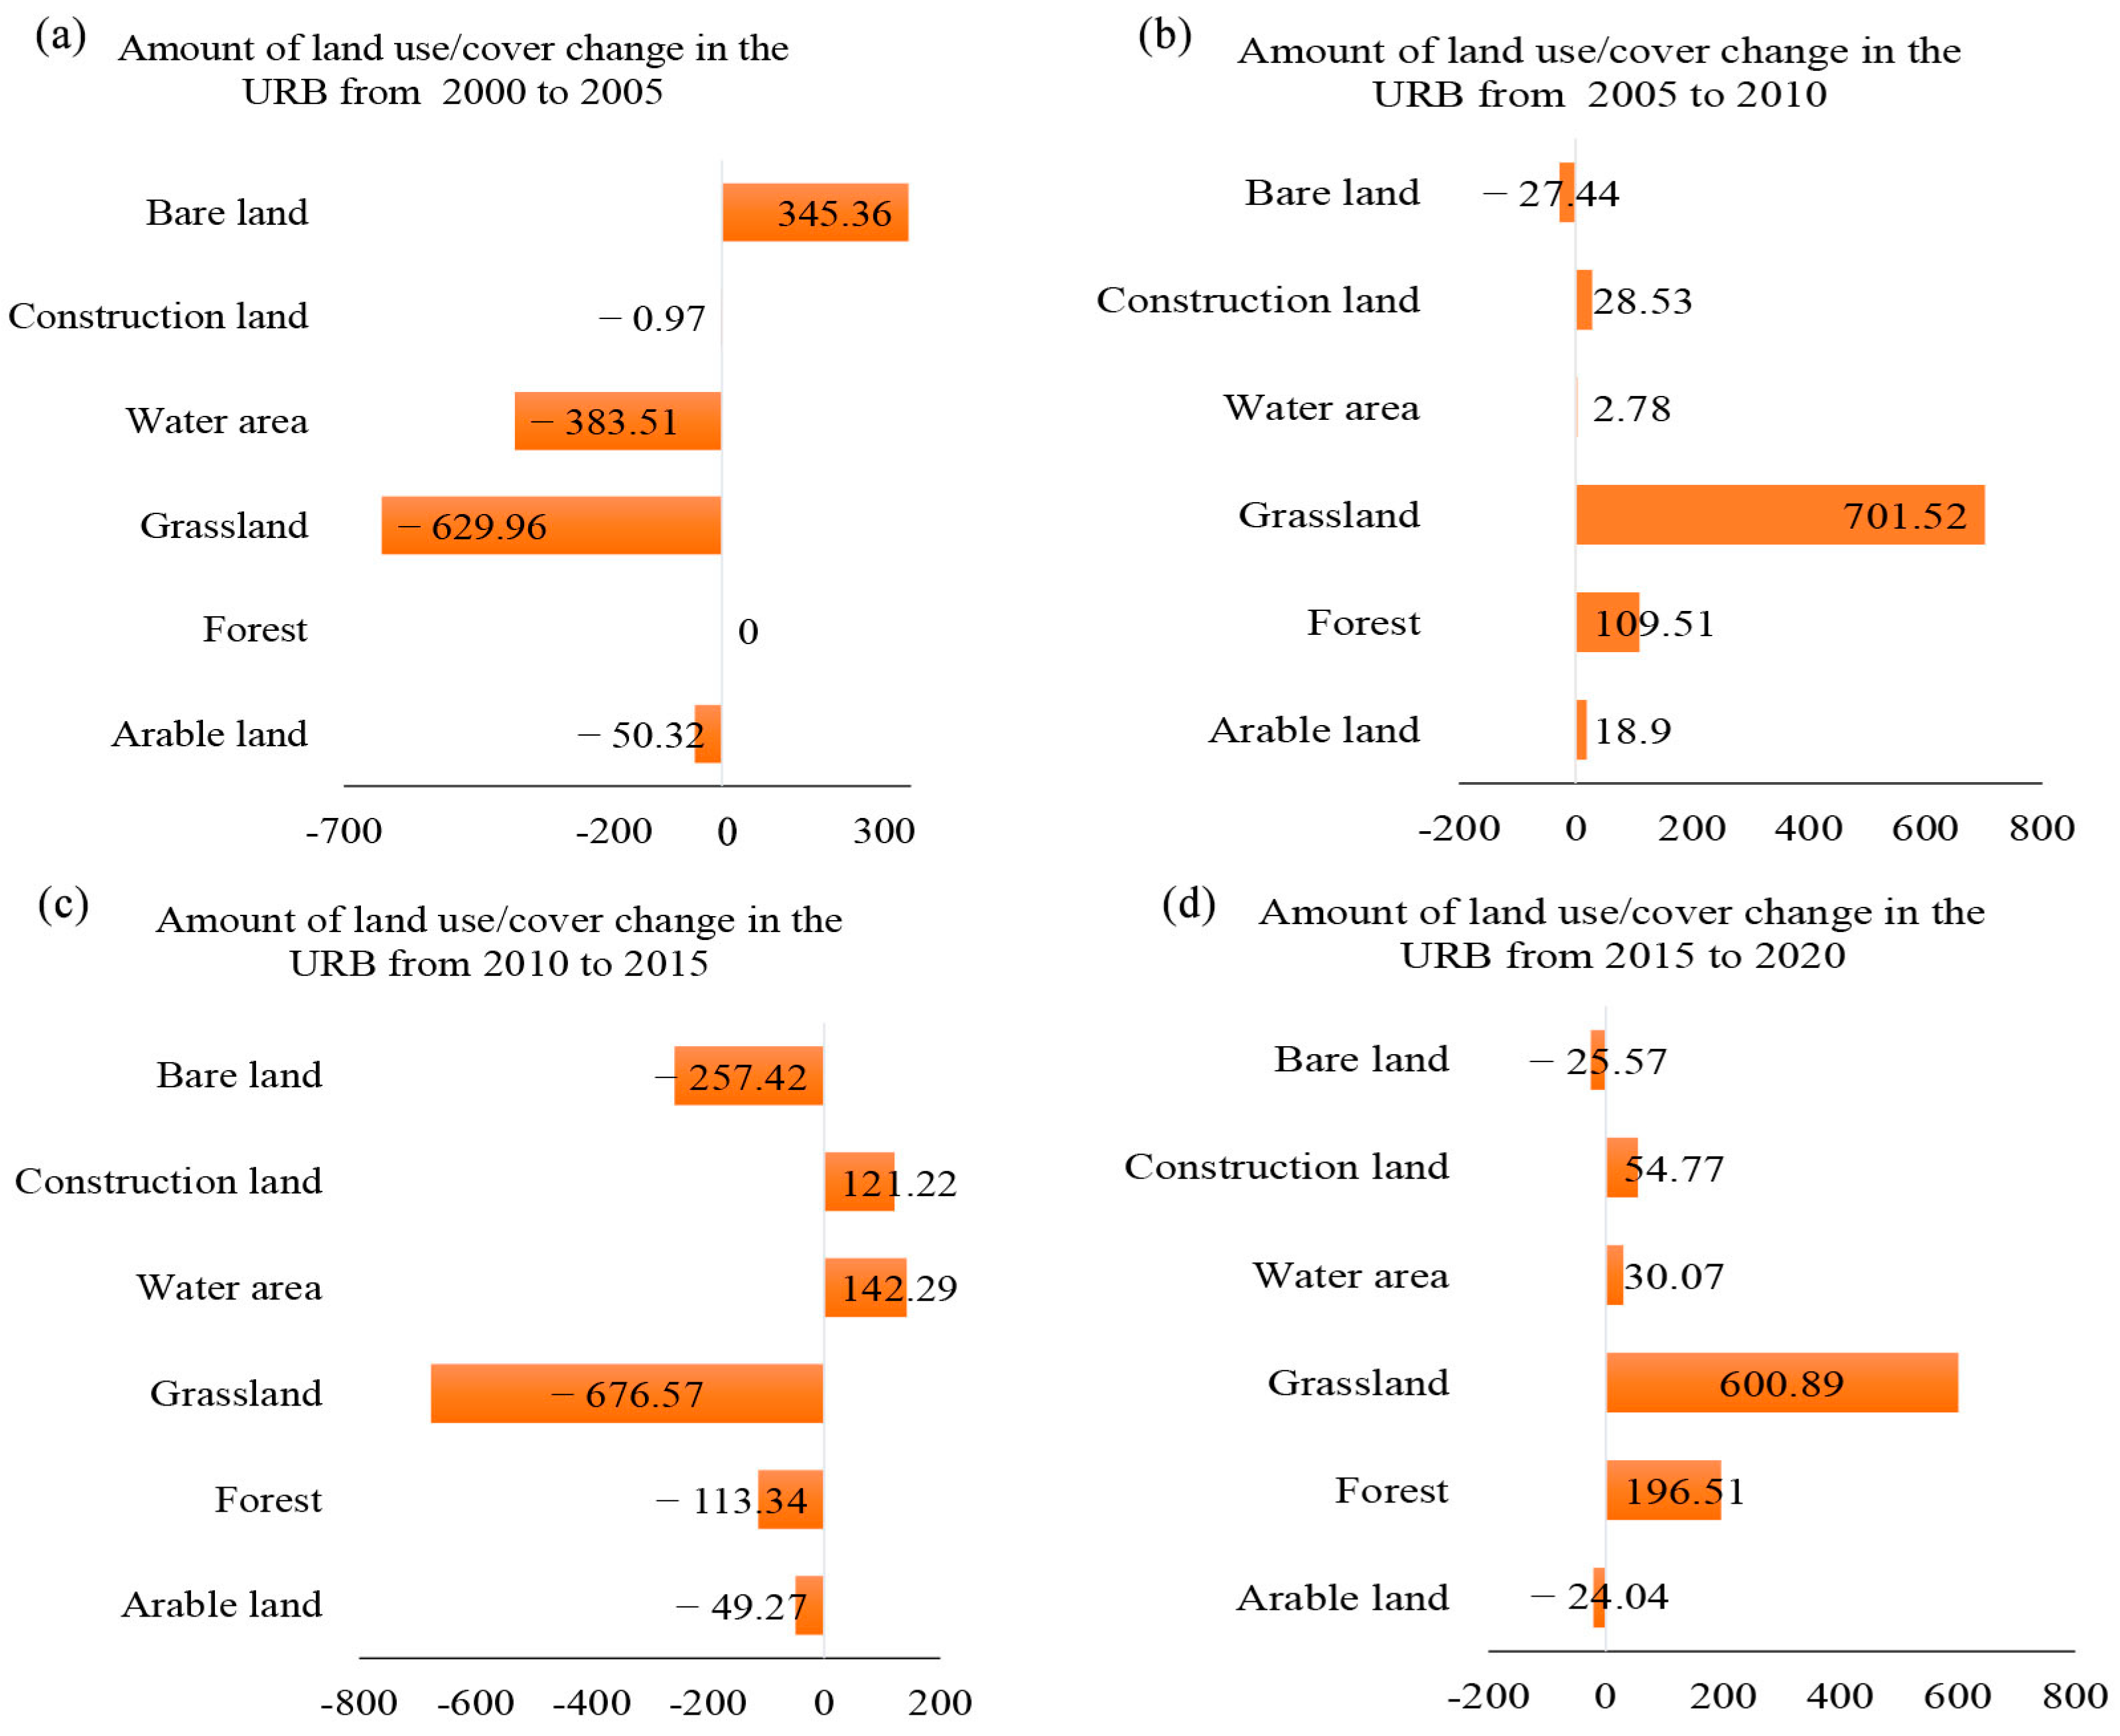
4.2. Extrinsic Disturbances Affecting Changes in the Synergistic Relationship between the URB’s Hydrological Processes and EQ

In the context of the URB warming and humidifying, EQ was dominated by a non-significant increase from 2001 to 2019. Even under supportive conditions for vegetation growth, EQ degradation still occurred in the southern and northwestern parts of the downstream region of the URB. Moreover, the results of this study showed that the correlation between the URB’s hydrological process factors and EQ was relatively high until 2012 and decreases afterward. This suggests that climatic and hydrological conditions are not the only forces affecting improved EQ in this inland river basin and that external drivers may be behind it as well.
The rapid economic development and continuous population increase led to urban expansion and increased industrial and mineral land use, and road construction generates ecological problems such as increased water consumption and the destruction of grasslands [42]. This study collected data about population and socioeconomic indicators (primary, secondary, and tertiary industries) from the statistical annals of the URB, during 2001–2019, in an attempt to explore the link between the hydrological process factors and EQ (Figure 12) and found that the population and socioeconomic indicators in the URB showed an increasing trend. In particular, the secondary sector surged in 2010 and reached its peak in 2012. This might have been the main reason for the slight decrease in EQ and increase in the correlation with the URB’s hydrological process factors after 2012. On the one hand, the construction of hydraulic reservoirs and industrial mines has contributed to the socioeconomic development of the region; on the other hand, the construction of factories and reservoirs has cut off the main streams of the river basin and occupied a large area of grassland, increasing the conflict between man and nature [15]. To achieve sustainable ecological development, the Inner Mongolia Autonomous Region has taken corresponding ecological restoration measures, such as the Beijing–Tianjin Sand Source Control Project, the Natural Forest Protection Project, and the policy of Returning Grazing Land to Grassland Project, mainly by reducing livestock and resting grazing [43,44]. As seen in Figure 12b and Figure 13, the trends of gradual reduction of total livestock, reduction of arable land area, and subsequent increase of grassland, as well as forest land area, from 2001 to 2019 confirm the effective implementation of this series of measures. This has improved the carrying capacity of grasslands to some extent, by reducing the consumption of water resources and the burden on grasslands [45]. Ecological protection measures taken by the government have accelerated EQ improvement, as well as soil and water conservation, in the URB.

5. Conclusions

This study was based on the improved SWAT model and comprehensive EQ assessment model. It analyzed the spatial and temporal distribution and evolutionary characteristics of the URB’s hydrological process factors and EQ and identified their synergy relationships and their internal and external change-driving mechanisms. The main conclusions of this study are as follows:
(1)
Besides snowmelt, the URB’s hydrological process factors, such as precipitation, ET, surface runoff, lateral flow, and groundwater recharge, are all on the rise; the change rate of the downstream hydrological process factors is higher than that of the upstream factors.
(2)
During 2001–2019, the URB’s EPI, ESI, and EBCI showed an increasing trend. The EPI and EBCI were higher in the upstream and southern part of the downstream, whereas the ESI of the downstream is higher than that of the upstream. The multi-year average value of the URB’s EQ was 53.66, which is a medium level. The overall EQ trend improved, accounting for 95.14% of the total basin area, of which, of these, 19.75% were dominated by significant increases, mainly in the upstream and northern part of the downstream.
(3)
The synergistic relationship between the hydrological process factors and EQ is strong. The degree of synergy between the URB’s EQ and the hydrological process factors was higher than 0.7 during the study period. Moreover, this relationship showed obvious spatial heterogeneity, with a decreasing distribution pattern from upstream to downstream areas. The URB’s EQ improved with an increase in precipitation, surface runoff, lateral flow, and groundwater recharge. Furthermore, the ecological protection measures proposed by the government have accelerated the improvement of the ecosystem, which plays an important role in promoting soil and water conservation and EQ. Local governments should continue to strengthen the implementation of ecosystem protection strategies.
Overall, this study focused on the whole hydrological cycle process and evaluated EQ in an integrated way, with three aspects, i.e., EPI, ESI, and EBCI. On this basis, we analyzed the synergistic evolutionary relationship between hydrological processes and EQ in arid and semi-arid regions. This study contributes to theoretical support for understanding the synergistic relationship between ecological changes and hydrological processes in arid and semi-arid regions and provides new ideas for related studies. In this study, the external drivers of hydrologic processes and EQ were not discussed comprehensively. Therefore, the quantitative effects of industrial and mining exploitation, agricultural irrigation, and extreme weather on the relationship between hydrological processes and ecosystem quality should be considered in future studies.

Author Contributions

Conceptualization, methodology, and writing—original draft preparation, H.C.; conceptualization, supervision, inspection, review, and editing, F.M., C.S. and M.L.; investigation and validation, H.Z., S.B. and G.L.; investigation, Y.B. All authors have read and agreed to the published version of the manuscript.

Funding

This work was jointly supported by the National Natural Science Foundation of China (Nos. 42261079, 42101030, 41861014 and 41961058), Natural Science Foundation of Inner Mongolia Autonomous Region (Nos. 2022MS04004, 2020BS03042 and 2020BS04009), Key research, development and achievement transformation project of Inner Mongolia Autonomous Region (No. 2022YFDZ0061), Development Plan for Young Scientific and Technological Talents in Higher Education Institutions of Inner Mongolia Autonomous Region (Nos. NJYT23019 and NJYT22027), Fundamental Research Funds for the Inner Mongolia Normal University (Nos. 2022JBQN093 and 2022JBBJ014).

Data Availability Statement

Not applicable.

Acknowledgments

The authors would like to thank the editors and anonymous reviewers for their valuable comments and suggestions, which improved the quality of the manuscript.

Conflicts of Interest

The authors declare no conflict of interest.

References

  1. Luo, M.; Liu, T.; Meng, F.; Duan, Y.; Bao, A.; Xing, W.; Feng, X.; De Maeyer, P.; Frankl, A. Identifying Climate Change Impacts on Water Resources in Xinjiang, China. Sci. Total Environ. 2019, 676, 613–626. [Google Scholar] [CrossRef] [PubMed]
  2. Zhang, Q.; Xu, C.Y.; Zhang, Z.; Ren, G.; Chen, Y.D. Climate Change or Variability? The Case of Yellow River as Indicated by Extreme Maximum and Minimum Air Temperature During 1960–2004. Theor. Appl. Climatol. 2008, 93, 35–43. [Google Scholar] [CrossRef]
  3. Yao, J.; Chen, Y.; Guan, X.; Zhao, Y.; Chen, J.; Mao, W. Recent Climate and Hydrological Changes in a Mountain–Basin System in Xinjiang, China. Earth-Sci. Rev. 2022, 226, 103957. [Google Scholar] [CrossRef]
  4. Chen, Y.; Li, B.; Fan, Y.; Sun, C.; Fang, G. Hydrological and Water Cycle Processes of Inland River Basins in the Arid Region of Northwest China. J. Arid Land. 2019, 11, 161–179. [Google Scholar] [CrossRef] [Green Version]
  5. Chen, J.; Brissette, F.P.; Poulin, A.; Leconte, R. Overall Uncertainty Study of the Hydrological Impacts of Climate Change for a Canadian Watershed. Water Resour. Res. 2011, 47, W12509. [Google Scholar] [CrossRef]
  6. Meng, F.; Liu, T.; Huang, Y.; Luo, M.; Bao, A.; Hou, D. Quantitative Detection and Attribution of Runoff Variations in the Aksu River Basin. Water 2016, 8, 338. [Google Scholar] [CrossRef] [Green Version]
  7. Li, C.; Qi, J.; Feng, Z.; Yin, R.; Zou, S.; Zhang, F. Parameters Optimization Based on the Combination of Localization and Auto-Calibration of SWAT Model in a Small Watershed in Chinese Loess Plateau. Front. Earth Sci. China 2010, 4, 296–310. [Google Scholar] [CrossRef]
  8. Luo, Y.; Arnold, J.; Liu, S.; Wang, X.; Chen, X. Inclusion of Glacier Processes for Distributed Hydrological Modeling at Basin Scale with Application to a Watershed in Tianshan Mountains, Northwest China. J. Hydrol. 2013, 477, 72–85. [Google Scholar] [CrossRef]
  9. Idrees, M.; Ahmad, S.; Khan, M.W.; Dahri, Z.H.; Ahmad, K.; Azmat, M.; Rana, I.A. Estimation of Water Balance for Anticipated Land Use in the Potohar Plateau of the Indus Basin Using SWAT. Remote Sens. 2022, 21, 5421. [Google Scholar] [CrossRef]
  10. Luan, X.; Wu, P.; Sun, S.; Li, X.; Wang, Y.; Gao, X. Impact of Land Use Change on Hydrologic Processes in a Large Plain Irrigation District. Water Resour. Manag. 2018, 32, 3203–3217. [Google Scholar] [CrossRef]
  11. Xiao, Y.; Ou Yang, Z.; Wang, L.; Rao, E.; Jiang, L. Spatial Characteristics of Ecosystem Quality and its Driving Forces in Inner Mongolia. J. Ecol. 2016, 36, 6019–6030. (In Chinese) [Google Scholar]
  12. Wei, W.; Guo, Z.; Xie, B.; Zhou, J.; Li, C. Spatiotemporal Evolution of Environment Based on Integrated Remote Sensing Indexes in Arid Inland River Basin in Northwest China. Environ. Sci. Pollut. Res. 2019, 26, 13062–13084. [Google Scholar] [CrossRef] [PubMed]
  13. Ma, L.; Bo, J.; Li, X.; Fang, F.; Cheng, W. Identifying Key Landscape Pattern Indices Influencing the Ecological Security of Inland River Basin: The Middle and Lower Reaches of Shule River Basin as an Example. Sci. Total Env. 2019, 674, 424–438. [Google Scholar] [CrossRef] [PubMed]
  14. Huang, F.; Chunyu, X.; Zhang, D.; Chen, X.; Ochoa, C.G. A Framework to Assess the Impact of Ecological Water Conveyance on Groundwater-Dependent Terrestrial Ecosystems in Arid Inland River Basins. Sci. Total Env. 2020, 709, 136155. [Google Scholar] [CrossRef]
  15. Zhang, Y.; Wang, Q.; Wang, Z.; Yang, Y.; Li, J. Impact of Human Activities and Climate Change on the Grassland Dynamics Under Different Regime Policies in the Mongolian Plateau. Sci. Total Environ. 2022, 698, 134304. [Google Scholar] [CrossRef]
  16. Hao, L.; Sun, G.; Liu, Y.; Gao, Z.; He, J.; Shi, T.; Wu, B. Effects of Precipitation on Grassland Ecosystem Restoration Under Grazing Exclusion in Inner Mongolia, China. Landsc. Ecol. 2014, 29, 1657–1673. [Google Scholar] [CrossRef]
  17. Liu, Y.; Zhuang, Q.; Chen, M.; Pan, Z.; Tchebakova, N.; Sokolov, A.; Kicklighter, D.; Melillo, J.; Sirin, A.; Zhou, G.; et al. Response of Evapotranspiration and Water Availability to Changing Climate and Land Cover on the Mongolian Plateau During the 21st Century. Glob. Planet. Chang. 2013, 108, 85–99. [Google Scholar] [CrossRef]
  18. Woo, Y.H.; Min, J.P.; Jong, Y.P.; Geun, A.P.; Joon, K.S. The Spatial and Temporal Correlation Analysis Between MODIS NDVI and SWAT Predicted Soil Moisture during Forest NDVI Increasing and Decreasing Periods. KSCE J. Civ. Eng. 2010, 14, 931–939. [Google Scholar]
  19. Zhang, X.; Yu, G.Q.; Li, Z.B.; Li, P. Experimental Study on Slope Runoff, Erosion and Sediment under Different Vegetation Types. Water Resour. Manag. 2014, 28, 2415–2433. [Google Scholar] [CrossRef]
  20. Zhang, Y.; Liang, W.; Liao, Z.; Han, Z.; Xu, X.; Jiao, R.; Liu, H. Effects of Climate Change on Lake Area and Vegetation Cover over the Past 55 Years in Northeast Inner Mongolia Grassland, China. Theor. Appl. Climatol. 2019, 138, 13–25. [Google Scholar] [CrossRef]
  21. Xue, L.; Wang, J.; Zhang, L.; Wei, G.; Zhu, B. Spatiotemporal Analysis of Ecological Vulnerability and Management in the Tarim River Basin, China. Sci. Total Environ. 2019, 649, 876–888. [Google Scholar] [CrossRef] [PubMed]
  22. Su, B.D.; Yi, J.; Chen, J.; Bao, X.; Sa, R.N.S.Q. Analysis of Vegetation Degeneration Succession Trend in Middle and Lower Reaches of Wulagai Wetland of Inner Mongolia. Chin. J. Grassl. 2011, 33, 73–78. [Google Scholar]
  23. Liu, J.; Luo, M.; Liu, T.; Bao, A.; De Maeyer, P.; Feng, X.; Chen, X. Local Climate Change and the Impacts on Hydrological Processes in an Arid Alpine Catchment in Karakoram. Water 2017, 9, 344. [Google Scholar] [CrossRef] [Green Version]
  24. Gang, C.C.; Zhang, Y.Z.; Wang, Z.Q.; Chen, Y.Z.; Yang, Y.; Li, J.L.; Cheng, J.M.; Qi, J.G.; Odeh, I. Modeling the Dynamics of Distribution, Extent, And NPP of Global Terrestrial Ecosystems in Response to Future Climate Change. Glob. Planet. Chang. 2017, 148, 153–165. [Google Scholar] [CrossRef]
  25. Chen, P. Study of Plant Community Succession and Vegetation Dynamics in the Wulagai Basin in the Past 20 Years; Inner Mongolia University: Inner Mongolia, China, 2019. (In Chinese) [Google Scholar]
  26. Zhang, Y.; Liu, Z. Study on Water Resources Assessment and Reasonable use of Wulagai River and its Main Tributary. J. Arid. Land Resour. Environ. 1999, 1, 55–65. (In Chinese) [Google Scholar]
  27. Nacun, B.; Nendel, C.; Hu, Y.; Lakes, T. Land-Use Change and Land Degradation on the Mongolian Plateau from 1975 to 2015—A Case Study from Xilingol, China. Land Degrad. Dev. 2018, 29, 1595–1606. (In Chinese) [Google Scholar]
  28. Duan, Y.; Meng, F.; Liu, T.; Huang, Y.; Luo, M.; Xing, W.; De Maeyer, P. Sub-Daily Simulation of Mountain Flood Processes Based on the Modified Soil Water Assessment Tool (SWAT) Model. Int. J. Environ. Res. Public Health 2019, 16, 3118. [Google Scholar] [CrossRef] [PubMed] [Green Version]
  29. Meng, F.; Liu, T.; Wang, H.; Luo, M.; Duan, Y.; Bao, A. An Alternative Approach to Overcome the Limitation of Hrus in Analyzing Hydrological Processes Based on Land Use/Cover Change. Water 2018, 10, 434. [Google Scholar] [CrossRef] [Green Version]
  30. Luo, M.; Liu, T.; Meng, F.; Duan, Y.; Frankl, A.; Bao, A.; De Maeyer, P. Comparing Bias Correction Methods Used in Downscaling Precipitation and Temperature from Regional Climate Models: A Case Study from the Kaidu River Basin in Western China. Water 2018, 10, 1046. [Google Scholar] [CrossRef] [Green Version]
  31. Wu, Y.; Li, Y.; Zhang, L.; Guo, L.; Li, H.; Xi, B.; Wang, L.; Li, C. Assessment of Lakes Ecosystem Health Based on Objective and Subjective Weighting Combined with Fuzzy Comprehensive Evaluation. J. Lake Sci. 2017, 29, 1091–1102. (In Chinese) [Google Scholar]
  32. Chen, Q.; Chen, Y.; Wang, M.; Jiang, W.; Hou, P. Remote Sensing Comprehensive Evaluation and Change Analysis of Dongting Lake Ecosystem Quality from 2001 to 2010. J. Ecol. 2015, 35, 4347–4356. (In Chinese) [Google Scholar]
  33. Huiting, Z.; Fanhao, M.; Chula, S.; Min, L.; Mulan, W.; Hao, L.C. Spatiotemporal Change and Cause Analysis of Ecosystem Quality in Mongolian Plateau during 2001 to 2019. Chin. J. Ecol. 2022, 42, 1–14. (In Chinese) [Google Scholar]
  34. Li, M.; Weng, B.; Yan, D.; Bi, W.; Yang, Y.; Gong, X.; Wang, H. Spatiotemporal Characteristics of Surface Water Resources in the Tibetan Plateau Based on the Produce Water Coefficient Method Considering Snowmelt. Sci. Total Environ. 2022, 851, 158048. [Google Scholar] [CrossRef]
  35. Yin, C.; Luo, M.; Meng, F.; Sa, C.; Yuan, Z.; Bao, Y. Contributions of Climatic and Anthropogenic Drivers to Net Primary Productivity of Vegetation in the Mongolian Plateau. Remote Sens. 2022, 14, 3383. [Google Scholar] [CrossRef]
  36. Hu, S.; Ma, R.; Sun, Z.; Ge, M.; Zeng, L.; Huang, F.; Bu, J.; Wang, Z. Determination of the Optimal Ecological Water Conveyance Volume for Vegetation Restoration in an Arid Inland River Basin, Northwestern China. Sci. Total Environ. 2021, 788, 147775. [Google Scholar] [CrossRef]
  37. Shen, Q.; Gao, G.; Lü, Y.; Wang, S.; Jiang, X.; Fu, B. River flow is Critical for Vegetation Dynamics: Lessons from Multi-Scale Analysis in a Hyper-Arid Endorheic Basin. Sci. Total Environ. 2017, 603–604, 290–298. [Google Scholar] [CrossRef]
  38. Zhang, X.; Guan, T.; Zhou, J.; Cai, W.; Gao, N.; Du, H.; Jiang, L.; Lai, L.; Zheng, Y. Groundwater Depth and Soil Properties are Associated with Variation in Vegetation of a Desert Riparian Ecosystem in an Arid Area of China. Forests 2018, 9, 34. [Google Scholar] [CrossRef] [Green Version]
  39. Guo, E.; Wang, Y.; Wang, C.; Sun, Z.; Bao, Y.; Mandula, N.; Jirigala, B.; Bao, Y.; Li, H. NDVI Indicates Long-Term Dynamics of Vegetation and its Driving Forces from Climatic and Anthropogenic Factors in Mongolian Plateau. Remote Sens. 2021, 13, 688. [Google Scholar] [CrossRef]
  40. Luo, M.; Meng, F.; Sa, C.; Duan, Y.; Bao, Y.; Liu, T.; De Maeyer, P. Response of Vegetation Phenology to Soil Moisture Dynamics in the Mongolian Plateau. Catena 2021, 206, 105505. [Google Scholar] [CrossRef]
  41. Chen, B.; Zhang, X.; Tao, J.; Wu, J.; Wang, J.; Shi, P.; Yangjian. The Impact of Climate Change and Anthropogenic Activities on Alpine Grassland Over the Qinghai-Tibet Plateau. Agric. For. Meteorol. 2014, 189, 11–18. [Google Scholar] [CrossRef]
  42. Yang, Y.; Wang, Z.; Li, J.; Gang, C.; Zhang, Y.; Zhang, Y.; Odeh, I.; Qi, J. Comparative Assessment of Grassland Degradation Dynamics in Response to Climate Variation and Human Activities in China, Mongolia, Pakistan and Uzbekistan from 2000 to 2013. J. Arid. Environ. 2016, 135, 164–172. [Google Scholar] [CrossRef]
  43. Ouyang, X.; Wang, J.; Chen, X.; Zhao, X.; Ye, H.; Watson, A.E.; Wang, S. Applying a Projection Pursuit Model for Evaluation of Ecological Quality in Jiangxi Province, China. Ecol. Indic. 2021, 133, 108414. [Google Scholar] [CrossRef]
  44. Wang, J.; Brown, D.G.; Chen, J. Drivers of the Dynamics in Net Primary Productivity Across Ecological Zones on the Mongolian Plateau. Landsc. Ecol. 2013, 28, 725–739. [Google Scholar] [CrossRef]
  45. Miao, L.; Sun, Z.; Ren, Y.; Schierhorn, F.; Müller, D. Grassland Greening on the Mongolian Plateau Despite Higher Grazing Intensity. Land Degrad. Dev. 2021, 32, 792–802. [Google Scholar] [CrossRef]
Figure 1. Overview map of (a) geographic location, (b) elevation, (c) land use/cover, and (d) subbasin delineation of the URB.
Remotesensing 15 01785 g001
Figure 2. Comparison of SWAT model simulation results and measured discharged (a), MODIS snow cover (b), and evapotranspiration (c) in the URB.
Remotesensing 15 01785 g002
Figure 3. Characteristics of interannual variation in the URB’s hydrological process factors from 2001 to 2019: (a) precipitation, (b) ET, (c) surface runoff, (d) lateral flow, (e) groundwater recharge, and (f) snowmelt.
Remotesensing 15 01785 g003
Figure 4. Spatial distribution and change rate of the URB’s hydrological process factors, 2001–2019: (a) precipitation, (b) ET, (c) runoff depth, (d) lateral flow, (e) groundwater recharge, and (f) snowmelt.
Remotesensing 15 01785 g004
Figure 5. Interannual variation of the URB’s EPI, ESI, and EBCI from 2001 to 2019 (a); the spatial distribution of EPI level (b); the spatial distribution of ESI level (c); and the spatial distribution of EBCI level (d).
Remotesensing 15 01785 g005
Figure 6. Ecosystem quality levels (a) and its area proportion in different river segments (b) in the URB from 2001 to 2019.
Remotesensing 15 01785 g006
Figure 7. Interannual trends (a) and spatial distribution (b) of ecological quality in the URB from 2001 to 2019.
Remotesensing 15 01785 g007
Figure 8. Synergy of hydrological process factors and EQ in URB (a), the most synergistic hydrological process factors (b), spatial distribution of average synergy between hydrological process factors and EQ in subbasins (c), and synergy between hydrological process factors and EQ system in different river sections (d).
Remotesensing 15 01785 g008
Figure 9. Synergy relationships between the URB’s hydrological process factors and EQ: (a) precipitation, (b) ET, (c) runoff depth, (d) lateral flow, (e) groundwater recharge, and (f) snowmelt.
Remotesensing 15 01785 g009
Figure 10. Spatial distribution of the URB’s strongest synergistic hydrological process factors for EQ changes.
Remotesensing 15 01785 g010
Figure 11. Interannual synergistic relationship between hydrological process factors and EQ.
Remotesensing 15 01785 g011
Figure 12. Economic indicators (a) and population (b) of the URB.
Remotesensing 15 01785 g012
Figure 13. Land-use/cover net change in the URB in different periods: (a) 2000–2005, (b) 2005–2010, (c) 2010–2015, and (d) 2015–2020.
Remotesensing 15 01785 g013
Table 1. Introduction to basic data sources.
UsageData NameData TypeResolutionSource
For building SWAT modelASTER DEMRaster30 mNASA (http://www.nasa.gov (accessed on 15 February 2020))
Soil typesRaster1 kmHWSD (http://westdc.westgis.ac.cn/data/ (accessed on 15 February 2020))
Land-use/coverRaster1 kmEnvironmental Resources and Data Center of Chinese Academy of Sciences (http://www.resdc.cn (accessed on 15 February 2020))
MeteorologyStationDaily scaleChina Weather Data Network (http://data.cma.cn (accessed on 15 May 2021))
Measured runoffStationDaily scaleHydrological Yearbook of Inner Mongolia Autonomous Region
Snow coverRaster500 m/8 daysMODIS MOD10A1
ETRaster500 m/8 daysMODIS MOD16A2
For evaluating ecosystem qualityGPPRaster500 m/8 daysMODIS MOD17A2
NDVIRaster1 km/30 daysMODIS MOD13A3
LAIRaster500 m/8 daysMODIS MOD15A2
LCTRaster500 m/yearMODIS MCD12Q1 (https://lpdaacsvc.cr.usgs.gov/appeears/ (accessed on 15 May 2021))
Population DensityRaster1 kmDemographic Data Network (https://www.worldpop.org/ (accessed on 25 May 2021))
Disclaimer/Publisher’s Note: The statements, opinions and data contained in all publications are solely those of the individual author(s) and contributor(s) and not of MDPI and/or the editor(s). MDPI and/or the editor(s) disclaim responsibility for any injury to people or property resulting from any ideas, methods, instructions or products referred to in the content.

