Article

Accuracy Assessment and Validation of Multi-Source CHIRPS Precipitation Estimates for Water Resource Management in the Barada Basin, Syria

1
Department of Transport Infrastructure and Water Resources Engineering, Széchenyi István University, 9026 Győr, Hungary
2
Higher Institute of Regional Planning, Damascus University, Damascus P.O. Box 30621, Syria
3
James Watt School of Engineering, University Glasgow, Glasgow G12 8QQ, UK
4
The National Water and Energy Center, United Arab Emirates University, Al Ain P.O. Box 15551, United Arab Emirates
5
School of Interdisciplinary Studies, University of Glasgow, Dumfries DG1 4ZL, UK
*
Author to whom correspondence should be addressed.
Remote Sens. 2023, 15(7), 1778; https://doi.org/10.3390/rs15071778
Submission received: 27 February 2023 / Revised: 22 March 2023 / Accepted: 24 March 2023 / Published: 27 March 2023

Abstract

:
The lack of sufficient precipitation data has been a common problem for water resource planning in many arid and semi-arid regions with sparse and limited weather monitoring networks. Satellite-based precipitation products are often used in these regions to improve data availability. This research presents the first validation study in Syria for Climate Hazards Group InfraRed Precipitation with Stations (CHIRPS) estimates using in-situ precipitation data. The validation was performed using accuracy and categorical statistics in the semi-arid Barada Basin, Syria, between 2000 and 2020. Multiple temporal scales (daily, pentad, monthly, seasonally, and annual) were utilized to investigate the accuracy of CHIRPS estimates. The CHIRPS results indicated advantages and disadvantages. The main promising result was achieved at the seasonal scale. Implementing CHIRPS for seasonal drought was proven to be suitable for the Barada Basin. Low bias (PBwinter = 2.1%, PBwet season = 12.7%), high correlation (rwet season = 0.79), and small error (ME = 4.25 mm/winter) support the implementation of CHIRPS in winter and wet seasons for seasonal drought monitoring. However, it was observed that CHIRPS exhibited poor performance (inland pentads) in reproducing precipitation amounts at finer temporal scales (pentad and daily). Underestimation of precipitation event amounts was evident in all accuracy statistics results, and the magnitude of error was higher with more intense events. CHIRPS results better corresponded in wet months than dry months. Additionally, the results showed that CHIRPS had poor detection skill in drylands; on average, only 20% of all in-situ precipitation events were correctly detected by CHIRPS with no effect of topography found on detection skill performance. This research could be valuable for decision-makers in dryland regions (as well as the Barada Basin) for water resource planning and drought early warning systems using CHIRPS.

1. Introduction

Precipitation plays an essential role in the hydrological cycle [1]. Improving precipitation measurement methods is crucial in a wide range of climatology-dependent studies, such as drought monitoring, flood forecasting, and water resource management [2,3,4,5]. Precipitation data are typically obtained from in-situ gauges, earth observations, and the output of atmospheric model simulations. Among them, in-situ measurements are the most reliable source of precipitation data; however, obtaining a consistent set of measurements from in-situ data is challenging, especially in developing countries [6]. In-situ gauges that collect precipitation data in developing countries are often limited. They lack spatial coverage and may comprise a heterogeneous mix of technologies, precision, and operational expertise, resulting in a high percentage of missing or inaccurate data. Gauges may have been recently installed, yielding a limited recorded history that would be unsuitable for reliable climate analysis.
In Syria, located in the eastern part of the Mediterranean Sea Basin, climate change is more intense, similar to other countries in the Mediterranean region [7]. Changes in climate characteristics have affected precipitation patterns by increasing variability over the last decades [8], causing the region to become more vulnerable to drought events. In addition, the threat of drought is expected to rise dramatically over the next two decades [9]. The Barada Basin, located in the southwestern part of Syria, has two climate zones: a hot semi-arid climate with an average annual precipitation of less than 250 mm and a cold semi-arid climate with an average annual rainfall amount of 450 to 800 mm [10,11]. Precipitation is the primary source of recharge of the groundwater aquifers that are the main water supply for all life activities in the basin [12]. Therefore, reliable and consistent precipitation measurements are critical for drought management and water resource planning in the basin. Collecting precipitation measurements in the basin is limited, and the number of active gauges has considerably declined as a result of the Syrian war [13]. Therefore, satellite-based estimates may provide a reliable alternative with a variety of temporal resolutions and global coverage in regions where rainfall information is scarce and inadequate [2,14,15]. However, these indirect estimates have several limitations, e.g., uncertainties in the relationship between the physical variables measured by the satellite (e.g., cold cloud duration and potential amount of rainfall) and precipitation estimates [16,17].
The algorithms used to generate estimates are divided into two categories: (1) utilizing thermal infrared bands (TIR) based on cloud-top temperature, and (2) utilizing passive microwave (PM)-based sensors [18]. In the TIR algorithm, the cold cloud duration (CCD) parameter is used to predict rainfall by assuming a linear correlation between CCD duration and rainfall potential [19,20]. The PM technique uses sensors to detect radiation from cloud cover and provide information on the cloud’s internal properties [21]. Both methods have advantages and disadvantages in estimating rainfall. For example, the PM technique is better in estimating short term rainfall over a specific location compared to TIR, while TIR outperforms PM in estimating rainfall over longer periods of time [22]. To overcome these limitations, both techniques have been combined with other sources [23], such as ground stations and/or numerical simulations that improve the accuracy of the estimations [24,25,26]. Climate Hazards Group InfraRed Precipitation with Stations (CHIRPS) is a multi-source precipitation product [26,27]. It provides high spatial resolution and multiple temporal scales. Validation of the accuracy of CHIRPS estimates is a key step to supporting its widespread use in different applications, e.g., drought monitoring [28,29]. Numerous studies have been conducted to investigate the performance of CHIRPS. In an arid climate region in Iran, it was found that CHIRPS performed better in areas with predominantly convective rainfall (wet conditions) [30]. The results also revealed that high elevations produced better estimates than lower elevations in southern and northern low coastlands. Another study in an arid climate confirmed the successful performance of CHIRPS over a monthly time scale compared to daily or yearly scales [31]. In this study, CHIRPS again performed better under wet conditions. However, studies in humid climates have revealed different results; for example, Alejo et al. [32] found that CHIRPS performed poorly during the wet season in the Philippines, compared to the dry season where CHIRPS performed better in terms of rainfall detection.
In the Mediterranean region, previous studies agreed on the ability of CHIRPS to reproduce winter estimations with a low bias percentage [33,34]. Other studies have compared the performance of CHIRPS with additional products. In Mozambique, CHIRPS was investigated with other precipitation products (TAMSAT African Rainfall Climatology and Time-series (TARCAT) v2.0 and Famine Early Warning System NETwork (FEWS NET) Rainfall Estimate) [17]. CHIRPS estimates did better in the wet season, with an overestimation of the rainfall event frequency. In Southern China (humid climate), a study concluded that monthly CHIRPS estimations were best especially in representing the spatial distribution of rainfall variations [35].
In Egypt, four precipitation products were compared on a daily scale [36], and CHIRPS proved to be best in detecting light rainfall events (<1 mm/day), even though in general, all products had poor performance. The purpose of this research was to assess the accuracy of the CHIRPS product in estimating and detecting precipitation events. The main research questions are: (1) evaluating the accuracy of the CHIRPS product in detecting and estimating precipitation events (pentad scale), (2) evaluating the performance of CHIRPS within the hydrological year (monthly and seasonally), (3) investigating the suitability of the CHIRPS product for water resource planning (annual scale). Previously, satellite-based precipitation products have not yet been tested at the basin level over Syria; therefore, this study would be the very first. To answer the research questions, two groups of statistics were used with different scales (daily, pentad, monthly, seasonally, and annual) within two distinctive regions (inland and highland basin parts).

2. Study Area and Datasets
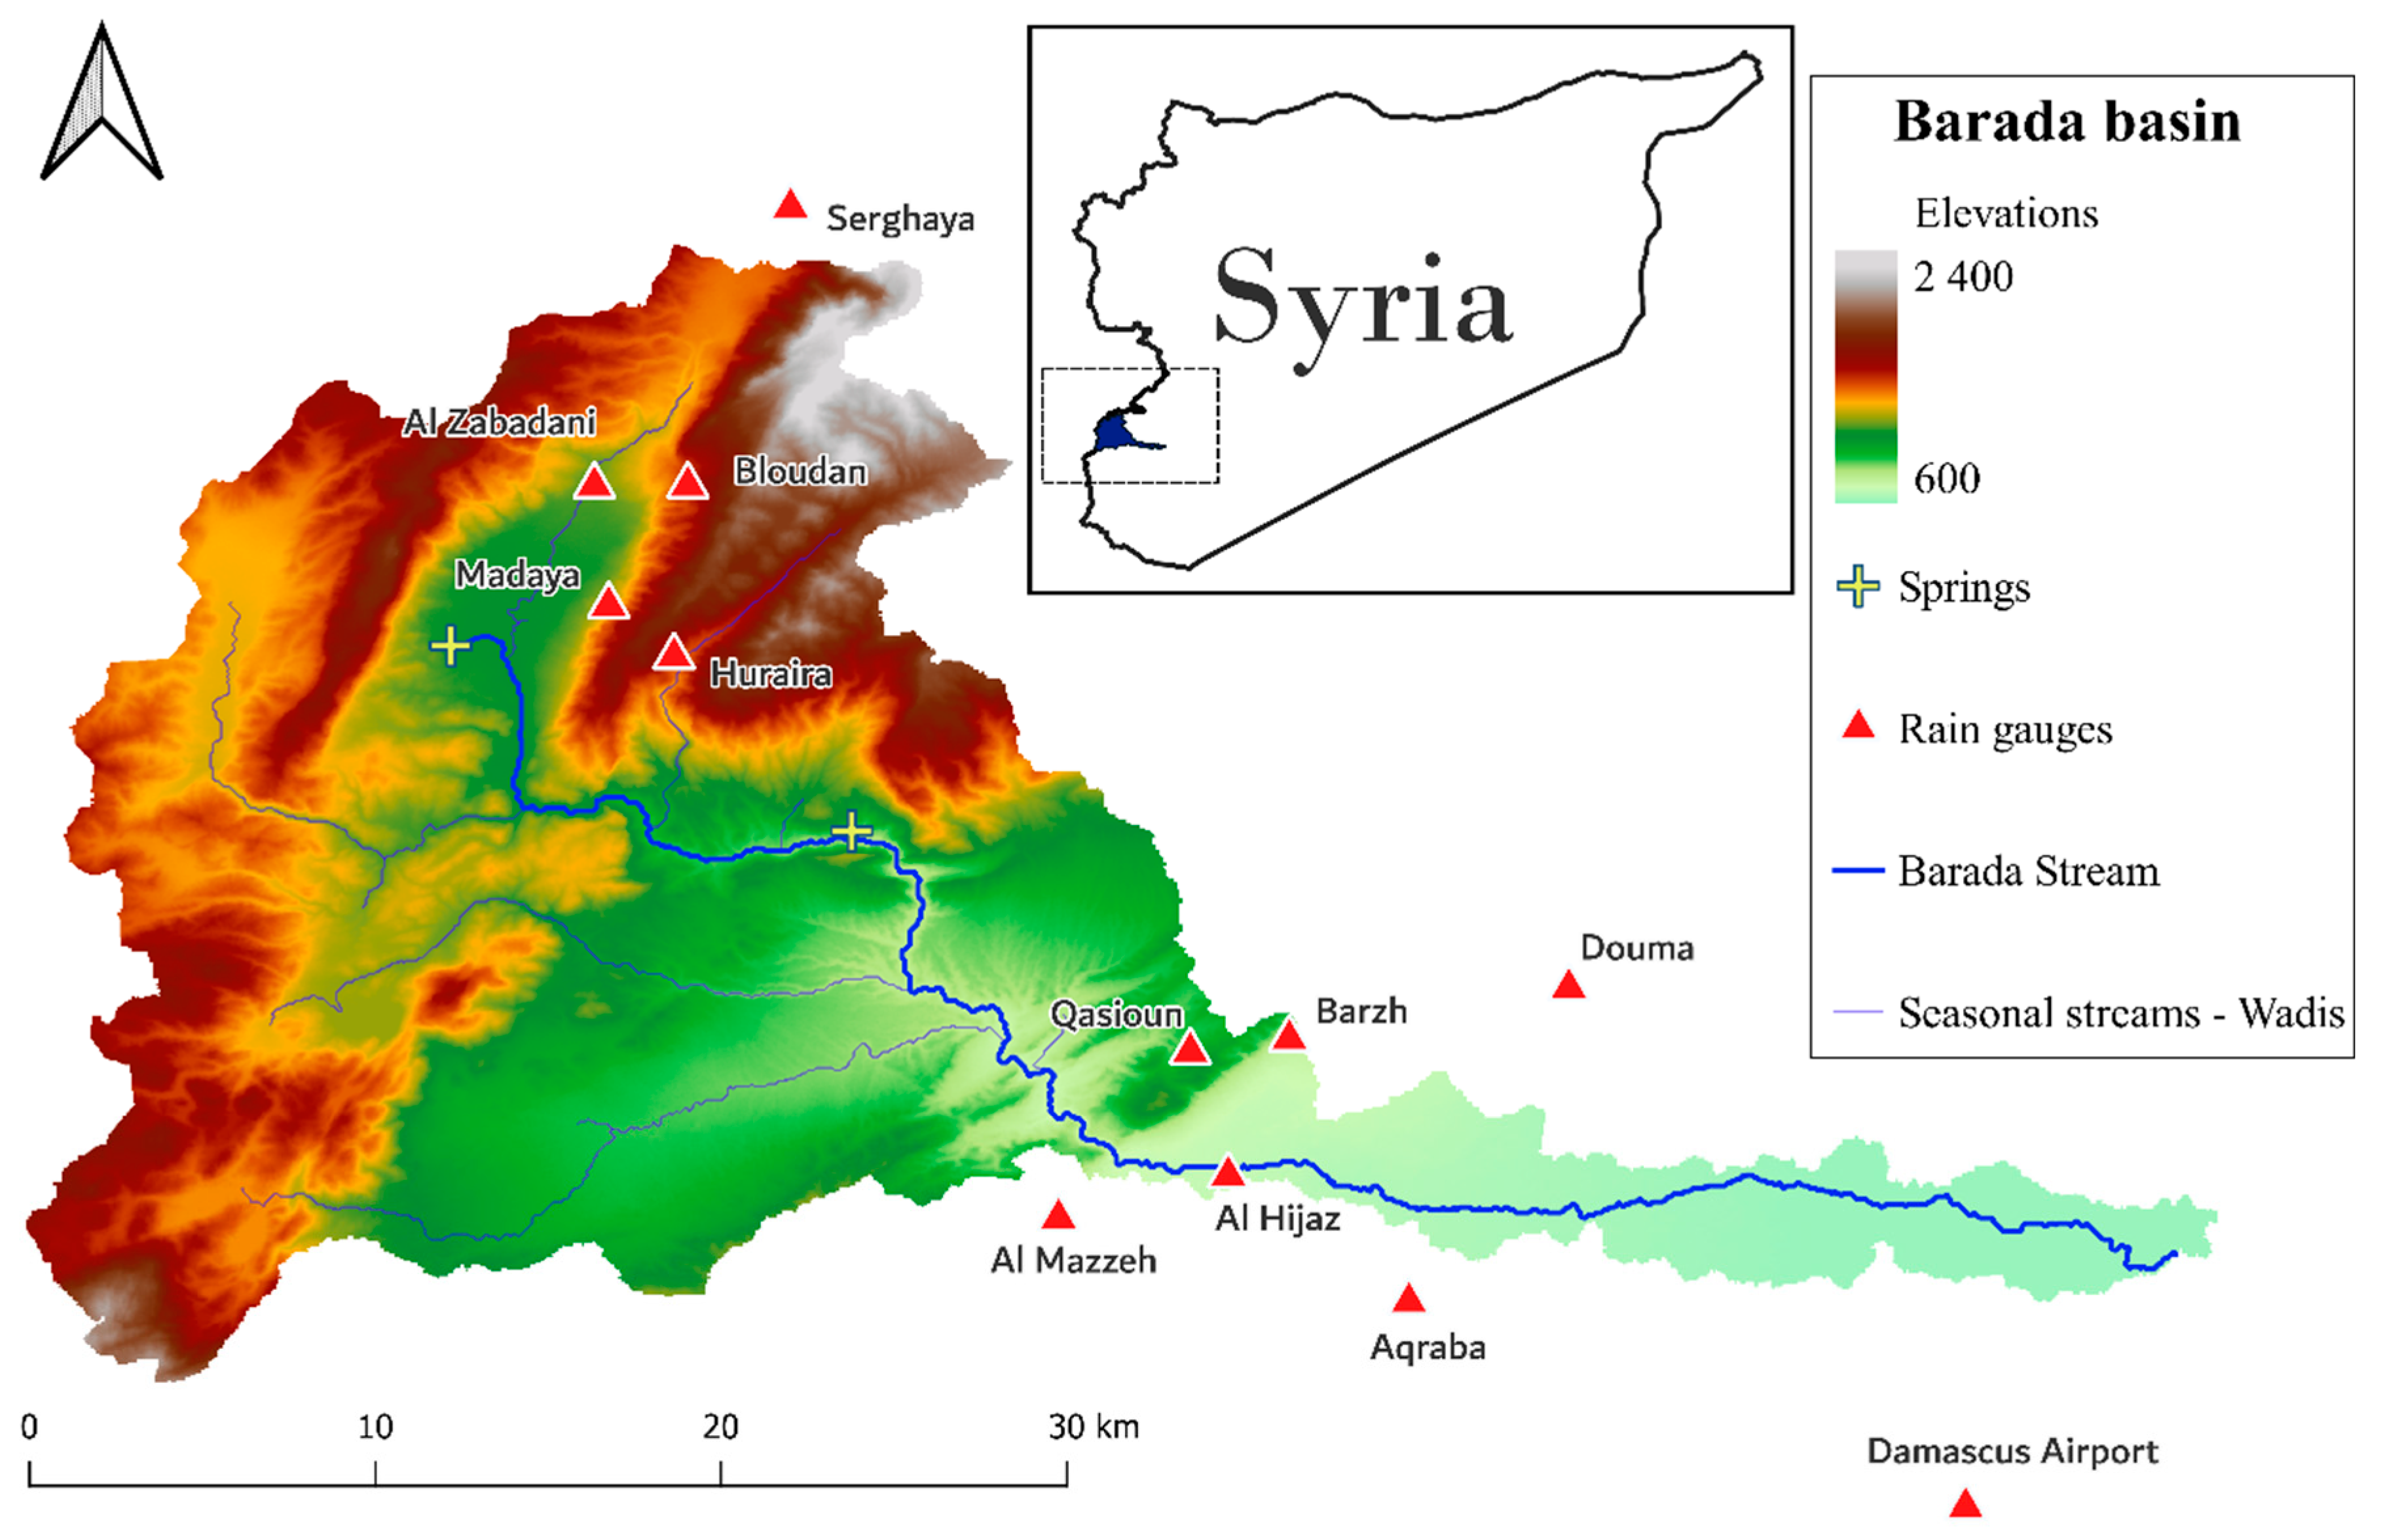
2.1. Study Area

The Barada Basin (Figure 1) is located in the southwestern part of Syria, where the capital city of Damascus is located, occupying the northwestern part of the Barada and Awaj Basin and covering an area of 1063 km2, with the landscape divided into two main parts. The Anti-Lebanon Mountains occupy the northwestern part of the basin with the highest elevation of 2814 m (Mount Hermon) [37], and the Damascus plain includes the city of Damascus and its suburbs. The elevation varies from 710 m at the foot of Qasioun Mountain to 559 m at Ateibeh Lake [38].
This specific landscape affects the precipitation behavior over the basin. Based on the Köppen-Geiger climate classification [11], the mountainous (highland) part exhibits a cold semi-arid climate. Summer is hot but cooler than summers in hot semi-arid areas, whereas winter tends to be cold to freezing with occasional snowfall. The mean annual precipitation ranges from 505 (Bloudan gauge, 1550 m) to 1500 mm and 1800 mm at the highest mountain peaks higher than 2000 m (Hermon and Sheer Mountains) [37]. A hot semi-arid climate dominates the plain area (inland part). Winter is warm to cool, and summer tends to be hot or extremely hot. Precipitation is low compared with a cold semi-arid (the highland part) climate. The main cause of this precipitation variation between the highland and inland areas is the prevailing rain shadow phenomena. Rain shadow in the basin reduces the rainfall amounts in the inland part beyond the Anti-Lebanon Mountains. The main drivers of the precipitation system are controlled by the subtropical cyclones coming from west from the Mediterranean Sea via westerlies wind movement [39,40]. Two periods can be distinguished in the hydrological year: the wet period between October and March, and the hot dry period from April to September.

2.2. Datasets

2.2.1. In-Situ Precipitation Data

In Syria, multiple government agencies are responsible for collecting rainfall measurements. In the Barada Basin, three resources were utilized to collect the rainfall measurements from 12 rain gauges (Table 1). Precipitation measurements were obtained from five rain gauges at the upstream highland part of the basin from the directory of Ain AL-Fijah (or Al-Fijah springe). The measurements extended from 2000 to 2019 with a daily accumulation of precipitation. The other seven rain gauges were located in the downstream inland part. Their measurements were collected from two sources, the ministry of water resources (daily accumulation of precipitation from 2010 to 2020) and the Harvesting project of the ministry of agriculture (monthly accumulation of precipitation from 2000 to 2010). The two resources were used to build a consistent and relatively long-term dataset from 2000 to 2019. It should be noted that daily measurements were available from the inland rain gauges only from 2010 to 2020, therefore any next analysis of daily rainfall would be within this period (2010–2020). All rain gauges had missing values, but in general, the missing ratio did not exceed 20%. In every dataset, the missing data were excluded from the analysis. Referring to Figure 1, the distribution of the rain gauges over the basin lacks adequate spatial coverage, since the gauges are concentrated between the highland and inland parts.

2.2.2. CHIRPS Precipitation Data

Climate Hazards Group InfraRed Precipitation with Stations (CHIRPS) is a quasi-global precipitation dataset with 40+ years of data from 1981 until the present. The CHIRPS dataset was created by the US Geological Survey and the Santa Barbara Climate Hazards Group at the University of California [27]. CHIRPS is a multi-source product consisting of satellite and rain gauge data. The spatial coverage extends from 50°S to 50°N and 180°E to 180°W, with a high spatial resolution (0.05°) (about 5.3 × 5.3 km2). Based on this resolution, multiple temporal series are available at each pixel, which include daily, pentad (accumulation of 5 days), dekadal (accumulation of 10 days), and monthly. CHIRPS is produced in several stages, starting with satellite thermal infrared (TIR) images and applying subsequent adjustments, as described in ref. [27] and summarized below. First, the cold cloud duration (CCD) technique is applied to TIR images globally with a threshold of 235 K to identify areas with a likelihood of being rainy areas, using the Cold Cloud Persistence (CCP) parameter. Next, a linear regression best-fit analysis is conducted for the CCD values, using the 0.25° Tropical Rain Measurement Mission (TRMM) Multi-satellite Precipitation Analysis (TMPA) 3B42 pentad precipitation archive from 2000 to 2013 to predict the coefficients of the regression model. To calculate the CHIRPS results, the values from the regression model are divided by the average precipitation estimates from 1981 to 2013 and multiplied by the same grid value as the CHPclim values [41]. The CHPclim value is a historical mean precipitation from five sources at every grid cell. CHPclim is defined as a modeling approach that combines satellite data and gridded physiographic indicators with in-situ climate normals [26], using moving window regressions and inverse distance-weighting interpolation. Following that, the observations are blended with the in-situ stations [17,41]. The blending procedure is a modified inverse distance-weighting algorithm with several unique characteristics. Data from the in-situ stations are weighted according to their performance, with national stations typically receiving higher weights than automated stations. The five stations closest to each pixel are chosen for blending [27]. The CHIRPS dataset from 2000 to 2020 was acquired from the following website (https://www.chc.ucsb.edu/data/chirps (accessed on 17 December 2022). We used the latest version of CHIRPS (CHIRPS v.2).

3. Methods

3.1. Point-to-Pixel Method

As part of the assessment, the CHIRPS precipitation estimates were compared to the measurements obtained from the 12 in-situ rain gauges by applying accuracy and categorical statistics. The point-to-pixel method was chosen to compare the time series of CHIRPS to the in-situ precipitation measurements [14,16,42]. The application of this method eliminated the uncertainty inherent in the pixel-to-pixel analysis [43], where the interpolation procedure may introduce considerable uncertainty. This was especially true since only a small number of in-situ gauges are available for the Barada Basin [44]. At each gauge location, the precipitation time series from 2000 to 2021 was extracted from the corresponding CHIRPS pixels and compared to the in-situ gauges.

3.2. Accuracy Statistics

Evaluation of CHIRPS’s accuracy was performed using a pairwise comparison of the CHIRPS and in-situ precipitation time series [16]. In this study, five accuracy statistics (Table 2) were considered in the pairwise comparison: Pearson correlation coefficient (r), Mean Error (ME), Mean Absolute Error (MAE), Root Mean Square Error (RMSE), and Percent Bias (PB), with their respective equations described in Table 2. The Pearson correlation coefficient, which ranges from −1 to 1 with a perfect score of 1, reflects the strength of the linear correlation between the estimates and measurements. ME and MAE quantify the error direction and average magnitude of that error, respectively. ME can take any negative or positive value, whereas MAE can take only positive values. The perfect score for both is 0. RMSE measures the average difference between the CHIRPS estimates and the in-situ measurements. It provides information on the accuracy of the CHIRPS estimates. It is an estimation of how well CHIRPS performed in estimating the real measurements. RMSE’s perfect value is zero and it produces only non-negative values. PB shows the average tendency of the estimated values, which can be smaller or larger than their observed values, with an ideal value of 0. Correlations are nondimensional, while PB has percentage units. ME, MAE, and RMSE values need to be close to 0 with high values of r for drought monitoring and water management planning and to minimize the overestimation and underestimation of rainfall amounts [17].

3.3. Categorical Statstics

Detecting precipitation events via satellite requires a robust method to quantify the quality of the results. The estimations must be reliable to have confidence in applying those results to water resource planning and drought/flood monitoring [17]. Therefore, the second part of the analysis was to examine the CHIRPS product’s reliability in detecting precipitation events by employing categorical statistics. A precipitation event was defined as the accumulation of daily precipitation assumed to be equal to rainfall storms that occurred during that day. Storms in semi-arid regions tend to occur briefly, are intense, and most importantly, they occur once daily; therefore, it is rare to observe multiple storms in one day. Next, the precipitation event threshold was defined to discriminate between precipitation events and non-precipitation events. Since the Barada Basin has a semi-arid climate and complex topography, the threshold was set to 0.5 mm/day. According to other researchers, thresholds were based on their specific case study climate condition, such as in ref. [30] where the 0.1 mm/month threshold was selected for semi-arid conditions in Iran. However, in this study, the climate is hot/cold semi-arid, so 0.5 mm/day was more suitable based on ref. [45]. Five categorical statistics (Table 3) were used to assess CHIRPS performance in detecting precipitation events. Calculating these statistics was based on a contingency table (see ref. [46] for more details), showing the number of estimated and measured (by both CHIRPS and in-situ gauge), not estimated but measured (detected by in-situ gauge but not CHIRPS), and estimated but not measured (detected by CHIRPS but not in-situ gauge). To evaluate the overall detection skill, Percent Correct (PC) was used. PC provides an overall view of the detection skill as it involves all the measurements during the hydrological year. The discrimination performance of the CHIRPS product was investigated by Probability Of Detection (POD). POD indicates the percentage of in-situ events that were detected correctly by CHIRPS divided by total actual in-situ events. POD can vary between 0 and 1, with 1 being the optimal value. False alarm ratio (FAR) represents the number of CHIRPS estimates that did not occur divided by the total number of CHIRPS estimates (both correct and false). The ratio can range from 0 to 1, with an optimal value of 0. The Threat Score (TS) compares correct CHIRPS estimates to total outcomes (estimated–measured, estimated–not measured, not estimated–measured). The best possible value of TS is 1.0. Since TS includes three possible outcomes, it will diverge more rapidly with the number of incorrect (estimated–not measured, not estimated–measured) outcomes. Additional categorical metrics involve a large population of estimated–measured pairs and often include the fourth outcome, where CHIRPS estimates no event and gauges measure no event [46]. The climate of the Barada Basin means the frequency of rainy days is limited during the hydrological year. Therefore, using the TS statistic was more useful than the modified version, the equitable threat score (ETS), which is more suitable for wet climates [46]. The Frequency Bias (FB) reflects the systematic differences in the precipitation events between in-situ measurements and CHIRPS estimates. Unbiased CHIRPS estimates take the value of 1.

4. Results and Discussion

4.1. Daily Scale Assessment

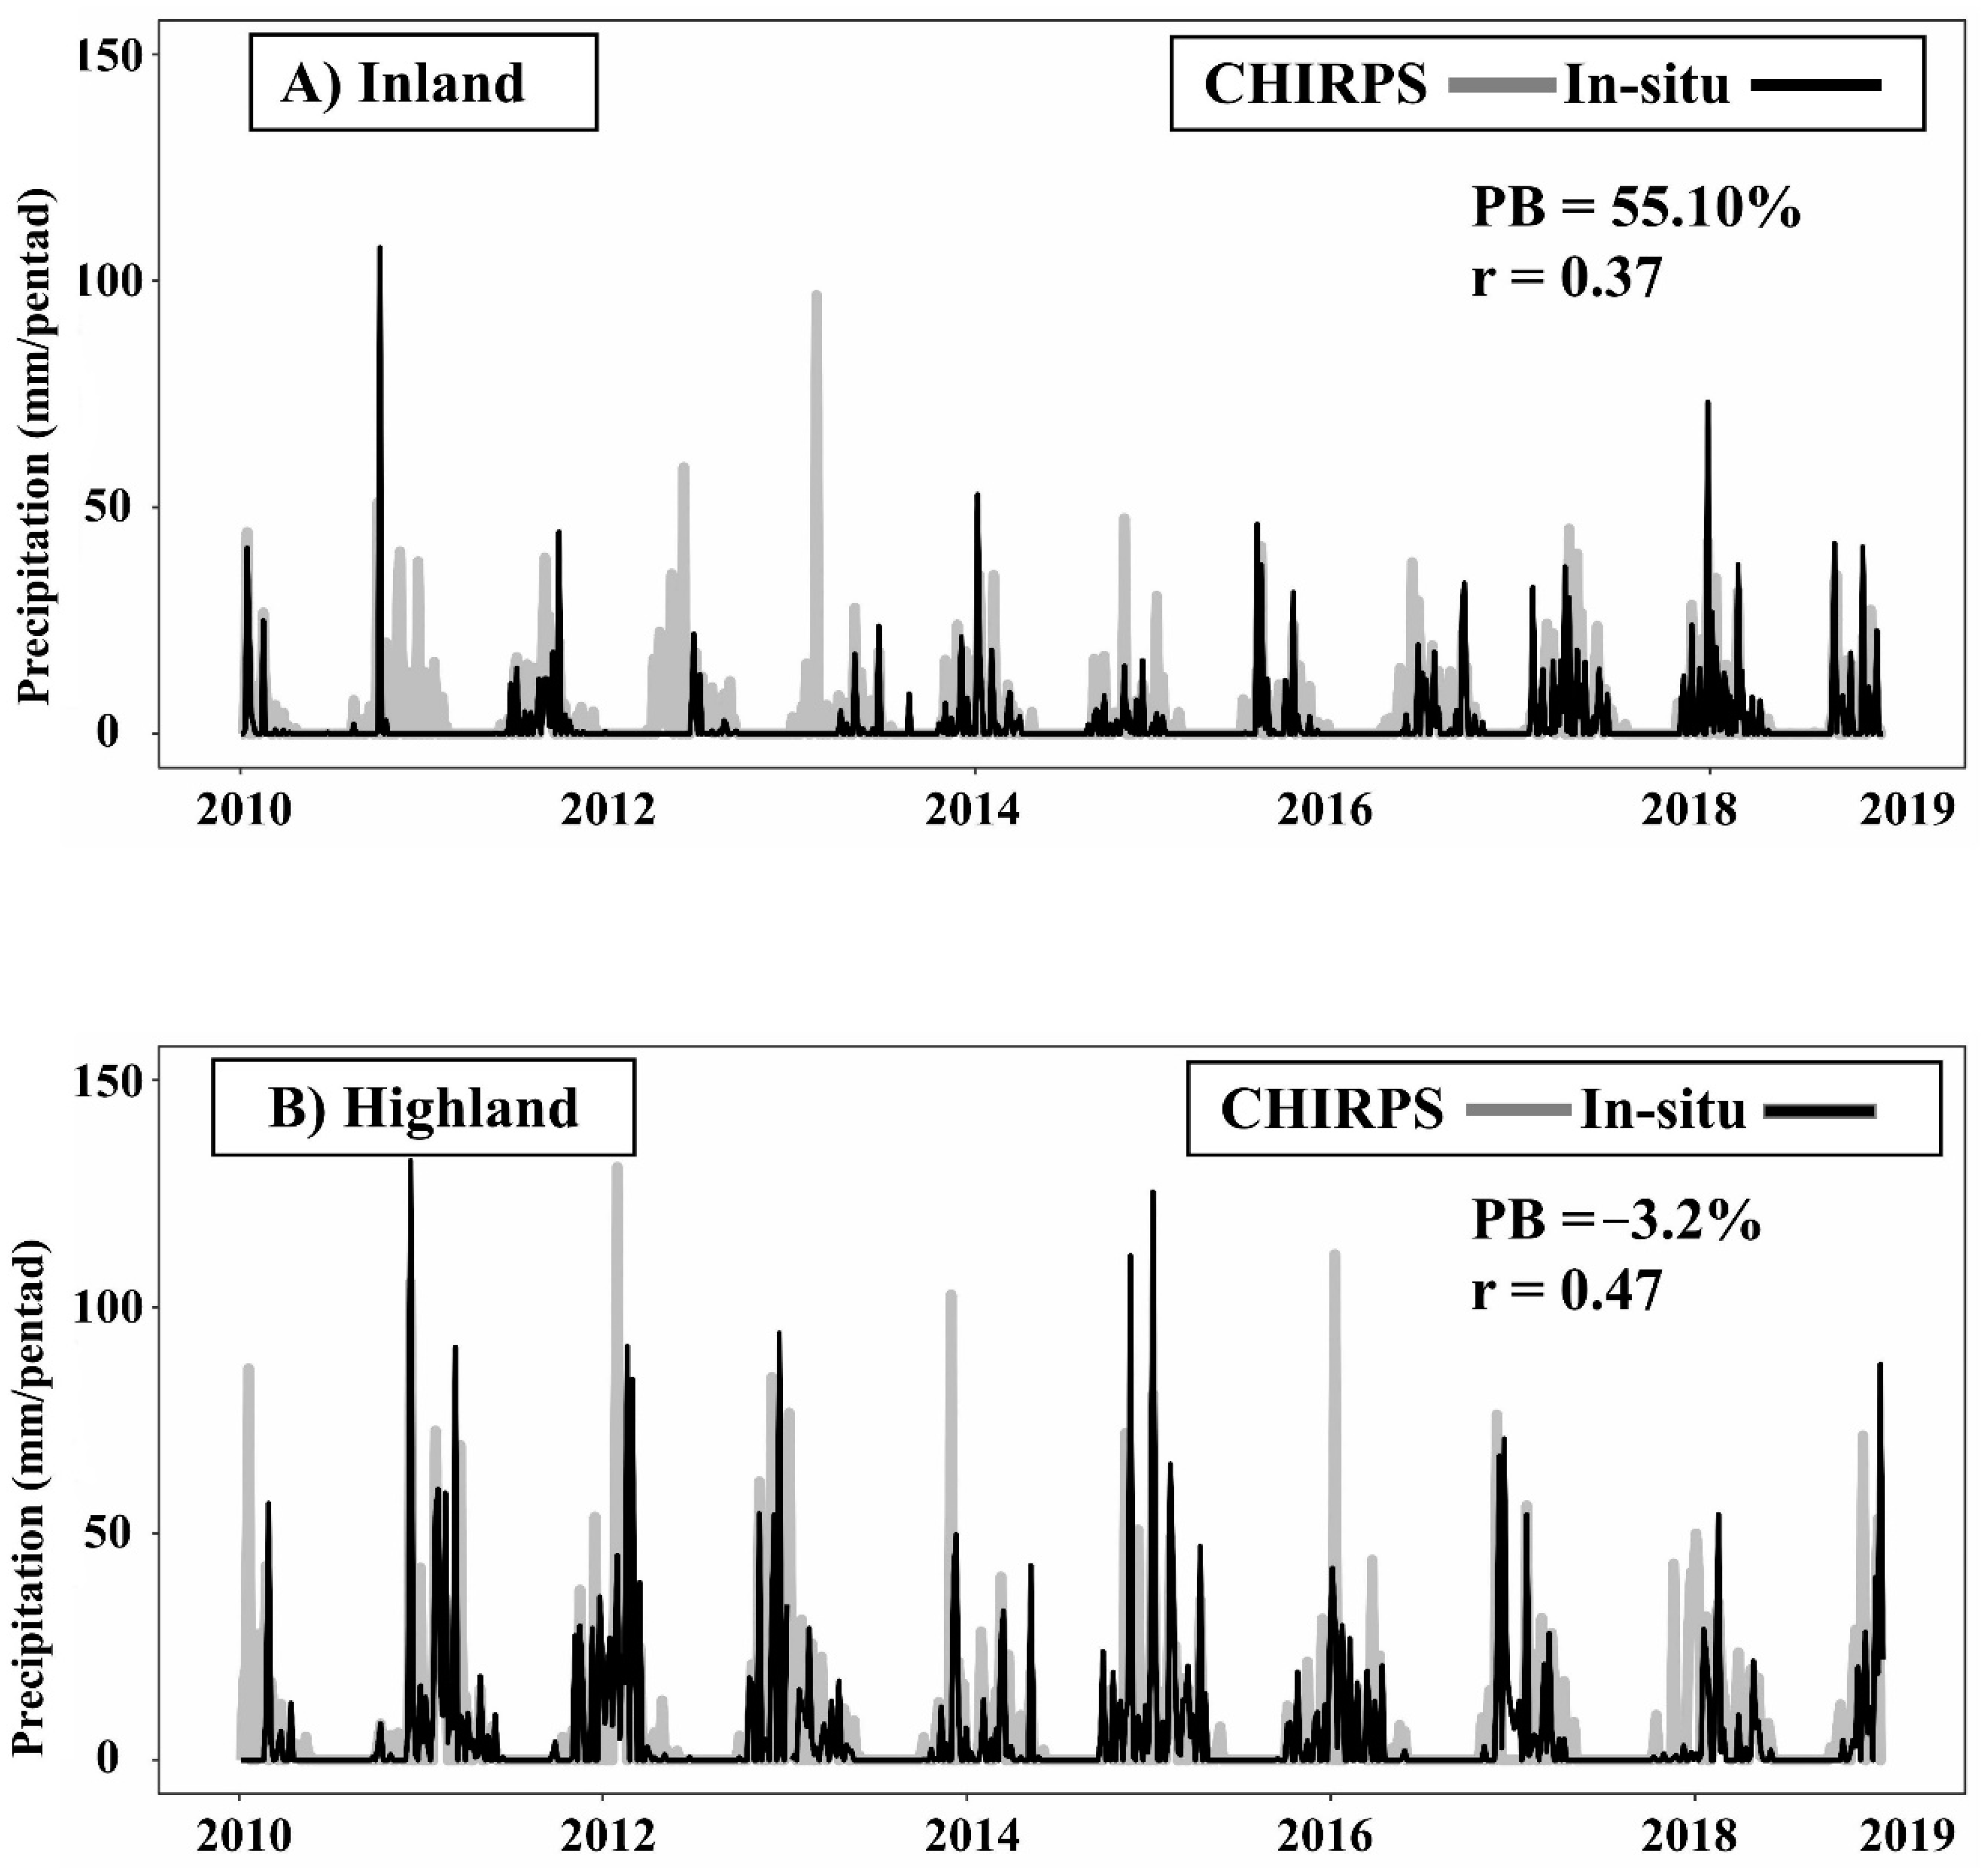
4.1.1. Daily Comparison

Daily accumulations were aggregated to 5 days of total precipitation accumulation (pentads) in both basin parts (inland and highland) to evaluate CHIRPS performance at a daily scale. This aggregation was essential to eliminate the latency issue associated with observation sampling times and the CHIRPS estimates. In addition, the pentad scale is the primary scale that the CHIRPS product uses to produce the estimates and daily estimates are only a disaggregation of the pentad’s estimates [27]. Figure 2 shows a time series comparison at the pentad scale from 2010 to 2019; given the small comparison window (9 years, 660 sample size), no clear trend was observed. For instance, inland in-situ pentads (Figure 2A) exhibited more pronounced wetter years after 2017; between 2010 and 2017, drier and wetter conditions were observed with an exceptional peak in 2011. Highland in-situ pentads (Figure 2B) were less variable; 2011 and 2015 were the wettest years. CHIRPS performed better in the highland part with higher correlation (r = 0.47) and less bias (PB = −3.2%); however, its performance was poor in the inland part with significant bias (PB = 55.10%). At the pentad scale, the CHIRPS product in the hot semi-arid region (inland) seemed unsuitable for precipitation-based studies since the high bias would produce misleading results; in the cold semi-arid region (highland), little bias was observed, which would benefit precipitation-based studies.

4.1.2. Daily Detection Skill

Detection skill was evaluated for each gauge using the daily accumulation from all rain gauges. Table 4 shows the categorical statistics results for all gauges. PC values represent the overall detection skill within the whole hydrological year, including the rainy (October to March) and dry (April-September) seasons due to the inclusion of the correct detection of zero days. As the region is located in a semi-arid (steppe) climate, most of the year is rainless, and a large percentage of zero precipitation could be expected. Accordingly, better values could be expected with this statistic compared to the other categorical statistics. Based on the PC values in Table 4, the overall detection skill of CHIRPS was high. On average, 80% of all CHIRPS estimates were correct. No effect of topography was observed; all gauges in the highlands and inland exhibited close results. Based on the BIAS (FB) results, CHIRPS tended to underestimate rain events (the frequency of rain events) more in the highland part than inland. In the inland part, there was a slight tendency to overestimate/underestimate, where this tendency (under-forecasting) was more pronounced in the highland (0.58 on average for the gauges in the highland part). Removing the correct detection of zero days is important, and the TS and POD statistics evaluated the detection accuracy of CHIRPS estimates/observed events counted. TS could be seen as a measure related to the rainy season, where rainfall events were mostly observed with corresponding estimates. TS values were poor for all gauges (on average, 13% of all observed/estimated rain events were correct), and POD values confirmed this poor performance. In the highland part, POD was 0.16 on average, which means only 16% of the observed rain events were correctly estimated. In the inland part, POD was slightly better (0.24 on average, 24% of all observed rain events were correctly estimated) but still poor in general (perfect value of POD is 1). POD represents the accuracy of detection in the winter or coldest months due to the exclusion of false alarms. False alarms were more dominant in transition months such as October and April. In spring, increasing temperature could be misleading by inferring the clouds as rainy. This period of the hydrological year (transition months) exhibited more stochastic cells of convective clouds (dominant especially in the subtropics) that, in most cases, were not raining. Spring in steppe climates features warmer temperatures than fall; therefore, more false alarms could be expected. The false alarm ratio (FAR) followed the same pattern as other statistics. The result was close, and no distinction could be observed between the two parts of the basin (the cold steppe highland and the hot steppe inland). FAR values were more related to the CHIRPS product estimates; in all gauges, more than 70% of all estimates did not occur. Investigating the CHIRPS product’s detection skill on a daily scale revealed poor performance in general. Detecting storms is a crucial skill for a good precipitation product to be used in water resource and climate-based studies such as flood forecasting.

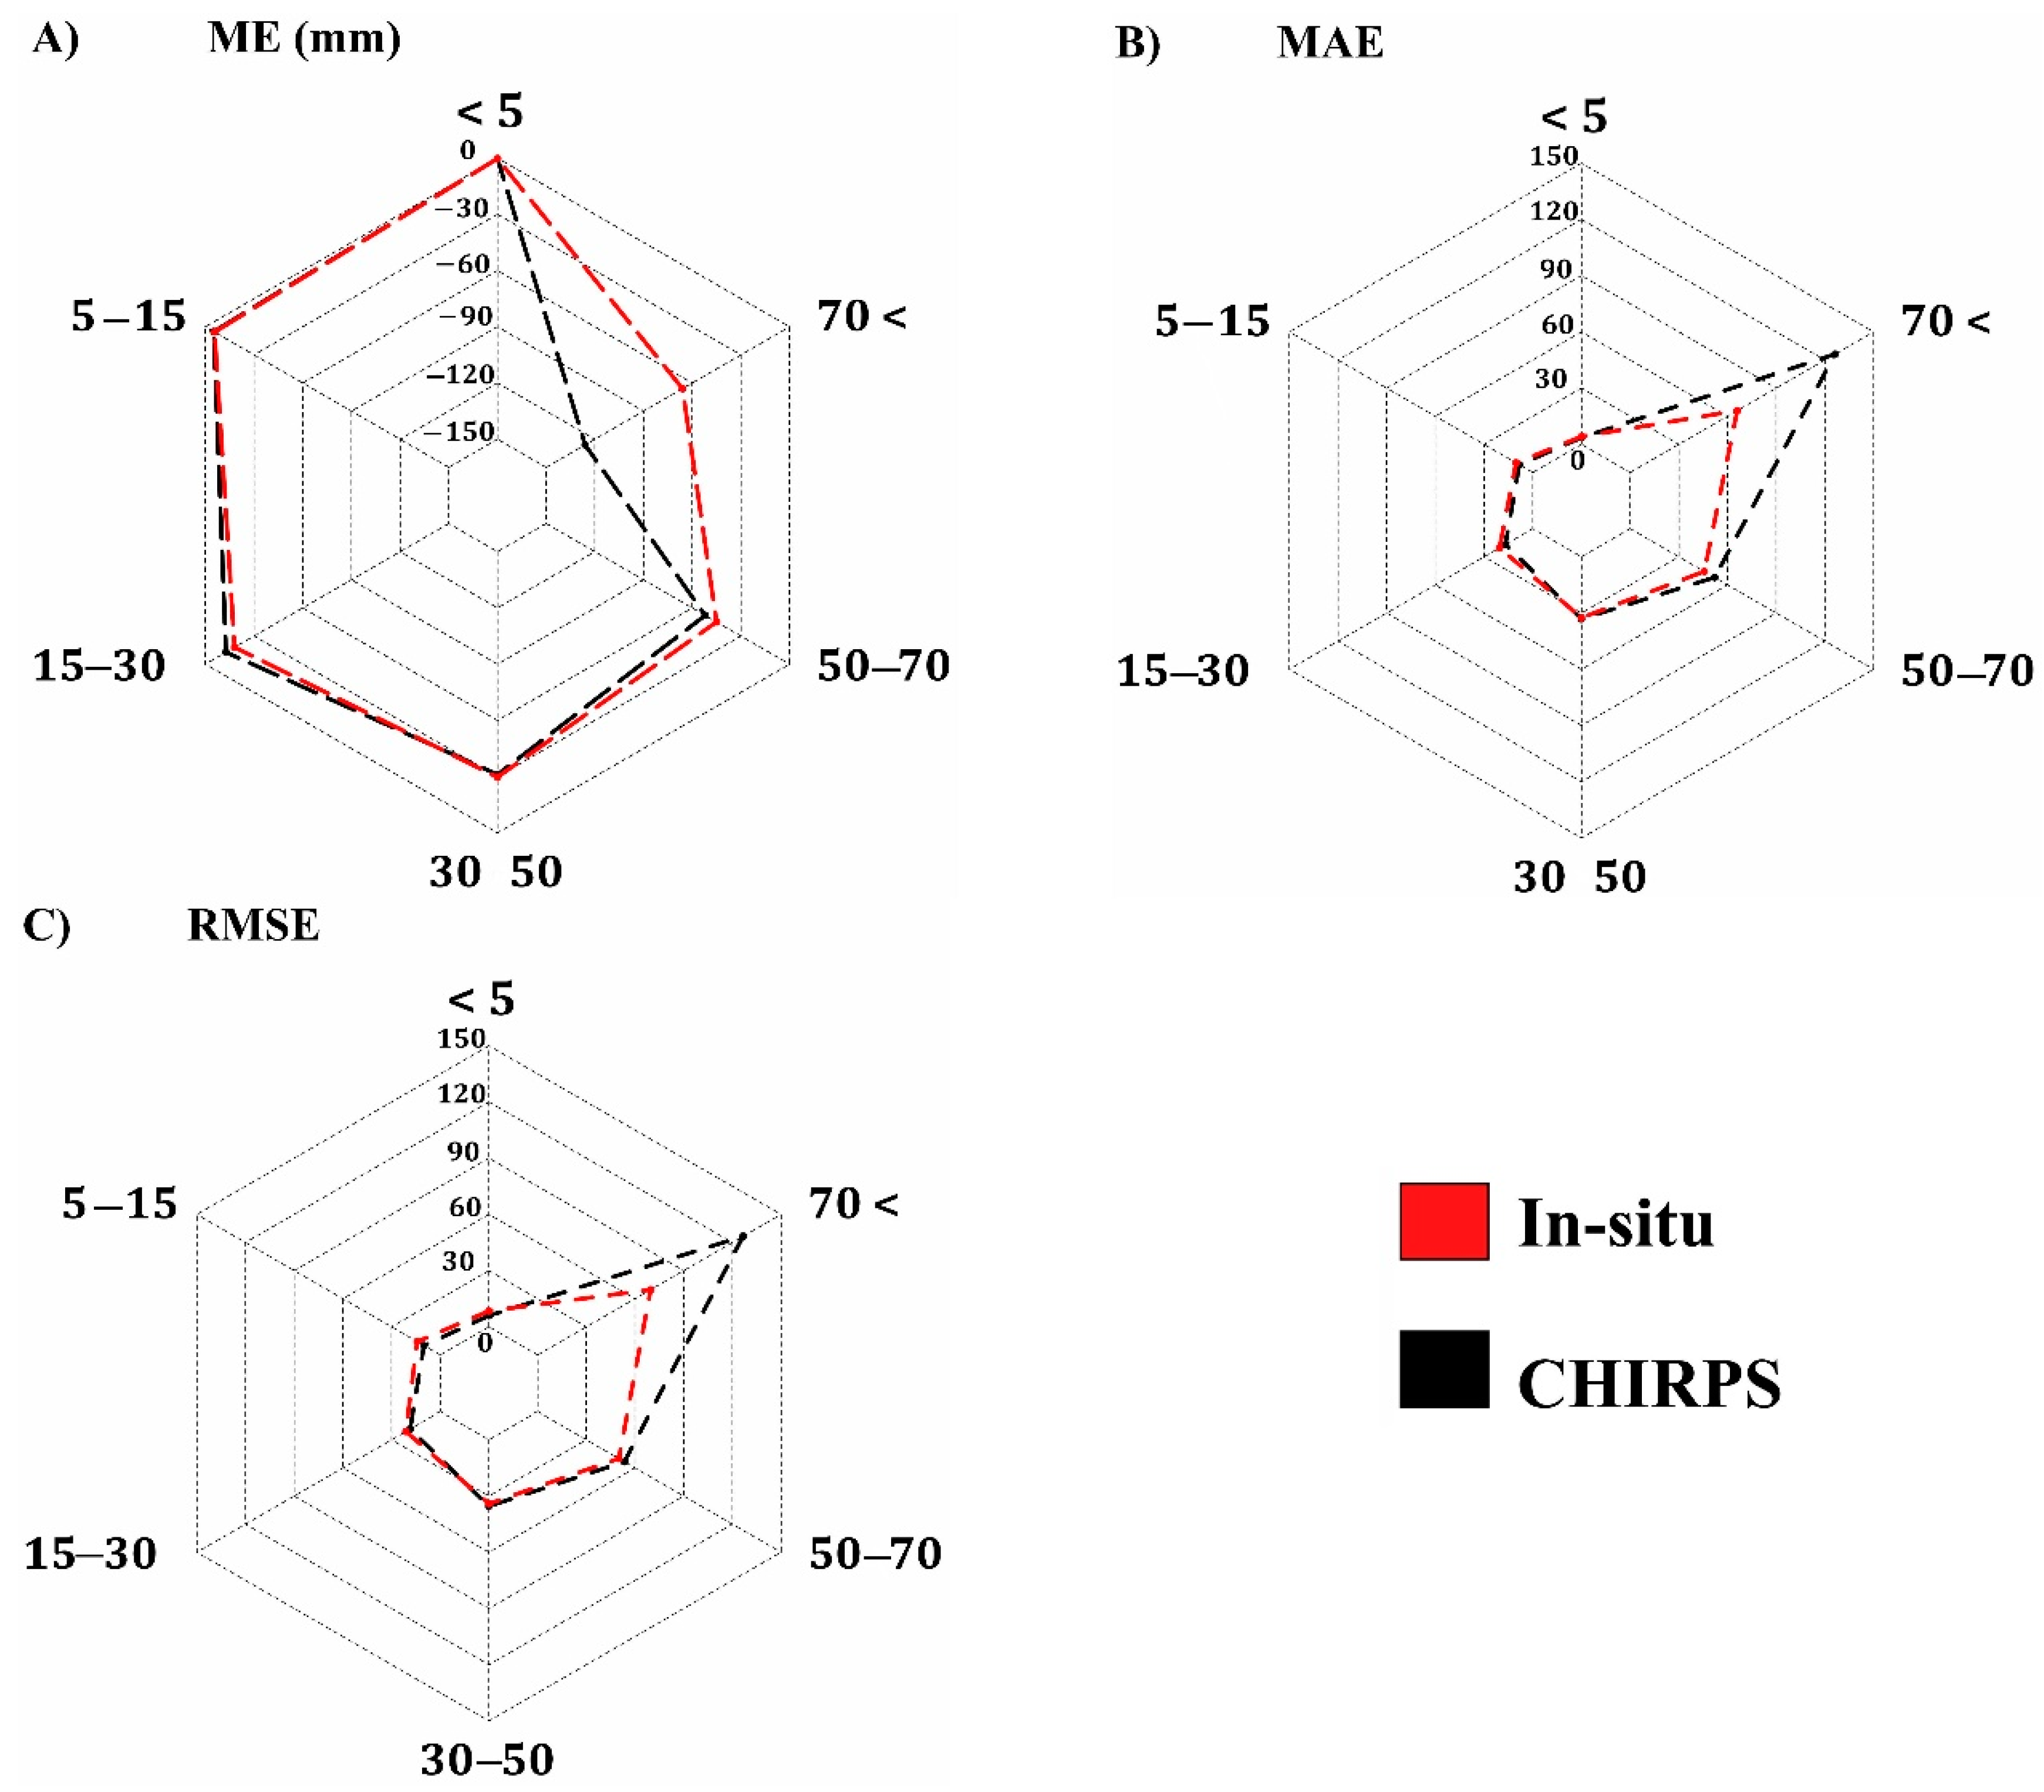
4.1.3. Daily Accuracy Skill

Precipitation events (daily accumulations) were extracted from all daily rain gauge datasets, and as a result, 2174 events occurred in the hot inland part and 4891 events occurred in the cold highland. Table 5 shows the distribution of these events based on event classification. More than 90% of the events in the inland part were less than 15 mm/day, whereas 80% of the highland events fell in the same classification (less than 15 mm/day). This situation (light storms) is typical in semi-arid climates. Most rain events are convective, and convective storms tend to be intense and brief but, in most cases, localized. CHIRPS exhibited relatively good accuracy in estimating light and small rainstorms in both parts (Figure 3A). The best accuracy was achieved with small storms (0.5–5 mm), where ME values were −0.31 and −0.28 mm for the highland and inland parts, respectively. Underestimation was the dominant characteristic of CHIRPS performance in rain event estimation, and the magnitude of this underestimation increased with higher intensity storms (Figure 3B). For instance, CHIRPS estimations of heavy storms (>70 mm) had a higher average error margin in the highland part (MAE = 126.28), while in the inland part, the average error magnitude or margin was lower (MAE = 66) but still significant. The CHIRPS product clearly had a deficit in estimating rare events that produce heavy floods. These were referred to as rare events (heavy storms, >70 mm) since they accounted for a small percentage of all events in the basin. For example, the highland part had only 9 heavy events out of 4891 rain events in the last 20 years, which accounts for only 0.1%(Table 5). The RMSE statistic (Figure 3C) results confirmed the increased estimation error with higher intensity events. Error propagation in rain event estimation could be explained by the deficit in the model used in CHIRPS to produce the moisture content in the clouds, and the model could not be tested well over steppe climates. In addition, calibrating the model with the TRMM product could produce more biased results, as the TRMM product tends to perform poorly in a semiarid climate [47,48].

4.2. Monthly Scale Assessment

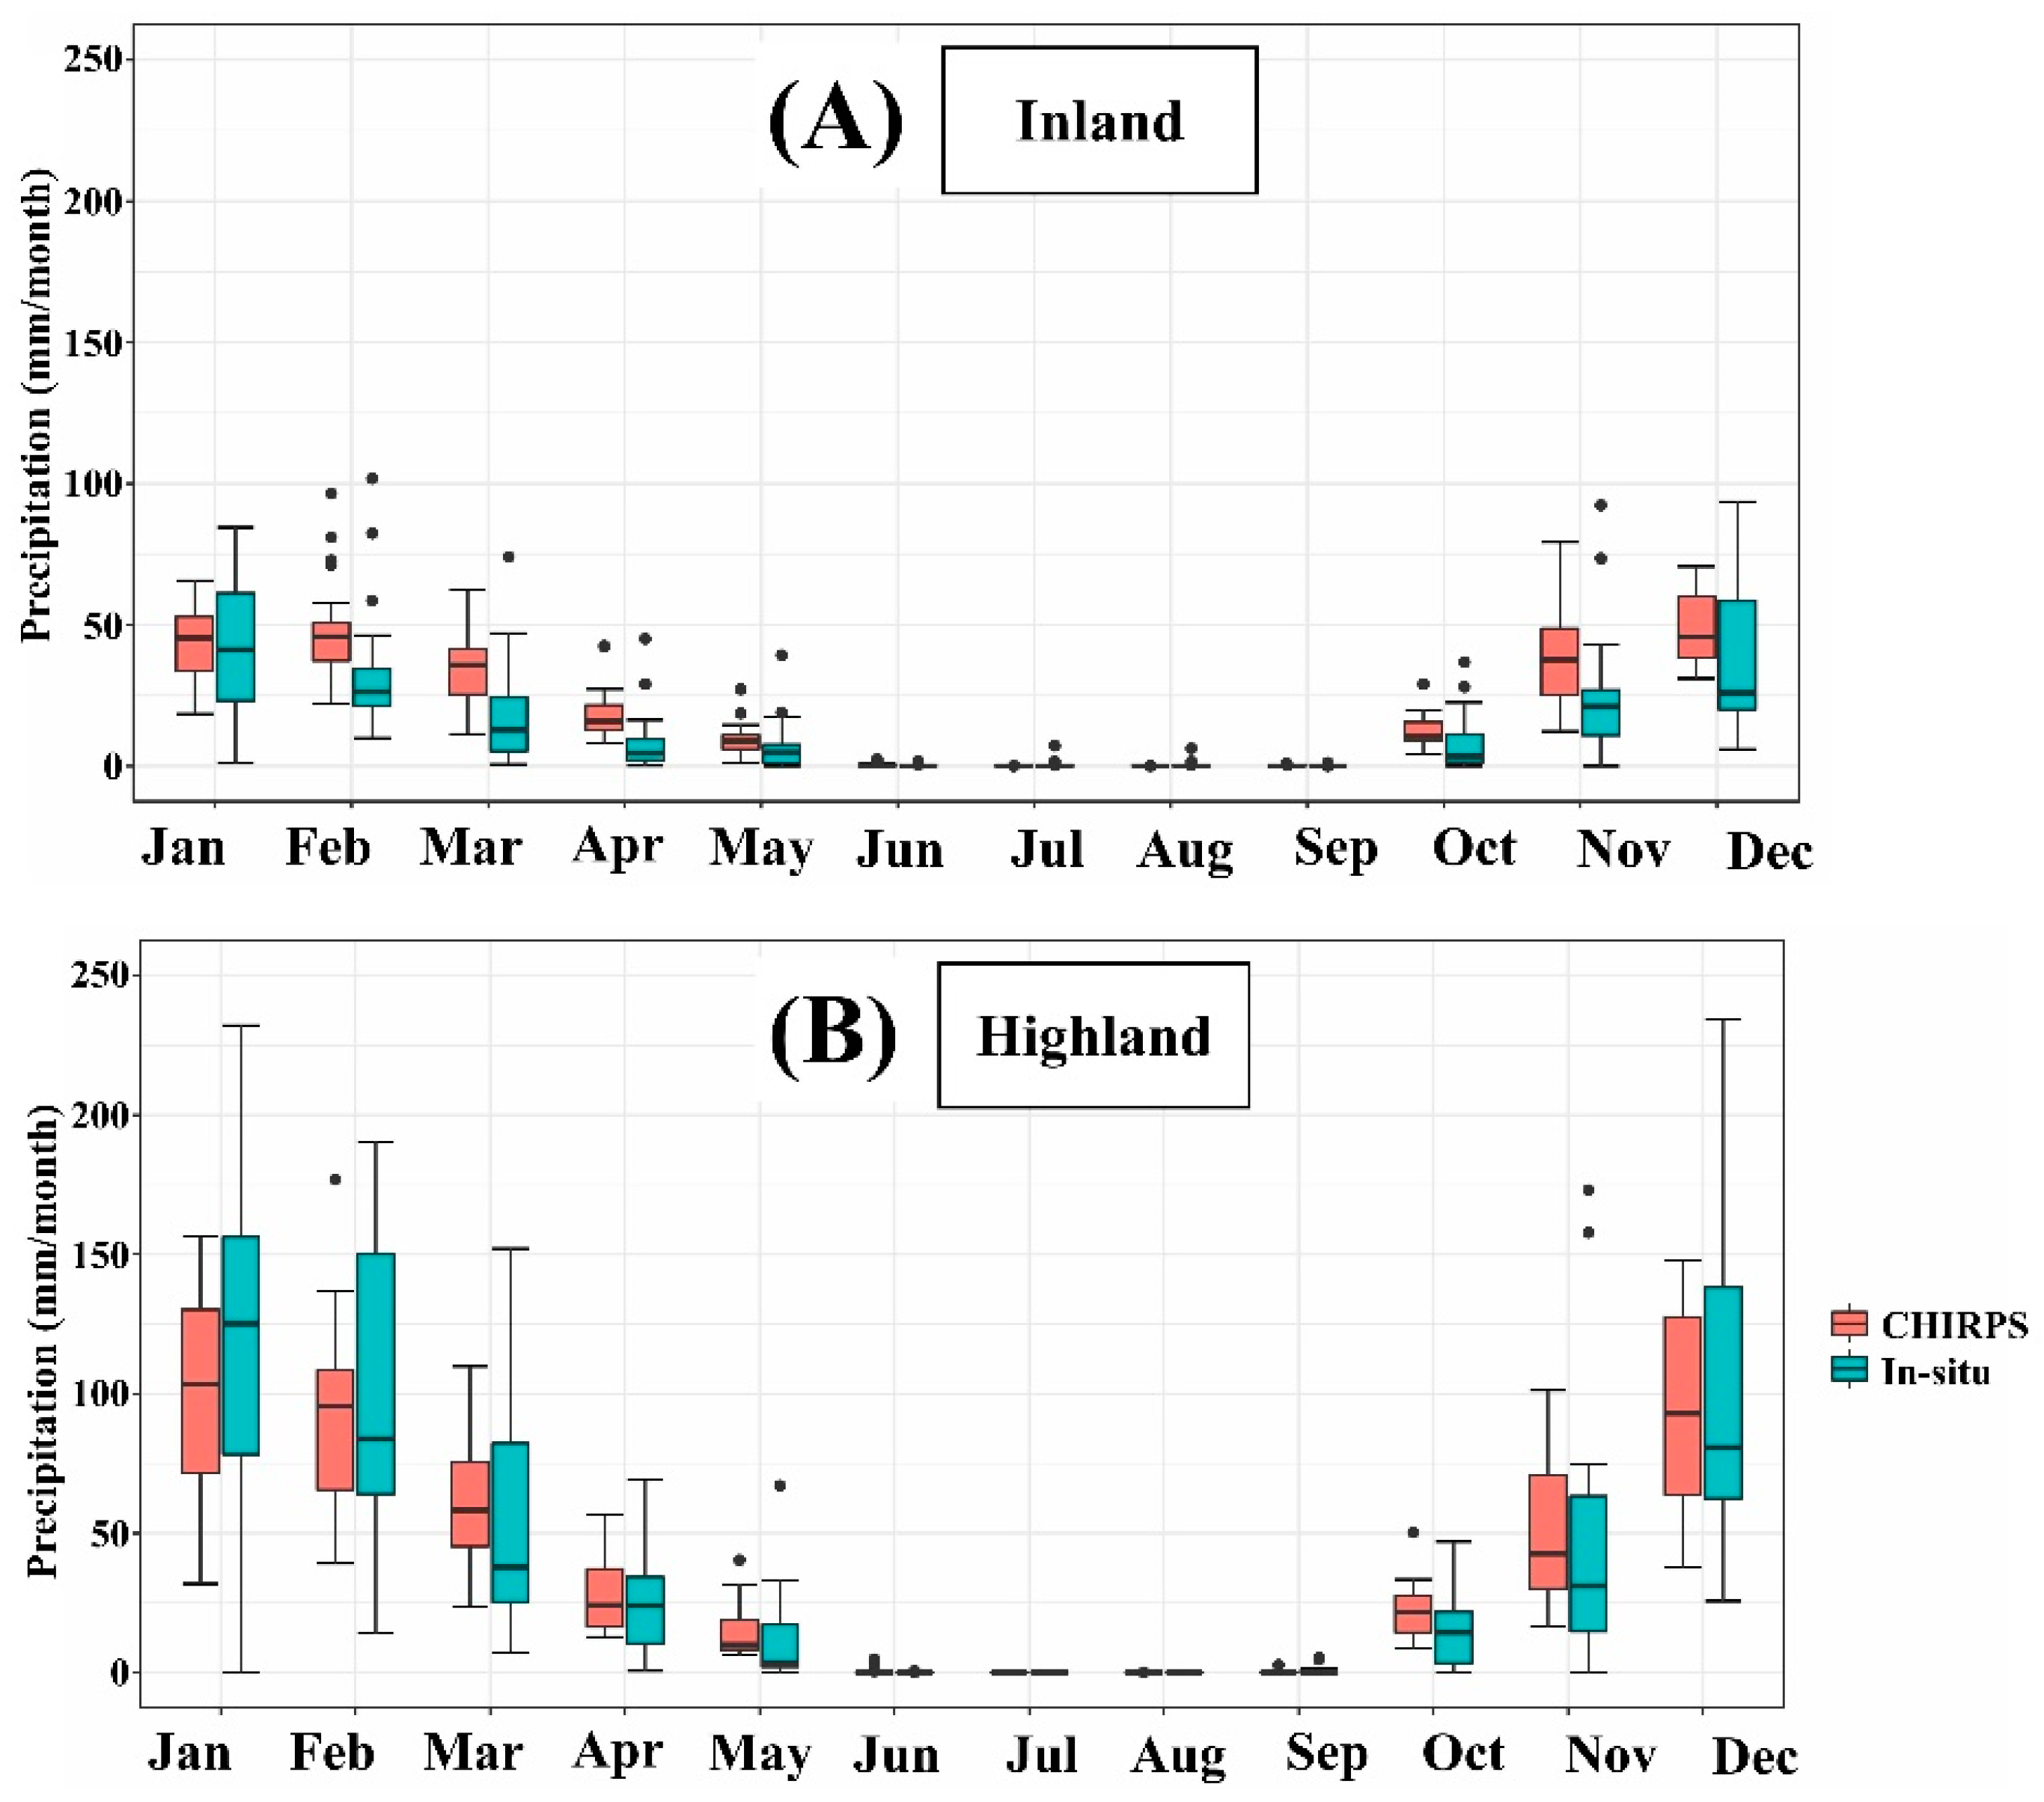
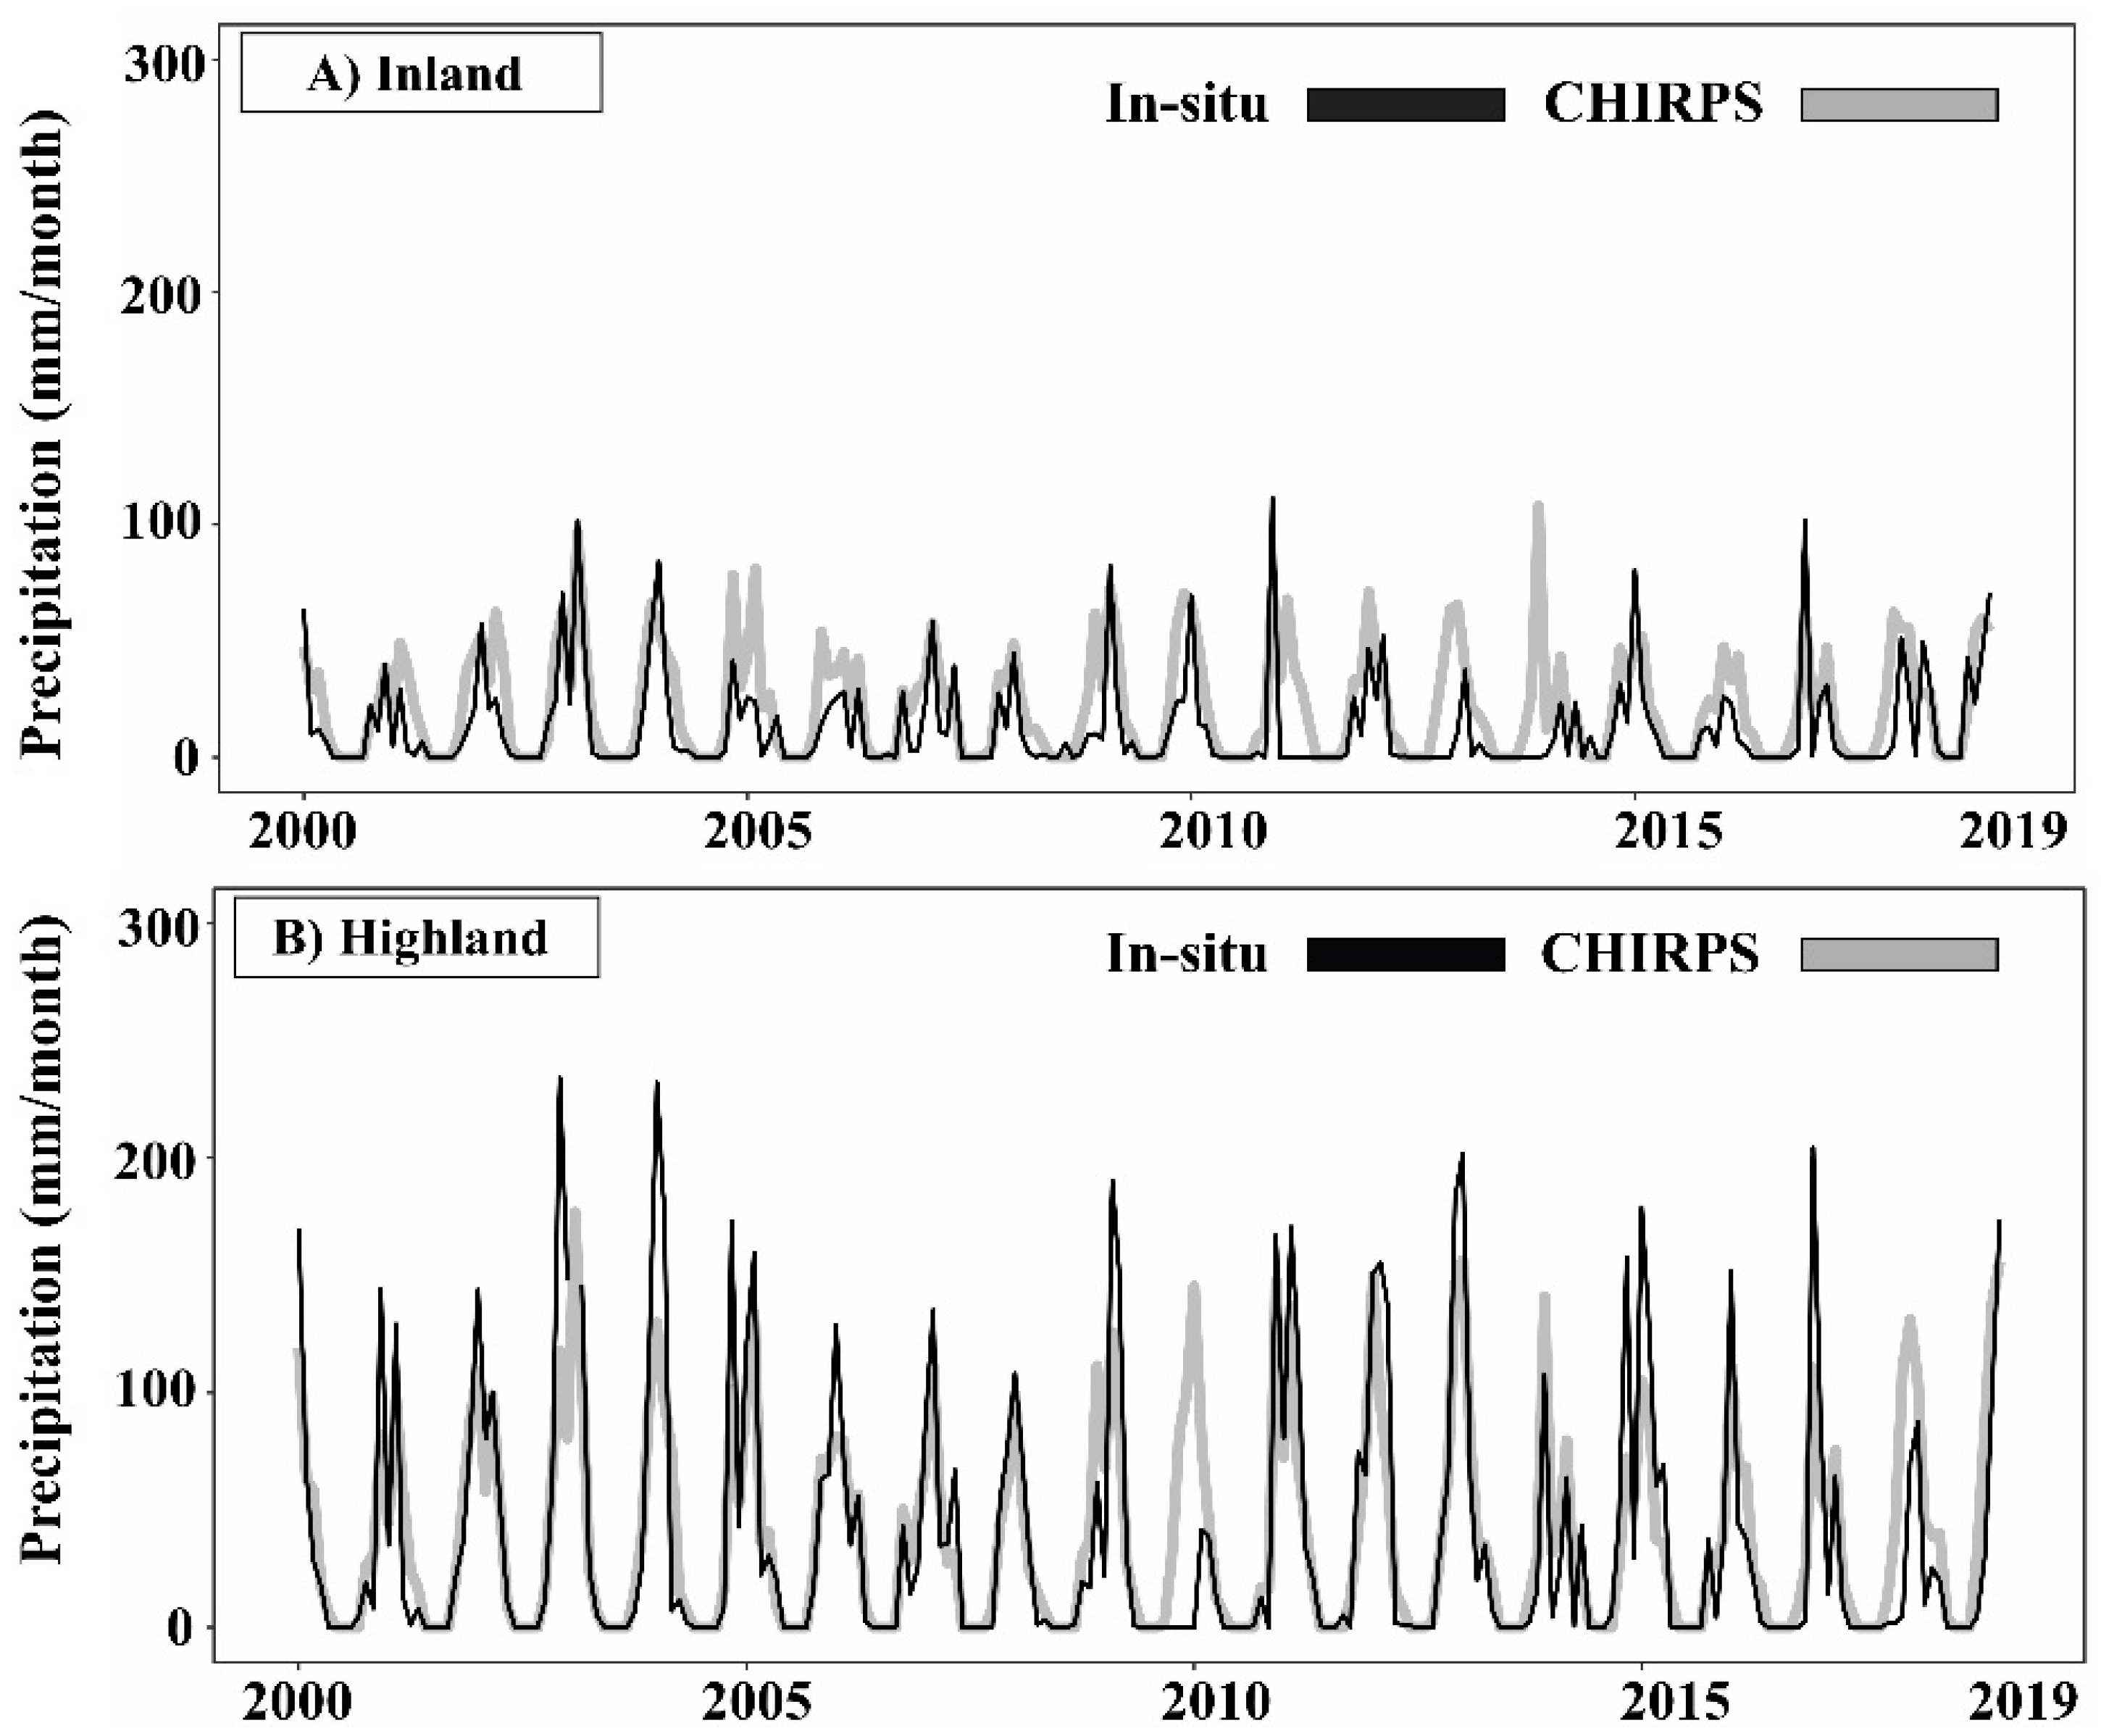
4.2.1. Monthly Comparison

The monthly average comparison between CHIRPS estimates and in-situ precipitation is shown in Figure 4. It could easily be observed that the highland exhibited wetter conditions than inland. The hydrological year in both parts (inland and highland) followed the same pattern: June to September was a rainless period, whereas the rainy season extended from October to April. For 20 months of records, the CHIRPS median precipitation values were higher than the measured values. The variation of the in-situ data was greater than that of the CHIRPS data. December precipitation measurements resulted in the highest variation of in-situ measured data in both basin parts. The rain shadow seemed to significantly affect the moisture input over the region. For instance, the highland had a monthly average of 115 mm/month in January, which was three times higher than the January monthly average in the inland part (39.52 mm/month). The same trend was found in other winter months, including December and February. In transition months, the moisture gap was lower. For example, the November and October monthly averages in the highland were approximately double the monthly averages inland. This information provides insight into the cloud mechanism over the basin. Based on Figure 4B, CHIRPS seemed more reliable in the highland part. Close agreement was observed in almost all months. In the inland part (Figure 4A), CHIRPS failed to produce the in-situ precipitation amounts, as significant over/underestimation was observed.
A monthly time series comparison is shown in Figure 5. A longer time series was available at a monthly scale. Although the time series is considered relatively short to infer a generalization on the climate trend over the basin, it provides good information on the precipitation behavior in the first two decades of the current millennium. Precipitation seemed to be more intense in the first decade, as 2004 was the wettest year over the basin. Roughly, a cycle of wet/dry years seemed to repeat every 4–5 years in the highland (Figure 5B). For instance, 2004–2009–2013–2017 had the highest peaks. The historical drought in 2007–2008 was shown clearly [49]. Interestingly, another similar drier condition could be observed in 2018, aligning with numerous studies indicating extreme drought in this year [50].

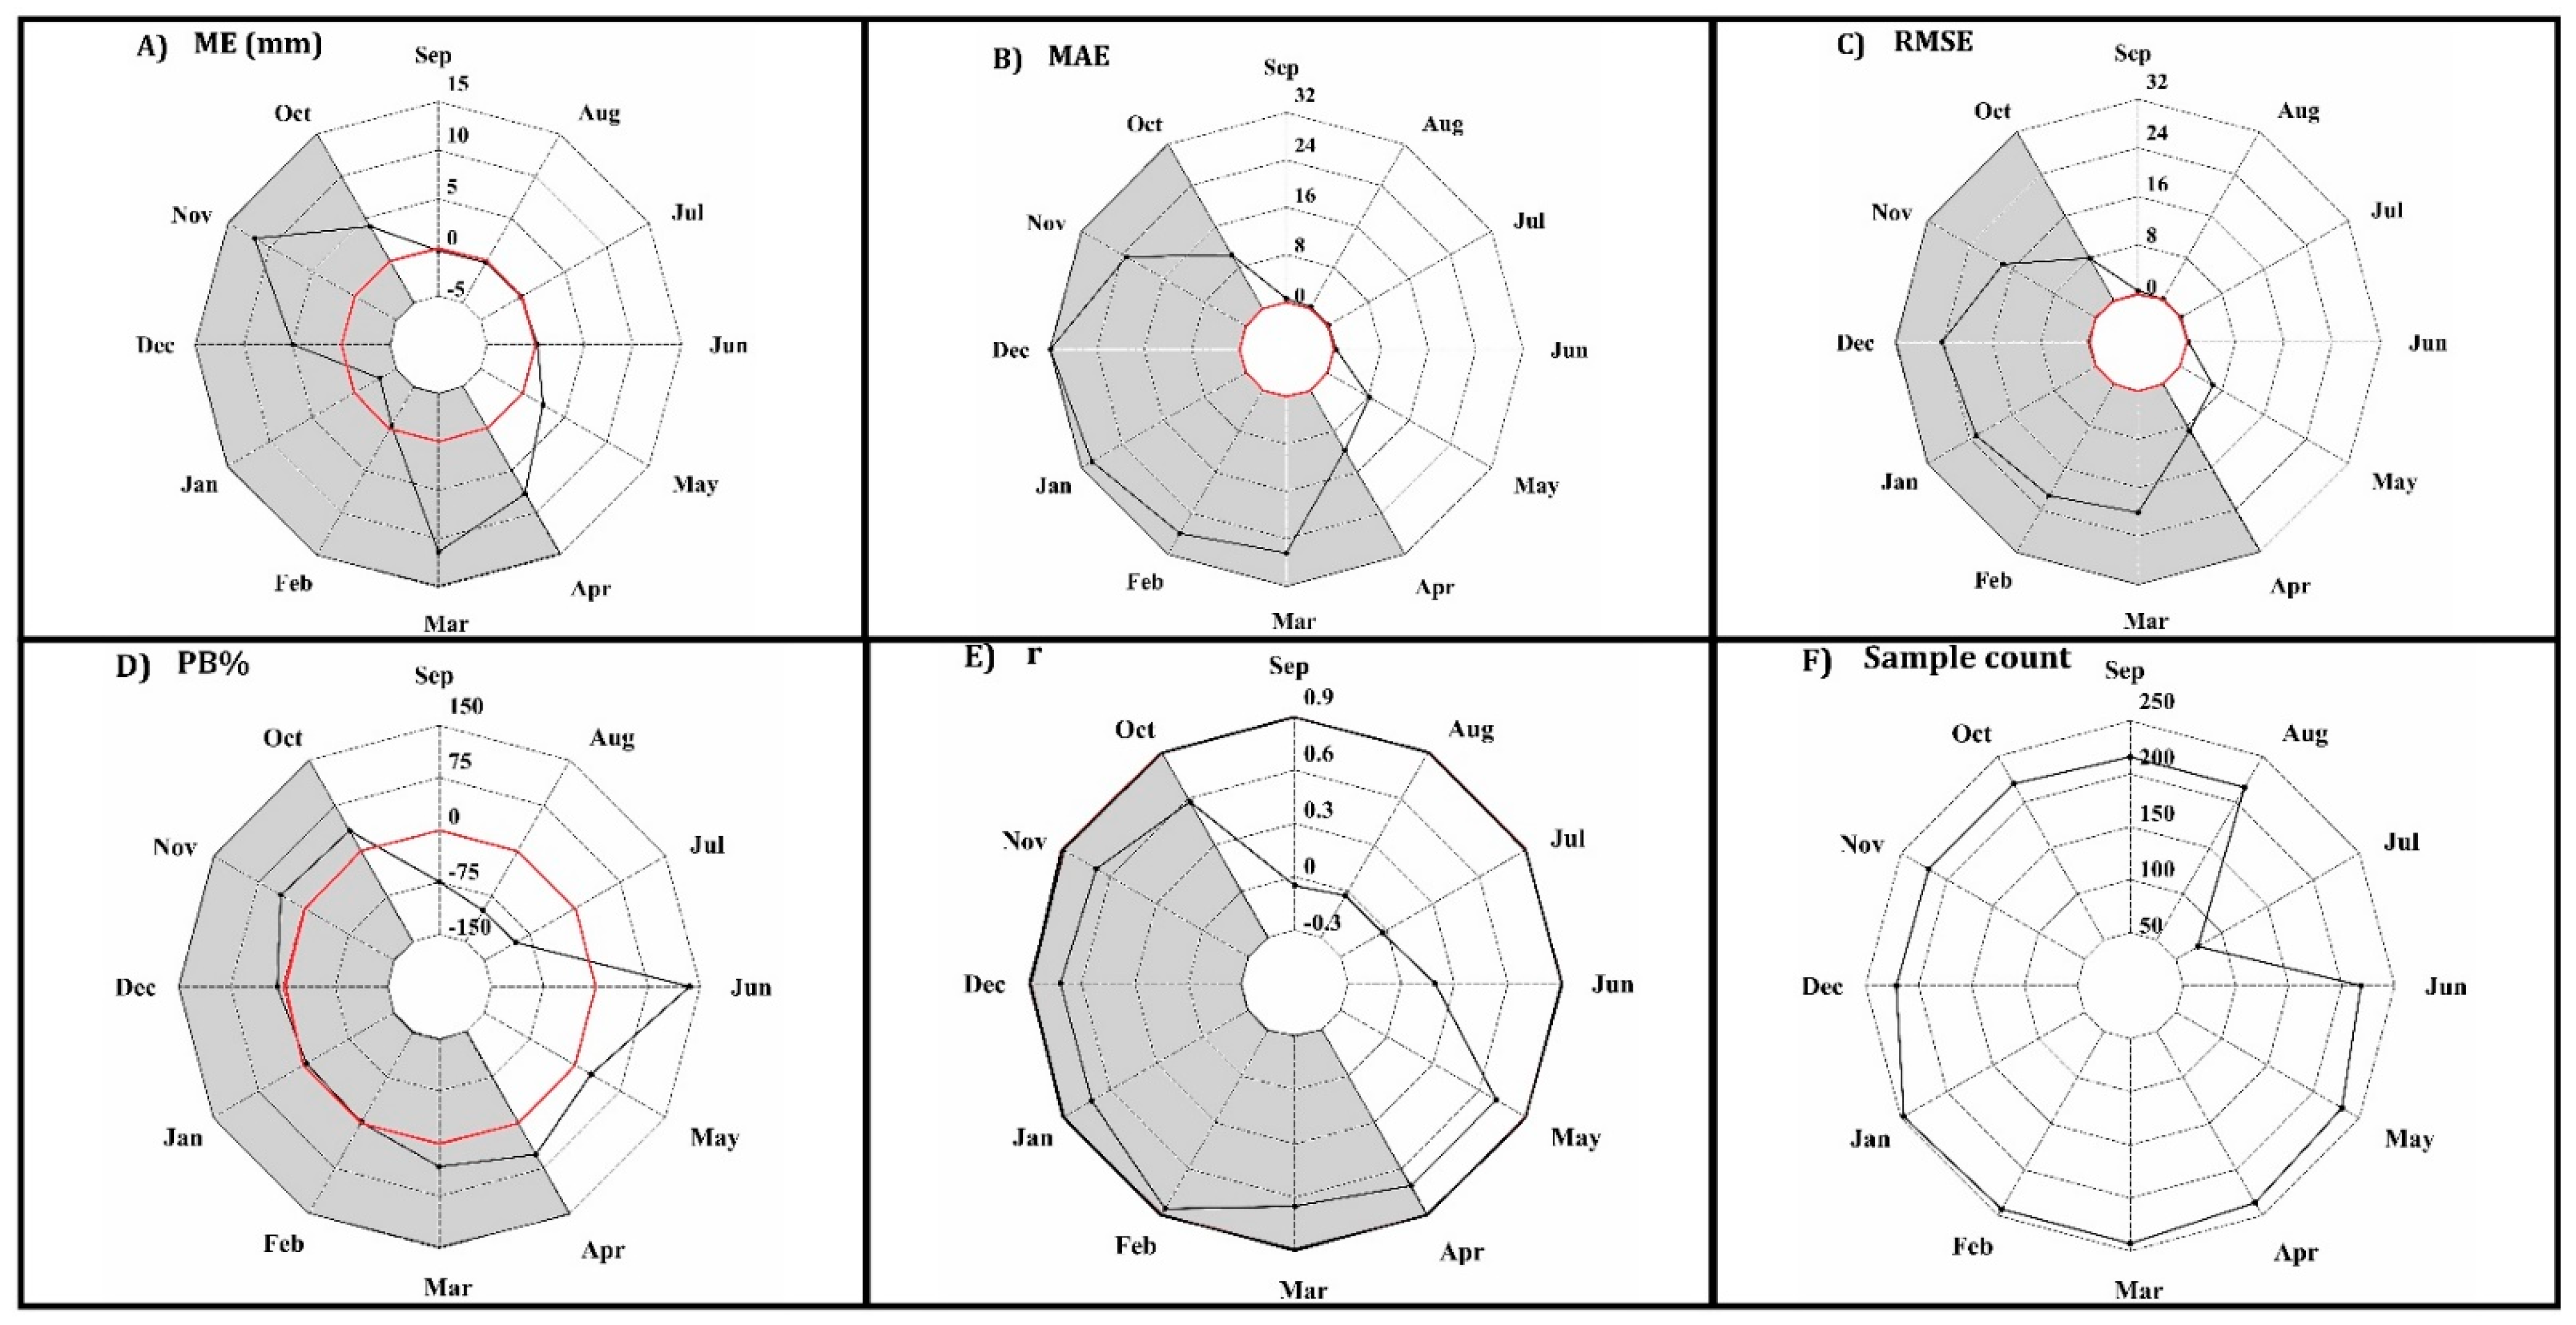
4.2.2. Monthly Accuracy Skill

At the monthly scale, the accuracy test results in Figure 6 revealed under/overestimation of the in-situ precipitation measurements. In wet months (October to April), the average error was more pronounced with higher correlation (mean r = 0.72) and less bias, whereas dry months exhibited lower average error but higher bias and less correlation (mean r = 0.24). Figure 6A shows the ME variations across the hydrological year in months; the lowest values were in dry months (June has the lowest average error, ME = 0.19 mm/month). The highest average errors were observed in March (ME = 11.36 mm/month) and November (ME = 11.84 mm/month). The CHIRPS product tended to perform poorly in transition months. Transition months feature unstable weather conditions, such as increasing/decreasing temperatures. The MAE results (Figure 6B) provide information on the CHIRPS product’s magnitude of error. The results showed an increase in the error magnitude in wet months, whereas in dry months, the error margin was less, which is typical in semi-arid regions where dry months are almost rainless. June exhibited the highest bias (Figure 6D). June’s high PB resulted from short and intense showers that happen randomly in this month, which produced a tendency to overestimate the observation with a higher PB.

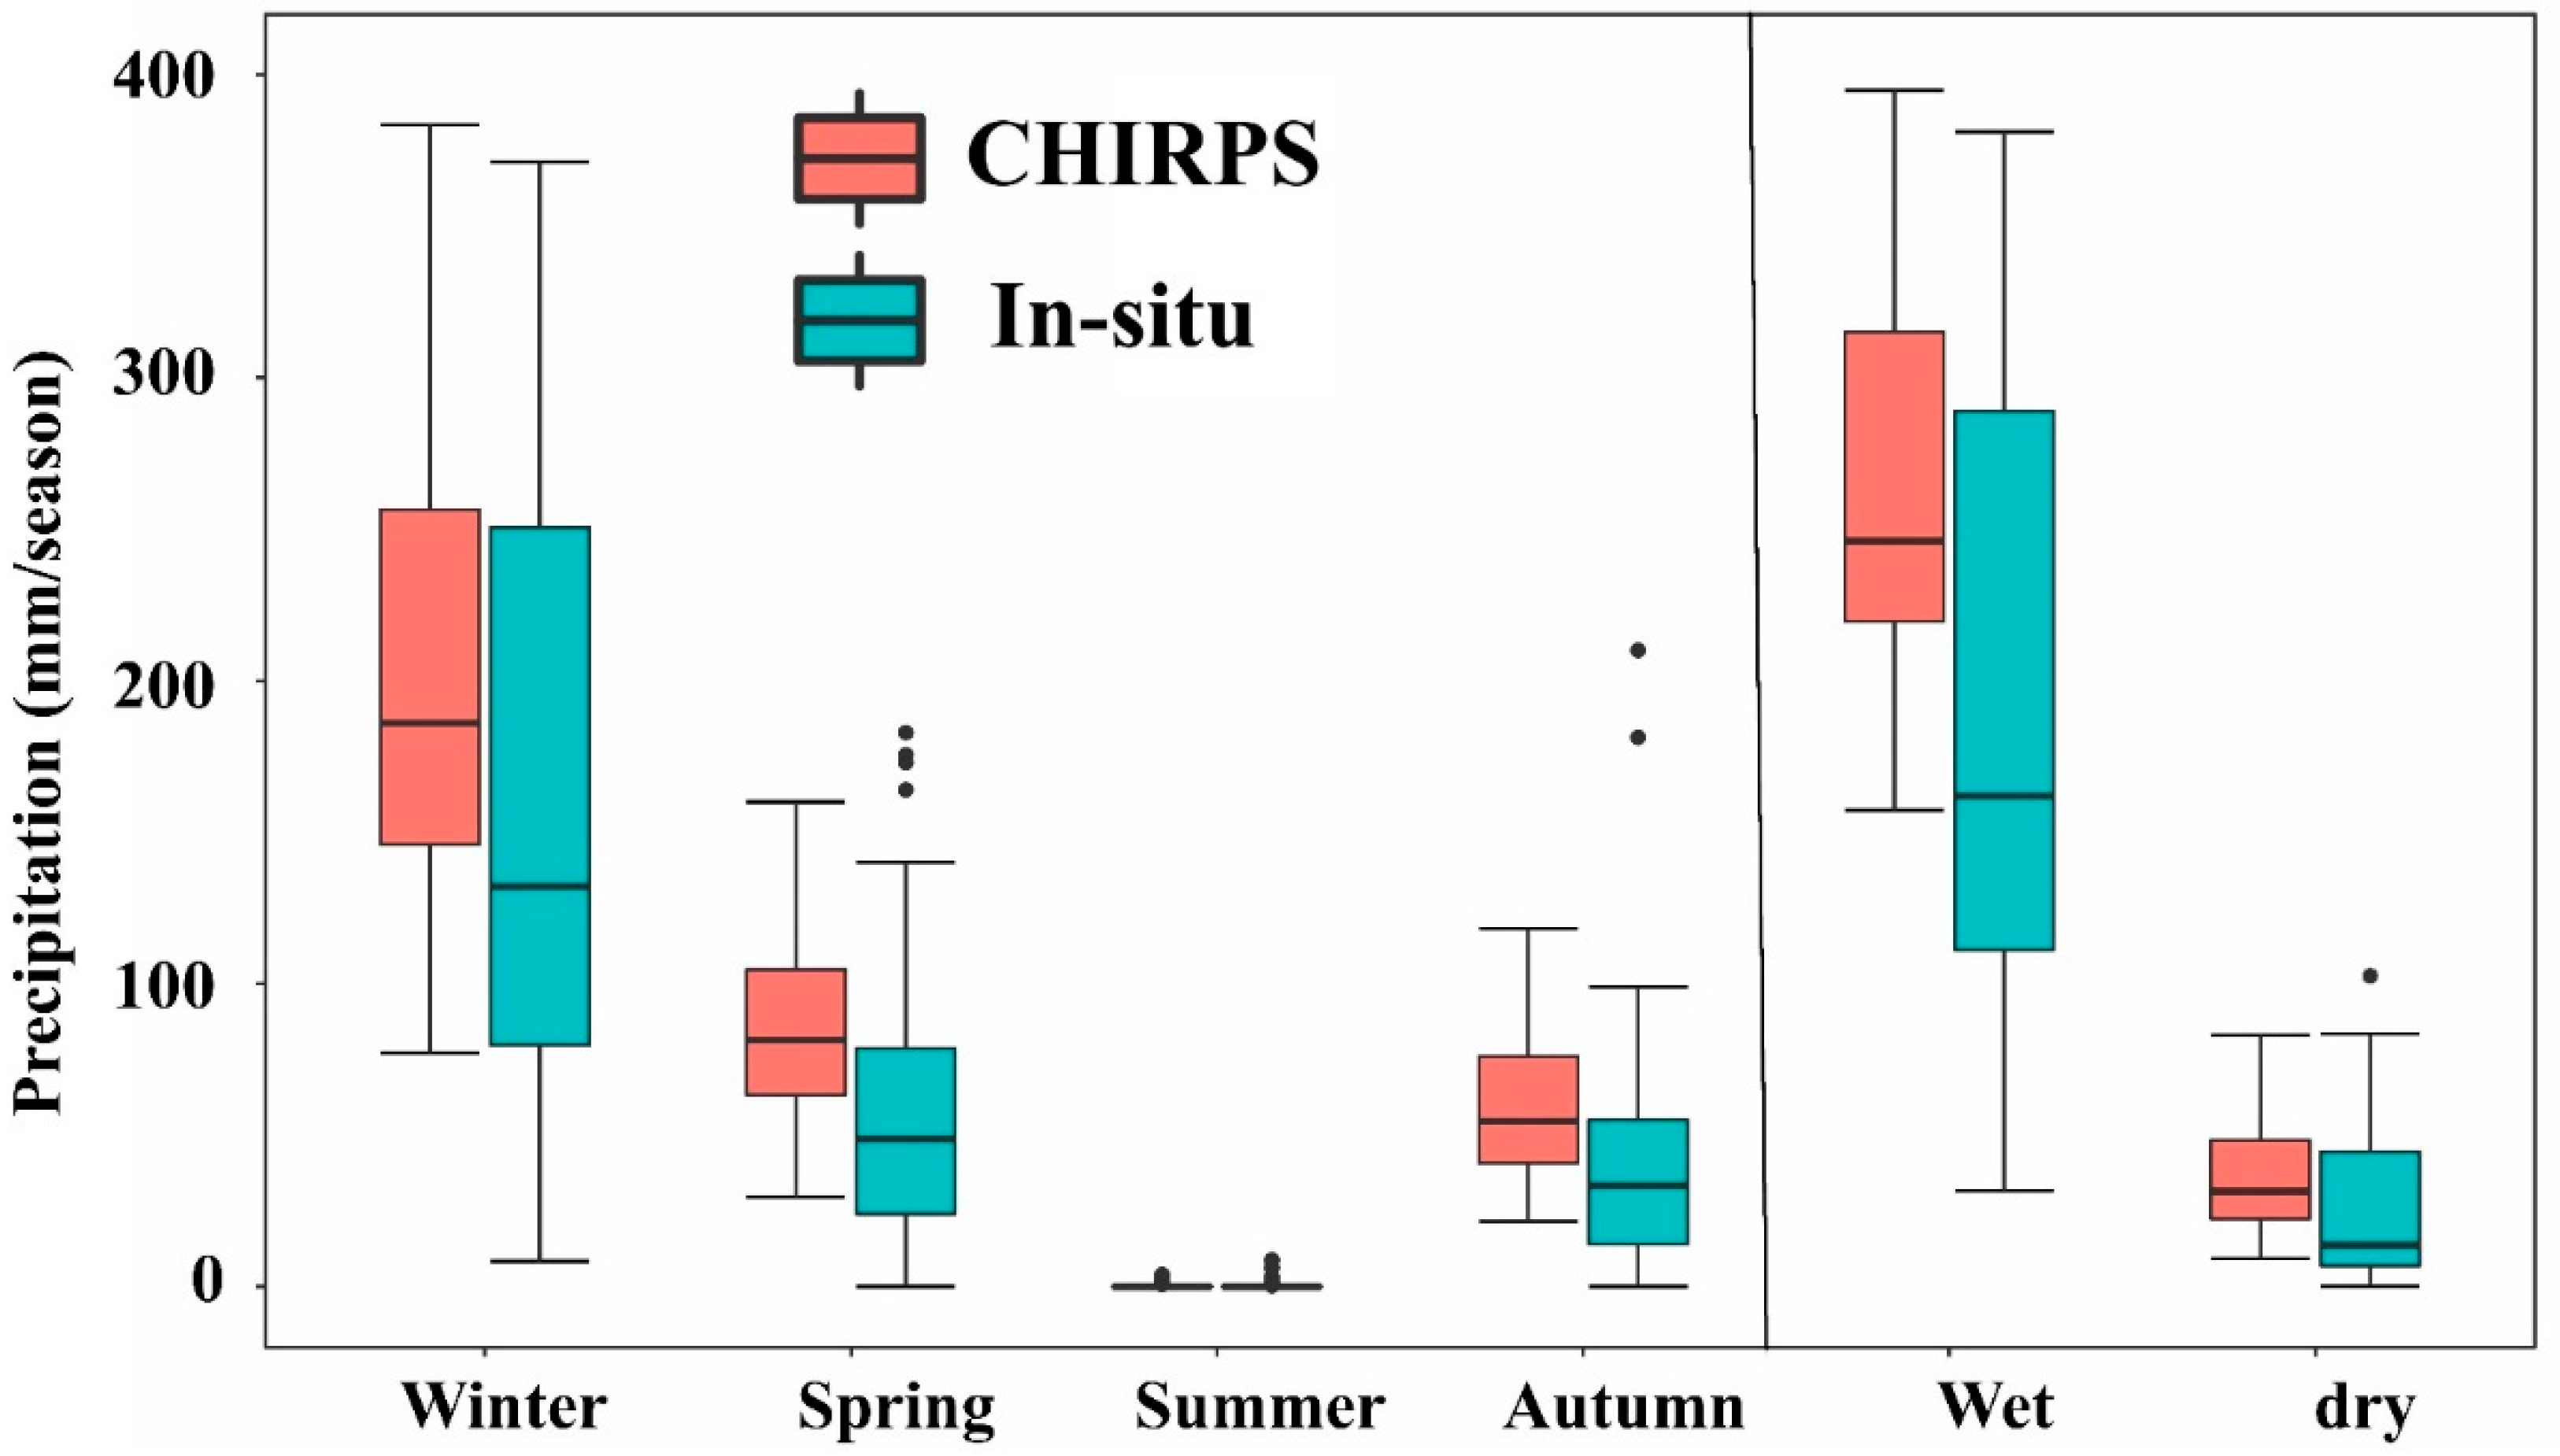
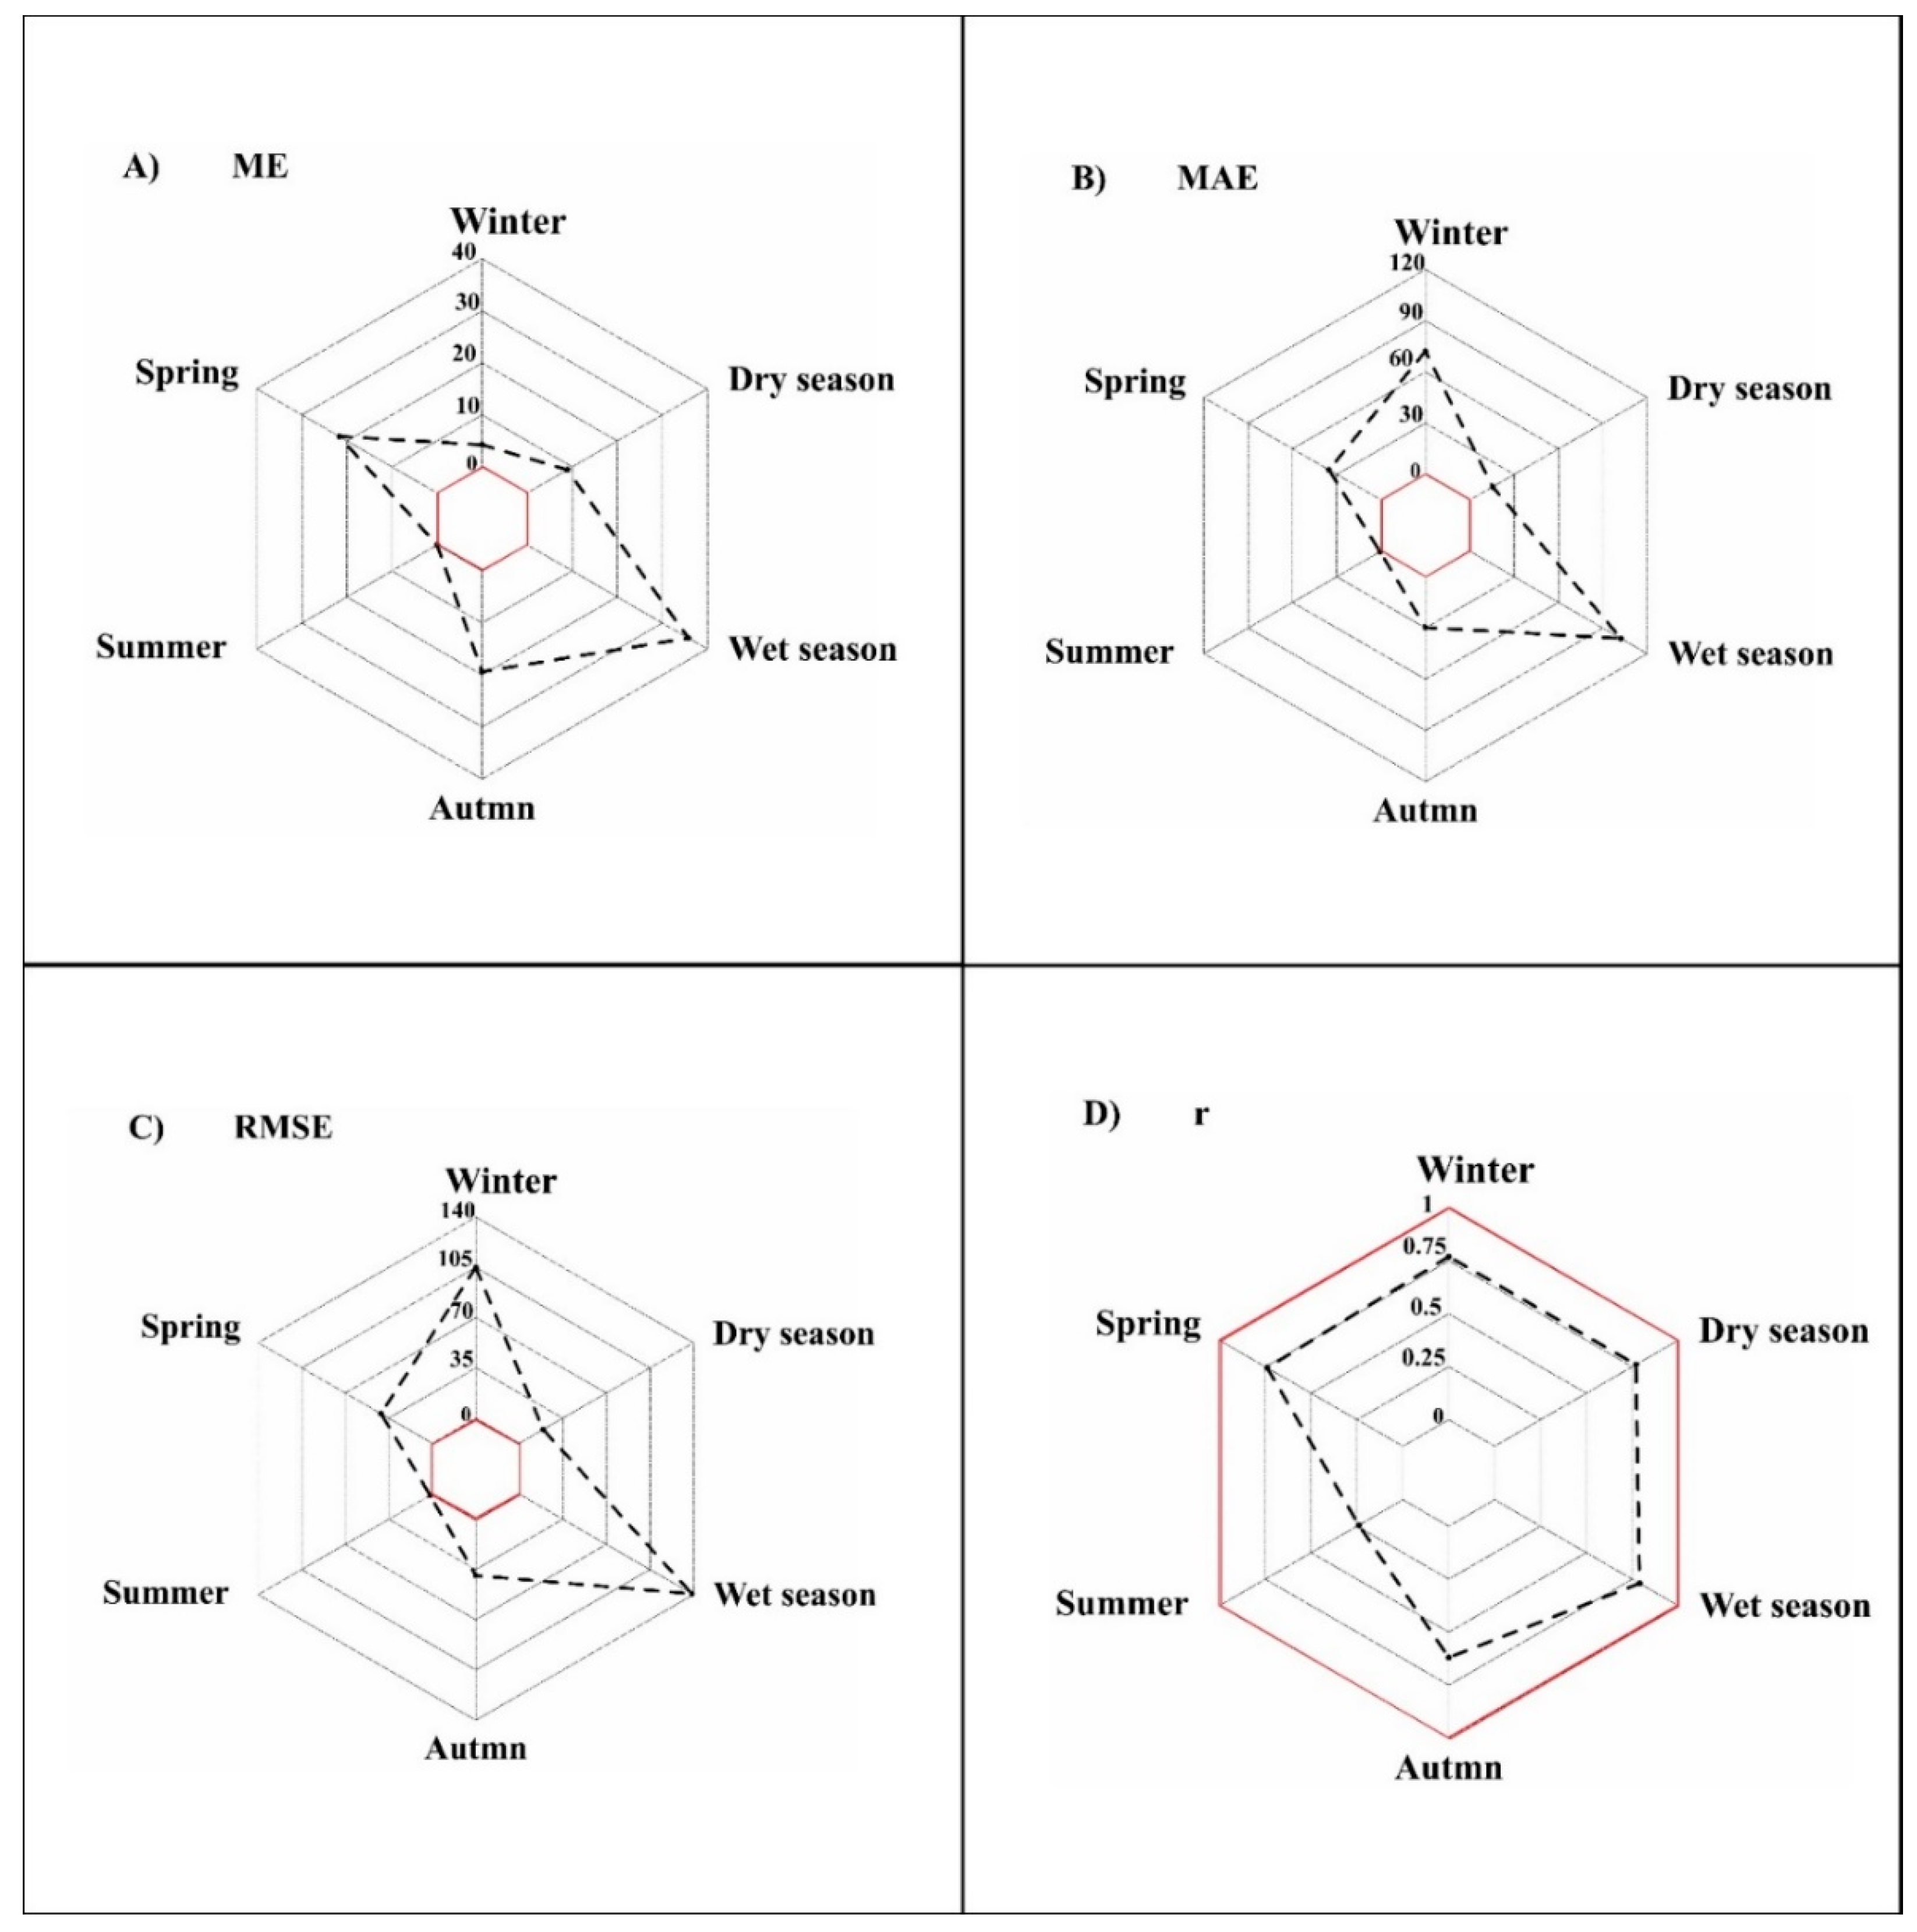
4.3. Seasonal Scale Assessment

The main application of CHIRPS is seasonal drought studies [26], hence seasonal analysis benefits the assessment of CHIRPS performance for seasonal drought. For all the gauges over the basin, the in-situ measurements were clustered based on the seasons of the hydrological year. Four seasons were defined: autumn (September–October–November), winter (December–January–February), spring (March–April–May), and summer (June–July–August). Two additional periods were added to the analysis, the wet season extending from the beginning of October to the end of March and the dry season representing the rest of the months. Figure 7 shows the statistical visualization of the seasons’ characteristics. Winter accounted for the majority of the precipitation amounts with a mean precipitation of 211.5 mm/winter, whereas the autumn and spring seasons had significantly lower precipitation. The summer season was rainless. CHIRPS performed well in producing the skewed distribution in all seasons. The median values of all CHIRPS seasonal precipitations were close to the minimum values, indicating good representation of the right-skewed distribution. The data spread was wider in in-situ seasonal precipitation than in CHIRPS.
Seasonal accuracy assessment (Figure 8) of the CHIRPS product in the Barada Basin showed promising results. For instance, CHIRPS overestimated the winter season by only 2.10%, with a small mean error of 4.25 mm/winter and an error magnitude of 72.28, accounting for only 45% of one standard deviation (STDwinter = 157.2). For seasonal drought, numerous approaches use standard deviation as drought magnitude classification in their methodologies [51]. Using CHIRPS for winter drought analysis in the Barada Basin would guarantee the non-masking of drought conditions. Another important season is the wet season. Low bias (12.7%) and mean error (MEwet = 35.8 mm/wet season) revealed the CHIRPS product’s accuracy in reproducing wet season precipitation amounts. The wet/rainy season is the primary source of moisture into the basin, which is considered closed, with no external water resources available. The wet season could be an early warning alarm for water storage drought in the basin.

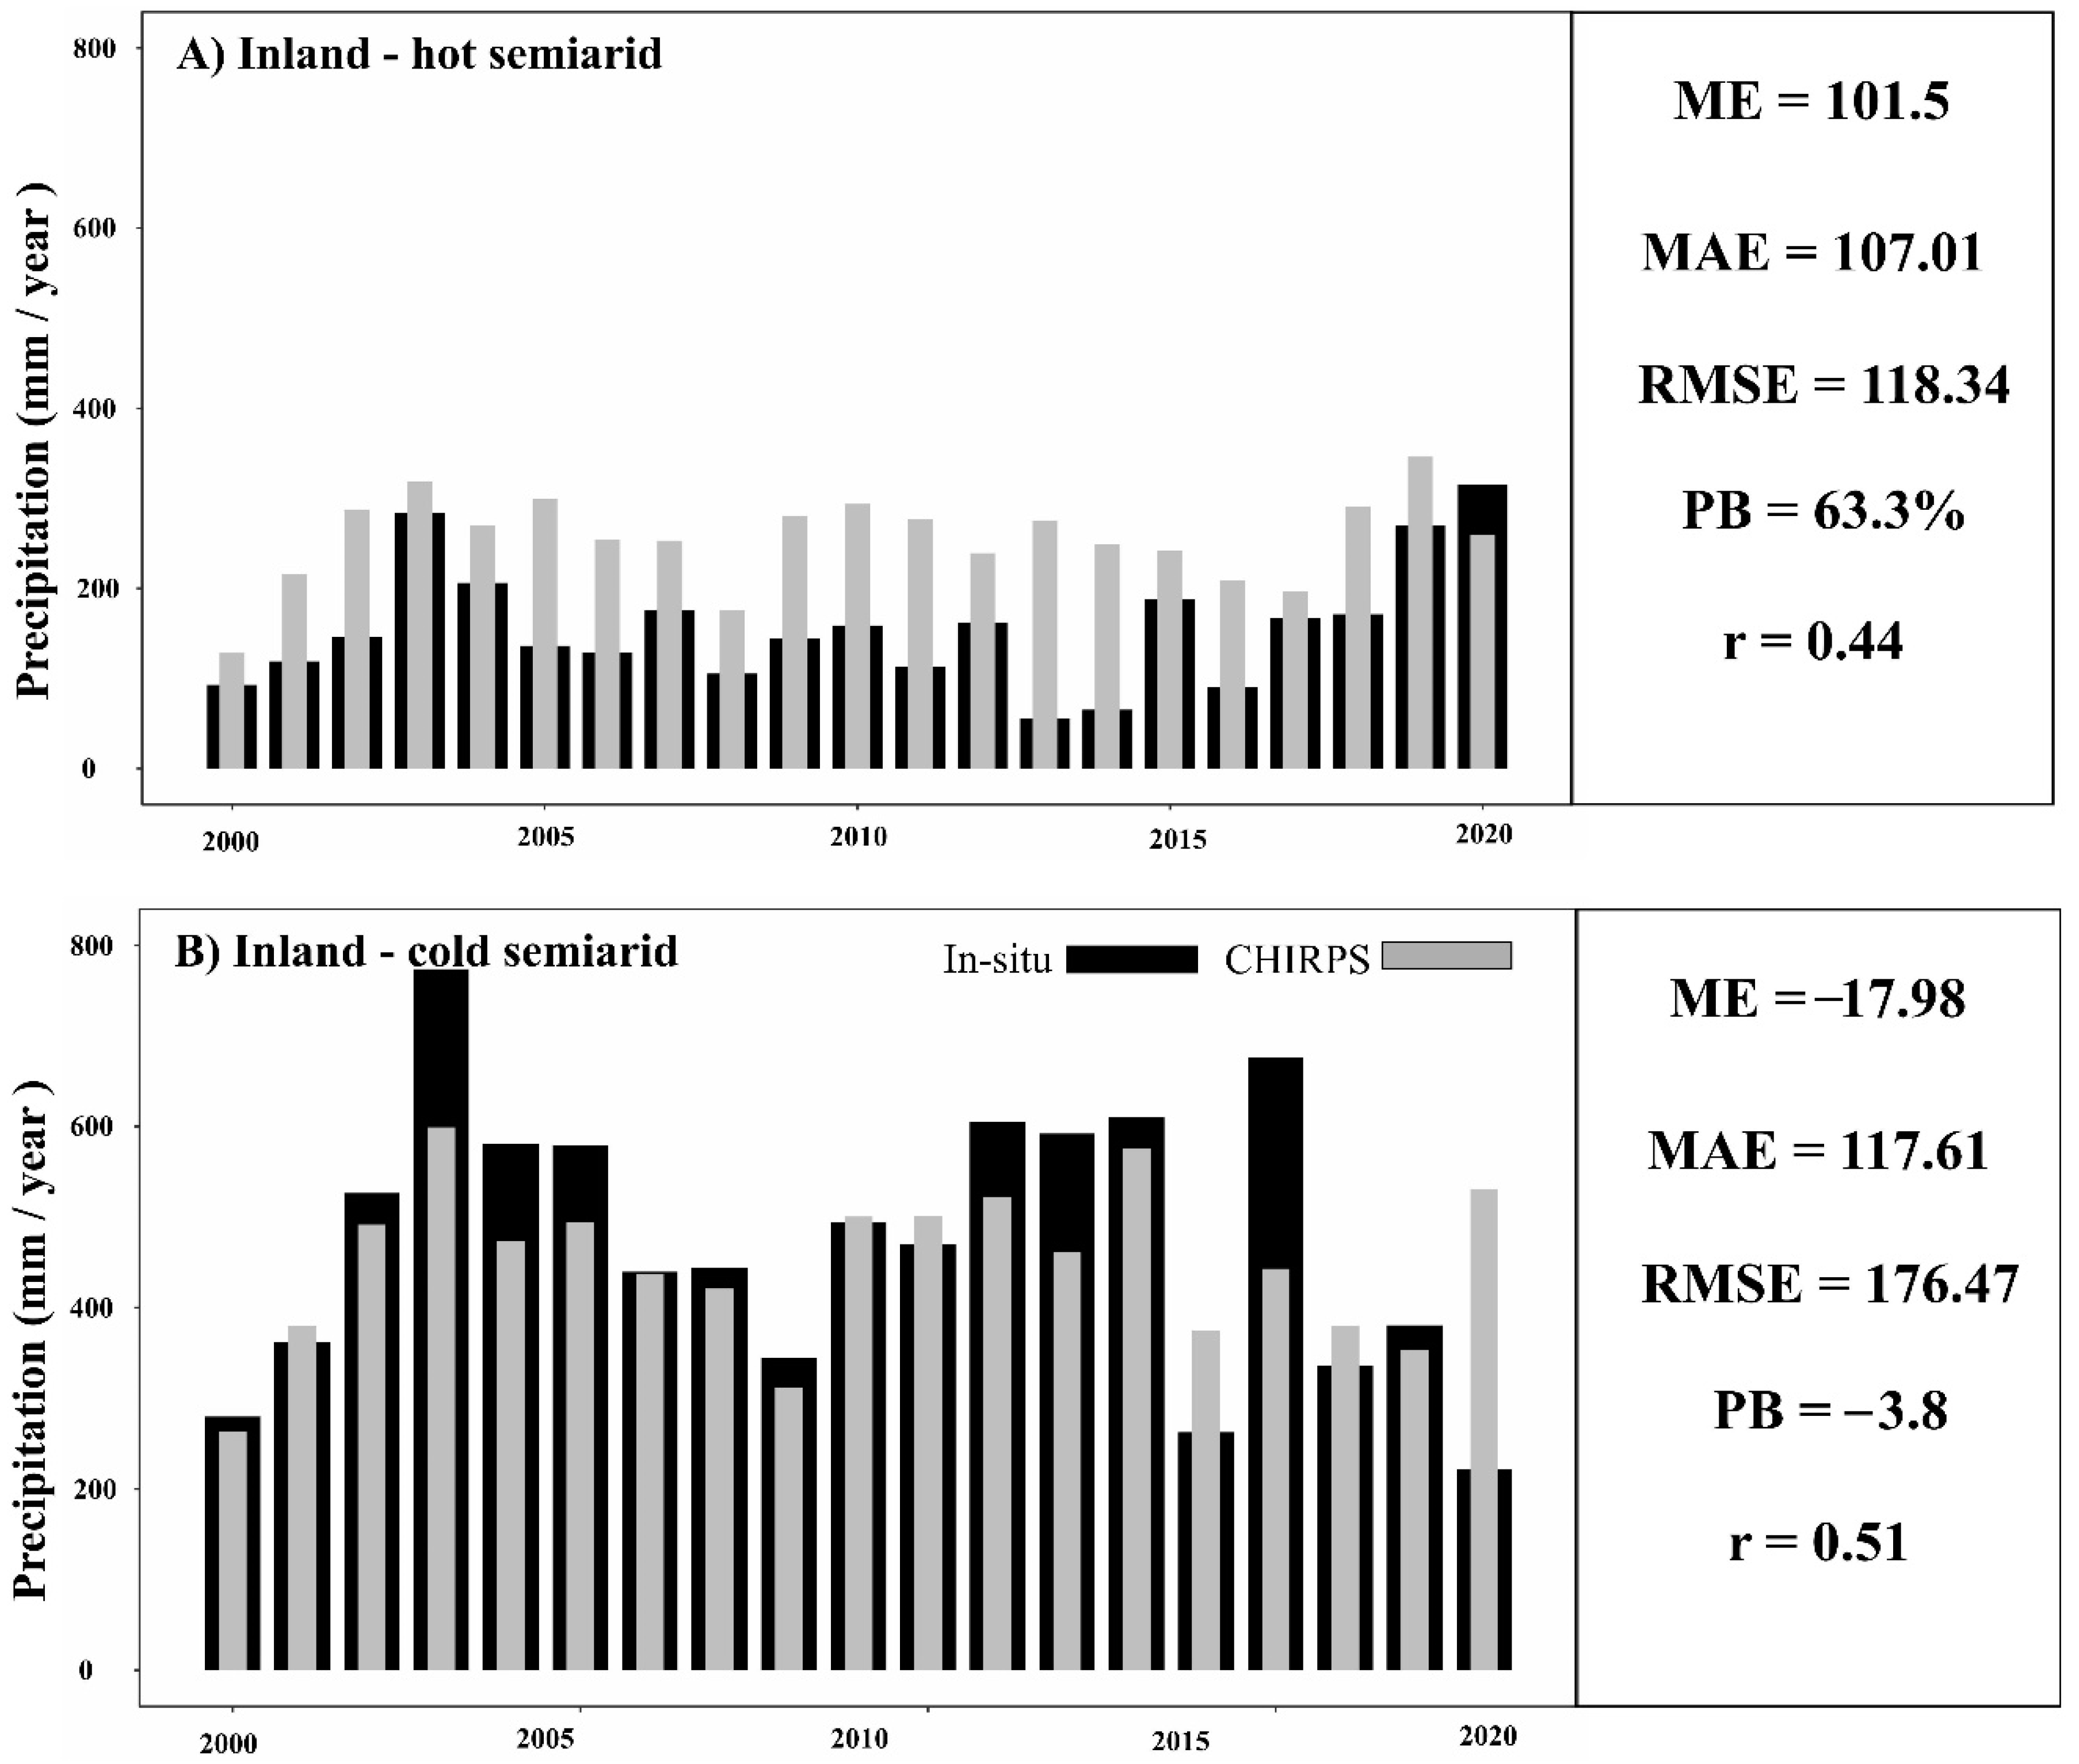
4.4. Annual Scale Assessment

Figure 9 shows the annual time series comparison between CHIRPS and in-situ with all accuracy statistics. The inland annual precipitation (Figure 9A) was higher in recent years (2020) compared to the drying trend since 2004. The mean inland annual precipitation was 157 mm/year (based on our sample in this study, 20 years), which was lower than the CHIRPS annual mean (255.3) by 40%. ME and PB confirmed this overestimation, respectively (MEinland = 101.5 mm/year, PBinland = 63.3%). The error margin was significant, with an average error magnitude of 107.01, which was considered to be approximately 60% of the annual mean.
Annual precipitation in the highland (Figure 9B) exhibited more correlation with CHIRPS (r = 0.51) than that in the inland part (r = 0.44). CHIRPS annual estimates successfully produced the majority of the in-situ annual amounts. CHIRPS mean annual precipitation in the highland (448 mm/year) was close to the in-situ annual precipitation in the highland (472 mm/year), with only a 5% lower value. The average error magnitude was 117.6, accounting for only 25% of the annual mean. Underestimation was the dominant characteristic, which confirmed in the lower ME = −17.98 and small PB (−3.8%). The good performance of CHIRPS in the highland suggested its suitability for water resource related studies, specifically in the planning phase.

4.5. More Discussions

This research evaluated CHIRPS product suitability for water resource management in the Barada Basin. The basin is located within the subtropics and has seasonal cycles modulated by Mediterranean convective systems that heavily affect the precipitation regime over the basin. Precipitation in drylands exhibits high variability in time and space, which makes the characterization of precipitation difficult [52]. In addition, precipitation information in such regions is limited. This research intended to overcome this issue using the satellite-based product CHIRPS [27]. The CHIRPS results indicated advantages and disadvantages. The main promising result was achieved at the seasonal scale. Implementing CHIRPS for seasonal drought monitoring was proven to be suitable in the Barada Basin. Low bias (PBwinter = 2.1%, PBrainy season = 12.7%), high correlation (rwinter = 0.77 and rwet = 0.79), and small error support the implementation of CHIRPS in winter and wet seasons for seasonal drought monitoring.
This conclusion was consistent with previous studies that suggested the usefulness of the CHIRPS product for seasonal drought in arid/semi-arid regions. In the Arabian arid region, CHIRPS performed well at the seasonal scale [45]. The results of ref. [6] in Pakistan agreed with our results, where the correlation at the seasonal scale was >0.7, which was comparable to this study’s results (rwinter = 0.77 and rwet = 0.79). In addition, a wide range of studies agreed on the superiority of CHIRPS at monthly and longer time scales, such as those conducted in Turkey [33], China [51], Argentina [2], Ethiopia [53], Taiwan [54], Kingdom of Saudi Arabia (KSA) [45], and Nepal [55]. However, it was observed that CHIRPS exhibited poor performance (inland pentads) in reproducing precipitation amounts at finer temporal scales (pentad and daily). Flash floods are common in drylands [56], especially in bare hillslopes like the highland part of the Barada Basin. The results showed that CHIRPS had poor detection skill in drylands, on average, as CHIRPS detected only 20% of in-situ precipitation events. The accuracy of reproducing flood events was also poor since the results showed a significant error margin (Figure 3B,C) in estimating heavy storms. It could be concluded that the CHIRPS product in this region is not recommended for flood forecasting. Based on this research, implementing the CHIRPS product for water resource management in the Barada Basin is beneficial; however, comprehensive care of the scale used is critical (longer temporal scales were better). In addition, the highland part could be a better candidate for implementing CHIRPS than the inland part of the basin. CHIRPS estimates were also evaluated along orographic precipitation-based topography by dividing the basin into highland and flatland. The variation in CHIRPS estimates along the elevation grade was attributed mainly to the poor performance of satellite-based precipitation products over orographic rainfall-based regions [57]. Several explanations of this poor performance were reported in the literature, such as Nonuniform Beam Filling (NUBF) artifacts attributed to the radar beam’s horizontal resolution and contamination of the near-surface ground with ground clutter [57,58,59,60,61,62]. Poor performance led to significant errors in detecting light and low-level orographic rainfall along the elevation grade [57].

5. Conclusions

This study tested and validated the CHIRPS satellite-based precipitation product in the Barada Basin in southwestern Syria. To evaluate the estimation accuracy, various accuracy statistics were used (ME, MAE, RMSE, PB, and r). The detection skill of the CHIRPS product was investigated using categorical statistics (PC, POD, FAR, TS, and FB). Based on the results at multiple scales, the conclusions are summarized as below:
  • CHIRPS performance depends heavily on the temporal scale. Longer temporal scales were the most accurate, while the daily scale was observed to be the worst.
  • CHIRPS estimates well light events (<5 mm). In more intense events, CHIRPS estimates have higher bias and error magnitude.
  • During the hydrological year, CHIRPS estimation is better correlated in wet months than dry months.
  • Detection skill was generally poor, with an under-estimation trend in all gauge locations.
This study concluded that the CHIRPS product is recommended for water resource planning and seasonal drought in the Barada Basin. However, CHIRPS exhibited poor performance for other applications, such as flood forecasting. Decision-makers in the Barada Basin are encouraged to cooperate more (increase the number of anchor gauges in the basin) with CHIRPS developers. The more in-situ data included in the CHIRPS procedure, the more bias reduction can be improved.

Author Contributions

F.A.: Conceptualization, Methodology, Software, Formal Analysis, Data Curation, Visualization, Writing—Original Draft. K.B.: Supervision, Conceptualization, Writing—Original Draft, Review & Editing. G.B.: Supervision. K.A.: Review & Editing. X.S.: Writing—Original Draft, Review & Editing. All authors have read and agreed to the published version of the manuscript.

Funding

This research received no external funding.

Data Availability Statement

Climate Hazards Group Infra-Red Rainfall with Station (CHIRPS) is freely available at https://www.chc.ucsb.edu/data/chirps (accessed on 17 December 2022). In-situ dataset available on request.

Conflicts of Interest

The authors declare no conflict of interest.

References

  1. Hegerl, G.C.; Black, E.; Allan, R.P.; Ingram, W.J.; Polson, D.; Trenberth, K.E.; Chadwick, R.S.; Arkin, P.A.; Sarojini, B.B.; Becker, A.; et al. Challenges in quantifying changes in the global water cycle. Bull. Am. Meteorol. Soc. 2015, 96, 1097–1115. [Google Scholar] [CrossRef] [Green Version]
  2. Rivera, J.A.; Marianetti, G.; Hinrichs, S. Validation of CHIRPS precipitation dataset along the Central Andes of Argentina. Atmos. Res. 2018, 213, 437–449. [Google Scholar] [CrossRef]
  3. Kidd, C.; Huffman, G. Global precipitation measurement. Meteorol. Appl. 2011, 18, 334–353. [Google Scholar] [CrossRef]
  4. Tong, K.; Su, F.; Yang, D.; Hao, Z. Evaluation of satellite precipitation retrievals and their potential utilities in hydrologic modeling over the Tibetan Plateau. J. Hydrol. 2014, 519, 423–437. [Google Scholar] [CrossRef]
  5. Zambrano, F.; Wardlow, B.; Tadesse, T.; Lillo-Saavedra, M.; Lagos, O. Evaluating satellite-derived long-term historical precipitation datasets for drought monitoring in Chile. Atmos. Res. 2017, 186, 26–42. [Google Scholar] [CrossRef]
  6. Nawaz, M.; Iqbal, M.F.; Mahmood, I. Validation of CHIRPS satellite-based precipitation dataset over Pakistan. Atmos. Res. 2021, 248, 105289. [Google Scholar] [CrossRef]
  7. Mohammed, S.; Alsafadi, K.; Al-Awadhi, T.; Sherief, Y.; Harsanyie, E.; El Kenawy, A.M. Space and time variability of meteorological drought in Syria. Acta Geophys. 2020, 68, 1877–1898. [Google Scholar] [CrossRef]
  8. Homsi, R.; Shiru, M.S.; Shahid, S.; Ismail, T.; Harun, S.B.; Al-Ansari, N.; Chau, K.W.; Yaseen, Z.M. Precipitation projection using a CMIP5 GCM ensemble model: A regional investigation of Syria. Eng. Appl. Comput. Fluid Mech. 2020, 14, 90–106. [Google Scholar] [CrossRef]
  9. Dubrovský, M.; Hayes, M.; Duce, P.; Trnka, M.; Svoboda, M.; Zara, P. Multi-GCM projections of future drought and climate variability indicators for the Mediterranean region. Reg. Environ. Change 2014, 14, 1907–1919. [Google Scholar] [CrossRef]
  10. Zakhem, B.A.; Kattaa, B. Cumulative drought effect on Figeh karstic spring discharge (Damascus basin, Syria). Environ. Earth Sci. 2016, 75, 1–17. [Google Scholar] [CrossRef]
  11. Kottek, M.; Grieser, J.; Beck, C.; Rudolf, B.; Rubel, F. World map of the Köppen-Geiger climate classification updated. Meteorol. Z. 2006, 15, 259–263. [Google Scholar] [CrossRef] [PubMed]
  12. Kattan, Z. Characterization of surface water and groundwater in the Damascus Ghotta basin: Hydrochemical and environmental isotopes approaches. Environ. Geol. 2006, 51, 173–201. [Google Scholar] [CrossRef]
  13. Gleick, P.H. Water, drought, climate change, and conflict in Syria. Weather. Clim. Soc. 2014, 6, 331–340. [Google Scholar] [CrossRef]
  14. Zambrano-Bigiarini, M.; Nauditt, A.; Birkel, C.; Verbist, K.; Ribbe, L. Temporal and spatial evaluation of satellite-based rainfall estimates across the complex topographical and climatic gradients of Chile. Hydrol. Earth Syst. Sci. 2017, 21, 1295–1320. [Google Scholar] [CrossRef] [Green Version]
  15. Iqbal, M.F.; Athar, H. Validation of satellite based precipitation over diverse topography of Pakistan. Atmos. Res. 2018, 201, 247–260. [Google Scholar] [CrossRef]
  16. Paredes-Trejo, F.J.; Barbosa, H.A.; Kumar, T.L. Validating CHIRPS-based satellite precipitation estimates in Northeast Brazil. J. Arid. Environ. 2017, 139, 26–40. [Google Scholar] [CrossRef]
  17. Toté, C.; Patricio, D.; Boogaard, H.; Van der Wijngaart, R.; Tarnavsky, E.; Funk, C. Evaluation of satellite rainfall estimates for drought and flood monitoring in Mozambique. Remote Sens. 2015, 7, 1758–1776. [Google Scholar] [CrossRef] [Green Version]
  18. Levizzani, V.; Cattani, E. Satellite remote sensing of precipitation and the terrestrial water cycle in a changing climate. Remote Sens. 2019, 11, 2301. [Google Scholar] [CrossRef] [Green Version]
  19. Hsu, K.L.; Gao, X.; Sorooshian, S.; Gupta, H.V. Precipitation estimation from remotely sensed information using artificial neural networks. J. Appl. Meteorol. 1997, 36, 1176–1190. [Google Scholar] [CrossRef]
  20. Hong, Y.; Hsu, K.L.; Sorooshian, S.; Gao, X. Precipitation estimation from remotely sensed imagery using an artificial neural network cloud classification system. J. Appl. Meteorol. 2004, 43, 1834–1853. [Google Scholar] [CrossRef] [Green Version]
  21. Wang, C.; Tang, G.; Gentine, P. PrecipGAN: Merging microwave and infrared data for satellite precipitation estimation using generative adversarial network. Geophys. Res. Lett. 2021, 48, e2020GL092032. [Google Scholar] [CrossRef]
  22. Skofronick-Jackson, G.; Petersen, W.A.; Berg, W.; Kidd, C.; Stocker, E.F.; Kirschbaum, D.B.; Kakar, R.; Braun, S.A.; Huffman, G.J.; Iguchi, T.; et al. The Global Precipitation Measurement (GPM) mission for science and society. Bull. Am. Meteorol. Soc. 2017, 98, 1679–1695. [Google Scholar] [CrossRef] [PubMed]
  23. Huffman, G.J.; Bolvin, D.T.; Nelkin, E.J.; Wolff, D.B.; Adler, R.F.; Gu, G.; Hong, Y.; Bowman, K.P.; Stocker, E.F. The TRMM multisatellite precipitation analysis (TMPA): Quasi-global, multiyear, combined-sensor precipitation estimates at fine scales. J. Hydrometeorol. 2007, 8, 38–55. [Google Scholar] [CrossRef]
  24. Sorooshian, S.; Hsu, K.L.; Gao, X.; Gupta, H.V.; Imam, B.; Braithwaite, D. Evaluation of PERSIANN system satellite-based estimates of tropical rainfall. Bull. Am. Meteorol. Soc. 2000, 81, 2035–2046. [Google Scholar] [CrossRef]
  25. Joyce, R.J.; Xie, P.; Yarosh, Y.; Janowiak, J.E.; Arkin, P.A. CMORPH: A “morphing” approach for high resolution precipitation product generation. In Satellite Rainfall Applications for Surface Hydrology; Springer: Dordrecht, The Netherlands, 2009; pp. 23–37. [Google Scholar]
  26. Funk, C.; Verdin, A.; Michaelsen, J.; Peterson, P.; Pedreros, D.; Husak, G. A global satellite-assisted precipitation climatology. Earth Syst. Sci. Data 2015, 7, 275–287. [Google Scholar] [CrossRef] [Green Version]
  27. Funk, C.C.; Peterson, P.J.; Landsfeld, M.F.; Pedreros, D.H.; Verdin, J.P.; Rowland, J.D.; Romero, B.E.; Husak, G.J.; Michaelsen, J.C.; Verdin, A.P. A quasi-global precipitation time series for drought monitoring. US Geol. Surv. Data Ser. 2014, 832, 1–12. [Google Scholar]
  28. Narulita, I.; Fajary, F.R.; Mulyono, A.; Kusratmoko, E.; Djuwansah, M.R. Application of Climate Hazards Group InfraRed Precipitation with Station (CHIRPS) satellite data for drought mitigation in Bintan island, Indonesia. In IOP Conference Series: Earth and Environmental Science; IOP Publishing: Bristol, UK, 2021; p. 012052. [Google Scholar]
  29. Perdigón-Morales, J.; Romero-Centeno, R.; Pérez, P.O.; Barrett, B.S. The midsummer drought in Mexico: Perspectives on duration and intensity from the CHIRPS precipitation database. Int. J. Climatol. 2018, 38, 2174–2186. [Google Scholar] [CrossRef]
  30. Saeidizand, R.; Sabetghadam, S.; Tarnavsky, E.; Pierleoni, A. Evaluation of CHIRPS rainfall estimates over Iran. Q. J. R. Meteorol. Soc. 2018, 144, 82–291. [Google Scholar] [CrossRef] [Green Version]
  31. Ghozat, A.; Sharafati, A.; Hosseini, S.A. Long-term spatiotemporal evaluation of CHIRPS satellite precipitation product over different climatic regions of Iran. Theor. Appl. Climatol. 2021, 143, 211–225. [Google Scholar] [CrossRef]
  32. Alejo, L.A.; Alejandro, A.S. Validating CHIRPS ability to estimate rainfall amount and detect rainfall occurrences in the Philippines. Theor. Appl. Climatol. 2021, 145, 967–977. [Google Scholar] [CrossRef]
  33. Aksu, H.; Akgül, M.A. Performance evaluation of CHIRPS satellite precipitation estimates over Turkey. Theor. Appl. Climatol. 2020, 142, 71–84. [Google Scholar] [CrossRef]
  34. Katsanos, D.; Retalis, A.; Michaelides, S. Validation of a high-resolution precipitation database (CHIRPS) over Cyprus for a 30-year period. Atmos. Res. 2016, 169, 459–464. [Google Scholar] [CrossRef]
  35. Wu, W.; Li, Y.; Luo, X.; Zhang, Y.; Ji, X.; Li, X. Performance evaluation of the CHIRPS precipitation dataset and its utility in drought monitoring over Yunnan Province, China. Geomat. Nat. Hazards Risk 2019, 10, 2145–2162. [Google Scholar] [CrossRef] [Green Version]
  36. Nashwan, M.S.; Shahid, S.; Dewan, A.; Ismail, T.; Alias, N. Performance of five high resolution satellite-based precipitation products in arid region of Egypt: An evaluation. Atmos. Res. 2020, 236, 104809. [Google Scholar] [CrossRef]
  37. Wolfart, R. Hydrogeology of the Damascus basin (southwest-Syria). Int. Assoc. Sci. Hydrol. 1964, 64, 402–413. [Google Scholar]
  38. Masterman, E.W.G. Damascus, the oldest city in the world. Biblical World 1989, 12, 71–85. [Google Scholar] [CrossRef] [Green Version]
  39. Lionello, P.; Abrantes, F.; Congedi, L.; Dulac, F.; Gacic, M.; Gomis, D.; Goodess, C.; Hoff, H.; Kutiel, H.; Luterbacher, J.; et al. Introduction: Mediterranean climate—Background information. In The Climate of the Mediterranean Region: From the Past to the Future; Elsevier: Amsterdam, The Netherlands, 2012; pp. xxxv–xc. [Google Scholar]
  40. Bolle, H.J. Climate, climate variability, and impacts in the Mediterranean area: An overview. Mediterr. Clim. 2003, 5–86. [Google Scholar]
  41. Funk, C.; Peterson, P.; Landsfeld, M.; Pedreros, D.; Verdin, J.; Shukla, S.; Husak, G.; Rowland, J.; Harrison, L.; Hoell, A.; et al. The climate hazards infrared precipitation with stations—A new environmental record for monitoring extremes. Sci. Data 2015, 2, 1–21. [Google Scholar] [CrossRef] [Green Version]
  42. Dembélé, M.; Zwart, S.J. Evaluation and comparison of satellite-based rainfall products in Burkina Faso, West Africa. Int. J. Remote Sens. 2016, 37, 3995–4014. [Google Scholar] [CrossRef] [Green Version]
  43. Xu, W.; Zou, Y.; Zhang, G.; Linderman, M. A comparison among spatial interpolation techniques for daily rainfall data in Sichuan Province, China. Int. J. Climatol. 2015, 35, 2898–2907. [Google Scholar] [CrossRef]
  44. Bai, L.; Shi, C.; Li, L.; Yang, Y.; Wu, J. Accuracy of CHIRPS satellite-rainfall products over mainland China. Remote Sens. 2018, 10, 362. [Google Scholar] [CrossRef] [Green Version]
  45. Helmi, A.M.; Abdelhamed, M.S. Evaluation of CMORPH, PERSIANN-CDR, CHIRPS V2. 0, TMPA 3B42 V7, and GPM IMERG V6 Satellite Precipitation Datasets in Arabian Arid Regions. Water 2022, 15, 92. [Google Scholar] [CrossRef]
  46. Wilks, D.S. Statistical Methods in the Atmospheric Sciences; Academic Press: Cambridge, MA, USA, 2019; p. 100. [Google Scholar]
  47. Prat, O.P.; Barros, A.P. Assessing satellite-based precipitation estimates in the Southern Appalachian mountains using rain gauges and TRMM PR. Adv. Geosci. 2010, 25, 143–153. [Google Scholar] [CrossRef] [Green Version]
  48. Fang, J.; Yang, W.; Luan, Y.; Du, J.; Lin, A.; Zhao, L. Evaluation of the TRMM 3B42 and GPM IMERG products for extreme precipitation analysis over China. Atmos. Res. 2019, 223, 24–38. [Google Scholar] [CrossRef]
  49. Ide, T. Climate war in the Middle East? Drought, the Syrian civil war and the state of climate-conflict research. Curr. Clim. Change Rep. 2018, 4, 347–354. [Google Scholar] [CrossRef]
  50. Moravec, V.; Markonis, Y.; Rakovec, O.; Svoboda, M.; Trnka, M.; Kumar, R.; Hanel, M. Europe under multi-year droughts: How severe was the 2014–2018 drought period? Environ. Res. Lett. 2021, 16, 034062. [Google Scholar] [CrossRef]
  51. Gao, F.; Zhang, Y.; Ren, X.; Yao, Y.; Hao, Z.; Cai, W. Evaluation of CHIRPS and its application for drought monitoring over the Haihe River Basin, China. Nat. Hazards 2018, 92, 155–172. [Google Scholar] [CrossRef]
  52. Nicholson, S.E. Dryland Climatology; Florida State University: Tallahassee, FL, USA, 2011. [Google Scholar]
  53. Geleta, C.D.; Deressa, T.A. Evaluation of climate hazards group infrared precipitation station (CHIRPS) satellite-based rainfall estimates over Finchaa and Neshe Watersheds, Ethiopia. Eng. Rep. 2021, 6, 12338. [Google Scholar] [CrossRef]
  54. Hsu, J.; Huang, W.R.; Liu, P.Y.; Li, X. Validation of CHIRPS precipitation estimates over Taiwan at multiple timescales. Remote Sens. 2021, 13, 254. [Google Scholar] [CrossRef]
  55. Upadhyay, S.; Silwal, P.; Prajapati, R.; Talchabhadel, R.; Shrestha, S.; Duwal, S.; Lakhe, H. Evaluating magnitude agreement and occurrence consistency of CHIRPS product with ground-based observations over medium-sized river basins in Nepal. Hydrology 2022, 9, 146. [Google Scholar] [CrossRef]
  56. Middleton, N.J.; Sternberg, T. Climate hazards in drylands: A review. Earth-Sci. Rev. 2013, 126, 48–57. [Google Scholar] [CrossRef]
  57. Chen, C.; Li, Z.; Song, Y.; Duan, Z.; Mo, K.; Wang, Z.; Chen, Q. Performance of multiple satellite precipitation estimates over a typical arid mountainous area of China: Spatiotemporal patterns and extremes. J. Hydrometeorol. 2020, 21, 533–550. [Google Scholar] [CrossRef]
  58. Duan, Y.; Barros, A.P. Understanding how low-level clouds and fog modify the diurnal cycle of orographic precipitation using in situ and satellite observations. Remote Sens. 2017, 9, 920. [Google Scholar] [CrossRef] [Green Version]
  59. Speirs, P.; Gabella, M.; Berne, A. A comparison between the GPM dual-frequency precipitation radar and ground-based radar precipitation rate estimates in the Swiss Alps and Plateau. J. Hydrometeorol. 2017, 18, 1247–1269. [Google Scholar] [CrossRef]
  60. Maggioni, V.; Meyers, P.C.; Robinson, M.D. A review of merged high-resolution satellite precipitation product accuracy during the Tropical Rainfall Measuring Mission (TRMM) era. J. Hydrometeorol. 2016, 17, 1101–1117. [Google Scholar] [CrossRef]
  61. Kirstetter, P.E.; Hong, Y.; Gourley, J.J.; Schwaller, M.; Petersen, W.; Zhang, J. Comparison of TRMM 2A25 products, version 6 and version 7, with NOAA/NSSL ground radar–based National Mosaic QPE. J. Hydrometeorol. 2013, 14, 661–669. [Google Scholar] [CrossRef] [Green Version]
  62. Arulraj, M.; Barros, A.P. Improving quantitative precipitation estimates in mountainous regions by modelling low-level seeder-feeder interactions constrained by Global Precipitation Measurement Dual-frequency Precipitation Radar measurements. Remote Sens. Environ. 2019, 231, 111213. [Google Scholar] [CrossRef]
Figure 1. Location of the Barada Basin, Syria, and spatial distribution of rain gauges over the basin.
Remotesensing 15 01778 g001
Figure 2. Pentad time series comparison between CHIRPS product precipitation estimates and in-situ precipitation measurements between 2010 and 2019, at (A) inland part and (B) highland part.
Remotesensing 15 01778 g002
Figure 3. Accuracy statistics results of daily events based on the classification in Table 5.
Remotesensing 15 01778 g003
Figure 4. Comparison of CHIRPS monthly precipitation estimates (red boxplots) and in-situ monthly precipitation (blue boxplots). (A) Inland average monthly comparison, (B) Highland average monthly comparison.
Remotesensing 15 01778 g004
Figure 5. Monthly time series comparison between CHIRPS product precipitation estimates and in-situ precipitation measurements between 2000 and 2019, at (A) inland part and (B) highland part.
Remotesensing 15 01778 g005
Figure 6. Shows results of the accuracy statistics (A) ME, (B) MAE, (C) RMSE, (D) PB%, and (E) r. The comparison is between CHIRPS estimates to the in-situ dataset for each month in the Barada Basin from 2000 to 2020. Red lines indicate the optimal values. Grey highlighting indicates the rainy season. In (E), for better visualization of r values, we made the upper limit 0.9 (the optimal value of r is 1) as all r values were under 0.8. (F) Represent the sample count at every month that used to calculate the monthly accuracy statistics.
Remotesensing 15 01778 g006
Figure 7. Seasonal boxplot comparison between in-situ and CHIRPS precipitation in the Barada Basin. Wet is the accumulation of rainy months from October to the end of March. Dry is the accumulation of dry months from April to the end of September.
Remotesensing 15 01778 g007
Figure 8. Accuracy statistics results at the seasonal scale in the Barada Basin between 2000 and 2020. Red lines indicate ideal values. Wet season is the accumulation of rainy months from October to end of March. Dry season is the accumulation of dry months from April to the end of September.
Remotesensing 15 01778 g008
Figure 9. Composite plot of annual time series with corresponding accuracy statistics. (A) Inland, (B) Highland.
Remotesensing 15 01778 g009
Table 1. The geographical and climatological characteristics of the rain gauges used in the Barada Basin.
Rain GaugeLatitudeLongitudeElevationsM.A.P *MissingES **ClimateLocation
DA ***33°24″36°30″61616017%3409Hot steppeInland
Douma33°24″36°24″65516718%3377Hot steppeInland
Barzh33°33″36°18″84217017%3429Hot steppeInland
Qasioun33°32″36°17″105027717%3430Hot steppeInland
Aqraba33°26″36°22″65914317%3417Hot steppeInland
Al Hijaz33°30″36°17″70015617%3409Hot steppeInland
Al Mazzeh33°30″36°14″74520018%3367Hot steppeInland
Al Zabadani33°41″36°06″11505407%6529Cold steppeHighland
Bloudan33°44″36°08″15502057%6541Cold steppeHighland
Serghaya33°48″36°09″14505862%6835Cold steppeHighland
Huraira33°36″36°11″16004906%6498Cold steppeHighland
Madaya33°41″36°08″13005108%6467Cold steppeHighland
* M.A.P = Mean Annual Precipitation (mm/year), ** ES = Effective sample (the original sample minus the missing measurements).*** DA = Damascus Airport gauge.
Table 2. Accuracy statistics equations used in the pairwise comparisons between CHIRPS and in-situ data.
Statistical MetricEquationOptimal Value
Pearson correlation coefficient r =   ( G G ¯ ) ( C C ¯ ) ( G G ¯ ) 2 ( C C ¯ ) 2 1
Mean Error M E = 1 N   ( C G ) 0
Mean Absolute Error M A E = 1 N     ( | C G | ) 0
Root-Mean-Square Error R M S E = 1 N ( C G ) 2 0
Percent Bias P B = 100   ( C G )   G 0
G: gauge precipitation measurement, G ¯ : average in-situ precipitation measurement, C: CHIRPS-based precipitation estimates, C ¯ : average CHIRPS-based precipitation estimates, and N: number of data pairs.
Table 3. The formulas of categorical statistics used in analyzing the detection skill of CHIRPS estimates (based on ref. [46]).
SkillCategoric StatisticFormula
Overall AccuracyPercent Correct (PC) P C = A   +   C T o t a l
DiscriminationProbability of Detection (POD) P O D = A A   +   C
ReliabilityFalse Alarm Ratio (FAR) F A R = B A   +   B
AccuracyThreat score (TS) TS = A A   +   B   +   C
BiasFrequency Bias (FB) F B = A   +   B A   +   C
A = the number of hits (precipitation events detected by both CHIRPS and in-situ gauges). B = false alarms (precipitation events detected by CHIRPS but not by in-situ gauges). C = the number misses (precipitation events detected by in-situ gauges but not by CHIRPS).
Table 4. The results of categorical statistics for all gauges in the Barada Basin.
Rain GaugePODFARBIASTSPCSample CountClimateLocation
DA *0.250.720.90.150.863409Hot steppeInland
Douma0.270.751.120.150.873377Hot steppeInland
Barzh0.240.730.930.140.863429Hot steppeInland
Qasioun0.240.70.830.150.863430Hot steppeInland
Aqraba0.240.761.030.130.873417Hot steppeInland
Al Hijaz0.250.720.90.150.863409Hot steppeInland
Al Mazzeh0.240.730.920.140.873367Hot steppeInland
Al Zabadani0.160.710.590.110.86529Cold steppeHighland
Bloudan0.170.720.60.110.816541Cold steppeHighland
Serghaya0.160.70.550.110.856835Cold steppeHighland
Huraira0.160.720.60.110.816498Cold steppeHighland
Madaya0.160.720.590.110.816467Cold steppeHighland
* DA = Damascus Airport gauge.
Table 5. Classification of precipitation events from all stations (12 stations) in the Barada Basin between 2010 and 2020.
Event CategoryClassificationInland%Inland SampleHighland%Highland Sample
<5 mmSmall67%145851.5%2530
5–15Light24%51630%1425
15–30Medium6%13713%635
30–50Medium strong2.5%535%266
50–70Strong0.3%70.4%50
>70 mmHeavy0.2%30.1%9
Disclaimer/Publisher’s Note: The statements, opinions and data contained in all publications are solely those of the individual author(s) and contributor(s) and not of MDPI and/or the editor(s). MDPI and/or the editor(s) disclaim responsibility for any injury to people or property resulting from any ideas, methods, instructions or products referred to in the content.

