Article

Quantifying the Effects of Climate Change and Revegetation on Erosion-Induced Lateral Soil Organic Carbon Loss on the Chinese Loess Plateau

1
Key Laboratory of Soil and Water Conservation on the Loess Plateau, Ministry of Water Resources, Yellow River Institute of Hydraulic Research, Zhengzhou 450003, China
2
Institute of Soil and Water Conservation, Northwest Agriculture & Forestry University, Yangling 712100, China
3
Henan Yellow River Engineering and Consulting Company Limited, Zhengzhou 450003, China
4
Institute of Soil and Water Conservation, Chinese Academy of Sciences and Ministry of Water Resources, Yangling 712100, China
*
Author to whom correspondence should be addressed.
Remote Sens. 2023, 15(7), 1775; https://doi.org/10.3390/rs15071775
Submission received: 3 February 2023 / Revised: 15 March 2023 / Accepted: 17 March 2023 / Published: 26 March 2023

Abstract

:
Erosion-induced soil organic carbon (SOC) loss substantially affects the redistribution of global organic carbon. The Chinese Loess Plateau, the most severely eroded region on Earth, has experienced notable soil erosion mitigation over the last few decades, making it a hotspot for soil erosion studies. However, the overall rate of SOC loss and spatiotemporal evolution under changing environments remain unclear. In this study, we investigated SOC loss from 1982 to 2015 in the severely eroded Hetong region of the Chinese Loess Plateau by combining the Revised Universal Soil Loss Equation (RUSLE) model and the localized enrichment ratio function derived from field observations and attributed the changes in SOC loss to climate- and human-induced vegetation changes. The results showed that SOC loss in the Hetong region was 64.73 t·km−2·yr−1, 16.79 times higher than the global average. Over the past 34 years, SOC loss decreased by 23.84%, with a total reduction of more than 105.64 Tg C since the change-point year. Moreover, our study found that vegetation changes dominated the changes in SOC loss in the Hetong region, contributing 89.67% of the total reduction in SOC loss in the Hetong region. This study can inform carbon accounting and sustainable catchment management in regions that have experienced large-scale ecological restoration.

1. Introduction

Soil is the largest organic carbon pool in terrestrial ecosystems [1,2,3], stored over 1550 Pg of carbon, more than twice that of the atmosphere [4]. Soil erosion is one of the most common environmental problems worldwide [5,6], whereby soil particles, soil aggregates, and the attached SOC are removed from their primary locations [7]. Approximately 30–100 Pg of soil is eroded globally each year [8], and the effects of SOC loss on global carbon cycling are well recognized [9,10]. Soil erosion dominates the exports of organic carbon from the terrestrial biosphere [11], and the limited information on soil erosion could lead to the overestimation of regional SOC accumulation [12]. However, SOC loss induced by soil erosion has not been adequately accounted for when estimating terrestrial carbon sources and sinks [13].
Lateral loss of SOC is a result of changes in several environmental factors, including climate, geomorphology, soil, and land use, which result in the lateral movement of carbon [14,15]. For example, it was reported that lateral movement of organic carbon from land to water in northern Europe increased annually by 1.4% 1990 to 2013 [16]. Because of anthropogenic activity, the lateral transport of organic carbon has increased by 1.0 ± 0.5 Gt annually since pre-industrial times [17]. Hilton [18] reported that climate regulated the SOC exported from the terrestrial ecosystem to the hydrosphere by controlling the runoff-driven soil erosion processes, and that particle carbon discharge increased by 4% with a 1% increase in annual runoff. Therefore, understanding how environmental factors affect lateral carbon movement is important for regional carbon accounting and management.
Study of spatiotemporal variations of lateral carbon movement and their responses to environment changes were still very challenging, mainly due to the shortage of ground-based observational data [19]. In recent decades, remote sensing has been proven to be an excellent tool to monitor carbon processes, but lateral carbon movement could not be directly monitored by remote sensing. However, remote sensing can provide extensive data for a number of variables at regional scale and support ecological models [20]. Thus, the integration of remote sensing and modelling could be a promising way to address the challenge in investigating the lateral carbon movement at the regional scale [20].
Chinese Loess Plateau is one of the most severely eroded regions worldwide, making the Yellow River the most sediment-laden river globally, with more than 1.6 Pg of sediment having been delivered each year from 1919–1959 [21], contributing approximately 6% of the global land-to-ocean sediment flux [22]. The Hetong region of the Chinese Loess Plateau is the predominant sediment source, providing nearly 90% for the Yellow River [23]. Severe soil erosion in the Hetong region has made it popular for global SOC loss studies because the associated eroded soil particles contain SOC. In recent decades, the environment in the Hetong region has changed considerably, primarily because of land surface changes dominated by large-scale ecological restoration and global climate change [24,25]. The notable environmental changes that have led to the alleviation of soil erosion in the Hetong region have been recognized by many researchers [26]. However, the magnitude of SOC loss in the Hetong region is still unclear, and temporal changes in SOC loss under notable ecological restoration has rarely been reported. To address this deficit, the objectives of this study were to: (1) estimate the amount of SOC eroded from the Hetong region and investigate its spatiotemporal changes over the last three decades; and (2) quantify the effects of vegetation and climate change to the temporal changes in SOC loss.

2. Materials and Methods
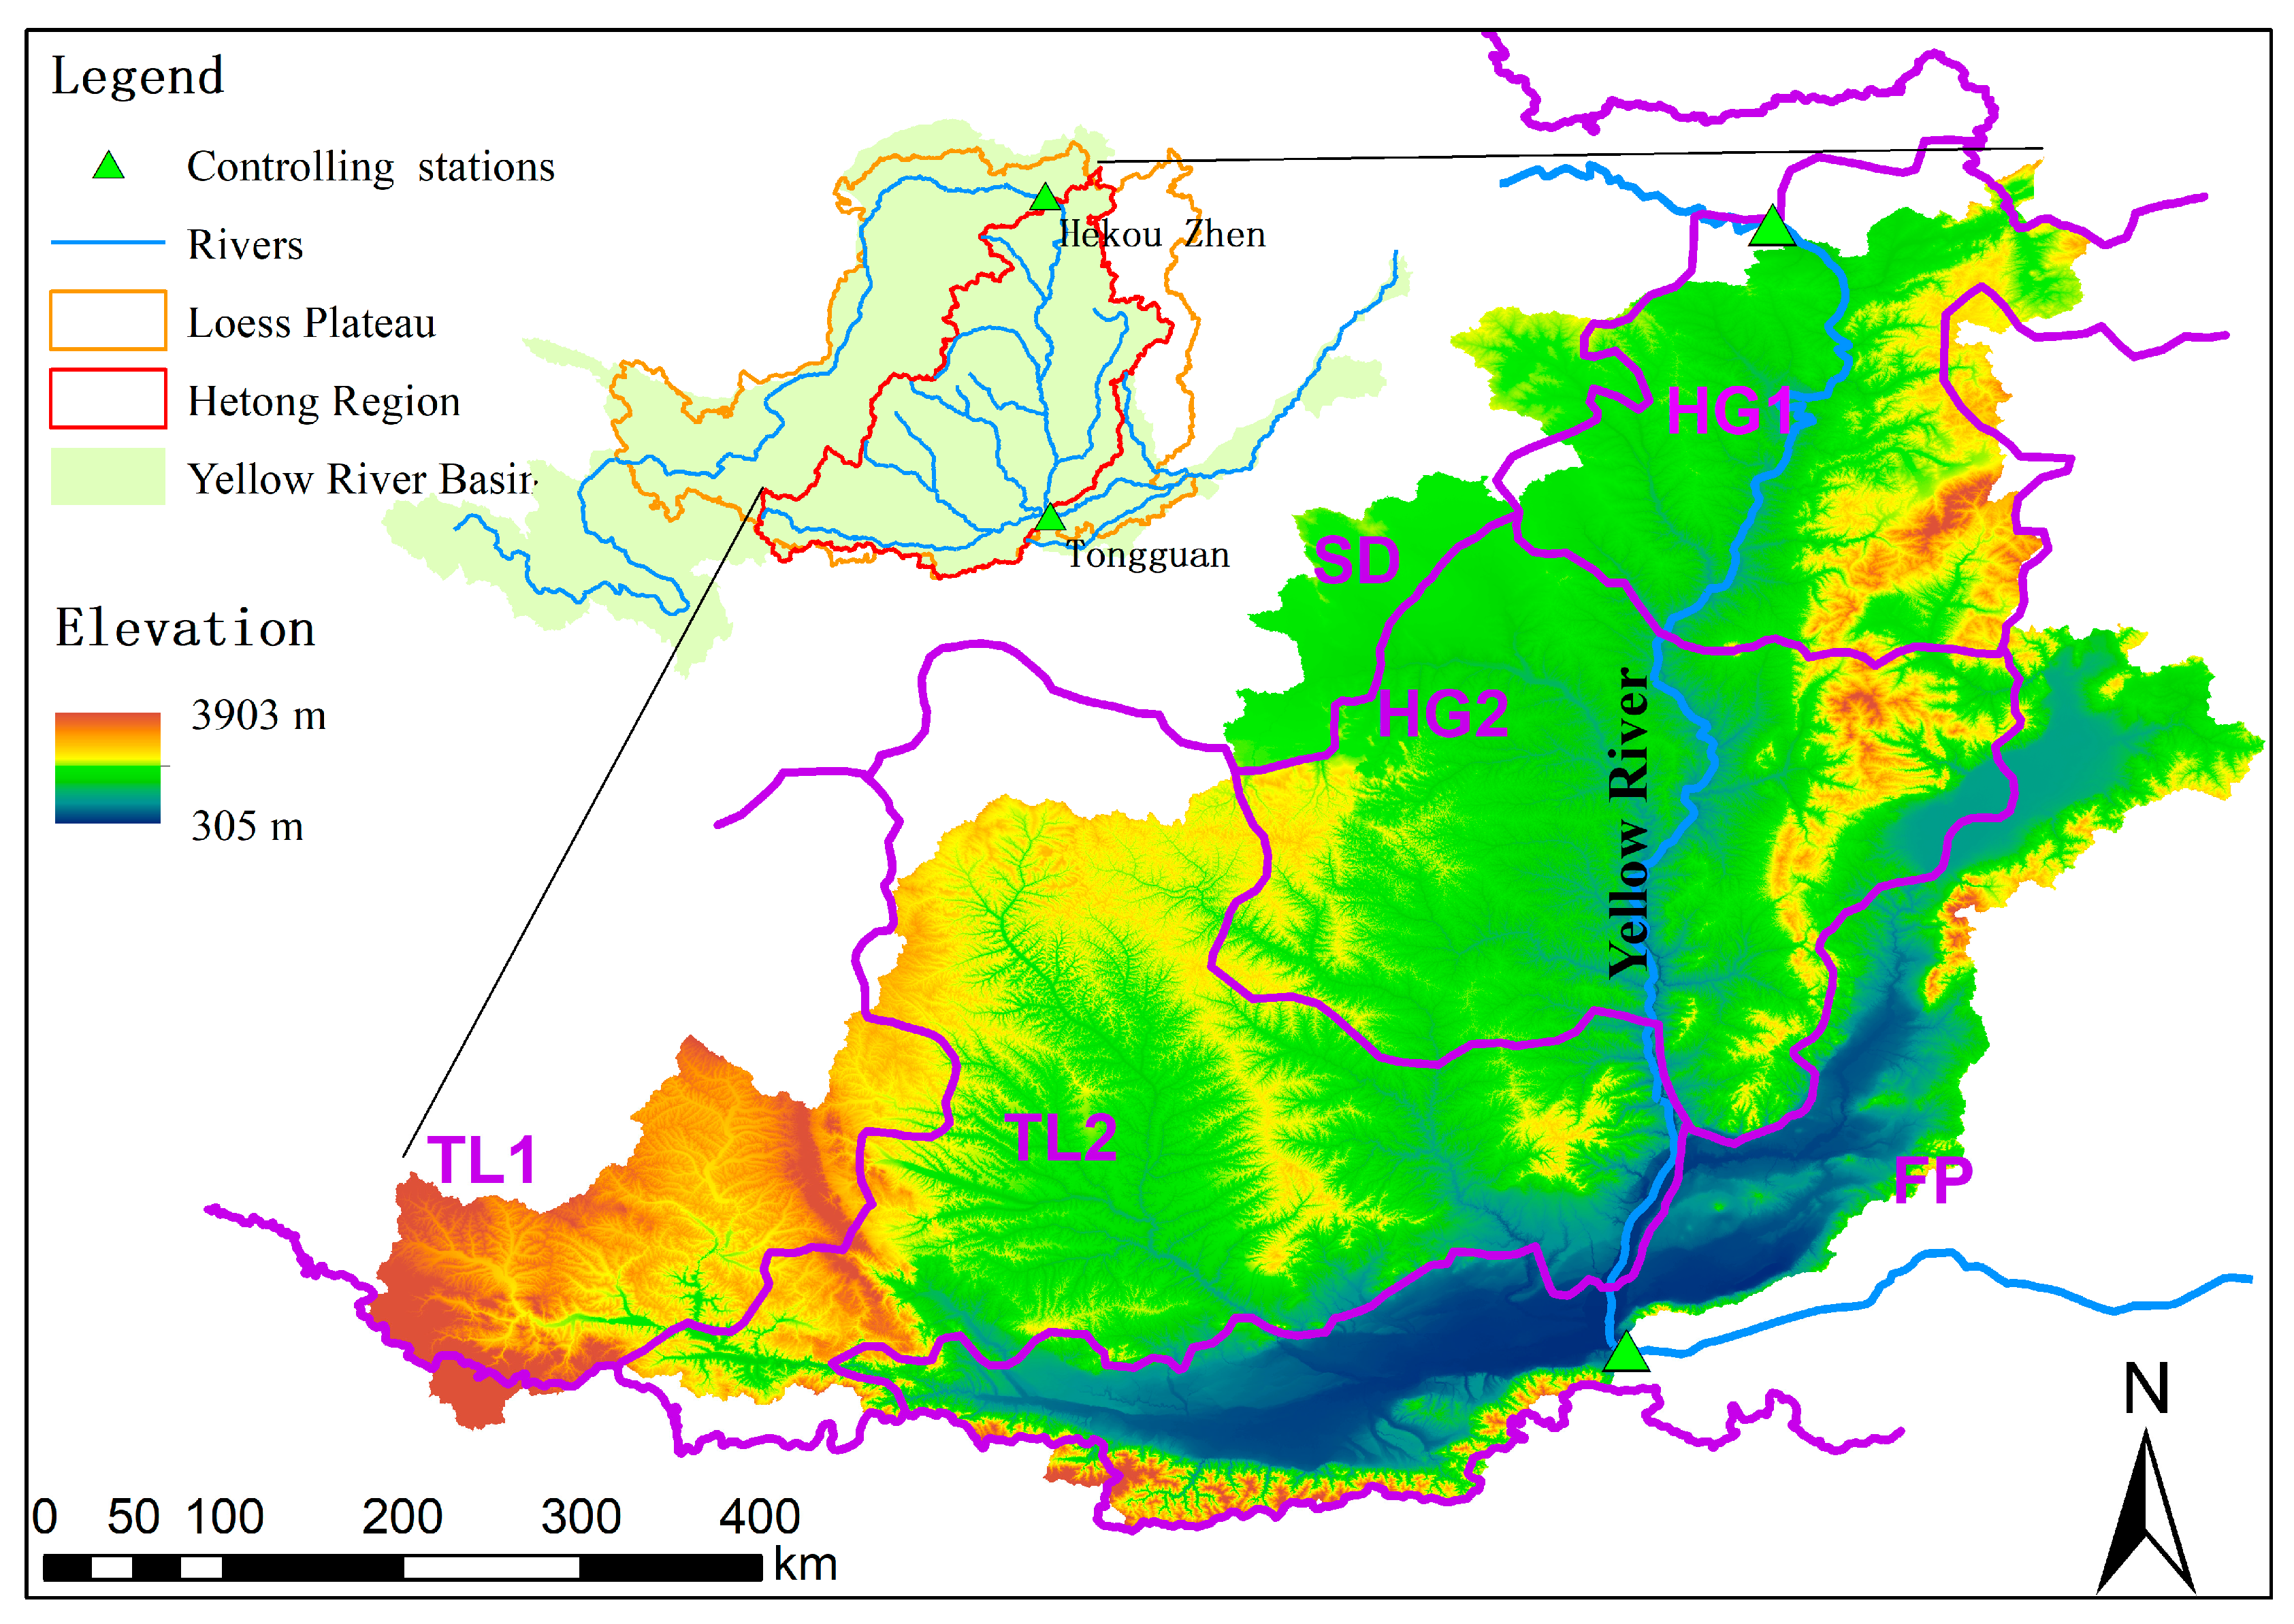
2.1. Study Area

The Hetong region, is located between the two controlling gaging stations on the Yellow River mainstream, Toudaoguai and Tongguan station, covering an area of 282,530 km2 in five provinces in northwestern China, Ningxia, Inner Mongolia, Shanxi, Gansu, and Shaanxi (Figure 1). Annual precipitation in the Hetong region ranges from 300 mm in the northwest to approximately 800 mm in the southeast, and more than half of the annual precipitation falls with high intensity during the wet season [27,28]. The high-erosivity rainfalls, and the low vegetation coverage had made the Hetong region one of the most eroded regions in the world, contributing nearly 90% of the total sediment load in the Yellow River mainstream. During the past decades, a large number of ecological restoration programs had been implemented in the Hetong region, making it the most successful ecological restoration area in China. In this study, we divided the whole Hetong region into six sub-regions referring to the ecological regionalization study by Yang et al. [29], including the sand sub-region (SD), two loess hilly gully sub-regions (HG1 and HG1), two loess tableland sub-regions (TL1 and TL2), and the floodplain sub-region (FP) (Figure 1).

2.2. Method

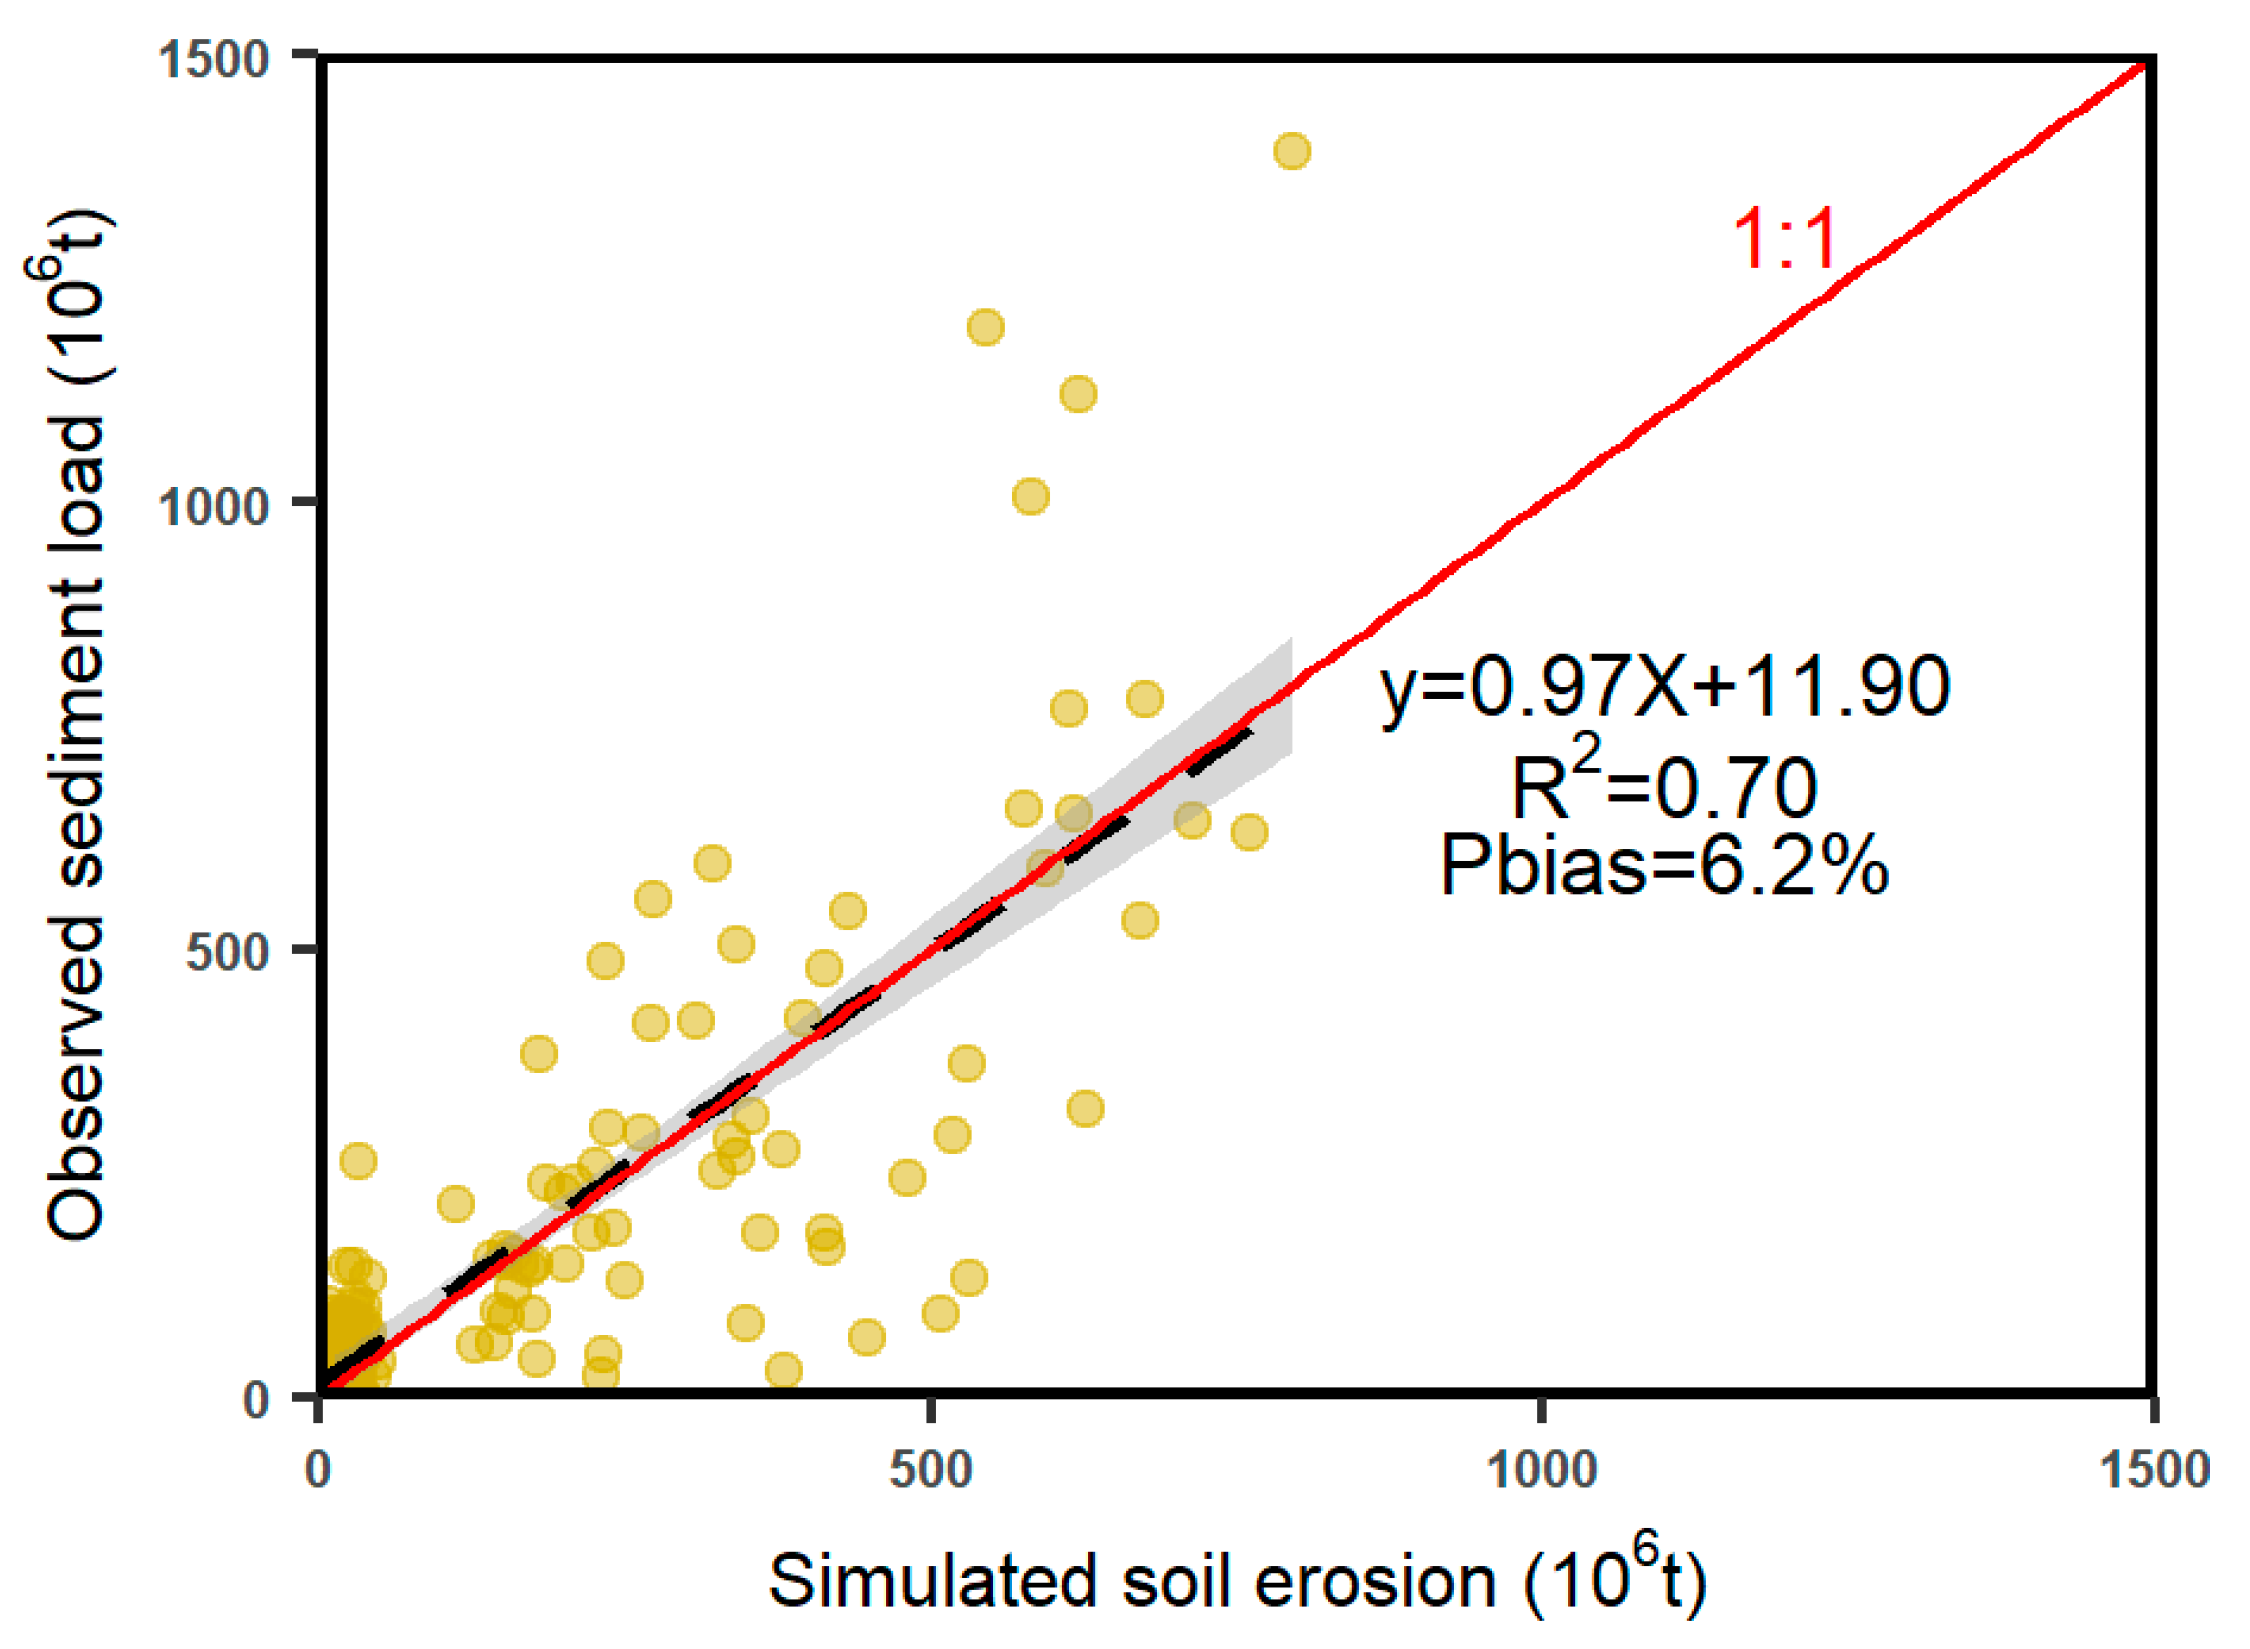
2.2.1. Soil Erosion Estimation

In this study, the Revised Universal Soil Loss Equation (RUSLE), having been previously validated and widely used on the Chinese Loess Plateau [30], has been adopted for estimating soil erosion over the past 34 years. Rainfall erosivity was estimated using the rainfall erosivity model proposed by Xie [31], and the gridded daily precipitation dataset (CRU TS v4.02) was used to generate the spatially distributed rainfall erosivity factor (R). However, the gridded dataset should be adjusted when estimating annual rainfall erosivity due to the differences between gridded data and gauge data [32]. Thus, the correction method for calculating the R-factor proposed by Wang et al. [33] was used in this study. Soil erodibility factor (K), was calculated by the erosion/productivity impact calculator (EPIC) model based on the soil texture provided by the global gridded soil information dataset World Soil Information Service (WoSIS) [34]. Slope length and steepness factor, LS, was calculated using the elevation data extracted from the Global Land One km Base Elevation Project. Land use map extracted from the China’s multi-period land use and land cover remote sensing monitoring data set (CNLUCC) [35] was used to calculate the conservation support practice factor, P [36]. The most sensitive factor influencing soil erosion, vegetation cover factor (C), was calculated using the fraction of vegetation coverage (FVC) derived from satellite-based NDVI [36].

2.2.2. SOC Loss Estimation

The SOC loss ( E S O C ) can be estimated as follows:
E S O C = E s o i l × C o n c s e d 1000
where  E S O C  is the estimated SOC loss intensity, t⸱km−2⸱yr−1 E s o i l  is the estimated soil erosion per unit area, t⸱km−2⸱yr−1, and  C o n c s e d  is the concentration of SOC in the sediment, g⸱kg−1.
The SOC concentration in the sediment is higher than that in the topsoil because of the preferential transport of SOC during the selective process of soil particles [37,38]. Thus, the concentration of SOC in the eroded soil is the combined result of the SOC concentration of the topsoil and the enrichment processes during soil erosion, which can be calculated as follows:
C o n c s e d = E R × C o n c s o i l
where  C o n c s o i l  is the concentration of SOC in the topsoil, g⸱kg−1, and  E R  is the dimensionless enrichment ratio. In this study, the  C o n c s o i l  was derived from the global gridded soil information dataset World Soil Information Service (WoSIS) SOC [34], which has been widely adopted. We assessed the gridded SOC dataset by comparing WoSIS SOC with 805 in situ observations derived from an open access database [39] (Figure 2). The estimated SOC generally matched well with the observations, and most of the estimation–observation points were around the 1:1 line, with |P-bias| ≤ 18.7% and R2 ≥ 0.58, indicating that SOC derived from the WoSIS dataset can be used for further study.
The ratio of SOC concentration in the eroded soil to that in the topsoil is ER, reflecting the fact that SOC in the topsoil is preferentially eroded. Many studies have reported that the ER is closely related to the soil erosion intensity ( E s o i l ) [40,41], and the power function between the soil erosion intensity and the ER value is the most widely used formula, which can be expressed as:
E R = a × E s o i l b
where  a   and   b  are the dimensionless parameters. The two parameters in the ER calculation are usually considered constant because of the limited observations, such as the default values of ER calculation methods in the SWAT and CREAMS models. In this study, we collected SOC loss and corresponding SOC quantity observations in the Hetong region under different land surface conditions ascribed by Jia [42], Deng [43], and Li [44], covering three different land use types, namely, cropland, grassland, and forest, and nine slope ranges between 4° and 30°. Thus, ER in this study was estimated as follows:
E R = 14.68 × E s o i l 0.267

2.3. Attributing the Change in SOC Loss and Statistical Analysis

Because it is relatively simple, highly visual, and practical, the widely used double-mass curve (DMC) method was applied to separate the influence of climate change and human activities on changes in SOC loss [45]. In this study, the DMC method was applied to each grid to determine the influence of both climate- and human-induced vegetation changes (Appendix A.1). The nonparametric median-cased linear model proposed by Sen [46] was adopted to estimate the change trend (Appendix A.2), and the nonparametric method developed by Pettitt [47] was used to detect the change-point (Appendix A.3).

3. Results

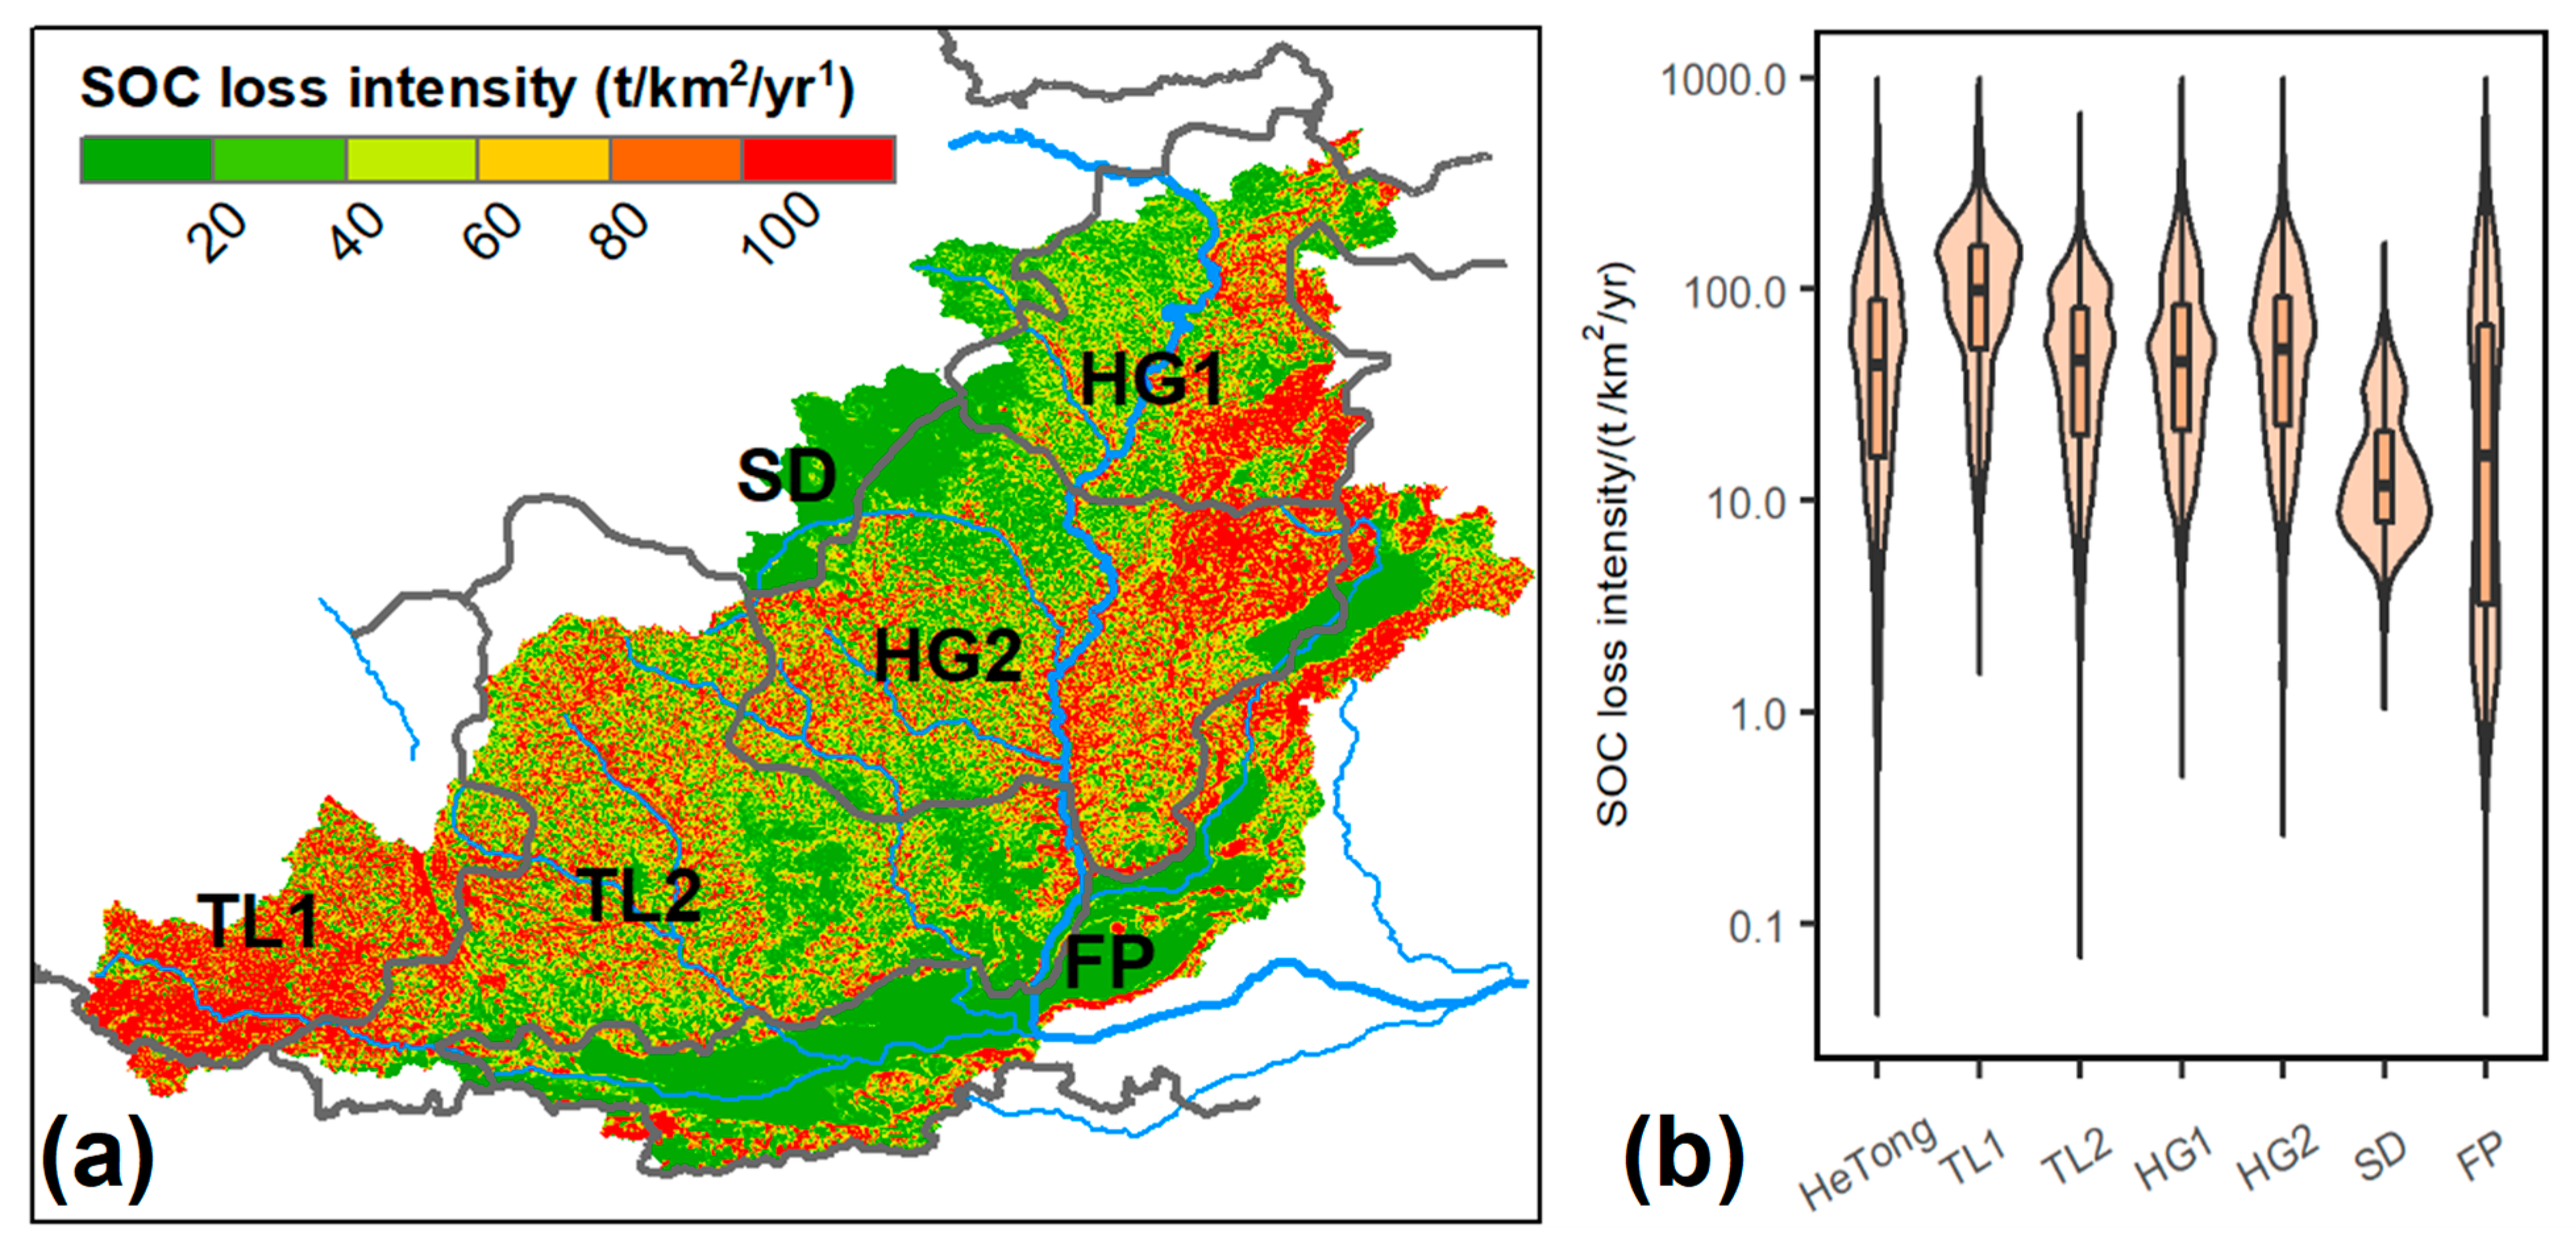
3.1. The Spatial Patterns of SOC Loss

As shown in Figure 3a, mean annual SOC loss ranged from 0.68 to 344.34 t⸱km−2⸱yr−1, with an average value of 64.73 t⸱km−2⸱yr−1 for the entire region. On average, approximately 18.29 Tg C is eroded from the Hetong region annually, but there is high inter-annual variation, which ranges from 10.16 to 28.33 Tg C⸱yr−1. Figure 3b shows a comparison of the intensity of SOC loss in different sub-regions. Statistical analysis showed that there were significant differences in SOC loss intensity between the six sub-regions (i.e., TL1, TL2, HG1, HG2, SD, and FP). The mean annual SOC loss intensity for the six sub-regions was 116.60, 55.93, 66.26, 67.35, 16.85, and 57.44 t⸱km−2⸱yr−1, respectively, with the most severe SOC loss taking place in the TL1 region.

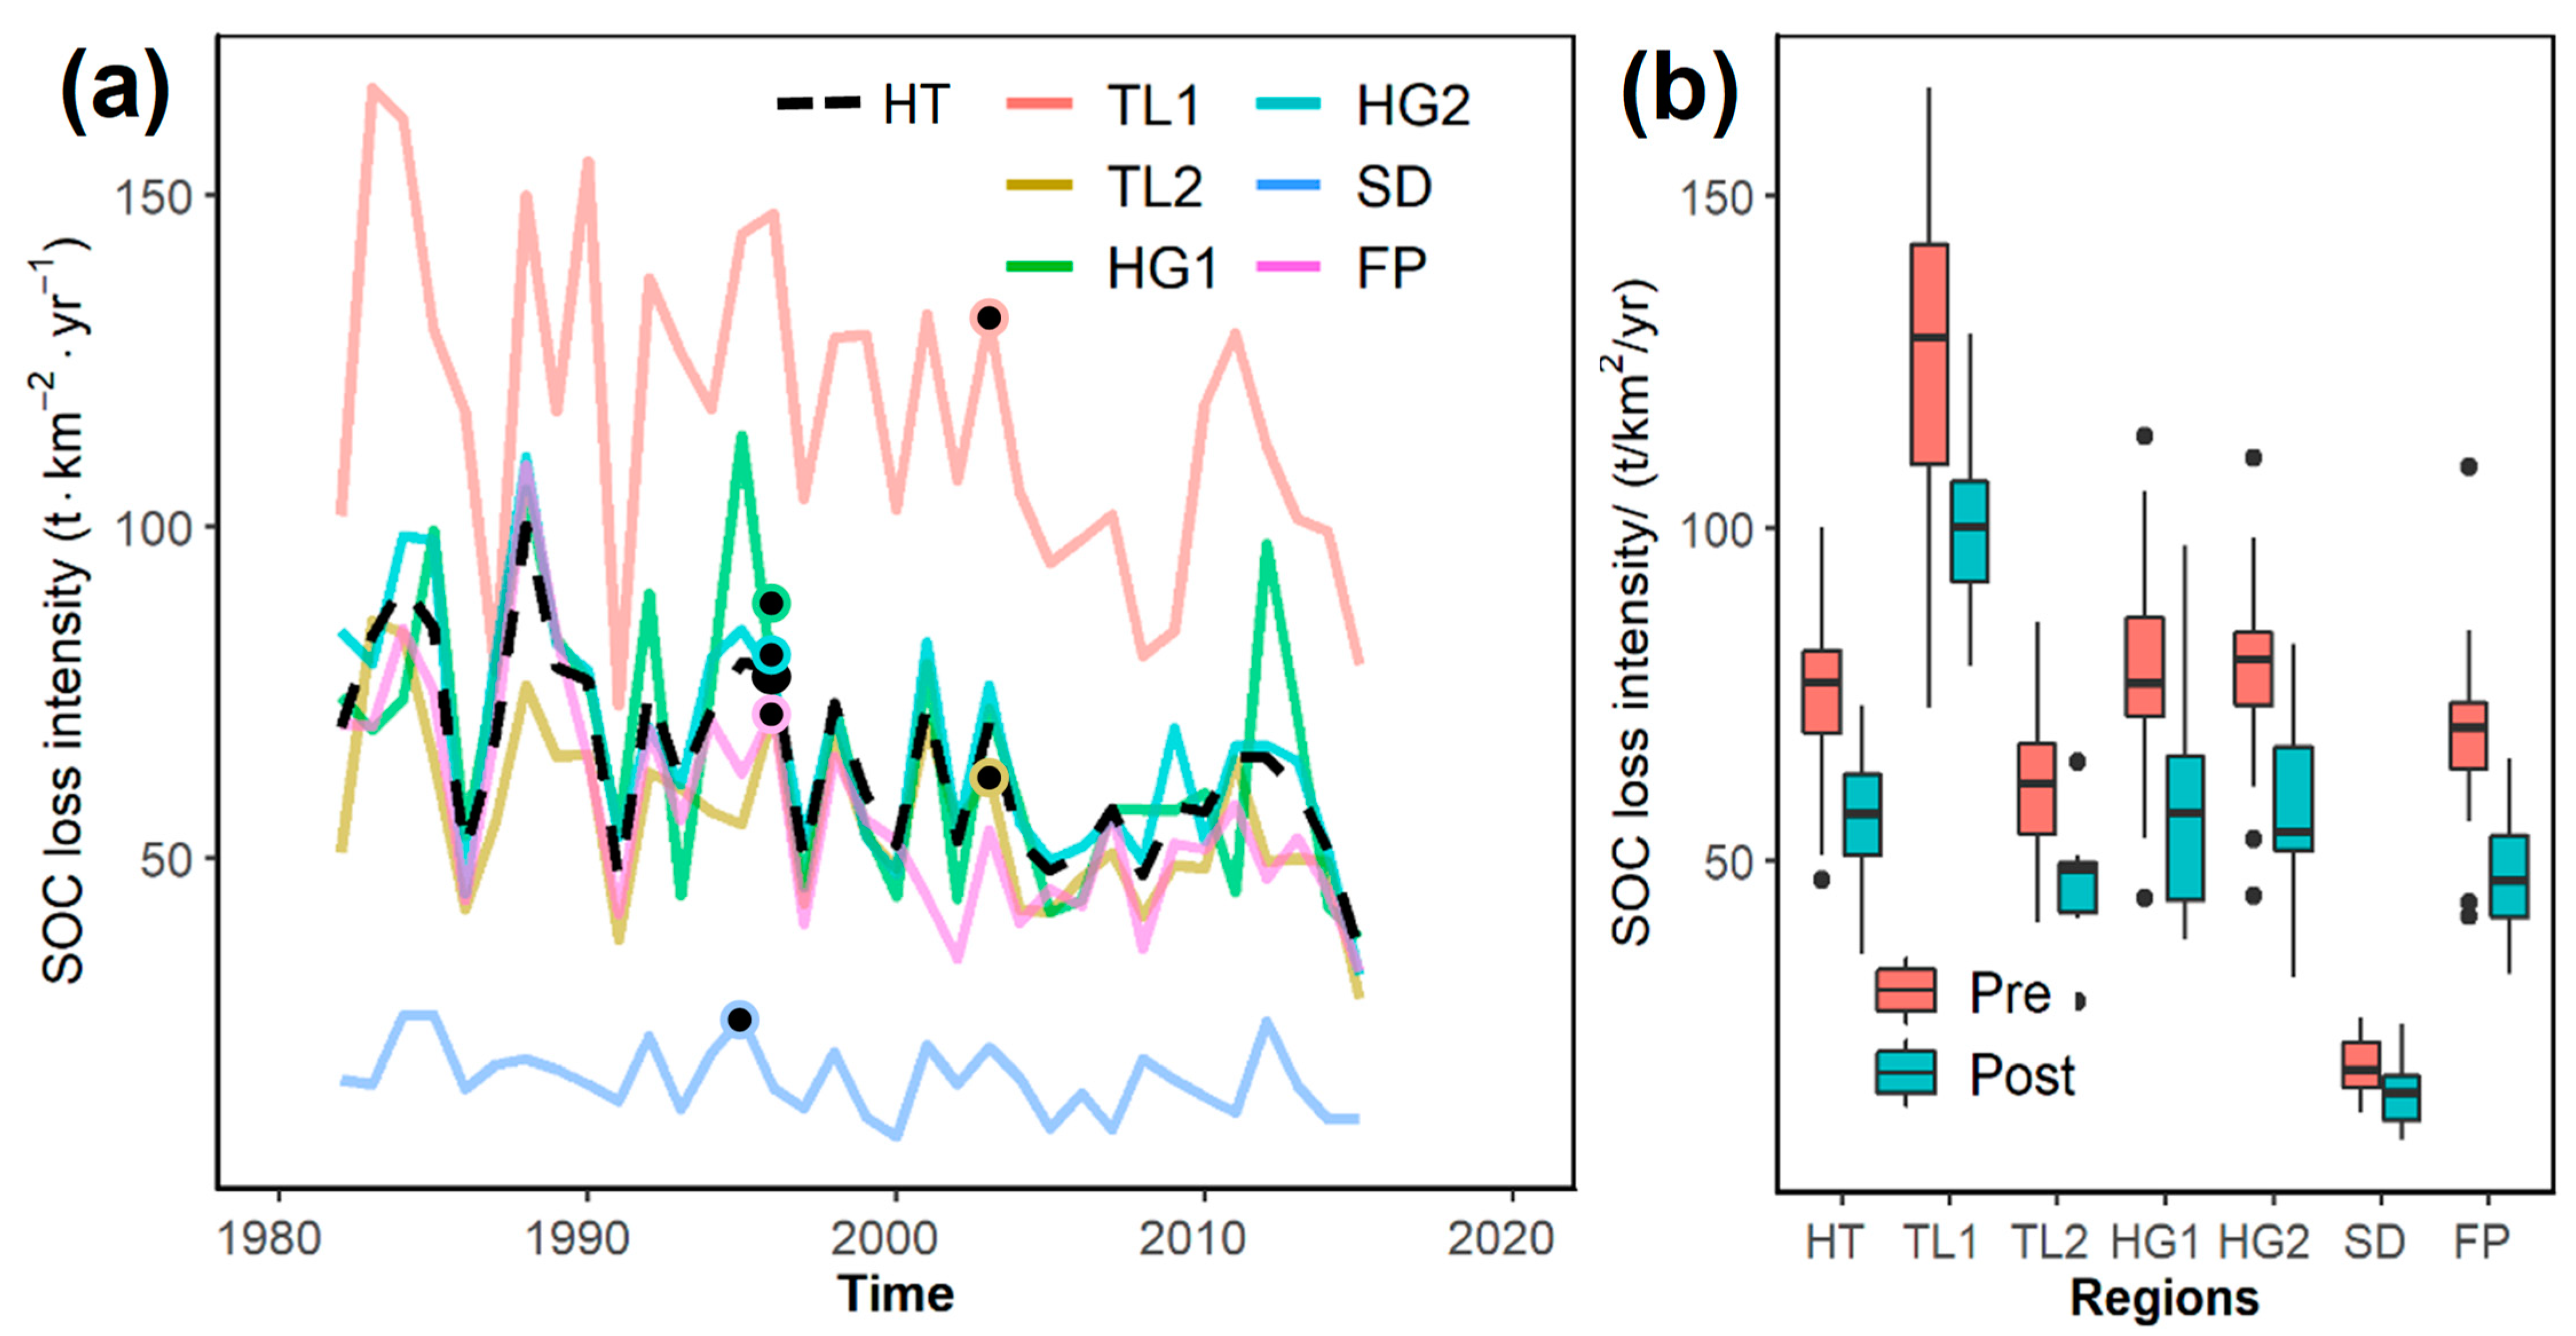
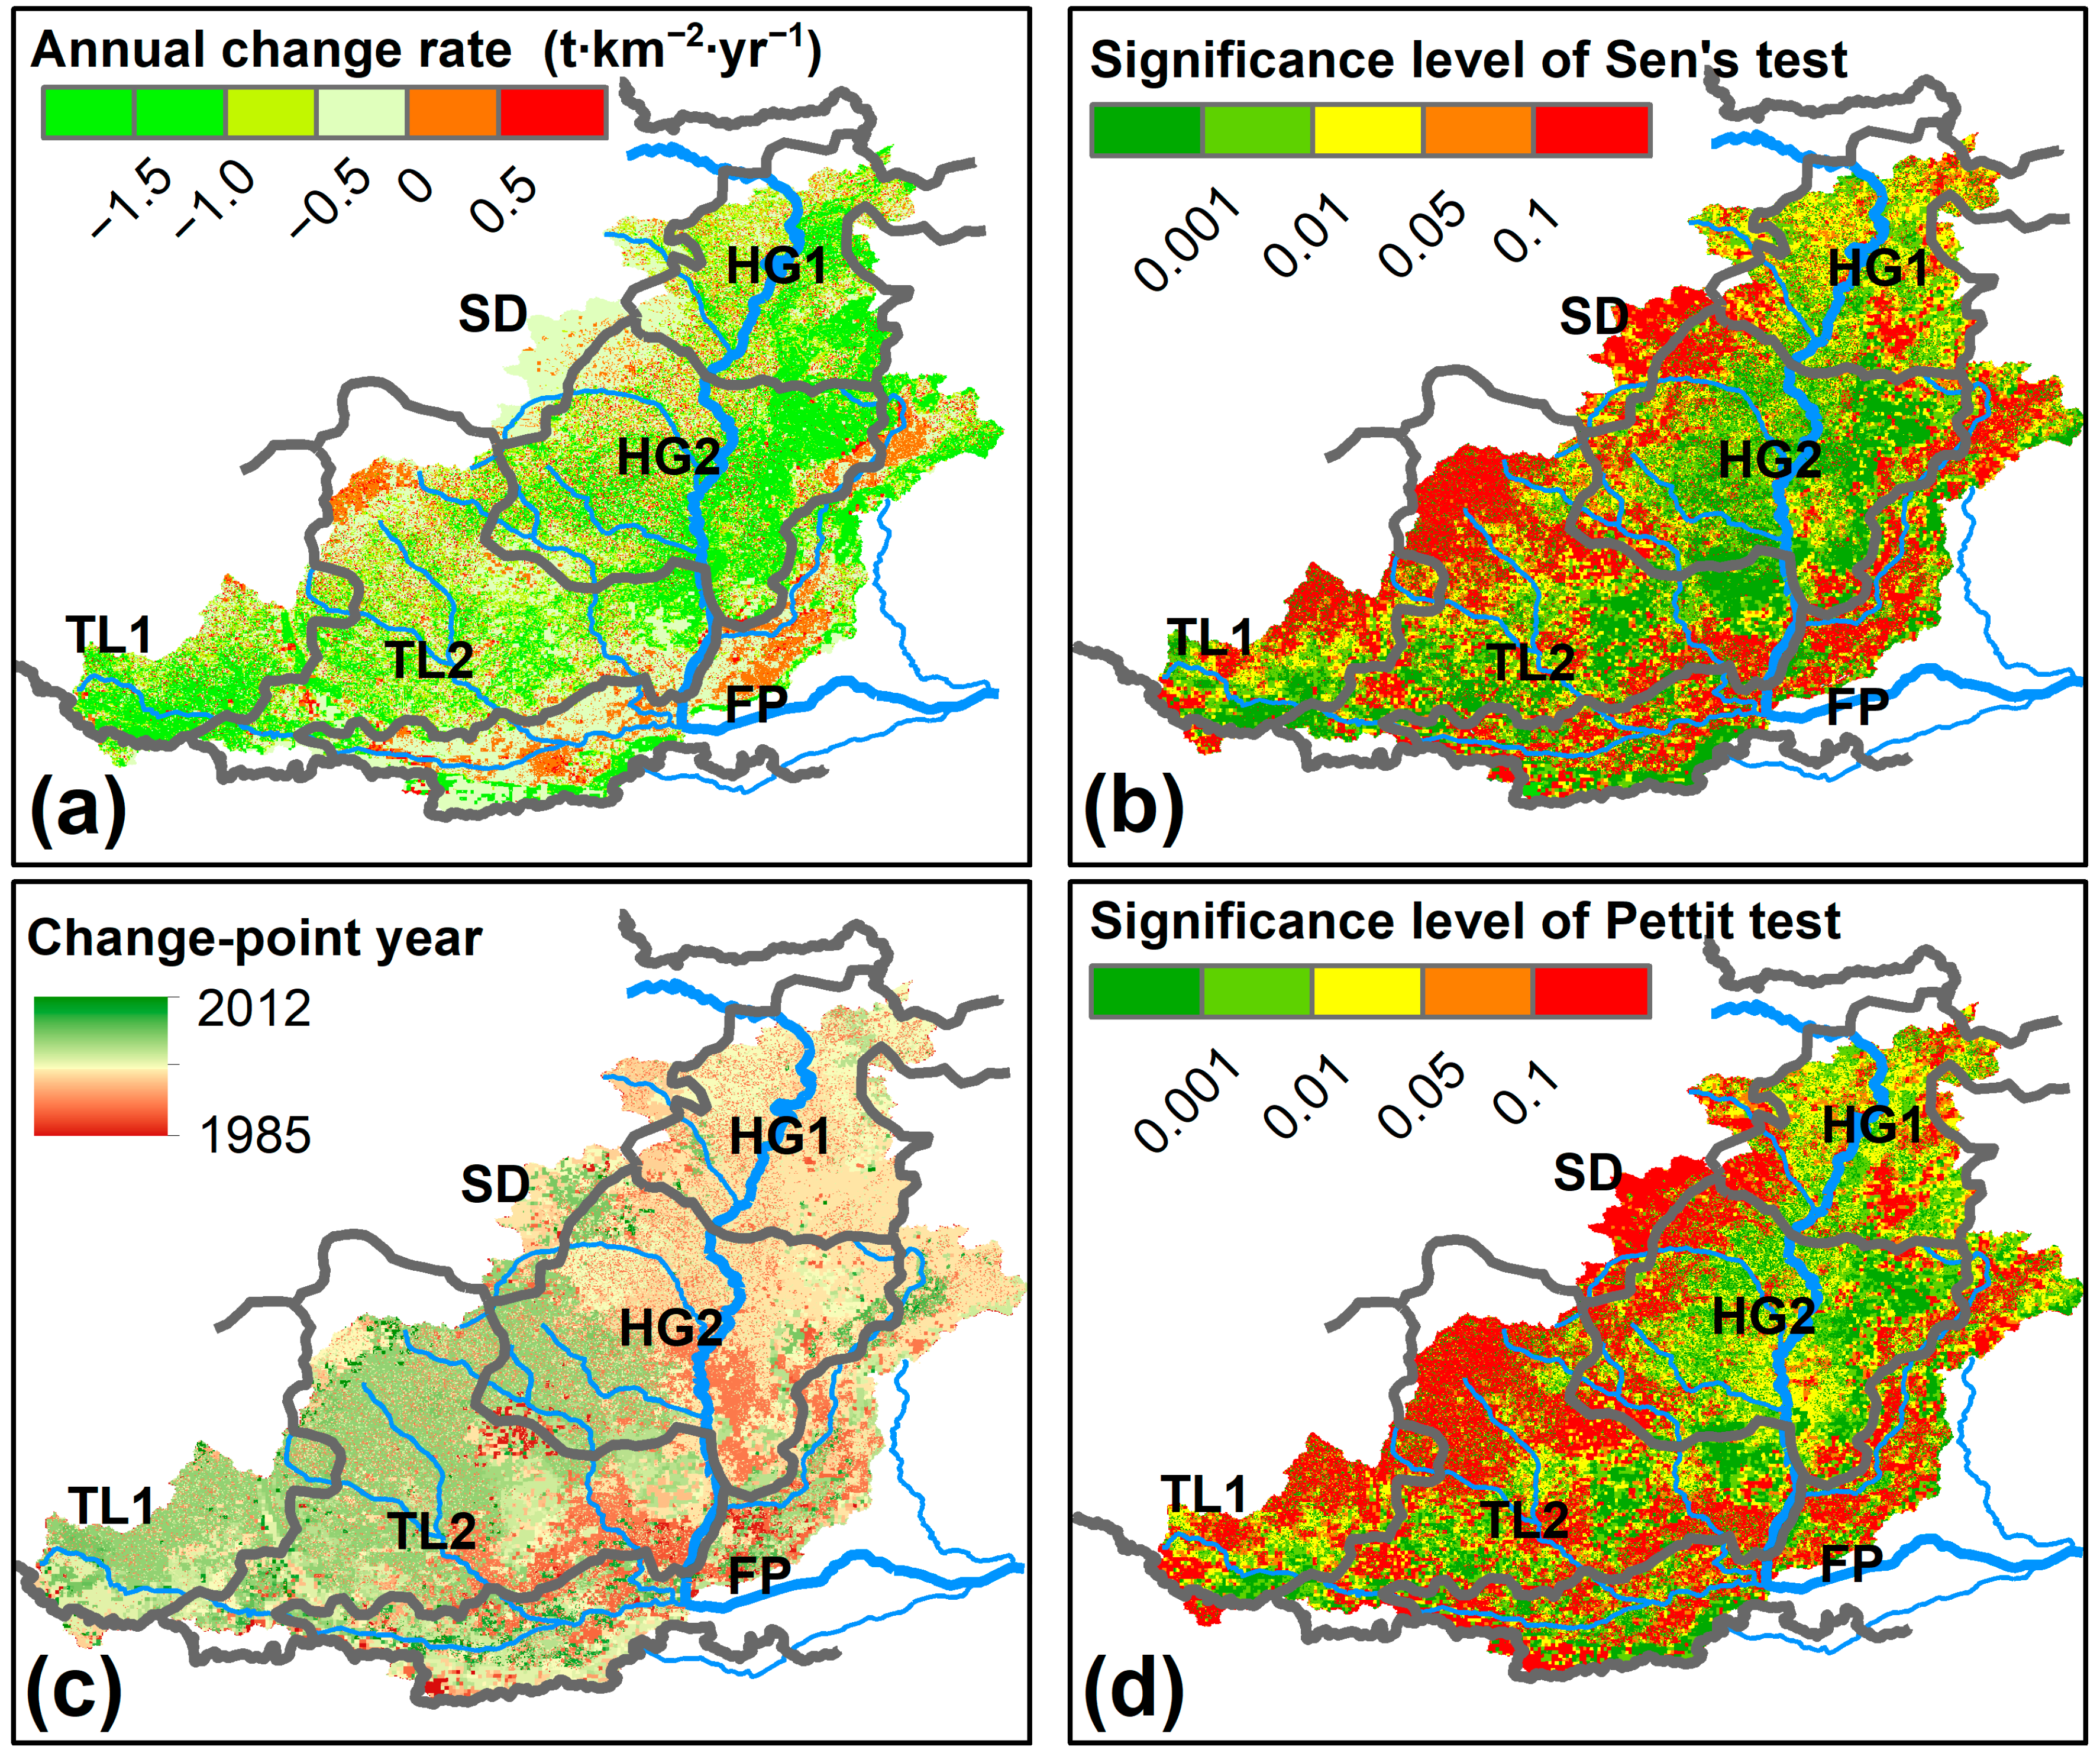
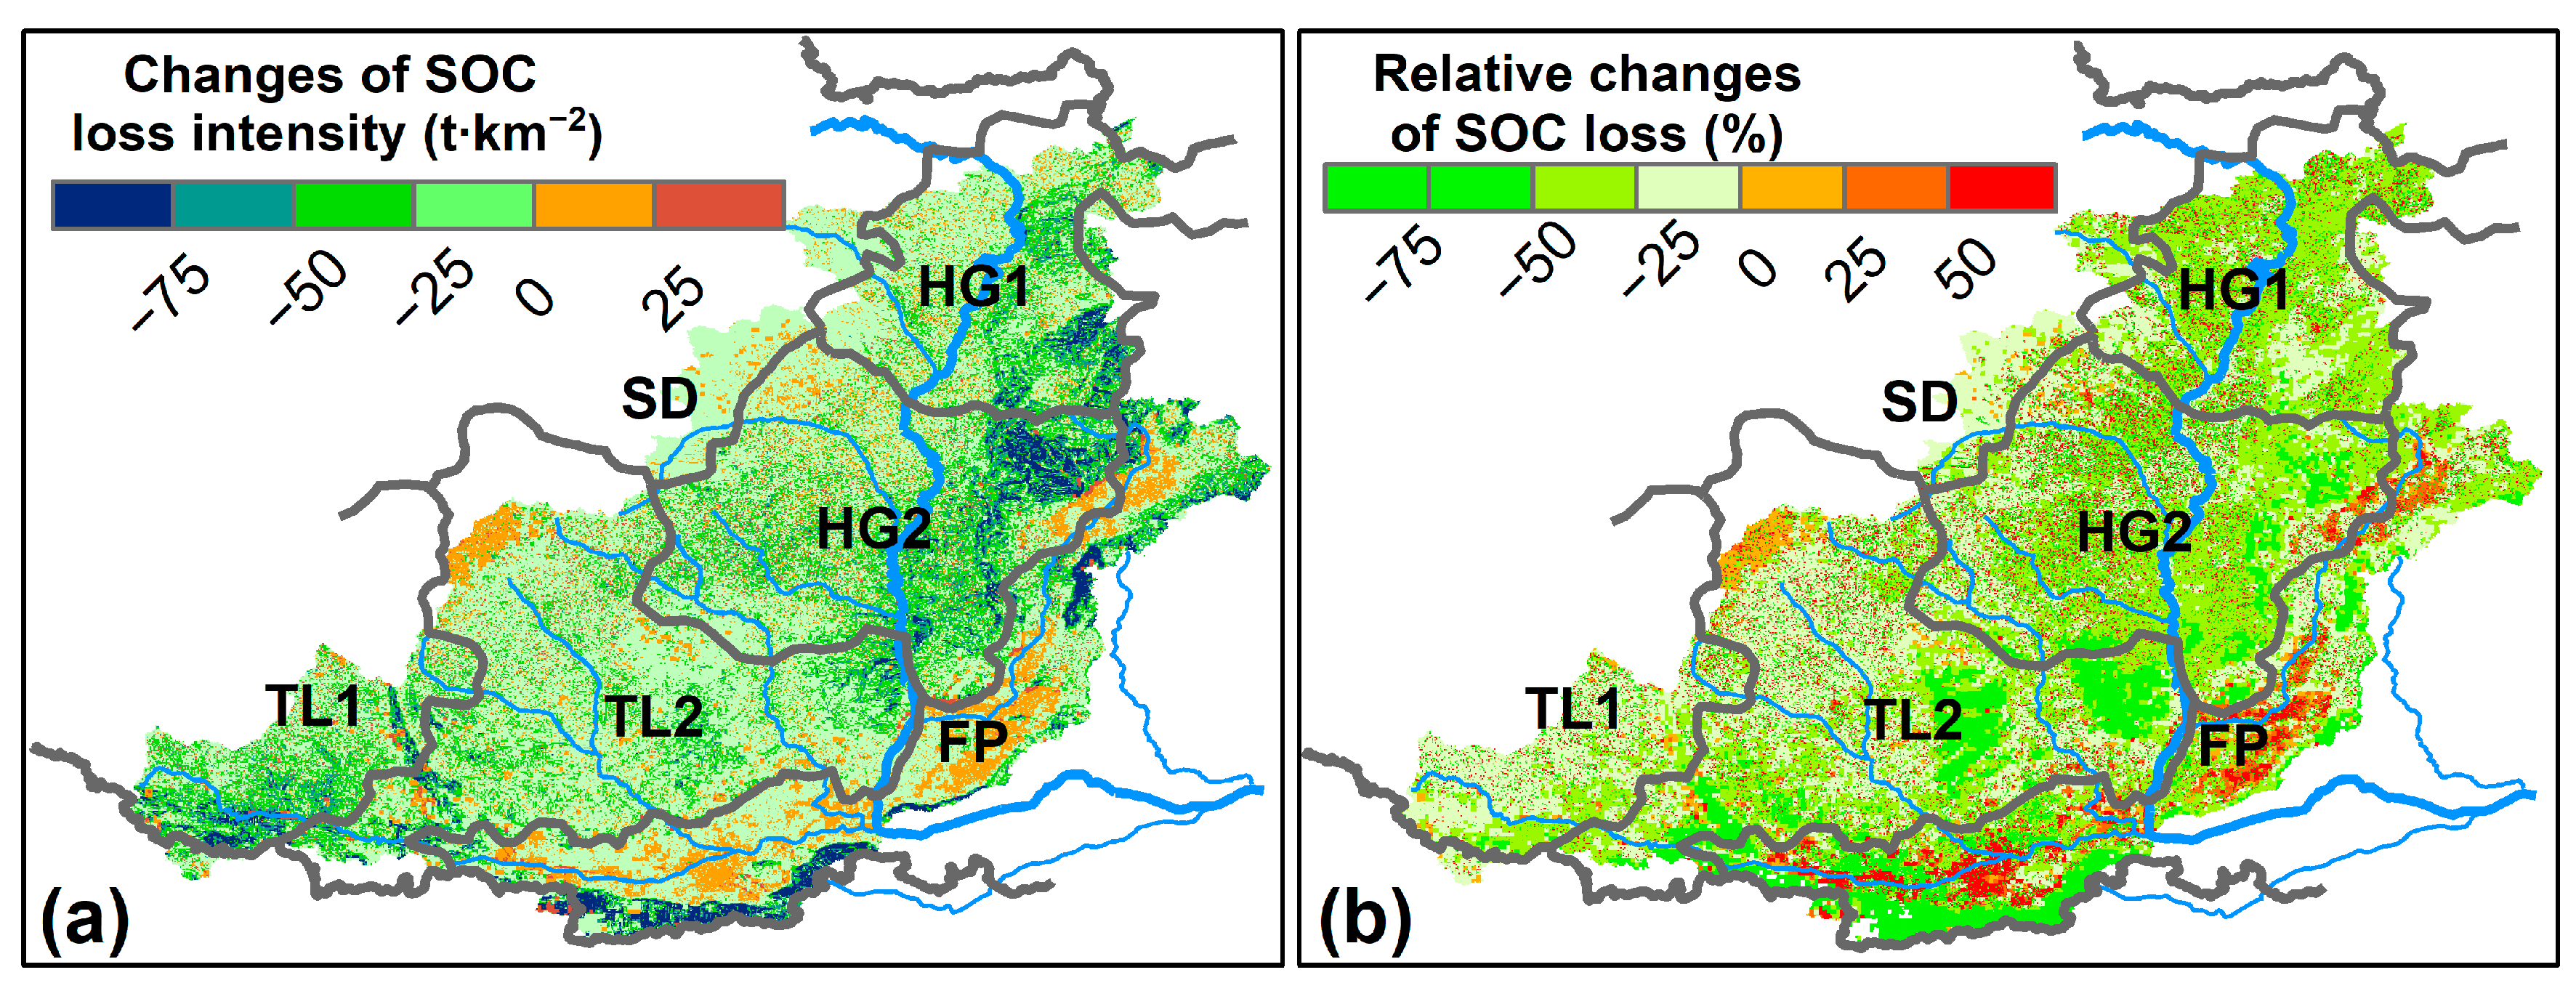
3.2. Temporal Changes in the SOC Loss

Temporal trends of SOC loss in the Hetong region and the six sub-regions are presented in Figure 4a. The Sen’s slope test showed that SOC loss in the entire Hetong region and the six sub-regions decreased significantly, with the most notable decrease observed in the TL1 sub-region (Table 1). The Pettit test showed that in the Hetong region there was at least one sudden decrease in SOC loss between 1982 and 2015, and the observed change-point year for the entire Hetong region was 1996, but different change-point years were observed for all the sub-regions (Table 1). Figure 4b shows the mean annual SOC loss before and after the change-point years for the Hetong and six sub-regions, respectively. Statistical analysis showed that SOC loss in the entire Hetong region decreased by 23.84% before and after the change-point year (1996), with the change percentages ranging from 19.96% to 31.25% between the sub-regions (Table 1).
We further investigated the temporal changes in SOC loss at the grid scale. As shown in Figure 5a, a decreased trend of SOC loss intensity was observed in 84.85% of the entire Hetong region. Statistical analysis showed that SOC loss intensity decreased significantly (p < 0.05) in 50.70% of the entire region, with an additional 4.63% decrease at a significance level of 0.1. At the same time, SOC loss increased in 14.61% of the entire Hetong region, but only 8.22% increased at a significance level of 0.05. The spatial variations in the change rate of SOC loss are shown in Figure 5a. It was found that regions experiencing increased SOC loss were mainly concentrated in the Fen-wei flood plain (sub-region FP) and the northwestern part of sub-region TL2, which is the source region of the Jing River. Change-point analysis showed that there was at least one change-point of SOC loss for 55.80% of the entire Hetong region; meanwhile, 9.7% of the region experienced an abrupt decrease at a significance level of 0.1. As shown in Figure 5c, the change-point years of SOC loss in the Hetong region also showed large spatial variation, and the change-point years in HG1, HG2, and SD were approximately six to eight years earlier than in other sub-regions.
Changes in SOC loss before and after the change-point year were quantitatively estimated. As shown in Figure 6a, more than 84.86% of the Hetong region has experienced a reduction in SOC loss since the observed change-point year, with the mean annual SOC loss reduced by 24.45 t⸱km−2⸱yr−1. At the same time, an increase in SOC loss was detected for the remaining 14.62% of the Hetong region, with a mean annual SOC loss increase of 16.64 t⸱km−2⸱yr−1. The relative change in the intensity of SOC loss before and after the change-point year is shown in Figure 6b. Statistical analysis showed that the relative change in SOC loss ranged from −98.74% to 169.75%, with a mean value of −18.44% and a median value of −25.73%. Overall, 84.86% of the Hetong region had experienced a reduction in SOC loss, resulting in a total reduction of 118.34 Tg C. At the same time, SOC loss increased in the remaining 14.62% of the Hetong region, with a total amount of 12.70 Tg C. In summary, the SOC loss for the majority of the Hetong region decreased markedly, with a net reduction of 105.64 Tg C.

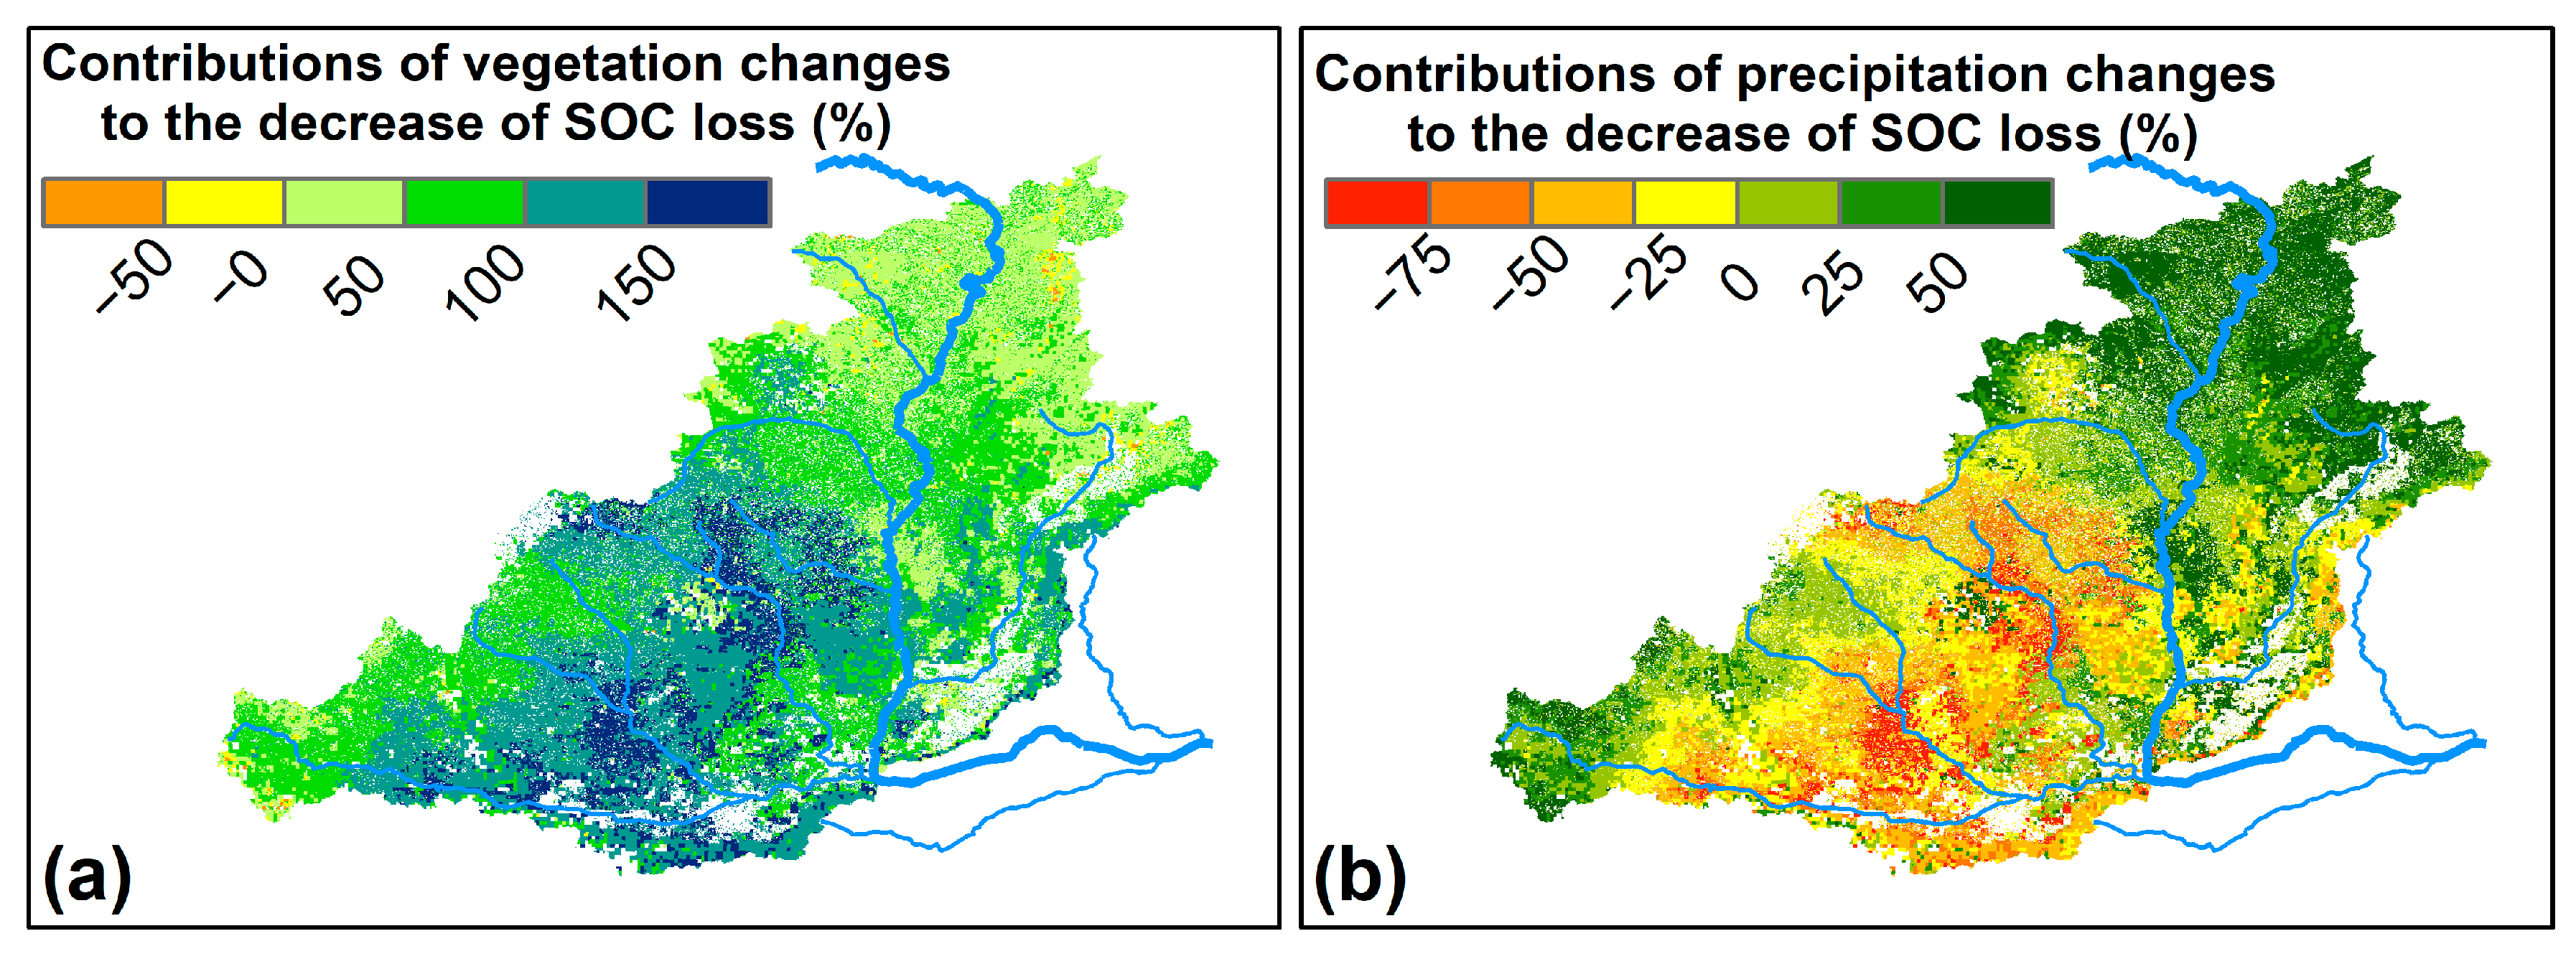
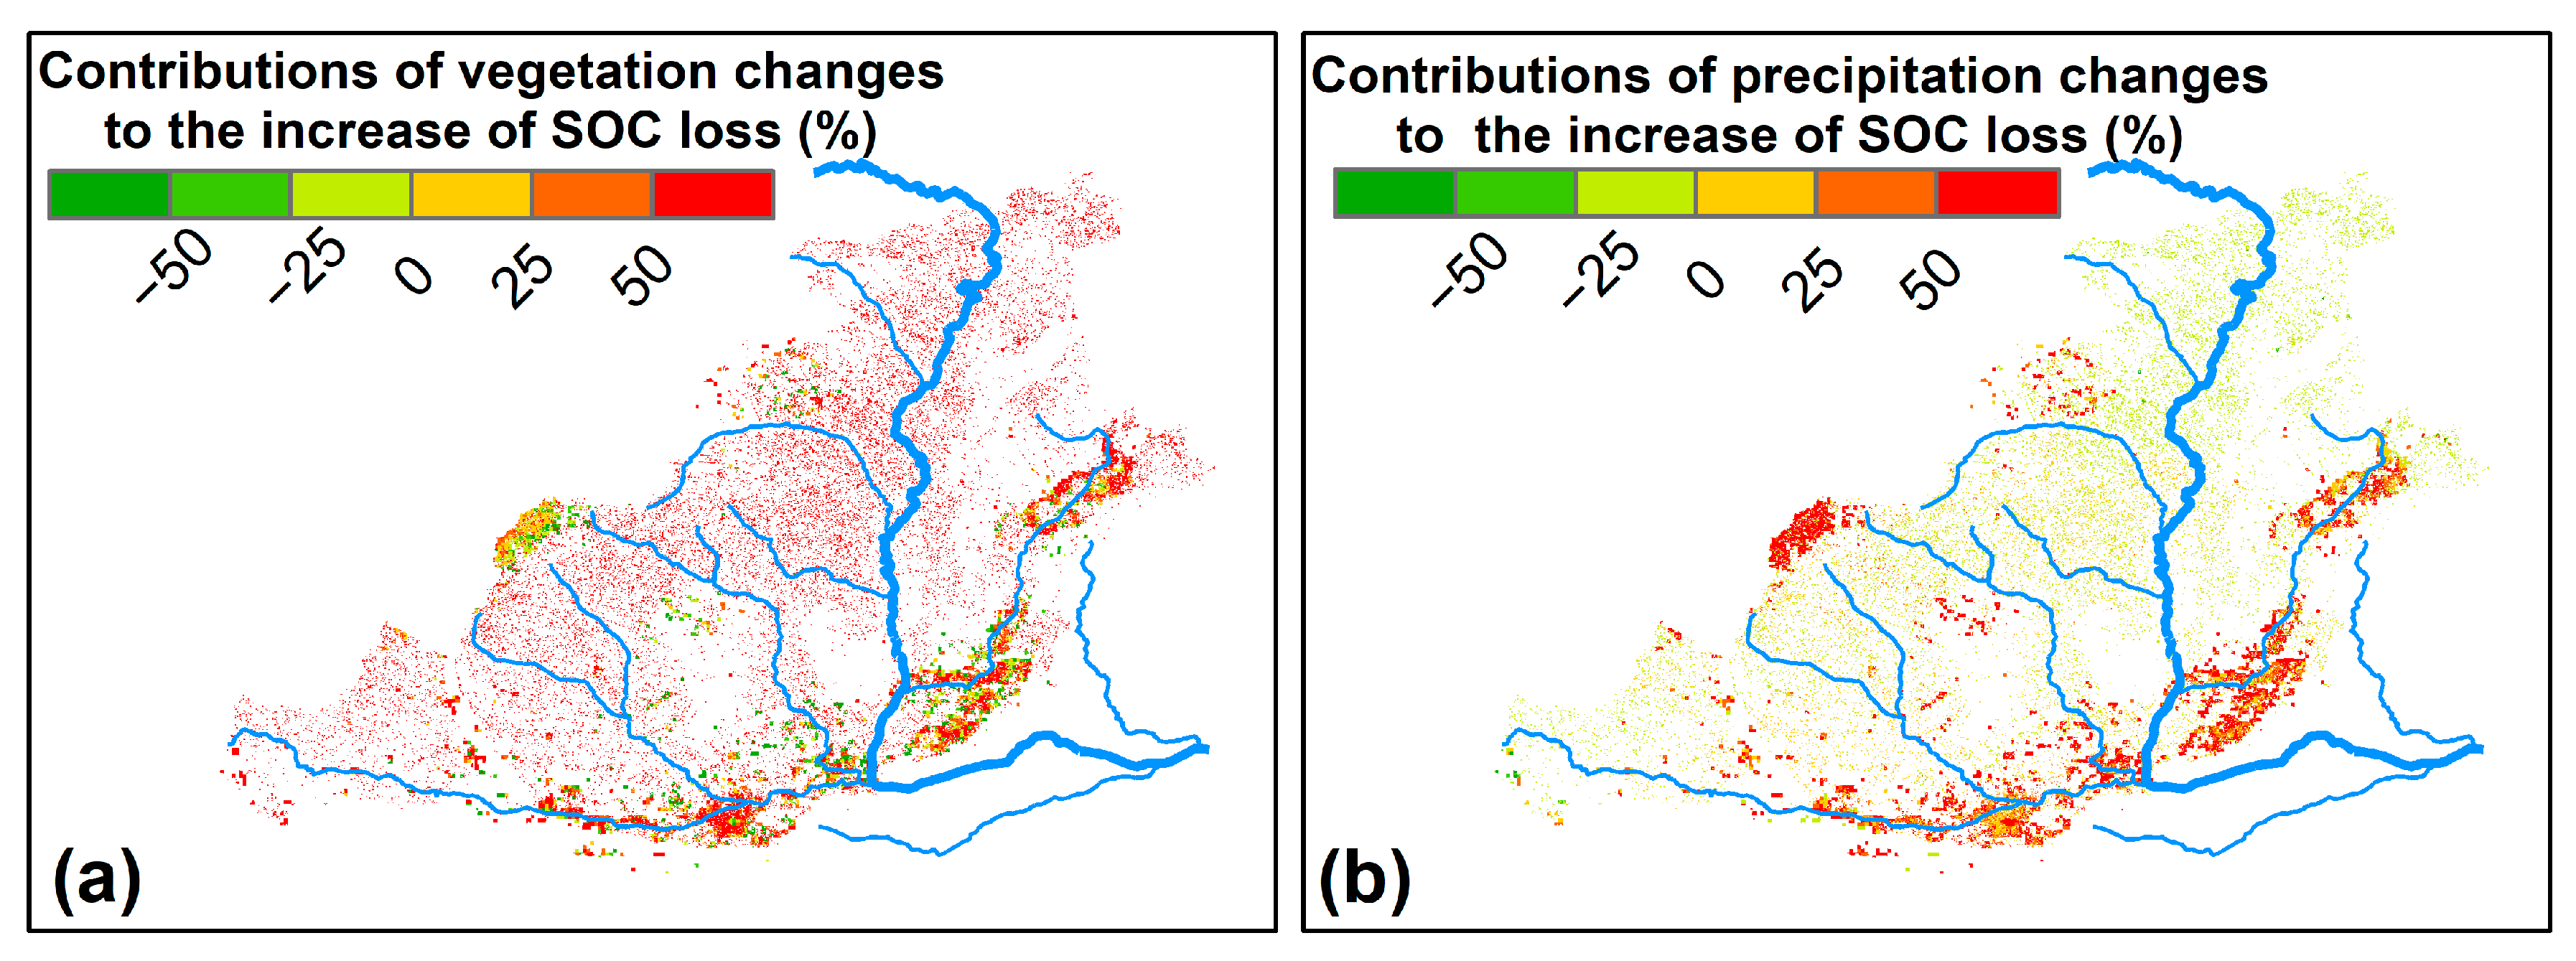
3.3. Impacts of Precipitation and Vegetation Changes on SOC Loss

Using the DMC method, we quantified the effects of climate and anthropogenic vegetation changes on SOC loss at the grid scale. As shown in Figure 7a,b, the effects of vegetation changes on reduction in SOC loss were higher than those of precipitation. Vegetation changes were the main contributor for 78.01% of reduced SOC loss regions (with a contribution exceeding 50%); meanwhile, vegetation changes dominated the reduction in SOC loss in 63.98% of SOC loss-reduced regions (contributing more than 75% of the total reduction). In addition, it is worth noting that climate change caused an increase in SOC loss in 48.40% of SOC loss-reduced regions, primarily in the south and east of the Hetong region (i.e., sub-regions TL2, FP, and southern HG2), indicating that vegetation changes had offset the negative effects of precipitation on SOC loss, and resulted in a net reduction in SOC loss.
As shown in Figure 8a,b, SOC loss increased in 14.62% of the Hetong region, and regions experiencing increased SOC loss were distributed almost uniformly throughout the entire region. Statistical analysis showed that vegetation changes contributed positively to 84.79% of the SOC loss increased regions, with a mean and median contribution of 84.82% and 97.19%, respectively. Meanwhile, precipitation contributed positively to 55.90% of the SOC loss increased regions. The contributions of vegetation changes were also much higher than those of precipitation for regions experiencing increased SOC loss, particularly in sub-regions HG1 and northern HG2, where precipitation resulted in a reduction in SOC loss.
Over the 34-year period, vegetation changes reduced the SOC loss by 106.12 Tg, comprising 89.67% of the total SOC loss reduction in the Hetong region. At the same time, vegetation changes had also increased the SOC loss by 11.31 Tg, comprising 89.04% of the total SOC loss increase in the Hetong region. Thus, it can be concluded that vegetation changes dominate change in SOC loss in the Hetong region for regions experiencing increased or decreased SOC loss.

4. Discussion

4.1. Role of Lateral SOC Loss in Carbon Cycle in the Hetong Region

The potential impacts of the lateral moved carbon on regional carbon cycling has been well recognized. This study estimated SOC loss in the Hetong region over the past 34 years, and the results highlighted the effects of the lateral moved carbon on carbon balance in this most seriously eroded region. Our estimation showed that soil erosion had an induced SOC loss of 18.29 Tg carbon annually, taking almost 4.20% of the total carbon storage in the top 5 cm soil. The Hetong region was also one of the hotspots for global lateral carbon movement study because of its high SOC loss intensity. Mean annual eroded SOC for the whole Hetong region was 64.73 t⸱km−2⸱yr−1, almost 3.45 times higher than that of the whole China [48], and 16.79 times higher than the global average value [49]. The estimation results were also comparable to previous studies. Yue et al. [48] simulated the SOC loss in the whole of China, and reported that the annual SOC removal rate on the Loess Plateau was about 75 t·km−2. Zeng et al. [50] estimated the SOC loss intensity using the sediment deposited before the check dam in a small watershed with a controlling area of 187 km2, and their observation showed that the SOC loss intensity was about 77 t·km−2·yr−1. Therefore, serious soil erosion made the Hetong region the hotspot for later SOC loss study. Eroded organic carbon migrates horizontally across landscapes, deposited along slopes [51,52], and transported through terrestrial water bodies [53,54]. However, the fate of eroded carbon is more complicated and more debatable in the Hetong region than other regions globally, because this region had experience both serious soil erosion and remarkable soil conservation simultaneously. On the one hand, eroded carbon induced by serious soil erosion was the dominant carbon sources for aquatic ecosystems, determining greenhouse gas emissions from water bodies [19,55]. On the other hand, the eroded soil, as well as the attached carbon, were deposited and stored in the large number of engineering structures (e.g., terraces and check dams) constructed along slopes and gullies [56]. The modelling framework proposed in this study provided a valuable tool to estimate lateral SOC loss, and it can be further extended to investigate the fate of eroded carbon at multi-scales in the Hetong region.

4.2. Implications and Uncertainties

The assessments showed that results in this study were reasonable; however, the estimation processes were still incomplete, and there were considerable uncertainties that should be further reduced in future studies. Accurate estimation of soil erosion is necessary, but it is impossible to validate the RUSLE model directly because observation of soil erosion at the regional scale was not available. In this study, estimated soil erosion was validated using observed sediment load in five independent watersheds (the Wei, Jing, Beiluo, Yan, and Qingjian) and the whole Hetong region. Validation results showed that estimated soil erosion matched the observed sediment load well (Figure 9), with the R2 higher than 0.70 and the Nash Coefficient higher than 0.59, indicating a reliable estimation of soil erosion. In this study, the SOC loss in the Hetong region was estimated dynamically, implying the needs of dynamic inputs of soil erosion, SOC content, and ER. Soil erosion was estimated annually using the dynamic cover management factor derived from derived from satellite observations, and the improved and regionalized calculation method also provided dynamic ER for the modelling of SOC loss. However, gridded dataset of SOC content used in this study could only reflect the spatially variations. Errors associated with ER estimation also represent a significant uncertainty in SOC loss simulation [57]. In this study, the ER function was localized by calibrating the two parameters using field observations from different land use types and different slope gradients on the dominant loess soil, which could improve the accuracy of the results. However, it is worth noting that soil types greatly influenced the enrichment and transport of carbon during soil erosion, indicating different parameters for the ER function [58]. Moreover, it was well recognized that ecological restoration measures, especially the reforestation and grass-planting, greatly changed SOC content [59,60] as well as the enrichment processes of SOC [61]. Therefore, the ignorance of human-dominant ecological restoration on ER would bring considerable uncertainties to the estimation results. Thus, the ER function could be further calibrated to improve the modelling accuracy.

5. Conclusions

In this study, we investigated SOC loss and its spatiotemporal variations in the severely eroded Hetong region between 1982 and 2015 and quantified the contributions of climate and anthropogenic vegetation changes on the temporal changes in loss of SOC. The Hetong region has experienced a severe loss of SOC as a result of soil erosion, with an erosion intensity of 64.73 t⸱km−2⸱yr−1, and with approximately 18.29 Tg SOC being removed. Temporal analysis showed that the loss of SOC decreased by 23.84% over the last 34 years, with a net reduction of 105.64 Tg C since the observed change-point year. Approximately 84.86% of the Hetong region experienced a reduction in SOC loss, with a total reduction of 118.34 Tg C, meanwhile, SOC loss increased in the remaining 14.62%, with a total amount of 12.70 Tg C. Attribute analysis demonstrated that vegetation changes were the primary contributor to the changes in SOC loss, contributing to 89.67% of the total reduction in loss of SOC and 89.04% to the increase in loss of SOC in the Hetong region. Our results suggest that anthropogenic vegetation changes changed SOC loss in the Hetong region considerably, which is informative and valuable for carbon management in regions that have experienced substantial ecological restoration.

Author Contributions

Conceptualization, P.S. and J.H.; methodology, J.H.; software, P.S.; validation, J.H. and P.S.; formal analysis, P.S. and J.H.; investigation, P.S., W.G. and J.H.; resources, Y.P., P.X. and J.H.; data curation, J.H.; writing—original draft preparation, P.S. and J.H.; writing—review and editing, P.S. and J.H.; visualization, P.S. and J.H.; supervision, P.S., P.X. and J.H.; project administration, P.S. and J.H.; funding acquisition, P.S. and J.H. All authors have read and agreed to the published version of the manuscript.

Funding

This work was supported by the National Natural Science Foundation of China [No. 42207401, No. U2243210, No. 42177327]; Foundation of development on science and technology by YRIHR [No. HKF202205]; the open Project Fund of Key Laboratory of the Loess Plateau Soil Erosion and Water Loss Process and Control, Ministry of Water Resources [No. HTGY202004]; and the Scientific Research Foundation of Yellow River Institute of Hydraulic Research (HKY-JBYW-2022-09); and the Youth Talent Lift Project of China Association for Science and Technology [No. 2019-2021QNRC001].

Data Availability Statement

Not applicable.

Conflicts of Interest

The authors declare no conflict of interest.

Appendix A

Appendix A.1. Double-Mass Curve (DMC) Method

The relation between the cumulative SOC loss and cumulative precipitation in the reference period is calculated by:
E S O C t = k P ( t ) + b
where k and b are two coefficients. Equation (A1) is used to predict the SOC loss in the modified period. Precipitation, the climate factor, is the same for both the predicted and observed SOC loss.
We assume that SOC loss variation in each grid is caused by revegetation and precipitation changes. Once accumulated annual SOC loss deviation attributed to precipitation changes ( Δ E S O C , v ( t ) ) was estimated, the deviation resulting from revegetation can then be computed by the following equation:
Δ E S O C , v ( t ) = Δ E S O C ( t ) Δ E S O C , p ( t )
where  Δ E S O C , p ( t )  and  Δ E S O C ( t )  represent accumulated annual SOC loss deviation attributed to revegetation and total accumulated annual SOC loss deviation for the t-th year, respectively.

Appendix A.2. Sen’s Slope Method

Sen’s slope computes both the slope and confidence levels according to Sen’s method. First, a set of linear slopes is calculated as follows:
d k = x j x i j i
for (1 ≤ i < jn), where d is the slope, x denotes the variable, n is the number of data, and i, j are indices. Sen’s slope is then calculated as the median from all slopes.

Appendix A.3. Pettitt’s Test

The test is implemented as given by Verstraeten et al. (2006), where the ranks r1, r2,…, rn of the X1, X2,…, Xn are used for the statistic:
U k = 2 i = 1 k r i k ( n + 1 ) k = 1 , 2 , , n
The test statistic is the maximum of the absolute value of the vector:
U ^ = max | U k |

References

  1. Crowther, T.W.; Todd-Brown, K.E.; Rowe, C.W.; Wieder, W.R.; Carey, J.C.; Machmuller, M.B.; Snoek, B.L.; Fang, S.; Zhou, G.; Allison, S.D.; et al. Quantifying global soil carbon losses in response to warming. Nature 2016, 540, 104–108. [Google Scholar] [CrossRef] [PubMed] [Green Version]
  2. Scharlemann, J.W.; Tanner, E.J.; Hiederer, R.; Kapos, V. Global soil carbon: Understanding and managing the largest terrestrial carbon pool. Carbon Manag. 2014, 5, 81–91. [Google Scholar] [CrossRef]
  3. Oost, K.V.; Quine, T.A.; Govers, G.; Gryze, S.D.; Six, J.; Harden, J.W.; Ritchie, J.C.; McCarty, G.W.; Heckrath, G.; Kosmas, C.; et al. The impact of agricultural soil erosion on the global carbon cycle. Science 2007, 318, 626–629. [Google Scholar] [CrossRef] [PubMed]
  4. Lal, R. Soil carbon sequestration impacts on global climate change and food security. Science 2004, 304, 1623. [Google Scholar] [CrossRef] [PubMed] [Green Version]
  5. Toy, T.J.; Foster, G.R.; Renard, K.G. Soil Erosion: Processes, Prediction, Measurement and Control; John Wiley & Sons: Hoboken, NJ, USA, 2002. [Google Scholar]
  6. Luo, P.; Luo, M.; Li, F.; Qi, X.; Huo, A.; Wang, Z.; He, B.; Takara, K.; Nover, D.; Wang, Y. Urban flood numerical simulation: Research, methods and future perspectives. Environ. Model. Softw. 2022, 156, 105478. [Google Scholar] [CrossRef]
  7. Poesen, J. Soil erosion in the Anthropocene: Research needs. Earth Surf. Process. Landf. 2018, 43, 64–84. [Google Scholar] [CrossRef]
  8. Stallard, R.F. Terrestrial sedimentation and the carbon cycle: Coupling weathering and erosion to carbon burial. Glob. Biogeochem. Cycles 1998, 12, 231–257. [Google Scholar] [CrossRef]
  9. Regnier, P.; Resplandy, L.; Najjar, R.G.; Ciais, P. The land-to-ocean loops of the global carbon cycle. Nature 2022, 603, 401–410. [Google Scholar] [CrossRef]
  10. Xu, L.; Saatchi, S.S.; Yang, Y.; Yu, Y.; Pongratz, J.; Bloom, A.A.; Bowman, K.; Worden, J.; Liu, J.; Yin, Y.; et al. Changes in global terrestrial live biomass over the 21st century. Sci. Adv. 2021, 7, eabe9829. [Google Scholar] [CrossRef]
  11. Luo, X.; Bai, X.; Tan, Q.; Ran, C.; Chen, H.; Xi, H.; Chen, F.; Wu, L.; Li, C.; Zhang, S.; et al. Particulate organic carbon exports from the terrestrial biosphere controlled by erosion. Catena 2022, 209, 105815. [Google Scholar] [CrossRef]
  12. Zhang, H.; Lauerwald, R.; Regnier, P.; Ciais, P.; Yuan, W.; Naipal, V.; Guenet, B.; Van Oost, K.; Camino-Serrano, M. Simulating Erosion-induced soil and carbon delivery from uplands to rivers in a global land surface model. J. Adv. Model. Earth Syst. 2020, 12, e2020MS002121. [Google Scholar] [CrossRef]
  13. Butman, D.; Stackpoole, S.; Stets, E.; McDonald, C.P.; Clow, D.W.; Striegl, R.G. Aquatic carbon cycling in the conterminous United States and implications for terrestrial carbon accounting. Proc. Natl. Acad. Sci. USA 2016, 113, 58. [Google Scholar] [CrossRef] [PubMed] [Green Version]
  14. Tank, S.E.; Fellman, J.B.; Hood, E.; Kritzberg, E.S. Beyond respiration: Controls on lateral carbon fluxes across the terrestrial-aquatic interface. Limnol. Oceanogr. Lett. 2018, 3, 76–88. [Google Scholar] [CrossRef]
  15. Doetterl, S.; Berhe, A.A.; Nadeu, E.; Wang, Z.; Sommer, M.; Fiener, P. Erosion, deposition and soil carbon: A review of process-level controls, experimental tools and models to address C cycling in dynamic landscapes. Earth-Sci. Rev. 2016, 154, 102–122. [Google Scholar] [CrossRef]
  16. Wit, H.D.; Valinia, S.; Weyhenmeyer, G.A.; Futter, M.N.; Kortelainen, P.; Austnes, K.; Hessen, D.O.; Rike, A.; Laudon, H.; Vuorenmaa, J. Current browning of surface waters will be further promoted by wetter climate. Environ. Sci. Technol. Lett. 2016, 3, 430–435. [Google Scholar] [CrossRef] [Green Version]
  17. Regnier, P.; Friedlingstein, P.; Ciais, P.; Mackenzie, F.T.; Gruber, N.; Janssens, I.A.; Laruelle, G.G.; Lauerwald, R.; Luyssaert, S.; Andersson, A.J.; et al. Anthropogenic perturbation of the carbon fluxes from land to ocean. Nat. Geosci. 2013, 6, 597–607. [Google Scholar] [CrossRef] [Green Version]
  18. Clark, K.E.; Hilton, R.G.; West, A.J.; Robles Caceres, A.; Gröcke, D.R.; Marthews, T.R.; Ferguson, R.I.; Asner, G.P.; New, M.; Malhi, Y. Erosion of organic carbon from the Andes and its effects on ecosystem carbon dioxide balance. J. Geophys. Res. Biogeosci. 2017, 122, 449–469. [Google Scholar] [CrossRef] [Green Version]
  19. Battin, T.J.; Lauerwald, R.; Bernhardt, E.S.; Bertuzzo, E.; Gener, L.G.; Hall, R.O.; Hotchkiss, E.R.; Maavara, T.; Pavelsky, T.M.; Ran, L.; et al. River ecosystem metabolism and carbon biogeochemistry in a changing world. Nature 2023, 613, 449–459. [Google Scholar] [CrossRef]
  20. Sun, P.; Wu, Y.; Xiao, J.; Hui, J.; Hu, J.; Zhao, F.; Qiu, L.; Liu, S. Remote sensing and modeling fusion for investigating the ecosystem water-carbon coupling processes. Sci. Total Environ. 2019, 697, 134064. [Google Scholar] [CrossRef]
  21. Hu, C. Changes in runoff and sediment loads of the Yellow River and its management strategies. (In Chinese with English abstract). J. Hydroelectr. Eng. 2016, 35, 1–11. [Google Scholar]
  22. Best, J. Anthropogenic stresses on the world’s big rivers. Nat. Geosci. 2019, 12, 7–21. [Google Scholar] [CrossRef]
  23. Chen, F.; Fu, B.; Xia, J.; Wu, D.; Wu, S.; Zhang, Y.; Sun, H.; Liu, Y.; Fang, X.; Qin, B.J.S.C.E.S. Major advances in studies of the physical geography and living environment of China during the past 70 years and future prospects. Sci. China Earth Sci. 2019, 62, 1665–1701. [Google Scholar] [CrossRef]
  24. Wang, S.; Luo, P.; Xu, C.; Zhu, W.; Cao, Z.; Ly, S. Reconstruction of historical land use and urban flood simulation in Xian, Shannxi, China. Remote Sens. 2022, 14, 6067. [Google Scholar] [CrossRef]
  25. Zhu, Y.; Luo, P.; Zhang, S.; Sun, B. Spatiotemporal analysis of hydrological variations and their impacts on vegetation in semiarid areas from multiple satellite data. Remote Sens. 2020, 12, 4177. [Google Scholar] [CrossRef]
  26. Jin, F.; Yang, W.; Fu, J.; Li, Z. Effects of vegetation and climate on the changes of soil erosion in the Loess Plateau of China. Sci. Total Environ. 2021, 773, 145514. [Google Scholar] [CrossRef] [PubMed]
  27. Sun, P.; Wu, Y.; Gao, J.; Yao, Y.; Zhao, F.; Lei, X.; Qiu, L. Shifts of sediment transport regime caused by ecological restoration in the Middle Yellow River Basin. Sci. Total Environ. 2020, 698, 134261. [Google Scholar] [CrossRef]
  28. Wang, S.; Cao, Z.; Luo, P.; Zhu, W. Spatiotemporal variations and climatological trends in precipitation indices in Shaanxi province, China. Atmosphere 2022, 13, 744. [Google Scholar] [CrossRef]
  29. Yang, Y.; Wang, B.; Wang, G.; Li, Z. Ecological regionalization and overview of the Loess Plateau. Acta Ecol. Sin. 2019, 39, 7389–7397. [Google Scholar]
  30. Li, P.; Mu, X.; Holden, J.; Wu, Y.; Irvine, B.; Wang, F.; Gao, P.; Zhao, G.; Sun, W. Comparison of soil erosion models used to study the Chinese Loess Plateau. Earth-Sci. Rev. 2017, 170, 17–30. [Google Scholar] [CrossRef] [Green Version]
  31. Xie, Y.; Yin, S.Q.; Liu, B.-y.; Nearing, M.A.; Zhao, Y. Models for estimating daily rainfall erosivity in China. J. Hydrol. 2016, 535, 547–558. [Google Scholar] [CrossRef] [Green Version]
  32. Bezak, N.; Borrelli, P.; Panagos, P. Exploring the possible role of satellite-based rainfall data in estimating inter-and intra-annual global rainfall erosivity. Hydrol. Earth Syst. Sci. 2022, 26, 1907–1924. [Google Scholar] [CrossRef]
  33. Wang, M.; Yin, S.; Yue, T.; Yu, B.; Wang, W. Rainfall erosivity estimation using gridded daily precipitation datasets. Hydrol. Earth Syst. Sci. Discuss. 2020, 2020, 1–30. [Google Scholar]
  34. Hengl, T.; Mendes de Jesus, J.; Heuvelink, G.B.M.; Ruiperez Gonzalez, M.; Kilibarda, M.; Blagotić, A.; Shangguan, W.; Wright, M.N.; Geng, X.; Bauer-Marschallinger, B.; et al. SoilGrids250m: Global gridded soil information based on machine learning. PLoS ONE 2017, 12, e0169748. [Google Scholar] [CrossRef] [PubMed] [Green Version]
  35. Xu, X.; Liu, J.; Zhang, S.; Li, R.; Yan, C.; Wu, S. China’s Multi-Period Land Use Land Cover Remote Sensing Monitoring Data Set (CNLUCC); Resource and Environment Data Cloud Platform: Beijing, China, 2018. [Google Scholar]
  36. Sun, W.; Shao, Q.; Liu, J.; Zhai, J. Assessing the effects of land use and topography on soil erosion on the Loess Plateau in China. Catena 2014, 121, 151–163. [Google Scholar] [CrossRef]
  37. Holz, M.; Augustin, J. Erosion effects on soil carbon and nitrogen dynamics on cultivated slopes: A meta-analysis. Geoderma 2021, 397, 115045. [Google Scholar] [CrossRef]
  38. Li, J.; Fu, B.; Feng, X.; Dargusch, P.; Liu, J.; Chen, W.; Wang, J. Topsoil carbon-selective transport in an eroding soil landscape with vegetation restoration. Land Degrad. Dev. 2021, 32, 2061–2073. [Google Scholar] [CrossRef]
  39. Xu, L.; Yu, G.; He, N.; Wang, Q.; Gao, Y.; Wen, D.; Li, S.; Niu, S.; Ge, J.J.S.R. Carbon storage in China’s terrestrial ecosystems: A synthesis. Sci. Rep. 2018, 8, 1–13. [Google Scholar] [CrossRef] [PubMed] [Green Version]
  40. Li, Z.; Nie, X.; Chang, X.; Lin, L.; Sun, L. Characteristics of Soil and Organic Carbon Loss Induced by Water Erosion on the Loess Plateau in China. PLoS ONE 2016, 11, e0154591. [Google Scholar] [CrossRef] [PubMed] [Green Version]
  41. Wang, Z.; Govers, G.; Oost, K.V.; Clymans, W.; den Putte, A.V.; Merckx, R. Soil organic carbon mobilization by interrill erosion: Insights from size fractions. J. Geophys. Res. Earth 2013, 118, 348–360. [Google Scholar] [CrossRef] [Green Version]
  42. Jia, S. Soil organic carbon loss under different slope gradients in loess hilly region. Res. Soil Water Conserv. 2009, 16, 30–33. [Google Scholar] [CrossRef]
  43. Deng, R.; Wang, B.; Liu, P.; LIu, D.; Xu, J. Effects of different land use patterns on soil organic carbon loss on the Loess Plateau. Res. Soil Water Conserv. 2011, 18, 104–107. [Google Scholar]
  44. Li, G.; Yao, J.; Pang, X. Distribution and erosion process of organic carbon in the different particle size fractions in loess hills region. Acta Pedl. Sin. 2008, 45, 740–744. [Google Scholar]
  45. Gao, P.; Li, P.; Zhao, B.; Xu, R.; Zhao, G.; Sun, W.; Mu, X. Use of double mass curves in hydrologic benefit evaluations. Hydrolo. Process. 2017, 31, 4639–4646. [Google Scholar] [CrossRef]
  46. Sen, P.K. Estimates of the Regression Coefficient Based on Kendall’s Tau. J. Am. Stat. Assoc. 1968, 63, 1379–1389. [Google Scholar] [CrossRef]
  47. Pettitt, A. A non-parametric approach to the change-point problem. J. R. Stat. Soc. App. 1979, 28, 126–135. [Google Scholar] [CrossRef]
  48. Yue, Y.; Ni, J.; Ciais, P.; Piao, S.; Wang, T.; Huang, M.; Borthwick, A.G.; Li, T.; Wang, Y.; Chappell, A.; et al. Lateral transport of soil carbon and land-atmosphere CO2 flux induced by water erosion in China. Proc. Natl. Acad. Sci. USA 2016, 113, 6617–6622. [Google Scholar] [CrossRef] [Green Version]
  49. Naipal, V.; Ciais, P.; Wang, Y.; Lauerwald, R.; Guenet, B.; Van Oost, K. Global soil organic carbon removal by water erosion under climate change and land use change during AD 1850–2005. Biogeosciences 2018, 15, 4459–4480. [Google Scholar] [CrossRef] [Green Version]
  50. Zeng, Y.; Fang, N.; Shi, Z.; Lu, X.; Wang, Z. Soil organic carbon redistribution and delivery by soil erosion in a small catchment of the Yellow River basin. J. Geophys. Res. Biogeosci. 2020, 125, e2019JG005471. [Google Scholar] [CrossRef]
  51. Li, T.; Zhang, H.; Wang, X.; Cheng, S.; Fang, H.; Liu, G.; Yuan, W. Soil erosion affects variations of soil organic carbon and soil respiration along a slope in Northeast China. Ecol. Process. 2019, 8, 1–10. [Google Scholar] [CrossRef] [Green Version]
  52. Liu, S.; Bliss, N.; Sundquist, E.; Huntington, T.G. Modeling carbon dynamics in vegetation and soil under the impact of soil erosion and deposition. Glob. Biogeochem. Cycles 2003, 17, 1074. [Google Scholar] [CrossRef] [Green Version]
  53. Wang, S.; Wang, X.; He, B.; Yuan, W. Relative influence of forest and cropland on fluvial transport of soil organic carbon and nitrogen in the Nen River basin, northeastern China. J. Hydrol. 2020, 582, 124526. [Google Scholar] [CrossRef]
  54. Liu, S.; Kuhn, C.; Amatulli, G.; Aho, K.; Butman, D.E.; Allen, G.H.; Lin, P.; Pan, M.; Yamazaki, D.; Brinkerhoff, C.; et al. The importance of hydrology in routing terrestrial carbon to the atmosphere via global streams and rivers. Proc. Natl. Acad. Sci. USA 2022, 119, e2106322119. [Google Scholar] [CrossRef] [PubMed]
  55. Ran, L.; Wang, X.; Li, S.; Zhou, Y.; Xu, Y.J.; Chan, C.N.; Fang, N.; Xin, Z.; Shen, H. Integrating aquatic and terrestrial carbon fluxes to assess the net landscape carbon balance of a highly erodible semiarid catchment. J. Geophys. Res. Biogeosci. 2022, 127, e2021JG006765. [Google Scholar] [CrossRef]
  56. Fang, N.; Zeng, Y.; Ran, L.; Wang, Z.; Lu, X.; Wang, Z.; Yang, X.; Jian, J.; Yu, Q.; Ni, L.; et al. Substantial role of check dams in sediment trapping and carbon sequestration on the Chinese Loess Plateau. Commun. Earth Environ. 2023, 4, 65. [Google Scholar] [CrossRef]
  57. Zhang, X. Simulating eroded soil organic carbon with the SWAT-C model. Environ. Model. Softw. 2018, 102, 39–48. [Google Scholar] [CrossRef]
  58. De Nijs, E.A.; Cammeraat, E.L.H. The stability and fate of soil organic carbon during the transport phase of soil erosion. Earth-Sci. Rev. 2020, 201, 103067. [Google Scholar] [CrossRef]
  59. Deng, L.; Liu, G.; Shangguan, Z. Land-use conversion and changing soil carbon stocks in China’s ‘Grain-for-Green’ Program: A synthesis. Glob. Change Biol. 2014, 20, 3544–3556. [Google Scholar] [CrossRef]
  60. Wang, J.; Liu, Z.; Gao, J.; Emanuele, L.; Ren, Y.; Shao, M.; Wei, X. The Grain for Green project eliminated the effect of soil erosion on organic carbon on China’s Loess Plateau between 1980 and 2008. Agric. Ecosyst. Environ. 2021, 322, 107636. [Google Scholar] [CrossRef]
  61. Zheng, J.; Zhao, J.; Shi, Z.; Wang, L. Soil aggregates are key factors that regulate erosion-related carbon loss in citrus orchards of southern China: Bare land vs. grass-covered land. Agric. Ecosyst. Environ. 2021, 309, 107254. [Google Scholar] [CrossRef]
Figure 1. Location of the Hetong region on the Chinese Loess Plateau.
Remotesensing 15 01775 g001
Figure 2. Comparison of gridded World Soil Information Service (WoSIS) soil organic carbon (SOC) dataset and in situ observations.
Remotesensing 15 01775 g002
Figure 3. (a) Spatial distribution of SOC loss intensity in the Hetong region and (b) its statistical comparison in different sub-regions.
Remotesensing 15 01775 g003
Figure 4. (a) Temporal change in SOC loss intensity in different regions and (b) relative change in SOC loss before and after the change-point year. HT, TL1, TL2, HG1, HG2, SD, and FP represent the Hetong region, and the six sub-regions, namely, two loess tableland sub-regions (TL1 and TL2), two loess hilly gully sub-regions (HG1 and HG1), sand sub-region (SD), and floodplain sub-region (FP), respectively. Black points in sub-figure (a) with different outline colors denotes the change-point year for the Hetong region and each sub-regions, respectively, and the ‘Pre’ and ‘Post’ in sub-figure (b) denotes the period before and after the change-point year.
Remotesensing 15 01775 g004
Figure 5. Temporal changes in SOC loss in the Hetong region. (a) Change rates of SOC loss, (b) their statistical significance, (c) detected change-point years of SOC loss, and (d) the statistical significance of the Pettitt test.
Remotesensing 15 01775 g005
Figure 6. Change in SOC loss in the Hetong region: (a) change magnitude and (b) relative changes.
Remotesensing 15 01775 g006
Figure 7. Contributions of (a) precipitation and (b) vegetation changes to the reduction in SOC loss in regions experienced decreasing SOC loss.
Remotesensing 15 01775 g007
Figure 8. Contributions of (a) precipitation and (b) vegetation changes to the increase in SOC loss in regions with increasing SOC loss.
Remotesensing 15 01775 g008
Figure 9. Comparison of simulated soil erosion and observed sediment load in five controlled watersheds and the Hetong Region.
Remotesensing 15 01775 g009
Table 1. Temporal changes in SOC loss intensity in the Hetong region and the six sub-regions.
RegionsPettit TestSen’s Test
Change-Point Yearp-ValueChange Percentage (%)Sen Slopep-Value
Hetong1996<0.01−23.85−0.94<0.01
TL120030.03−19.97−1.38<0.01
TL220030.02−22.76−0.68<0.01
HG119960.02−26.87−0.82<0.01
HG21996<0.01−26.20−1.09<0.01
SD19950.13−21.28−0.210.02
FP1996<0.01−31.26−0.99<0.01
Disclaimer/Publisher’s Note: The statements, opinions and data contained in all publications are solely those of the individual author(s) and contributor(s) and not of MDPI and/or the editor(s). MDPI and/or the editor(s) disclaim responsibility for any injury to people or property resulting from any ideas, methods, instructions or products referred to in the content.

