Article

Impacts of Water Resources Management on Land Water Storage in the Lower Lancang River Basin: Insights from Multi-Mission Earth Observations

Institute of Geographic Sciences and Natural Resources Research, Chinese Academy of Sciences, Beijing 100101, China
Remote Sens. 2023, 15(7), 1747; https://doi.org/10.3390/rs15071747
Submission received: 11 February 2023 / Revised: 11 March 2023 / Accepted: 23 March 2023 / Published: 24 March 2023
(This article belongs to the Special Issue Remote Sensing Approaches to Groundwater Management and Mapping)

Abstract

:
Climate change and heavy reservoir regulation in the lower Lancang River basin (LLRB) have caused significant impacts on terrestrial water storage (TWS) in several ways, including changes in surface water storage (SWS), soil moisture storage (SMS), and groundwater storage (GWS). Understanding these impacts is crucial for promoting comprehensive cooperation in managing and utilizing water resources within the basin. This study utilized multi-mission Earth observation (EO) datasets, i.e., gravimetry (GRACE/-FO), altimetry (Jason-2, Sentinel-3, and Cryosat-2), imagery (Sentinel-1/2), and microwave sensors (IMERG), as well as gauged meteorological, hydrological data and reanalysis products, to investigate the spatial-temporal variation of water resources in the LLRB. The study shows that the fluctuations in precipitation and the construction of reservoirs are the primary drivers of changes in the TWS anomaly (TWSA) in the region. Precipitation decreased significantly from 2010 to 2019 (−34.68 cm/yr), but the TWSA showed a significant increase (8.96 cm/yr) due to enhanced water storage capacity in the Xiaowan and Nuozhadu reservoirs. SWS and GWS were also analyzed, with SWS showing a decrease (−5.48 cm/yr) from 2010 to 2019 due to declining precipitation and increasing evaporation. GWS exhibited a steady rise (9.73 cm/yr) due to the maintenance of groundwater levels by the reservoirs. This study provides valuable insights into the potential of EO data for monitoring water resources at a regional scale.

1. Introduction

Terrestrial water storage (TWS) refers to the total amount of water stored in the land-based water cycle, including groundwater, surface water, soil moisture, and snow and ice [1,2]. Understanding the distribution, variability, and dynamics of terrestrial water storage is crucial for many aspects of water resources management, including water supply, water quality, and flood control [3,4,5,6,7,8]. Particularly in international river basins [9,10,11,12], such as the transboundary Lancang-Mekong River, the assessment of TWS is crucial for ensuring sustainable water resource utilization and potentially mitigating conflicts among countries [13,14,15,16].
The transboundary Lancang-Mekong River, which flows through six countries in Southeast Asia, is one of the world’s largest river basins and is home to a complex system of cascade reservoirs [17]. Reservoirs in the Lancang-Mekong River basin play a crucial role in managing water resources, including regulating streamflow and storing water for hydropower generation, irrigation, and other uses [18,19,20,21,22]. China has built only a small number of dams (11 out of 100 or more) in the entire Mekong River basin [18,23]. However, these limited dams in the Upper Mekong River (Lancang) have substantial storage capacity (about 42 km3) and regulate a significant portion of the river’s discharge (55% of the average annual flow in Northern Thailand) [24]. Among them, Xiaowan and Nuozhadu are the two largest reservoirs and account for massive storage capacity and adjustment ability: about 34% and 50%, respectively [14]. The two reservoirs can significantly impact the TWS of the region in several ways, including changes in soil moisture and groundwater levels, alterations in the timing and magnitude of streamflow, and the regulation of water for various uses. In turn, these changes can affect the water flow downstream, which can impact the water security of urban areas located along the river. For instance, changes in the timing and quantity of water release from the reservoirs can affect the availability of water for domestic and industrial uses in downstream areas, potentially leading to water scarcity and compromising the water security of urban populations. Therefore, understanding these changes is crucial for promoting comprehensive cooperation in managing and utilizing water resources within the basin. However, the influence of the large reservoirs on the surface and sub-surface water storages over the basin has not been comprehensively investigated due to data availability constraints and other geopolitical reasons [25,26,27,28,29,30].
The latest Earth observation (EO) satellites, such as the Gravity Recovery and Climate Experiment (GRACE) [31], Sentinel imagery [32], and altimetry [33], provide exceptional opportunities for monitoring different water balance components with near real-time or limited delay. Hence, EO data serves as a promising solution for observing and assessing changes in water storage within the region. The GRACE mission has enabled scientists to measure TWS changes (including surface water storage, soil moisture water storage, and groundwater storage) on a global scale and provide new insights into the water balance of watersheds [12,34,35,36]. For example, the GRACE satellite mission has enabled the monitoring of groundwater storage changes in regions experiencing significant depletion, including in Northwest India [37], the U.S. High Plains [38], and the California Central Valley [39]. Moreover, GRACE products have demonstrated great potential in monitoring TWS balance in response to droughts and floods [40]. Additionally, remote sensing EO data can provide complementary information to GRACE data [34], such as satellite radar altimetry, synthetic aperture radar (SAR), and optical remote sensing. Combining these data sources with GRACE data can provide a more comprehensive understanding of the Earth’s system and its processes.
EO data provide an alternative approach to monitor and assess water storage variation in the Lancang-Mekong River basin. For example, Jing et al. [12] provided an overview of the total water storage dynamics in the Lancang-Mekong River basin from 2003 to 2016 and compared GRACE and the Global Land Data Assimilation System (GLDAS) data. Jing et al. [12] tried to analyze the impact of reservoirs on TWS but did not quantitatively provide the extent of the impact. Estimating surface water storage (SWS) is difficult due to the sparse monitoring network and limited access to in-situ data. However, advancements in technology have enabled the estimation of SWS through satellite-based methods, including surface water extent (SWE) and water surface elevation (WSE) [41,42,43]. For example, Zhang et al. [14] used GRACE-derived TWS, Sentinel-3-derived WSE, and Sentinel-2-derived SWE to limit hydrological model parameters and to simulate the TWS, SWS, and streamflow variation in the Lancang River basin. Additionally, the impacts of Xiaowan and Nuozhadu reservoirs on TWS and streamflow were quantitatively analyzed. Overall, the existing studies provide a solid foundation for further research on water storage in the Lancang-Mekong River basin. However, these studies have limitations. Firstly, they lack comprehensive and quantitative analysis of individual changes in water balance components and their interrelationships in the context of climate change. Secondly, the impact of Xiaowan and Nuozhadu, the two major reservoirs, on each water balance component has yet to be adequately quantified. Therefore, future research should focus on a more comprehensive analysis of water balance components and their interactions, as well as a more detailed assessment of the impact of reservoir construction on water storage in the region.
In this study, we demonstrate the utilization of several types of satellite Earth observation (EO) datasets that monitor different water balance components for quantitatively evaluating water resources in the lower Lancang River basin before and after the construction of Xiaowan and Nuozhadu reservoirs. Specifically, gravimetry, multiple satellite altimetry, spectral/SAR imagery, and outputs of land surface models (i.e., soil moisture water storage) are used to assess the spatial-temporal dynamics of both surface and subsurface freshwater. Overall, this study intends to address the following objectives: (1) to explore the spatial and temporal variations of TWS as derived from different GRACE solutions; (2) to estimate variations in SWS using gauged monthly discharge, Sentinel-1/2 imagery, and Jason-2, Cyosat-2, Sentinel-3 A/B altimetry; (3) to evaluate groundwater storage (GWS) dynamics.

2. Materials and Methods
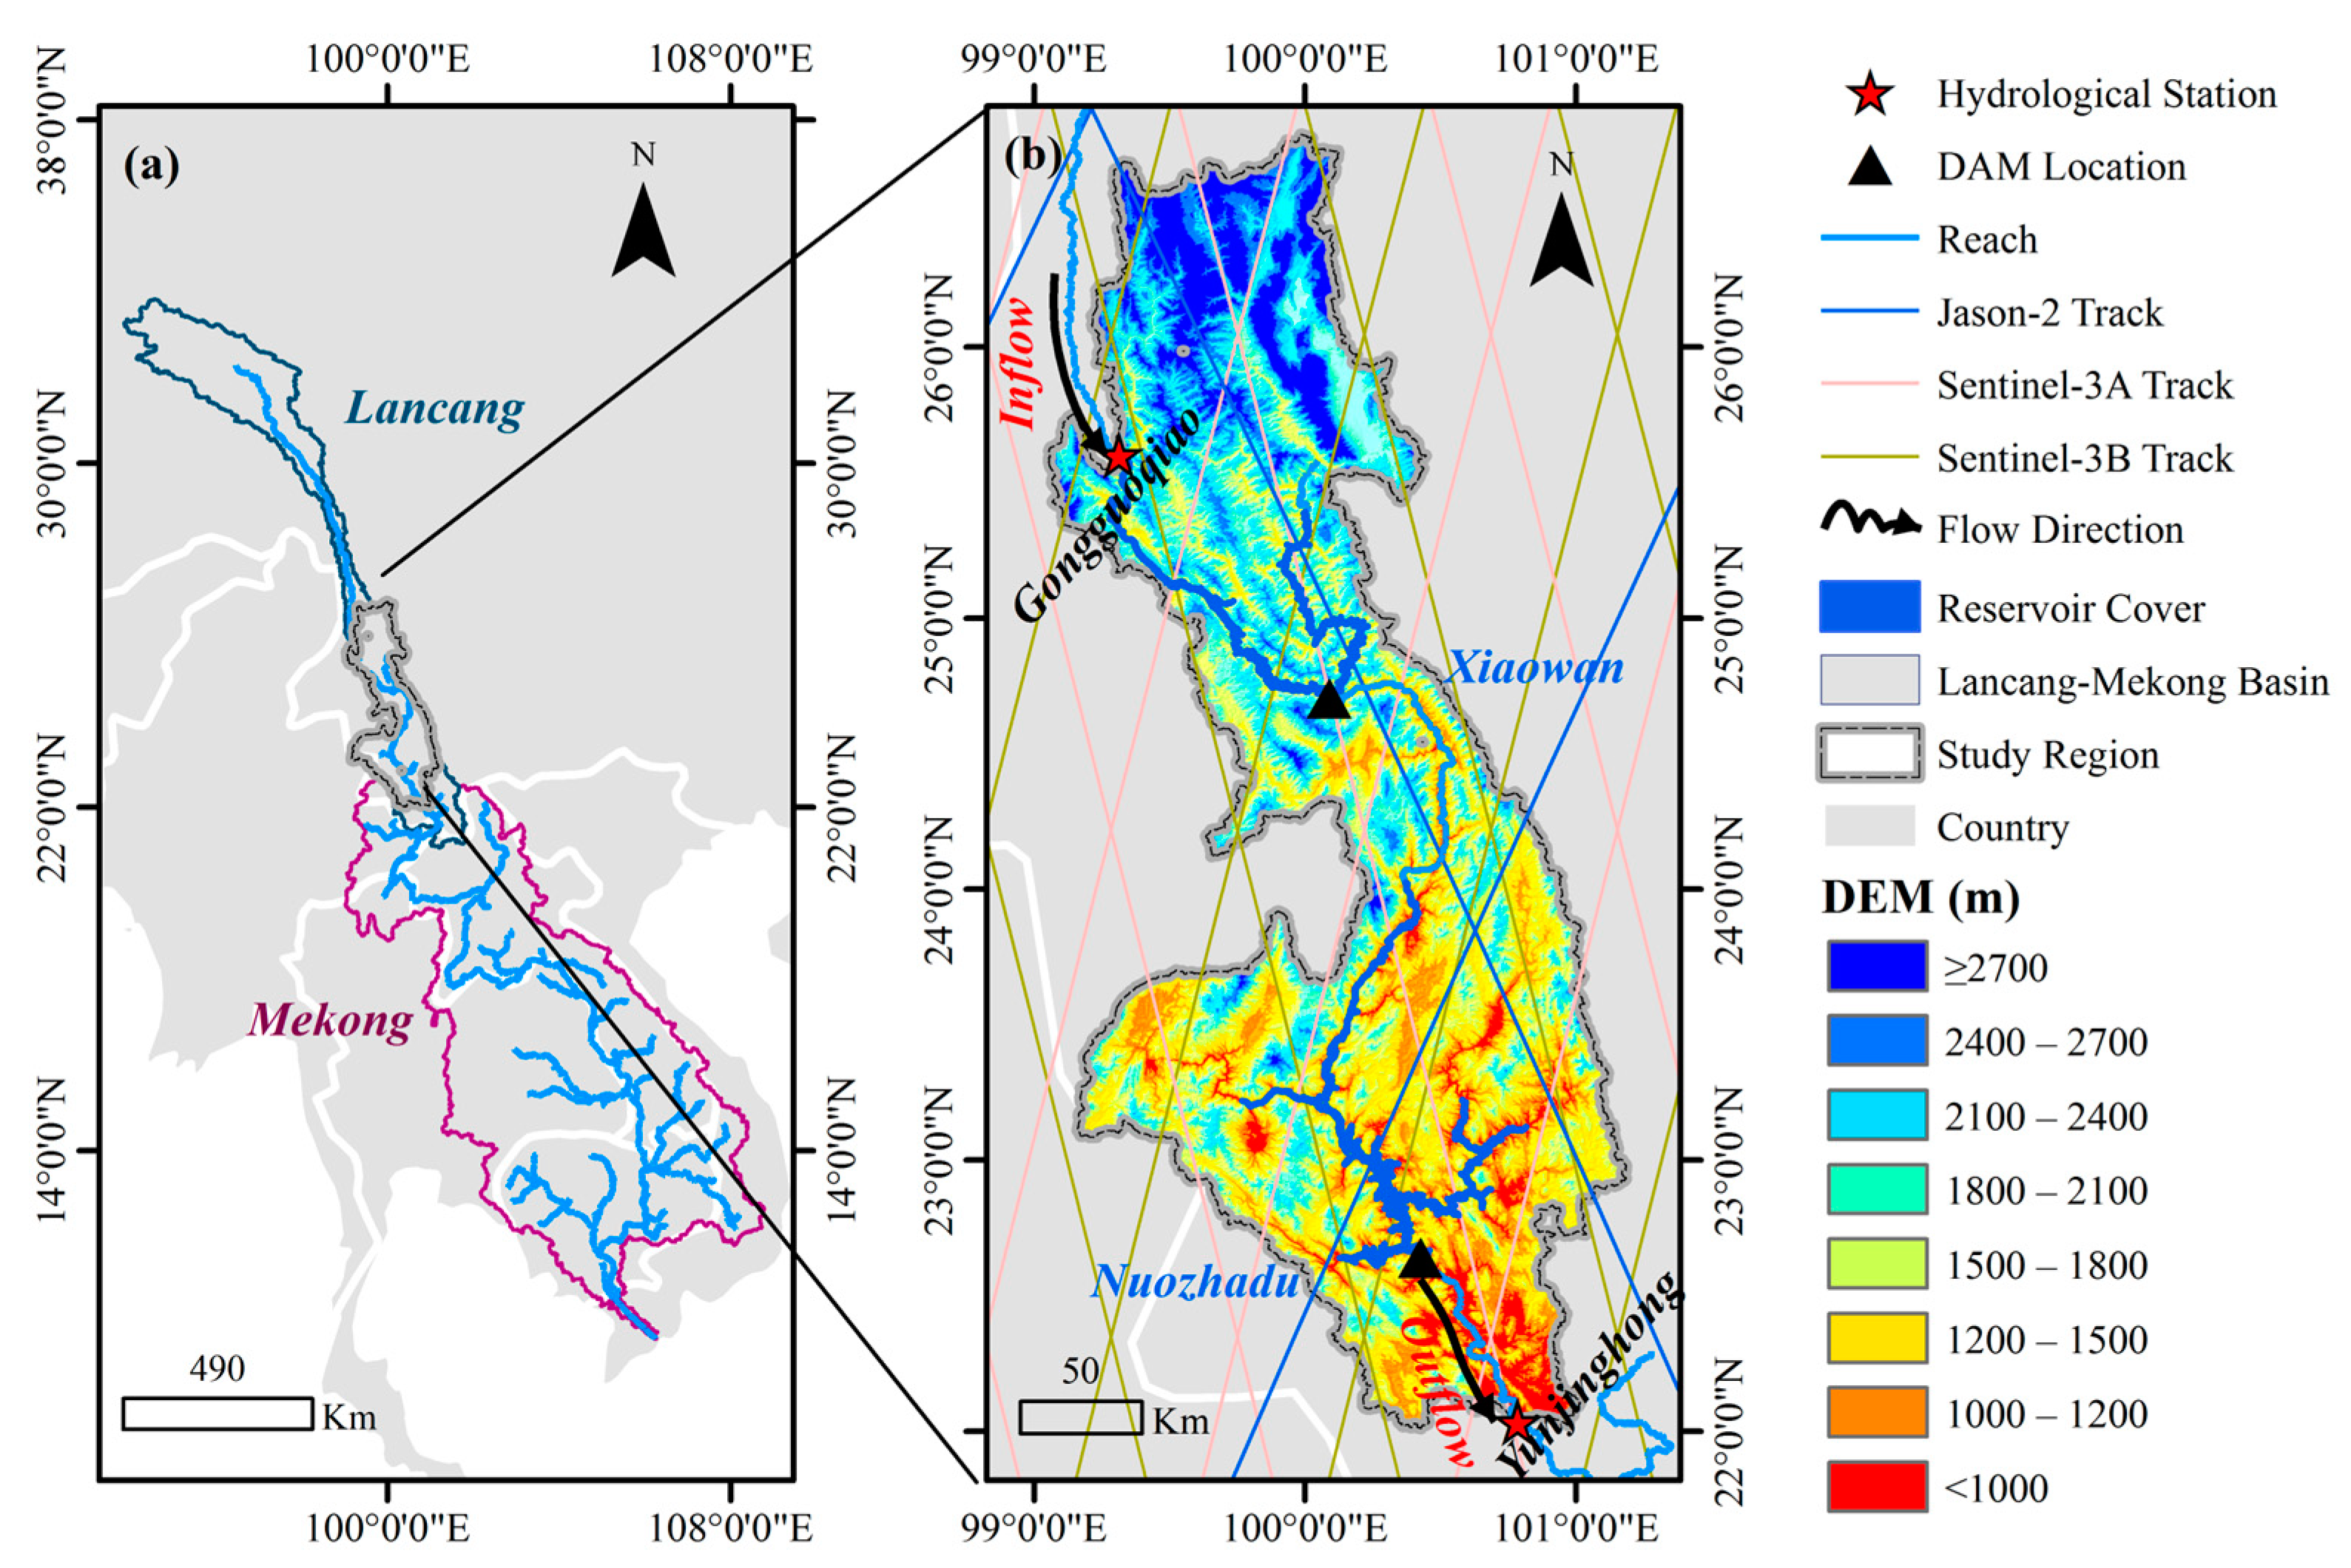
2.1. Study Area

The Lancang-Mekong River is a significant waterway in Asia, starting from the northeast slope of Tanggula Mountain in China and flowing into the Indo-China Peninsula (Figure 1). The total length of the Lancang-Mekong River is 4350 km and the total area is 795,000 km2. The Lancang River is the upper part of the Lancang-Mekong River. It flows out of the border from Yunnan Province, with a total length of approximately 2139 km and a drainage area of approximately 159,000 km2. The Lancang River basin is characterized by a humid southwest monsoon, with a mean annual precipitation of 804 mm. Additionally, the basin’s topography is complex, with an average elevation of 3300 m and a substantial elevation difference of more than 5500 m.
Abundant water resources and unique water head differences provide favorable conditions for the reservoir. There are more than 55 large reservoirs in the Lancang-Mekong River basin and 11 large reservoirs in the Lancang River basin. These projects encompass the two largest engineering structures, Xiaowan Reservoir and Nuozhadu Reservoir (which became operational in 2009 and 2013, respectively), located in the lower Lancang River basin (LLRB) with a total water volume (TWV) of 149.14 billion m3 and 227.41 billion m3, respectively, and total adjustment volume (TAV) of 102.1 billion m3 and 124 billion m3, respectively (Figure 1b). The TWV and TAV of the Xiaowan and Nuozhadu reservoirs are significantly larger than the other 55 reservoirs. The implementation of regulations to govern the dynamics of the Xiaowan and Nuozhadu reservoirs has substantially influenced the LLRB’s water balance components. Therefore, the management of water resources in the Lancang River basin, particularly the regulation of Xiaowan and Nuozhadu reservoirs in the LLRB, has always been a focus of attention in downstream countries. As shown in Figure 1b, the study area is located in the LLRB between Gongguoqiao Station and Yunjinghong Hydrological Station. Both hydrological stations are on the main stream of the Lancang River; other than that, there are no other inflow and outflow rivers in the study area.

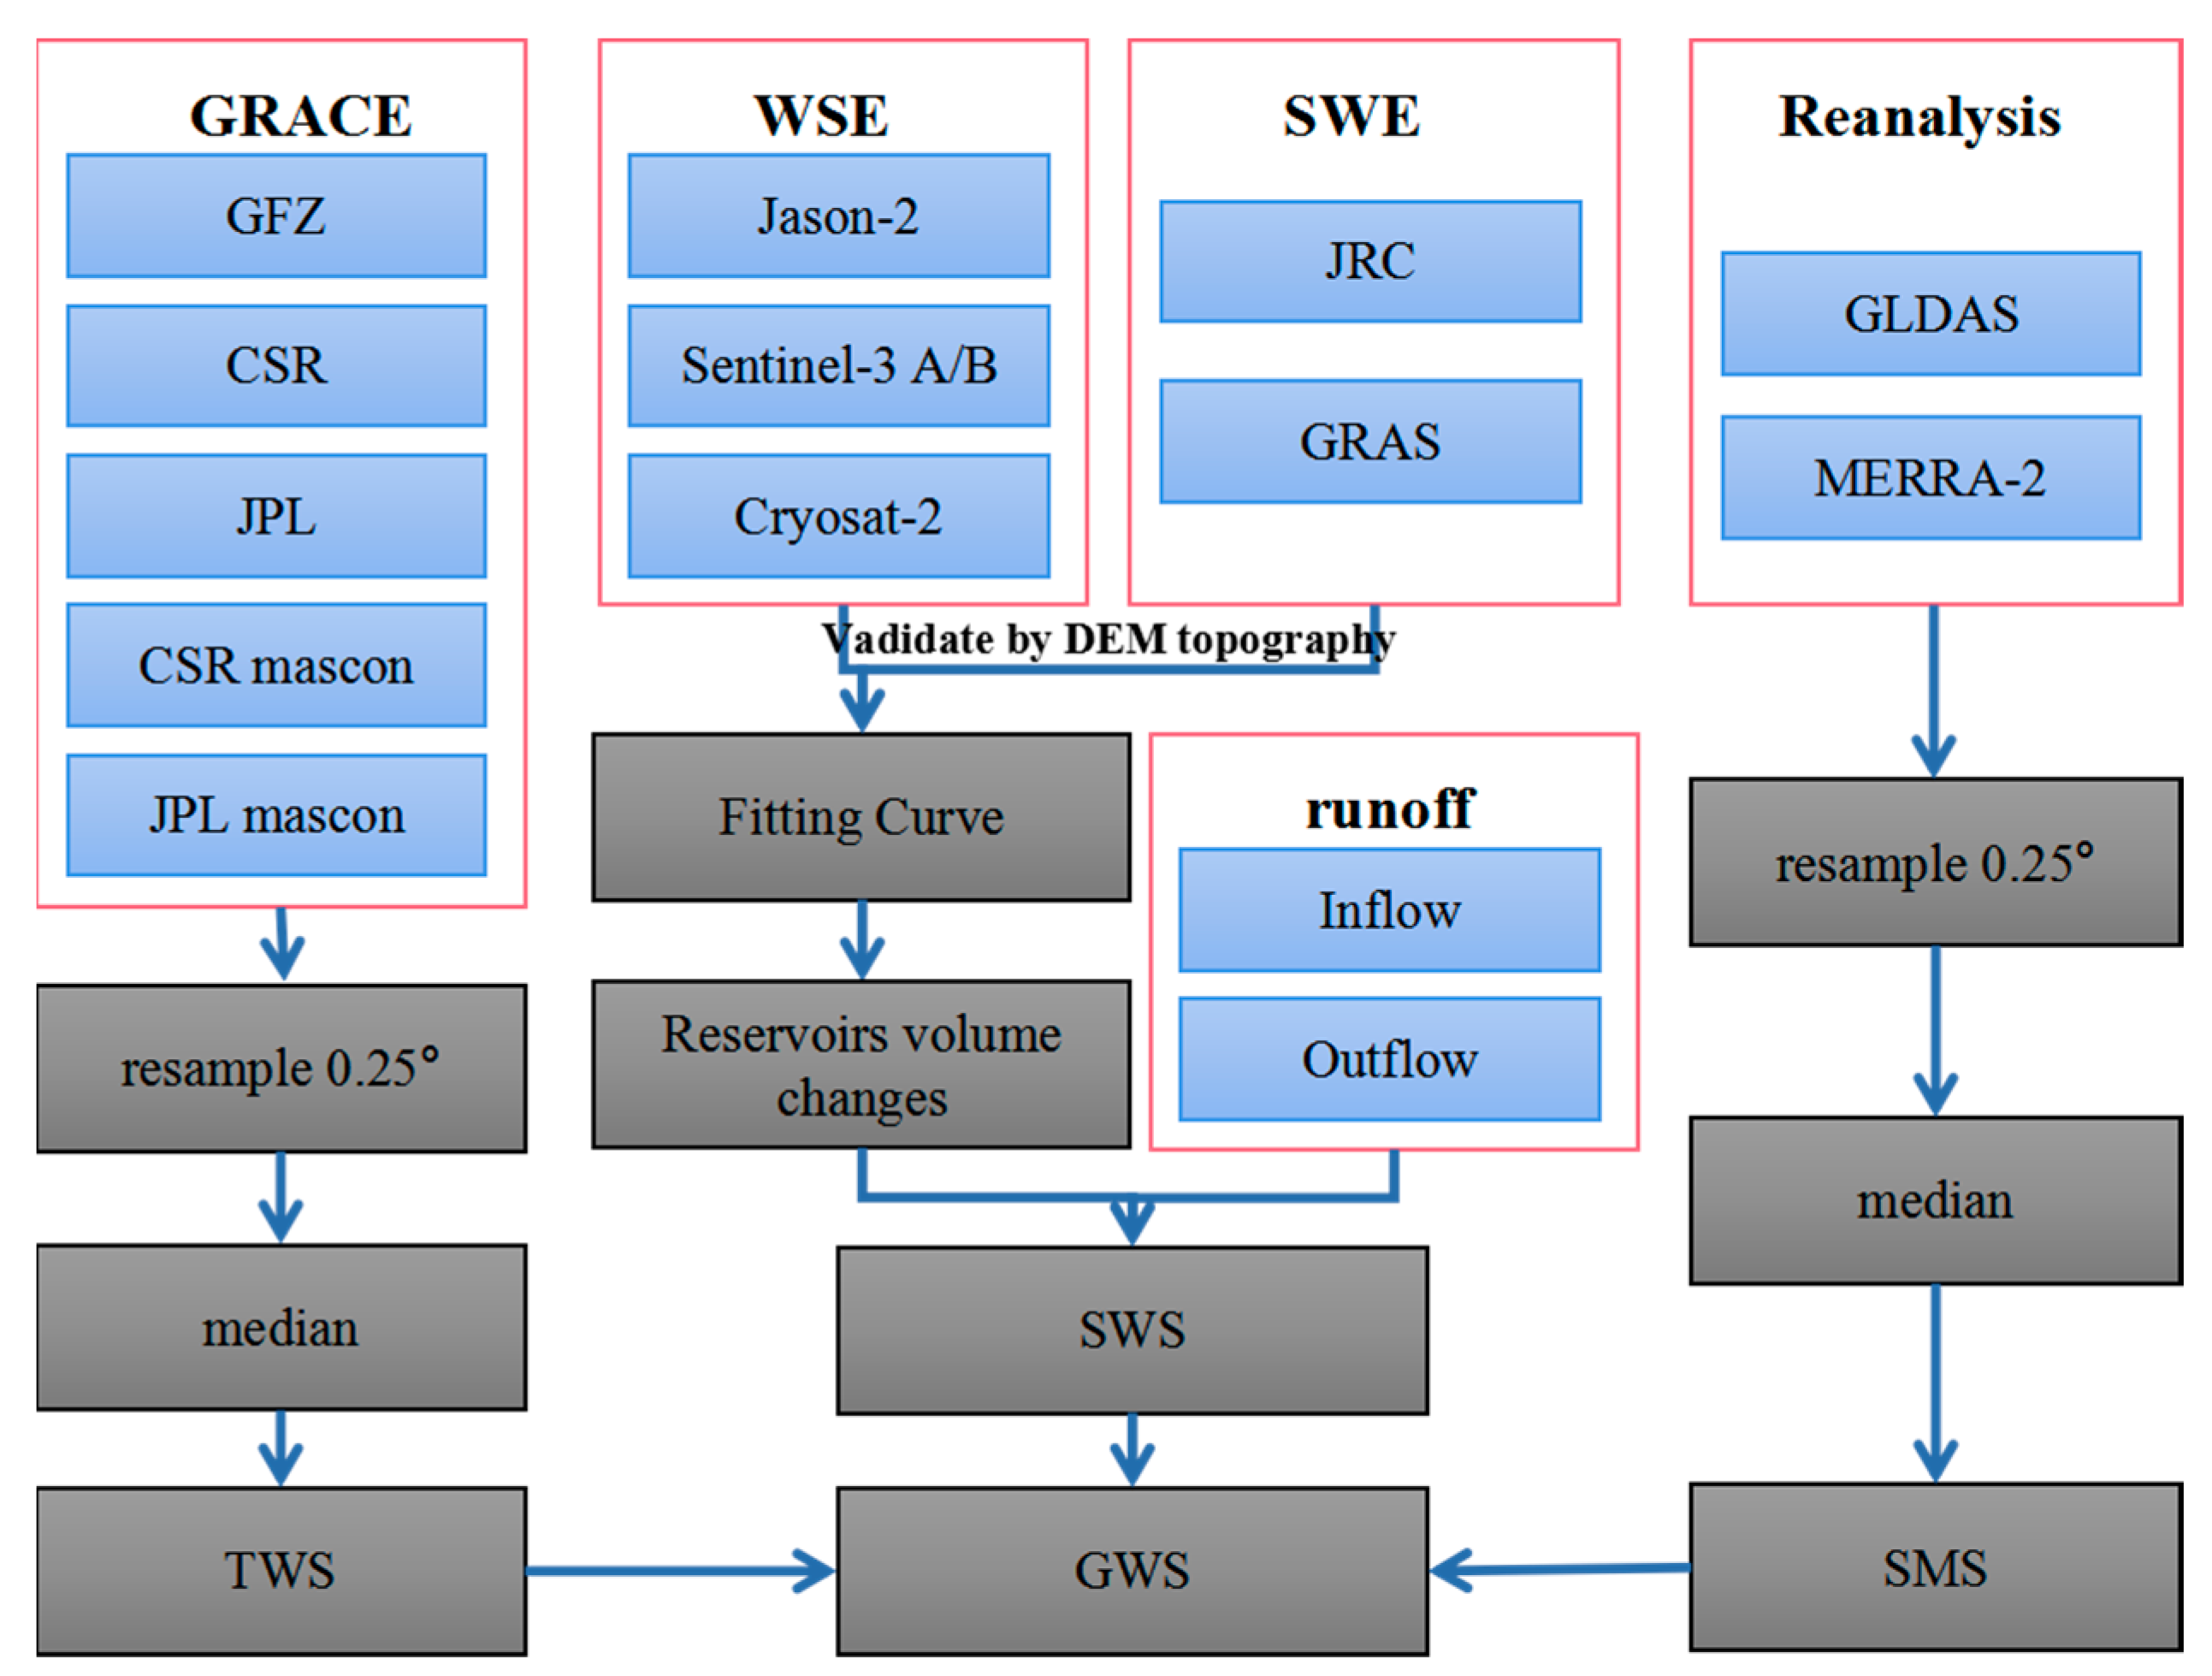
2.2. Methods Overview

The monthly surface and subsurface water storage estimation are accomplished using multi-mission EO data and model outputs using the water balance Equation (1). Where TWS represents terrestrial water storage and the components of surface water storage (SWS), soil moisture storage (SMS), and groundwater storage (GWS) are calculated using the following steps (Figure 2): (1) Monthly TWS is derived from five different GRACE products (GFZ, CSR, JPL, CSR mascon, and JPL mascon). (2) SWS is obtained by summing up net surface runoff and reservoirs volume changes according to Equation (2). Inflow and outflow are obtained through in-situ hydrological station measurements. The volume changes of Xiaowan ( Δ V Xiaowan ) and Nuozhadu (   Δ V Nuozhadu ) reservoirs are estimated from multi-mission-derived WSE and spectral and SAR imagery-derived SWE. (3) The SMS is retrieved from GLDAS and the Modern-Era Retrospective analysis for Research and Applications from NASA Global Modeling and Assimilation Office (MERRA-2). (4) The GWS can be calculated by subtracting SWS and SMS from TWS derived from the above steps according to Equation (3). The units of TWS, SWS, SMS, and GWS are all in centimeters. Both runoff and reservoir volume changes are reported in cubic meters and converted into equivalent water depths (in centimeters) by dividing the area of the study region (S) as shown in Equation (2). The specific information and processing methods of datasets used in this study are described in the following sections. All datasets used in this study are listed in Table 1.
TWS   =   SWS   + SMS   +   GWS  
SWS   = ( Inflow   + Δ V Xiaowan + Δ V Nuozhadu   outflow )
GWS   =   TWS   SWS     SMS  

2.3. GRACE/GRACE-FO Derived TWS

GRACE satellite provided global monthly TWS anomalies (TWSAs) by measuring the minute distance changes between twin satellites caused by changes in the Earth’s gravity field [36]. The GRACE Science System continuously release monthly GRACE solutions from three different processing center, the GeoForschungsZentrum Potsdam (GFZ), the Center for Space Research at the University of Texas, Austin (CSR), and the Jet Propulsion Laboratory (JPL), with each utilizing different parameters and solution strategies [31,44]. Five different TWSA products were utilized in this study: (1) three spherical harmonic coefficients from CSR, GFZ, and JPL (provided at 1°); (2) JPL mascon solutions (provided at 0.5°) [45]; and (3) CSR mascon solutions (provided at 0.5°) [46]. All products cover the GRACE period from April 2002 to June 2017 and the GRACE-FO [47] period from June 2018 to December 2020. There are nineteen months missing TWSA data points during the GRACE and GRACE-FO periods that are supplemented by the nearest neighbor interpolation approach. All products are resampled at 0.25° using a bilinear approach to keep them consistent. This study utilized the GRACE TWSA solutions from 2002 to 2019 (downloaded from https://grace.jpl.nasa.gov/data/get-data/monthly-mass-grids-land/, accessed on 11 July 2022).

2.4. Surface Water Storage (SWS) Estimation

The SWS is estimated according to Equation (2), while the net surface runoff ( Δ R , unit: m3) is calculated using Equation (4). The two in-situ hydrological gauging stations with monthly observed discharge records from 2000 to 2019 represent the inflow and outflow of the study region (provided by the Yunnan Hydrological Bureau, China). The two hydrological stations use the same measurement standards, and the flow is determined using a single line method. The volume changes of the reservoir can be estimated according to Equation (5) [48]. Δ V indicates the volume change in the reservoir (unit: m3), where SWE t (unit: km2) indicates SWE on a specific date t, and Δ WSE (unit: m) denotes the WSE difference between date t and t-1. Continued SWE and WSE data can be easily obtained from spectral and SAR imageries and multi-mission altimetry satellites (see Section 2.4.1 and Section 2.4.2). A SWE-WSE curve is firstly established for Xiaowan and Nuozhadu, respectively, based on a power function shown in Equation (6).
Δ R =   Inflow     Outflow  
Δ V t = SWE t 1 + SWE t + SWE t SWE t 3 Δ WSE  
SWE   WSE = a   WSE h b

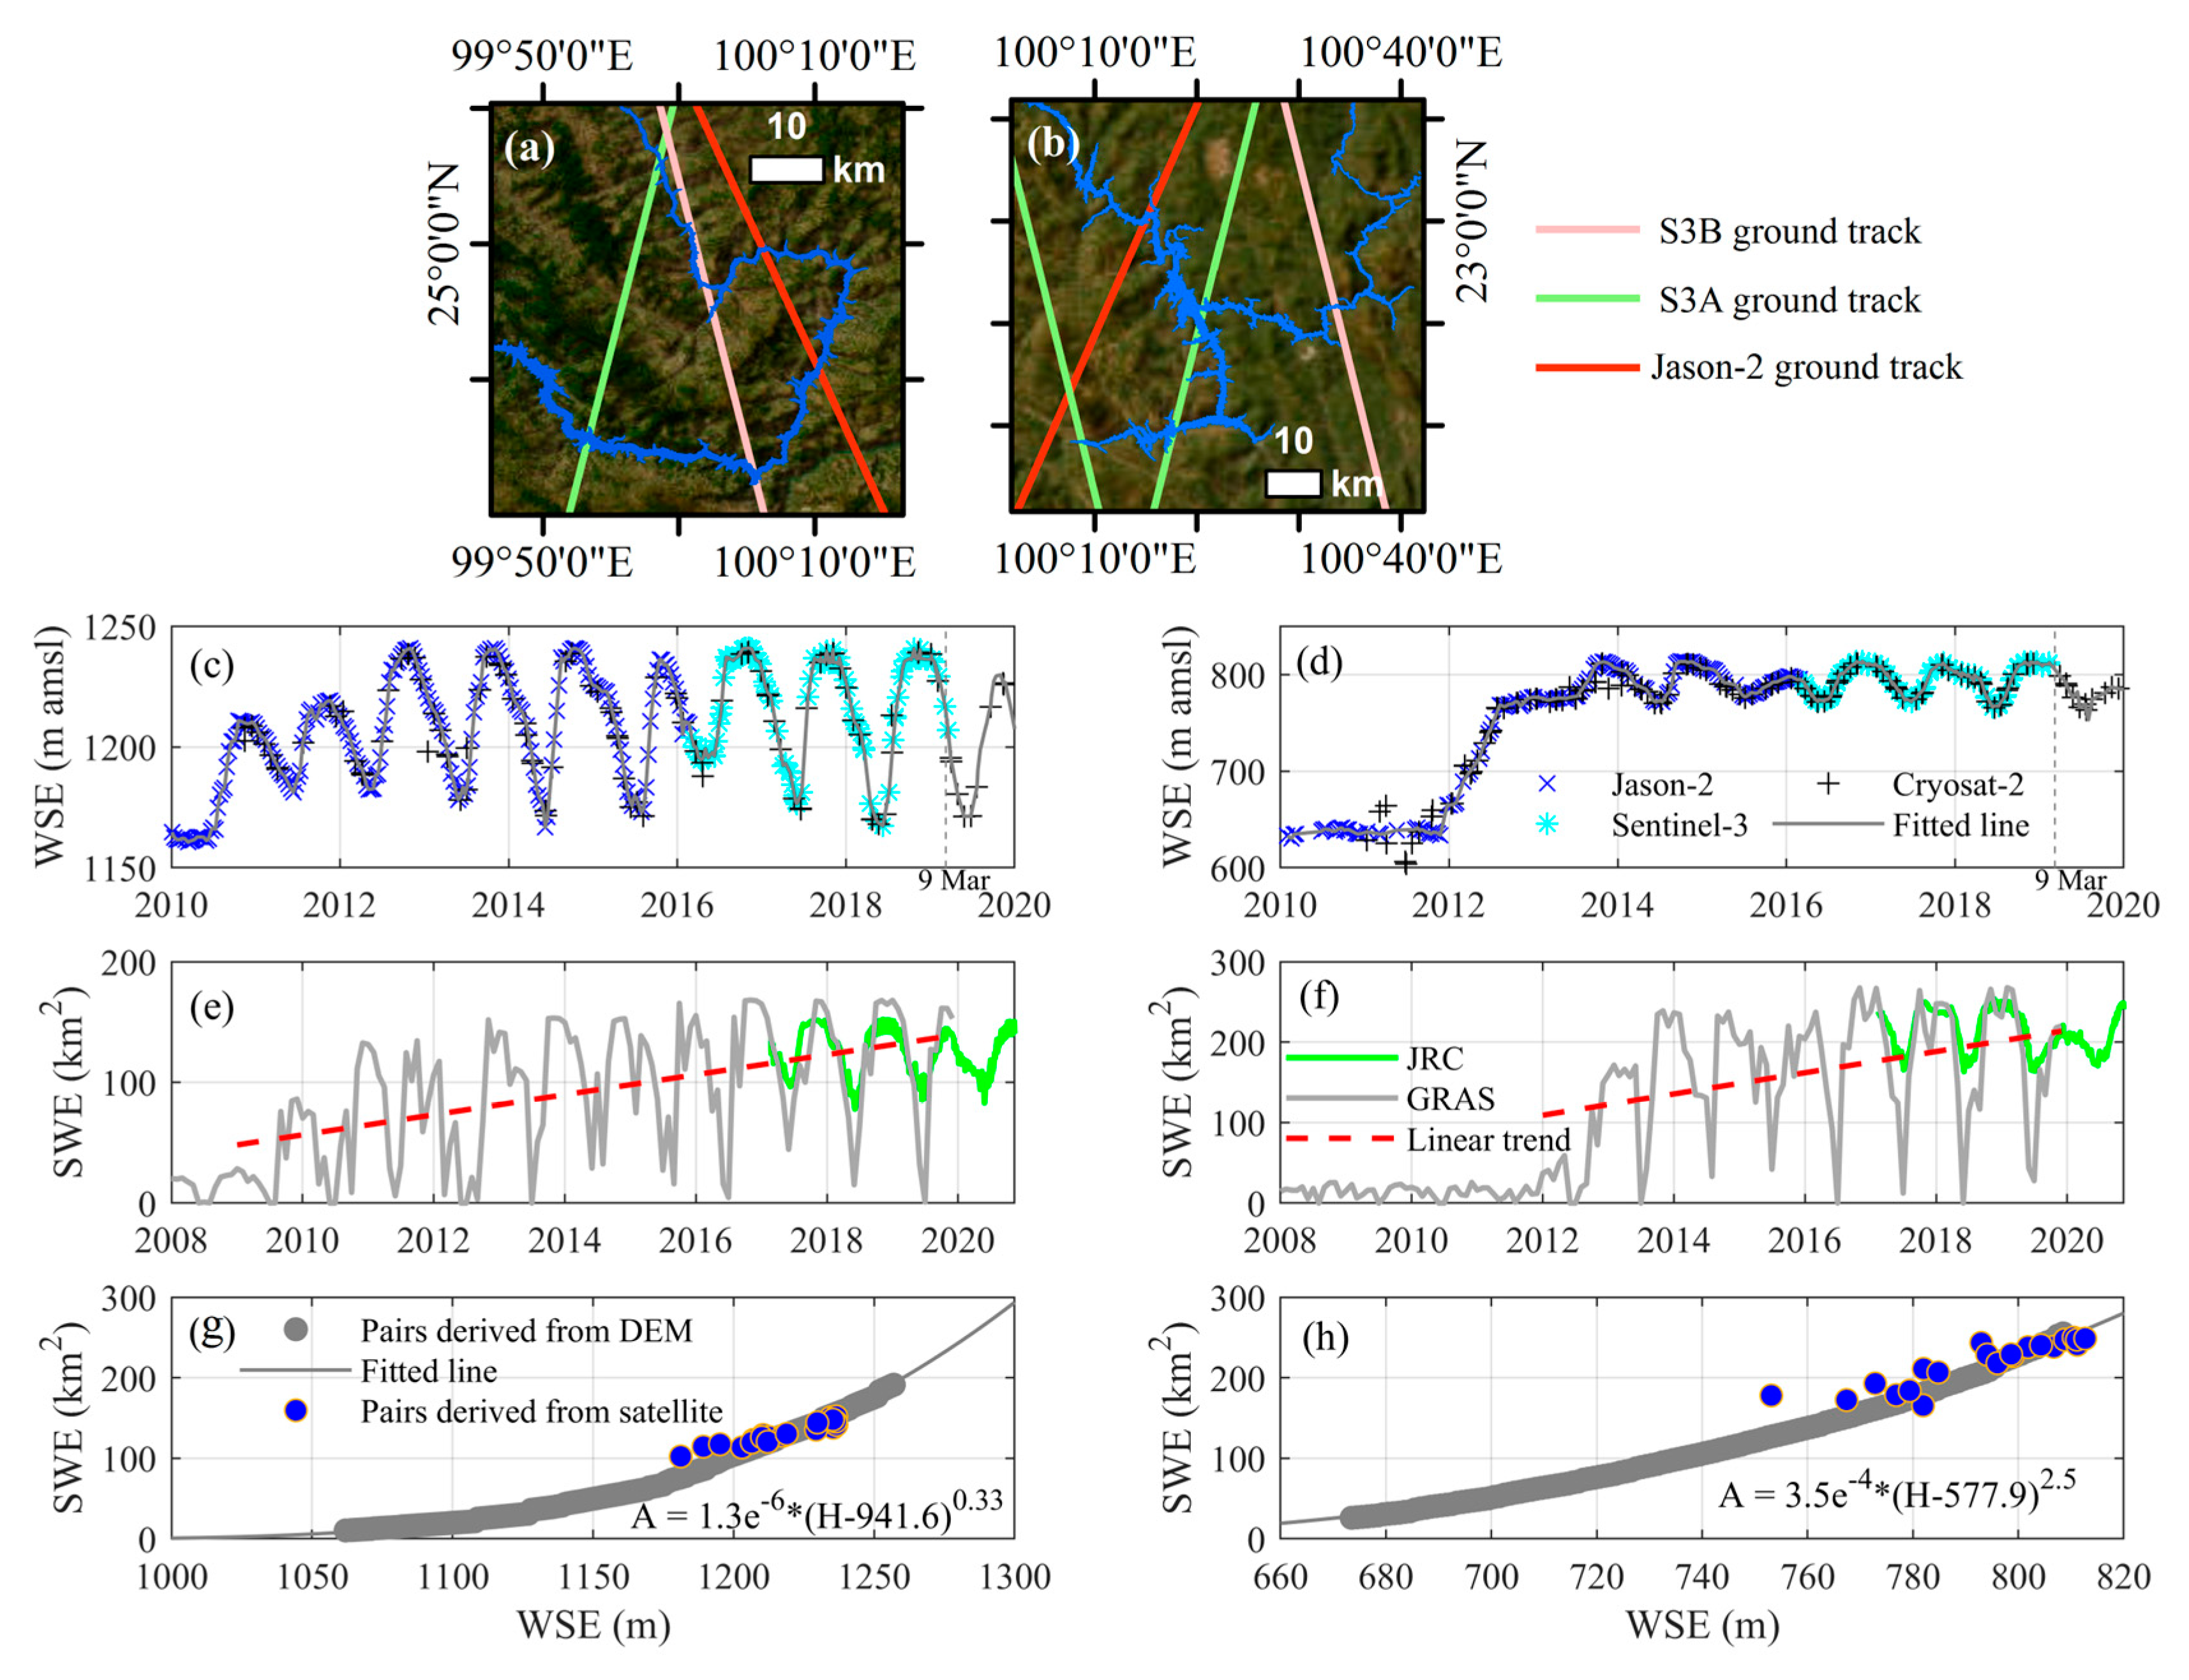
2.4.1. SWE Retrieved from Spectral and SAR Imagery

Two SWE datasets provided by the Joint Research Centre (JRC) and Denmark DHI-GRAS Company (referred to as GRAS) over Xiaowan and Nuozhadu were chosen. The JRC Global Surface Water dataset, produced from Landsat 5, 7, and 8 optical imageries, tracks the temporal and spatial changes in SWE over 32 years (1984–2015) with a 30 m resolution globally [49]. A new algorithm for fusing optical and SAR data to map SWE dynamics has been developed to address the limitations of previous optical-only datasets (GRAS) [50], such as cloud cover and winter coverage [49,51,52]. The algorithm utilizes multiple indices, including VV SAR backscatter from Sentinel-1 [53,54] and the optical Normalized Difference Vegetation Index (NDVI), and the Normalized Difference Water Index (NDWI) calculated from optical images as inputs. By integrating all available Sentinel-2, Landsat, and Sentinel-1 images from 2017–2020, the algorithm employs machine learning and logistic regression techniques, training with the Global Surface Water Dynamics database from the Global Land Analysis and Discovery (GLAD) to map surface water dynamics. GRAS fuses optical and SAR data to provide improved temporal resolution (approximately six times per month) and more accurate results.

2.4.2. WSE Observed from Jason-2, Sentinel-3 A/B and Cryosat-2

The rapid development of satellite radar altimetry technology provides an additional means for monitoring lake/reservoir changes. Jason-2 [55] is a continuation of the TOPEX/Poseidon [56] and Jason-1 missions [33], which was launched in June 2008. Jason-2 is a high-precision radar altimeter that operates in the Ku-band (13.6 GHz) and C-band (5.3 GHz) frequencies with a repeat cycle of 10 days, resulting in a ground footprint ranging from 2 to 4 km, depending on the surface roughness.
CryoSat-2, launched by the European Space Agency in 2010, is equipped with a state-of-the-art synthetic aperture radar altimeter [38,57], with a ground footprint of only about 300 m in the orbital direction and an orbital ground spacing of approximately 7.5 km. CryoSat-2 operates in a drift orbit mode, allowing it to monitor a greater number of inland water bodies, such as rivers, lakes, and reservoirs.
Sentinel-3 mission is not only equipped with a SAR altimeter but the dual-satellite constellation (Sentinel-3A and 3B) also greatly improves the spatial coverage, allowing for a balance of both spatial and temporal resolutions, making it highly beneficial for monitoring inland water bodies [58,59]. Additionally, the Open-Loop Tracking Command (OLTC) [60,61] equipped on Sentinel-3 drives is less affected by topographical effects compared to CryoSat-2 and Jason-2 and holds significant promise for the reliable observation of inland water bodies, particularly medium-sized (approximately 300 m wide) or smaller rivers.
The WSE time series in the study was constructed using data from three different satellite missions, Jason-2 (2010–2016), Sentinel-3 (2016–2019), and Cryosat-2 (2010–2019). Note that system errors between different altimetry tasks must be eliminated when constructing a WSE time series. Detailed data processing was described by [61,62,63].

2.5. Soil Moisture Water Storage (SMS) Estimation

The SMS from two datasets were chosen: (1) the second version of Global Land Data Assimilation (GLDAS 2.1) developed by the National Aeronautics and Space Administration (NASA) Goddard Earth Science Data Information and Services Center [64]; (2) the updated version of the Modern-Era Retrospective analysis for Research and Applications (MERRA-2) from the NASA Global Modeling and Assimilation Office [65]. GLDAS covers the period from 2000 to the present with a spatial resolution of 0.25° × 0.25°. MERRA-2 covers the period from 1980 to the present with a spatial resolution of 0.65° × 0.50°. The MERRA-2 data is resampled at 0.25° using a bilinear approach to keep consistent with GLDAS.

2.6. IMERG and CMAGrid Precipitation

This study considers one satellite-based precipitation estimate and one in-situ rain gauge-based precipitation. Integrated Multi-Satellite Retrievals for GPM (IMERG) [66] is a global high-resolution (0.10° × 0.10°) gridded precipitation dataset that is created by combining information of the GPM satellite constellation. The latest version of IMERG (Version 06) is used in this study, which is bias-corrected by climatological gauge. IMERG is available from 2000 to the present and can be accessed from https://gpm.nasa.gov/data/imerg (accessed on 11 July 2022). The CMAGrid is an official interpolation precipitation grid (0.50° × 0.50°) published by the China Meteorological Administration (CMA) [67], which is interpolated by ANUSPLIN based on Thin Plate Spline (TPS) algorithm and the latest compilation of China’s surface high-density stations (2472 national meteorological observation stations). CMAGrid is available from 1961 to the present and can be accessed from http://data.cma.cn (accessed on 11 July 2022).

2.7. Time Series Decomposition and Trend Estimation

The TWSA series for different GRACE products was obtained by regional averaging. The seasonality of the GRACE-derived TWSA series was removed based on local regression (STL) [68]. STL uses the local regression smoothing (LOESS) operator to decompose the TWSA time series into three components as Equation (7), where T total represents the GRACE-derived TWSA. The TWSA trend refers to the linear trends estimated from T long term , T seasonal , and T residual that represent the long-term trend, the seasonal signal, and the sub-seasonal signal or noise, respectively. All units in Equation (7) are in cm.
T total = T long term + T seasonal + T residual
Additionally, the Mann-Kendall trend test (M-K test) was used to calculate the trend from the de-seasonalized TWSA series and other variables. The M-K test is a nonparametric and robust test commonly used to detect trends in hydrologic data [69]. Further details about the M-K test can be found in [70,71].

3. Results

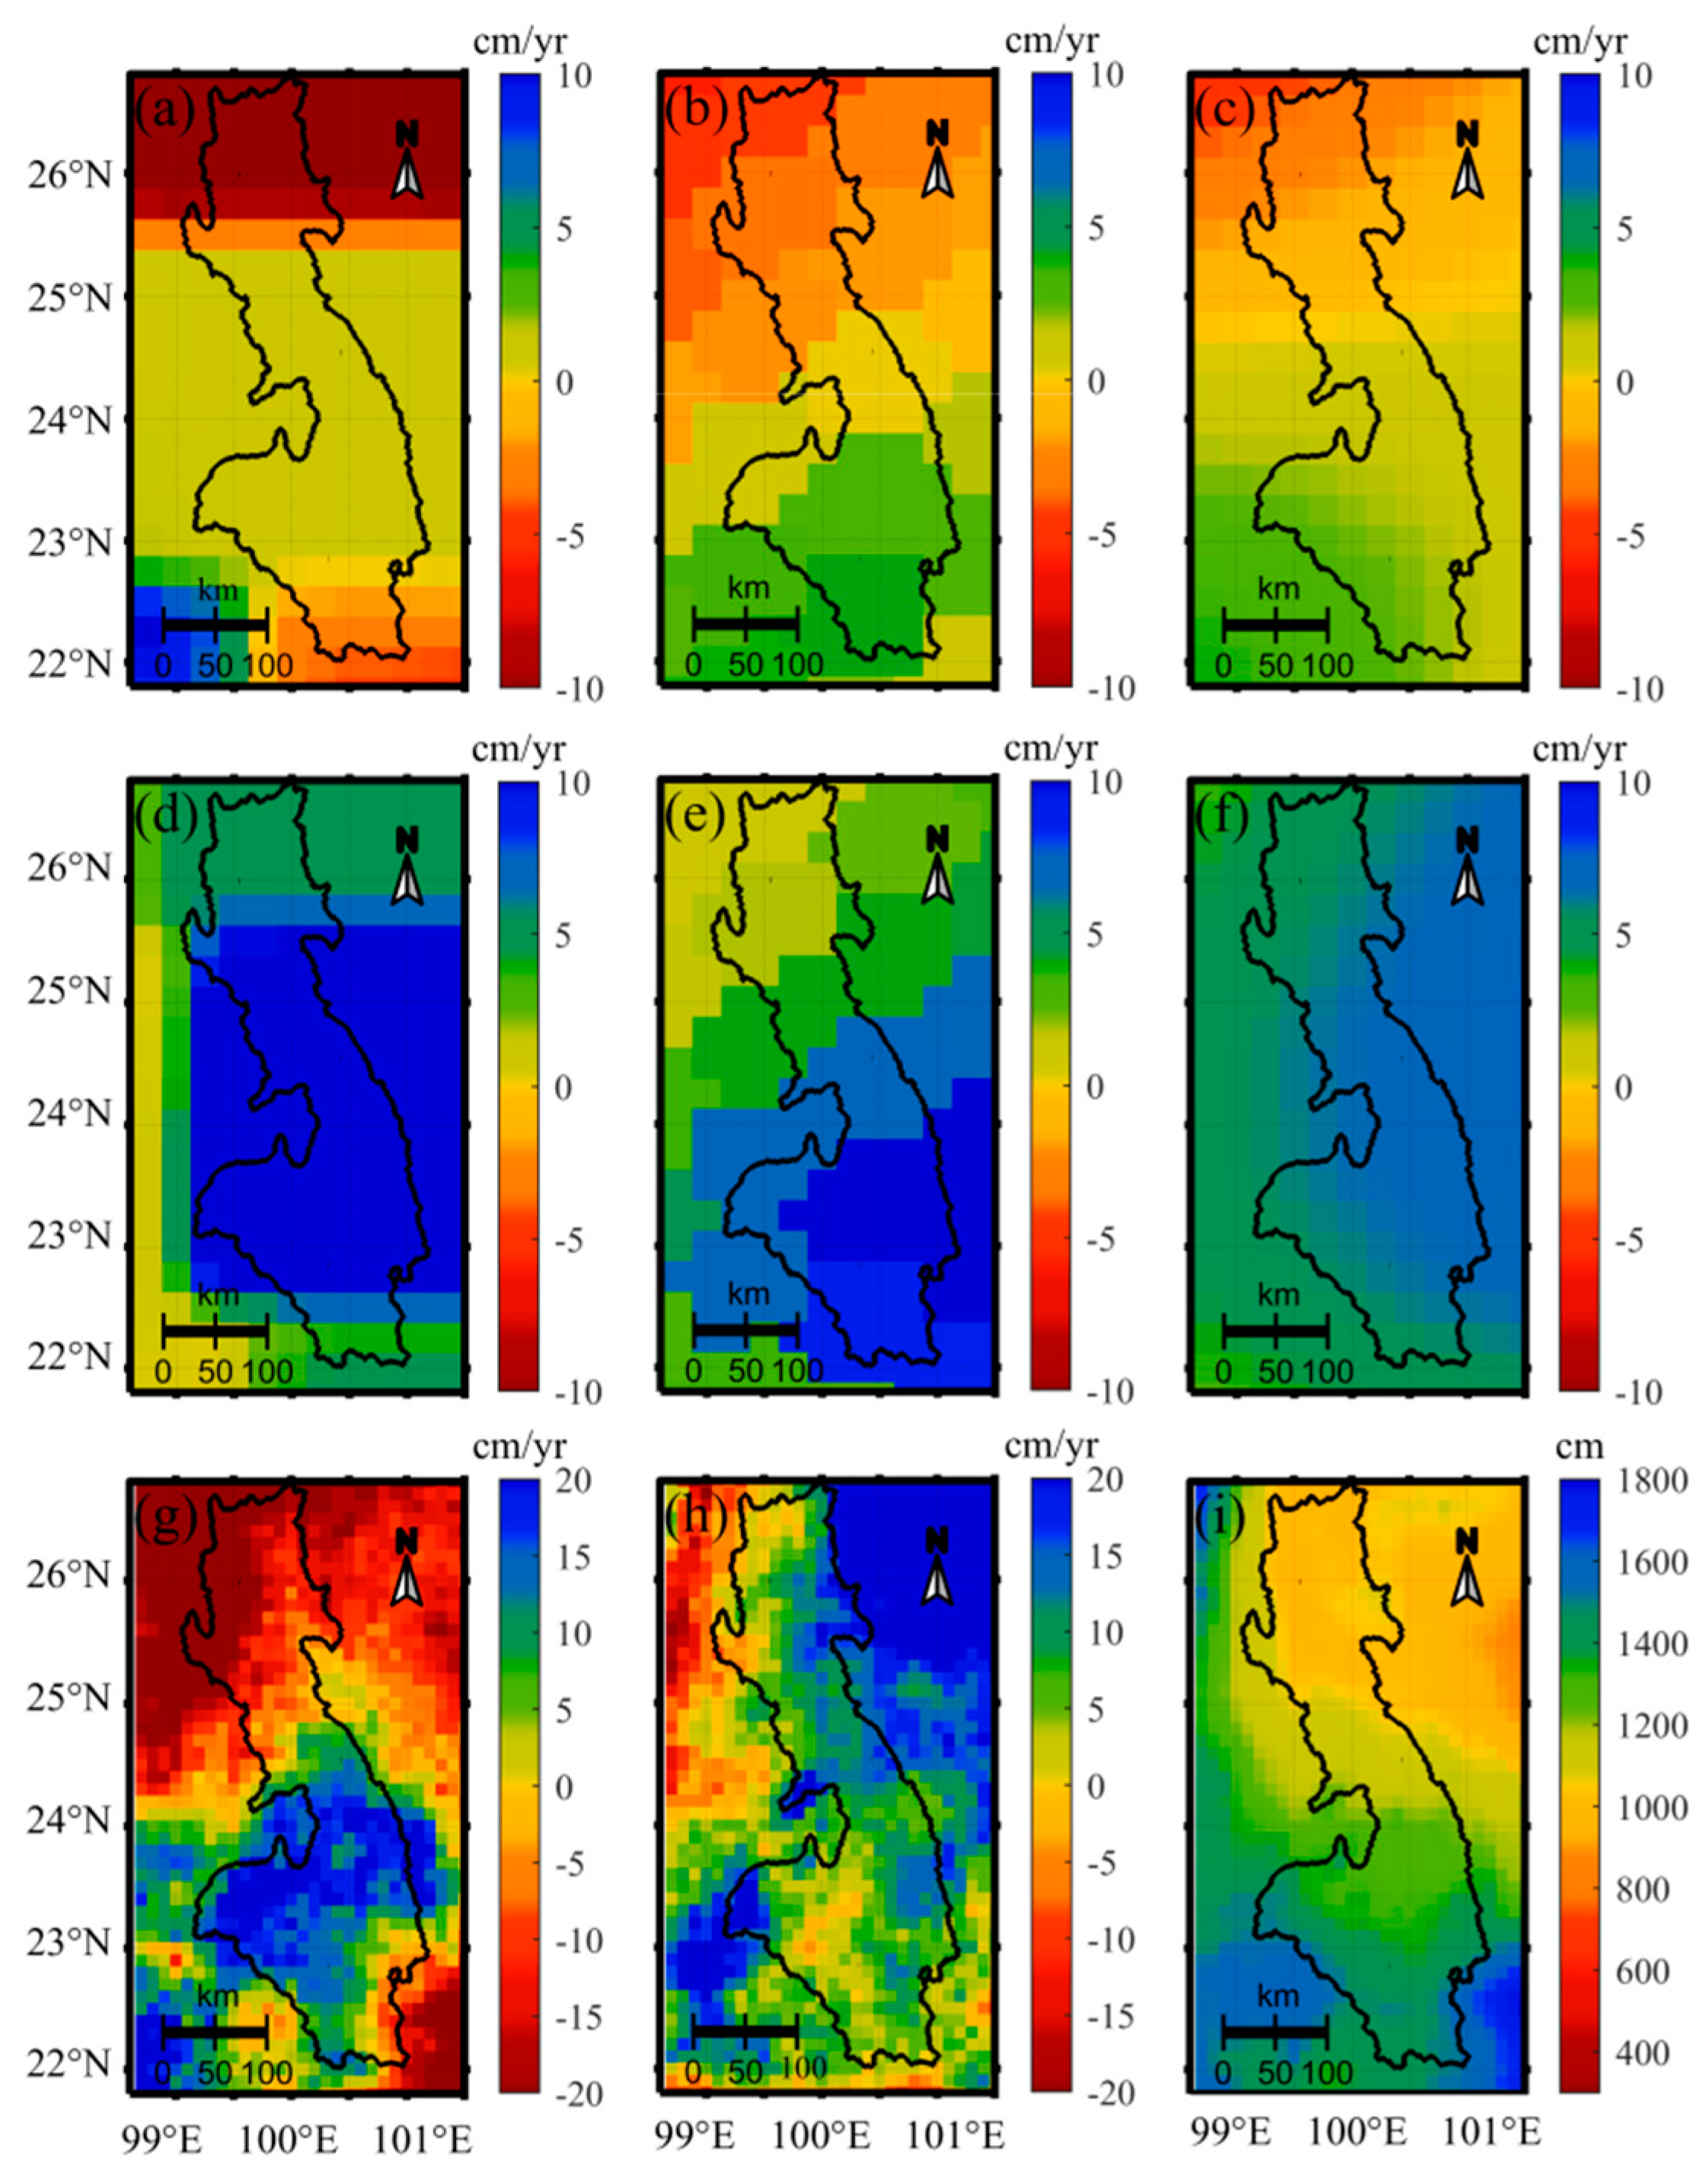
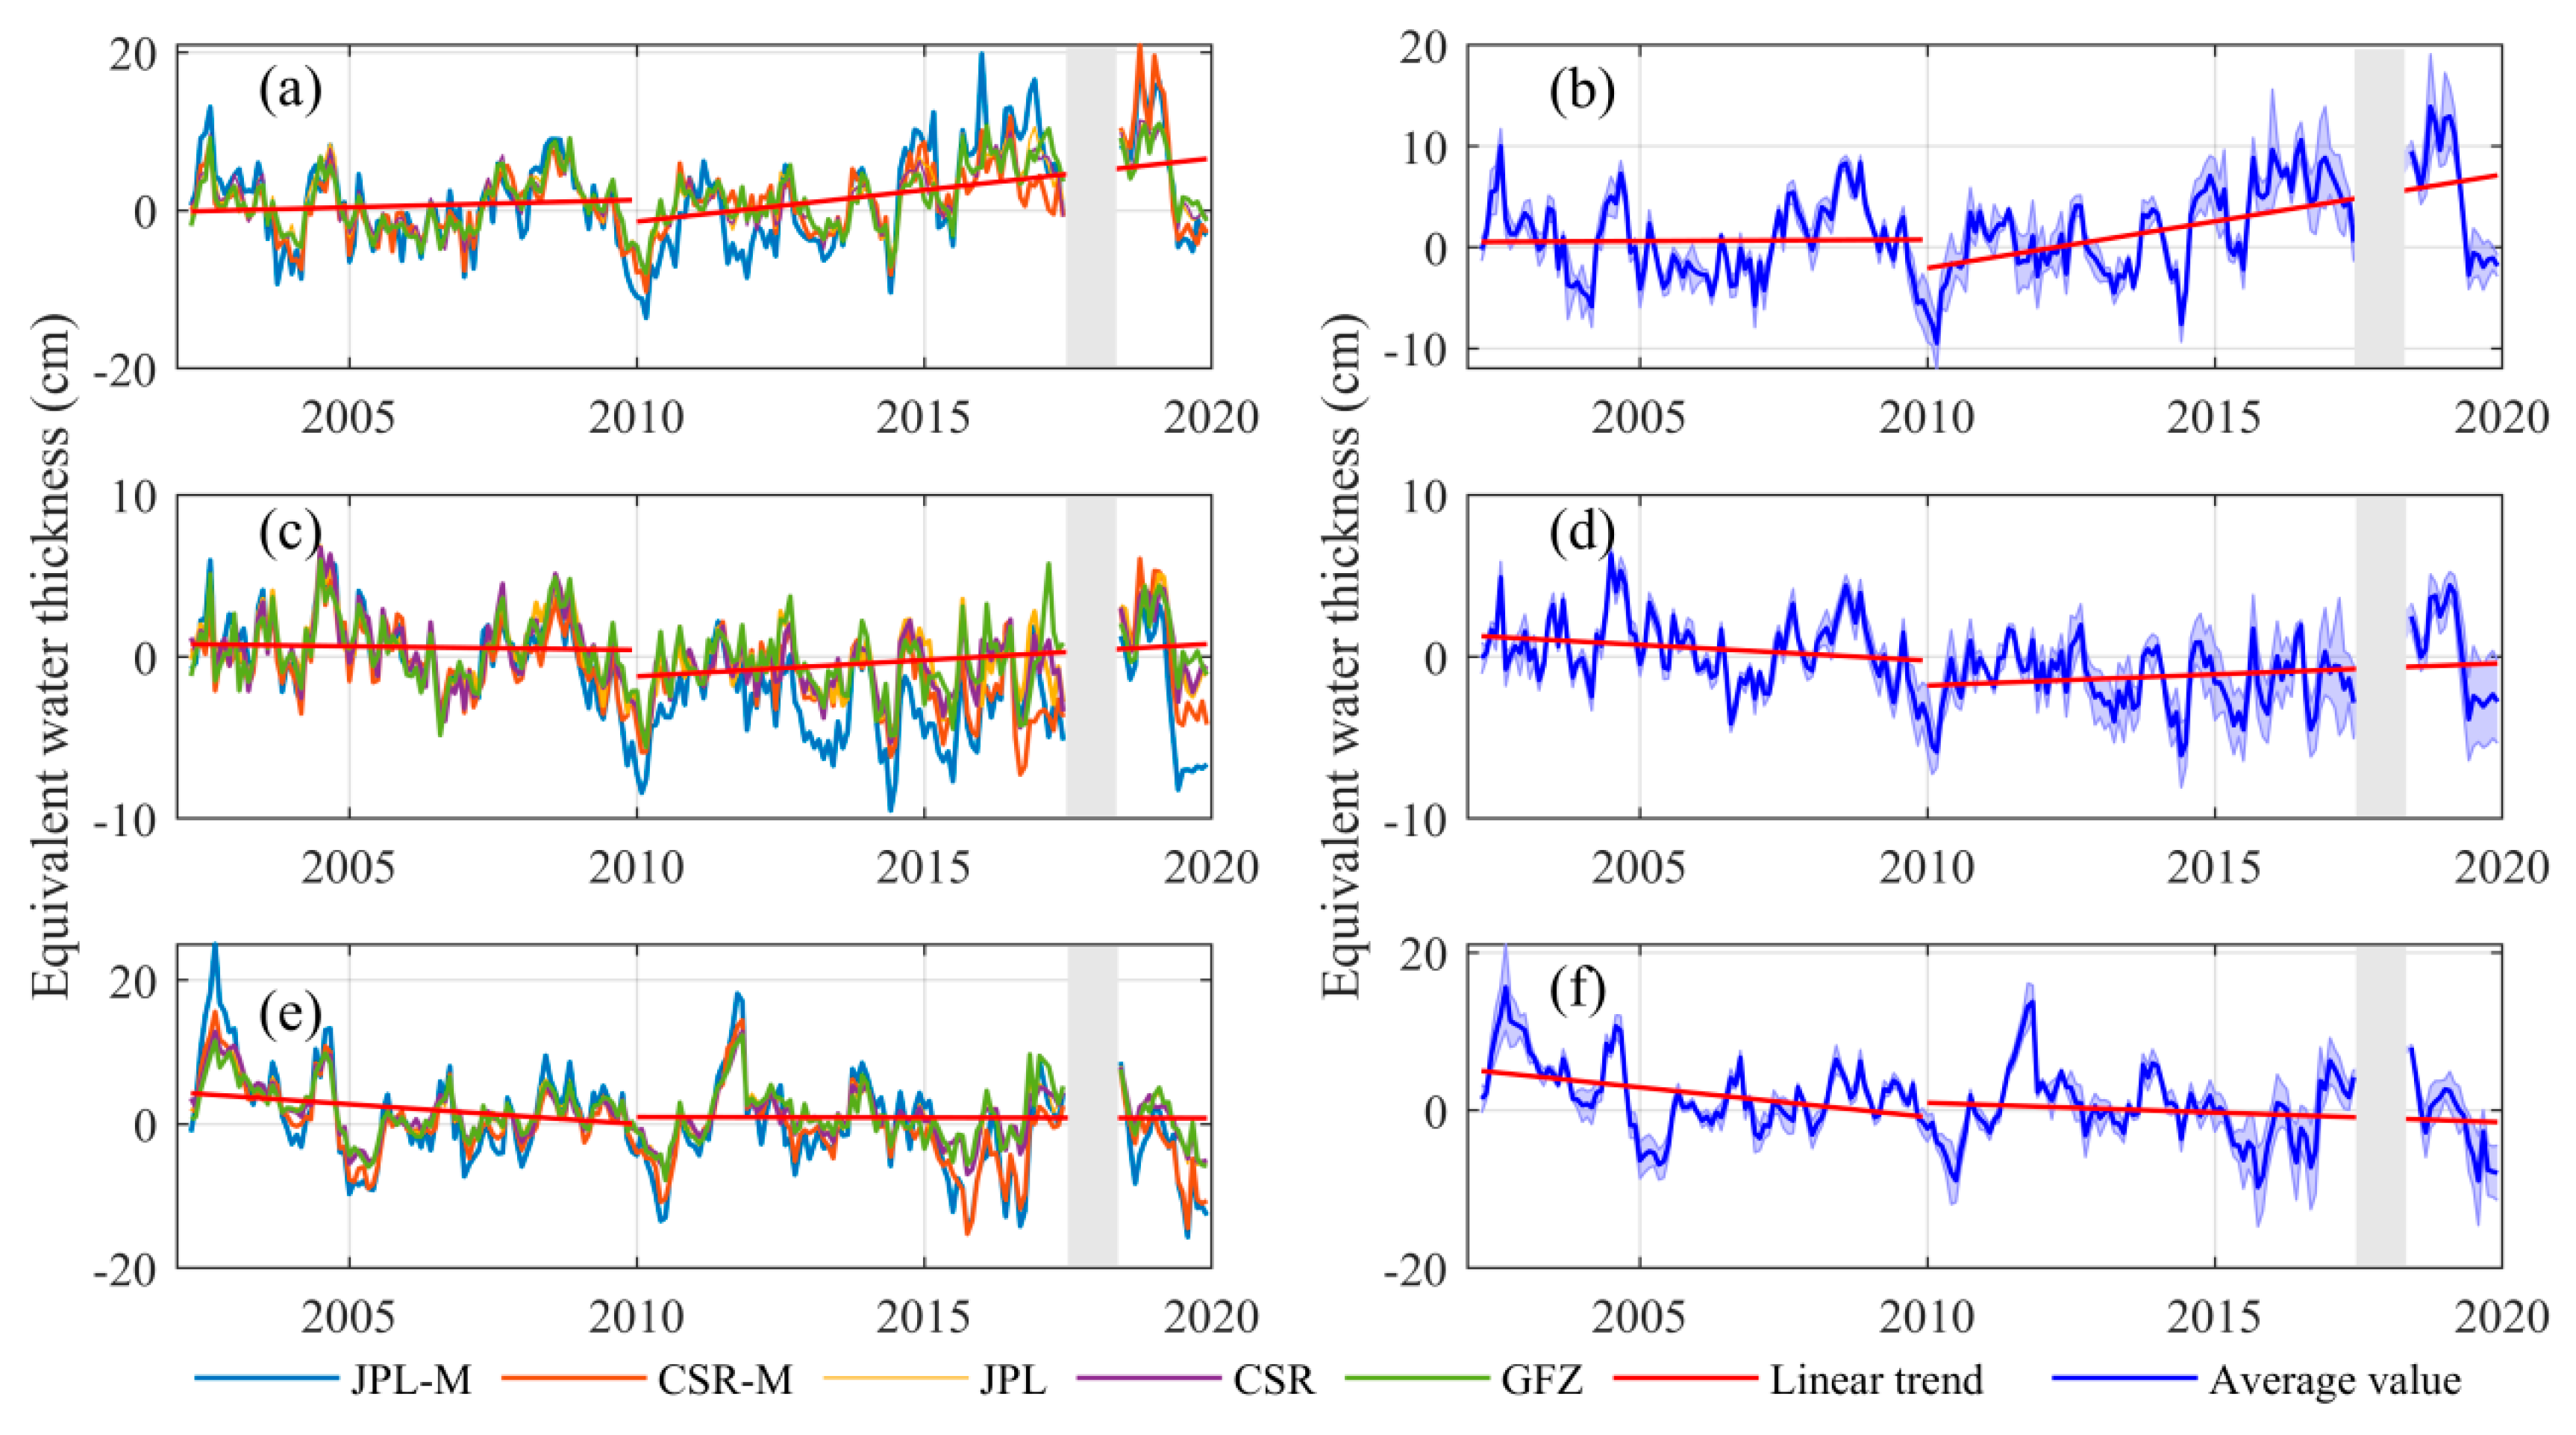
3.1. Spatio-Temporal Patterns of the TWSA

The period is partitioned into two phases: the initial phase, spanning 2000 to 2009, is deemed to be the period of natural conditions, while the latter phase, covering 2010 to 2019, is regarded as the reservoir regulation phase. Figure 3 shows the spatial patterns of the linear trend of GRACE-derived TWSA. All TWSA products indicate a significant decreasing trend in the northern region of the study area from 2002 to 2009 (Figure 3a–c). The JPL mascon shows the most severe drying trend, with a range of values from −2 to −10 cm/yr. However, since 2010, with the impounding of the Xiaowan and Nuozhadu reservoirs, a marked increase trend in the TWSA has been observed. Similarly, the JPL mascon shows more significant trends (2 to 10 cm/yr) compared to CSR mascon and averaged spherical harmonics data (Figure 3d–f). Precipitation in the northern region of the study area showed a decreasing trend from 2002 to 2009, with the fastest decreasing rate of decline exceeding 20 cm/yr, while in the southern region, it increased. From 2010 to 2019, precipitation showed a slightly decreasing trend, dominating the study region.
The TWSA time series in the study region, as well as the Lancang River basin and Mekong River basin, derived from five GRACE solutions (Figure 4), are in agreement with the results shown in Figure 3. During the period from 2002 to 2009, the TWSA in the study region showed a slight upward trend, while exhibiting a particularly pronounced decline (p < 0.05) in the Lancang (−2.21 cm/yr) and Mekong River basins (−8.65 cm/yr). From 2010 to 2019, the Mekong River basin’s TWSA decreased (−2.48 cm/yr), while both the study region (8.96 cm/yr) and the Lancang River basin (1.85 cm/yr) showed an upward trend. Over the entire 2002–2019 period, the study region showed a significant upward trend (2.95 cm/yr), while both the Lancang (−1.40 cm/yr) and Mekong (−3.36 cm/yr) River basins showed significant downward trends (Table 2).

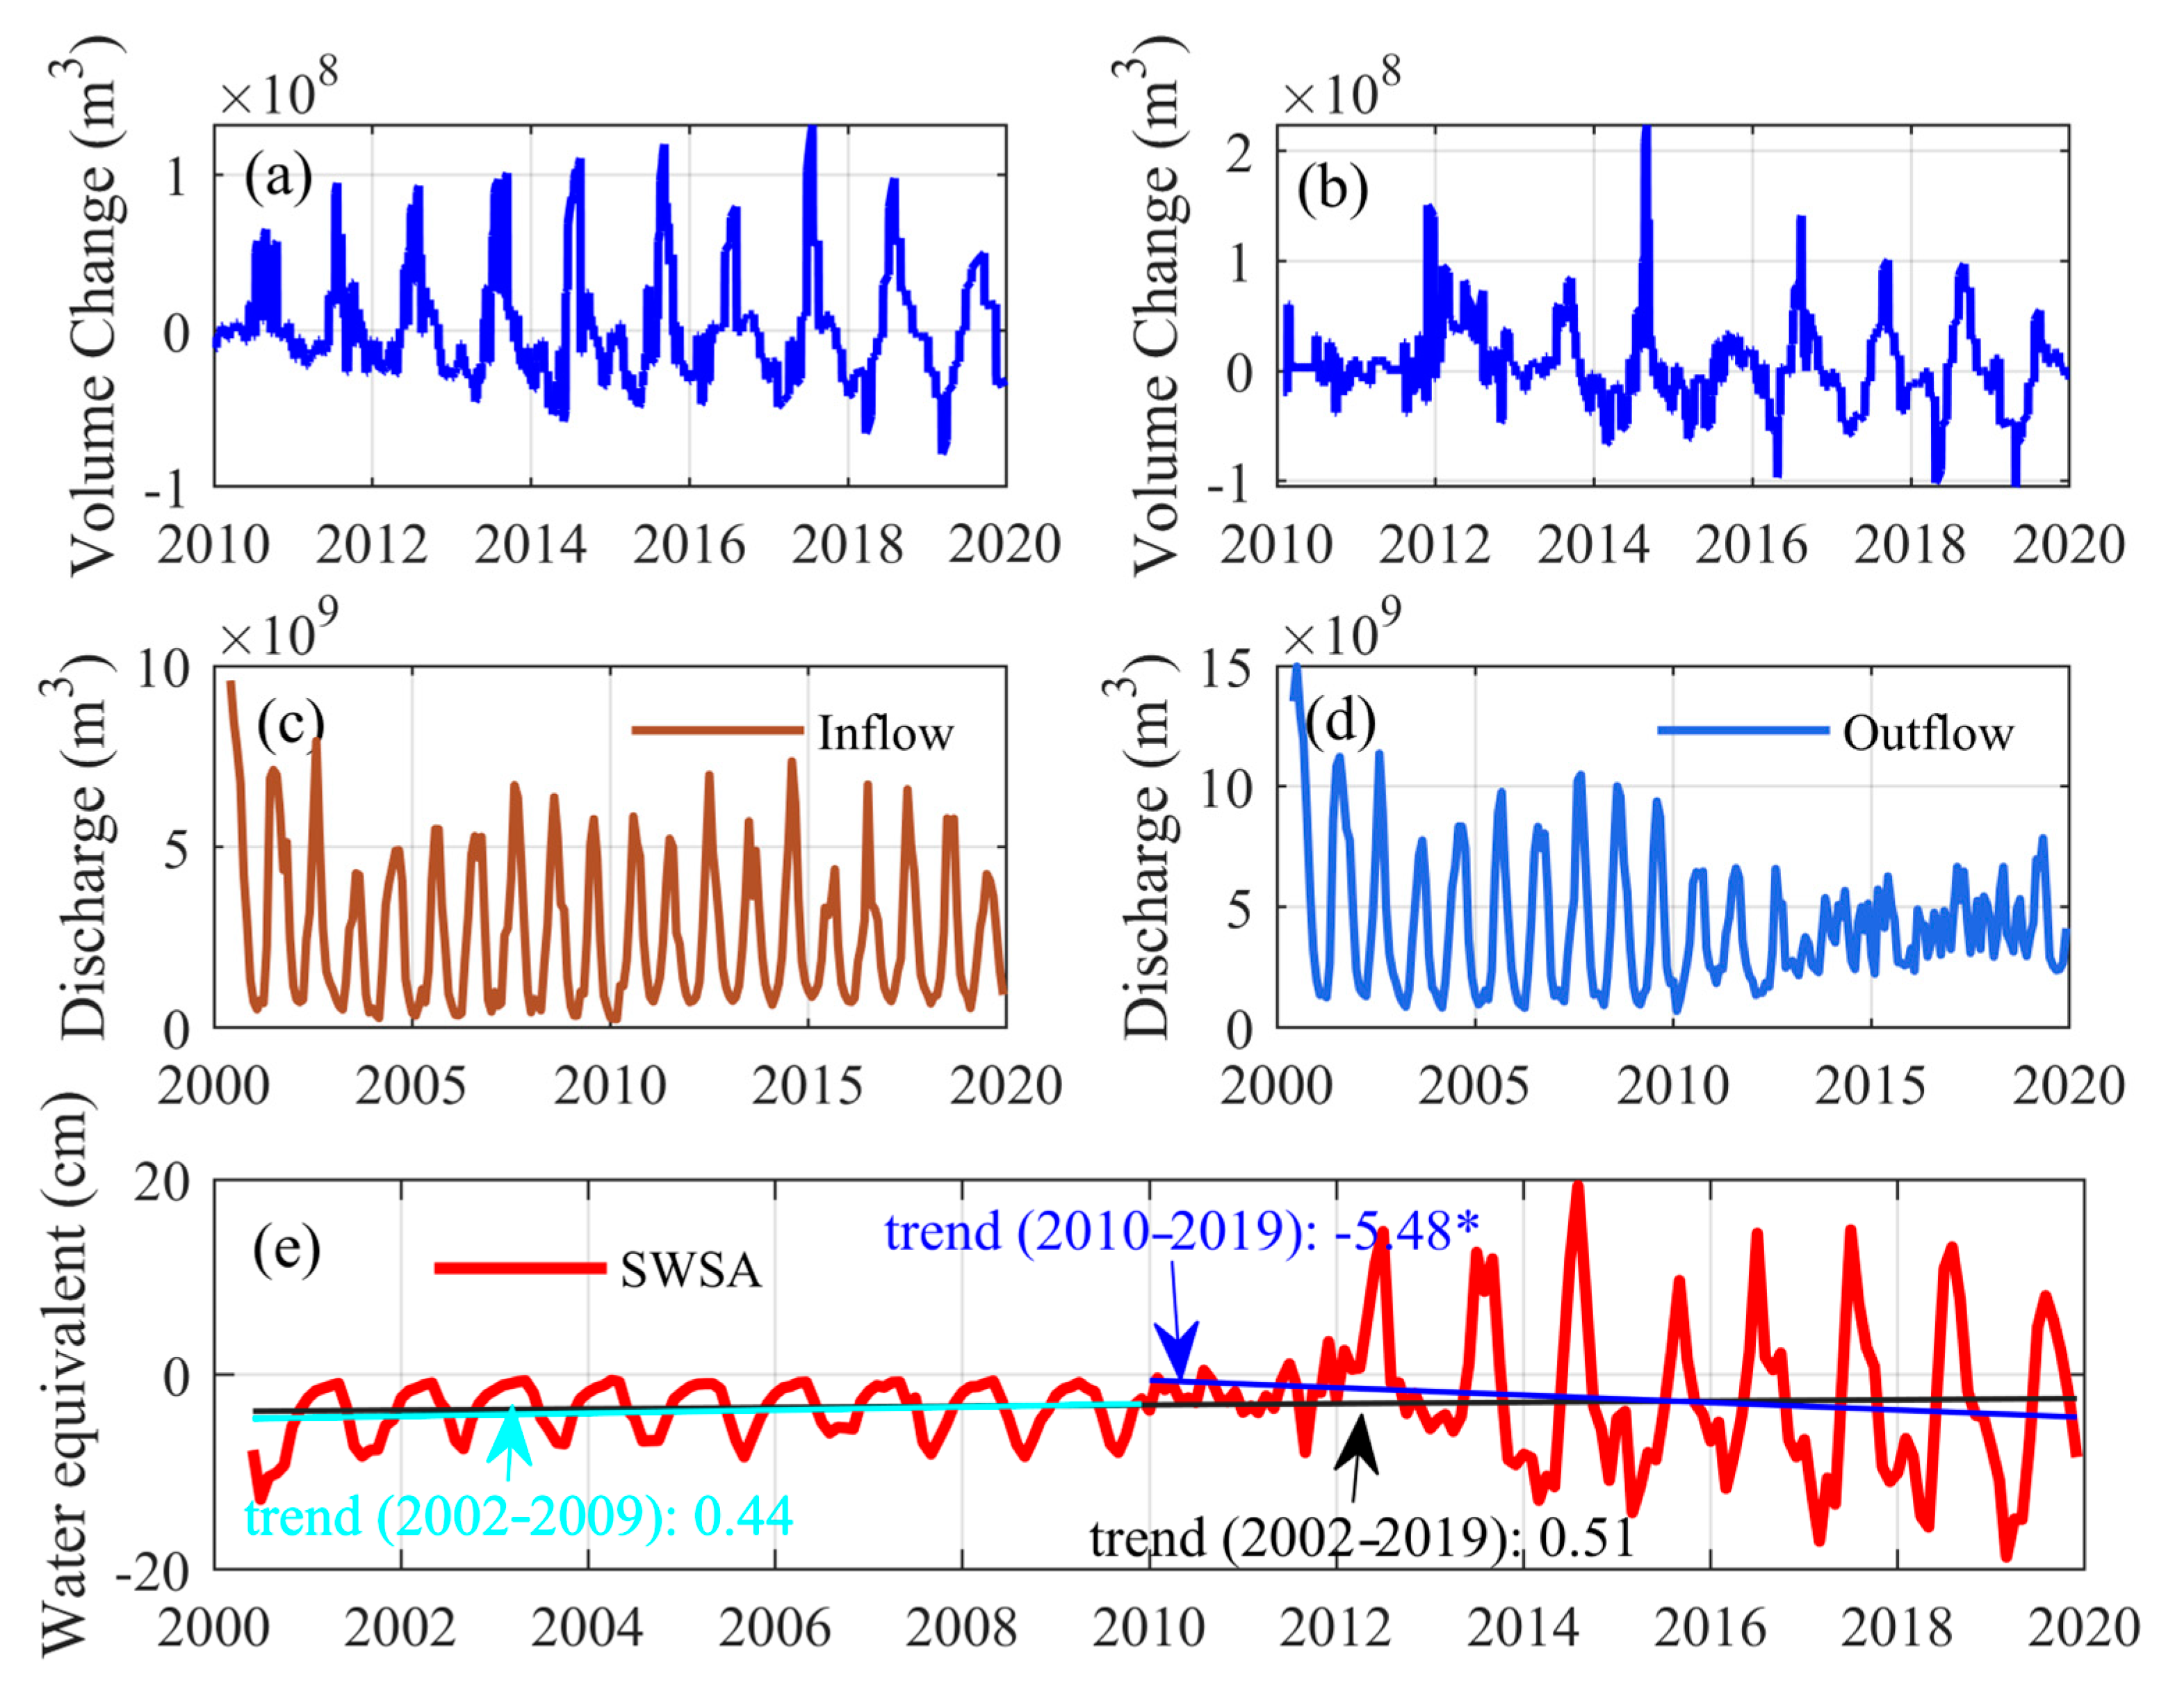
3.2. Surface Water Storage Variations

WSE of the reservoirs are monitored by Jason-2, Sentinel-3, and Cryosat-2 (Figure 5c,d). Additionally, SWEs provided by the JRC and GRAS are compared (Figure 5e,f). WSE and SWE experienced a sharp rise starting in 2010 (Xiaowan) and 2012 (Nuozhadu), which coincides with the start of the reservoir impoundment phase. It took roughly three years for Xiaowan and Nuozhadu to reach stability after impoundment, which occurred in 2013 and 2015, respectively. The significant annual fluctuations of both Xiaowan and Nuozhadu reservoirs (>60 m) indicate a wide range of operating conditions (filling or draining the reservoirs).
The presence of extreme values and anomalies in mountainous regions such as Xiaowan and Nuozhadu reservoirs due to cloud cover and mountain shadow can impact the quality of optical images and cause errors in JRC’s data results [52]. Therefore, SWE from GRAS and WSE derived from Jason-2, Sentinel-3, and Cryosat-2 from 2017 to 2019 were utilized to construct Equation (6). Additionally, the fitted curves fitted by the digital elevation model (DEM) [72] were used to validate the WSE-SWE curves shown in Figure 5e,f. The WSE and SWE pairs are more or less scattered on the teams derived from DEM topography, which proves the reliability of this research method.
The WSE from 2010 to 2019 was interpolated to a daily resolution according to a bilinear interpolation method. Then, the volume changed the time series from 2010 to 2019 in Xiaowan and Nuozhadu reservoirs, which was constructed (Figure 6a,b) based on the SWE-WSE relation curves fitted in Figure 5g,h. Climate change had a very limited impact on the inflow (Figure 6c). Since the reservoir impoundment had intercepted a portion of the runoff, there had been a noticeable decrease in outflow after 2010 (Figure 6d). Reservoir regulation significantly limits peak flows and supplements dry season flows, resulting in less seasonal variation in outflows in the study area. The SWSA time series is shown in Figure 6e. Due to the operation of the reservoir, the SWSA from 2010 to 2019 fluctuated sharply (range -20 to 20 cm) and had a significantly decreasing trend (−5.48 cm/yr) compared to 2002 to 2009. This result is consistent with the precipitation trend from 2010 to 2019 in Figure 3.

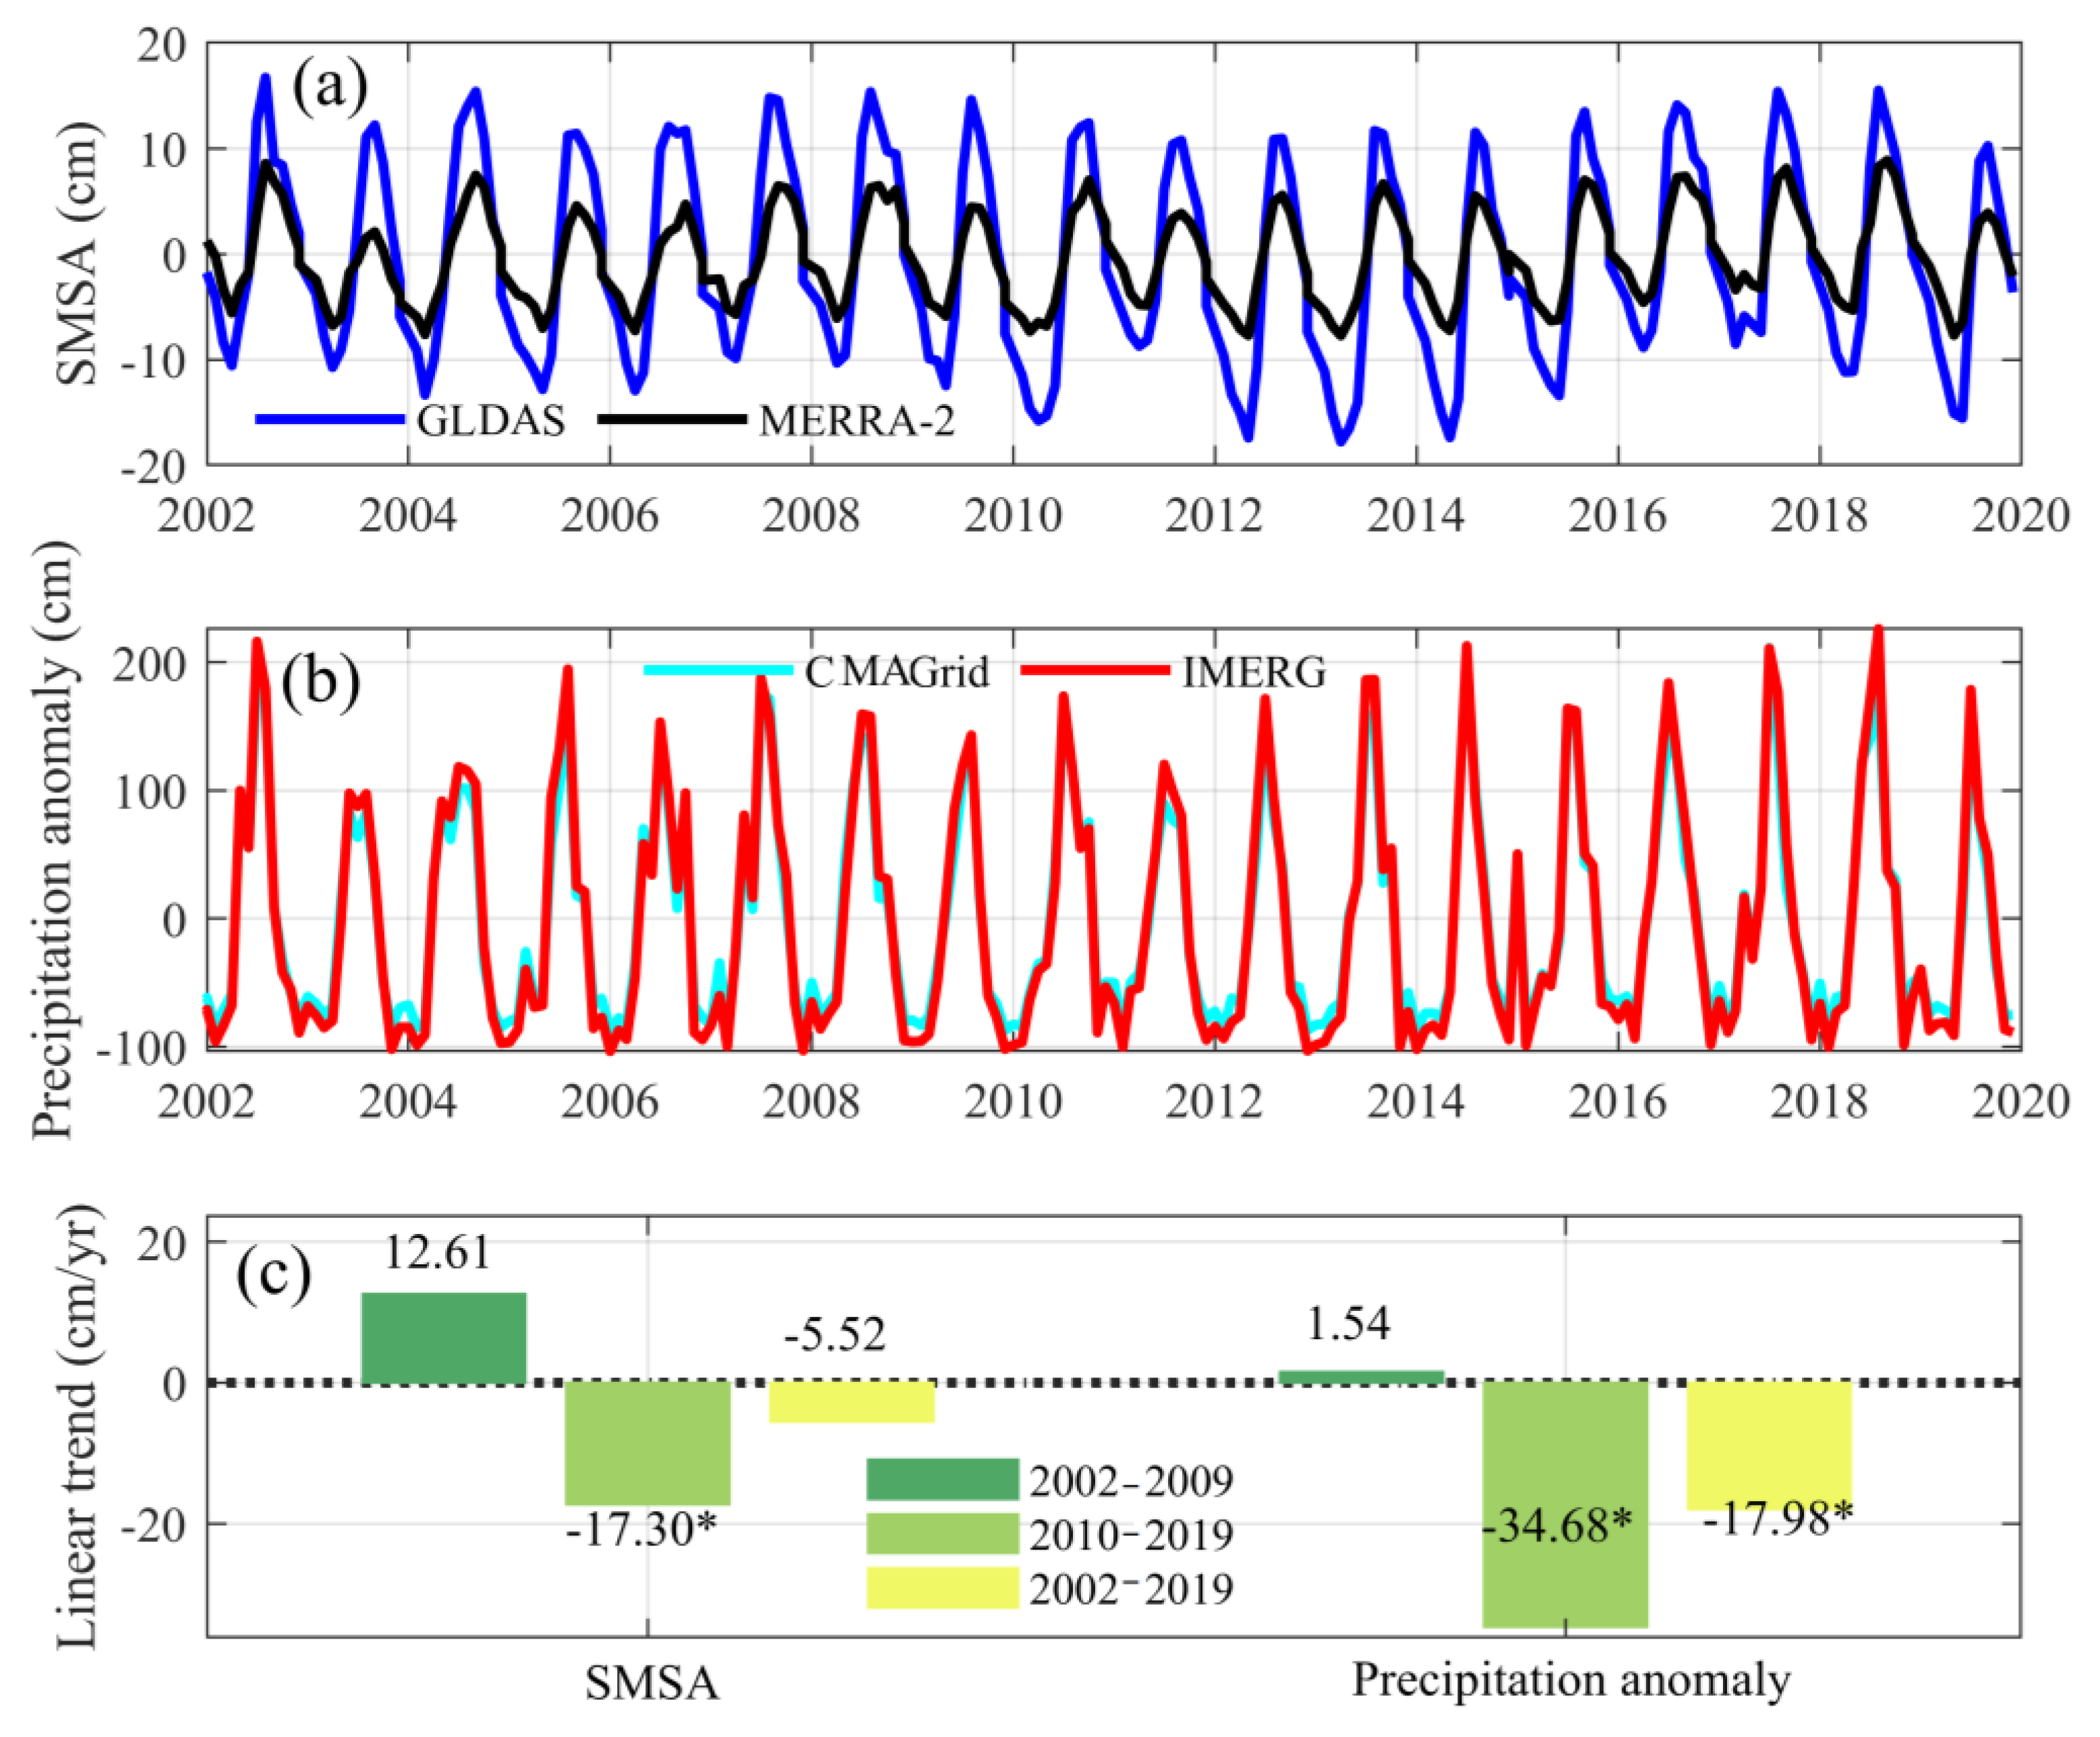
3.3. Soil Moisture Water Storage Variation

Soil moisture storage anomalies (SMSA) derived from GLDAS and MERRA-2 showed high consistency of inter-annual and seasonal changes, with a correlation coefficient of 0.86 (Figure 7a). Precipitation anomalies derived from CMAGrid and IMERG also showed high consistency, with a correlation coefficient of 0.94 (Figure 7b). In this study, averaged SM and precipitation were used. The monthly fluctuations in SMSA and precipitation were in sync, and SMSA quickly reacted to changes in precipitation in the study region (Figure 7c). There was a significant decreasing trend of precipitation (−34.68 cm/yr) and SM (−17.30 cm/yr) from 2010 to 2019.

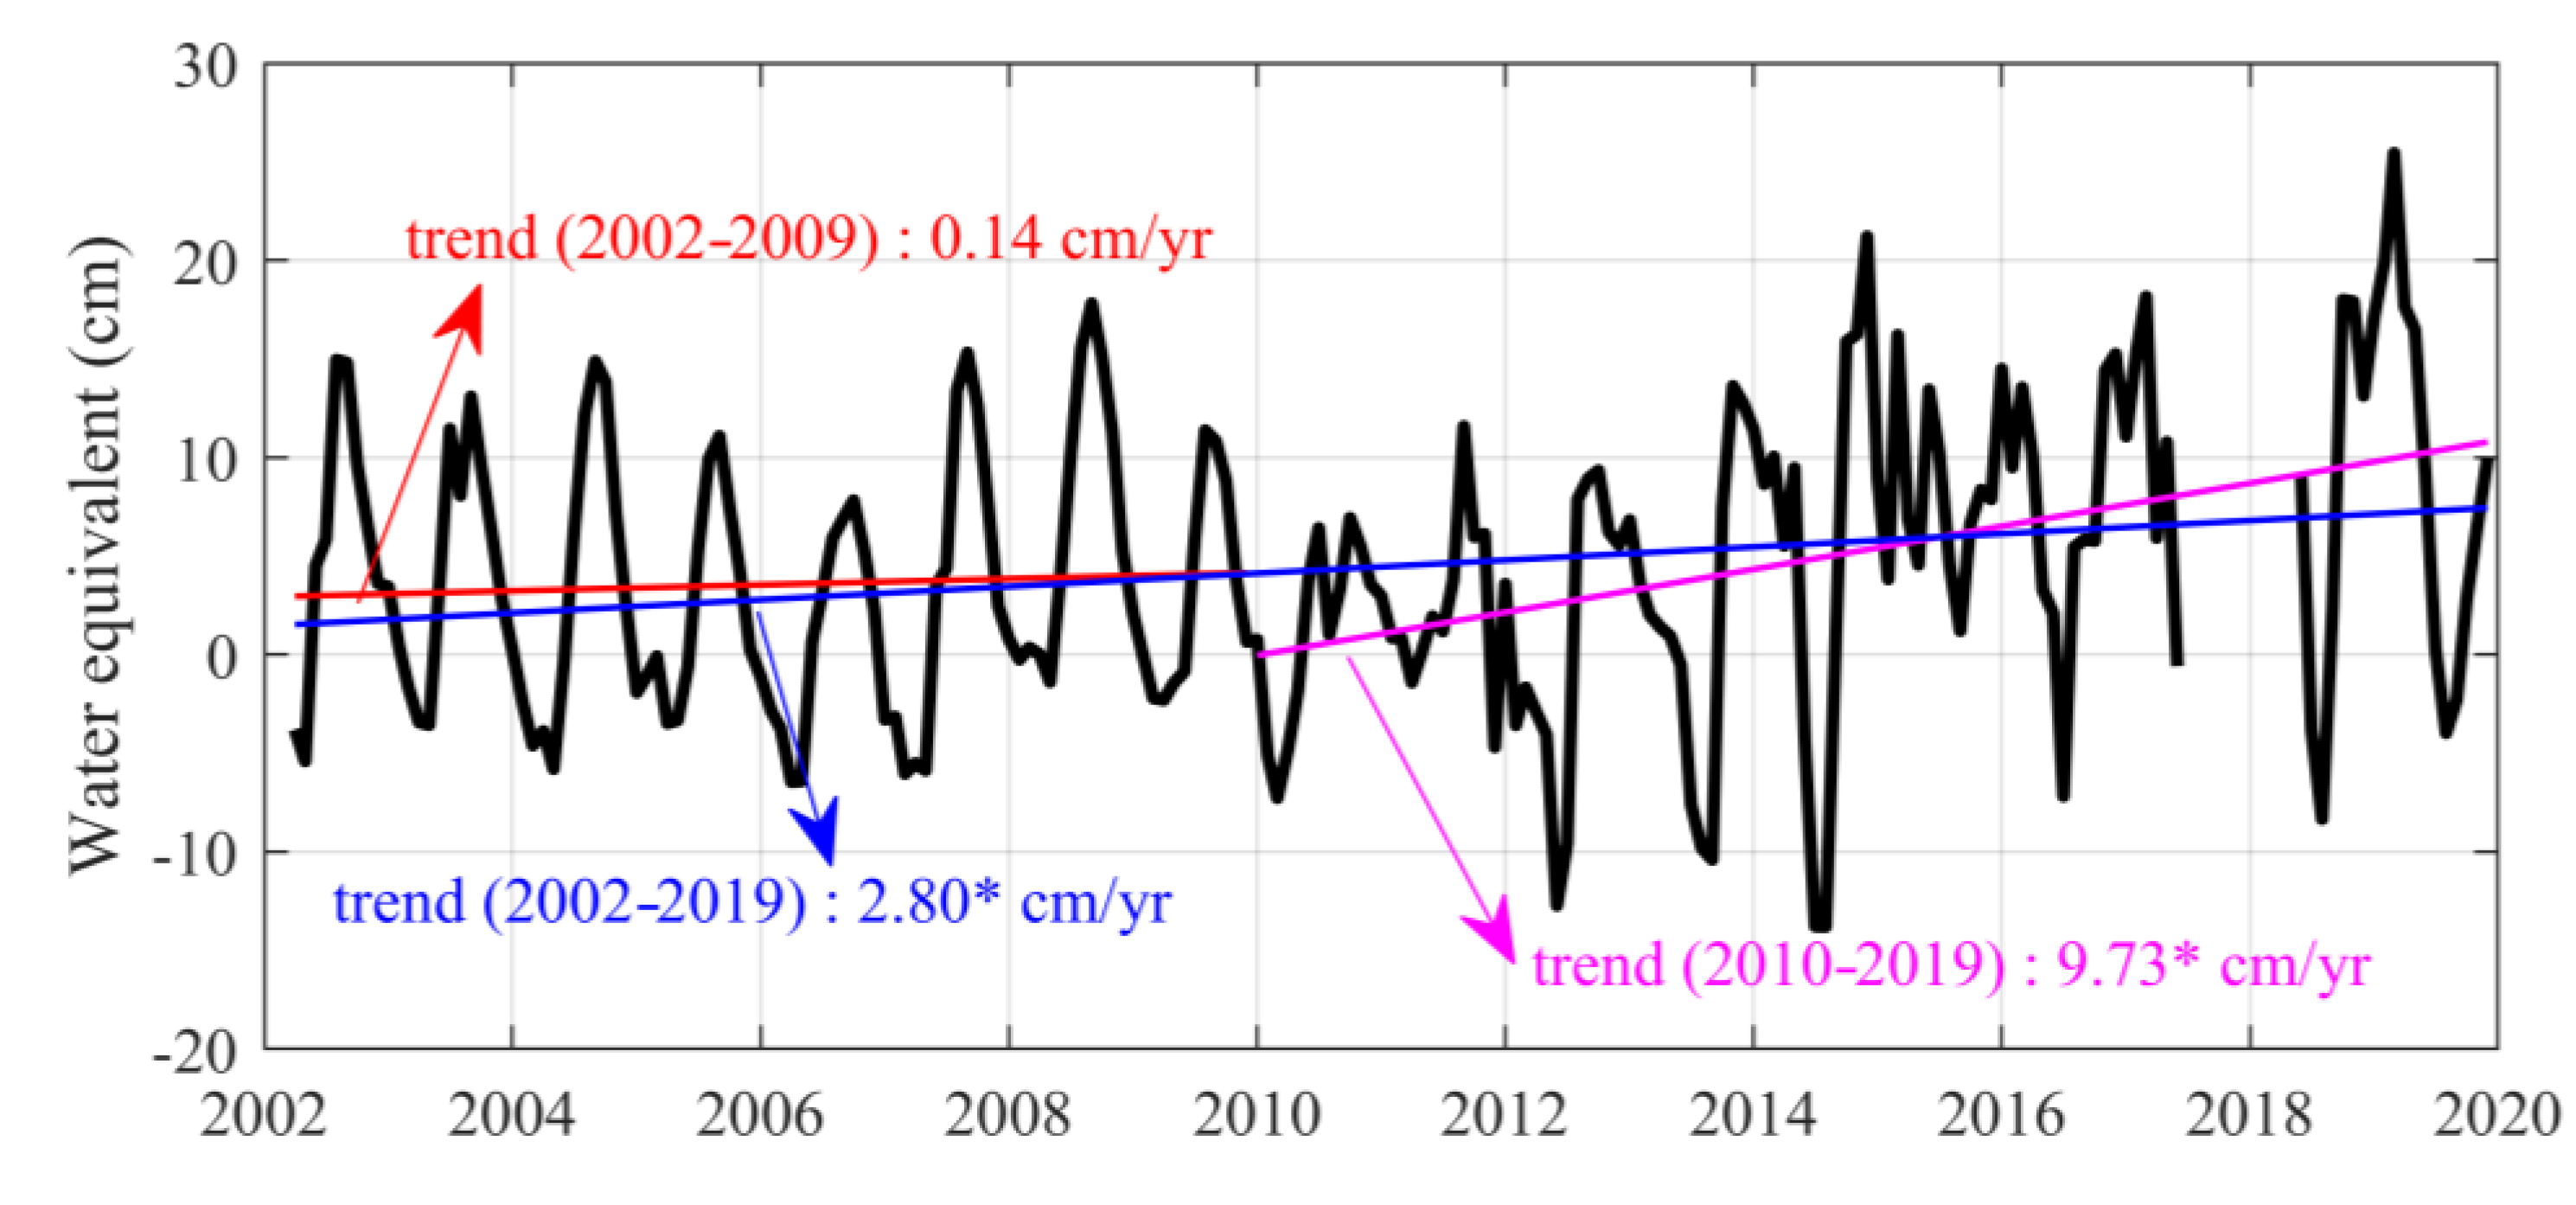
3.4. Groundwater Storage Variation

The temporal variation of monthly groundwater storage anomaly (GWSA) is shown in Figure 8. The GWSA shows a slightly growing trend from 2002 to 2009, with a value of 0.14 cm/yr. The growing trend of GWSA from 2002 to 2009 is consistent with the precipitation trend shown in Figure 7c. Since 2010, the GWSA has increased significantly, with a rate of increase of 9.73 cm/yr. It is worth mentioning that precipitation showed a significant decrease from 2010 to 2019 (−34.68 cm/yr), while GWSA showed a significant upward trend, with an increased rate of 9.73 cm/yr. Over the entire study period from 2002 to 2019, GWSA also displayed a significant upward trend, with a rate of increase of 2.80 cm/yr.

4. Discussion

The spatial and temporal patterns of water resources are profoundly changing in the Lancang-Mekong River basin under the impacts of climate change and human activities [16,21,26,73]. A plethora of literature has reported that the Lancang-Mekong River basin has undergone increased frequency and severity of extreme floods and droughts [74,75,76]. Additionally, dams and reservoirs directly regulate streamflow and change water resources. The Xiaowan and Nuozhadu reservoirs can make up approximately 85% of the total storage capacity in the Lancang River, thereby playing a pivotal role of water management in the LLRB.
The GRACE mission provides a potential solution for monitoring the TWSA dynamics changes in the LLRB. The TWSA of the LLRB exhibits a substantial spatial and temporal variation between the periods of 2002 to 2009 and 2010 to 2019 (Figure 3). This discrepancy is primarily due to the fluctuation in precipitation and the construction of reservoirs. From 2002 to 2009, there was no significant trend observed in either precipitation or TWSA (Figure 4a,b and Figure 7c). However, from 2010 to 2019, while precipitation showed a significant decrease (−34.68 cm/yr), the TWSA of the LLRB displayed a significant increase (8.96 cm/yr). This sudden shift in the TWSA can be attributed to the enhanced water storage capacity in the Xiaowan and Nuozhadu reservoirs after 2010. The trend of the TWSA in the LLRB over the past two decades differs from that in the Lancang and Mekong River basins (Figure 4 and Table 2). The downward trend of the TWSA observed in the Lancang-Mekong River basin is believed to be a result of climate change, characterized by decreased precipitation and increased evapotranspiration [77,78,79].
SWS, represented by runoff and reservoir storage, is directly impacted by the spatial and temporal distributions of precipitation. Following the impoundment in Xiaowan and Nuozhadu reservoirs after 2010, the SWS showed a dramatic increase until it stabilized, exhibiting cyclical, seasonal fluctuations (Figure 6). The persistent declining precipitation (−34.68 cm/yr, Figure 7) and increasing evaporation [77,78,79] from 2010 to 2019 resulted in a decrease of inflow (Figure 6c). To ensure the stability of outflow in the downstream areas (Figure 6d), the volume of the reservoirs is naturally adjusted less (Figure 6a,b). Therefore, the SWS in the LLRB shows a decreasing trend (−5.48 cm/yr, Figure 6d).
The linear trends of the SMSA and precipitation anomaly in the study region are consistent (Figure 7) because SMS has a rapid response to precipitation [34,80,81]. Unlike SWS and SMS, which react to precipitation directly, the linear trend of the GWSA and TWSA after reservoir regulation in the study region is consistent (Figure 8). The Xiaowan and Nuozhadu reservoirs always maintain a certain amount of water for hydropower generation and downstream water security, even in extreme drought conditions. The maintenance of groundwater levels has a positive impact on basin drought management. Therefore, from the start of water storage in 2010 to the stabilized operation of the reservoirs, a steady rise in groundwater was observed (9.73 cm/yr). This finding aligns with the results reported by Jing et al. [12].
The accuracy of EO data inevitably introduces uncertainty to the results of this study. To reduce this uncertainty, most of the data sources in this study were calculated using the average of data from multiple sources. For example, five GRACE solutions, two precipitation products, and two SM products were compared and utilized. These datasets showed high consistency in the study area. Additionally, the GRACE-derived TWSAs are more accurate for large regions; the presence of open water bodies near the basin could have affected GRACE signals. But the seasonal WSE changes in the Xiaowan and Nuozhadu reservoirs can reach 80 m, and the water volume changes are more than the order of 108 cubic meters. At this time, the water volume variation of the reservoirs dominates the GRACE signal variation. Zhang et al.’s study [14] also showed that reservoir regulation dominates the GRACE signal in the southern Lancang River basin and well constrains the model parameters with GRACE-derived TWSAs. Additionally, there are many studies using GRACE data for water variability in individual reservoirs [82,83,84]. WSE and SWE are the two main components that influence SWS. Although Sentinel-3 has been running since 2016, the open-loop model after March 2019 cannot detect valid data due to incorrect a priori elevation [61] (Figure 5). Therefore, we used the Cryosat-2 data as a supplement. Additionally, the fitted curves fitted by topography [72] are used to validate the WSE-SWE curves (Figure 5), which ensures the accuracy of the reservoir volume change calculation.

5. Conclusions

In this study, a combination of multi-satellite data and modeled variables was employed to examine the TWS and the dynamics of its components in the LLRB. The main conclusions are listed as follows:
(1)
The spatial and temporal patterns of the TWSA in the LLRB vary between 2002 to 2009 and 2010 to 2019. The fluctuations in precipitation and the construction of reservoirs are the primary drivers of changes in the TWSA in the region. Precipitation decreased significantly from 2010 to 2019 (−34.68 cm/yr), but the TWSA showed a significant increase (8.96 cm/yr) due to enhanced water storage capacity in the Xiaowan and Nuozhadu reservoirs.
(2)
SWS exhibited an overall increasing trend at a rate of 0.51 cm/yr from 2002 to 2019. However, SWS showed a decrease (−5.48 cm/yr) from 2010 to 2019 due to declining precipitation (−34.68 cm/yr) and increasing evaporation, causing a reduction in reservoir volume after a stabilized operation.
(3)
The linear trends of the GWSA and TWSA in the study region follow a similar pattern after adjusting for regulation of the Xiaowan and Nuozhadu reservoirs. From the initiation of water storage in 2010 to the stabilized operation of the reservoirs, GWS exhibited a steady rise (9.73 cm/yr) due to the maintenance of groundwater levels by the reservoirs.
This study serves as a benchmark for evaluating the impacts of climate change and reservoir regulation on changes in TWS and its associated water components in the LLRB. It will provide critical support for water resource management and cooperation in the Lancang-Mekong River basin. Furthermore, the utilization of multi-satellite EO datasets demonstrates their potential to support regional-scale monitoring, particularly in regions with limited data and transboundary river basins. The precision of these EO datasets is expected to improve with the launch of new and upgraded missions, such as Sentinel-6, Sentinel-3C/-3D, and SWOT missions.

Funding

The research was financially supported by the Strategic Priority Research Program of the Chinese Academy of Sciences (Grants No. XDA2006020202), the National Natural Science Foundation of China (Grants No. 42201037), and the project was funded by the China Postdoctoral Science Foundation (Grants No. 2022M713122). Xingxing Zhang was financially supported by the Chinese Scholarship Council, the Special Research Assistant Program of the Chinese Academy of Sciences (Grant No. E2S20001Y5), which is gratefully acknowledged.

Data Availability Statement

River discharge data were provided by the Hydrology and Water Resources Bureau of Yunnan Province in China (accessed on 11 July 2022), which is acknowledged here. GRACE data are available at https://grace.jpl.nasa.gov/data/get-data/jpl_global_mascons/ (accessed on 11 May 2022). Jason-2 data are from the CNES AVISO+ program (Centre National D’Etudes Spatiales, Archiving, Validation and Interpretation of Satellite Oceanographic data, ftp://avisoftp.cnes.fr/AVISO/pub/) (accessed on 11 May 2022). Cryosat-2 data are publicly accessible at https://earth.esa.int/eogateway/missions/cryosat/data (accessed on 11 May 2022). Sentinel-3 data are publicly accessible at https://scihub.copernicus.eu/dhus/ (accessed on 11 May 2022). JRC can be processed using the Google Earth Engine. GRAS was provided by the DHI Company of Denmark (accessed on 11 January 2022). CMAGrid interpolation precipitation product was from the China Meteorological Administration and is publicly accessible at http://data.cma.cn/ (accessed on 11 May 2022). IMERG can be accessed from https://gpm.nasa.gov/data/imerg (accessed on 11 May 2022). GLDAS and MERRA-2 can be accessed from https://disc.gsfc.nasa.gov/ (accessed on 11 May 2022).

Conflicts of Interest

The authors declare that they have no known competing financial interests or personal relationships that could have appeared to influence the work reported in this paper.

Abbreviations

LLRB: lower Lancang River basin; TWS: terrestrial water storage; SWS: surface water storage; SMS: soil moisture storage; GWS: groundwater storage; EO: Earth observation; GRACE: Gravity Recovery and Climate Experiment; GLDAS: Global Land Data Assimilation System; GFZ: GeoForschungsZentrum Potsdam; CSR: Center for Space Re-search at the University of Texas, Austin; JPL: Jet Propulsion Laboratory; SWE: surface water extent; WSE: water surface elevation; TWV: total water volume; TAV: total adjustment volume; IMERG: Integrated Multi-Satellite Re-trievals for GPM; JRC: Joint Research Centre; GRAS: Denmark DHI-GRAS Company; MERRA-2: Modern-Era Ret-rospective Analysis for Research and Applications version 2; CMA: China Meteorological Administration; CMA-Grid: 0.5° gridded daily precipitation dataset from the China Meteorological Administration; STL: local regression; LOESS: local regression smoothing; TPS: Thin Plate Spline; OLTC: Open-Loop Tracking Command; NDVI: optical Normalized Difference Vegetation Index; NDWI: Normalized Difference Water Index; GLAD: Global Land Analysis and Discovery; SAR: synthetic aperture radar; DEM: digital elevation model.

References

  1. Pokhrel, Y.; Felfelani, F.; Satoh, Y.; Boulange, J.; Burek, P.; Gädeke, A.; Gerten, D.; Gosling, S.N.; Grillakis, M.; Gudmundsson, L.; et al. Global Terrestrial Water Storage and Drought Severity under Climate Change. Nat. Clim. Chang. 2021, 11, 226–233. [Google Scholar] [CrossRef]
  2. Castle, S.L.; Thomas, B.F.; Reager, J.T.; Rodell, M.; Swenson, S.C.; Famiglietti, J.S. Groundwater Depletion during Drought Threatens Future Water Security of the Colorado River Basin. Geophys. Res. Lett. 2014, 41, 5904–5911. [Google Scholar] [CrossRef] [PubMed] [Green Version]
  3. Reager, J.T.; Famiglietti, J.S. Global Terrestrial Water Storage Capacity and Flood Potential Using GRACE. Geophys. Res. Lett. 2009, 36, L23402. [Google Scholar] [CrossRef] [Green Version]
  4. Sterling, S.M.; Ducharne, A.; Polcher, J. The Impact of Global Land-Cover Change on the Terrestrial Water Cycle. Nat. Clim. Chang. 2013, 3, 385–390. [Google Scholar] [CrossRef]
  5. Wada, Y.; Reager, J.T.; Chao, B.F.; Wang, J.; Lo, M.H.; Song, C.; Li, Y.; Gardner, A.S. Recent Changes in Land Water Storage and Its Contribution to Sea Level Variations. Surv. Geophys. 2016, 38, 131–152. [Google Scholar] [CrossRef] [Green Version]
  6. Wang, Y.; Sun, Z.; Wu, Q.; Fang, J.; Jia, W. Spatio-Temporal Variability of Terrestrial Water Storage in the Yangtze River Basin: Response to Climate Changes. Geod. Geodyn. 2022. [Google Scholar] [CrossRef]
  7. Yang, B.; Li, Y.; Tao, C.; Cui, C.; Hu, F.; Cui, Q.; Meng, L.; Zhang, W. Variations and Drivers of Terrestrial Water Storage in Ten Basins of China. J. Hydrol. Reg. Stud. 2023, 45, 101286. [Google Scholar] [CrossRef]
  8. Xie, J.; Xu, Y.P.; Booij, M.J.; Guo, Y. Influences of Reservoir Operation on Terrestrial Water Storage Changes Detected by GRACE in the Yellow River Basin. J. Hydrol. 2022, 610, 127924. [Google Scholar] [CrossRef]
  9. Shamsudduha, M.; Panda, D.K. Spatio-Temporal Changes in Terrestrial Water Storage in the Himalayan River Basins and Risks to Water Security in the Region: A Review. Int. J. Disaster Risk Reduct. 2019, 35, 101068. [Google Scholar] [CrossRef]
  10. Voss, K.A.; Famiglietti, J.S.; Lo, M.; De Linage, C.; Rodell, M.; Swenson, S.C. Groundwater Depletion in the Middle East from GRACE with Implications for Transboundary Water Management in the Tigris-Euphrates-Western Iran Region. Water Resour. Res. 2013, 49, 904–914. [Google Scholar] [CrossRef] [Green Version]
  11. Munia, H.A.; Guillaume, J.H.A.; Wada, Y.; Veldkamp, T.; Virkki, V.; Kummu, M. Future Transboundary Water Stress and Its Drivers Under Climate Change: A Global Study. Earth’s Future 2020, 8, e2019EF001321. [Google Scholar] [CrossRef] [PubMed]
  12. Jing, W.; Zhao, X.; Yao, L.; Jiang, H.; Xu, J.; Yang, J.; Li, Y. Variations in Terrestrial Water Storage in the Lancang-Mekong River Basin from GRACE Solutions and Land Surface Model. J. Hydrol. 2019, 580, 124258. [Google Scholar] [CrossRef]
  13. Xiong, J.; Guo, S.; Chen, D.; Zhong, Y.; Liu, B.; Abhishek; Yin, J. Past and Future Terrestrial Water Storage Changes in the Lower Mekong River Basin: The Influences of Climatic and Non-Climatic Factors. J. Hydrol. 2022, 612, 128275. [Google Scholar] [CrossRef]
  14. Zhang, X.; Jiang, L.; Liu, Z.; Kittel, C.M.M.; Yao, Z.; Druce, D.; Wang, R.; Tøttrup, C.; Liu, J.; Jiang, H.; et al. Flow Regime Changes in the Lancang River, Revealed by Integrated Modeling with Multiple Earth Observation Datasets. Sci. Total Environ. 2023, 862, 160656. [Google Scholar] [CrossRef]
  15. Liu, J.; Chen, D.; Mao, G.; Irannezhad, M.; Pokhrel, Y. Past and Future Changes in Climate and Water Resources in the Lancang–Mekong River Basin: Current Understanding and Future Research Directions. Engineering 2021, 13, 144–152. [Google Scholar] [CrossRef]
  16. Yun, X.; Tang, Q.; Wang, J.; Liu, X.; Zhang, Y.; Lu, H.; Wang, Y.; Zhang, L.; Chen, D. Impacts of Climate Change and Reservoir Operation on Streamflow and Flood Characteristics in the Lancang-Mekong River Basin. J. Hydrol. 2020, 590, 125472. [Google Scholar] [CrossRef]
  17. Kattelus, M.; Kummu, M.; Keskinen, M.; Salmivaara, A.; Varis, O. China’s Southbound Transboundary River Basins: A Case of Asymmetry. Water Int. 2015, 40, 113–138. [Google Scholar] [CrossRef]
  18. Hecht, J.S.; Lacombe, G.; Arias, M.E.; Dang, T.D.; Piman, T. Hydropower Dams of the Mekong River Basin: A Review of Their Hydrological Impacts. J. Hydrol. 2019, 568, 285–300. [Google Scholar] [CrossRef]
  19. Yun, X.; Tang, Q.; Li, J.; Lu, H.; Zhang, L.; Chen, D. Can Reservoir Regulation Mitigate Future Climate Change Induced Hydrological Extremes in the Lancang-Mekong River Basin? Sci. Total Environ. 2021, 785, 147322. [Google Scholar] [CrossRef]
  20. Wang, W.; Lu, H.; Ruby Leung, L.; Li, H.Y.; Zhao, J.; Tian, F.; Yang, K.; Sothea, K. Dam Construction in Lancang-Mekong River Basin Could Mitigate Future Flood Risk From Warming-Induced Intensified Rainfall. Geophys. Res. Lett. 2017, 44, 10378–10386. [Google Scholar] [CrossRef]
  21. Han, Z.; Long, D.; Fang, Y.; Hou, A.; Hong, Y. Impacts of Climate Change and Human Activities on the Flow Regime of the Dammed Lancang River in Southwest China. J. Hydrol. 2019, 570, 96–105. [Google Scholar] [CrossRef]
  22. Zhang, X.; Qu, Y.; Ma, M.; Liu, H.; Su, Z.; Lv, J.; Peng, J.; Leng, G.; He, X.; Di, C. Satellite-Based Operational Real-Time Drought Monitoring in the Transboundary Lancang-Mekong River Basin. Remote Sens. 2020, 12, 376. [Google Scholar] [CrossRef] [Green Version]
  23. Mekong River Commission. Mekong River Commission Annual Report 2019; Mekong River Commission: Lao PDR, Vientiane, 2020. [Google Scholar]
  24. Vu, D.T.; Dang, T.D.; Galelli, S.; Hossain, F. Satellite Observations Reveal Thirteen Years of Reservoir Filling Strategies, Operating Rules, and Hydrological Alterations in the Upper Mekong River Basin. Hydrol. Earth Syst. Sci. 2022, 26, 2345–2364. [Google Scholar] [CrossRef]
  25. Williams, J.M. Is Three a Crowd? River Basin Institutions and the Governance of the Mekong River. Int. J. Water Resour. Dev. 2020, 37, 720–740. [Google Scholar] [CrossRef]
  26. Ogden, S. The Impact of China’s Dams on the Mekong River Basin: Governance, Sustainable Development, and the Energy-Water Nexus. J. Contemp. China 2023, 32, 152–169. [Google Scholar] [CrossRef]
  27. Crétaux, J.; Biancamaria, S.; Arsen, A.; Bergé-nguyen, M.; Becker, M. Global Surveys of Reservoirs and Lakes from Satellites and Regional Application to the Syrdarya River Basin. Environ. Res. Lett. 2015, 10, 15002. [Google Scholar] [CrossRef] [Green Version]
  28. Hannah, D.M.; Demuth, S.; van Lanen, H.A.J.; Looser, U.; Prudhomme, C.; Rees, G.; Stahl, K.; Tallaksen, L.M. Large-Scale River Flow Archives: Importance, Current Status and Future Needs. Hydrol. Process. 2011, 25, 1191–1200. [Google Scholar] [CrossRef]
  29. Pokhrel, Y.; Burbano, M.; Roush, J.; Kang, H.; Sridhar, V.; Hyndman, D.W. A Review of the Integrated Effects of Changing Climate, Land Use, and Dams on Mekong River Hydrology. Water 2018, 10, 266. [Google Scholar] [CrossRef] [Green Version]
  30. Feng, Y.; Wang, W.; Suman, D.; Yu, S.; He, D. Water Cooperation Priorities in the Lancang-Mekong River Basin Based on Cooperative Events Since the Mekong River Commission Establishment. Chin. Geogr. Sci. 2019, 29, 58–69. [Google Scholar] [CrossRef] [Green Version]
  31. Landerer, F.W.; Swenson, S.C. Accuracy of Scaled GRACE Terrestrial Water Storage Estimates. Water Resour. Res. 2012, 48. [Google Scholar] [CrossRef]
  32. Wang, Y.; Yésou, H. Remote Sensing of Floodpath Lakes and Wetlands: A Challenging Frontier in the Monitoring of Changing Environments. Remote Sens. 2018, 10, 1955. [Google Scholar] [CrossRef] [Green Version]
  33. Jarihani, A.A.; Callow, J.N.; Johansen, K.; Gouweleeuw, B. Evaluation of Multiple Satellite Altimetry Data for Studying Inland Water Bodies and River Floods. J. Hydrol. 2013, 505, 78–90. [Google Scholar] [CrossRef]
  34. Liu, J.; Jiang, L.; Zhang, X.; Druce, D.; Kittel, C.M.M.; Tøttrup, C.; Bauer-Gottwein, P. Impacts of Water Resources Management on Land Water Storage in the North China Plain: Insights from Multi-Mission Earth Observations. J. Hydrol. 2021, 603, 126933. [Google Scholar] [CrossRef]
  35. Liu, X.; Liu, Z.; Wei, H. Trends of Terrestrial Water Storage and Actual Evapotranspiration in Chinese Inland Basins and Their Main Affecting Factors. Front. Environ. Sci. 2022, 10, 1–12. [Google Scholar] [CrossRef]
  36. Tapley, B.D.; Bettadpur, S.; Watkins, M.; Reigber, C. The Gravity Recovery and Climate Experiment: Mission Overview and Early Results. Geophys. Res. Lett. 2004, 31. [Google Scholar] [CrossRef] [Green Version]
  37. Rodell, M.; Velicogna, I.; Famiglietti, J.S. Satellite-Based Estimates of Groundwater Depletion in India. Nature 2009, 460, 999–1002. [Google Scholar] [CrossRef] [Green Version]
  38. Longuevergne, L.; Scanlon, B.R.; Wilson, C.R. GRACE Hydrological Estimates for Small Basins: Evaluating Processing Approaches on the High Plains Aquifer, USA. Water Resour. Res. 2010, 46. [Google Scholar] [CrossRef]
  39. Famiglietti, J.S.; Lo, M.; Ho, S.L.; Bethune, J.; Anderson, K.J.; Syed, T.H.; Swenson, S.C.; De Linage, C.R.; Rodell, M. Satellites Measure Recent Rates of Groundwater Depletion in California’s Central Valley. Geophys. Res. Lett. 2011, 38, 2010GL046442. [Google Scholar] [CrossRef] [Green Version]
  40. Tapley, B.D.; Watkins, M.M.; Flechtner, F.; Reigber, C.; Bettadpur, S.; Rodell, M.; Sasgen, I.; Famiglietti, J.S.; Landerer, F.W.; Chambers, D.P.; et al. Contributions of GRACE to Understanding Climate Change. Nat. Clim. Chang. 2019, 9, 358–369. [Google Scholar] [CrossRef]
  41. Crétaux, J.-F.; Calmant, S.; del Rio, R.A.; Kouraev, A.; Bergé-Nguyen, M.; Maisongrande, P. Lakes Studies from Satellite Altimetry. In Coastal Altimetry; Springer: Berlin/Heidelberg, Germany, 2011; pp. 509–533. [Google Scholar]
  42. Jiang, L.; Schneider, R.; Andersen, O.B.; Bauer-Gottwein, P. CryoSat-2 Altimetry Applications over Rivers and Lakes. Water 2017, 9, 211. [Google Scholar] [CrossRef]
  43. Khandelwal, A.; Karpatne, A.; Marlier, M.E.; Kim, J.; Lettenmaier, D.P.; Kumar, V. An Approach for Global Monitoring of Surface Water Extent Variations in Reservoirs Using MODIS Data. Remote Sens. Environ. 2017, 202, 113–128. [Google Scholar] [CrossRef]
  44. Swenson, S.; Wahr, J. Post-Processing Removal of Correlated Errors in GRACE Data. Geophys. Res. Lett. 2006, 33, L08402. [Google Scholar] [CrossRef]
  45. Watkins, M.M.; Wiese, D.N.; Yuan, D.-N.; Boening, C.; Landerer, F.W. Improved Methods for Observing Earth’s Time Variable Mass Distribution with GRACE Using Spherical Cap Mascons. J. Geophys. Res. Solid Earth 2015, 120, 2648–2671. [Google Scholar] [CrossRef]
  46. Save, H.; Bettadpur, S.; Tapley, B.D. High-Resolution CSR GRACE RL05 Mascons. J. Geophys. Res. Solid Earth 2016, 121, 7547–7569. [Google Scholar] [CrossRef]
  47. Landerer, F.W.; Flechtner, F.M.; Save, H.; Webb, F.H.; Bandikova, T.; Bertiger, W.I.; Bettadpur, S.V.; Byun, S.H.; Dahle, C.; Dobslaw, H.; et al. Extending the Global Mass Change Data Record: GRACE Follow-On Instrument and Science Data Performance. Geophys. Res. Lett. 2020, 47, e2020GL088306. [Google Scholar] [CrossRef]
  48. Taube, C. Instructions for Winter Lake Mapping. In Manual of Fisheries Survey Methods II: With Periodic Updates; Michigan Department of Natural Resources: New York, NY, USA, 2000; pp. 1–4. [Google Scholar]
  49. Pekel, J.F.; Cottam, A.; Gorelick, N.; Belward, A.S. High-Resolution Mapping of Global Surface Water and Its Long-Term Changes. Nature 2016, 540, 418–422. [Google Scholar] [CrossRef]
  50. Druce, D.; Tong, X.; Lei, X.; Guo, T.; Kittel, C.M.M.; Grogan, K.; Tottrup, C. An Optical and SAR Based Fusion Approach for Mapping Surface Water Dynamics over Mainland China. Remote Sens. 2021, 13, 1663. [Google Scholar] [CrossRef]
  51. Pickens, A.H.; Hansen, M.C.; Hancher, M.; Stehman, S.V.; Tyukavina, A.; Potapov, P.; Marroquin, B.; Sherani, Z. Mapping and Sampling to Characterize Global Inland Water Dynamics from 1999 to 2018 with Full Landsat Time-Series. Remote Sens. Environ. 2020, 243, 111792. [Google Scholar] [CrossRef]
  52. Busker, T.; de Roo, A.; Gelati, E.; Schwatke, C.; Adamovic, M.; Bisselink, B.; Pekel, J.-F.; Cottam, A. A Global Lake and Reservoir Volume Analysis Using a Surface Water Dataset and Satellite Altimetry. Hydrol. Earth Syst. Sci. 2019, 23, 669–690. [Google Scholar] [CrossRef] [Green Version]
  53. Bioresita, F.; Puissant, A.; Stumpf, A.; Malet, J.-P. A Method for Automatic and Rapid Mapping of Water Surfaces from Sentinel-1 Imagery. Remote Sens. 2018, 10, 217. [Google Scholar] [CrossRef] [Green Version]
  54. Schmitt, M. Potential of Large-Scale Inland Water Body Mapping from Sentinel-1/2 Data on the Example of Bavaria’s Lakes and Rivers. PFG–J. Photogramm. Remote Sens. Geoinf. Sci. 2020, 88, 271–289. [Google Scholar] [CrossRef]
  55. Yuan, C.; Gong, P.; Zhang, H.; Guo, H.; Pan, B. Monitoring Water Level Changes from Retracked Jason-2 Altimetry Data: A Case Study in the Yangtze River, China. Remote Sens. Lett. 2017, 8, 399–408. [Google Scholar] [CrossRef]
  56. Koblinsky, C.J.; Clarke, R.T.; Brenner, A.C.; Frey, H. Measurement of River Level Variations with Satellite Altimetry. Water Resour. Res. 1993, 29, 1839–1848. [Google Scholar] [CrossRef]
  57. Wingham, D.J.; Francis, C.R.; Baker, S.; Bouzinac, C.; Brockley, D.; Cullen, R.; de Chateau-Thierry, P.; Laxon, S.W.; Mallow, U.; Mavrocordatos, C.; et al. CryoSat: A Mission to Determine the Fluctuations in Earth’s Land and Marine Ice Fields. Adv. Space Res. 2006, 37, 841–871. [Google Scholar] [CrossRef]
  58. Kittel, C.M.M.; Jiang, L.; Tøttrup, C.; Bauer-Gottwein, P. Sentinel-3 Radar Altimetry for River Monitoring-A Catchment-Scale Evaluation of Satellite Water Surface Elevation from Sentinel-3A and Sentinel-3B. Hydrol. Earth Syst. Sci. 2021, 25, 333–357. [Google Scholar] [CrossRef]
  59. McMillan, M.; Muir, A.; Shepherd, A.; Escolà, R.; Roca, M.; Aublanc, J.; Thibaut, P.; Restano, M.; Ambrozio, A.; Benveniste, J. Sentinel-3 Delay-Doppler Altimetry over Antarctica. Cryosphere 2019, 13, 709–722. [Google Scholar] [CrossRef] [Green Version]
  60. Jiang, L.; Nielsen, K.; Dinardo, S.; Andersen, O.B.; Bauer-Gottwein, P. Evaluation of Sentinel-3 SRAL SAR Altimetry over Chinese Rivers. Remote Sens. Environ. 2020, 237, 111546. [Google Scholar] [CrossRef]
  61. Zhang, X.; Jiang, L.; Kittel, C.M.M.; Yao, Z.; Nielsen, K.; Liu, Z.; Wang, R.; Liu, J.; Andersen, O.B.; Bauer-Gottwein, P. On the Performance of Sentinel-3 Altimetry Over New Reservoirs: Approaches to Determine Onboard A Priori Elevation. Geophys. Res. Lett. 2020, 47, e2020GL088770. [Google Scholar] [CrossRef]
  62. Jiang, L.; Nielsen, K.; Andersen, O.B.; Bauer-Gottwein, P. CryoSat-2 Radar Altimetry for Monitoring Freshwater Resources of China. Remote Sens. Environ. 2017, 200, 125–139. [Google Scholar] [CrossRef] [Green Version]
  63. Normandin, C.; Frappart, F.; Diepkilé, A.T.; Marieu, V.; Mougin, E.; Blarel, F.; Lubac, B.; Braquet, N.; Ba, A. Evolution of the Performances of Radar Altimetry Missions from ERS-2 to Sentinel-3A over the Inner Niger Delta. Remote Sens. 2018, 10, 833. [Google Scholar] [CrossRef] [Green Version]
  64. Mo, X.; Wu, J.J.; Wang, Q.; Zhou, H. Variations in Water Storage in China over Recent Decades from GRACE Observations and GLDAS. Nat. Hazards Earth Syst. Sci. 2016, 16, 469–482. [Google Scholar] [CrossRef] [Green Version]
  65. Gelaro, R.; McCarty, W.; Suárez, M.J.; Todling, R.; Molod, A.; Takacs, L.; Randles, C.A.; Darmenov, A.; Bosilovich, M.G.; Reichle, R.; et al. The Modern-Era Retrospective Analysis for Research and Applications, Version 2 (MERRA-2). J. Clim. 2017, 30, 5419–5454. [Google Scholar] [CrossRef] [PubMed]
  66. Tan, J.; Petersen, W.A.; Kirstetter, P.E.; Tian, Y. Performance of IMERG as a Function of Spatiotemporal Scale. J. Hydrometeorol. 2017, 18, 307–319. [Google Scholar] [CrossRef] [PubMed]
  67. Zhao, Y.; Zhu, J. Assessing Quality of Grid Daily Precipitation Datasets in China in Recent 50 Years. Plateau Meteoorol. 2015, 34, 50–58. [Google Scholar]
  68. Cleveland, R.B.; Cleveland, W.S.; McRae, J.E.; Terpenning, I. STL: A Seasonal-Trend Decomposition Procedure Based on Loess (with Discussion). J. Off. Stat. 1990, 6, 3–73. [Google Scholar]
  69. Hamed, K.H. Trend Detection in Hydrologic Data: The Mann–Kendall Trend Test under the Scaling Hypothesis. J. Hydrol. 2008, 349, 350–363. [Google Scholar] [CrossRef]
  70. Yue, S.; Pilon, P.; Cavadias, G. Power of the Mann-Kendall and Spearman’s Rho Tests for Detecting Monotonic Trends in Hydrological Series. J. Hydrol. 2002, 259, 254–271. [Google Scholar] [CrossRef]
  71. Shadmani, M.; Marofi, S.; Roknian, M. Trend Analysis in Reference Evapotranspiration Using Mann-Kendall and Spearman’s Rho Tests in Arid Regions of Iran. Water Resour. Manag. 2011, 26, 211–224. [Google Scholar] [CrossRef] [Green Version]
  72. Gao, H. Satellite Remote Sensing of Large Lakes and Reservoirs: From Elevation and Area to Storage. WIREs Water 2015, 2, 147–157. [Google Scholar] [CrossRef]
  73. Räsänen, T.A.; Koponen, J.; Lauri, H.; Kummu, M. Downstream Hydrological Impacts of Hydropower Development in the Upper Mekong Basin. Water Resour. Manag. 2012, 26, 3495–3513. [Google Scholar] [CrossRef]
  74. IPCC Climate Change 2013: The Physical Science Basis-Conclusions. Bull. Fuer Angew. Geol. 2013, 18, 5–19. [CrossRef]
  75. IPCC Climate Change 2014 Mitigation of Climate Change; Cambridge University Press: Cambridge, UK, 2014.
  76. Hoang, L.P.; Lauri, H.; Kummu, M.; Koponen, J.; van Vliet, M.T.H.; Supit, I.; Leemans, R.; Kabat, P.; Ludwig, F. Mekong River Flow and Hydrological Extremes under Climate Change. Hydrol. Earth Syst. Sci. 2016, 20, 3027–3041. [Google Scholar] [CrossRef] [Green Version]
  77. Bibi, S.; Song, Q.; Zhang, Y.; Liu, Y.; Kamran, M.A.; Sha, L.; Zhou, W.; Wang, S.; Gnanamoorthy, P. Effects of Climate Change on Terrestrial Water Storage and Basin Discharge in the Lancang River Basin. J. Hydrol. Reg. Stud. 2021, 37, 100896. [Google Scholar] [CrossRef]
  78. Ma, Y.; Yang, Y.; Han, Z.; Tang, G.; Maguire, L.; Chu, Z.; Hong, Y. Comprehensive Evaluation of Ensemble Multi-Satellite Precipitation Dataset Using the Dynamic Bayesian Model Averaging Scheme over the Tibetan Plateau. J. Hydrol. 2018, 556, 634–644. [Google Scholar] [CrossRef]
  79. Hu, S.; Mo, X. Attribution of Long-Term Evapotranspiration Trends in the Mekong River Basin with a Remote Sensing-Based Process Model. Remote Sens. 2021, 13, 303. [Google Scholar] [CrossRef]
  80. Kabir, T.; Pokhrel, Y.; Felfelani, F. On the Precipitation-Induced Uncertainties in Process-Based Hydrological Modeling in the Mekong River Basin. Water Resour. Res. 2022, 58, e2021WR030828. [Google Scholar] [CrossRef]
  81. Cheng, R.R.; Chen, Q.W.; Zhang, J.G.; Shi, W.Y.; Li, G.; Du, S. Soil Moisture Variations in Response to Precipitation in Different Vegetation Types: A Multi-Year Study in the Loess Hilly Region in China. Ecohydrology 2020, 13, e2196. [Google Scholar] [CrossRef]
  82. Li, Q.; Liu, X.; Zhong, Y.; Wang, M.; Zhu, S. Estimation of Terrestrial Water Storage Changes at Small Basin Scales Based on Multi-Source Data. Remote Sens. 2021, 13, 3304. [Google Scholar] [CrossRef]
  83. Wang, L.; Kaban, M.K.; Thomas, M.; Chen, C.; Ma, X. The Challenge of Spatial Resolutions for GRACE-Based Estimates Volume Changes of Larger Man-Made Lake: The Case of China’s Three Gorges Reservoir in the Yangtze River. Remote Sens. 2019, 11, 99. [Google Scholar] [CrossRef] [Green Version]
  84. Longuevergne, L.; Wilson, C.R.; Scanlon, B.R.; Crétaux, J.F. GRACE Water Storage Estimates for the Middle East and Other Regions with Significant Reservoir and Lake Storage. Hydrol. Earth Syst. Sci. 2013, 17, 4817–4830. [Google Scholar] [CrossRef] [Green Version]
Figure 1. Study area. (a) The geographical location of the Lancang-Mekong Basin. (b) Zoomed-in map showing the base map of the cascade Xiaowan and Nuozhadu reservoirs along with dam locations, in situ discharge stations, DEM, the ground tracks of sentinel-3 A/B, and Jason-2.
Remotesensing 15 01747 g001
Figure 2. Research flow chart. Abbreviations, TWS: total water storage; SWE: surface water extend; WSE: water surface elevation; SMS: soil moisture storage; SWS: surface water storage; GWS: groundwater storage.
Remotesensing 15 01747 g002
Figure 3. Spatial trends (first row: 2002–2009; second row: 2010–2019) of the total water storage anomaly (TWSA) derived from (ad) JPL mascon, (be) CSR mascon, and (cf) average spherical harmonics in the study region. Spatial information of precipitation (averaged from IMERG and CMAGrid) displayed as trends (g) 2002–2009, (h) 2010–2019, and annual average value (i) 2002–2019.
Remotesensing 15 01747 g003
Figure 4. Temporal variations of GRACE-derived total water storage anomalies (TWSA) in (a,b) Xiaowan and Nuozhadu reservoirs basin, (c,d) Lancang River basin, and (e,f) Mekong River basin. LOESS trend is the de-seasonalized TWSA using the LOESS (locally estimated scatterplot smoothing) method. The gray bars indicate the intermission gap between GRACE and GRACE-FO.
Remotesensing 15 01747 g004
Figure 5. The water bodies of (a) Xiaowan and (b) Nuozhadu reservoirs. The water surface elevations (WSE) derived from Jason-2. Sentinel-3, and Cryosat-2 in (c) Xiaowan and (d) Nuozhadu reservoirs. The surface water extents (SWE) provided by JRC and GRAS in (e) Xiaowan and (f) Nuozhadu reservoirs. The relation curves fitted by altimetry-derived WSE and GRAS-derived SWE in (g) Xiaowan and (h) Nuozhadu reservoirs.
Remotesensing 15 01747 g005
Figure 6. The variations of volume change in (a) Xiaowan and (b) Nuzohadu. The variations of (c) the inflow and (d) outflow in the study region. (e) The variations of the surface water storage anomaly (SWSA) in the study region. The unit of trend is cm/yr. Asterisk (*) refers to statistically significant values (p-value < 0.05).
Remotesensing 15 01747 g006
Figure 7. (a) Time series of monthly soil moisture storage anomaly (SMSA) derived from GLDAS and MERRA-2 products, (b) time series of monthly precipitation derived from CMAGrid and IMERG, (c) linear trends of SMSA and precipitation anomaly in the study region. Asterisk (*) refers to statistically significant values (p-value < 0.05).
Remotesensing 15 01747 g007
Figure 8. Groundwater storage anomaly (GWSA) in the study region. The vacant part of the time series indicates the intermission gap between GRACE and GRACE-FO. Asterisk (*) refer to statistically significant values (p-value < 0.05).
Remotesensing 15 01747 g008
Table 1. Data used in this study. Abbreviations, TWSA: total water storage anomaly; SWE: surface water extend; WSE: water surface elevation; SMS: soil moisture storage.
NameUsageResolutionPeriodSource
GFZTWSA2002–2019https://grace.jpl.nasa.gov/data/get-data/ (accessed on 11 July 2022)
CSRTWSA2002–2019https://grace.jpl.nasa.gov/data/get-data/ (accessed on 11 July 2022)
JPLTWSA2002–2019https://grace.jpl.nasa.gov/data/get-data/ (accessed on 11 July 2022)
CSR masconTWSA0.5°2002–2019https://grace.jpl.nasa.gov/data/get-data/ (accessed on 11 July 2022)
JPL masconTWSA0.5°2002–2019https://grace.jpl.nasa.gov/data/get-data/ (accessed on 11 July 2022)
JRCSWEmonthly2008–2020JRC/GSW1_2/GlobalSurfaceWater
GRASSWE12 day2017–2020DHI Company of Denmark
Jason-2WSE10 day2010–2016ftp://avisoftp.cnes.fr/AVISO/pub/ (accessed on 11 July 2022)
Sentinel-3 A/BWSE27 day2016–2019https://earth.esa.int/eogateway/missions/cryosat/data (accessed on 11 July 2022)
Cryosat-2WSE369 day2010–2019https://scihub.copernicus.eu/dhus/ (accessed on 11 July 2022)
GLDAS 2.1SMS0.25°2002–2019https://disc.gsfc.nasa (accessed on 11 July 2022)
MERRA-2SMS0.65° × 0.50°2002–2019https://disc.gsfc.nasa (accessed on 11 July 2022)
IMERGPrecipitation0.1°2002–2019https://gpm.nasa.gov/data/imerg (accessed on 11 July 2022)
CMAGridPrecipitation0.5°2002–2019http://data.cma.cn/ (accessed on 11 July 2022)
Table 2. The total water storage anomaly (TWSA) trends derived from GRACE in the lower Lancang River basin, Lancang River basin, and Mekong River basin.
Trends in TWSA (cm/yr)
Basin2002–20092010–20192002–2019
Study Region0.168.96 *2.95 *
Lancang River basin−2.211.85−1.40 *
Mekong River basin−8.65−2.48−3.36 *
Note. An asterisk (*) indicates that the trends are statistically significant (p-value < 0.05).
Disclaimer/Publisher’s Note: The statements, opinions and data contained in all publications are solely those of the individual author(s) and contributor(s) and not of MDPI and/or the editor(s). MDPI and/or the editor(s) disclaim responsibility for any injury to people or property resulting from any ideas, methods, instructions or products referred to in the content.

