Article

Mesoscale Eddy Chain Structures in the Black Sea and Their Interaction with River Plumes: Numerical Modeling and Satellite Observations

by
Konstantin Korotenko
1,*,
Alexander Osadchiev
1,2 and
Vasiliy Melnikov
1
1
Shirshov Institute of Oceanology, Russian Academy of Sciences, Nakhimovskiy Prospect 36, 117997 Moscow, Russia
2
Moscow Institute of Physics and Technology, Institusky Lane 9, 141701 Dolgoprudny, Russia
*
Author to whom correspondence should be addressed.
Remote Sens. 2023, 15(6), 1606; https://doi.org/10.3390/rs15061606
Submission received: 20 December 2022 / Revised: 8 March 2023 / Accepted: 11 March 2023 / Published: 15 March 2023
(This article belongs to the Special Issue Remote Sensing Data Assimilation in Ocean Modelling)

Abstract

:
The northeastern part of the cyclonic Rim Current, which encircles the entire basin of the Black Sea, is named as the Northeast Caucasian Current. It periodically approaches the coast, triggering the formation of topographic generated eddies, including long-living isolated anticyclonic eddies and short-living multiple anticyclonic eddies, which group and merge into eddy chain structures. Both types of eddies affect coastal dynamics and interact with multiple river plumes formed in the study area. This interaction determines cross- and along-shelf transport of fluvial water, enhancing the processes of self-cleaning of the coastal zone. In this study, we used a 3D low-dissipation model, DieCAST, coupled with a Lagrangian particle tracking model, and supported by analysis of satellite images, to study the generation and evolution of eddy chains and their interaction with river plumes along the Caucasian coast. Using Fourier and wavelet analyses of kinetic energy time series, we revealed that the occurrence of eddy chains ranges from 10 to 20 days, predominantly in spring-summer season in the area between the Pitsunda and Iskuria capes. During the period of eddy merging, the angular velocities of the orbiting eddies reach maximal values of 7 × 10⁻⁶ rad s−1, while after merging, the angular velocities of the resulting eddies decreased to 5 × 10⁻⁶ rad s−1. Numerical experiments with Lagrangian particle tracking showed that eddy chains effectively capture water from river plumes localized along the coast and then eject it to the open sea. This process provides an effective mechanism of cross-shelf transport of fluvial water, albeit less intense than the influence of isolated anticyclonic eddies, which are typical for autumn-winter season.

1. Introduction

1.1. Mesoscale Eddies in the Black Sea

The Black Sea is an enclosed sea with very limited water exchange with the rest of the World Ocean. Therefore, it could be regarded as a natural laboratory for investigating oceanographic processes in an isolated sea basin. An important challenge in coastal oceanography during the last decades has been the study of coastal mesoscale eddies, which play a significant role in many processes in the World Ocean. In this study, particular attention is paid to near-shore anticyclonic eddies (NAEs) that may significantly affect transport, accumulation, and dispersion of various pollutants [1,2,3], floating organisms [4,5,6,7,8], and plankton [9] in the ocean.
NAEs are regularly observed in satellite imagery at many locations in the Black Sea, mostly concentrated in coastal zones with abrupt changes in bottom topography and shoreline morphology, e.g., along the coasts of Turkey, Georgia, Russia, Crimea, and Bulgaria [10,11,12]. These eddies are formed as a result of instability of the cyclonic Rim Current (RC) that encircles the entire basin of the Black Sea. Meandering of the RC and the resulting formation of instabilities manifested by mesoscale eddies, filaments, and dipole structures could significantly enhance the cross-shelf exchange [13,14,15]. Meanders and mesoscale anticyclonic eddies could arrest coastal waters, which are rich in contaminants and nutrients, and drag them to the central part of the basin or along the coast [3,16,17,18,19,20,21,22,23,24,25,26]. Studies of these processes are very important for understanding the ability of the marine environment to self-cleaning. However, nowadays, the related studies are focused mostly on registering these eddies and calculating their general statistical characteristics, including their velocity, size, and existence time [10,11,12,27,28]. In addition to studying properties of NAEs, a very important issue for coastal oceanography is to predict periodicity of appearance of specific types of NAEs, i.e., so-called topographically generated eddies (TGEs). They are often observed in regions with topographic bottom and coastline features, such as submarine ridges, islands, seamounts, capes, and peninsulas [29,30,31]. Various types of current instabilities and occurrence of TGEs have been studied in [32] and were confirmed by laboratory experiments [33,34,35] and numerical simulations [36,37,38]. The present work is an extension of our recent study, which was focused on generation and evolution of an isolated mesoscale anticyclone at the particular site off the Caucasian coast [39].
Abrupt irregularities of bottom topography and coastline have been proven to be the main causes of RC instabilities. As a result, they induce generation of coherent NAEs on the leeward side of the streamlined obstacles. In the presence of local river discharges, and in case of wide coastal areas with strong thermohaline gradients, this effect could be boosted [39]. The role of eddies in transporting dissolved and suspended matter across the shelf to the open part of the Black Sea is still poorly understood, particularly in relation to river discharge and the related interaction between river plumes and eddies. To predict the effect of mesoscale eddies on the transport of fluvial water and river-borne material across the shelf, different techniques based on coupled Eulerian-Lagrangian approaches are widely used. In our recent study [39], we applied the DieCAST hydrodynamic ocean model and the Lagrangian particle tracking model (LPTM) to predict the influence of meandering of RC, the generation and behavior of anticyclonic eddies on the spreading and mixing of river plumes. The same approach is applied in the current work.

1.2. Manifestation of Eddy Chains and Their Behavior in the Black Sea

Eddy chain structures (ECs) are among the most interesting structures in circulation of the Black Sea. Satellite observations with high spatial resolution allowed documenting evidences of the evolution and decay of ECs during the last few decades [11,12]. Such as other coastal mesoscale structures, such as NAEs and mushroom-like currents, ECs are generated by RC. As was summarized in previous studies (see Figure 4.4 in [13]), ECs were revealed in regions to the south of the Kerch Strait and southwest of the Crimea Peninsula above the continental slope, as well as in the southwestern part of the Black Sea between Kaliakra Cape and the Strait of Bosphorus. In the eastern part of the Black Sea, ECs were revealed in areas along the Anatolian and Caucasian coasts. Eddies in these chains are mostly anticyclonic and stretched over the continental slope along RC flow. The number of eddies in ECs varied from two to four and their diameters ranged within 30–100 km. It is remarkable that most of these chains were observed in spring, which is associated with enhanced meandering of the RC.
Regular satellite observations of the Black Sea enable us to monitor local hydrophisical fields of sea surface temperature and salinity, surface altimetry, and water quality. Figure 1 demonstrates the sea surface temperature, water-leaving radiance, and chlorophyll-a distributions in the Black Sea provided by MODIS Aqua on 4 June 2017. These satellite products (panels A–C) demonstrate a large anticyclonic eddy adjoining the Caucasian coast. Some details surrounding this eddy (e.g., protuberances southeast from the eddy) are clearly visible in the sea surface temperature, water-leaving radiance, and visible RGB composite images (panels A, B, and D) but not in chlorophyll-a image (panel C). The higher spatial resolution in the zoomed visible RGB composite (panel D) enables us to see detailed structures, including a so-called a von Karman vortex street (KVS) (inset in panel D).
Topographically generated mesoscale NAEs periodically emerge in the Black Sea due to the instability of RC impinging on submarine ridges. As was shown in [39], NAEs are shed and then travel along the Caucasian coast, significantly affecting the local brackish waters. In addition, NAEs play an important role in the cross- and along-shelf energy and mass exchange. Thus, they can provide an effective mechanism of river-borne pollution transport towards the open sea areas. Bottom irregularities of submarine ridges near the Pitsunda and Iskuria capes create favorable conditions for eddy genesis. This mechanism of eddy generation in a case of the powerful jet stream of RC approaching the shore was investigated numerically in detail in our recent study [39]. It was revealed that isolated anticyclonic eddies are regularly formed and detached beyond the Pitsunda Cape when the RC position was close to the cape. The processes of eddy evolution consisted of three stages, namely, developing, maturing, and decaying. All stages in total lasted 50–60 days, during which the eddy remained coherent for ~30 days. The process of eddy maturing lasted for the next ~20 days followed by the decaying regime, which lasted ~15 days. The decaying regime was accompanied by onshore intrusions and filaments induced by upwelling and downwelling processes in the coastal zone. Such processes enhance the water exchange between the shelf and open sea, which was confirmed by satellite observations and numerical modeling of particle transport at the zones of interaction between river plumes and mesoscale eddies [11,12,17,21,24,27,28,40,41,42,43,44,45,46,47,48].
Of particular interest among multiscale vortex structures emerging in the ocean are those organizing behind islands or submarine ridges as a result of their interaction with strong jet currents. Streamlines behind a topographic obstacle have a specific form called a “wake”. Vortexes, which start from the surface of the obstacle, separate the fluid in the wake from the main flow. Under favorable conditions, vortices in such wakes are arranged in KVS, which consist of two rows of vortices with opposite rotation signs. The vortices are staggered such that a vortex in one row lies opposite the center of the downstream spacing between adjacent vortices in the other row. The probability of occurrence of KVS and the evolution of vortices were investigated by [49] in the Luzon Strait in the lee of an isolated island using satellite observations from January 2018 to August 2020. It was found that KVS events occur only from May to July. Characteristic parameters for KVS were estimated (see Figure 3 in [49]): horizontal velocity   U e , the longitudinal spacing in one row   a , and transverse spacing between two rows b . For different days, a varied from 6.918 to 9.568 km and b varied from 1.059 to 2.687 km. The ratio b / a ranged from 0.963 to 2.442. Numerical experiments with DieCAST ocean model revealed that for realistic velocities and eddy viscosities of the flow, an isolated island sheds KVS vortices, the latter being shed with a period of about 10 days [50]. Disturbances of the ambient flow by the presence of an island are very extensive and remain downstream for a distance of up to nine diameters of the island [50,51,52].
There are certain areas in the Black Sea, e.g., off the Caucasian coast, where high-resolving satellite imagery detected evidence of KVS eddies [53]. We also found a number of confirmations of such structures. One of them is shown in Figure 1D, which demonstrates a KVS structure evolving off the Pitsunda Cape. The schematic diagram of the vortex street with characteristic parameters is presented in the inset D1 in Figure 1. As was mentioned above, the Caucasian coast is one of the Black Sea regions where EC formation frequently occurs. Eddies forming a chain are both cyclonic and anticyclonic. Such EC structures were detected in optical satellite images [11,12] along the Caucasian coast. ECs were distributed in three clusters: (1) off the region of Iskuria Cape, (2) off the Pitsunda Cape, and (3) along the strip from the eastern coast of Crimea to Tuapse. There are a particular class of instabilities associated with topographical irregularities of the sea bottom and shoreline leading to eddy-emerging processes. Regularity and frequency of these processes can result in the formation of EC structures. To recognize the processes and mechanisms, which cause the appearance of such structures, we used numerical modeling.
Figure 2 shows a series of MODIS Aqua satellite images of chlorophyll-a, indicating the manifestation of ECs along the Caucasian coast in March and April of different years. Chlorophyll-a, as a tracer, helps to visualize the effect of ECs on the distribution of fluvial waters from numerous Caucasian rivers distributed along the coast. The quality of the visualization of eddies strongly depends on clouds and the size of river plumes in the local coastal zone. Within the band of fluvial waters of about 100 km in width, three to eight eddies could be detected in the chains. The majority of eddies shown in Figure 2 are anticyclonic with diameters from 30 to 80 km, whereas only one image (Figure 2F) indicates that EC contains cyclonic eddies. Figure 2 shows that ECs are strictly attached to the RC and are often stretched along the coast between the Iskuria Cape and Novorossiysk, i.e., for more than 400 km. We presume that some periodic mechanism of eddy generation produces such long chains. As was shown in [39], approaching of RC to certain sites of the Caucasian coast may trigger dynamic instability and eddy production; therefore, the period of meandering of RC determines the generation of either isolated eddies or EC structures. As mentioned above, predicting the periodicity of occurrence of specific types of near-shore eddies is a very important issue for coastal oceanography. Among them, TGEs hold a unique place since they are often observed in regions with topographic features such as islands, submarine ridges and canyons, as well as coastline features such as peninsulas and capes [29,30,31]. Different kinds of obstacles define various causes of hydrodynamic instability and thus, the occurrence of TGEs and the frequency of their appearance.
In the present study, as in [39], we focus on the northeastern part of the Black Sea, i.e., the Caucasian shelf and coastal zones. In this area, meandering of the Northeast Caucasian Current (NCC) often approaches very closely to the coast [27,40]. The local bathymetry map (Figure 3) demonstrates peculiarities of the bottom topography to northwest of the Pitsunda Cape, characterizing a very narrow and steep slope that follows shallow shelf offshore the Pitsunda and Iskuria capes. This feature, along with inflow of Caucasian rivers and formation of river plumes along the coast, creates conditions favorable for TGE generation. First, using spectral analyses, we assess the periodicity of TGE appearance and study conditions of EC structure development as a result of the interaction of meandering RC with bottom topography. Second, in order to understand the mechanisms enabling eddies to efficiently transport coastal waters, we study a periodically emerging near-shore anticyclonic eddies in NCC, leading to the assemblage of ECs. Combining a hydrodynamic model with a Lagrangian particle-tracking model, we scrutinize the evolution of eddies and gain new insights into the formation, development, advection, and dissipation of the chain of anticyclonic eddies in the study area.
The paper is structured as follows. In Section 2, we introduce the area of interest. The DieCAST hydrodynamic model, the Lagrangian particle-tracking model, and two spectral methods (the Fourier and wavelet transforms), which are applied to identify eddy generation and shedding are described in Section 3. In Section 4, the baseline experiments and modeling results are presented, and the obtained features of topographically generated ECs are analyzed in detail. Spectral methods are applied to numerical simulation outputs. Section 5 is focused on features of the interaction between ECs and river plumes in the study area, followed by conclusions in Section 6.

2. Study Area

We focus on the northeastern part of the Black Sea, where TGEs are often generated (Figure 3). Satellite observations indicate that the most frequently NAEs emerge in the area between the Iskuria and Sochi capes [22,23,27,29,40]. After being shed, NAEs propagate along the coast to Novorossiysk and even further up to the eastern Crimea with an average translation velocity of about 4 km/day. The area between Tuapse and the Iskuria Cape receives freshwater from multiple rivers that cause their interaction with NAEs. From time to time, NAEs protrude through RC and move further across the shelf towards the open part of the Black Sea as isolated eddies [3,23,28]. They carry trapped coastal water and river-borne pollutants and thus enhance water exchange between the open sea and coastal zone. We study the spectral structure of current velocity and peculiarities of TGE processes and their shedding. In the study area, shedding of mesoscale NAEs is likely to be triggered by the interaction of RC with abrupt bottom irregularities (ridges and canyons).

3. Data and Methods

3.1. Hydrodynamic and Lagrangian Particle-Tracking Models

The 3D, low dissipative, z-coordinate and 2 nautical-minute resolution ocean circulation model, DieCAST [54], adapted for the Black Sea and referred to as Die2BS [54,55,56], was used to study generation and shedding of mesoscale eddies and their progressing along the Caucasian coast of the Black Sea, as well as the impacts of NAEs on river plumes. The computational grid of the model covers the entire Black Sea basin from 27.2°E to 42°E and from 40.9°N to 46.6°N and contains a total of 426 × 238 rectangular cells, so that square cell dimensions varied from 2.6 to 2.8 km. The vertical step was uneven, with the grid condensation near the sea surface in order to enhance seasonal thermocline resolution. In this work, we used unsmoothed bottom topography, ETOPO2, which is very important for adequately modeling mesoscale activity. Note that the first internal baroclinic deformation radius in the Black Sea varies from 5 to 20 km, i.e., significantly less than the square cell, thus, the model enables to adequate resolution of mesoscale and even sub-mesoscale structures. The time step in simulation was 12 min. The model spin-up time to reach a quasiperiodic mode of circulation was 39 years, although the main features of the Black Sea circulation (such as RC and cyclonic gyres, Rossby waves, and coastally trapped waves) appeared after five computation years. The physical boundary conditions, initial conditions, and surface forcing used in this study were derived from monthly climatology [3,19,26,57].
Die2BS was initialized with monthly-averaged temperature and salinity data and forced with climatological surface buoyancy fluxes, evaporation minus precipitation, monthly winds, and river runoff from 31 largest rivers [58]. During model runs, a special nudging data assimilation procedure was launched. The surface buoyancy flux was computed by nudging both the temperature and the salinity toward monthly climatology as in [19]. For determining vertical viscosity and diffusivity, a modified version of the Gibson-Launder turbulence model was used [59,60]. The validation of DieCAST lying in the base of Die2BS was performed based on altimetry data (joint TOPEX/Poseidon and ERS-1/2 data with 0.25° spatial and 10 day temporal resolution), satellite images of the sea surface temperature and surface current velocities obtained in observations and derived from drifter experiments [3,26,39,55,56,57,61]. The interaction of eddies passing along the coastal zone with river plumes was reproduced by coupling Die2BS with LPTM [3]. The detailed description of numerical modeling is given in [39].

3.2. Spectral Methods

In the present paper, we focus on the formation of ECs and merging of eddies as they move along the Caucasian coastal zone, especially in relation to the frequency of occurrence of TGEs and their behavior. For this purpose, we used the Fourier transform (FT) and wavelet transform (WT) spectral analysis of the kinetic energy fluctuations to identify frequencies of the occurrence of mesoscale TGEs. These spectral techniques complement each other in identifying coherent mesoscale eddies. One of the criteria used to distinguish coherent structures (e.g., velocity fluctuations) from chaotic ones is a sign that the phase-correlated vorticity derived from velocity gradients (see below in Section 4.2) covers the entire space of the structure, e.g., mesoscale eddy structures. In this sense, the coherent vorticity is the main characteristic identifier for coherent structures. Such mesoscale eddies are the most frequent coherent structures in the World Ocean, and their emergence is a result of dynamic instability of currents.
Mesoscale eddies are often generated in the study region, which was revealed by satellite and in situ observations [16,22,23,26] and confirmed by numerical modeling [39]. peculiar type of mesoscale eddies are TGEs produced by interaction of RC with bottom or coastline irregularities. In these cases, the generated lee eddies propagate behind topographic features occupying the entire water column. The area between Sochi and the Iskuria Cape with abrupt bottom relief could trigger the emerging of eddies, which are later shed and progress along the Caucasian coast [22,23,62]. Sizes of these eddies are ~50 km in diameter, and sometimes they produce fine-scale sub-mesoscale (<10 km) eddies sandwiched between the initial eddy and the shoreline [63].
Using FT and WT, we determine spectral content of current velocity fluctuations within the frequency band associated with eddy effects to identify their frequency. In [39], the frequency of the appearance of isolated anticyclonic TGE was successfully identified for the same region. In this paper, similarly, we focus on the formation of ECs and their progression along the Caucasian coast.

4. Results

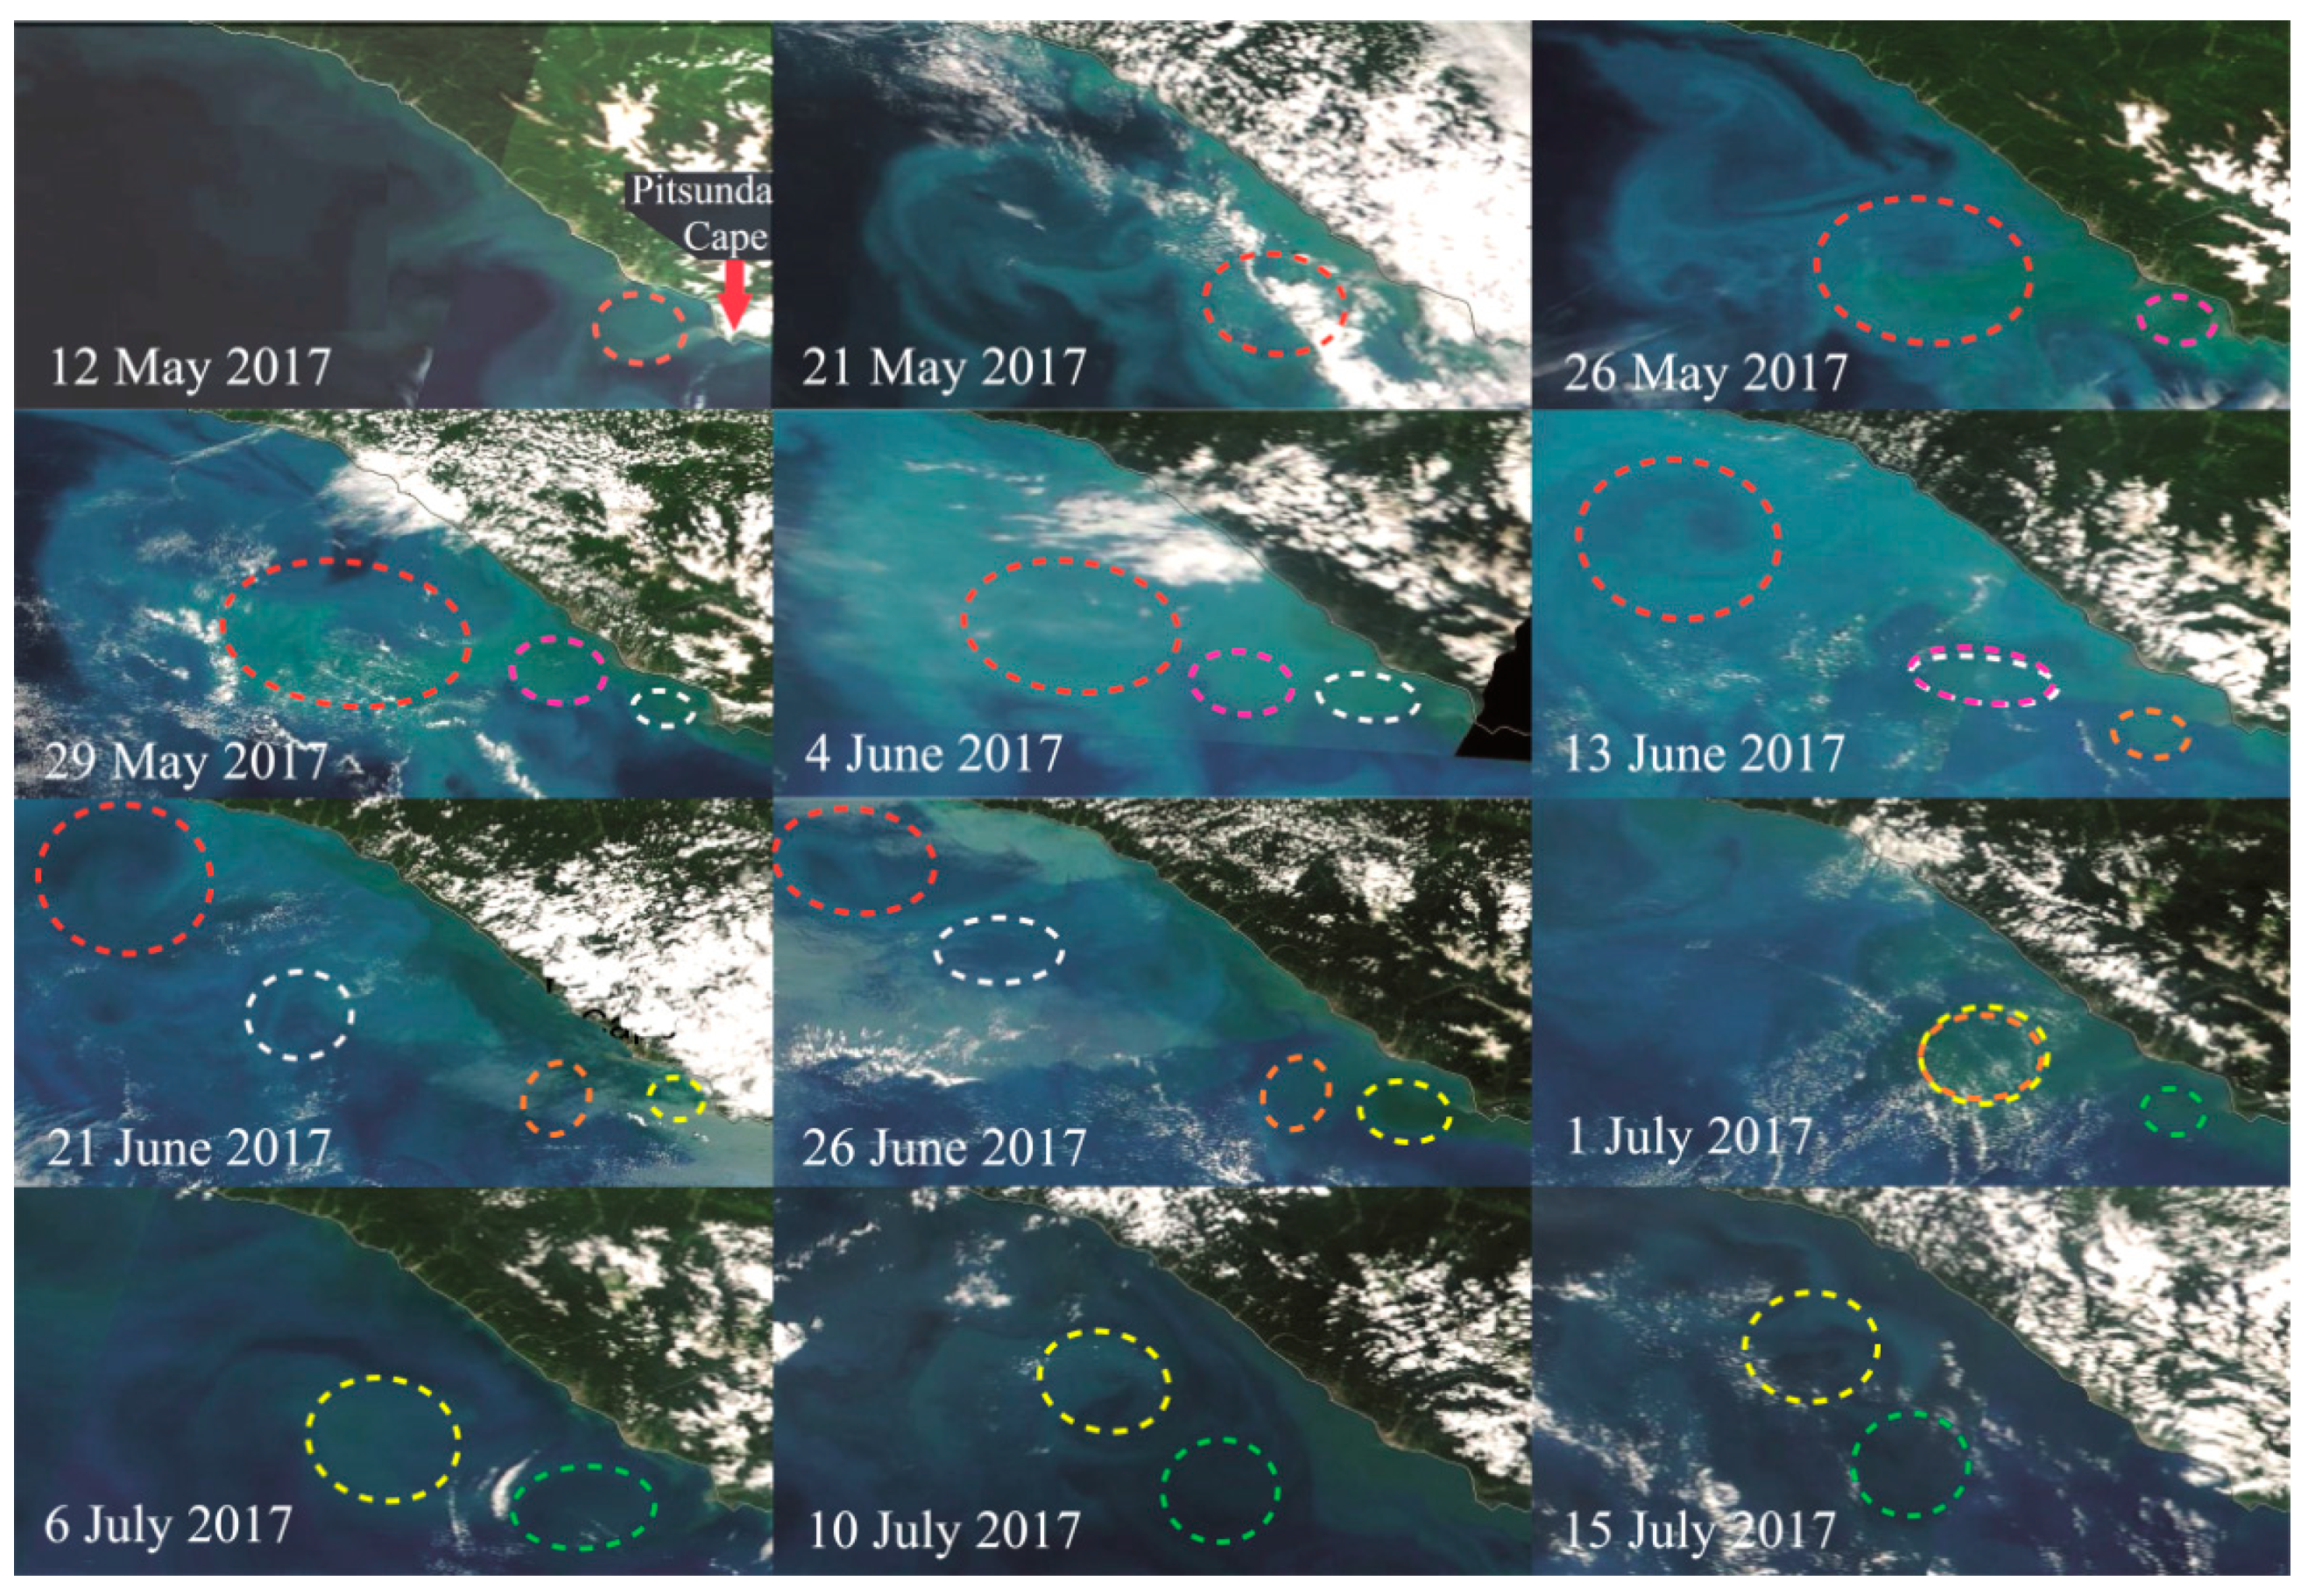
4.1. Phenomenon and Origing of Eddy Chain Structures

Recently, in [39], we investigated the generation, progression, and dissipation of an intense isolated TGE, which emerged when the RC very closely approached the coast in the region between Iskuria and Pitsunda capes. Modeling revealed that this kind of eddy occurs during the fall-winter period when the RC is strong and is slowly meandering. During this period, the Batumi anticyclonic eddy (BAE) is absent, and the strengthening RC reaches the Pitsunda-Iskuria region. The latter appears to be the most favorable location where eddy occurrences frequently happen because RC loses stability impinging on the abrupt bottom irregularities.
As our modeling revealed, two types of mesoscale anticyclonic eddies appeared in the NCC: (1) isolated eddies and (2) ECs with events of merging. The appearance of each type of eddy depends on a season; the former occurred mostly in spring-summer when the RC wanes, while the latter occurred mostly in autumn-winter when the RC waxes. The Eulerian-Lagrangian experiment performed with the isolated Caucasian anticyclonic eddy aimed to mimic the process of the involvement of river water into the eddy as it traveled along the shore. It was shown that the anticyclonic eddy effectively trapped suspended matter incoming with river water, transported it as the eddy moved along the coast and, thus, facilitated the water exchange between coastal zone and open sea.
Another kind of interesting mesoscale structure occurring in NCC and affecting water mass exchange are ECs, which are common in frontal zones, particularly, in those associated with the influence of the RC [10,11,12,63]. The first manifestations of eddy structures in the NCC visible in the distribution of chlorophyll-a are located between the Iskuria and Pitsunda capes (Figure 2) due to the complex bottom topography with ridges and canyons stretched offshore (Figure 3). Unlike isolated NAEs emerging along the Caucasian coast, ECs mainly appear during the warm season (March–September) under the following conditions: (1) BAE is suppressed, and (2) the RC stretches to the easternmost part of the Black Sea (Figure 2) [10,11]. Examples provided in [63] confirm that ECs arise when the meandering of RC increases, and it approaches very close to the Pitsunda Cape. Note that an image acquired on 1 October 2003 in [63] demonstrates EC consisting of cyclonic eddies, as in Figure 2F. Interestingly, KVSs mainly occur during warm periods with a maximal frequency in April and May [49].
Complex mesoscale eddy dynamics with seasonal variability considerably affect physical and biochemical processes along the Caucasian coast of the Black Sea. During the warm season, the eastern part of the Black Sea is occupied by the evolving BAE, which is the most pronounced feature of the Black Sea eddy dynamics. Growing BAE displaces RC from the easternmost part of the Black Sea to the north, which considerably alters the configuration of the current system in the vicinity of the Pitsunda and Iskuria capes. As shown in the inset of Figure 4, the shoreward part of BAE meets the displaced cyclonic RC jet that accelerates the latter. This process could trigger the formation of an isolated eddy or EC. Previous studies assumed that eddies originated directly from BAE [16]. However, numerous in situ and remote sensing data, particularly during summer period when BAE is establishing, do not clarify the role of strong BAE in the genesis of eddies. Particularly, it is unclear what causes an eddy (generated due to BAE activity) to pass over the submarine Pitsunda-Kodor ridge and progress further along the Caucasian coast to Novorossiysk. To elucidate these problems, we use the DieCAST/LPTM hybrid model to understand the behavior of generated eddies and their impact on river plumes.
Figure 4A presents an example of modeled dynamic structures at sea surface that could be compared with satellite images, e.g., chlorophyll-a or suspended matter concentrations. The snapshot shows the bathymetry and the distribution of NAEs exhibited by velocity streamlines, and NAEs are outlined by the sea surface height (SSH) obtained from the model output. Figure 4B presents satellite-derived suspended matter concentration demonstrating the capture of river plumes by each eddy of a chain structure. Both panels show the presence of a large BAE attached to the Iskuria Cape. Importantly, there is no evidence of connection of BAE with the EC structure stretched along the Caucasian shore. As modeling revealed, the major part of eddy activity generated due to BAE rotation does not cross the southern flank of the Pitsunda Ridge. Therefore, ECs north of the Pitsunda Cape are not connected with mesoscale structures in the eastern part of the Black Sea.
The satellite image of suspended matter (Figure 4B) demonstrates numerous turbid river plumes along the Caucasian coast, which are trapped by eddies. NAEs capture river plume waters due to internal convergent circulation and shield them inside the eddy cores from strong mixing with the surrounding sea. Thus, NAEs could transport the trapped fluvial waters far from their sources in river mouths. Sequential satellite data images (which depend on cloud conditions) are useful to track particular events associated with the generation of NAEs and their evolution in the sea. Therefore, a joint analysis of satellite imagery and numerical modeling allows the study of the 3D structure of eddies [64]. Below, we use our hybrid model to scrutinize the processes of formation of EC structures, their fate, and their merging while they travel along the Caucasian coast. We use relative vorticity as the main modelling parameter to emphasize eddy structures. In addition, we compare model results with satellite images.

4.2. Eddy Chain Formation and Eddy Merging

Vortices in the Black Sea have a long life cycle (from several weeks to several months) and exhibit complex evolution involving perturbations due to wind forcing, instabilities in vortex cores, and merging events. In this model study, we simulate and examine ECs. Being generated and shed from the Pitsunda–Kodor area with bottom irregularities, ECs progress along the Caucasian coast, periodically merge, and produce agglomerated eddy structures. The eddy-train structures are often observed by satellites [10,11,12,19,22,23,47,65,66] during the spring-summer period when the northward shift of RC occurs due to the development and growth of BAE.
The relative vorticity (s−1) is expressed as   ζ = d v d x d u d y   , where u and v are the mean horizontal components of velocity. It is an extremely important characteristic for describing the rate and sign of instantaneous fluid rotation. Counterclockwise rotation indicates positive or cyclonic vorticity, while clockwise rotation indicates negative or anticyclonic vorticity. When a sea current encounters irregular bathymetry, such as coastal canyon or cape, it shifts to open sea or shallow shelf with varying relative vorticity while keeping potential vorticity conservation [32]. Figure 5 (panel ‘Day 70’) shows the prehistory of complex interaction between large scale cyclonic RC (red arrow) and rotating BAE (blue arrow). This flow structure bifurcates near the coast between the Pitsunda and Iskuria capes and creates a dipole structure directed toward the coast. Merging and splitting of two intense flows at this particular region of the Caucasian coast provide favorable conditions for eddy formation. It was presumed by [40] that Caucasian NAEs are emitted directly by BAE and then progress along the Caucasian coast in northwest direction. However, high-resolution low-dissipative model used in the present work allowed for the clarification of and scrutiny of the process of eddy shedding in this region. It was revealed that coherent anticyclonic eddies appear near the Pitsunda and Iskuria capes with wide shelf and slope. Isobaths turn offshore from the curving coastline, indicating the existence of submarine ridges. Flowing over such irregularities, the strong cyclonic RC modifies its vorticity over the seamounts. These peculiarities of horizontal vorticity distribution are critical for eddy interactions and are important for the assessment of the total vorticity in eddies after their merging or splitting.
The vertical component of relative vorticity, ζ normalized by Coriolis parameter   f 0 , i.e., ζ/ f 0 , demonstrates the development and propagation of EC along the Caucasian coast in spring (Figure 5). The red and magenta stars denote the locations of sites where TGE are periodically formed. The insets in panels ‘Day 70’ and ‘Day 105’ show streamlines indicating the positions of RC and BAE, which significantly changed during this period. On Day 70, RC expands to northeast and creates a loop. As shown by streamlines, RC passes over both sites marked by the red and magenta stars. The evolving BAE shifted RC to the northwest, and by Day 90, RC moved off the red-star site abeam of the Pitsunda Cape but remained at the magenta-star site. Further development and penetration of BAE to the northwest resulted in the shifting of RC offshore by Day 105. The band of vertical vorticity at both sites was significantly weakened and completely disappeared by Day 110. The observed evolution of the complex system RC-BAE significantly affects the eddy genesis, which is worth focusing on.
As seen in the panel ‘Day 70’ (Figure 5), at the beginning, the anticyclonic vorticity (blue colors) is confined within a narrow band stretched along the Caucasian coast between the Pitsunda Cape and Novorossiysk. This discrete anticyclonic vorticity strip consists of the chain of elongated anticyclonic eddies A1, A2 and A3 separated by a cyclonic filament F (red colors) resembling upwelling cross-shelf intrusion. Values of ζ/ f 0 in A1, A2, and A3 eddy cores were about −0.6, −0.6, and −0.8, respectively. At the eddy generating sites marked by the magenta and red stars, the value of ζ/ f 0 was equal to −0.8 and −1.0, respectively, while the maximum of negative ζ/ f 0   in BAE (blue colors) was −0.4.
The intrusion F gradually extended and, by Day 75, surrounded two recently merged eddies A2 and A3 (resulted in eddy A2,3). Intrusion F separated A2,3 from the eddy A1 to the north and from a recently formed eddy A4 to the south. By this day, the extended BAE reached the northeastern coast near the Pitsunda and Iskuria capes. As the model revealed, the values of ζ/ f 0 in eddy cores of A1, A2,3 and A4 were equal to about −0.8, −1.0, and −1.0, respectively. At the eddy generating sites marked by magenta and red stars, the value of ζ/ f 0 reached −1.0 and −1.2, respectively. The latter indicates a significant contribution from non-geostrophic processes. The minimum of   ζ / f 0   in BAE (blue colors) was equal to −0.4 and was shifted to the north. The computations revealed that as the merging of A2 and A3 was completed, the resulting eddy A2,3 increased in size and kept moving northwest with a translation velocity of about 3 km day−1. During the merging event (Days 71–73), the translation velocity of A3 increased to about 5 km day−1. The angular velocity of A2,3, during the period of merging, reached a maximum of about 7 × 10⁻⁶ rad s−1, while, after merging, the angular velocity decreased to about 5 × 10⁻⁶ rad s−1.
The panel labeled ‘Day 80’ shows the result of the transformation of the EC structure, which includes: (1) complete dissipation of the eddy A1, (2) progressing of all eddies to the northwest and merging of A2 with A3, and (3) formation of a dipole pair A2,3 + C1 abeam of Tuapse with ζ/ f 0   equal to −0.8 and +0.4, respectively. Afterward, a new eddy A4 evolved offshore Sochi. The dipole pair A2,3+C1 was unstable, possibly due to repulsion between vortices of opposite signs. As a result, by Day 85, C1 squeezed to the filament separating A2,3 from A4. A new vortex A5 started developing offshore Sochi, and its merging with A4 provided an additional element (A4 + A5) to EC. On Day 85, the minimal values of ζ/ f 0   in A2,3 A4, and A5 eddy cores were about −0.8, −1.0, and −0.8, respectively. At the eddy generating sites marked by the magenta and red stars, the value of ζ/ f 0 decreased to about −0.9 and −0.6, respectively. The minimum value of ζ/ f 0   in BAE (blue colors) remained the same (−0.4), albeit shifted eastward.
The panel labeled ‘Day 90′ shows eddies A2,3 and A4,5 formed at the final stage of merging, as well as the occurrence of a new anticyclonic eddy (A6) at the northwestern flank of the vorticity band stretched from the eddy generation site. The minimum of ζ/ f 0 in the cores of eddy A2,3 remained the same as at Day 85, while those of A4,5 and A6 were about −1.0. At the eddy generation cites marked by the magenta and red stars, the value of ζ/ f 0 increased to about −0.8 and −0.3, respectively. The minimum ζ/ f 0   in BAE (blue colors) remained the same (−0.4) but shifted southward. On Day 95, three well-pronounced anticyclonic eddies located offshore Novorossiysk (A2,3 with diameter ~35 km), Tuapse (A4,5 with diameter ~45 km), and between Tuapse and Sochi (A6 with diameter ~30 km) were completely developed. They created a classical EC embedded in the coastal frontal zone of RC. On Day 105, the fully developed eddy A6 was involved in a merging process with the complex eddy A4,5. Note that the inset on Day 95 presents a satellite-derived chlorophyll-a distribution at the study area on 10 March 2016 [63]. It clearly demonstrates the presence of an EC system along the coast.
Panel ‘Day 110’ shows details of the transformation of eddies A4, A5, and A6 at the intermediate stage of eddy merging. The merging process of A4 and A5 preceded formation of an anticyclonic meander and then was followed by the merging of eddies A4, 5 and A6. A younger eddy, A6, reached the merging eddies A4 and A5, as shown in Figure 5 (Day 110). The merging eddy A4,5, along with eddy A6, crossed the cyclonic filament separating these eddies. It resulted in blocking of the onshore part of the filament and and causing its quick growth to a double-core cyclonic eddy (C2) embedded between A4,5 + A6 and the coastline. By Day 110, the minimum of ζ/ f 0   in cores of eddies A4,5 and A6 were −0.8, −0.6, respectively, while the vorticity at both sites marked by the magenta and red stars increased to about −0.2. This value, as evidenced by Figure 5 (Day 110), was associated with intrusion of BAE, which had a ζ/ f 0 of up to −0.4. The modeling revealed that the occurrence of instability and, thus, generation of anticyclonic vorticity occurred to the northwest abeam of Sochi. Two days later (on Day 112—not shown in Figure 5), the conjunction of the cyclonic eddy C2 with the merged eddy A4,5,6 creates a dipole structure A4,5,6 + C2. The cyclonic eddy C2 proved to be unstable and, being squeezed between A4,5,6 and the newborn eddy A7, by Day 120, spread and surrounded, as a cyclonic filament, the eddy A4,5,6.
By Day 120, when the merging of A4,5 and A6 finished, the joint elongated eddy A4,5,6 increased its size and continued to move northwestward towards Novorossiysk. By Day 130 (not shown in Figure 5), the eddy A4,5,6 reached Novorossiysk. The value of ζ/ f 0   in the core of A4,5,6 increased to −0.7, whereas the translation velocity of A4,5,6 decreased to 2 km day−1. The cyclonic filament stretching between C2 and A7 (Day 110) and isolating the latter from A4,5,6 led to the degradation of C2. At the final stage (Day 160 not shown in Figure 5), eddy A4,5,6 reached the shelf break of eastern Crimea (44.5°N, 36.8°E), and the minimum of ζ/ f 0   in its core increased to −0.2. Interestingly, during the development of EC, the average eddy translation velocity was non-homogenously distributed along the eddy track and ranged from 2 to 5 km day−1 reaching maximal values during the eddy merging events. As simulations revealed, eddy shedding events occur every ~13 days during the development of EC. Once an eddy was shed, it propagated along the Caucasian coast from the Pitsunda-Kodor area to Novorossiysk and merged with other eddies. Note that merging events lasted for ~7 days, reflecting the changes in eddy translation velocity before and after shedding.
The performed numerical simulations demonstrated the formation of ECs in NCC and reveal their extremely complex structure and evolution. We showed that EC has a quasi-seasonal variability derived by meandering of RC because its interaction with the submarine ridge located offshore the Pitsunda Cape induces generation of TGEs. Intense meandering of RC usually occurs in early spring but could last till mid-summer. This EC experiences abrupt and quick changes that could be observed in satellite imagery, which supports the numerical modeling results. Figure 6 presents cloud-free MODIS Aqua satellite images of the study area from May to July 2017. The images illustrate the capture of turbid river plume waters by TGEs generated over the submarine ridge offshore Pitsunda. This process first visualizes eddies at satellite images and second demonstrates their interaction with river plumes. Satellite images demonstrate advection of individual eddies and their merging within EC. The first eddy (red dashed ellipse on 12 May 2017 in Figure 6) was generated near the Pitsunda Cape (red arrow in Figure 6). It moved along the coast and increased in size, while generation of eddies continued near the Pitsunda Cape. By 4 June 2017, three eddies (red, magenta, and white ellipses) were formed. On 13 June 2017 the second and third eddies merged near Sochi, while the fourth eddy (orange ellipse) was generated near the Pitsunda Cape. The first eddy and the merged second and third eddies continued to move in a northwestward direction and left the study region by 1 July 2017. By this time, the fourth and fifth eddies merged (orange and yellow ellipses), while the sixth eddy (green ellipse) was generated near the Pitsunda Cape. Both eddies were visible until 15 July; however, new eddies did not appear at the generation site. The interruption of eddy formation is presumed to be caused by deflection of RC from the coast.
Tracing the advection and merging of eddies at satellite imagery (Figure 6) demonstrates that eddies were generated on 12, 26, and 29 May and on 13 and 21 June and 1 July 2017, with uneven but with time spans of less than 15 days. Generation of new eddies was interrupted after 1 July 2017, while the two remaining eddies continued moving along the Caucasian coast and extending in diameter. During the formation of EC structure, two merging events occurred on 13 May and 1 July 2017. The time periods from eddy generation till its merging was equal to 10 and 15 days. In summary, both numerical simulations (Figure 5) and satellite imagery (Figure 6) demonstrate that newly formed eddy emerged near the Pitsunda Cape as a result of RC instability over a submarine ridge. Formation of eddies occurs every ~10 days in spring, while merging of eddies occurs 10–15 days after their formation, although not for every eddy.

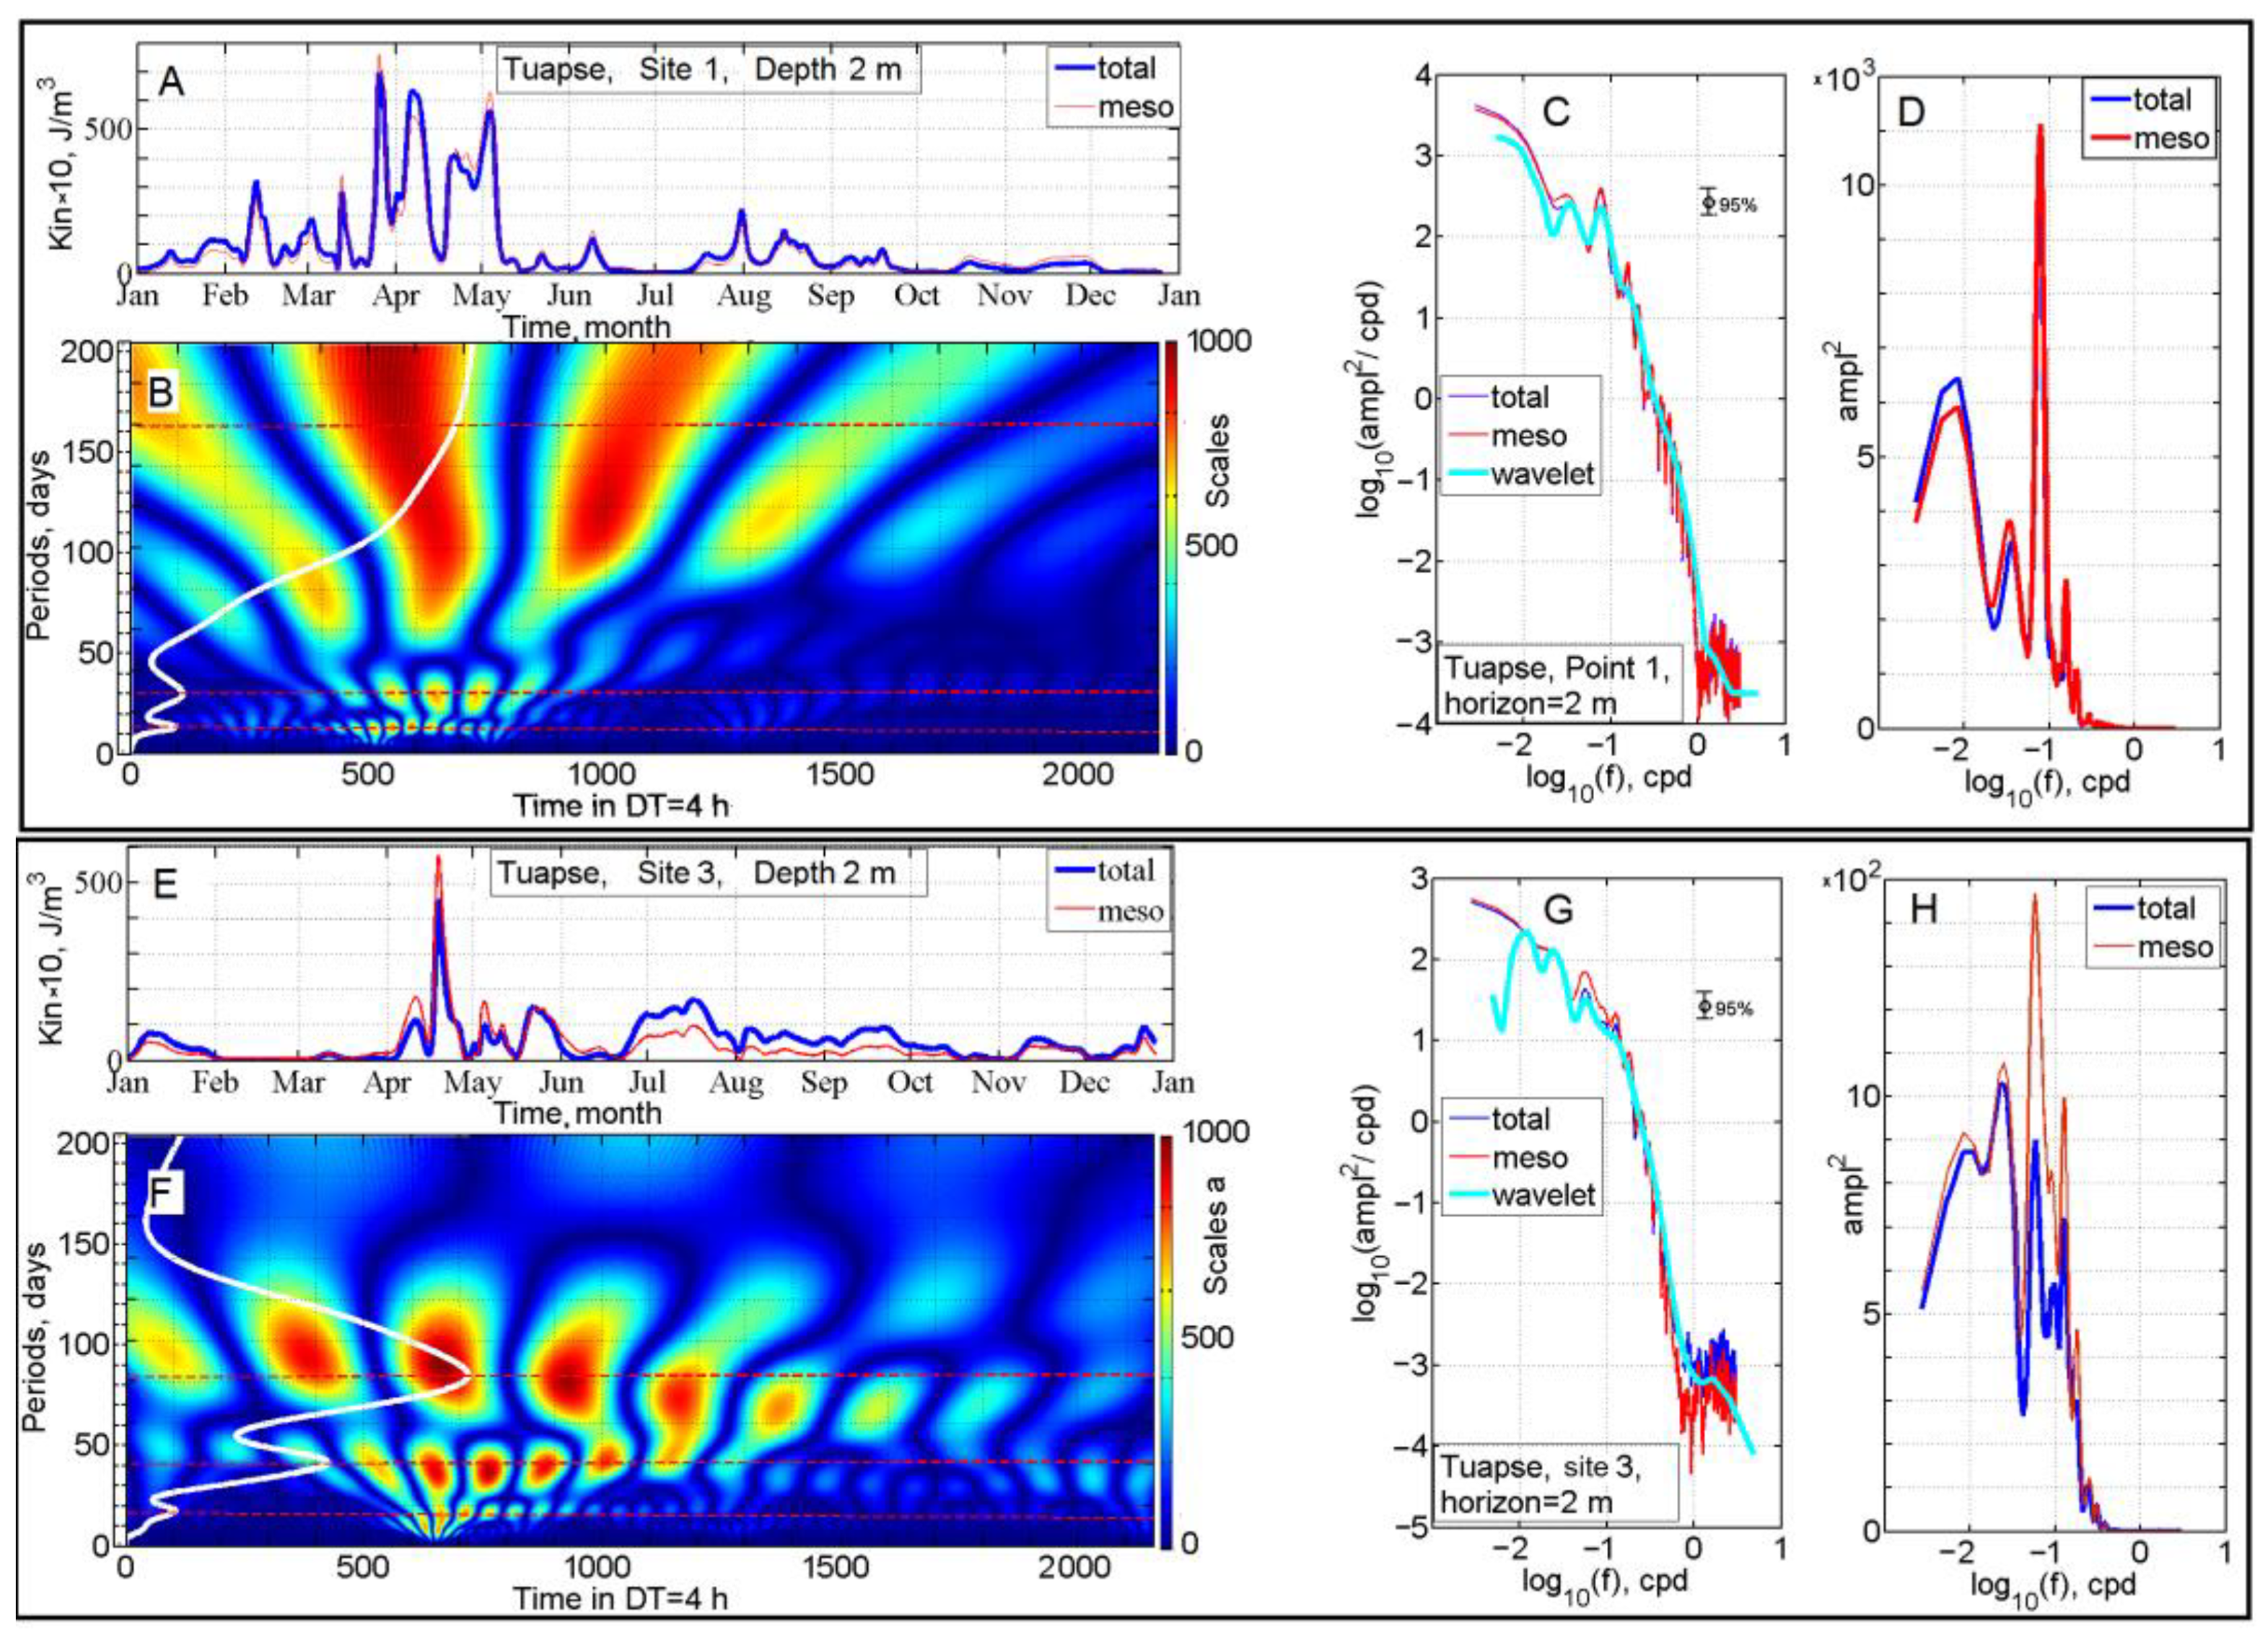
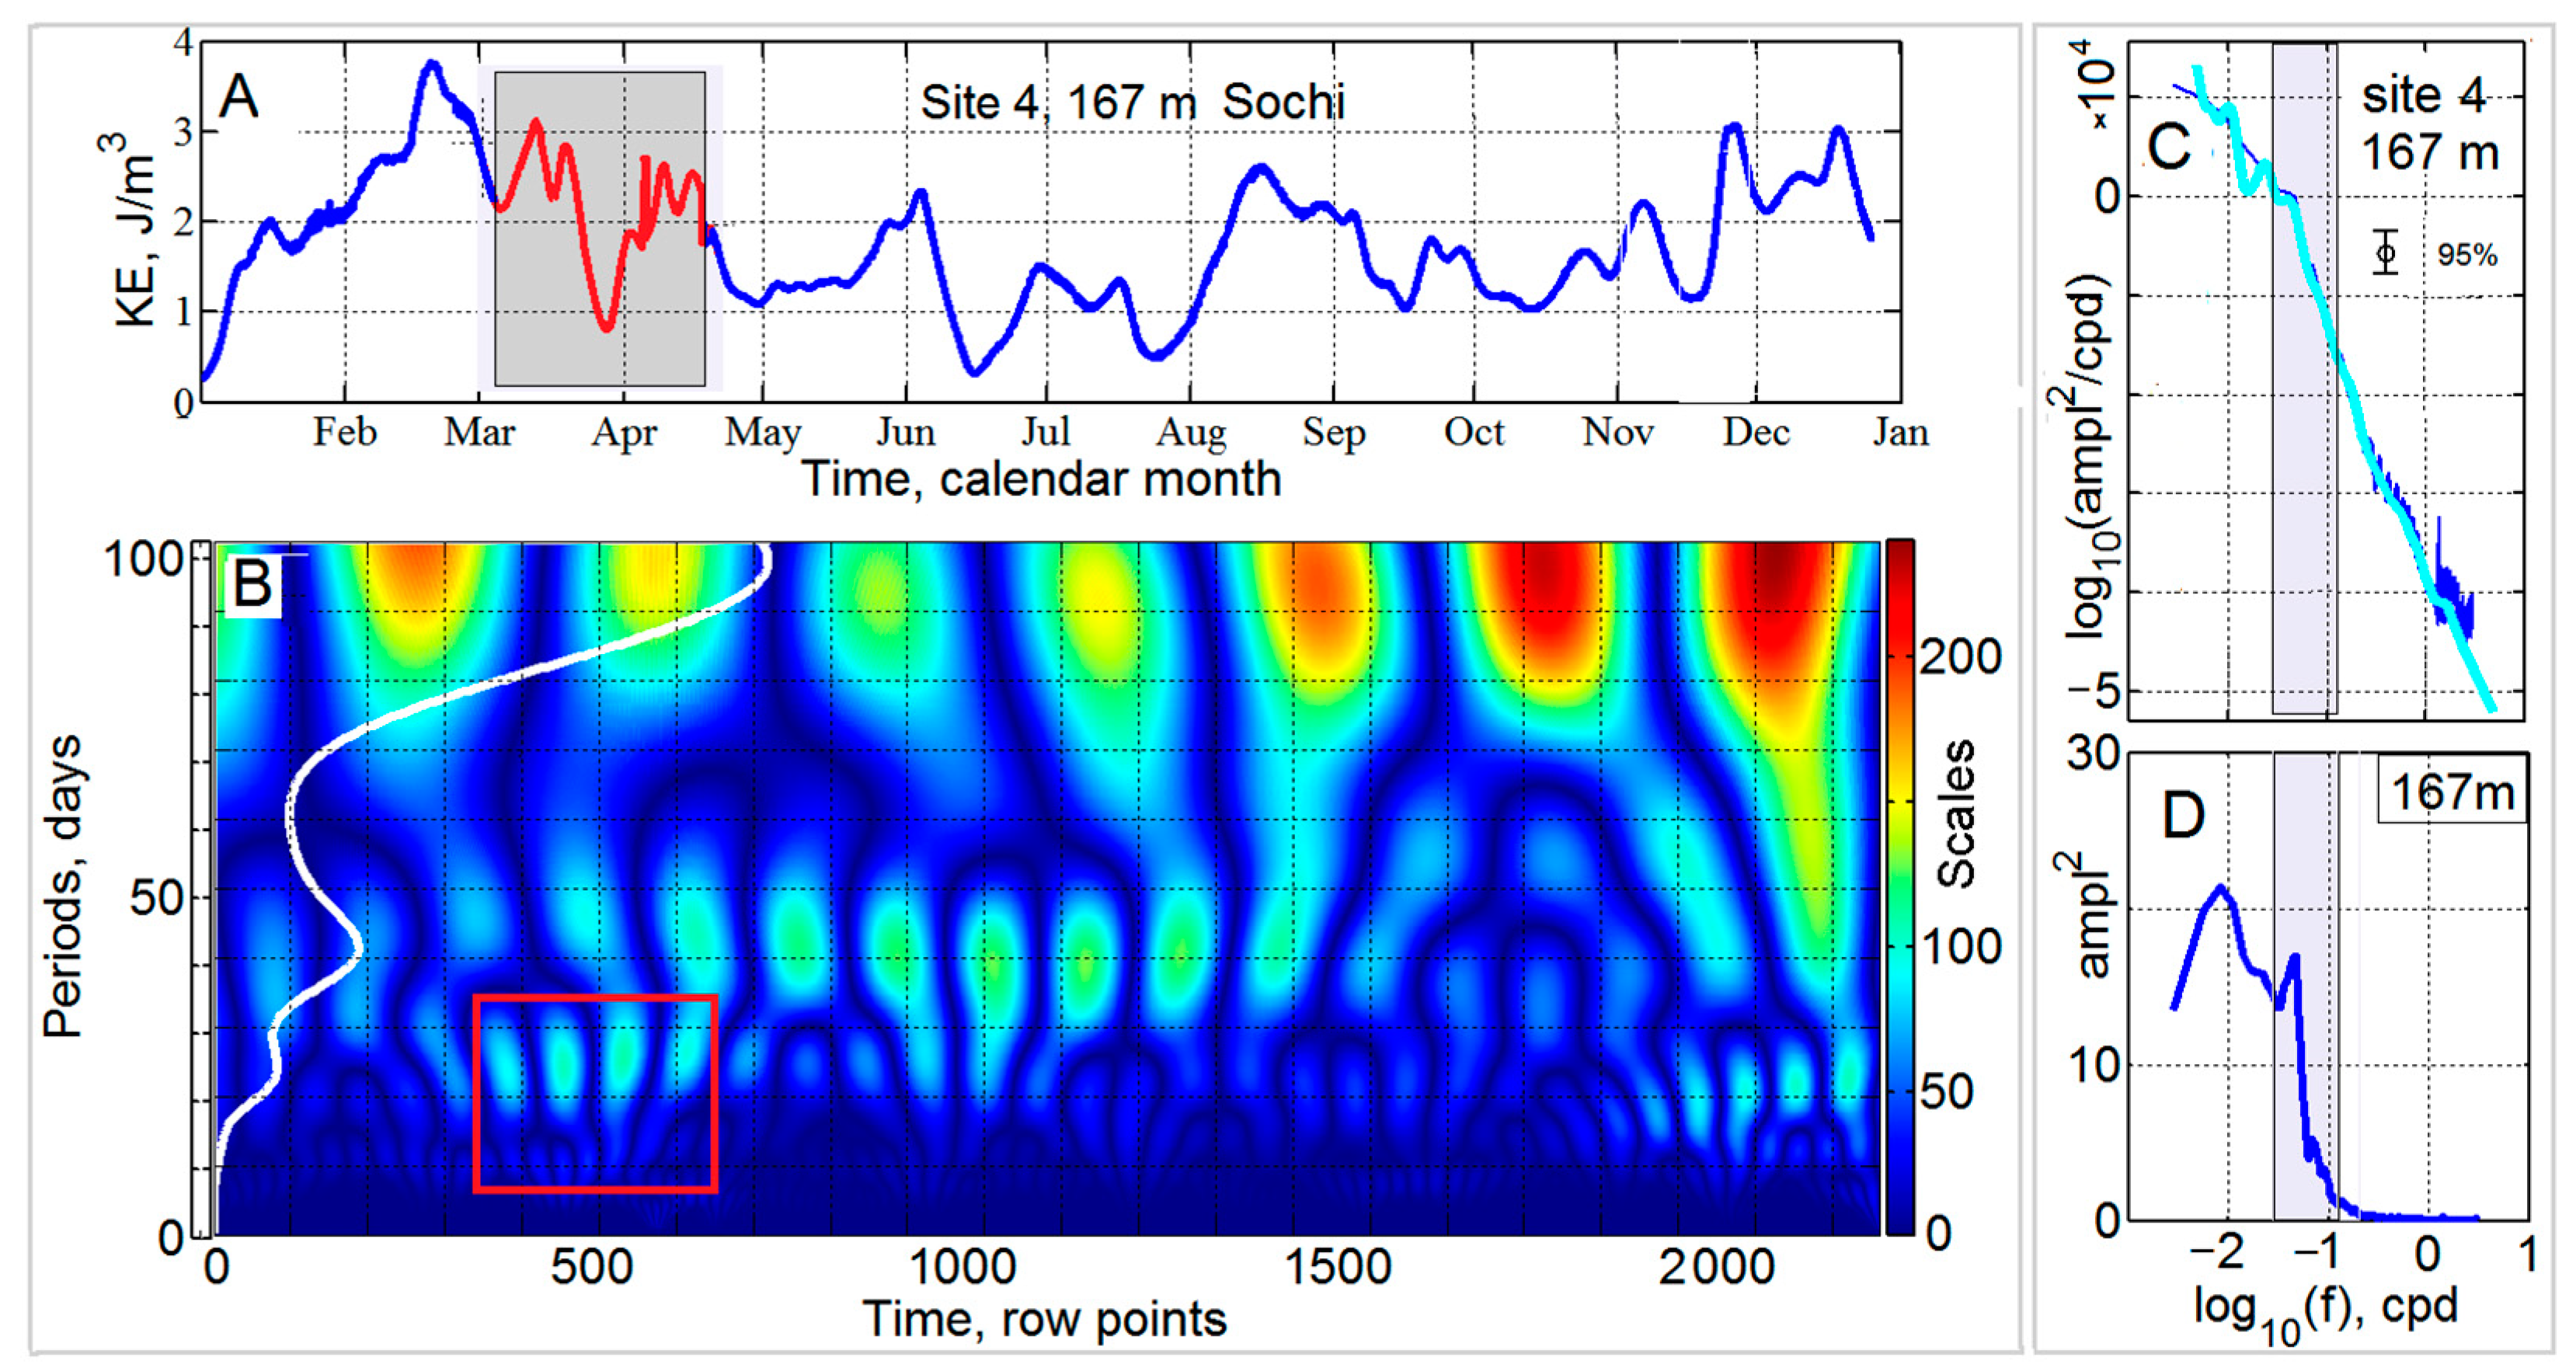
4.3. Spectral Analysis of Eddy Chains

The Fourier Transform (FT) and Wavelet (WT) methods allow for understanding the spatial and temporal variability of ECs and examining their internal structure. Note that, unlike the FT, the WT technique is based on the concept of time-frequency localization, and, thus, enables us to localize the signals not only in frequency but in the time domains, preserving the temporal characteristics. To examine the eddy kinetic energy, we examined the series of current velocity retrieved from the Die2BS model at the stations abeam of Tuapse (Section S1 in Figure 3) and northwest of Sochi (Section S2 in Figure 3). Velocity data for statistical analysis were obtained from the model output for the model year 39 with temporal discreteness of 4 h (a total of 2160 row data). To avoid dependence of characteristics on direction, we calculate invariant kinetic energy (KE) instead of two horizontal velocity components. Figure 7 and Figure 8 demonstrate the ability of the FT and WT in allocating frequencies of velocity fluctuations associated with the occurrence and progression of mesoscale eddies in the sea. Both techniques are complementary, enabling the extraction of appropriate frequencies. Despite the FT is an efficient method in revealing determined harmonics in the energy spectrum, its temporal uncertainty, inherent to this method, does not allow clarifying when a certain event happened. Figure 7 shows a wavelet diagram of the kinetic energy density (KE) and the wavelet density (WD) computed for sites one and three at the depths of 2 m. In WD diagrams (panels B and F), the left axis shows pseudo-periods of the wavelet transform, making it possible to compare the integral wavelet density (see white curves) with the Fourier spectra.
We examined KE at section S1 at the depths of 2 m at onshore Site one (panel A) and offshore Site three (panel E) (Figure 7). This allows comparing the change of energy characteristics with distance. The plots of KE in the upper panels indicate that temporal variations of kinetic energy reveal periodic bursts, the latter being reflected in the clear seasonal trend for the onshore site near Tuapse. The burst is clearly seen from March to April. Offshore (Site three), the energy peak is narrower and shifted to April. Figure 7 shows that at the onshore Site one by Tuapse, the time-integrated WD spectra (white curve) reached local maximums at the periods of 10 and 30 days, while at the offshore Site three, they reached local maximums at the periods of 20 and 40 days. They seem to be associated with mesoscale eddy activity that is well pronounced in spring, exactly when the formation of ECs occurs. Interestingly, near the coast (panel B), the WD diagram shows long-periodic oscillations (>100 days) that are suppressed at the offshore Site three (panel F). Figure 7 show the kinetic energy density (panels C and D) and variance-preserving spectra (panels D and H), the latter being used to improve emphasizing spectral components. Variance-preserving spectra reveal spectral peaks that are not clearly detected by standard FT method. Both panels D and H distinctively show peaks at ~0.1 cpd.
Figure 8 (panels A and B) presents temporal variations of KE and WD in the range of 1–100 days during model year 39 over the shelf slope at Section S2 at Site four, at the depth of 167 m. The shaded area of the KE (panel A) denotes high frequency oscillation that echoing in WD light spots delineated by the red square (panel B). The period is close to 20 days, which corresponds to previous estimates derived from theory and experiments [33,34,35,36,37,38]. The right flank of Figure 8 presents spectra of kinetic energy density in log-log coordinates (panel C) and variance-preserving spectra (panel D). Both spectra indicate frequency ranged of 0.05–0.1 cpd marked by the shade. Our numerical experiments show that mesoscale eddies periodically (every 10–30 days) appear in the area of the Caucasus coast and then move along the coast, which is clearly seen in KE oscillations and WD diagrams. ECs are manifested by a series of color spots extended vertically, indicating multi-periodic components in the variability of WD with periods of 10–30 h (panels B and F in Figure 7, panel B in Figure 8). The cluster of spots located in the range from 360 to 660 row points corresponds to the March-April period. During this period, both WD and KE exhibit a synchronous increase in kinetic energy throughout the water column, likely associated with periodic passing of mesoscale eddies though the Sections S1 and S2.

5. Discussion

In this paper, we focused on the NCC current system, and a particular goal of this section is to show important details of the interaction of river plumes with EC structure during its evolution along the Caucasian shore. Recent in situ studies [47] and modeling [39] have revealed that coastal eddies can entrain coastal water masses, which are manifested by high turbidity. Spreading and mixing of river plumes could be considerably changed as a result of their interaction with EC structures passing through the plumes, which has not been well studied yet. To analyze this interaction, we used the Lagrangian method [39] and daily tracing of water properties and particle distribution along the shore. To track river plume waters captured by eddies and assess the degree of their leakiness, we performed an experiment with Lagrangian particles initialized in river estuaries. River plumes adjacent to the corresponding river estuaries were modeled by continuous releases of particles with specific discharge rates. We installed discharges of five major Caucasian rivers: the Kodor, Bzyb, Mzymta, Ashe, and Tuapse rivers (numbered from one to five in Figure 9). Discharge rates by each river, as in [39], were chosen to release 200 particles hourly. In total, 480,000 particles were released during the experiment from Day 60 till Day 160. It allowed us to cover all phases of EC evolving and decaying, including each eddy occurrence, progression, and merge.
Figure 9 shows the sequential plots of the phases of anticyclonic eddy and the integral particle concentrations (log10(C)), as well as surface streamlines during the experiment. The integral concentration presented in Figure 9 and marked by the frames ‘Day 70’–‘Day 120’ was defined as the number of particles, N, within the layer 0–50 m, i.e., C(x, y, z, t) = N(x, y, z, t)/VO(x, y, z, t), where VO is the unit cell (Δx × Δy × Δz) determined by the horizontal, x, y, and vertical, z, steps of the model grid cells. Visual analysis of the particle distributions revealed that at the beginning of the particle experiment, all released particles followed the RC, and as shown on panel ‘Day 70,’ were stretched along the Caucasian coast. All particles were pressed against the shore in a narrow band directed along the shore, except those involved in small-scale anticyclonic eddies A1, A2, and A3. Within this band, all river plumes were clearly pronounced by red strips directed southward from river mouths. This pattern remained stable until the new eddy emerging event formed by a cyclonic meander of RC that closely approached the coastal zone between the Pitsunda Cape and Tuapse (see the red arrow in panel ‘Day 70’). Once the generation of new eddies occurred, their growing and propagation started forming the EC structure containing from eddies A1, A2, A3, and A4, along with that resulting from the merging of eddies A2 and A3 (Figure 5, ‘Day 75’). The latter led to the spread of particles by A2 and A3. Note that they merged with some gap between them (panel ‘Day 75’ in Figure 5).
As EC was formed and propagated to the northwest (Figure 9, ‘Day 80’), the width of the zone occupied by particles widened, particularly between the Mzymta and Tuapse river mouths (Figure 9, ‘Day 80’), where the dipole structure consisting of the merged anticyclonic eddy A2,3 and cyclonic C1 was established (Figure 5, ‘Day 80’). By Day 80, anticyclonic eddy A1 had already dissipated. Note the effect of widening of the streamlines under the impact of the series of eddies traveling along the coast and perturbing the coastal zone. To the south, the narrow band of anticyclonic eddies, including A4 and those stretched along the shore down to Pitsunda Cape, created a narrow zone occupied by particles. Largely owing to the bifurcation of currents offshore the Kodor river mouth, some portions of particles were involved in BAE and infiltrated to southward.
On Day 85, a further accumulation of particles continued with further expansion of the zone occupied by particles. Particles were still strictly bound by RC dynamics and the structure of streamlines. However, by Day 90, a leakage of particles occurred exactly after merging of eddies A4 and A5. The particles longitudinally crossed the streamlines at ~38.5°E and approached the double-core cyclonic eddy centered at 42.5°N, 38.7°E. However, by Day 95, the dynamic situation sharply changed, so the particle zone shrunk back and was pressed to the shore. On Day 105, the gap between southeastern part and northwestern parts of the particle zone was extending, so that the northwestern part moved further northward and steadily disappeared (see Days 105, 110, and 120). On Day 110, EC transformed as a result of merging of complex eddy A4,5 and eddy A6. It caused swift dispersion of particles and their concentration in the head of the particle zone progressing northwestward. A small number of particles also propagated southwestward crossing the streamlines. Mostly, by Day 120, all particles were concentrated within a narrow band stretched along the shore. At the head of this band, the particles were retained and accumulated by the merged eddy A4, 5, and 6.
We compared the present numerical experiment conducted with EC structure with a similar one conducted with an isolated NAE described in our companion paper [39]. Unlike experiment performed in [39], the interaction of river plumes with EC resulted in considerably narrower spreading of fluvial water. This feature is associated with lower coastal current velocity due to the meandering and waning of RC during spring-summer period compared to the enhanced RC during autumn-winter period. Second, this feature is associated with much weaker and smaller (in energy and size) eddies combining EC compared to isolated NAE. The comparison of Figure 5 and Figure 9 indicates a well-pronounced difference between a compact eddy shape in EC and particle concentration distribution in the core flanked by wide filaments. Both satellite observations (Figure 6) and numerical simulations (Figure 5) revealed that the process of eddy merging occurred when a newborn eddy moved faster than the eddy at the mature stage.
Summarizing the results of our numerical experiment, we have established that the spring-summer season is more favorable for occurrence of ECs in the NCC. However, the effectiveness of ECs in water exchange processes between the coastal zone and open sea is less compared to the autumn-winter season when the generation of isolated eddies prevails [39]. During the warm period, the Black Sea circulation weakens and TGEs born in the area of the Pitsunda Cape are not strong enough to involve large water masses in the exchange process. This difference keeps the fluvial water mostly in the coastal zone during spring-summer period compared to the autumn-winter period. More details are presented in the video file provided in the Supplementary Materials Video S1, which describes the evolution of relative vorticity normalized by the Coriolis parameter and illustrates the processes of generating, growing, maturing, and decaying of TGEs within EC system and its progressing along the Caucasian coast.

6. Conclusions

This study is focused on mesoscale eddy activity in the northeastern part of the Black Sea, particularly on EC structures. These structures consist of eddies periodically formed in particular areas offshore the Caucasian coast, which further progress along the coast. We considered the coast between the Iskuria and Pitsunda capes, which is the most favorable location at the Caucasian coast where TGEs frequently occur. As found by numerical modeling in our companion paper [39], once RC closely approaches the coast and impinges on abrupt submarine ridges, it could lose stability and trigger the formation of TGEs. The periodicity of such events was found to be from 2.3 to 23.3 days, depending on the strength of RC. To estimate it, we used results obtained by Magaldi et al. [38], who investigated the roles of stratification and topographic slope in the generation of coherent structures in the lee of capes.
To study mesoscale activity, we used the 2-nautical mile horizontal resolution Die2BS model [26,39] adopted for the Black Sea [55]. Since the first internal baroclinic deformation radius in the study area (5–20 km) [58] is significantly less than the model square cell, it allowed us to adequately resolve mesoscale structures such as eddies, meanders, dipoles, and filaments [26]. Events of eddy generation and formation of ECs are well pronounced in fluctuations of velocity and thus in kinetic energy. We analyzed kinetic energy and vertical relative vorticity as highly informative parameters for ECs. To identify the EC effect on the fluctuation of KE and their frequency ranges, we used the FT and WT techniques that complement each other. For spectral analyses, we made eight time series of outputs of modeled current velocity at two sections: S1 (off Tuapse) and S2 (off Sochi) at four sites at distances of 4 and 60 km from the shore at the depths of 2 m and 167 m (Figure 3).
The FT analysis revealed that the spectral characteristics depend on the depths and distance from the shore and identified the presence of high-frequency fluctuations in KE within the 0.05 to 0.1 cpd. The WT analysis revealed the temporal location and periodicity of intense KE fluctuations, as well as indicating that the variability of KE had periods ranged from 10 to 20 days (Figure 7 and Figure 8). Following this analysis, we determined the time period in order to clarify the sources of KE disturbances that occurred in spring. We reveal that they penetrate deep layers and therefore relate to coherent eddy structures in ECs. We examined time segments to clarify the nature of KE variability in order to reveal which time segments of the latter may belong to coherent eddy structures. A combination of the FT and WT methods along with numerical modeling considerably extends the scope of problems to be solved. These methods allow understanding general reasons for spatial and temporal variability of ECs and examining their internal structure and seasons, which led to such disturbances.
Our simulations revealed that two types of anticyclonic structures could appear at the Caucasus coast: (1) isolated eddies described in [39] and (2) ECs with merging eddies (Figure 5). The occurrence of these structures is seasonally dependent, i.e., the former occurs mostly during autumn-winter when RC waxes, while the latter appears mostly during spring-summer, when RC wanes and is meandering. Interestingly, eddy merging (that often occurred in the case of EC development) resulted in an increase in eddy sizes. During the merging event, the translation velocity of eddies increased from ~3 to ~5 km day−1. The angular velocity of the resulting eddy during the period of merging reached maximum values of ~7 × 10⁻⁶ rad s−1 while, after merging, the angular velocity decreased to ~5 × 10⁻⁶ rad s−1. Examination of satellite imagery illustrating interaction of EC structure with river plumes indicated main features of this process. Plumes are differently influenced by eddies at different stages of their evolution. Similarly to [39], we performed an Eulerian-Lagrangian experiment with EC interacting with Lagrangian particles simulating the process of the involvement of river plumes into EC as it traveled along the shore. Note that, unlike cyclonic eddies that spread materials captured at the coast to the open sea, anticyclonic eddies accumulated dissolved and suspended riverine matter, as shown in Figure 9. Successive phases of distribution of particles, which simulate river plumes, revealed important details of their displacement in the presence of ECs: (1) at the stage of development of EC, the anticyclonic eddies trap plume waters and keep them inside their cores, (2) the major leakage of plume waters occurred at mature stage and during merging events, and (3) as the eddy was decaying, the majority of plume waters left the eddy (Figure 9). This estimation showed that by the end of the experiment, only ~10% of particles left the coastal zone towards the open sea, which evidences low self-cleaning effect of EC in the coastal zone. Lateral transport in the coastal zone intensifies as several subsequent ECs pass over river plumes.
Applied in this work, the Eulerian-Lagrangian method combined with satellite observations is a very useful toolset for performing multidisciplinary studies in the Black Sea [44,48,56,57], as well as in other areas in the World Ocean where coastal mesoscale eddies interact with river plumes [67,68,69,70,71,72]. Future research will be focused on the study of 3D structures of mesoscale eddies and their effects on riverine matter transport in coastal zones and exchange processes between coastal and open sea areas.

Supplementary Materials

The following supporting information can be downloaded at: https://www.mdpi.com/article/10.3390/rs15061606/s1, Video S1. Behavior of an eddy chain along the Caucasian coast: developing and merging of eddies.

Author Contributions

Conceptualization, K.K.; methodology, K.K.; numerical modeling, K.K.; analysis of satellite data, A.O.; spectral analysis, V.M.; writing and revising, K.K., A.O. and V.M. All authors have read and agreed to the published version of the manuscript.

Funding

This study was supported by the Ministry of Science and Higher Education of Russia, agreement number 075-15-2021-941.

Data Availability Statement

DieCAST ocean circulation model code is available at http://efdl.as.ntu.edu.tw/research/diecast/index.html (accessed on 19 December 2022). Bottom topography data ETOPO2 is available at http://www.ngdc.noaa.gov/mgg/global/etopo2.html (accessed on 19 December 2022). The MODIS Terra/Aqua optical satellite imagery is available at https://lance3.modaps.eosdis.nasa.gov (accessed on 19 December 2022).

Acknowledgments

KK is personally thankful to M.A. Vaskovskaya for the endorsement of this work.

Conflicts of Interest

The authors declare no conflict of interest.

References

  1. Hayward, T.L.; Mantyla, A.W. Physical, chemical and biological structure of a coastal eddy near Cape Mendocino. J. Mar. Res. 1990, 48, 825–850. [Google Scholar] [CrossRef]
  2. Doglioli, A.M.; Griffa, A.; Magaldi, M.G. Numerical study of a coastal current on a steep slope in presence of a cape: The case of the Promontorio di Portofino. J. Geophys. Res. Oceans 2004, 109, C12033. [Google Scholar] [CrossRef] [Green Version]
  3. Korotenko, K.A. Effects of mesoscale eddies on behavior of an oil spill resulting from an accidental deepwater blowout in the Black Sea: An assessment of the environmental impacts. PeerJ 2018, 6, e5448. [Google Scholar] [CrossRef] [Green Version]
  4. Lobel, P.S.; Robinson, A.R. Transport and entrapment of fish larvae by ocean mesoscale eddies and currents in Hawaiian waters. Deep Sea Res. Part A 1986, 33, 483–500. [Google Scholar] [CrossRef]
  5. Murdoch, R.C. The effects of a headland eddy on surface macro-zooplankton assemblages north of Otago Peninsula, New Zealand. Estuar. Coast. Shelf Sci. 1989, 29, 361–383. [Google Scholar] [CrossRef]
  6. Chiswell, S.M.; Roemmich, D. The East Cape Current and two eddies: A mechanism for larval retention? N. Z. J. Mar. Freshwater Res. 1998, 32, 385–397. [Google Scholar] [CrossRef]
  7. Roughan, M.; Mace, A.J.; Largier, J.L.; Morgan, S.G.; Fisher, J.L.; Carter, M.L. Subsurface recirculation and larval retention in the lee of a small headland: A variation on the upwelling shadow theme. J. Geophys. Res. Oceans 2005, 110, C10027. [Google Scholar] [CrossRef] [Green Version]
  8. Sentchev, A.; Korotenko, K. Modelling distribution of flounder larvae in the eastern English Channel: Sensitivity to physical forcing and biological behavior. Mar. Ecol.-Prog. Ser. 2007, 347, 233–245. [Google Scholar] [CrossRef] [Green Version]
  9. John, M.A.; Pond, S. Tidal plume generation around a promontory: Effects on nutrient concentrations and primary productivity. Cont. Shelf Res. 1992, 12, 339–354. [Google Scholar] [CrossRef]
  10. Mityagina, M.I.; Lavrova, O.Y.; Karimova, S.S. Multi-sensor survey of seasonal variability in coastal eddy and internal wave signatures in the north-eastern Black Sea. Int. J. Remote Sens. 2010, 31, 4779–4790. [Google Scholar] [CrossRef]
  11. Karimova, S. Eddy statistics for the Black Sea by visible and infrared remote sensing. In Remote Sensing of the Changing Oceans; Danling, T., Ed.; Springer: Berlin, Germany, 2011; pp. 61–75. [Google Scholar]
  12. Karimova, S. Non-stationary eddies in the Black Sea as seen by satellite infrared and visible imagery. Int. J. Remote Sens. 2013, 34, 8503–8517. [Google Scholar] [CrossRef]
  13. Ovchinnikov, I.M.; Titov, V.B. Anticyclonic vorticity of currents in the offshore zone of the Black Sea. Dokl. Akad. Nauk. SSSR 1990, 314, 1236–1239. [Google Scholar]
  14. Oguz, T.; Malanotte-Rizzoli, P.; Aubrey, D. Wind and thermohaline circulation of the Black Sea driven by yearly mean climatological forcing. J. Geophys. Res. Oceans 1995, 100, 6845–6863. [Google Scholar] [CrossRef]
  15. Demyshev, S.G.; Dymova, O.A. Analyzing intra-annual variations in the energy characteristics of circulation in the Black Sea. Izv. Atmos. Ocean. Phys. 2016, 52, 386–393. [Google Scholar] [CrossRef]
  16. Sur, H.I.; Ozsoy, E.; Ilyin, Y.P.; Unluata, U. Coastal-deep ocean interactions in the Black Sea and their ecological/environmental impacts. J. Mar. Syst. 1996, 7, 293–320. [Google Scholar] [CrossRef]
  17. Oguz, T.; Besiktepe, S. Observations on the Rim Current structure, CIW formation and transport in the western Black Sea. Deep Sea Res. Part I Oceanogr. Res. Pap. 1999, 46, 1733–1753. [Google Scholar] [CrossRef]
  18. Stanev, E.V.; Rachev, N.H. Numerical study on the planetary Rossby modes in the Black Sea. J. Mar. Syst. 1999, 21, 283–306. [Google Scholar] [CrossRef]
  19. Staneva, J.V.; Dietrich, D.E.; Stanev, E.V.; Bowman, M.J. Rim current and coastal eddy mechanisms in an eddy-resolving Black Sea general circulation model. J. Mar. Syst. 2001, 31, 137–157. [Google Scholar] [CrossRef] [Green Version]
  20. Demyshev, S.G. A numerical model of online forecasting Black Sea currents. Izv. Atmos. Ocean. Phys. 2012, 48, 120–132. [Google Scholar] [CrossRef]
  21. Ginzburg, A.I.; Kostianoy, A.G.; Soloviev, D.M.; Stanichny, S.V. Remotely sensed coastal/deep-basin water exchange processes in the Black Sea surface layer. Elsevier Oceanogr. Ser. 2000, 63, 273–287. [Google Scholar]
  22. Zatsepin, A.G.; Ginzburg, A.I.; Kostianoy, A.G.; Kremenetskiy, V.V.; Krivosheya, V.G.; Stanichny, S.V.; Poulain, P.M. Observations of Black Sea mesoscale eddies and associated horizontal mixing. J. Geophys. Res. Oceans 2003, 108, 3246. [Google Scholar] [CrossRef]
  23. Korotaev, G.; Oguz, T.; Nikiforov, A.; Koblinsky, C. Seasonal, interannual, and mesoscale variability of the Black Sea upper layer circulation derived from altimeter data. J. Geophys. Res. Oceans 2003, 108, 3122. [Google Scholar] [CrossRef]
  24. Sur, H.I.; Ilyin, Y.P. Evolution of satellite derived mesoscale thermal patterns in the Black Sea. Prog. Oceanogr. 1997, 39, 109–151. [Google Scholar] [CrossRef]
  25. Oguz, T.; Deshpande, A.G.; Malanotte-Rizzoli, P. The role of mesoscale processes controlling biological variability in the Black Sea coastal waters: Inferences from SeaWIFS-derived surface chlorophyll field. Cont. Shelf Res. 2002, 22, 1477–1492. [Google Scholar] [CrossRef]
  26. Korotenko, K.A. Modeling processes of the protrusion of near-coastal anticyclonic eddies through the Rim Current in the Black Sea. Oceanology 2017, 57, 394–401. [Google Scholar] [CrossRef]
  27. Kubryakov, A.A.; Stanichny, S.V. Mesoscale eddies in the Black Sea from satellite altimetry data. Oceanology 2015, 55, 56–67. [Google Scholar] [CrossRef]
  28. Sadighrad, E.; Fach, B.A.; Arkin, S.S.; Salihoglu, B.; Husrevoglu, Y.S. Mesoscale eddies in the Black Sea: Characteristics and kinematic properties in a high-resolution ocean model. J. Mar. Syst. 2021, 223, 103613. [Google Scholar] [CrossRef]
  29. Pattiaratchi, C.B.; Hammond, T.M.; Collins, M.B. Mapping of tidal currents in the vicinity of an offshore sandbank, using remotely sensed imagery. Int. J. Remote Sens. 1986, 7, 1015–1029. [Google Scholar] [CrossRef]
  30. Farmer, D.; Pawlowicz, R.; Jiang, R. Tilting separation flows: A mechanism for intense vertical mixing in the coastal ocean. Dyn. Atmos. Oceans 2002, 36, 43–58. [Google Scholar] [CrossRef]
  31. McCabe, R.M.; MacCready, P.; Pawlak, G. Form drag due to flow separation at a headland. J. Phys. Oceanogr. 2006, 36, 2136–2152. [Google Scholar] [CrossRef]
  32. Cushman-Roisin, B. Introduction to Geophysical Fluid Dynamics; Prentice Hall: Hoboken, NJ, USA, 1994. [Google Scholar]
  33. Boyer, D.L.; Davies, P.A.; Holland, W.R.; Biolley, F.; Honji, H. Stratified rotating flow over and around isolated three-dimensional topography. Philos. Trans. R. Soc. A 1987, 322, 213–241. [Google Scholar]
  34. Davies, P.A.; Besley, P.; Boyer, D.L. An experimental study of flow past a triangular cape in a linearly stratified fluid. Dyn. Atmos. Oceans 1990, 14, 497–528. [Google Scholar] [CrossRef]
  35. Cenedese, C.L.; Whitehead, J.A. Eddy shedding from a boundary current around a cape over a sloping bottom. J. Phys. Oceanogr. 2000, 30, 1514–1531. [Google Scholar] [CrossRef]
  36. Shchepetkin, A.F.; McWilliams, J.C. The regional oceanic modeling system (ROMS): A split-explicit, free-surface, topography following-coordinate oceanic model. Ocean Model. 2005, 9, 347–404. [Google Scholar] [CrossRef]
  37. Wang, J.; Bethel, B.J.; Dong, C.; Li, C.; Cao, Y. Numerical Simulation and Observational Data Analysis of Mesoscale Eddy Effects on Surface Waves in the South China Sea. Remote Sens. 2022, 14, 1463. [Google Scholar] [CrossRef]
  38. Magaldi, M.G.; Ozgokmen, T.M.; Griffa, A.; Chassignet, E.P.; Iskandarani, M.; Peters, H. Turbulent flow regimes behind a coastal cape in a stratified and rotating environment. Ocean Model. 2008, 25, 65–82. [Google Scholar] [CrossRef]
  39. Korotenko, K.; Osadchiev, A.; Melnikov, V. Mesoscale Eddies in the Black Sea and Their Impact on River Plumes: Numerical Modeling and Satellite Observations. Remote Sens. 2022, 14, 4149. [Google Scholar] [CrossRef]
  40. Besiktepe, S.; Lozano, C.J.; Robinson, A.R. On the summer mesoscale variability of the Black Sea. J. Mar. Res. 2001, 59, 475–515. [Google Scholar] [CrossRef]
  41. Zatsepin, A.G.; Baranov, V.I.; Kondrashov, A.A.; Korzh, A.O.; Kremenetskiy, V.V.; Ostrovskii, A.G.; Soloviev, D.M. Submesoscale eddies at the Caucasus Black Sea shelf and the mechanisms of their generation. Oceanology 2011, 51, 554–567. [Google Scholar] [CrossRef]
  42. Korotkina, O.A.; Zavialov, P.O.; Osadchiev, A.A. Synoptic variability of currents in the coastal waters of Sochi. Oceanology 2014, 54, 545–556. [Google Scholar] [CrossRef]
  43. Zavialov, I.B.; Osadchiev, A.A.; Sedakov, R.O.; Barnier, B.; Molines, J.-M.; Belokopytov, V.N. Water exchange between the Sea of Azov and the Black Sea through the Kerch Strait. Ocean Sci. 2020, 16, 15–30. [Google Scholar] [CrossRef] [Green Version]
  44. Osadchiev, A.; Gordey, A.; Barymova, A.; Sedakov, R.; Rogozhin, V.; Zhiba, R.; Dbar, R. Lateral border of a small river plume: Salinity structure, instabilities and mass transport. Remote Sens. 2022, 14, 3818. [Google Scholar] [CrossRef]
  45. Sedakov, R.; Osadchiev, A.; Barnier, B.; Molines, J.-M.; Colombo, P. Large chocked lagoon as a barrier for river–sea flux of dissolved pollutants: Case study of the Azov Sea and the Black Sea. Mar. Pollut. Bull. 2023, 187, 114496. [Google Scholar] [CrossRef] [PubMed]
  46. Korshenko, E.; Panasenkova, I.; Osadchiev, A.; Belyakova, P.; Fomin, V. Synoptic and seasonal variability of small river plumes in the northeastern part of the Black Sea. Water 2023, 15, 721. [Google Scholar] [CrossRef]
  47. Osadchiev, A.; Barymova, A.; Sedakov, R.; Zhiba, R.; Dbar, R. Spatial structure, short-temporal variability, and dynamical features of small river plumes as observed by aerial drones: Case study of the Kodor and Bzyp river plumes. Remote Sens. 2020, 12, 3079. [Google Scholar] [CrossRef]
  48. Korshenko, E.A.; Zhurbas, V.M.; Osadchiev, A.A.; Belyakova, P.A. Fate of river-borne floating litter during the flooding event in the northeastern part of the Black Sea in October 2018. Mar. Pollut. Bull. 2020, 160, 111678. [Google Scholar] [CrossRef]
  49. Liu, F.; Liu, Y.; Tang, S.; Li, Q. Oceanic Kármán Vortex Streets in the Luzon Strait in the Lee of Didicas Island from Multiple Satellite Missions. Remote Sens. 2022, 14, 4136. [Google Scholar] [CrossRef]
  50. Bowman, M.J.; Dietrich, D.E.; Lin, C.A. Observations and Modeling of Mesoscale Ocean Circulation Near a Small Island. In Small Islands Marine Science and Sustainable Development; Maul, G.A., Ed.; American Geophysical Union: Berlin, Germany, 1996; pp. 18–37. [Google Scholar]
  51. Dong, C.; McWilliams, J.C.; Shchepetkin, A.F. Island Wakes in Deep Water. J. Phys. Oceanogr. 2007, 37, 962–981. [Google Scholar] [CrossRef]
  52. Chang, M.-H.; Jan, S.; Liu, C.-L.; Cheng, Y.-H.; Mensah, V. Observations of island wakes at high Rossby numbers: Evolution of submesoscale vortices and free shear layers. J. Phys. Oceanogr. 2019, 49, 2997–3016. [Google Scholar] [CrossRef]
  53. Kostianoy, A.G.; Ginzburg, A.I.; Sheremet, N.A.; Lavrova, O.Y.; Mityagina, M.I. Small-scale eddies in the Black Sea. Sovr. Probl. Dist. Zond. Zemli Kosm. 2021, 7, 248–259. [Google Scholar]
  54. Dietrich, D.E.; Lin, C.A.; Mestas-Nunez, A.; Ko, D.S. A high resolution numerical study of Gulf of Mexico fronts and eddies. Meteorol. Atmos. Phys. 1997, 64, 187–201. [Google Scholar] [CrossRef]
  55. Korotenko, K.A. Predicting the behavior of an oil spill in the Black Sea resulting from accidental offshore deepwater blowout. J. Sustain. Energy Eng. 2018, 6, 48–83. [Google Scholar] [CrossRef]
  56. Korotenko, K.A.; Bowman, M.J.; Dietrich, D.E. High-resolution numerical model for predicting the transport and dispersal of oil spilled in the Black Sea. Terr. Atmos. Ocean. Sci. 2010, 21, 123–136. [Google Scholar] [CrossRef] [Green Version]
  57. Korotenko, K.A. Modeling mesoscale circulation of the Black Sea. Oceanology 2015, 55, 820–826. [Google Scholar] [CrossRef]
  58. Jaoshvili, S. The Rivers of the Black Sea; Khomeriki, I., Gigineishvili, G., Kordzadze, A., Eds.; Technical Report No. 71; European Environmental Agency: Copenhagen, Denmark, 2002. [Google Scholar]
  59. Gibson, M.M.; Launder, B.E. Ground effects on pressure fluctuations in the atmospheric boundary layer. J. Fluid Mech. 1978, 86, 491–511. [Google Scholar] [CrossRef]
  60. Korotenko, K.A. Modeling turbulent transport of matter in the ocean surface layer. Oceanology 1992, 32, 5–13. [Google Scholar]
  61. Tseng, Y.-H.; Dietrich, D.E.; Ferziger, J.H. Regional circulation of the Monterey Bay region: Hydrostatic versus nonhydrostatic modeling. J. Geophys. Res. Oceans 2005, 110, C09015. [Google Scholar] [CrossRef] [Green Version]
  62. Ozsoy, E.; Unluata, U. Oceanography of the Black Sea: A review of some recent results. Earth Sci. Rev. 1997, 42, 231–272. [Google Scholar] [CrossRef]
  63. Zatsepin, A.; Kubryakov, A.; Aleskerova, A.; Elkin, D.; Kukleva, O. Physical mechanisms of submesoscale eddies generation: Evidences from laboratory modeling and satellite data in the Black Sea. Ocean Dyn. 2019, 69, 253–266. [Google Scholar] [CrossRef]
  64. Kubryakov, A.A.; Mizyuk, A.I.; Puzina, O.S.; Senderov, M.V. Three-dimensional identification of the Black Sea mesoscale eddies based on the numerical model NEMO calculations. Prog. Oceanogr. 2018, 34, 20–28. [Google Scholar]
  65. Oguz, T.; La Violette, P.E.; Unluata, U. The upper layer circulation of the Black Sea: Its variability as inferred from hydrographic and satellite observations. J. Geophys. Res. Oceans 1992, 97, 12569–12584. [Google Scholar] [CrossRef]
  66. Chenillat, F.; Franks, P.J.; Capet, X.; Riviere, P.; Grima, N.; Blanke, B.; Combes, V. Eddy properties in the Southern California current system. Ocean Dyn. 2018, 68, 761–777. [Google Scholar] [CrossRef] [Green Version]
  67. Lihan, T.; Saitoh, S.-I.; Iida, T.; Hirawake, T.; Iida, K. Satellite-measured temporal and spatial variability of the Tokachi River plume. Estuar. Coast. Shelf Sci. 2008, 78, 237–249. [Google Scholar] [CrossRef]
  68. Korotenko, K.A.; Osadchiev, A.A.; Zavialov, P.O.; Kao, R.-C.; Ding, C.-F. Effects of bottom topography on dynamics of river discharges in tidal regions: Case study of twin plumes in Taiwan Strait. Ocean Sci. 2014, 10, 865–879. [Google Scholar] [CrossRef] [Green Version]
  69. Osadchiev, A.A.; Korotenko, K.A.; Zavialov, P.O.; Chiang, W.-S.; Liu, C.-C. Transport and bottom accumulation of fine river sediments under typhoon conditions and associated submarine landslides: Case study of the Peinan River, Taiwan. Nat. Hazards Earth Syst. Sci. 2016, 16, 41–54. [Google Scholar] [CrossRef] [Green Version]
  70. He, X.; Xu, D.; Bai, Y.; Pan, D.; Chen, C.-T.A.; Chen, X.; Gong, F. Eddy-entrained Pearl River plume into the oligotrophic basin 1180 of the South China Sea. Cont. Shelf Res. 2016, 124, 117–124. [Google Scholar] [CrossRef]
  71. Osadchiev, A.A. Spreading of the Amur river plume in the Amur Liman, the Sakhalin Gulf, and the Strait of Tartary. Oceanology 2017, 57, 376–382. [Google Scholar] [CrossRef]
  72. Osadchiev, A.A.; Medvedev, I.P.; Shchuka, S.A.; Kulikov, M.E.; Spivak, E.A.; Pisareva, M.A.; Semiletov, I.P. Influence of estuarine tidal mixing on structure and spatial scales of large river plumes. Ocean Sci. 2020, 16, 781–798. [Google Scholar] [CrossRef]
Figure 1. MODIS Aqua satellite images of (A) sea surface temperature, (B) water-leaving radiance, (C) chlorophyll−a, and (D) visible RGB composite on 4 June 2017. The red box in the panel (C) delineates the Caucasian coast with the evidence of mesoscale and sub-mesoscale eddy activity. The panel (D) shows magnified images of mesoscale anticyclonic eddy and sub-mesoscale eddy structure resembling a von Karman vortex street (KVS). Schematically, the KVS structure is depicted in the insert (D1) and its characteristic parameters   U e , a , and   b are explained in the text. AC denotes anticyclonic eddy.
Remotesensing 15 01606 g001
Figure 2. MODIS Aqua satellite images of chlorophyll−a exhibiting ECs along the Caucasian coast during different days in March and April from 2014 to 2016 (AF). Dates are shown at the top of each snapshot, and the general cyclonic direction of RC is depicted by the red curve.
Remotesensing 15 01606 g002
Figure 3. Bathymetry of the study area in the northeastern part of the Black Sea, delineated by the white rectangle C in the inset. Yellow lines S1 and S2 denote sections offshore Tuapse and Sochi, respectively. The numbers of 1–4 denote sites where control current velocities at the shelf and continental slopes were examined. The sites marked in red are used for examinations described in Section 4.3. The red line D denotes the characteristic horizontal dimension of the submarine ridge for estimation of the eddy shedding frequency.
Remotesensing 15 01606 g003
Figure 4. Snapshots of modeled ECs evolving in the sea surface layer and their effect on (A) streamline structures and sea surface height (SSH) (results on Day 90 model year 39) and (B) satellite-derived total suspended matter data provided by MERIS-Envisat on 1 July 2011. Panel A shows subsequently merged eddies A2,3, A4,5 and isolated eddy A6 constituting EC stretched along the Caucasian coast. Magenta lines show isobars of 100, 500, and 1000 m. Panel (B) demonstrates visualization of EC due to the capturing of turbid river plume water. In the inset, the yellow ring shows the conventional position of BAE during spring-summer period. The solid lines show the conventional positions of RC at the eastern part of the Black Sea in summer (yellow) and winter (green).
Remotesensing 15 01606 g004
Figure 5. A sequence of normalized vertical vorticity ζ/ f 0 at the depth of 50 m during transition of circulation from winter to summer of simulated year 39. Julian days are shown at the top. Magenta lines show isobars 500, 1000, and 1400 m. A1–A7 and F denote the sequence of anticyclonic eddies in EC and cyclonic (upwelling) filament, respectively. A2, 3 denote eddy resulting from merging A2 and A3 similar to A4,5 and A4,5,6. Red and magenta stars indicate two sites of generation of TGE. The insets at Day 70 and Day 105 show the positions of RC and BAE. The inset at Day 95 shows a fragment of MODIS satellite chlorophyll-a distribution along the shore at the study area on 10 March 2016.
Remotesensing 15 01606 g005
Figure 6. MODIS Aqua optical satellite images of the study area taken from May to July 2017, representing the development of EC structure along the Caucasian coast. The red arrow in the panel dated 12 May 2017 indicates the eddy generation cite near the Pitsunda Cape. Dashed colored ellipses are used to denote different eddies and illustrate their advection and merging.
Remotesensing 15 01606 g006
Figure 7. Temporal variations of KE (A,E) and corresponding WD (B,F) for 1–200 days during the model year 39 over the shelf slope at section S1 (Tuapse) at Site one (A,B) and Site three (E,F). The white curves show time-integrated WD spectra. At the right side of each wavelet diagram, the color scale indicates the intensity of the square of the KE. Time axis of WD is represented in row points numbers of time series with sampling interval of 4 h, the same units are for “Scales a”—wavelet shifts. KE is presented in nominal calendar units time axis for convenience, and the right panels show spectra of KE in log-log coordinates (C,G) and variance-preserving spectra (D,H). Thick cyan curves denote time-integrated WD spectra; the blue and red curves show KE spectra of the total and mesoscale components of the field velocity, respectively. The amplitudes “ampl” are in units of J/m3 (×10).
Remotesensing 15 01606 g007
Figure 8. Temporal variations of KE (A), WD (B) for 1–100 days during the model year 39, Fourier spectral density (C) and variance-preserving spectrum (D) at Section S2 (Sochi), at Site four, depth of 167 m. The white curve shows the time-integrated WD spectra. At the right side of wavelet diagram, the color scale indicates the intensity of the square of KE. The red square (panel B) delineates 20–30 days periodicity in kinetic energy bursts associated with eddy appearances.
Remotesensing 15 01606 g008
Figure 9. A sequence of streamlines and distributions of the surface particle concentration (log10(C)) illustrating the effect of EC developing and traveling along the Caucasian coast on the particle transport simulating river plumes. The Kodor, Bzyb, Mzymta, Ashe, and Tuapse river mouths are marked by numbers 1, 2, 3, 4, and 5, respectively. Magenta lines show isobaths of 500, 1000, and 1400 m.
Remotesensing 15 01606 g009
Disclaimer/Publisher’s Note: The statements, opinions and data contained in all publications are solely those of the individual author(s) and contributor(s) and not of MDPI and/or the editor(s). MDPI and/or the editor(s) disclaim responsibility for any injury to people or property resulting from any ideas, methods, instructions or products referred to in the content.

