Article

Spatial Correlations of Land Use Carbon Emissions in Shandong Peninsula Urban Agglomeration: A Perspective from City Level Using Remote Sensing Data

1
School of Geography and Environment, Liaocheng University, Liaocheng 252059, China
2
Institute of Huanghe Studies, Liaocheng University, Liaocheng 252059, China
*
Author to whom correspondence should be addressed.
Remote Sens. 2023, 15(6), 1488; https://doi.org/10.3390/rs15061488
Submission received: 4 January 2023 / Revised: 16 February 2023 / Accepted: 3 March 2023 / Published: 7 March 2023

Abstract

:
The spatial and temporal characteristics of land use carbon emissions are relevant to the sustainable use of land resources. Although spatial and temporal studies have been conducted on land use carbon emissions, the spatial correlation of land use carbon emissions at the city level still requires further research. Here, we estimated the distribution of carbon emissions at the city level in Shandong Peninsula urban agglomeration in spatial and temporal terms based on land use remote sensing data and fossil energy consumption data during 2000–2019. The results showed that the land use change in the 16 cities in the study area was the conversion of cropland to construction land. Carbon emissions from land use had an upward trend for all 16 cities overall during the period of 2000–2019, but the incremental carbon emissions trended downward after 2010. Among them, Jinan and Qingdao had higher carbon emissions than other cities. In addition, we also found that land use carbon emissions at the city level were characterized by stochasticity, while per capita carbon emissions displayed geospatial aggregation. Among them, Yantai displayed a spatial pattern of high–high clustering of carbon emissions, while Jining presented a spatial pattern of low–low clustering in terms of land-average carbon emissions and carbon emissions per capita during 2000–2019. The results of the study are important for guiding the achievement of urban carbon emission reduction and carbon neutrality targets at the city level.

1. Introduction

Land use change caused by urbanization leads to rapidly increasing carbon emissions with climate change, which has attracted widespread attention [1,2,3]. The process of urbanization has increased in construction land area, which in turn causes changes in the spatial and temporal characteristics of various land use types [4]. In addition, previous studies have shown that cities account for approximately 70% of global carbon emissions from energy consumption [5,6]. In addition, land use is the second largest source of global carbon emissions after fossil energy [7]. Therefore, it is important to study the carbon emissions from land use caused by urbanization.
At present, numerous studies have been carried out on carbon emissions caused by urbanization from different perspectives [3,8]. For instance, some studies have been conducted on the interrelationship between urbanization and carbon emissions [9,10]. In addition, the implications of urbanization on carbon emissions have been widely studied [8,11]. Recently, many scholars have investigated the impact of urban expansion on land surface temperature and carbon emissions [1,12]. Those above-mentioned studies have enriched the research content and methods of urbanization on carbon emissions. Current research on urbanization and carbon emissions is mainly at the global [10,11], national [8,13], provincial [14,15], and basin scales [7,16]. However, there are regional differences in carbon emissions between cities [17]. Thus, there is a need to conduct land use carbon emission studies at the city level.
Carbon emissions in different cities are mainly influenced by land type, as land use carbon emissions are the second largest source of carbon emissions. Current research on land use carbon emissions mainly focused on the carbon emissions of different land use types [18], or even specific land use types [19]. Some scholars have also conducted research on the impact of vegetation on soil carbon [20,21]. With the development of the Google Earth Engine (GEE) cloud platform, it has been widely used in the land use change analysis [22,23], including land use carbon emission studies [16,24,25]. However, carbon emissions in different cities are influenced by population, GDP per capita, urbanization rate, energy intensity and the share of secondary industries, in addition to land type. To better characterize carbon emissions in different cities, it is necessary to carry out research from the perspective of land-average carbon emissions and carbon emissions per capita at the city level.
Previous studies have demonstrated that Asia, including eastern China, is expected to bear the most of urban expansion in the world between 2015 and 2100 [26,27]. Shandong Peninsula urban agglomeration, the only one of the seven major urban agglomerations along the Yellow River in a mature stage, has an urbanization rate of 61.8% in 2020. Moreover, according to Carbon Emission Accounts and Datasets, the total carbon emissions of Shandong Peninsula urban agglomeration are in the top five in China. Numerous studies have focused on carbon emissions in Shandong province, including an analysis of the spatial and temporal changes [16,28], peak projections [29,30], and emission reduction recommendations [31,32]. These studies provided the basis for the study of Shandong Peninsula urban agglomeration. However, there are significant differences in the conditions of population, economic status, and natural resources within Shandong Peninsula urban agglomeration [15]. As a typical region with high carbon emissions, it is important to conduct research on land use carbon emissions in Shandong Peninsula urban agglomeration at the city level.
Global spatial autocorrelation (Moran’s I index) is the most widely used method for studying the spatial autocorrelation of regions [33,34]. Whether the data are spatially correlated or heterogeneous, the Moran’s I index emphasizes measuring the spatial associations of study objects [34,35]. It was widely utilized in the analysis of urban traffic conditions [36], the detection of pollution hotspots [37], and the monitoring of natural disasters [35]. Recently, Moran’s I index has also been used to reveal the overall characterization of carbon emissions spatial correlation [34]. Thus, we will employ the global Moran’s I index to investigate the general characteristics of Shandong Peninsula urban agglomeration. Moreover, local spatial autocorrelation (LISA) is widely used to investigate the characteristics of localized spatial clustering [38,39]. In this study, we will use LISA to identify the localized spatial characteristics of the spatial aggregation of land use carbon emissions at the city level.
The specific objective of this study was to reveal the spatial correlations of land use carbon emissions in Shandong Peninsula urban agglomeration at the city level. Spatial and temporal land use change characteristics were calculated using ArcGIS based on the land use data of 2000, 2010, and 2019. We further analyzed the carbon emissions from different land use types using the overall carbon emissions, land-average carbon emissions, and carbon emissions per capita at the city level. Finally, Moran’s I index and LISA were applied to study the spatial aggregation distribution characteristics of land use carbon emissions at the city level. The results of this study will contribute to the theoretical basis for the sustainable use of land resources and the development of carbon reduction policies at the city level.

2. Materials and Methods

2.1. Study Area Description

Shandong Peninsula urban agglomeration (114°47′~122°42′E, 34°22′~38°24′N) is situated on the downstream of the Yellow River (Figure 1a). It is 437.28 km long from north to south and 721.03 km wide from east to west. By the end of 2020, the total area was 1.57 × 10⁵ km2. According to the 7th National Census, the population of the Shandong Peninsula urban agglomeration in 2020 was 101.53 million, and the urbanization rate of Shandong Peninsula urban agglomeration was 63.05%. By the end of 2019, the study area had a GDP of CNY 7106.75 billion, ranking 3rd in China. The industrial structure of the study area is dominated by secondary and tertiary industries, with the three major industries accounting for 7.20%, 39.84%, and 52.96%, respectively. Based on the Shandong Peninsula urban agglomeration Development Plan (2016–2030), Shandong Peninsula urban agglomeration includes all the 16 cities in Shandong Province (Figure 1b). The main land use types were cropland, woodland, grassland, wetland, water, construction land, and unused land (Figure 1c). Among them, the study area consisted of 71.93% of cropland and 18.20% of construction land, respectively.

2.2. Data Sources and Preprocessing

The land use data were derived from the Global Land Cover Data Product Service website of the National Center for Basic Geographic Information (DOI:10.11769) (http://www.globallandcover.com/ accessed on 17 May 2022) at a spatial resolution of 30 m × 30 m. According to the situation of the study area combined with the Classification of Land Use Status, we reclassified the land use types into cropland, woodland, grassland, water, wetland, construction land, and unused land. Energy data and socioeconomic data, including the urbanization rate and GDP, were mainly obtained from the China Energy Statistical Yearbook (2001–2020) and the corresponding city statistical yearbooks. Administrative area data were provided from the Resource and Environmental Science and Data Center (https://www.resdc.cn/ accessed on 19 May 2022). The land use data were reprojected into an Albers equal area conical projection that was based on the WGS-84 datum using ArcGIS 10.8 software. Then, pre-processed land use data were masked using the administrative boundaries of Shandong Peninsula urban agglomeration to obtain the land use data for the study.

2.3. Research Methodology

2.3.1. Carbon Emissions Calculation Method

Previous research has showed that carbon emissions derived from land use can be separated into two types: direct carbon emissions or indirect carbon emissions [25,40]. Direct carbon emissions include carbon emissions produced by cropland, woodland, grassland, wetland, and other non-construction land, while indirect carbon emissions are generated by human activity on construction land.
  • Direct Carbon Emissions
The calculation of direct carbon emissions is specified as follows:
E t = γ i × θ i
where i means the various types of land use, which has 6 land use types in our study, namely, cropland, woodland, grassland, water, wetland, and unused land. E t   denotes LUCEs (kg);   γ i is the acreage of various land use patterns (km2); and θ i indicates the carbon emissions factor for various land types (Table 1).
2.
Indirect Carbon Emissions
Carbon emissions from construction land were gained by adding the product of each energy consumption and the corresponding energy carbon emissions factor, which is derived from the following method:
E j = ( E i × d i × i )
where E j denotes carbon emissions from construction land, and (kg) shows the various energy consumptions. Based on regional characteristics and data availability, we studied the consumption of five major energy sources, including coal, coke, gasoline, kerosene, and fuel oil. d i denotes the standard coal conversion factor for the sources of various energies, and i indicates the carbon emissions factor for the sources of various energies. Table 2 shows the conversion factors and carbon emissions factors for each energy standard of coal.

2.3.2. Spatial Autocorrelation Models

The exploratory spatial data analysis (ESDA) method was used to explore the spatial correlation characteristics of carbon emissions. Global spatial autocorrelation is taken to identify the overall correlation of spatial correlation [39], and Moran’s I can be formulated as:
I = 1 S 2 j = 1 n ( X i X ¯ ) ( X j X ¯ ) / i = 1 n j = 1 n W i j
where n refers to the city number of Shandong Peninsula urban agglomeration; X i denotes the observed value of i for Shandong Peninsula urban agglomeration; X ¯ represents the sample mean; and W i j denotes the spatial weight matrix; S 2 = i = 1 n X i X ¯ 2 / n . Moran’s I takes the value in the interval 1 ,   1 . Moreover, at the city level, LISA were also derived to determine the local clustering of carbon emissions.

3. Results

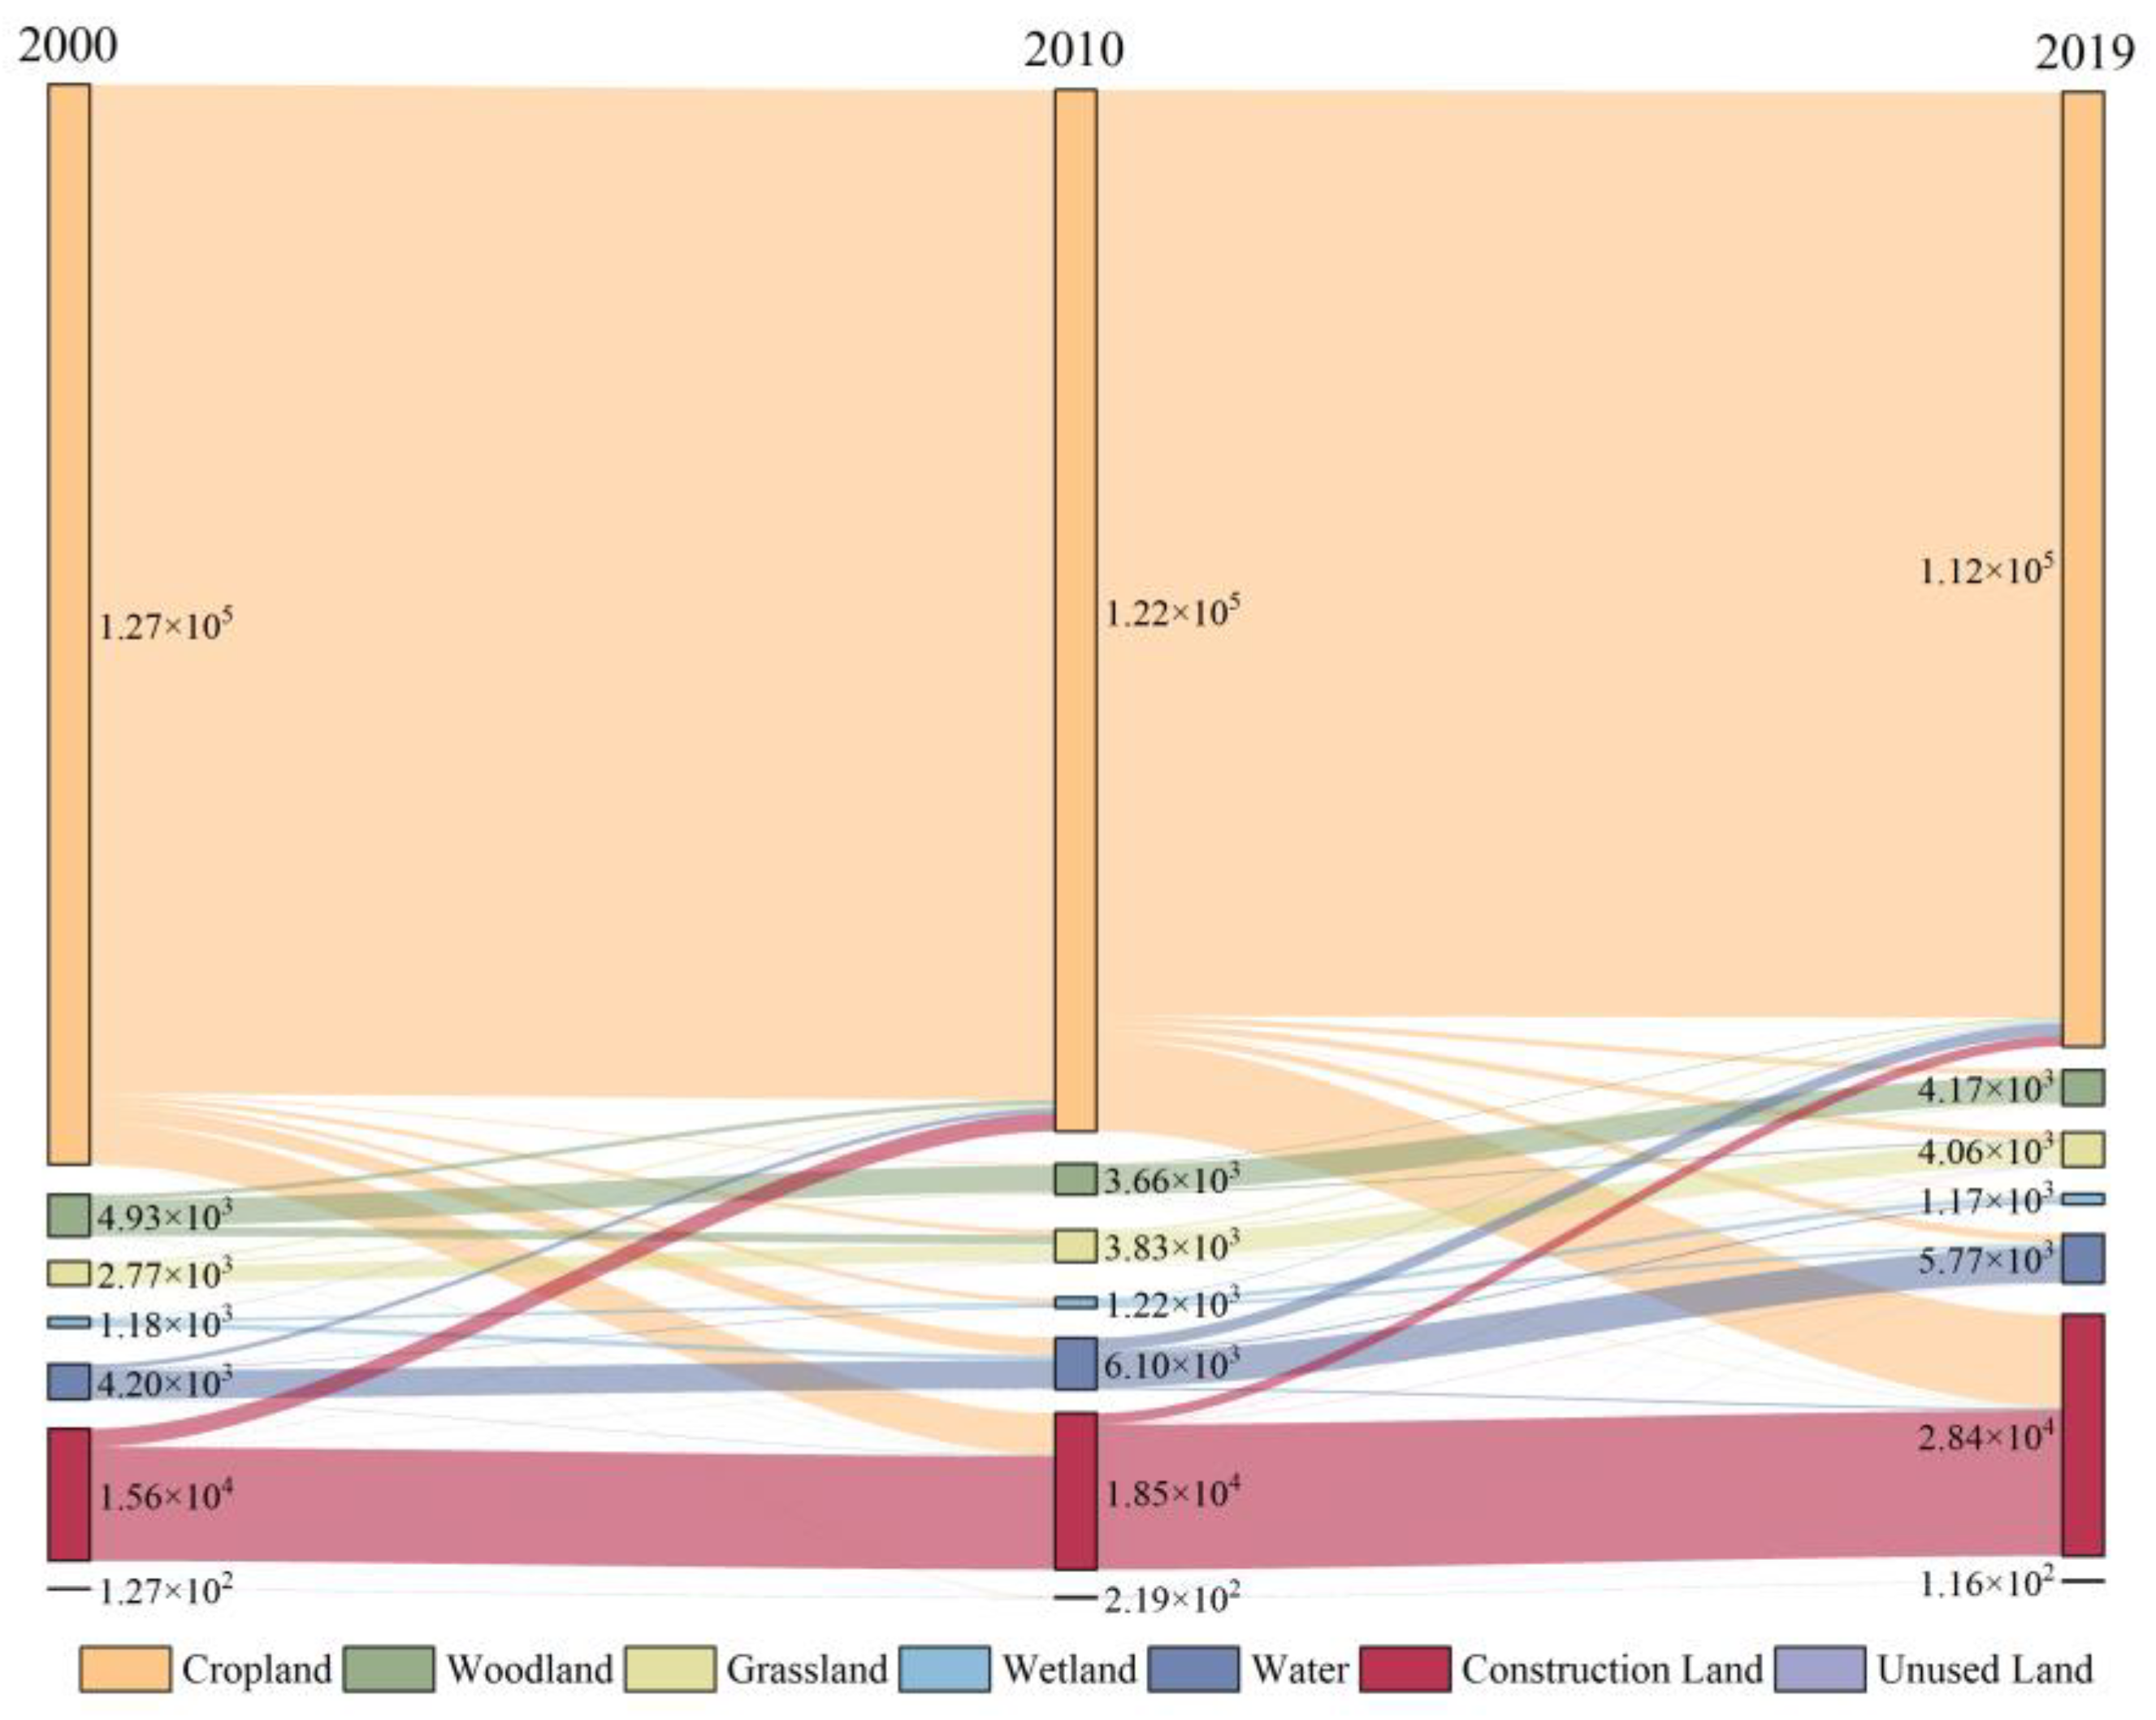
3.1. Spatial and Temporal Characteristics of Land Use Change

3.1.1. Spatial and Temporal Characteristics of Land Use Change in the Urban Agglomeration

The transition between the different types of land use in Shandong Peninsula urban agglomeration from 2000 to 2019 were illustrated in Figure 2. During 2000–2010, all land use types were transferred, and the total transferred presented area was 1.47 × 10⁴ km2, accounting for 9.44% of the study area. The largest area transferred was cropland, which was 8.32 × 10³ km2, representing approximately 56.55% of the total area transferred. Of this, 4.84 × 10³ km2 was transformed into construction land, accounting for the largest share of approximately 58.17%. The area of land transferred for construction land was second to cropland during 2000–2010. A total of 2.20 × 10³ km2 of construction land was transferred, of which approximately 97.17% of the construction land area was transferred to cropland. The area of cropland converted to construction land from 2010 to 2019 was 1.08 × 10⁴ km2, representing approximately 55.94% of the total area of cropland converted. The increased area of land for construction from 2010 to 2019 was mainly from cropland, which is similar to the land transfer from 2000 to 2010. The cropland was mainly transferred from construction land and water, with the area of 1.25 × 10³ km2 and 1.45 × 10³ km2, respectively. In summary, the area of cropland in Shandong Peninsula urban agglomeration decreased, while construction land increased during the study period.

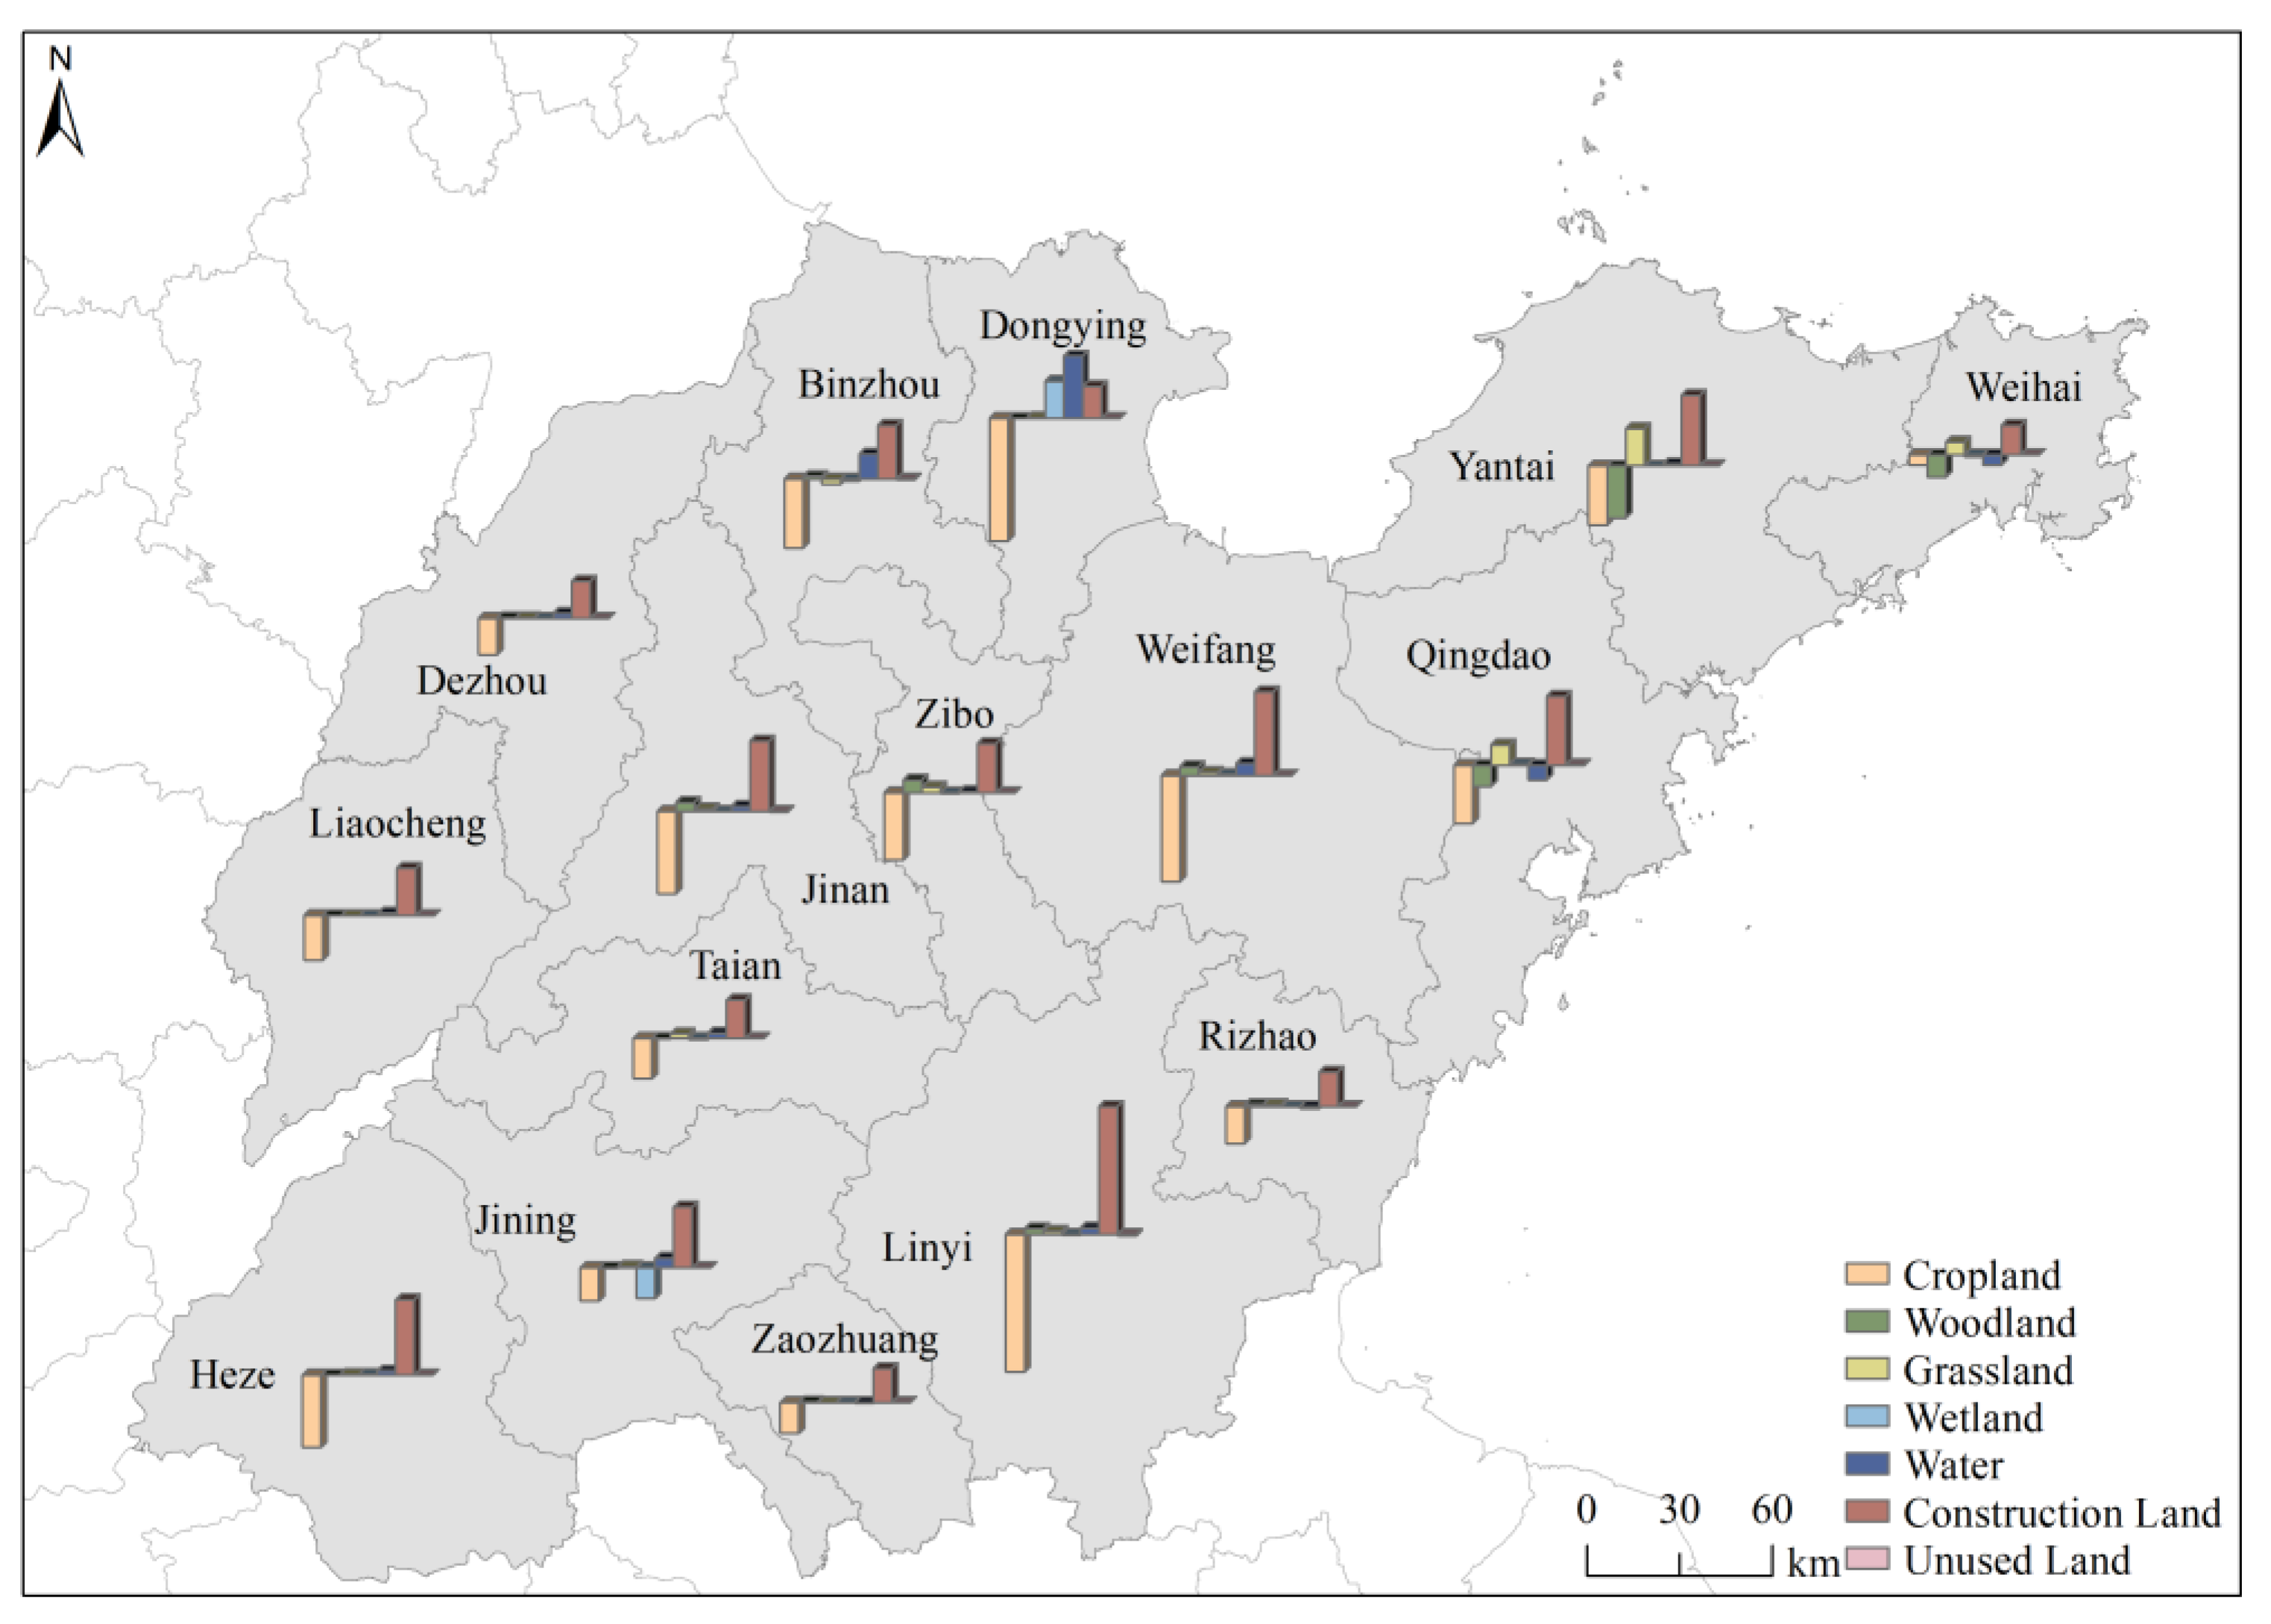
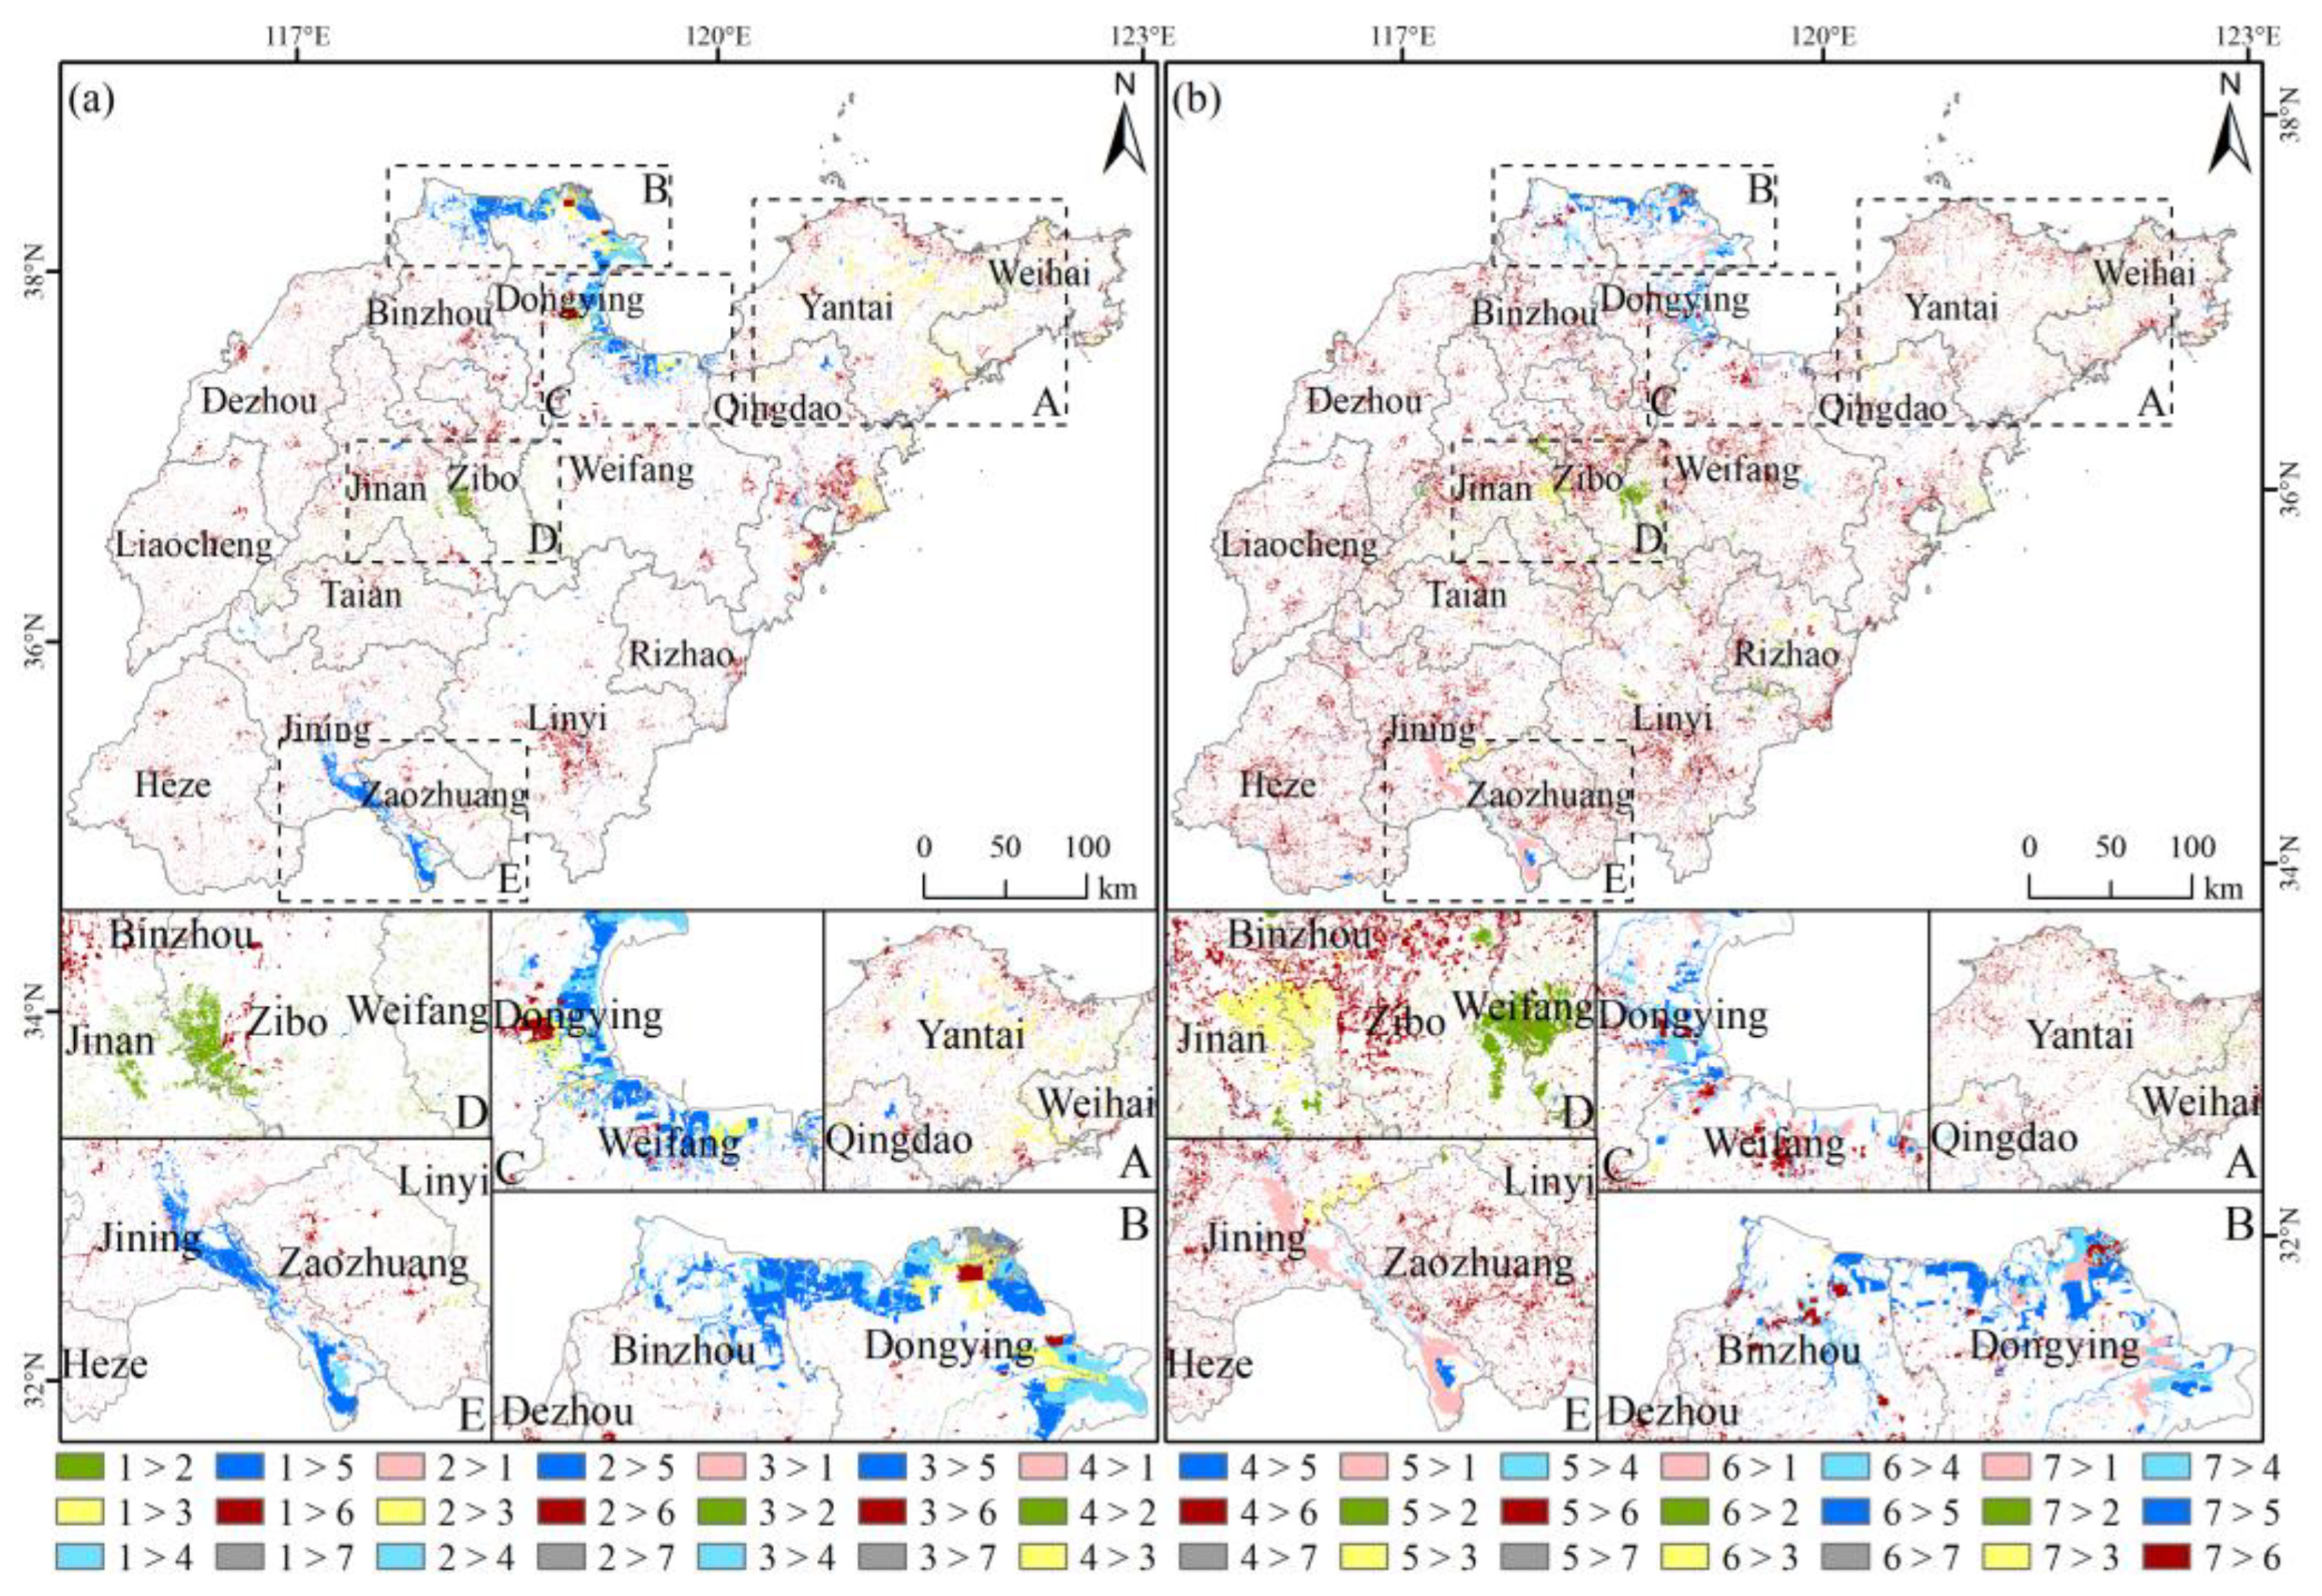
3.1.2. Spatial and Temporal Characteristics of Land Use Change at the City Level

Figure 3 showed the land use area changes and area variation rates for 16 cities in Shandong Peninsula urban agglomeration. Cropland experienced a decreasing tendency in all 16 cities from 2000 to 2019. Linyi had the largest reduction in cropland with a decrease of 1946 km2. By contrast, construction land was increased for all the 16 cities. Among them, Linyi had the largest increase in construction land with an increase of 1813 km2. During 2000–2019, Yantai had the largest decrease in woodland and the largest increase in grassland, with areas of 741 km2 and 531 km2, respectively. The largest increase in wetland and water area was in Dongying, with an increase of 525 km2 and 882 km2, respectively. In general, there was a spatial variability at the city level in land use change.
There was spatial variability in the transfer of various land use types in Shandong Peninsula urban agglomeration during 2000–2019 (Figure 4). From 2000 to 2010, both cropland and grassland were mainly increased in Yantai and Weihai (Figure 4(aA)), while the increased area of woodland was mainly concentrated in Zibo and Weifang (Figure 4(aD,bD)). From 2010 to 2019, the increased cropland area was primarily in Jining and Zaozhuang (Figure 4(bE)), and the increased grassland area was mainly in Zibo and Jinan (Figure 4(bD)). The expansion of wetlands and watersheds was mainly in Binzhou, Dongying, and Weifang during the study period (Figure 4(aB,aC,bB,bC)). In general, the increase in construction land occurred the most among all the land types in Shandong Peninsula urban agglomeration during the study period.

3.2. Spatial and Temporal Characteristics of Carbon Emissions at the City Level

3.2.1. Characteristics of Carbon Emissions from Different Land Use Types

The carbon emissions from various types of land use in 16 cities in Shandong urban agglomeration were generally in accordance with the area change in different land use types (Figure 5). The carbon emissions of the 16 cities increased by 179.65% from 2000 to 2010, while they increased by only 13.78% from 2010 to 2019. Therefore, the total carbon emissions of each city showed an increasing trend during 2000–2019, but the increment decreased after 2010 (Figure 5a–c). The overall carbon emissions of 16 cities increased from 1.05 × 10¹¹ kg in 2000 to 3.32 × 10¹¹ kg in 2019, an increase of approximately 1.14 × 10¹⁰ kg per year. The largest increases in carbon emissions were seen in Qingdao and Jinan, with increase rates of 382.25% and 337.05%, respectively. The carbon emissions of all 16 cities increased between 2000 and 2019. Dongying, Liaocheng, Tai’an, Zaozhuang, and Zibo showed a declining trend during 2000–2019, while the other cities showed an increase in their total carbon emissions. During the study period, Qingdao had the largest total carbon emissions, with 1.08 × 10¹⁰ kg in 2000, 3.80 × 10¹⁰ kg in 2010, and 5.22 × 10¹⁰ kg in 2019. Rizhao’s total carbon emissions were in the bottom 2, at 3.15 × 10⁹ kg in 2000, 8.07 × 10⁹ kg in 2010, and 9.48 × 10⁹ kg in 2019 (Figure 5d). The carbon emission distribution within the urban agglomeration was in spatial disparity.

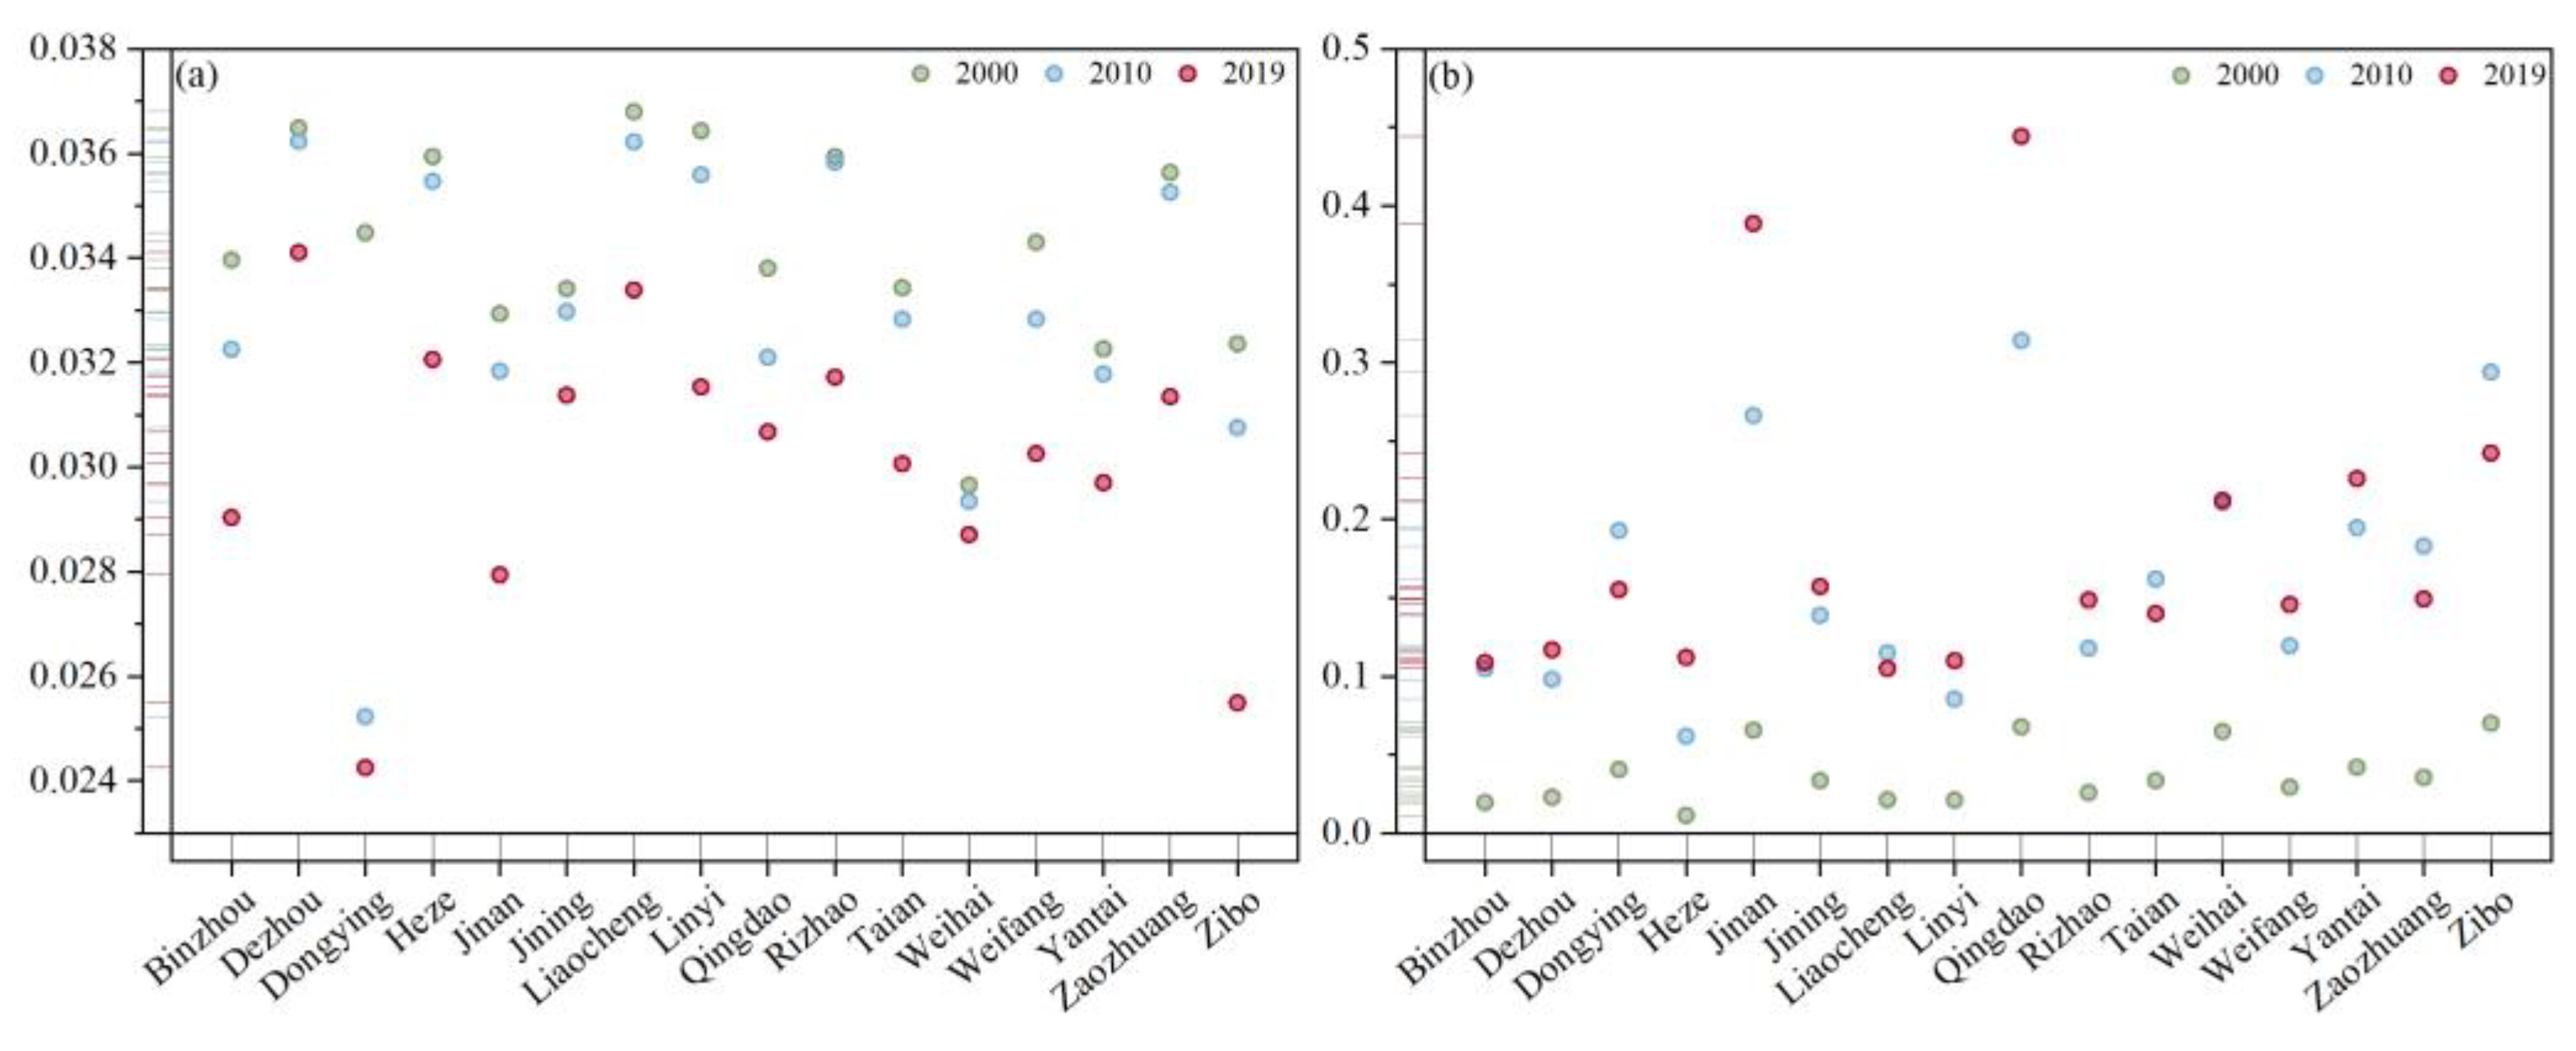
3.2.2. Characteristics of Land-Average Carbon Emissions and Carbon Emissions per Capita at the City Level

Land-average carbon emissions were calculated from the total carbon emissions in every city and corresponding land area, and there were large differences among the cities (Figure 6a). From 2000 to 2010, all 16 cities showed an upward trend of land-average carbon emissions. Qingdao increased from 9.83 × 10⁵ kg/km2 in 2000 to 34.46 × 10⁵ kg/km2 in 2010, with an increase of 24.63 × 10⁵ kg/km2. Heze experienced the least amount of growth, with only 5.01 × 10⁵ kg/km2 (Figure 6b). From 2010 to 2019, the land-average carbon emissions of Liaocheng, Tai’an, Zibo, Zaozhuang, and Dongying decreased, with a decrease of 8.53%, 12.91%, 17.27%, 18.22%, and 18.41%, respectively. The other 11 cities in the urban agglomeration increased in terms of their land-average carbon emissions. Qingdao had the largest increase in land-average carbon emissions, which was 12.94 × 10⁵ kg/km2, while Linyi output the least amount of land-average carbon emissions from 2000 to 2019.
From 2000 to 2010, all cities in the urban agglomeration showed an increasing trend in carbon emissions per capita (Figure 6c). Among them, Dongying had the largest increase in carbon emissions per capita, from 3.18 × 10³ kg in 2000 to 8.68 × 10³ kg in 2010, with an increase of 172.86%. The smallest increase was in Heze with only 558 kg. Liaocheng, Dongying, Binzhou, Tai’an, Zaozhuang, Zibo, and Weihai showed an increased tendency of carbon emissions per capita from 2010 to 2019. The largest reduction in carbon emissions per capita occurred in Dongying by 22.62%, while the largest increase was in Qingdao, where the carbon emissions per capita increased by 1.32 kg. Among the 16 cities, Dongying consistently ranked 1st in carbon emissions per capita, while Heze ranked last (Figure 6d).

3.2.3. Characteristics of Land-Average Carbon Emissions and Carbon Emissions per Capita of Major Carbon Sources

We measured the land-average carbon emissions for cropland and construction land for all 16 cities (Figure 7). All 16 cities showed a decreasing trend in land-average carbon emissions for cropland from 2000 to 2019. Among them, Dongying reduced the largest, with 0.1 kg of carbon emissions per 1 km2 of land (Figure 7a). The land-average carbon emissions of construction land in all 16 cities showed an increasing trend (Figure 7b). Qingdao had the highest land-average carbon emissions of construction land from 2000 to 2019, with an increase of 0.377 kg/km2. The land-average carbon emissions of construction land increased by 0.323 kg/km2. The trend of land-average carbon emissions from construction land corresponded with the change in the construction land area in every city.

3.3. Spatial Characteristics of Carbon Emissions in the Urban Agglomeration

3.3.1. Global Spatial Autocorrelation Characteristics at the City Level

To evaluate the overall characteristics in spatial terms of carbon emissions, we calculated the global Moran’s I values of carbon emissions in Shandong Peninsula urban agglomeration. A positive global Moran’s I value means that the characteristics in spatial terms of their total trend in carbon emissions tend to be clustering. A negative global Moran’s I value demonstrates that the characteristics in spatial terms of the total of carbon emissions tend to be dispersed. As showed in Table 3, it can be observed that the Moran’s I value of total carbon emissions was negative, suggesting that there is a tendency of total carbon emissions towards dispersion in Shandong Peninsula urban agglomeration. Likewise, the global Moran’s I value was negative in terms of land-average carbon emissions, showing that land-average carbon emissions also have a dispersion tendency. In contrast, the Moran’s I value for carbon emissions per capita was greater than zero, which indicates that carbon emissions per capita has a geographical agglomeration. In summary, during 2000–2019, there was a spatial correlation of carbon emissions among neighboring cities. The total characteristics in spatial terms of carbon emissions were random at the city level, but carbon emissions per capita were spatially autocorrelated with geographic agglomerations during 2000–2019.

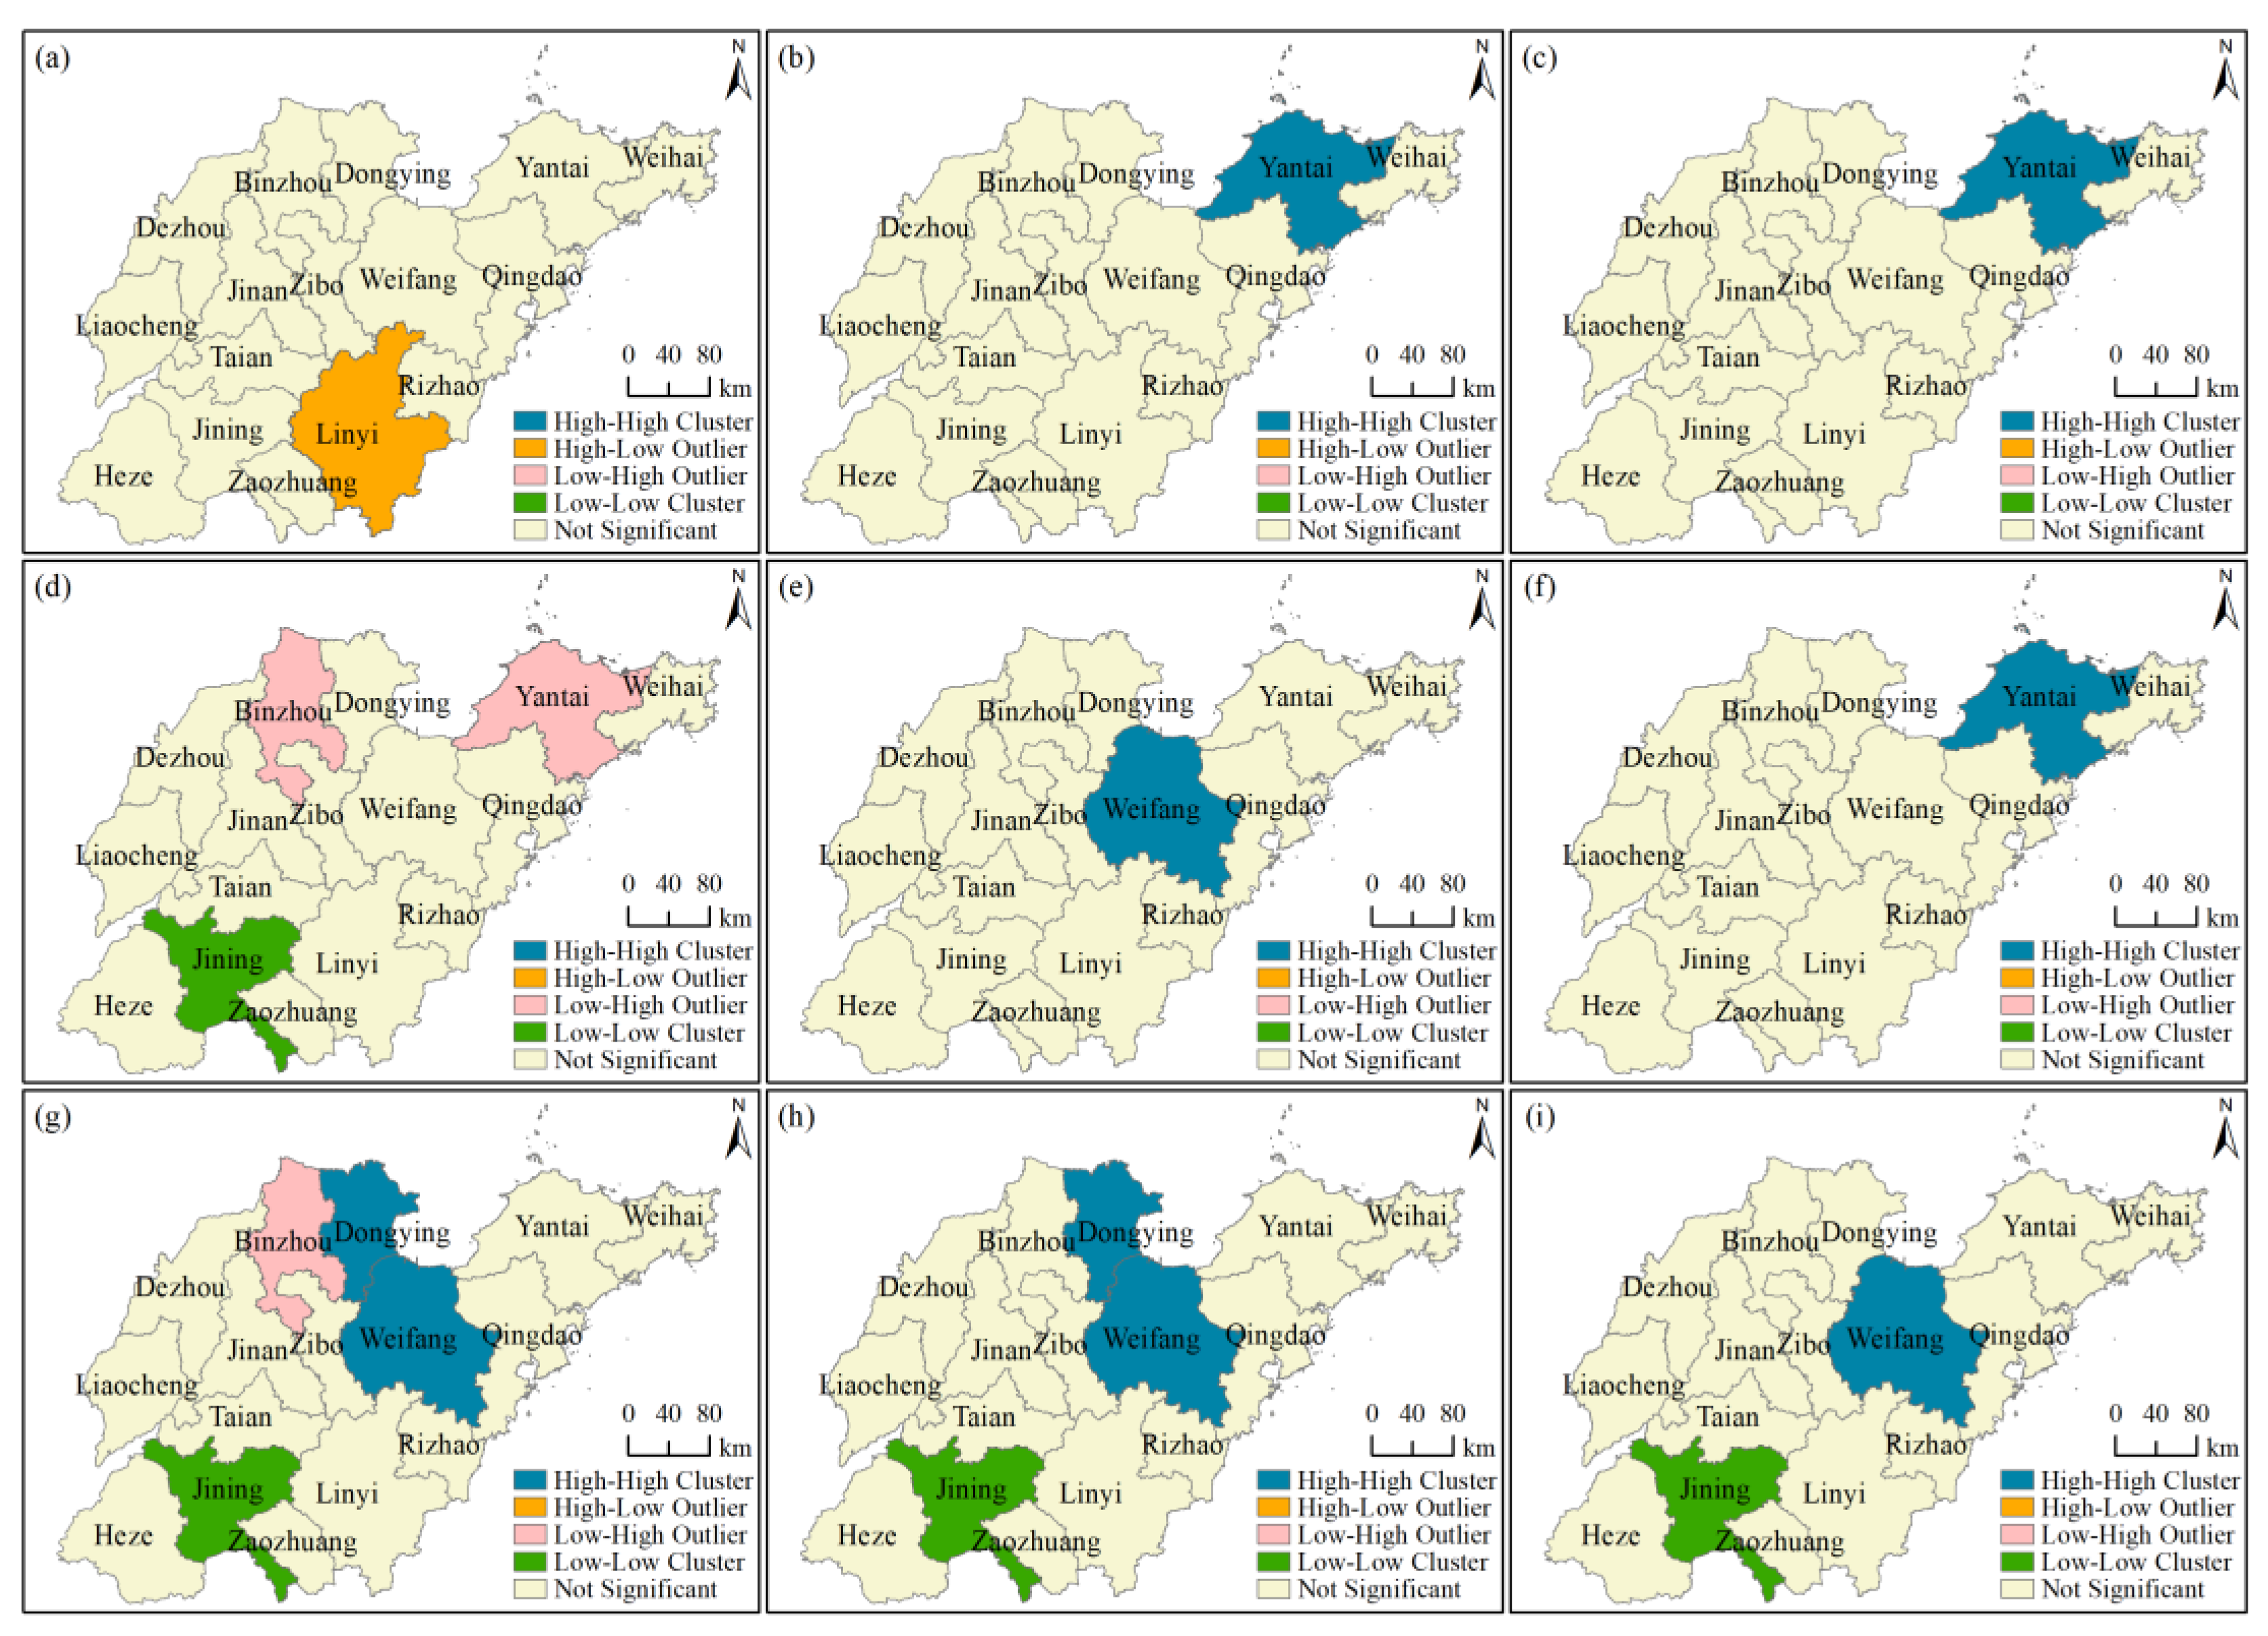
3.3.2. Local Spatial Autocorrelation Characteristics at the City Level

We conducted the average of the local indicators of LISA in Shandong Peninsula urban agglomeration, which further demonstrated the local spatial correlation of overall carbon emissions at the city level. The results of the calculation were classified into four different spatial patterns, which are high–high cluster, high–low outlier, low–high outlier, and low–low cluster. The total carbon emissions showed a spatial difference from 2000 to 2019 (Figure 8).
There was only a high–low outlier spatial pattern of the total carbon emissions for 2000 in Linyi. It showed that Linyi had high total carbon emissions, which did not lead to an increase in the surrounding areas (Figure 8a). In 2010 and 2019, only a high–high cluster spatial pattern of overall carbon emissions occurred in Yantai (Figure 8b,c), suggesting that Yantai had higher overall carbon emissions, which led to an increase in the surrounding areas. As showed in Figure 8d, there was a low–low cluster spatial pattern of land-average carbon emissions only in Jining in 2000, suggesting that Jining has low land-average carbon emissions, which led to a decrease in the surrounding areas.
There was a low–high outlier spatial pattern of the land-average carbon emissions located in Binzhou and Yantai in 2000, demonstrating that the land-average carbon emissions were low in Binzhou and Yantai, but their surrounding areas had higher land-average carbon emissions (Figure 8d). In 2010 and 2019, a high–high cluster spatial pattern of land-average carbon emissions only occurred in Weifang, suggesting that Weifang had higher land-average carbon emissions, which led to an increase in the surrounding areas (Figure 8e,f).
There were three spatial patterns of carbon emissions per capita in 2000, including a high–high cluster, low–high outlier, and low–low cluster (Figure 8g). Of these, the high–high cluster mainly occurred in Dongying and Weifang. This demonstrated that the carbon emissions per capita in Dongying and Weifang were high, which led to an increase in their surrounding areas. The low–high outlier spatial pattern of the carbon emissions per capita located in Binzhou showed that the carbon emissions per capita were low in Binzhou, but its surrounding areas had higher carbon emissions per capita. In 2000, the low–low cluster spatial pattern for carbon emissions per capita only occurred in Jining, suggesting that Jining had low carbon emissions per capita, which led to a decrease in the surrounding areas. In 2010, the low–low cluster spatial pattern of carbon emissions per capita only occurred in Jining, while the high–high cluster of carbon emissions per capita majorly occurred in Dongying and Weifang, which is similar to that in 2000 (Figure 8h). The low–low cluster spatial pattern of carbon emissions per capita only occurred in Jining in 2019, suggesting that Jining had low carbon emissions per capita, which led to a decrease in the surrounding areas. The high–high cluster of carbon emissions per capita primarily occurred in Weifang, indicating that the region had high carbon emissions per capita, which led to an increase in its surrounding areas (Figure 8i).

4. Discussion

4.1. Analysis of Land Use Change

The transfer between different land use types in Shandong Peninsula urban agglomeration between 2000 and 2019 was studied. We found that the cropland area decreased while the construction land area increased in Shandong Peninsula urban agglomeration from 2000 to 2019. A possible explanation is the accelerated urbanization and industrialization of Shandong Peninsula urban agglomeration. According to the Shandong Province Urbanization Development Outline (2012–2020), the government supported the expansion of the city scale in the province, which resulted in an increase in construction land. The urbanization rate in the study region increased from 26.84% to 49.94% from 2000 to 2019, with an urban population increase of 110.38%. Another possible explanation for this was the rapid population growth in the urban agglomeration. Based on the Shandong Provincial Statistical Yearbook, the population of the urban agglomeration has increased from 89.75 million in 2000 to 101.48 million in 2019, with an increase of 11.73 million.
Moreover, we found that the increase in construction land mainly occurred from the cropland (Figure 2). This result may be explained by the fact that the expansion of construction land is a common problem of the urbanization development in China [41]. Previous studies have demonstrated that the three main causes of urban expansion and shrinking cropland are urbanization, economic development (mainly industrialization), and population growth [42]. This finding accords with our earlier observations, which demonstrated an increase in construction land in Shandong Peninsula urban agglomeration. In accordance with the present results, previous studies have demonstrated that the land transformation in Shandong from 2000 to 2020 was mainly the conversion of cropland to construction land [28].

4.2. Analysis of Carbon Emissions at the City Level

The overall carbon emissions showed an upward trend during 2000–2019, but the upward trend slowed down after 2010 in Shandong Peninsula urban agglomeration. These results are likely to be related to the policy of energy saving and emission reduction developed by Shandong Province. In 2011, the Shandong Province environmental protection “12th Five-Year” plan stated that it would strongly develop new and renewable energy to decrease the percentage of coal in energy consumption. Additionally, the Shandong Peninsula urban agglomeration development plan (2016–2030) proposed to control the development of coal within the urban agglomeration and build coal production bases outside of the province. Moreover, urban agglomeration should prioritize the development of clean coal power and the construction of nuclear power bases. Hence, the trend of increasing carbon emissions in the Shandong Peninsula urban agglomeration slowed down after 2010.
We also found that in Shandong Peninsula urban agglomeration, the carbon emissions of Jinan and Qingdao were higher than other cities. It seems possible that this result is due to differences in the economic development of cities. Jinan City Master Plan (2011–2020) mentioned that Jinan should strongly develop its provincial capital economy, which is represented by the resident and headquarters economy. At the same time, Qingdao would build an important advanced manufacturing base and a marine emerging industry cluster in China according to the Qingdao City Master Plan (2011–2020). Jinan and Qingdao have relatively high levels of economic development compared to other cities in Shandong Province [43], which is consistent with our finding. Another possible explanation for this is the expansion of construction land. The construction land in Jinan increased from 1.10 × 10³ km2 in 2000 to 2.10 × 10³ km2 in 2019, with an increase of 9.99 × 10² km2. During the same period, the construction land in Qingdao increased from 1.11 × 10³ km2 to 2.10 × 10³ km2, meaning it increased by 88.83%. The construction land area in Jinan and Qingdao increased, which led to an increase in carbon emission during the study period. Furthermore, this result may be explained by the fact that economic development is linked to energy consumption in cities. According to the China Energy Statistics Yearbook, Jinan and Qingdao accounted for 30.84% of coal consumption in Shandong Province by the end of 2019. The high inertia of energy carbon emissions in economic development [29] make it difficult for Jinan and Qingdao to achieve economic and energy efficiency simultaneously in the short term. As a result, the carbon emissions of Jinan and Qingdao were higher in Shandong Province during the study period.

4.3. Analysis the Spatial Agglomeration of Carbon Emissions at the City Level

The result indicated that carbon emissions per capita had a spatial autocorrelation of geographical agglomeration during the study period at the city level. A possible explanation for this is related to population movement. The population is distributed heterogeneously, showing a clear geographical agglomeration [17]. The accelerated urbanization process, on the other hand, has led to an enormous influx of people from rural areas into the cities. In addition, population movement is characterized by a significant geographical proximity [44]. Thus, population movement in Shandong Peninsula urban agglomeration results in a geographic agglomeration of per capita carbon emissions at the city level.
We also found that Yantai showed a high–high cluster spatial pattern of carbon emissions. This result may be due to regional economic development. The Shandong Peninsula Blue Economic Zone Development Plan was approved by the State Council in 2011, which stated that it would promote regional economic development. As an important component of the Shandong Peninsula Blue Economic Zone, the GDP of Yantai was 3rd in all 16 cities in Shandong Peninsula urban agglomeration (Figure 9). Carbon emissions are positively correlated with economic development [45], which is consistent with our earlier finding. In addition, there was a low–low cluster spatial pattern of land-average carbon emissions and carbon emissions per capita in Jining during the study period. A possible explanation for this might be related to the impact of coal consumption. During the study period, the coal consumption for Jining was only 6.5% of the total coal consumption in Shandong Peninsula urban agglomeration. Those findings seem to be consistent with other bodies of research, which found that carbon emissions per capita as well as carbon intensity are increasing in more economically developed regions [43].
In the context of climate change, land use carbon emissions are receiving increased amounts of attention as urbanization accelerates. The study of land use carbon emissions at the city level not only helps in understanding the regional land resource use situation, but it also contributes to the formulation of appropriate policies for different city developments. In the future, we will continue to conduct research on land use carbon emissions at the city level from different perspectives.

5. Conclusions

Urban agglomerations are the most promising core areas in China’s future economic development pattern and are the main direction for China’s urban development. In the context of the global urbanization process and economic globalization, urban agglomerations are acting as a brand-new geographical unit for the country to participate in global competition. Here, we analyzed the spatial and temporal characteristics of carbon emissions from various land uses in terms of the total carbon emissions, land-average carbon emissions, and carbon emissions per capita of urban agglomerations. The detailed conclusions are summarized as follows:
(1) Cropland area decreased, and the construction land area increased in Shandong Peninsula urban agglomeration during 2000–2019, while the increased construction land was mainly from cropland.
(2) The overall carbon emissions in Shandong Peninsula urban agglomeration showed an uptrend during the study period, but the rising trend slowed down after 2010. The carbon emissions of Jinan and Qingdao were higher than those of other cities in Shandong Peninsula urban agglomeration at the city level.
(3) The overall spatial distribution of carbon emissions at the city level was characterized by spatial heterogeneity, but the per capita carbon emissions showed the spatial autocorrelation of geographical agglomeration. Since carbon emissions exhibit a positive correlation with economic development, Yantai showed a high–high cluster spatial pattern of carbon emissions. There was a low–low cluster spatial pattern of land-average carbon emissions and carbon emissions per capita in Jining during 2000–2019.
This study takes Shandong Peninsula urban agglomeration as an example to study land use carbon emissions at the city level, providing a new perspective for studying land use carbon emissions in other urban agglomerations under global climate change. At present, we have only studied carbon emissions at the city level from 2000 to 2019. In future work, we will combine a long-term series of land use and energy data to explore carbon emissions from land use under the influence of anthropogenic activities to provide a theoretical foundation for sustainable regional development.

Author Contributions

Conceptualization, L.Z.; methodology, C.-h.Y.; software, Y.-c.Z.; formal analysis, L.Z.; writing—original draft preparation, L.Z.; writing—review and editing, Q.-p.Z. and Q.W. All authors have read and agreed to the published version of the manuscript.

Funding

This study was supported by The Natural Science Foundation of China (32060279); Natural Science Foundation of Shandong Province (ZR2022MD063); Startup Fund of Liaocheng University (318052036, 318052116).

Institutional Review Board Statement

Not applicable.

Informed Consent Statement

Not applicable.

Data Availability Statement

The land use data with a spatial resolution of 30 m × 30 m were derived from the Global Land Cover Data Product Service website of the National Center for Basic Geo-graphic Information (DOI:10.11769) (http://www.globallandcover.com/ accessed on 17 May 2022). We gathered energy data and socioeconomic data, such as urbanization rate, population, and gross domestic product (GDP), from China Statistical Yearbook and the corresponding city statistical yearbooks (2001–2020), respectively. Administrative area data were gained by Resource and Environmental Science and Data Center (https://www.resdc.cn/ accessed on 19 May 2022). Data will be made available on request.

Conflicts of Interest

The authors declare no conflict of interest.

References

  1. Zhang, M.; Kafy, A.A.; Xiao, P.; Han, S.; Zou, S.; Saha, M.; Zhang, C.; Tan, S. Impact of urban expansion on land surface temperature and carbon emissions using machine learning algorithms in Wuhan, China. Urban Clim. 2023, 47, 101347. [Google Scholar] [CrossRef]
  2. Ranagalage, M.; Morimoto, T.; Simwanda, M.; Murayama, Y. Spatial Analysis of Urbanization Patterns in Four Rapidly Growing South Asian Cities Using Sentinel-2 Data. Remote Sens. 2021, 13, 1531. [Google Scholar] [CrossRef]
  3. Dabous, S.A.; Shanableh, A.; AlRuzouq, R.; Hosny, F.; Khalil, M.A. A spatio-temporal framework for sustainable planning of buildings based on carbon emissions at the city scale. Sustain. Cities Soc. 2022, 82, 103890. [Google Scholar] [CrossRef]
  4. Chen, G.; Li, X.; Liu, X.; Chen, Y.; Liang, X.; Leng, J.; Xu, X.; Liao, W.; Qiu, Y.; Wu, Q.; et al. Global projections of future urban land expansion under shared socioeconomic pathways. Nat. Commun. 2020, 11, 537. [Google Scholar] [CrossRef] [Green Version]
  5. Wang, W.; Liu, L.; Liao, H.; Wei, Y. Impacts of urbanization on carbon emissions: An empirical analysis from OECD countries. Energy Policy 2021, 151, 112171. [Google Scholar] [CrossRef]
  6. Su, K.; Wei, D.; Lin, W. Influencing factors and spatial patterns of energy-related carbon emissions at the city-scale in Fujian province, Southeastern China. J. Clean. Prod. 2020, 244, 118840. [Google Scholar] [CrossRef]
  7. Xu, L.; Wang, X.; Liu, J.; He, Y.; Tang, J.; Nguyen, M.; Cui, S. Identifying the trade-offs between climate change mitigation and adaptation in urban land use planning: An empirical study in a coastal city. Environ. Int. 2019, 133, 105162. [Google Scholar] [CrossRef] [PubMed]
  8. Carpio, A.; Ponce-Lopez, R.; Lozano-García, D.F. Urban form, land use, and cover change and their impact on carbon emissions in the Monterrey Metropolitan area, Mexico. Urban Clim. 2021, 39, 100947. [Google Scholar] [CrossRef]
  9. Ali, M.A.S.; Yi, L. Evaluating the nexus between ongoing and increasing urbanization and carbon emission: A study of ARDL-bound testing approach. Environ. Sci. Pollut. Res. 2022, 29, 27548–27559. [Google Scholar] [CrossRef]
  10. Duan, X.; Li, X.; Tan, W.; Xiao, R. Decoupling relationship analysis between urbanization and carbon emissions in 33 African countries. Heliyon 2022, 8, e10423. [Google Scholar] [CrossRef]
  11. Sun, Y.; Li, H.; Andlib, Z.; Genie, M.G. How do renewable energy and urbanization cause carbon emissions? Evidence from advanced panel estimation techniques. Renew. Energy 2022, 185, 996–1005. [Google Scholar] [CrossRef]
  12. Chao, Z.; Wang, L.; Che, M.; Hou, S. Effects of Different Urbanization Levels on Land Surface Temperature Change: Taking Tokyo and Shanghai for Example. Remote Sens. 2020, 12, 2022. [Google Scholar] [CrossRef]
  13. Li, R.; Li, L.; Wang, Q. The impact of energy efficiency on carbon emissions: Evidence from the transportation sector in Chinese 30 provinces. Sustain. Cities Soc. 2022, 82, 103880. [Google Scholar] [CrossRef]
  14. Li, L.; Cai, Y.; Liu, L. Research on the Effect of Urbanization on China’s Carbon Emission Efficiency. Sustainability 2019, 12, 163. [Google Scholar] [CrossRef] [Green Version]
  15. Shan, B.; Zhang, Q.; Ren, Q.; Yu, X.; Chen, Y. Spatial heterogeneity of urban–rural integration and its influencing factors in Shandong province of China. Sci. Rep. 2022, 12, 14317. [Google Scholar] [CrossRef]
  16. Zhang, C.; Zhao, L.; Zhang, H.; Chen, M.; Fang, R.; Yao, Y.; Zhang, Q.; Wang, Q. Spatial-temporal characteristics of carbon emissions from land use change in Yellow River Delta region, China. Ecol. Indic. 2022, 136, 108623. [Google Scholar] [CrossRef]
  17. Lyu, Y.; Jiang, F. Spatial and temporal distribution of population in urban agglomerations changes in China. Sci. Rep. 2022, 12, 8315. [Google Scholar] [CrossRef]
  18. Rong, T.; Zhang, P.; Zhu, H.; Jiang, L.; Li, Y.; Liu, Z. Spatial correlation evolution and prediction scenario of land use carbon emissions in China. Ecol. Inform. 2022, 71, 101802. [Google Scholar] [CrossRef]
  19. Feng, Y.; Chen, S.; Tong, X.; Lei, Z.; Gao, C.; Wang, J. Modeling changes in China’s 2000–2030 carbon stock caused by land use change. J. Clean. Prod. 2020, 252, 119659. [Google Scholar] [CrossRef]
  20. Shi, P.; Bai, L.; Zhao, Z.; Dong, J.; Li, Z.; Min, Z.; Cui, L.; Li, P. Vegetation position impacts soil carbon losses on the slope of the Loess Plateau of China. Catena 2023, 222, 106875. [Google Scholar] [CrossRef]
  21. Liu, S.; Wu, J.; Li, G.; Yang, C.; Yuan, J.; Xie, M. Seasonal freeze-thaw characteristics of soil carbon pools under different vegetation restoration types on the Longzhong Loess Plateau. Front. Ecol. Evol. 2022, 10, 3389. [Google Scholar] [CrossRef]
  22. Zhang, M.; Kafy, A.; Ren, B.; Zhang, Y.; Tan, S.; Li, J. Application of the Optimal Parameter Geographic Detector Model in the Identification of Influencing Factors of Ecological Quality in Guangzhou, China. Land 2022, 11, 1303. [Google Scholar] [CrossRef]
  23. Zhang, S.; Yang, P.; Xia, J.; Wang, W.; Cai, W.; Chen, N.; Hu, S.; Luo, X.; Li, J.; Zhan, C. Remote sensing inversion and prediction of land use land cover in the middle reaches of the Yangtze River basin, China. Environ. Sci. Pollut. Res. 2023. [Google Scholar] [CrossRef] [PubMed]
  24. Venkatappa, M.; Sasaki, N.; Anantsuksomsri, S.; Smith, B. Applications of the Google Earth Engine and Phenology-Based Threshold Classification Method for Mapping Forest Cover and Carbon Stock Changes in Siem Reap Province, Cambodia. Remote Sens. 2020, 12, 3110. [Google Scholar] [CrossRef]
  25. Sun, H.; Liang, H.; Chang, X.; Cui, Q.; Tao, Y. Land Use Patterns on Carbon Emission and Spatial Association in China. Econ. Geogr. 2015, 35, 154–162. [Google Scholar] [CrossRef]
  26. Huang, K.; Li, X.; Liu, X.; Seto, K.C. Projecting global urban land expansion and heat island intensification through 2050. Environ. Res. Lett. 2019, 14, 114037. [Google Scholar] [CrossRef] [Green Version]
  27. Zhou, Y.; Chen, M.; Tang, Z.; Mei, Z. Urbanization, land use change, and carbon emissions: Quantitative assessments for city-level carbon emissions in Beijing-Tianjin-Hebei region. Sustain. Cities Soc. 2021, 66, 102701. [Google Scholar] [CrossRef]
  28. Zhu, L.; Xing, H.; Hou, D. Analysis of carbon emissions from land cover change during 2000 to 2020 in Shandong Province, China. Sci. Rep. 2022, 12, 8021. [Google Scholar] [CrossRef]
  29. Tian, S.; Xu, Y.; Wang, Q.; Zhang, Y.; Yuan, X.; Ma, Q.; Chen, L.; Ma, H.; Liu, J.; Liu, C. Research on peak prediction of urban differentiated carbon emissions-a case study of Shandong Province, China. J. Clean. Prod. 2022, 374, 134050. [Google Scholar] [CrossRef]
  30. Shi, C. Decoupling analysis and peak prediction of carbon emission based on decoupling theory. Sustain. Comput.Inform. Sys. 2020, 28, 100424. [Google Scholar] [CrossRef]
  31. Yang, A.; Zhang, L.; Zhang, S.; Zhan, Z.; Shi, J. Research on the temporal and spatial characteristics, spatial clustering and governance strategies of carbon emissions in cities of Shandong. Front. Environ. Sci. 2022, 10, 3389. [Google Scholar] [CrossRef]
  32. Bai, C.; Chen, Z.; Wang, D. Transportation carbon emission reduction potential and mitigation strategy in China. Sci. Total Environ. 2023, 873, 162074. [Google Scholar] [CrossRef] [PubMed]
  33. Wen, L.; Chatalova, L.; Gao, X.; Zhang, A. Reduction of carbon emissions through resource-saving and environment-friendly regional economic integration: Evidence from Wuhan metropolitan area, China. Technol. Forecast. Soc. Change 2021, 166, 120590. [Google Scholar] [CrossRef]
  34. Bai, J.; Li, S.; Kang, Q.; Wang, N.; Guo, K.; Wang, J.; Cheng, J. Spatial Spillover Effects of Renewable Energy on Carbon Emissions in Less-developed Areas of China. Environ. Sci. Pollut. Res. 2022, 29, 19019–19032. [Google Scholar] [CrossRef] [PubMed]
  35. Lu, H.; Lu, X.; Jiao, L.; Zhang, Y. Evaluating urban agglomeration resilience to disaster in the Yangtze Delta city group in China. Sustain. Cities Soc. 2022, 76, 103464. [Google Scholar] [CrossRef]
  36. Wang, C.; Wood, J.; Wang, Y.; Geng, X.; Long, X. CO2 emission in transportation sector across 51 countries along the Belt and Road from 2000 to 2014. J. Clean. Prod. 2020, 266, 122000. [Google Scholar] [CrossRef]
  37. Guan, X.; Zhu, X.; Liu, X. Carbon Emission, air and water pollution in coastal China: Financial and trade effects with application of CRS-SBM-DEA model. Alex. Eng. J. 2022, 61, 1469–1478. [Google Scholar] [CrossRef]
  38. Li, Z.; Zheng, X.; Sun, D. The Influencing Effects of Industrial Eco-Efficiency on Carbon Emissions in the Yangtze River Delta. Energies 2021, 14, 8169. [Google Scholar] [CrossRef]
  39. Zhang, M.; Zhang, Z.; Tong, B.; Ren, B.; Zhang, L.; Lin, X. Analysis of the coupling characteristics of land transfer and carbon emissions and its influencing factors: A case study of China. Front. Environ. Sci. 2023, 10, 3389. [Google Scholar] [CrossRef]
  40. Tang, X.; Woodcock, C.E.; Olofsson, P.; Hutyra, L.R. Spatiotemporal assessment of land use/land cover change and associated carbon emissions and uptake in the Mekong River Basin. Remote Sens. Environ. 2021, 256, 112336. [Google Scholar] [CrossRef]
  41. Gao, J. How China will protect one-quarter of its land. Nature 2019, 569, 467. [Google Scholar] [CrossRef] [PubMed] [Green Version]
  42. Liu, F.; Zhang, Z.; Zhao, X.; Wang, X.; Zuo, L.; Wen, Q.; Yi, L.; Xu, J.; Hu, S.; Liu, B. Chinese cropland losses due to urban expansion in the past four decades. Sci. Total Environ. 2019, 650, 847–857. [Google Scholar] [CrossRef] [PubMed]
  43. Zhang, H.; Sun, X.; Wang, W. Study on the spatial and temporal differentiation and influencing factors of carbon emissions in Shandong province. Nat. Hazards 2017, 87, 973–988. [Google Scholar] [CrossRef]
  44. Long, H.; Li, Y.; Liu, Y.; Woods, M.; Zou, J. Accelerated restructuring in rural China fueled by ‘increasing vs. decreasing balance’ land-use policy for dealing with hollowed villages. Land Use Policy 2012, 29, 11–22. [Google Scholar] [CrossRef]
  45. Zhao, X.; Jiang, M.; Zhang, W. Decoupling between Economic Development and Carbon Emissions and Its Driving Factors: Evidence from China. Int. J. Environ. Res. Public Health 2022, 15, 2893. [Google Scholar] [CrossRef]
Figure 1. Study area locations. (a) Location of the study area in China; (b) elevation of the study area; (c) land use distribution map of the study area.
Remotesensing 15 01488 g001
Figure 2. Transfer process of each land use type in Shandong Peninsula urban agglomeration from 2000–2019 (unit: km2).
Remotesensing 15 01488 g002
Figure 3. Area variation in land use type area in 16 cities of Shandong Peninsula urban agglomeration during 2000–2019 (unit: km2).
Remotesensing 15 01488 g003
Figure 4. Spatial divergence of land use transfer. The values 1, 2, 3, 4, 5, 6, and 7 represent cropland, woodland, grassland, wetland, water, construction land, and unused land, respectively. ‘>’ indicates the transition process. (a) From 2000 to 2010; (b) from 2010 to 2019. A, B, C, D, E refers to areas with a greater increase in land use types, namely Yantai, Dongying, Weifang, Zibo and Zaozhuang, respectively.
Remotesensing 15 01488 g004
Figure 5. Carbon emissions of 16 cities in Shandong Peninsula urban agglomeration (unit: 107 kg). (a) Carbon emissions from different land uses in 2000; (b) carbon emissions from different land uses in 2010; (c) carbon emissions from different land uses in 2019; (d) trends in carbon emissions from 2000 to 2019.
Remotesensing 15 01488 g005
Figure 6. Spatial and temporal variation in carbon emissions related to Shandong Peninsula urban agglomeration during 2000–2019. (a) Visualization of land-average carbon emissions during 2000–2019; (b) land-average carbon emissions during 2000–2019; (c) visualization of carbon emissions per capita during 2000–2019; (d) carbon emissions per capita during 2000–2019.
Remotesensing 15 01488 g006
Figure 7. Spatial and temporal variation in land-average carbon emissions from major carbon sources in Shandong Peninsula urban agglomeration from 2000 to 2019 (unit: kg/km2). (a) Land-average carbon emissions from cropland; (b) land-average carbon emissions from construction land.
Remotesensing 15 01488 g007
Figure 8. LISA agglomeration map of carbon emissions in Shandong Peninsula urban agglomeration. (a) Total carbon emissions in 2000; (b) total carbon emissions in 2010; (c) total carbon emissions in 2019; (d) land-average carbon emissions in 2000; (e) land-average carbon emissions in 2010; (f) land-average carbon emissions in 2019; (g) carbon emissions per capita in 2000; (h) carbon emissions per capita in 2010; (i) carbon emissions per capita in 2019.
Remotesensing 15 01488 g008
Figure 9. GDP of cities in urban agglomerations from 2000 to 2019.
Remotesensing 15 01488 g009
Table 1. Direct carbon emissions for various land use types (kg·m−2·a−1) [16].
Land TypeFactor of Carbon Emissions
Cropland0.0422
Woodland−0.0644
Grassland−0.0021
Wetland−0.00006132
Water−0.0253
Unused land−0.0005
Table 2. The conversion factors and carbon emissions factors.
Energy TypeStandard Coal Conversion Factors (kgce·kg−1)Carbon Emissions Factors (kg·kgce−1)
Coal0.71430.7559
Coke0.97140.855
Gasoline1.47140.59
Kerosene1.47140.57
Fuel oil1.42860.62
Note: Carbon emissions factor was collected from IPCC 2006, and the standard coal conversion factor was obtained from the China Energy Statistical Yearbook.
Table 3. Global Moran’s I index of carbon emissions of Shandong Peninsula urban agglomeration.
Moran’s I Index
Carbon EmissionsLand-Average Carbon EmissionsCarbon Emissions per Capita
2000−0.164−0.0520.269
2010−0.037−0.0180.290
2019−0.066−0.0490.289
2000−0.164−0.0520.269
Disclaimer/Publisher’s Note: The statements, opinions and data contained in all publications are solely those of the individual author(s) and contributor(s) and not of MDPI and/or the editor(s). MDPI and/or the editor(s) disclaim responsibility for any injury to people or property resulting from any ideas, methods, instructions or products referred to in the content.

