
Ground Surface Deformation Analysis Integrating InSAR and GPS Data in the Karstic Terrain of Cheria Basin, Algeria
 , , , , , and
Abstract
:1. Introduction
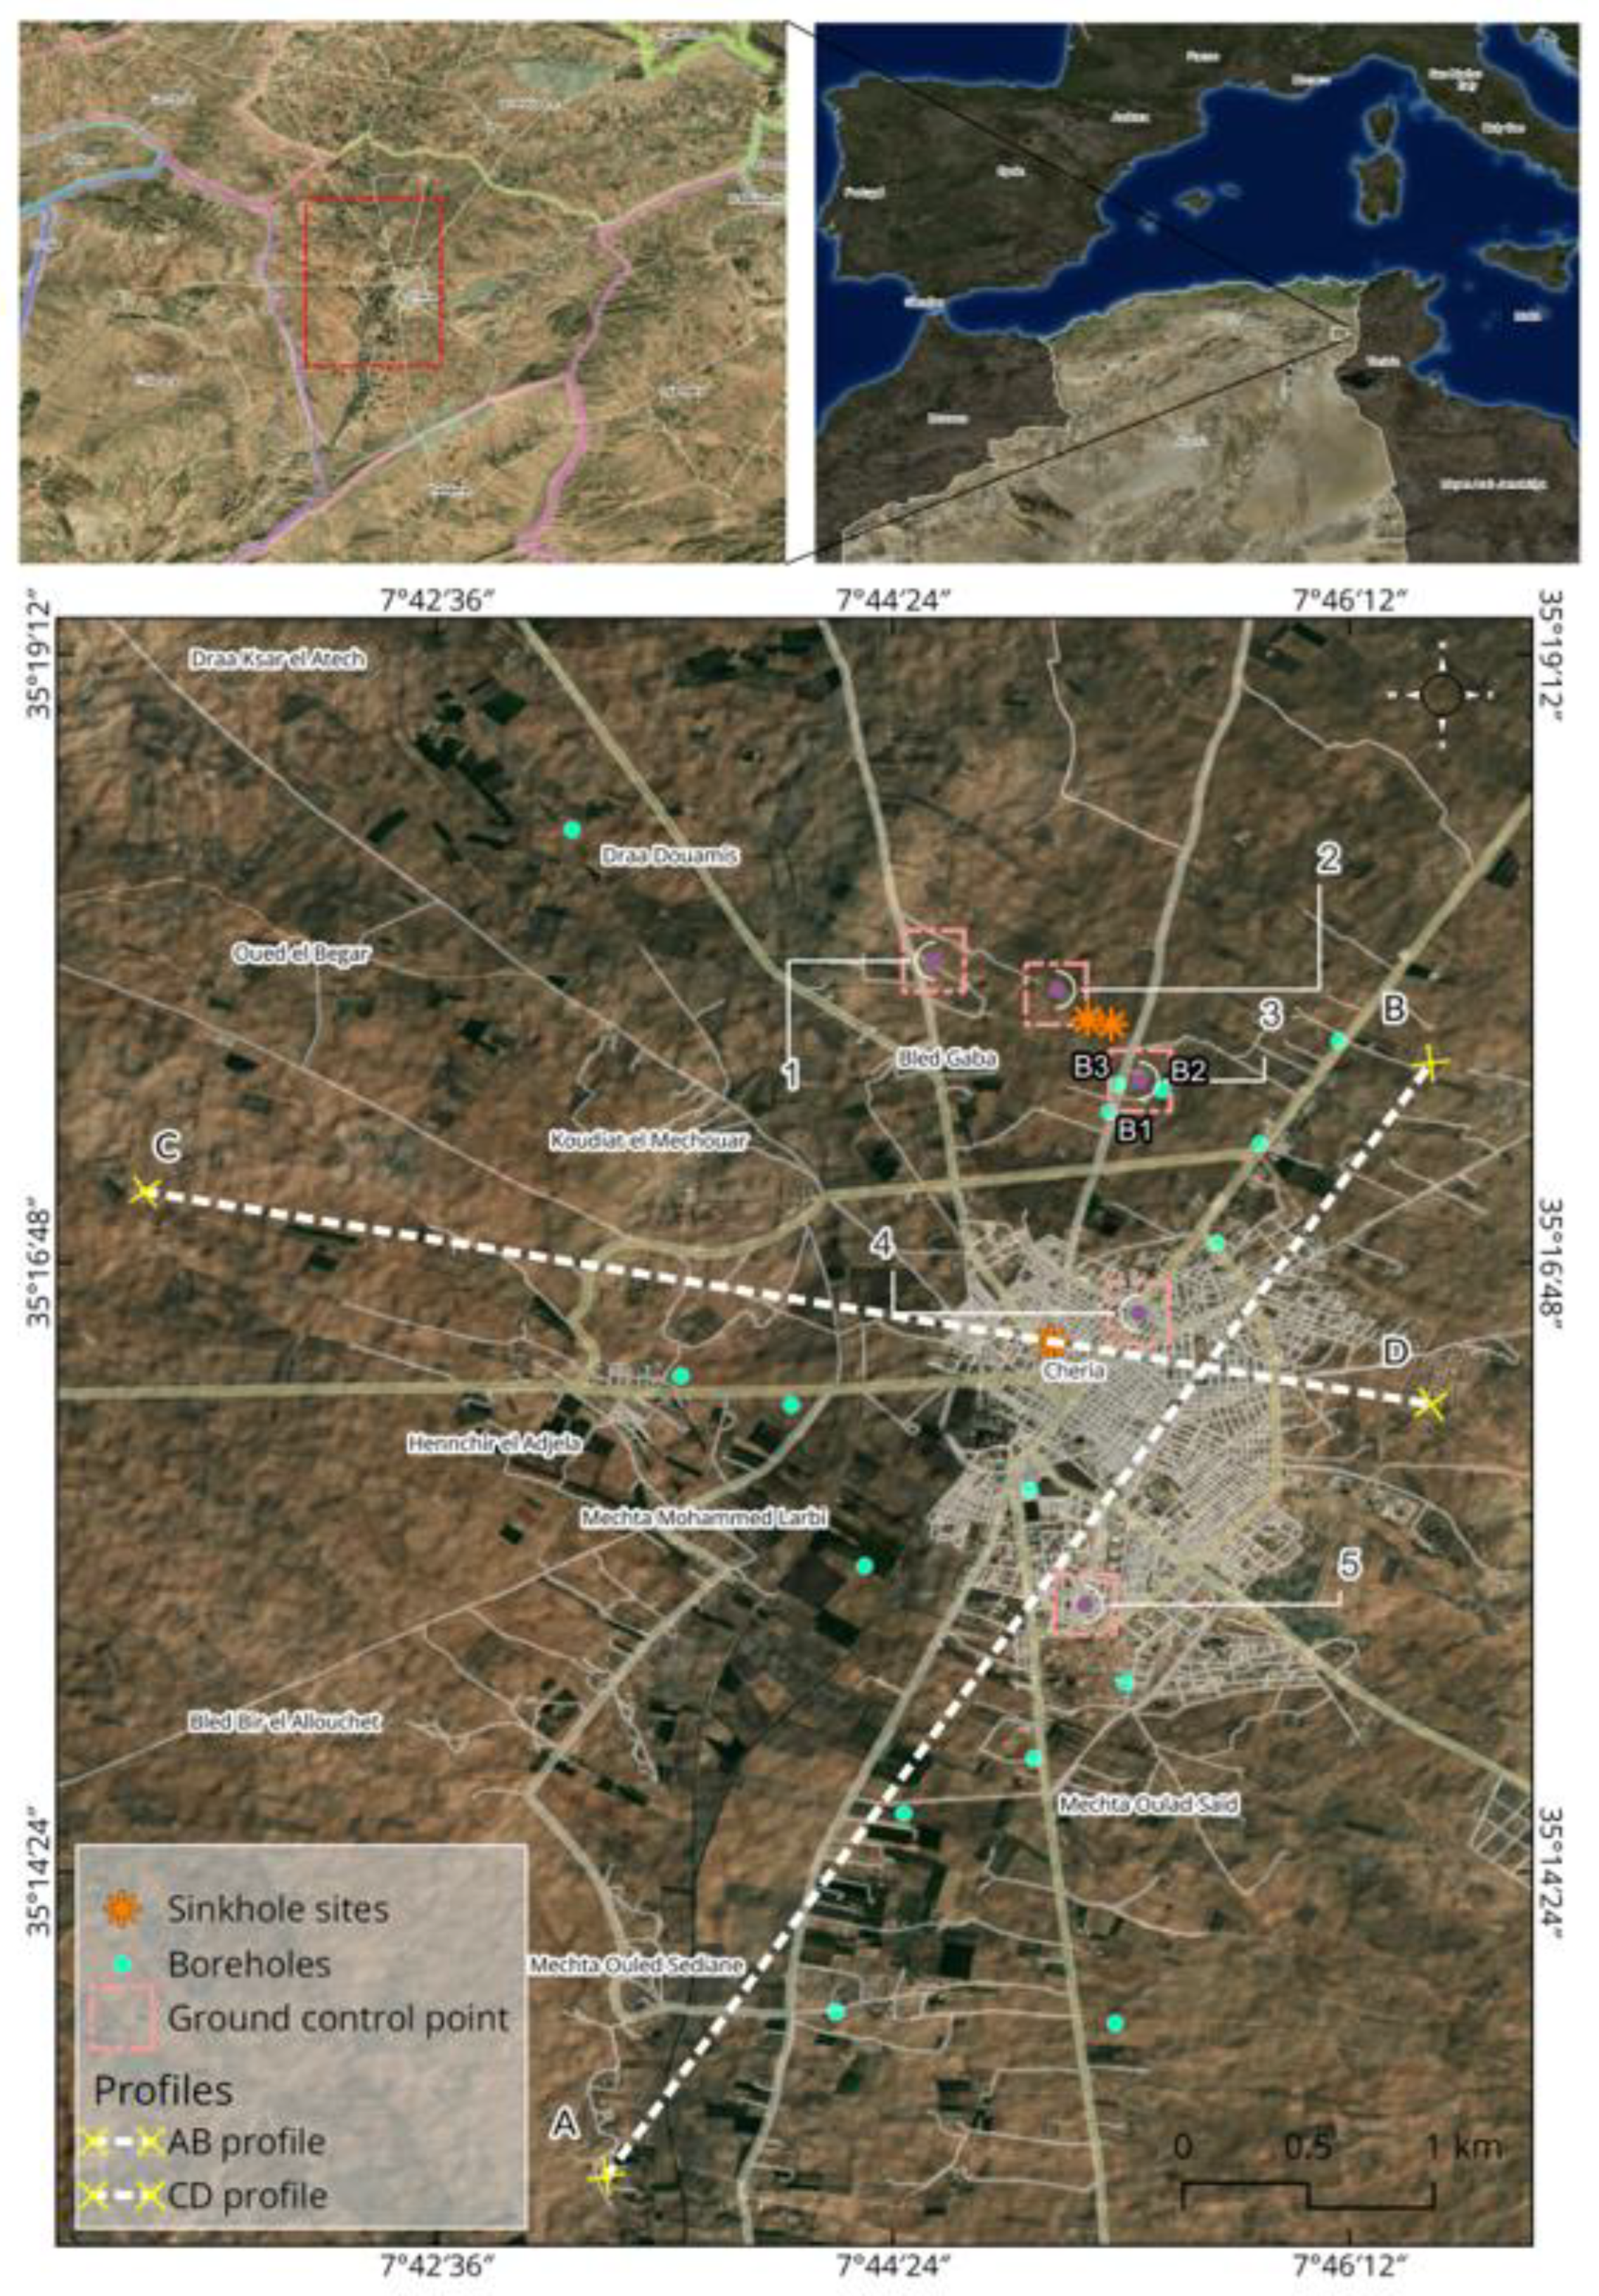
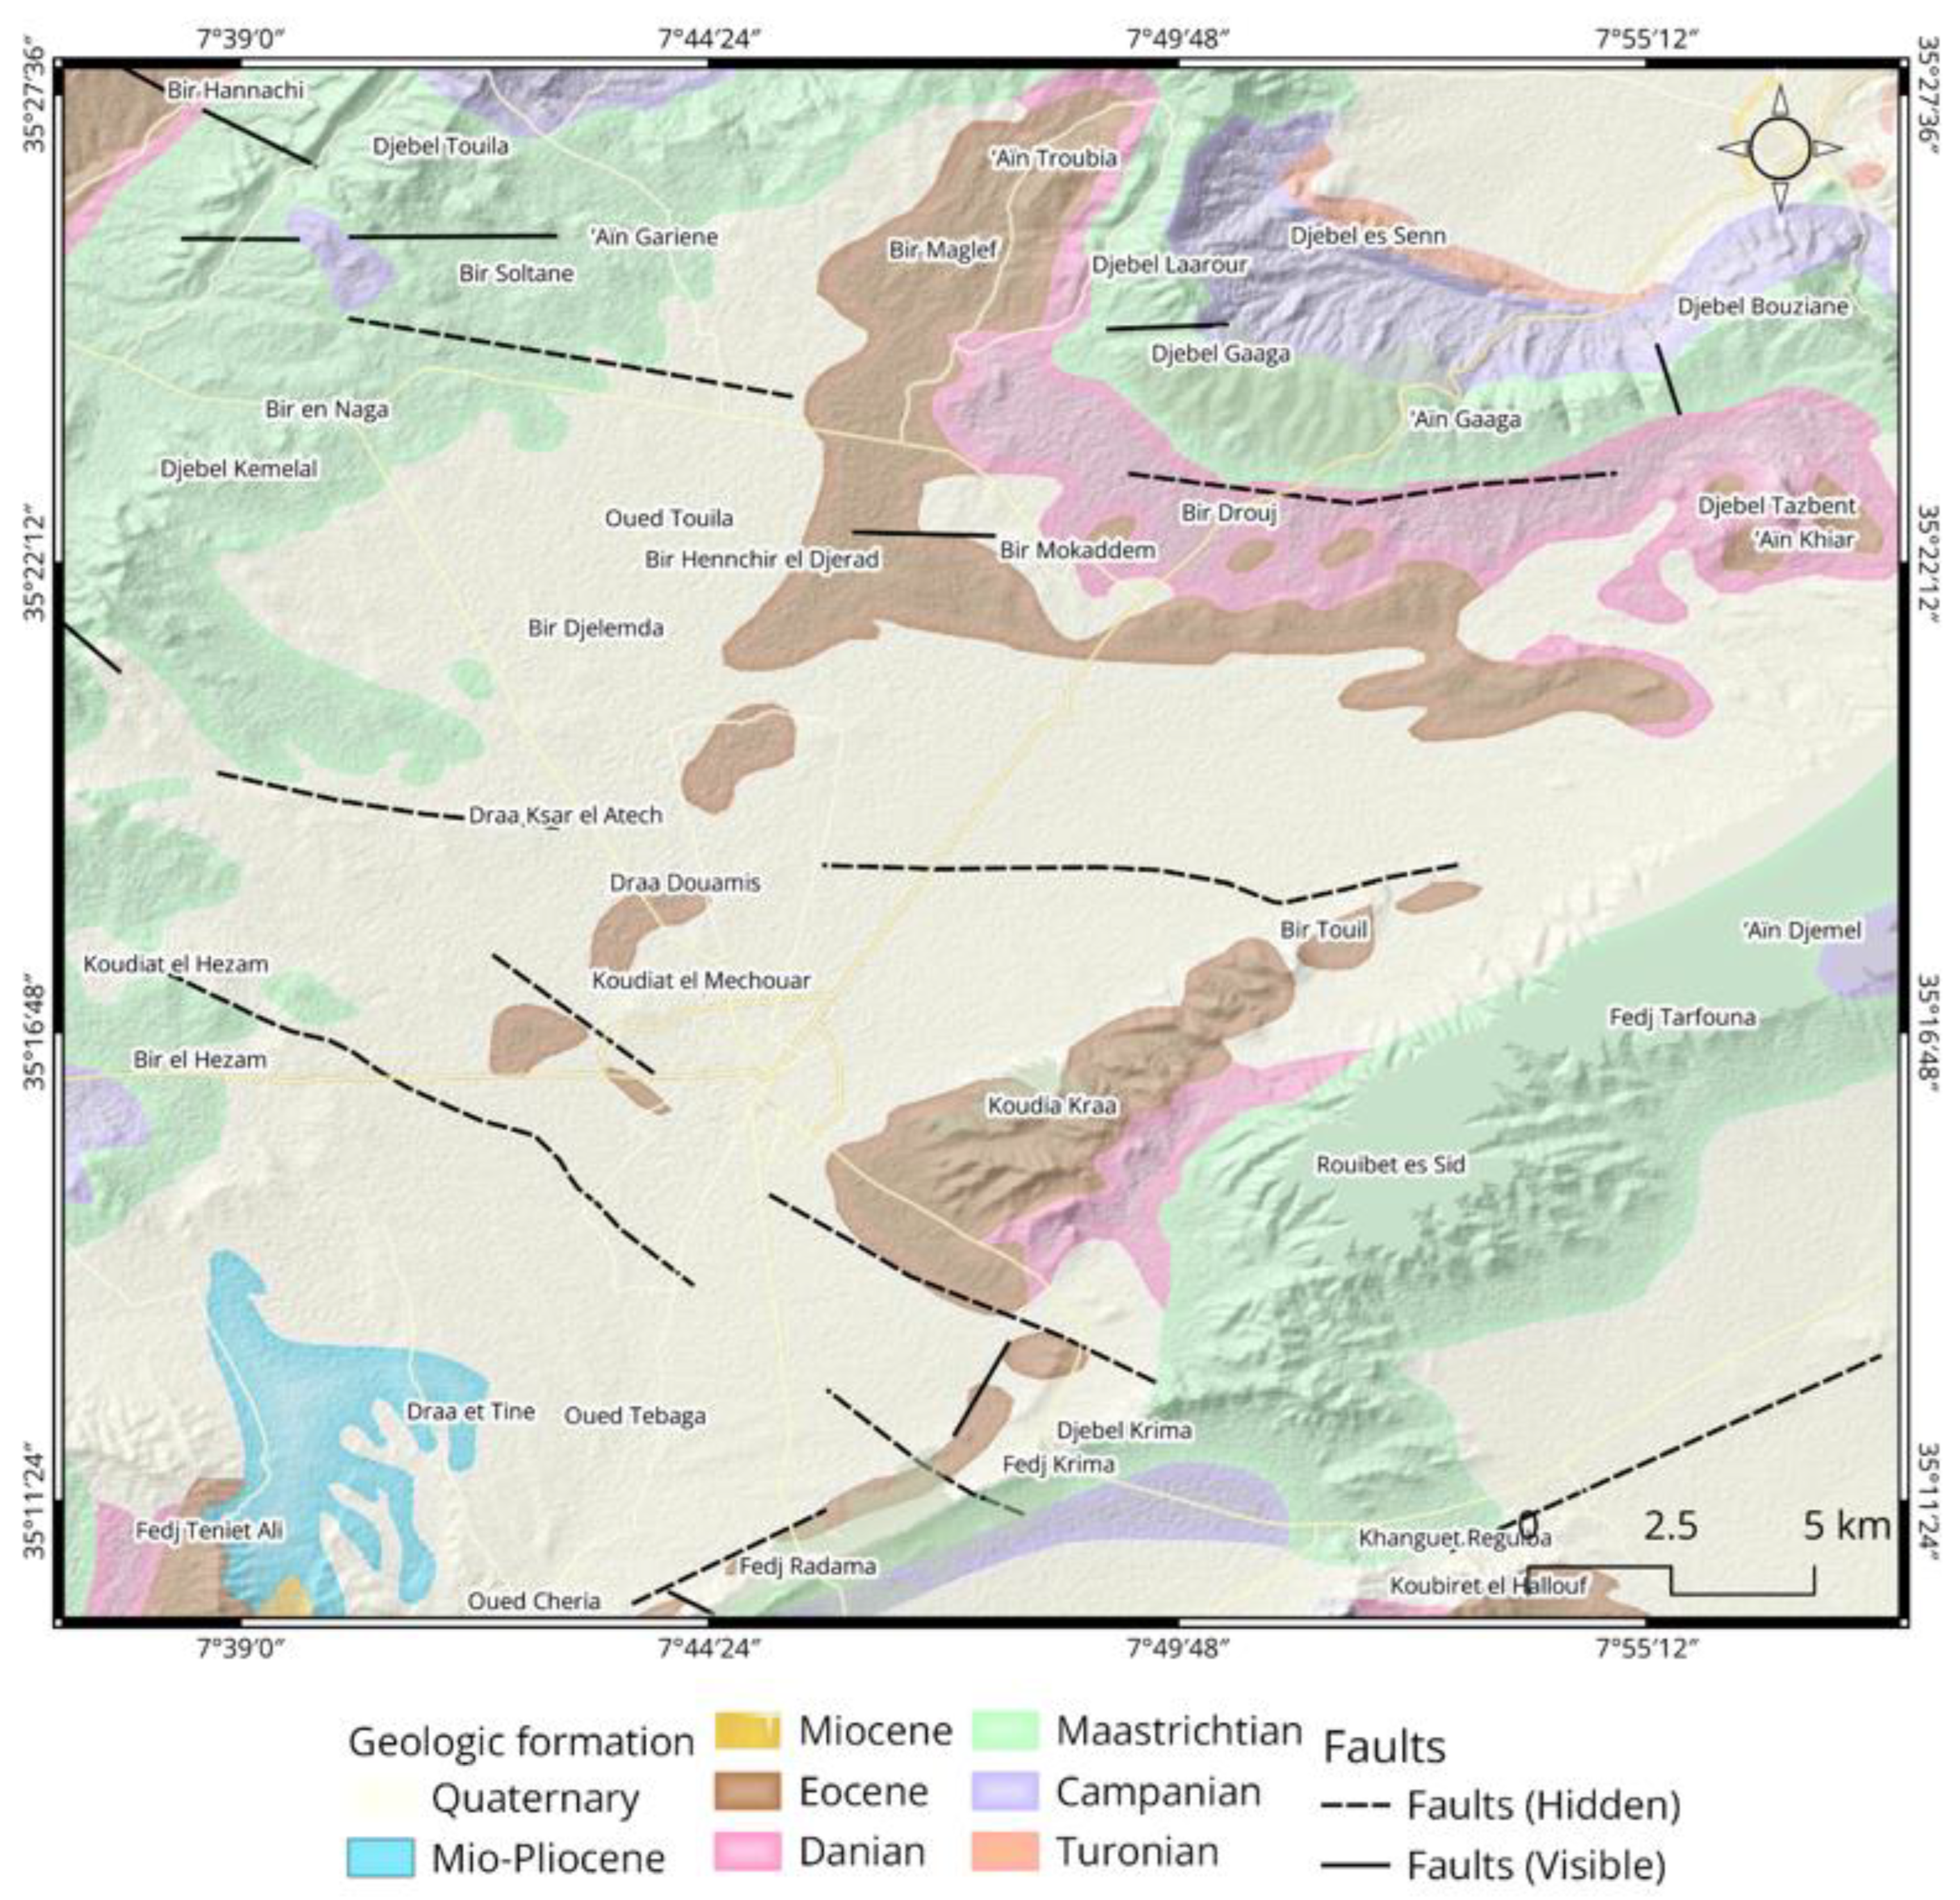
2. Study Area
3. Data and Methods
- In preliminary analysis loading, persistent scatterer (PS) candidate points are selected as pixels with a value of the amplitude dispersion index (ADI) that is smaller than a threshold.
- Estimate phase noise means the atmospheric phase screen (APS) value is contained on each candidate pixel in the interferogram, defined by the spatially correlated phase and uncorrelated terrain errors. For good results, various spatiotemporal filters are used to correct APS and achieve only the deformation part.
- Persistent scatterer points are selected according to the atmospheric phase screen (APS) correction parameter and the percentage of random pixels in a scene per density is estimated by application of a probability statistics method.
- The PSs selected in the previous step are weeded, removing those that are deemed too noisy due to signal contributions from neighboring ground resolution elements.
- The wrapped phase of the selected pixels is corrected for a spatially uncorrelated look angle DEM error.
- Three-dimensional unwrapping of the above-mentioned corrected phase PS result is used; unwrapping errors are more likely to occur in a longer perpendicular baseline interferogram.
- A spatially uncorrelated look angle SCLA error was calculated in step iii and removed in step v; in step vii, a spatial look angle error is calculated which is due almost exclusively to a spatially correlated DEM error (this includes an error in the DEM itself and incorrect mapping of the DEM into radar coordinates). The master atmosphere and orbit error phase are estimated simultaneously.
- Atmospheric filtering and estimation of other spatial correlation error terms are conducted. The results are a data file containing final PS points with a deformation velocity in the precision of mm/year representing the land deformation model of the area of interest [14].
4. Results
5. Discussion
6. Conclusions
Author Contributions
Funding
Data Availability Statement
Acknowledgments
Conflicts of Interest
References
- Oliver, D.M.; Zheng, Y.; Naylor, L.A.; Murtagh, M.; Waldron, S.; Peng, T. How Does Smallholder Farming Practice and Environmental Awareness Vary across Village Communities in the Karst Terrain of Southwest China? Agric. Ecosyst. Environ. 2020, 288, 106715. [Google Scholar] [CrossRef]
- Stevanović, Z.; Stevanović, A.M.; Pekaš, Ž.; Eftimi, R.; Marinović, V. Environmental Flows and Demands for Sustainable Water Use in Protected Karst Areas of the Western Balkans. Carbonates Evaporites 2022, 37, 3. [Google Scholar] [CrossRef]
- Mouici, R.; Baali, F.; Hadji, R.; Boubaya, D.; Audra, P.; Fehdi, C.-É.; Cailhol, D.; Jaillet, S.; Arfib, B. Geophysical, Geotechnical, and Speleologic Assessment for Karst-Sinkhole Collapse Genesis in Cheria Plateau (NE Algeria). Min. Sci. 2017, 24, 59–71. [Google Scholar] [CrossRef]
- Baali, F.; Fehdi, C.; Rouabhia, A.; Mouici, R.; Carlier, E. Hydrochemistry and Isotopic Exploration for a Karstic Aquifer in a Semi-Arid Region: Case of Cheria Plain, Eastern Algeria. Carbonates Evaporites 2015, 30, 99–107. [Google Scholar] [CrossRef]
- Theron, A.; Engelbrecht, J. The Role of Earth Observation, with a Focus on SAR Interferometry, for Sinkhole Hazard Assessment. Remote Sens. 2018, 10, 1506. [Google Scholar] [CrossRef] [Green Version]
- Castellazzi, P.; Arroyo-Domínguez, N.; Martel, R.; Calderhead, A.I.; Normand, J.C.L.; Gárfias, J.; Rivera, A. Land Subsidence in Major Cities of Central Mexico: Interpreting InSAR-Derived Land Subsidence Mapping with Hydrogeological Data. Int. J. Appl. Earth Obs. Geoinf. 2016, 47, 102–111. [Google Scholar] [CrossRef]
- Kuniansky, E.L.; Weary, D.J.; Kaufmann, J.E. The Current Status of Mapping Karst Areas and Availability of Public Sinkhole-Risk Resources in Karst Terrains of the United States. Hydrogeol. J. 2016, 24, 613–624. [Google Scholar] [CrossRef] [Green Version]
- Soldo, B.; Mahmoudi Sivand, S.; Afrasiabian, A.; Đurin, B. Effect of Sinkholes on Groundwater Resources in Arid and Semi-Arid Karst Area in Abarkooh, Iran. Environments 2020, 7, 26. [Google Scholar] [CrossRef] [Green Version]
- Elmahdy, S.I.; Mohamed, M.M.; Ali, T.A.; Abdalla, J.E.-D.; Abouleish, M. Land Subsidence and Sinkholes Susceptibility Mapping and Analysis Using Random Forest and Frequency Ratio Models in Al Ain, UAE. Geocarto Int. 2022, 37, 315–331. [Google Scholar] [CrossRef]
- Orhan, O. Monitoring of Land Subsidence Due to Excessive Groundwater Extraction Using Small Baseline Subset Technique in Konya, Turkey. Environ. Monit. Assess. 2021, 193, 174. [Google Scholar] [CrossRef]
- Parker, A.L.; Filmer, M.S.; Featherstone, W.E. First Results from Sentinel-1A InSAR over Australia: Application to the Perth Basin. Remote Sens. 2017, 9, 299. [Google Scholar] [CrossRef] [Green Version]
- Marbouti, M.; Praks, J.; Antropov, O.; Rinne, E.; Leppäranta, M. A Study of Landfast Ice with Sentinel-1 Repeat-Pass Interferometry over the Baltic Sea. Remote Sens. 2017, 9, 833. [Google Scholar] [CrossRef] [Green Version]
- Ferretti, A.; Prati, C.; Rocca, F. Permanent Scatterers in SAR Interferometry. IEEE Trans. Geosci. Remote Sens. 2001, 39, 13. [Google Scholar] [CrossRef]
- Hooper, A.; Zebker, H.; Segall, P.; Kampes, B. A New Method for Measuring Deformation on Volcanoes and Other Natural Terrains Using InSAR Persistent Scatterers: A NEW PERSISTENT SCATTERERS METHOD. Geophys. Res. Lett. 2004, 31, 110. [Google Scholar] [CrossRef]
- Baali, F.; Rouabhia, A.; Kherici, N.; Djabri, L.; Bouchaou, L.; Hani, A. Underground water quality and contamination risk. The case of the basin of Chéria (NE Algeria). Estud. Geol. 2007, 63, 127–133. [Google Scholar] [CrossRef]
- Fehdi, C.; Nouioua, I.; Belfar, D.; Djabri, L.; Salameh, E. Detection of Underground Cavities by Combining Electrical Resistivity Imaging and Ground Penetrating Radar Surveys: A Case Study from Draa Douamis Area (North East of Algeria). In H2Karst Research in Limestone Hydrogeology; Springer: Berlin/Heidelberg, Germany, 2014; pp. 69–82. [Google Scholar]
- Merghadi, A.; Abderrahmane, B.; Tien Bui, D. Landslide Susceptibility Assessment at Mila Basin (Algeria): A Comparative Assessment of Prediction Capability of Advanced Machine Learning Methods. ISPRS Int. J. Geo-Inf. 2018, 7, 268. [Google Scholar] [CrossRef] [Green Version]
- Wang, X.; Zhang, Q.; Zhao, C.; Qu, F.; Zhang, J. A Novel Method of Generating Deformation Time-Series Using Interferometric Synthetic Aperture Radar and Its Application in Mexico City. Remote Sens. 2018, 10, 1741. [Google Scholar] [CrossRef] [Green Version]
- Luo, W.; Dou, J.; Fu, Y.; Wang, X.; He, Y.; Ma, H.; Wang, R.; Xing, K. A Novel Hybrid LMD–ETS–TCN Approach for Predicting Landslide Displacement Based on GPS Time Series Analysis. Remote Sens. 2022, 15, 229. [Google Scholar] [CrossRef]
- Fiaschi, S.; Di Martire, D.; Tessitore, S.; Achilli, V.; Ahmed, A.; Borgstrom, S.; Calcaterra, D.; Fabris, M.; Ramondini, M.; Serpelloni, E. Monitoring of Land Subsidence in Ravenna Municipality Using Two Different DInSAR Techniques: Comparison and Discussion of the Results. Ecology 2015, 23, 38–50. [Google Scholar]
- Ito, H.; Susaki, J.; Anahara, T. Integrating Multi-Temporal SAR Images and GPS Data to Monitor Three-Dimensional Land Subsidence. ISPRS Ann. Photogramm. Remote Sens. Spat. Inf. Sci. 2019, 4, 9–16. [Google Scholar] [CrossRef] [Green Version]
- Merghadi, A.; Yunus, A.P.; Dou, J.; Whiteley, J.; ThaiPham, B.; Bui, D.T.; Avtar, R.; Abderrahmane, B. Machine Learning Methods for Landslide Susceptibility Studies: A Comparative Overview of Algorithm Performance. Earth-Sci. Rev. 2020, 207, 103225. [Google Scholar] [CrossRef]
- Dou, J.; Yunus, A.P.; Merghadi, A.; Wang, X.; Yamagishi, H. A Comparative Study of Deep Learning and Conventional Neural Network for Evaluating Landslide Susceptibility Using Landslide Initiation Zones. In Understanding and Reducing Landslide Disaster Risk; Guzzetti, F., Mihalić Arbanas, S., Reichenbach, P., Sassa, K., Bobrowsky, P.T., Takara, K., Eds.; Springer: Cham, Switzerland, 2021; pp. 215–223. ISBN 978-3-030-60226-0. [Google Scholar]
- Dou, J.; Yunus, A.P.; Tien Bui, D.; Sahana, M.; Chen, C.-W.; Zhu, Z.; Wang, W.; Pham, B.T. Evaluating GIS-Based Multiple Statistical Models and Data Mining for Earthquake and Rainfall-Induced Landslide Susceptibility Using the LiDAR DEM. Remote Sens. 2019, 11, 638. [Google Scholar] [CrossRef] [Green Version]
- Hamdi, L.; Defaflia, N.; Fehdi, C.; Merghadi, A. InSAR Investigation on DRAA-Douamis Sinkholes in Cheria Northeastern of Algeria. In Proceedings of the IGARSS 2020-2020 IEEE International Geoscience and Remote Sensing Symposium, Waikoloa, HI, USA, 26 September–2 October 2020; IEEE: Piscataway, NJ, USA, 2020; pp. 1034–1037. [Google Scholar]
- Braitenberg, C.; Pivetta, T.; Barbolla, D.F.; Gabrovšek, F.; Devoti, R.; Nagy, I. Terrain Uplift Due to Natural Hydrologic Overpressure in Karstic Conduits. Sci. Rep. 2019, 9, 3934. [Google Scholar] [CrossRef] [Green Version]
- Borsa, A.A.; Agnew, D.C.; Cayan, D.R. Ongoing Drought-Induced Uplift in the Western United States. Science 2014, 345, 1587–1590. [Google Scholar] [CrossRef] [PubMed]
- Barbour, A.J.; Wyatt, F.K. Modeling Strain and Pore Pressure Associated with Fluid Extraction: The Pathfinder Ranch Experiment: BARBOUR AND WYATT. J. Geophys. Res. Solid Earth 2014, 119, 5254–5273. [Google Scholar] [CrossRef]
- Schmidt, D.A.; Bürgmann, R. Time-Dependent Land Uplift and Subsidence in the Santa Clara Valley, California, from a Large Interferometric Synthetic Aperture Radar Data Set: SANTA CLARA VALLEY INSAR TIME SERIES. J. Geophys. Res. Solid Earth 2003, 108, B9. [Google Scholar] [CrossRef] [Green Version]
- Huang, J.; Ji, M.; Xie, Y.; Wang, S.; He, Y.; Ran, J. Global Semi-Arid Climate Change over Last 60 Years. Clim. Dyn. 2016, 46, 1131–1150. [Google Scholar] [CrossRef] [Green Version]
- Kottek, M.; Grieser, J.; Beck, C.; Rudolf, B.; Rubel, F. World Map of the Köppen-Geiger Climate Classification Updated. Meteorol. Z. 2006, 15, 259–263. [Google Scholar] [CrossRef]
- Dai, A. Increasing Drought under Global Warming in Observations and Models. Nat. Clim. Chang. 2013, 3, 52–58. [Google Scholar] [CrossRef]
- Yuan, D.; Zhang, L.; Yan, R.; Wu, L.; Feng, Y.; Feng, L. Application of Optimized Grey-Markov Model to Land Subsidence Monitoring with InSAR. IEEE Access 2022, 10, 96720–96730. [Google Scholar] [CrossRef]
- Yan, H.; Dai, W.; Liu, H.; Gao, H.; Neely, W.R.; Xu, W. Fusion of Spatially Heterogeneous GNSS and InSAR Deformation Data Using a Multiresolution Segmentation Algorithm and Its Application in the Inversion of Slip Distribution. Remote Sens. 2022, 14, 3293. [Google Scholar] [CrossRef]
- Struhár, J.; Rapant, P.; Kačmařík, M.; Hlaváčová, I.; Lazecký, M. Monitoring Non-Linear Ground Motion above Underground Gas Storage Using GNSS and PSInSAR Based on Sentinel-1 Data. Remote Sens. 2022, 14, 4898. [Google Scholar] [CrossRef]
- Ren, H.; Feng, X. Calculating Vertical Deformation Using a Single InSAR Pair Based on Singular Value Decomposition in Mining Areas. Int. J. Appl. Earth Obs. Geoinf. 2020, 92, 102115. [Google Scholar] [CrossRef]
- Ji, P.; Lv, X.; Wang, R. Deriving 3-D Surface Deformation Time Series with Strain Model and Kalman Filter from GNSS and InSAR Data. Remote Sens. 2022, 14, 2816. [Google Scholar] [CrossRef]
- Umarhadi, D.A.; Widyatmanti, W.; Kumar, P.; Yunus, A.P.; Khedher, K.M.; Kharrazi, A.; Avtar, R. Tropical Peat Subsidence Rates Are Related to Decadal LULC Changes: Insights from InSAR Analysis. Sci. Total Environ. 2022, 816, 151561. [Google Scholar] [CrossRef]
- Umarhadi, D.A.; Avtar, R.; Widyatmanti, W.; Johnson, B.A.; Yunus, A.P.; Khedher, K.M.; Singh, G. Use of Multifrequency (C-band and L-band) SAR Data to Monitor Peat Subsidence Based on Time-series SBAS InSAR Technique. Land Degrad. Dev. 2021, 32, 4779–4794. [Google Scholar] [CrossRef]
- Beccaro, L.; Tolomei, C.; Gianardi, R.; Sepe, V.; Bisson, M.; Colini, L.; De Ritis, R.; Spinetti, C. Multitemporal and Multisensor InSAR Analysis for Ground Displacement Field Assessment at Ischia Volcanic Island (Italy). Remote Sens. 2021, 13, 4253. [Google Scholar] [CrossRef]


| Satellite | Track | Band | Covered Period | Number of Scenes |
|---|---|---|---|---|
| Sentinel-1A | 161 | C-band | 03 January 2016 to 07 January 2022 | 50 |
| Sentinel-1B | 168 | C-band | 12 October 2016 to 22 October 2021 | 50 |
| Comparison | Movement Direction | RMSE (mm/Year) |
|---|---|---|
| InSAR vs. GPS | Vertical | 2.8374 |
| InSAR vs. GPS | Horizontal | 2.9155 |
Disclaimer/Publisher’s Note: The statements, opinions and data contained in all publications are solely those of the individual author(s) and contributor(s) and not of MDPI and/or the editor(s). MDPI and/or the editor(s) disclaim responsibility for any injury to people or property resulting from any ideas, methods, instructions or products referred to in the content. |
© 2023 by the authors. Licensee MDPI, Basel, Switzerland. This article is an open access article distributed under the terms and conditions of the Creative Commons Attribution (CC BY) license (https://creativecommons.org/licenses/by/4.0/).
Share and Cite
Hamdi, L.; Defaflia, N.; Merghadi, A.; Fehdi, C.; Yunus, A.P.; Dou, J.; Pham, Q.B.; Abdo, H.G.; Almohamad, H.; Al-Mutiry, M. Ground Surface Deformation Analysis Integrating InSAR and GPS Data in the Karstic Terrain of Cheria Basin, Algeria. Remote Sens. 2023, 15, 1486. https://doi.org/10.3390/rs15061486
Hamdi L, Defaflia N, Merghadi A, Fehdi C, Yunus AP, Dou J, Pham QB, Abdo HG, Almohamad H, Al-Mutiry M. Ground Surface Deformation Analysis Integrating InSAR and GPS Data in the Karstic Terrain of Cheria Basin, Algeria. Remote Sensing. 2023; 15(6):1486. https://doi.org/10.3390/rs15061486
Chicago/Turabian StyleHamdi, Loubna, Nabil Defaflia, Abdelaziz Merghadi, Chamssedine Fehdi, Ali P. Yunus, Jie Dou, Quoc Bao Pham, Hazem Ghassan Abdo, Hussein Almohamad, and Motrih Al-Mutiry. 2023. "Ground Surface Deformation Analysis Integrating InSAR and GPS Data in the Karstic Terrain of Cheria Basin, Algeria" Remote Sensing 15, no. 6: 1486. https://doi.org/10.3390/rs15061486