Article

Satellite-Based Ocean Color and Thermal Signatures Defining Habitat Hotspots and the Movement Pattern for Commercial Skipjack Tuna in Indonesia Fisheries Management Area 713, Western Tropical Pacific

1
Faculty of Marine Science and Fisheries, Hasanuddin University, Makassar 90245, Indonesia
2
Faculty of Fisheries and Marine Science, IPB University, Bogor 16680, Indonesia
3
Fisheries Agribusiness, National Agricultural Polytechnic, Pangkep 90655, Indonesia
4
Faculty of Fisheries and Marine Science, Padjadjaran University, Bandung 45363, Indonesia
*
Author to whom correspondence should be addressed.
Remote Sens. 2023, 15(5), 1268; https://doi.org/10.3390/rs15051268
Submission received: 9 January 2023 / Revised: 15 February 2023 / Accepted: 21 February 2023 / Published: 25 February 2023

Abstract

:
Understanding the mechanisms that determine the critical habitat of commercial species is one of the significant challenges in marine science, particularly for species that inhabit the vast ocean worldwide. Previous investigations primarily focused on determining skipjack habitats without considering the feasible size for sustainable fisheries. To define habitat hotspots and movement patterns for decently sized skipjack tuna (≥50 cm) in Indonesia Fisheries Management Area (IFMA) 713, Indonesia, we examined the remote sensing of synoptic sea surface temperature (SST) and chlorophyll-a concentration (Chl-a) measurements with catch data from 2007 to 2016. A new skipjack tuna habitat model was developed based on the link between the key satellite-based environmental data and the best tuna fishery performance using a combination of generalized additive models (GAMs) and kernel density estimates. The findings reveal that feasible skipjack catch sizes were found in approximately 27% of total fishing grounds and were significantly captured in areas with a Chl-a of 0.15–0.28 mg m−3 and an SST of 29.5–31.0 °C, corresponding with an elevated skipjack habitat index (SHI). The habitat hotspots for the commercial skipjack were particularly produced by favorable Chl-a and SST, in association with Chl-a front and anticyclonic and cyclonic eddies, especially in October, which coincided with the highest skipjack catch per unit effort (CPUE). Skipjack distributions were mostly found within 10 km of favorable feeding habitats. They used the hotspot area as an indicator of their dynamics and movement pattern in the environment. The observed CPUEs cross-validated the predicted SHI values, suggesting that the model provided a reliable proxy for defining the potential habitats and the spatial movement of mature skipjack schools. Our findings have global significance for locating ecological hotspots, monitoring sustainable skipjack fisheries, and tracking skipjack migration, especially within the western tropical Pacific.

1. Introduction

Mature skipjack tuna is one of the marine resources with the highest commercial and ecological value. It may be found in all tropical and subtropical regions, but it is most prevalent in equatorial water [1,2]. Skipjack catches have consistently increased over the last decade globally [3], especially in the Western Central Pacific Ocean (WCPO) [4]. The species provided approximately 57% of the total weight of the world’s tuna catch in recent years [2], making it the third most fished species worldwide [3]. This species accounted for about 64% of the total tuna catch in the WCPO [4], and the WCPO skipjack stock, which accounts for 35% of global tuna landings, supports the greatest tuna fishery in the world [2]. Surface fishing gear, such as purse seine and pole and line, is almost exclusively used to catch skipjack tuna [2,5]. Around 17.5% of the world’s tuna, including skipjack, was captured in Indonesian fishing grounds in 2017, making it the primary seafood commodity [6]. Indonesian skipjack accounted for over 16% of all skipjack tuna caught in the WCPO in 2018 [7]. Indonesia Fisheries Management Area (IFMA) 713 provides the second largest contribution to fish production in Indonesia among all fishery management areas, with the catch dominated by pelagic fish, particularly tuna [8]. Specifically, IFMAs 713, 714, and 715 provide the majority (about 76% in 2018) of Indonesia’s skipjack tuna catch in the WCPO [9].
Various studies have found a strong correlation between skipjack tuna distribution and abundance and environmental factors influencing their spatial movements [10,11,12,13]. The fish travel quickly and follow highly productive areas through their habitat environment in their search for food, requiring correspondingly large energy returns. This system has resulted in morphological and physiological adaptations, mainly in terms of thermoregulation and oxygen extraction efficiency [14]. As a result, ambient temperature and dissolved oxygen concentration, as well as water clarity, are thought to have a strong influence on tuna behavior [15,16]. This requirement for continuous swimming is compatible with skipjack’s highly migratory behavior and the widespread distribution of tropical and subtropical oceans coinciding with ideal feeding, nursery, and spawning sites [10,12,17,18,19,20]. Skipjack have been seen moving over a wide area in search of a high density of tuna forage [21]. Therefore, surface tuna habitats may include water masses with the proper temperature, high enough oxygen concentration, significant forage biomass, and clear water [14].
The availability of skipjack tuna in space and time varies significantly worldwide due to the dynamics of oceanographic conditions [21]. Consequently, attempts have been undertaken to improve tuna harvesting by looking for places with an elevated density of tuna (key habitats), which are typically related to (a) forage abundance [11,22], (b) migration patterns [10,18], and (c) specific environmental conditions [16,18,23]. Skipjack forage mainly consists of small pelagic fishes, crustaceans, cephalopods (squid), and mollusks [24,25,26]. In the Malaka Strait, a part of the western Coral Triangle, anchovies (Stolephorus spp.) make up more than 80% of the skipjack’s stomach contents [27]. Skipjack tuna are carnivores in the Flores Sea and its adjacent waters (Bone Gulf and Banda Sea), with Sardinella spp., accounting for 57%, followed by Stelophorus spp. (34.7%), Decapterus spp. (7.9%), and Loligo spp. And crustacea [28].
The primary environmental factor that has been used to explain the presence and abundance of skipjack tuna is temperature [12,29]. SST outlines the characteristics of tuna-like animals’ ideal habitats in several oceans [30]. The species inhabit warm water in the upper mixed layer (upper 200 m) [21,31,32], where they can dive to around 260 m during the day but are confined to near-surface waters at night [33]. Skipjack males reach maturity at 42–43 cm fork length, compared to 41–42 cm for females [34]. Adults have a temperature range of 14.7 to 30 °C [16,33], while 20.0 to 29.0 °C is the most frequently observed habitat temperature [21]. The 29 °C SST isotherm distribution can be used to identify the western Pacific Ocean’s frontal salinity area, where skipjack CPUEs are at their highest [10]. In waters with an SST of 22–26.5 °C, the highest skipjack CPUEs off the southern Brazilian coast are recorded [35]. However, this relationship varies seasonally [35], and skipjack abundance in that area is likely influenced by thermal fronts [36]. The Western North Pacific Ocean’s optimal SST for skipjack tuna is between 20.5 and 26.0 °C [12], with a lower SST limit of 18 °C [12,18]. Mature individuals are typically found in the Western North Pacific Ocean at an SST greater than 24 °C [37]. The preferred SST range is identified as being from 29.5 to 31.5 °C in the eastern IFMA 713, Indonesia [13], from 21.6 to 30.0 °C in the Indian Ocean and the Atlantic Ocean [38,39], and warmer than 29.6 °C, with the strongest SST front in the WCPO [29].
Although the SST is essential, other important factors, such as chlorophyll concentration and mesoscale ocean variability, may impact forage distribution and, thus, apex predator distribution. Chlorophyll density is a good predictor of albacore tuna habitat [40,41,42] and mesoscale variabilities, such as fronts and eddies, which affect albacore tuna abundance [41,42,43,44]. Skipjack tuna productivity in Papua’s northern region, Indonesia, strongly correlates with the Halmahera Eddy meridional shift, where CPUE increases significantly with a delay of 2 months after the center of the Halmahera Eddy shifts to the north [45]. Skipjack distribution in the Makassar Strait is sensitive to chlorophyll-a concentration [46]. SST and Chl-a may interact to significantly form suitable skipjack tuna habitats [12,13,39]. As a result, the biophysical environmental signatures with powerful trophic links are key indicators of skipjack tuna habitats. Satellite remote sensing enables the simple monitoring of signatures with varying spatial and temporal resolutions, which is extremely useful for modeling tuna habitat structures by developing a reliable model.
To benefit from understanding how important the effects of the key environmental parameters are in defining commercial skipjack habitat hotspots, we developed a model by integrating the generalized additive model (GAM) and kernel density estimates (KDE). The GAM is the primary tool for investigating the functional interactions between skipjack tuna and two well-known predictors of remotely sensed oceanographic data because the method allows for a very wide range of forms and does not require any assumptions about the shape of the functions [12,47]. One of GAM’s strongest points is its ability to handle substantially non-linear and non-monotonic correlations between the response and the series of explanatory factors [40,47]. Because of this, it is perfect for describing underlying relationships to progress species habitat studies [30]. To forecast the abundance of a species or the chance that it will occupy a specific environment, GAM can be used to find the best environmental conditions for a commercial species using oceanographic variables such as SST and Chl-a [12,40,48,49]. Compared to other prediction models based on environmental factors, GAMs have frequently performed better [50,51]. Interpolating species distributions in coarsely sampled areas with various spatial–temporal resolutions is frequently performed using the results of these models [12,40,52].
The kernel density estimator (KDE) is a term used to describe a group of methods for the non-parametric estimation of density functions that are data-driven [53]. It is an efficient approach for generating an empirical distribution density function from a population sample. A crucially important technique for estimating the probability density function is kernel density estimation, which allows the user to assess the researched probability distribution more effectively than using a conventional histogram. The kernel technique, as opposed to the histogram, generates a smooth estimate of the pdf, employs the positions of all sample points, and more convincingly suggests multimodality [54].
Numerous studies have provided in-depth descriptions of the habitat of skipjack tuna by demonstrating the significance of surface temperature, chlorophyll-a concentration, current velocity and direction, surface salinity, and other environmental characteristics [10,13,29,36,39,55]. All of these studies indicated specific oceanographic features that define skipjack tuna habitat hotspots. However, most of these investigations focused on analyzing skipjack tuna habitats for all sizes without considering skipjack with a commercially feasible size (mature) for the purposes of developing sustainable fishery management. In the Bone Gulf and Flores Sea, it has been found that more than 60% of skipjack catches are not of a feasible (eligible) size using various types of fishing gear [56,57]; therefore, this fact does not support environmentally friendly fishing. Using the key environmental parameters as an important step, the present paper aims to define commercial skipjack tuna habitat hotspots and assess the fish’s movement pattern in Indonesia Fisheries Management Area (IFMA) 713, western tropical Pacific, Indonesia, using remote sensing and fishery data.

2. Materials and Methods
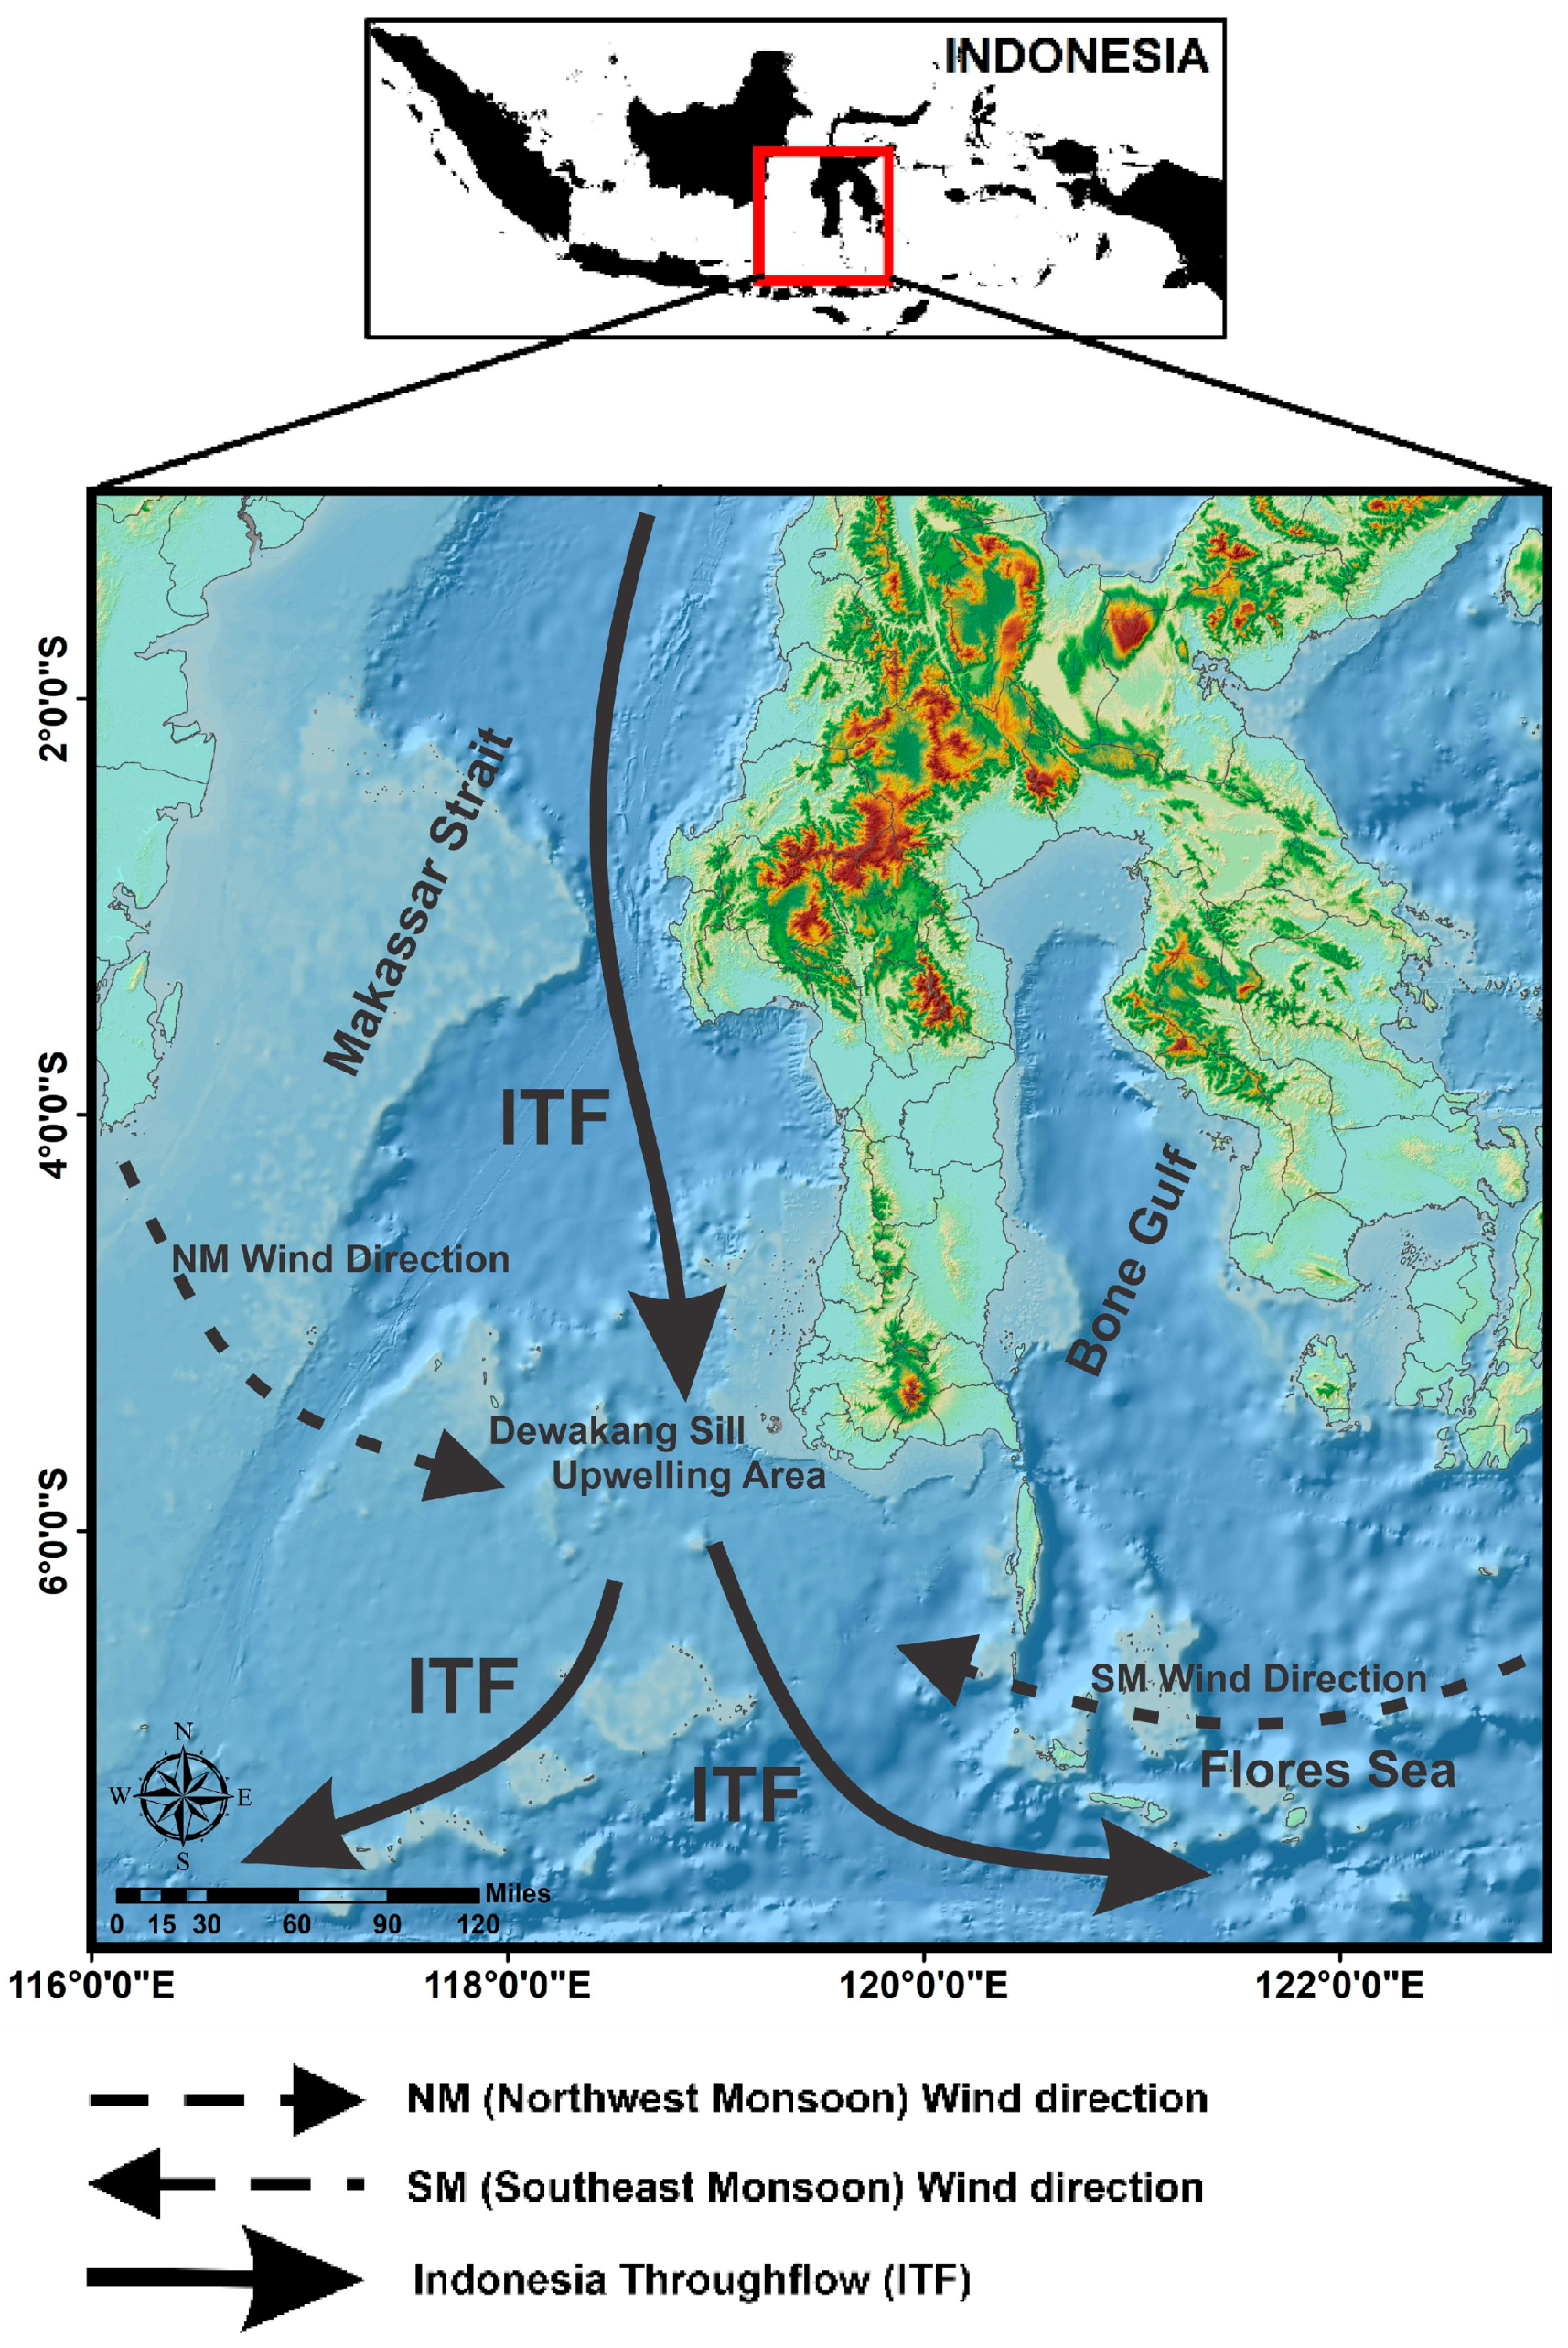
2.1. Study Area

Indonesia Fisheries Management Area (IFMA) 713, which is located in the central Indonesian Sea (western Coral Triangle area), is mostly covered by this study’s area of interest (1°S–8°S and 116°E–123°E) (Figure 1). The Makassar Strait, Bone Gulf, Flores Sea, and Bali Sea are the four principal areas that make up IFMA 713, which are recognized as significant skipjack fishing locations in Indonesia. One of the important routes for the Indonesian throughflow is between the Makassar Strait and the Flores Sea (ITF). As a result of the Asian–Australian wind systems, which alter the wind direction with the seasons, i.e., the southeast monsoon and northwest monsoon, it is significantly influenced by a tropical monsoon climate [58]. The southeast monsoon mainly occurs from June to August and is related to a relatively increased Chl-a concentration, low surface temperature (about 28–30 °C), relatively high salinity, westward current, wind speed, and directions [58,59]. Meanwhile, the northwest monsoon takes place from December to February, signified by relatively low Chl-a and surface salinity, high SST (>30 °C), and eastward current and wind directions [58,60]. The interaction between the ITF and the Asian monsoon affects the specific current circulation system, tidal mixing, Ekman mass, heat transport, wind-induced upwelling and downwelling process, and the environmental variability of SST and Chl-a density [58,59,60]. The southeast monsoon winds, which completely develop across the southern Makassar Strait between June and August, are primarily responsible for the upwelling process. The ITF in the Makassar Strait has an impact on the upwelling mechanism [58]. The ITF creates an eddy that induces a convergence in its route and divergence in the coastal region, resulting in a recirculation. Due to the complexity of the coastline and seafloor topography, eddies form in the Makassar Strait [61,62]. The dynamics of the biophysical environmental features in this area have resulted in the high productivity of this surface habitat hotspot, which provides foraging habitat for various pelagic species, notably tuna, that are both commercially and environmentally valuable [13,63].

2.2. Skipjack Fishery Data

Purse seine (standardized fishing effort with the highest fishing power index) and pole and line fisheries, which cover a range of 116°E–123°E and 1°S–8°S, catch skipjack tuna most of the year. These forms of fishing equipment are the most dominant used to catch skipjack in IFMA 713, central Indonesian Sea. The purse seine and pole and line fishing logbooks from which the fishery catch information was gathered were provided by the Indonesian Government Incorporated Company, Kendari Ocean Fishery Port, Southeast Sulawesi, the Ministry of Marine Affairs and Fisheries Republic of Indonesia, Fish Landing Sites under Marine Affairs and Fisheries, South Sulawesi, and the Faculty of Marine Science and Fisheries (FIKP), Hasanuddin University, fishing survey during both the northwest and southeast monsoons from 2007 to 2016.
The skipjack catch per unit effort (CPUE) was computed as the number of skipjack tuna per trip from daily georeferenced fishing positions (latitude and longitude), the number of skipjack in the catch, and effort (fishing set). The CPUE data were then compiled into datasets with a monthly resolution. The skipjack fork length data (ranging from 18 cm to 79 cm) were collected from the fishing surveys by the Hasanuddin University research teams and students (about 20% of fish samples in each fishing set). The data were also obtained and complemented from enumerators of the fish landing sites (more than 50% of fish samples from each fishing trip) that covered the study area (Makassar Strait, Flores Sea, and Bone Gulf). This paper investigated the habitat hotspot for mature skipjack tuna with a fork length ≥50 cm. Fork length (FL) at 50% maturity was estimated to be 47.9 cm in the tropical region of the WCPO [64], while the skipjack FL at first maturity in the Bone Gulf, Indonesia, is about 46.5 cm [65]. Therefore, to consider the sustainability of skipjack fishing, this paper investigated the habitat hotspot for commercial mature skipjack tuna with a fork length ≥ 50 cm. A total of 333 fishing grounds were sampled for commercial skipjack in the research area. The movement patterns of skipjack tuna schools were explored using the fishing data from July to November of 2017. The catch data were collected from up to 116 sampling fishing locations during scientific purse seine fishing surveys in the research area during the peak seasons of 2017 and 2018 to validate our model.

2.3. Remotely Sensed Oceanographic Data

We used sea surface Chl-a and SST as the primary bio-physical oceanographic variables to characterize the skipjack tuna habitat hotspots near the fishing grounds (Table 1). Aqua/MODIS (Moderate Resolution Imaging Spectroradiometer) Ocean Color Level-3 Standard Mapped Image Products were used to estimate the sea surface Chl-a concentration and SST at all fishing points. The level 3 binary data are made available by NASA in NetCDF format. These datasets were provided by NASA’s Earth Observing System Data and Information System (EOSDIS) with a portal (http://oceancolor.gsfc.nasa.gov, accessed on 1 March 2017). For the 2007–2016 period covered by this investigation, we employed Global Area Coverage (GAC), using the monthly mean images with a spatial footprint of approximately 0.04° × 0.04°. In addition, this paper also used the global geostrophic current velocity and net primary productivity data, especially during the peak season (Table 1). The current velocity data were provided by the Copernicus Global Sea Physical Analysis and Forecast numerical model (https://data.marine.copernicus.aeu/product, accessed on 1 January 2019) at a spatial resolution of approximately 8 km (latitude and longitude) and monthly mean temporal resolution. The products were stored using the NetCDF format. The Oregon State University provided satellite-derived net primary productivity (NPP) data. (http://sites.science.oregonstate.edu/ocean.productivity, accessed on 1 January 2019), as monthly means at 0.083° × 0.083° spatial resolution. The NPP is defined as a function of the vertically generalized production model (VGPM), Chl-a concentrations, SST, and cloud-corrected incident daily photosynthetically active radiation (PAR). We used standard VGPM data with an HDF format. The NPP and current velocity were resampled to match SST and Chl-a resolutions. We processed the satellite and catch data using Interactive Data Language (I.D.L.) 8.5 and R language and mapped all the data using the ArcGIS 10.2 software package (ESRI, Redlands, CA, USA) and Generic Mapping Tools (GMT).

2.4. Model Construction for Predicting Potential Skipjack Habitat

Potential habitat hotspots for mature skipjack were explored using a probability of SHI map constructed from satellite-derived ambient thermal and ocean color measurements. To precisely identify pelagic tuna hotspots, we used the best fishing performance (predicted CPUE and fishing effort frequency) in connection with biophysical oceanographic factors (SST and Chl-a). SST and surface Chl-a concentration are the two leading habitat predictors for tuna distribution and movement in the western North Pacific. [12,40,66]. CPUE was regarded as a proportional indicator of fish abundance [67,68], while fishing effort frequency was considered an index of fish availability [35]. We used generalized additive modeling (GAM) to predict mature skipjack CPUE based on the two predictors describing the environmental fishing grounds. A GAM is a non-parametric generalization of multiple regressions that is less limited in its assumptions of the underpinning statistical data sampling due to the probability of non-linear associations [47]. It is most probable that the natural relationship between CPUE and the skipjack environment is non-linear.
The GAM was constructed in the form:
g ( Log ( CPUE + c ) ) = + S ( SST ) + S ( Chl a )
where g is the link function of the expected value of the dependent variable (CPUE), α is the model constant, and Sn is a smoothing function for each of the model covariates (SST and Chl-a). We used a logarithmic transformation of CPUEs to normalize the asymmetrical distribution [40]. Before log transformation, a constant factor (c) was applied to allow for zero CPUEs [40].
The mgcv package’s gam function was used to build GAMs in R Studio [69], with CPUE as the response measurement and SST and Chl-a as predictor variables. The significance of the predictor terms and increasing cumulative deviance explained (CDE) were used to identify the model performance [12,70]. The predict.gam function could predict skipjack tuna CPUEs using constructed GAMs based on a set of covariates identical to those used to build the model [12,70]. From the model output, we constructed histograms to analyze the link between predicted CPUE and the oceanographic factors. Then, we plotted the probability density function using the “ndensity” function from the kernel density estimate (KDE) in R language on the histograms of SST and Chl-a. The kernel density estimator takes advantage of the positions of each sample point, which improves its ability to extract information from the sample. It is a smooth curve, which better shows the pdf’s details and may, in some situations, imply non-unimodality [54]. We generated the probability distribution of the skipjack habitat hotspot index (SHI) using the predicted CPUE model in connection with Chl-a (Figure S1) and SST (Figure S2) and the probability distribution of KDE in R Studio (Version 3.5.3). The probability of SHI was calculated from the histograms of both GAM-predicted CPUE and the probability of fishing density KDE. Then, we used the automatic processing algorithm through the IDL (Interactive Data Language) software package to generate the spatial and temporal pattern of SHI probabilities (potential habitat hotspots) in the study area.

2.5. Movement Pattern of Skipjack Tuna Fishing Ground

The movement of mature skipjack schools was studied using 5 months of the dataset from July to November 2017. This period covers the southern movement of high tuna concentrations in the peak season in the Makassar Strait. We used the monthly SHI during this period to track the spatial movement pattern of the skipjack tuna fishing ground. After that, we compared the actual fishing ground movements with the dynamics of an SHI probability of ≥0.75 (Quartile 3) based on the analysis of the GAM-KDE model during the period. Using Kappa statistics, the accuracy of the possible predicted habitat maps was tested [71]. A total of 170 independent pieces of fishing data were used for this analysis to verify the forecasting model’s accuracy level.

2.6. Mapping and Validating Potential Skipjack Tuna Habitat

The predicted skipjack habitat index (SHI) and a couple of oceanographic factors, including contour SST, Chl-a, current direction, and net primary production, were mapped using Generic Mapping Tools/GMT 4.5.18 [72]. Then, these maps were overlain and compared with independently observed CPUEs throughout the peak seasons of 2017 and 2018. The distribution of movement of skipjack through the habitat hotspot from July to November was also examined. Furthermore, we tested the degree of agreement between the distributions of fishing sites and habitat hotspots using the Kappa statistics. We also investigated the correlation between the total observed skipjack CPUEs and the probability index (SHI) using a nonlinear model to evaluate our model’s accuracy for the period 2007–2016.

3. Results

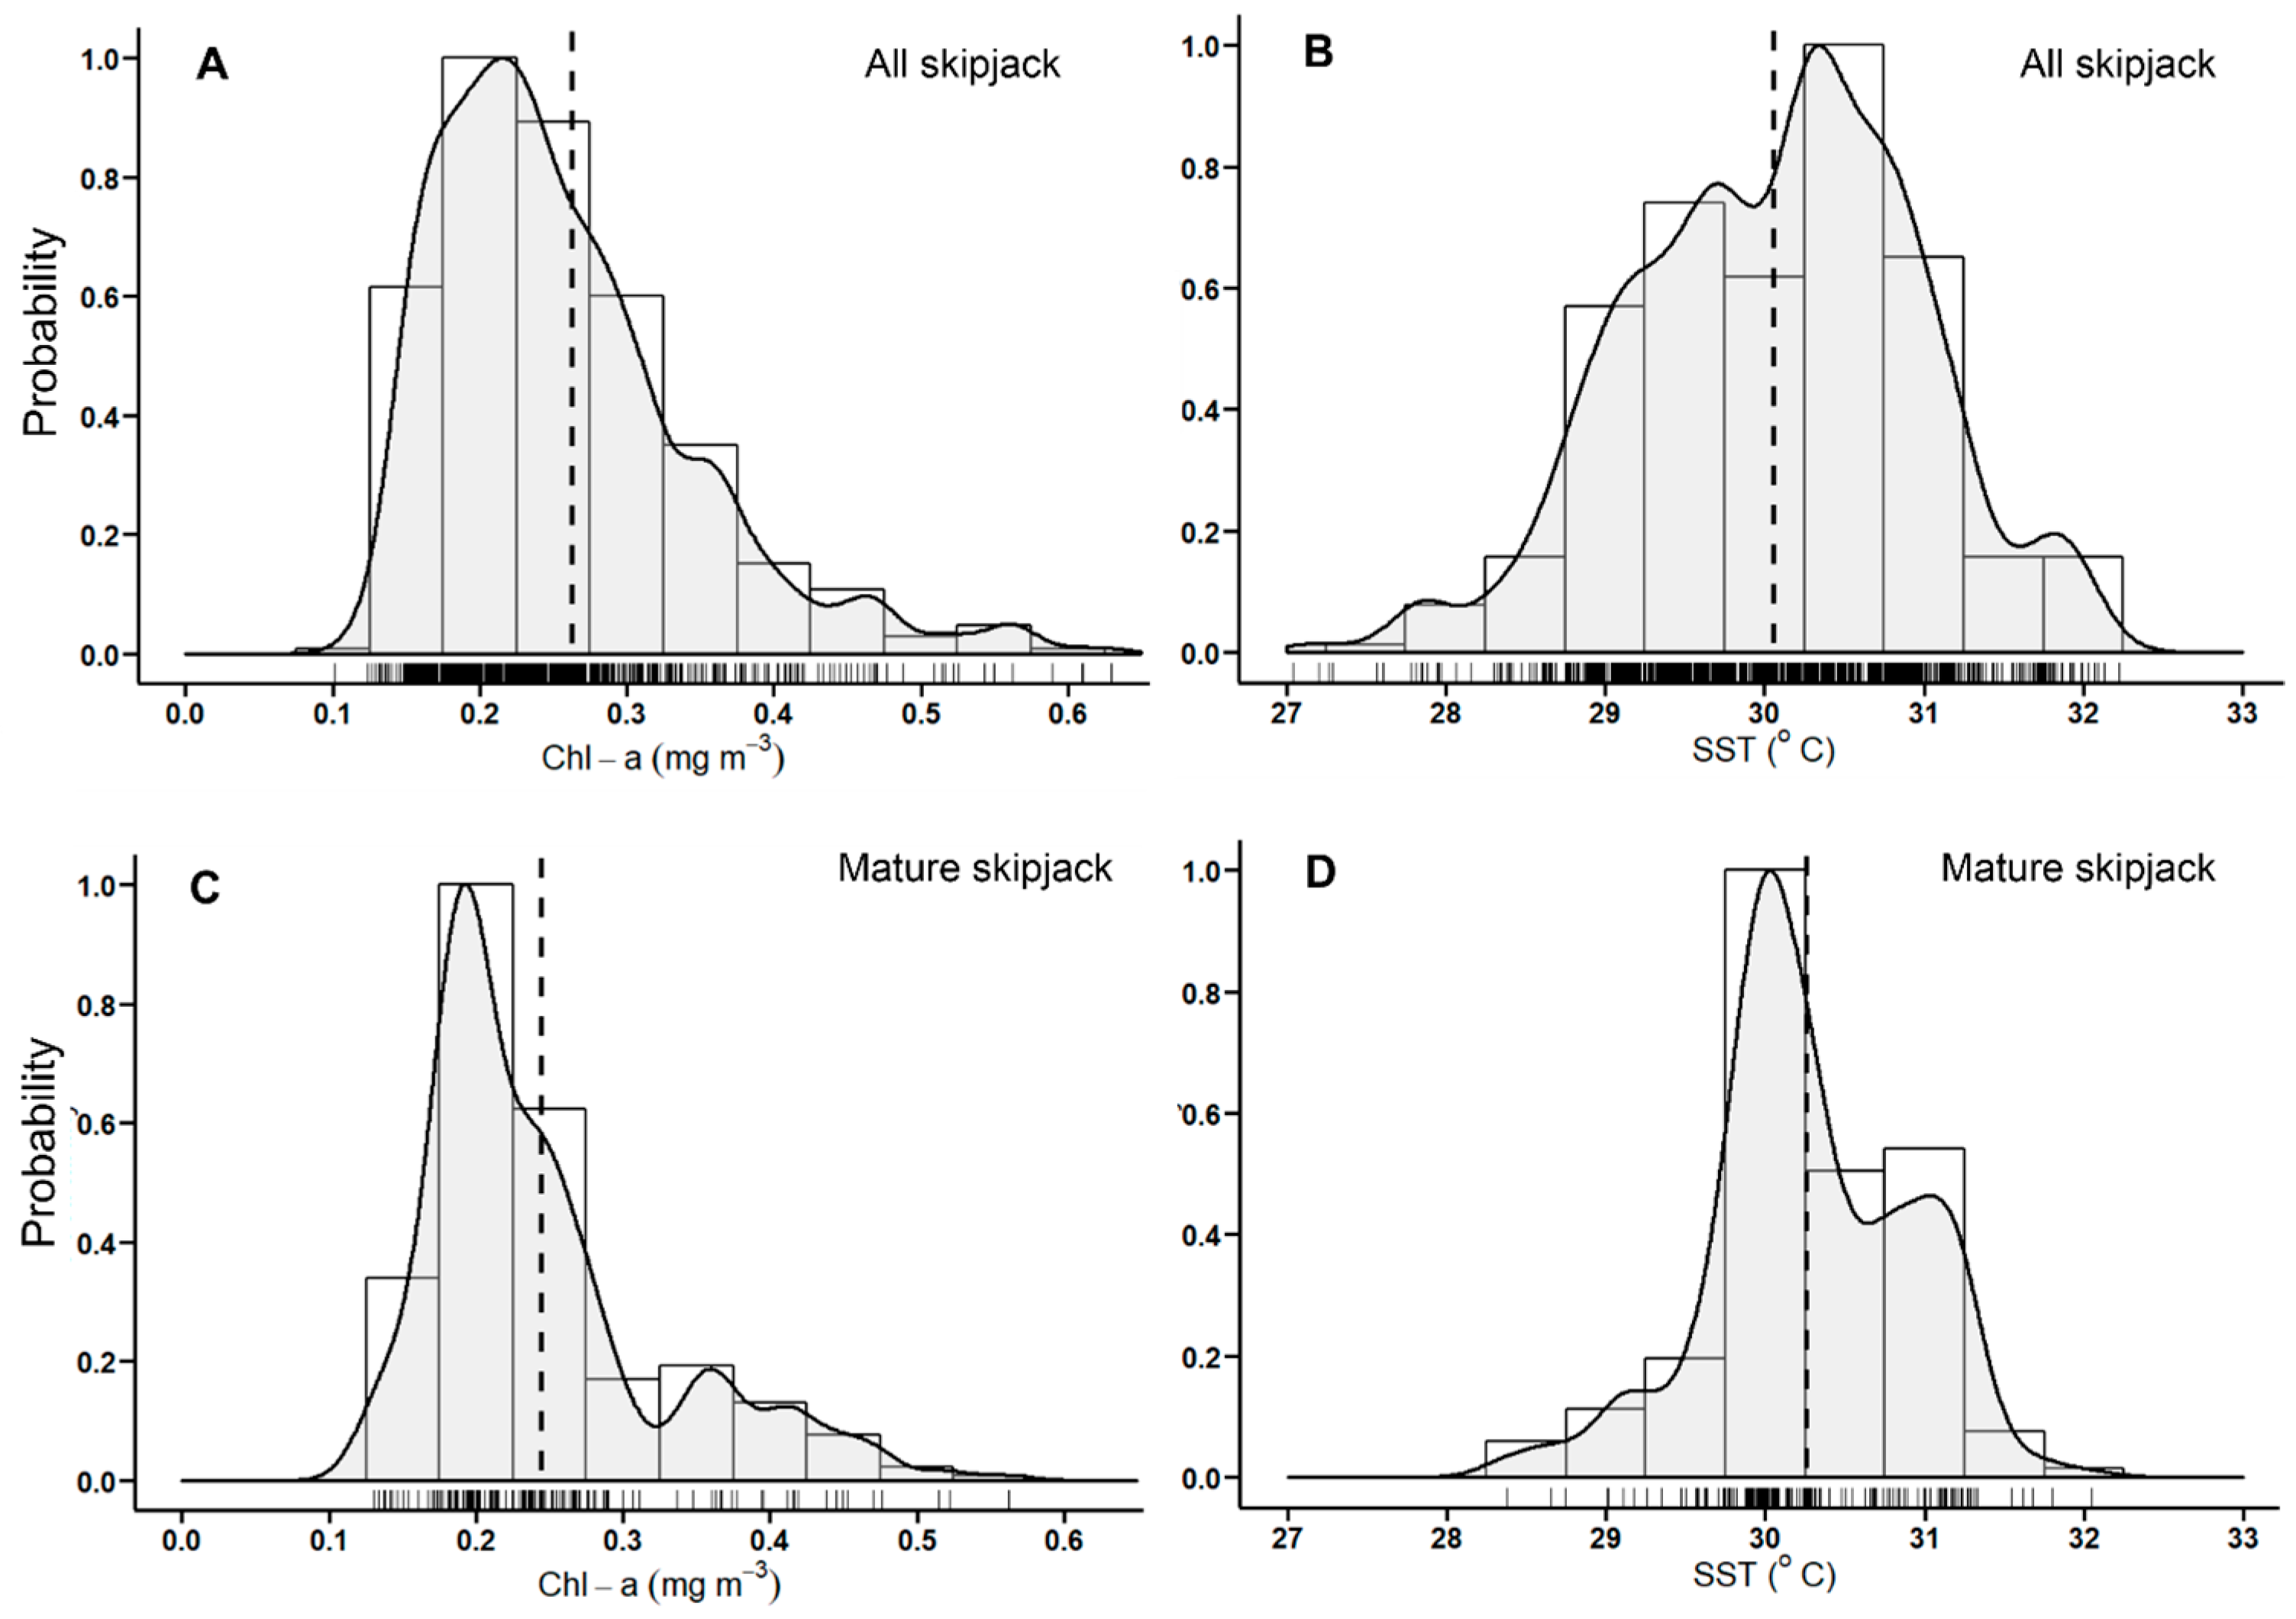
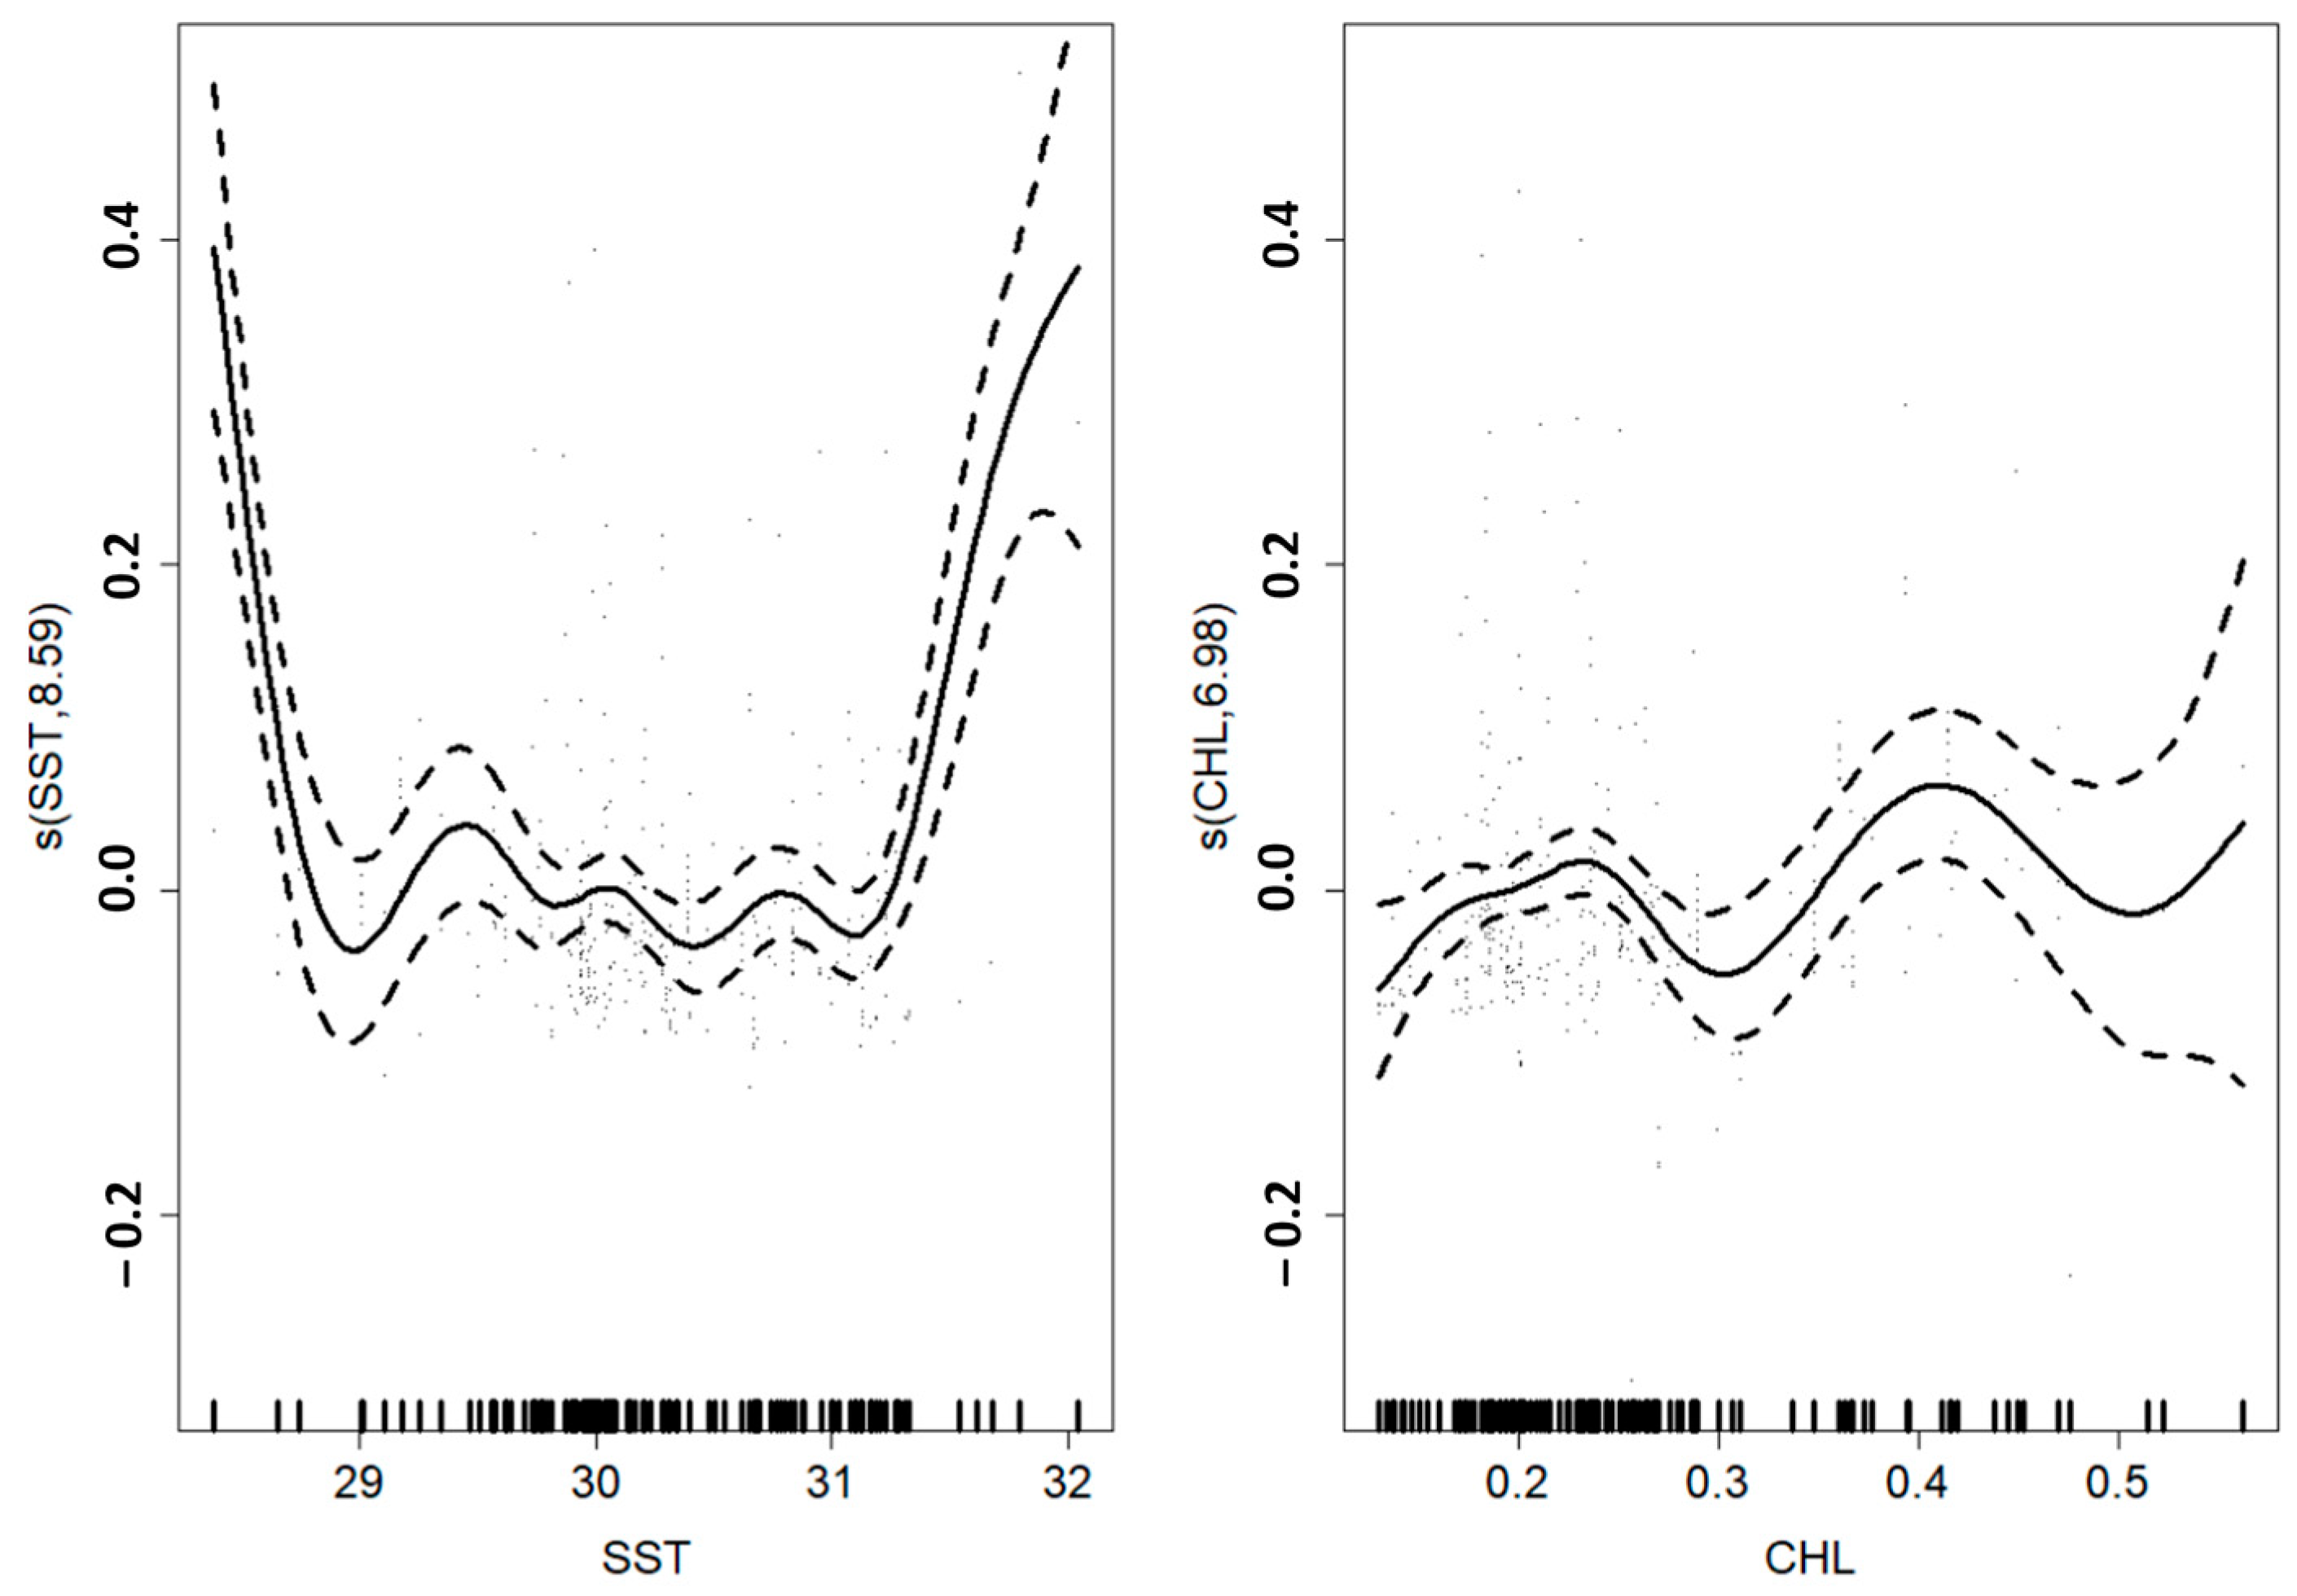
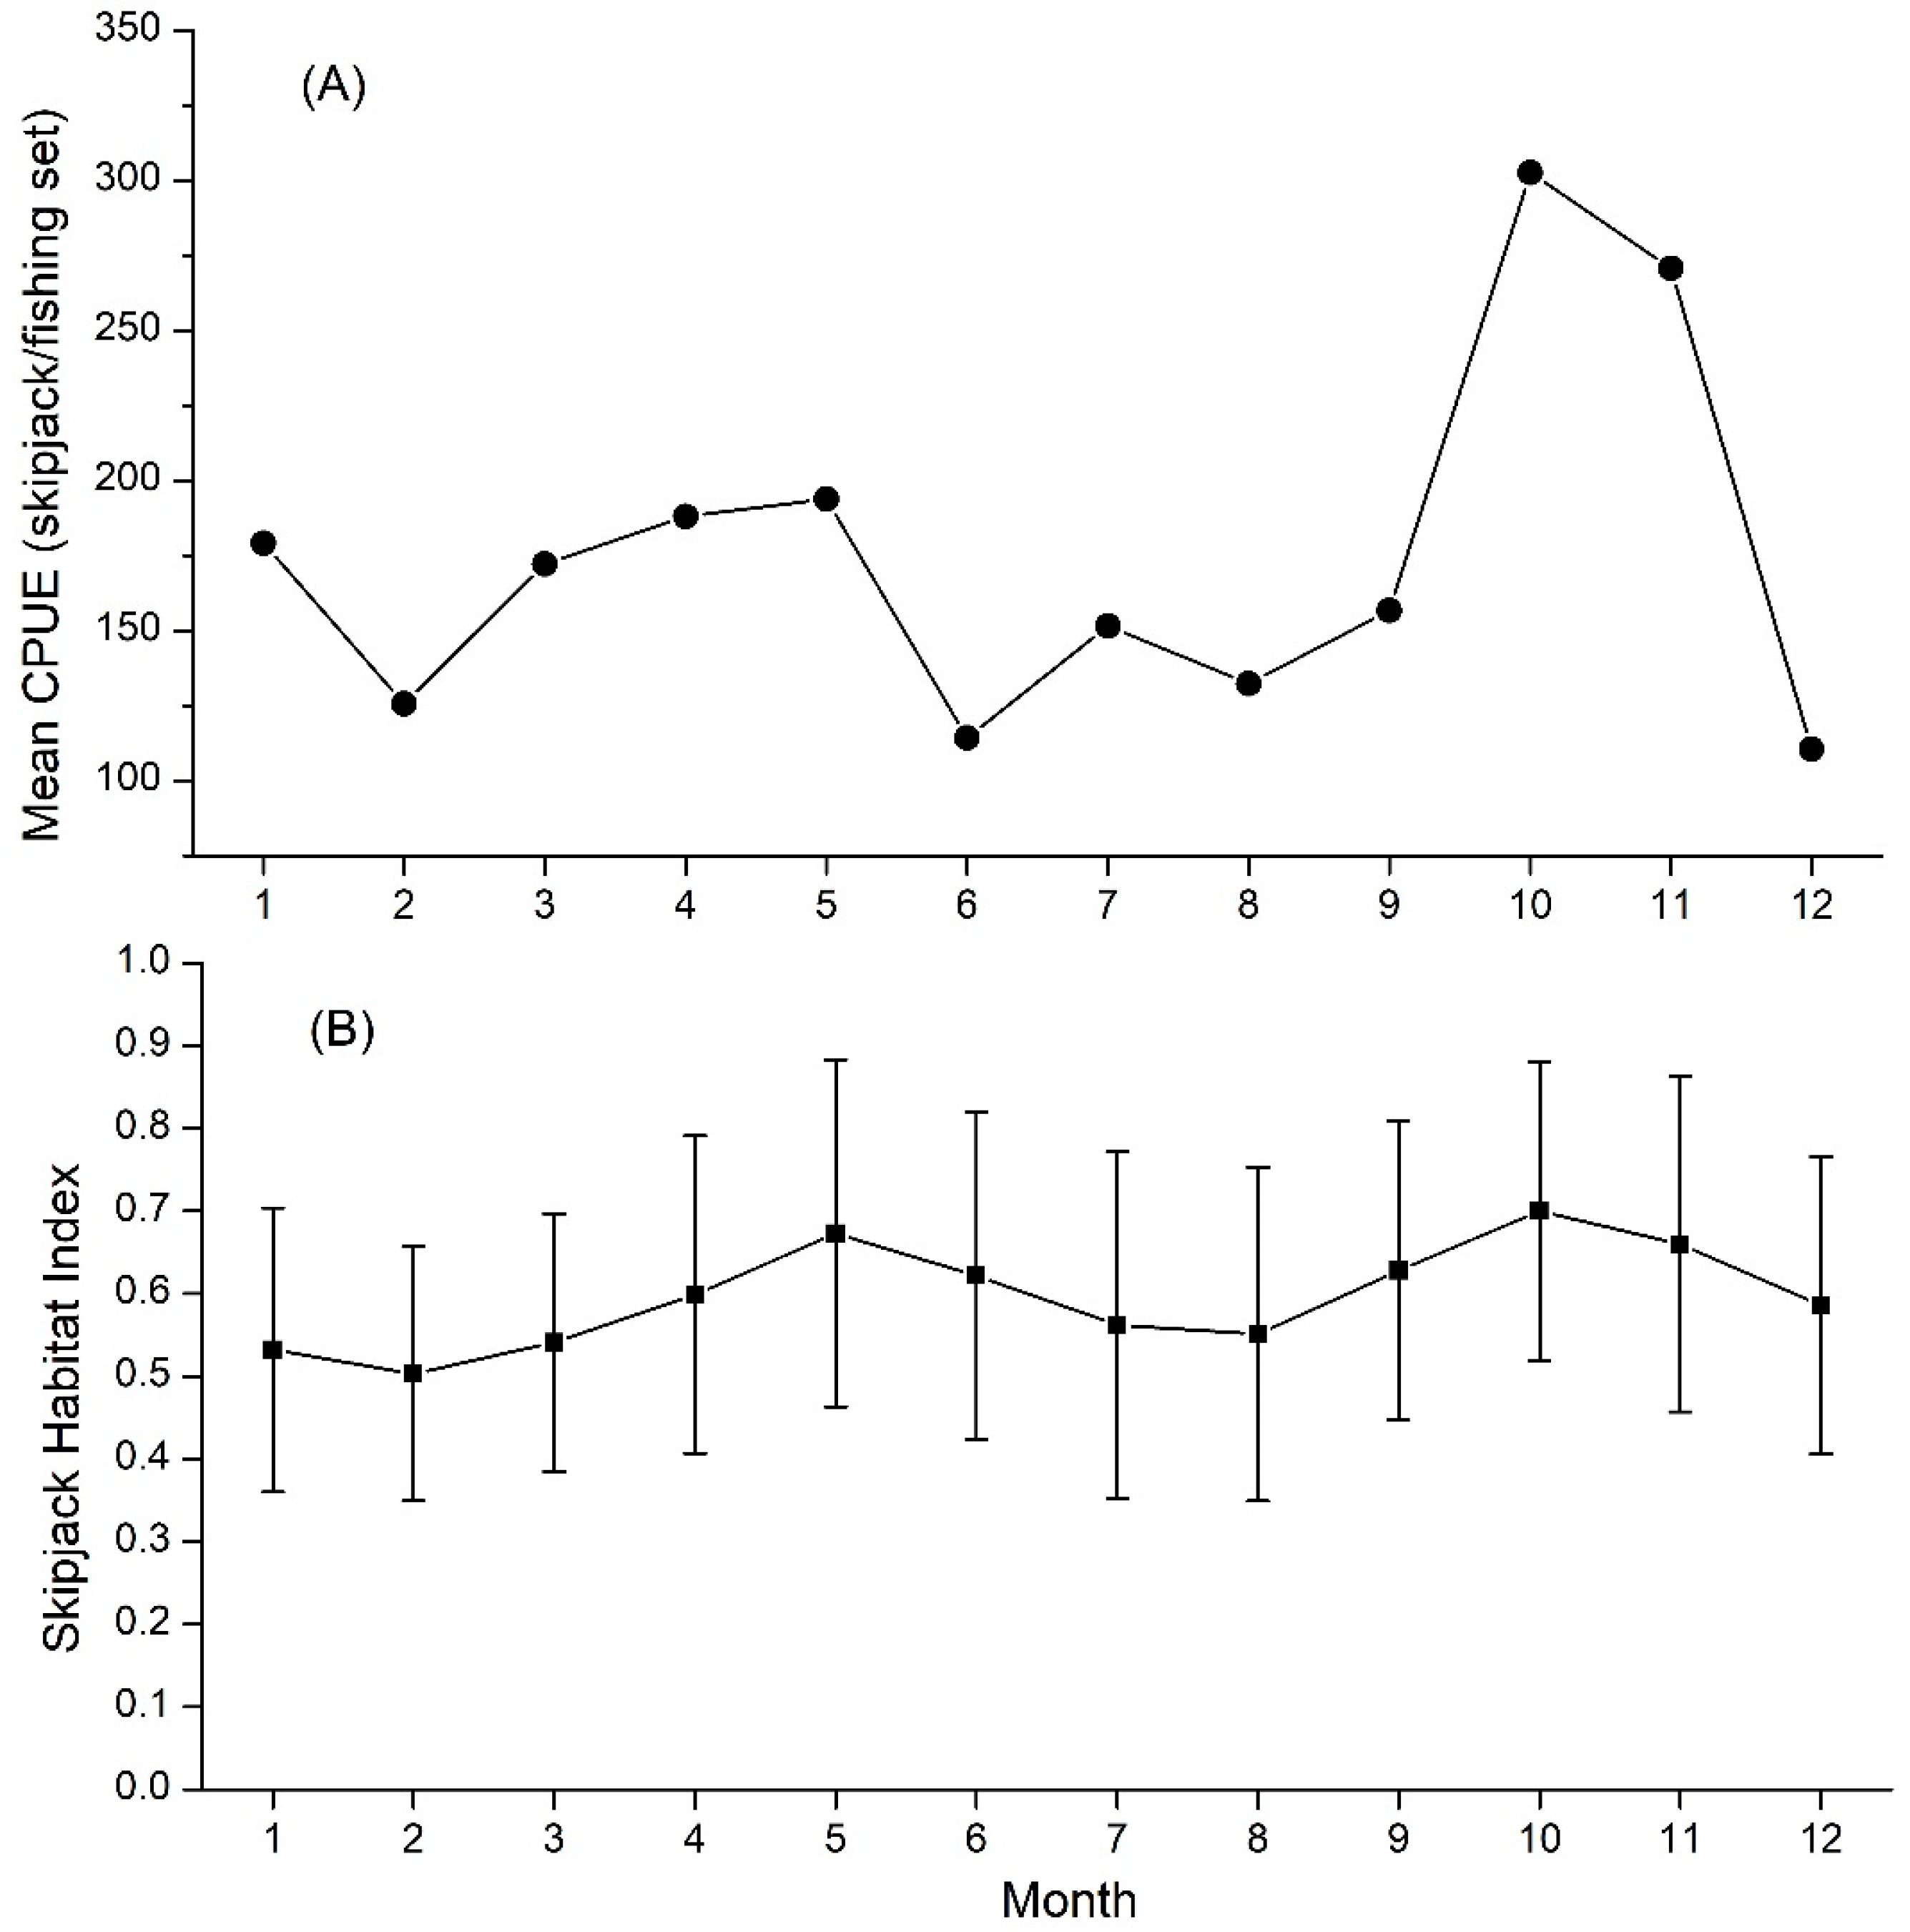
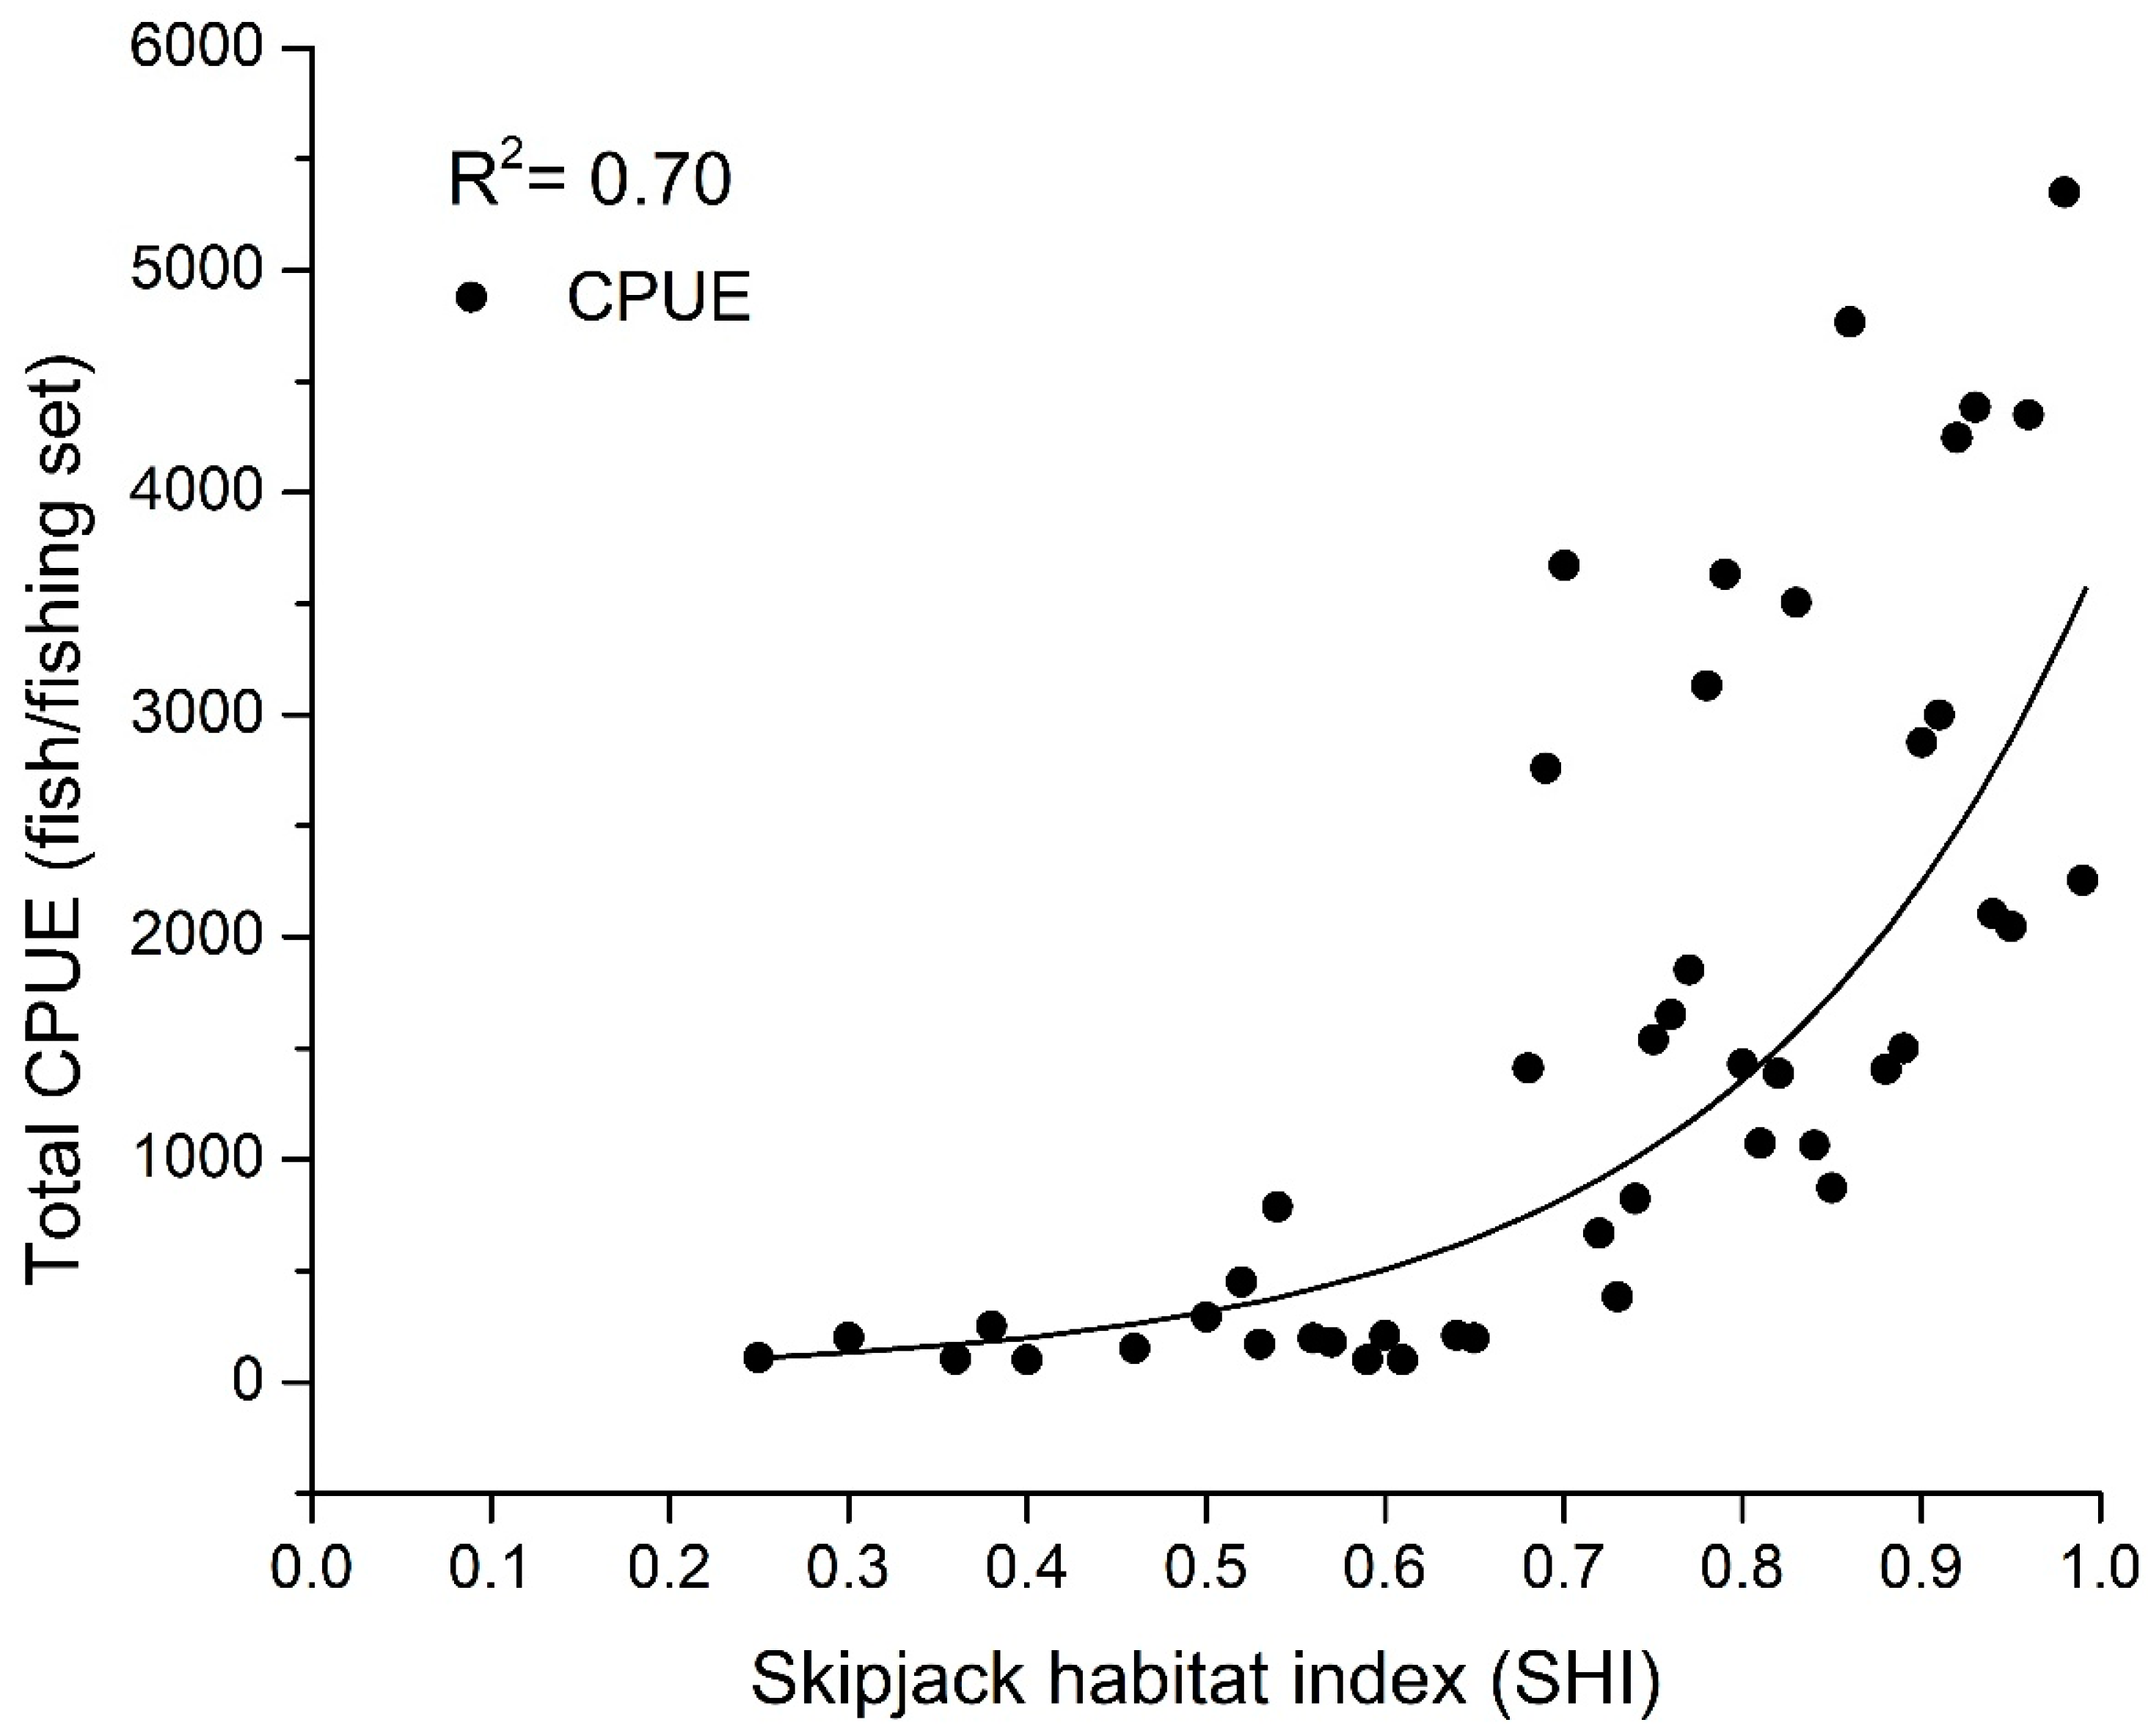
3.1. Skipjack Tuna Fishing Performance versus Oceanographic Factors

All skipjack tuna catch sizes were identified in the fishing grounds with a Chl-a between 0.1 and 0.6 mg m−3, with the fishing effort density increasing to between 0.15 and 0.37 mg m−3 (Figure 2A). The kernel density estimation revealed that the average fishing effort density was 0.26 mg m−3 and peaked at 0.22 mg m−3 (KDE). The SST varied from 27.5 to 32.5 °C, with 29.15 to 30.97 °C exhibiting the highest intensity of fishing sets, with a peak at 30.05 °C (Figure 2B). Based on the fishery datasets, skipjack catch sizes of ≥50 cm were obtained from approximately 27% of the fishing grounds. For the mature skipjack tuna used for commercial purposes, we found specific favorable Chl-a values ranging from 0.15 to 0.28 mg m−3, and KDE calculated the significance level to be 0.2 mg m−3 (Figure 2C). The probability distribution of Chl-a in the relatively high spatial resolution in which each fish had been caught demonstrated the strongest relationship between skipjack catch and the Chl-a front indicated by the 0.2 mg m−3 surface chlorophyll density. Using kernel density plots, the preferred SST for a feasible size of skipjack was 30 °C, with an interval of 29.5–31 °C (Figure 2D).
Using the GAM, the Gaussian family, linked to the identity link function, was selected because the CPUE has a continuous distribution. To normalize the asymmetrical distribution, we applied a logarithmic transformation to CPUEs [40]. The predicted skipjack CPUEs from the explanatory variables were significant, with 30.3% cumulative deviance explained (CDE) (Table 2). All predictors (SST and Chl-a) were statistically significant (p < 0.01). It is important to note that these environmental parameters greatly contributed to describing the real variability of commercial skipjack tuna habitats. From the model, the strongest effect of SST on CPUE occurred from 29.5 to 31 °C. The significant effect of Chl-a on skipjack abundance ranged from 0.15 to 0.28 mg m−3 (Figure 3). The preferred SST described 79.11% of total mature tuna catches. In contrast, the favorable Chl-a accounted for 79.20% of the commercial skipjack CPUEs. All of these signatures can be used as strong indicators of skipjack habitat hotspots.
The results obtained above are further reinforced by comparisons of the predicted skipjack CPUE with concurrent ocean color (Chl-a) and thermal (SST) signatures using 3D catch–oceanographic relationships for the period of 2007–2016 (Figure 4A). The highest CPUEs (more than 300 fish/fishing set) were localized between 0.1 and 0.3 mg m−3 for surface Chl-a and peaked at around 0.2 mg m−3. The range of temperatures where SST and CPUE were most strongly correlated was 29.5 to 31.5 °C, with 30 °C being the habitat of choice. Using KDE, the highest density of fishing sets occurred in areas with a Chl-a of 0.15–0.3 mg m−3 and an SST of 29.5–30.5 °C, centered at 0.2 mg m−3 and 30 °C, respectively (Figure 4B).

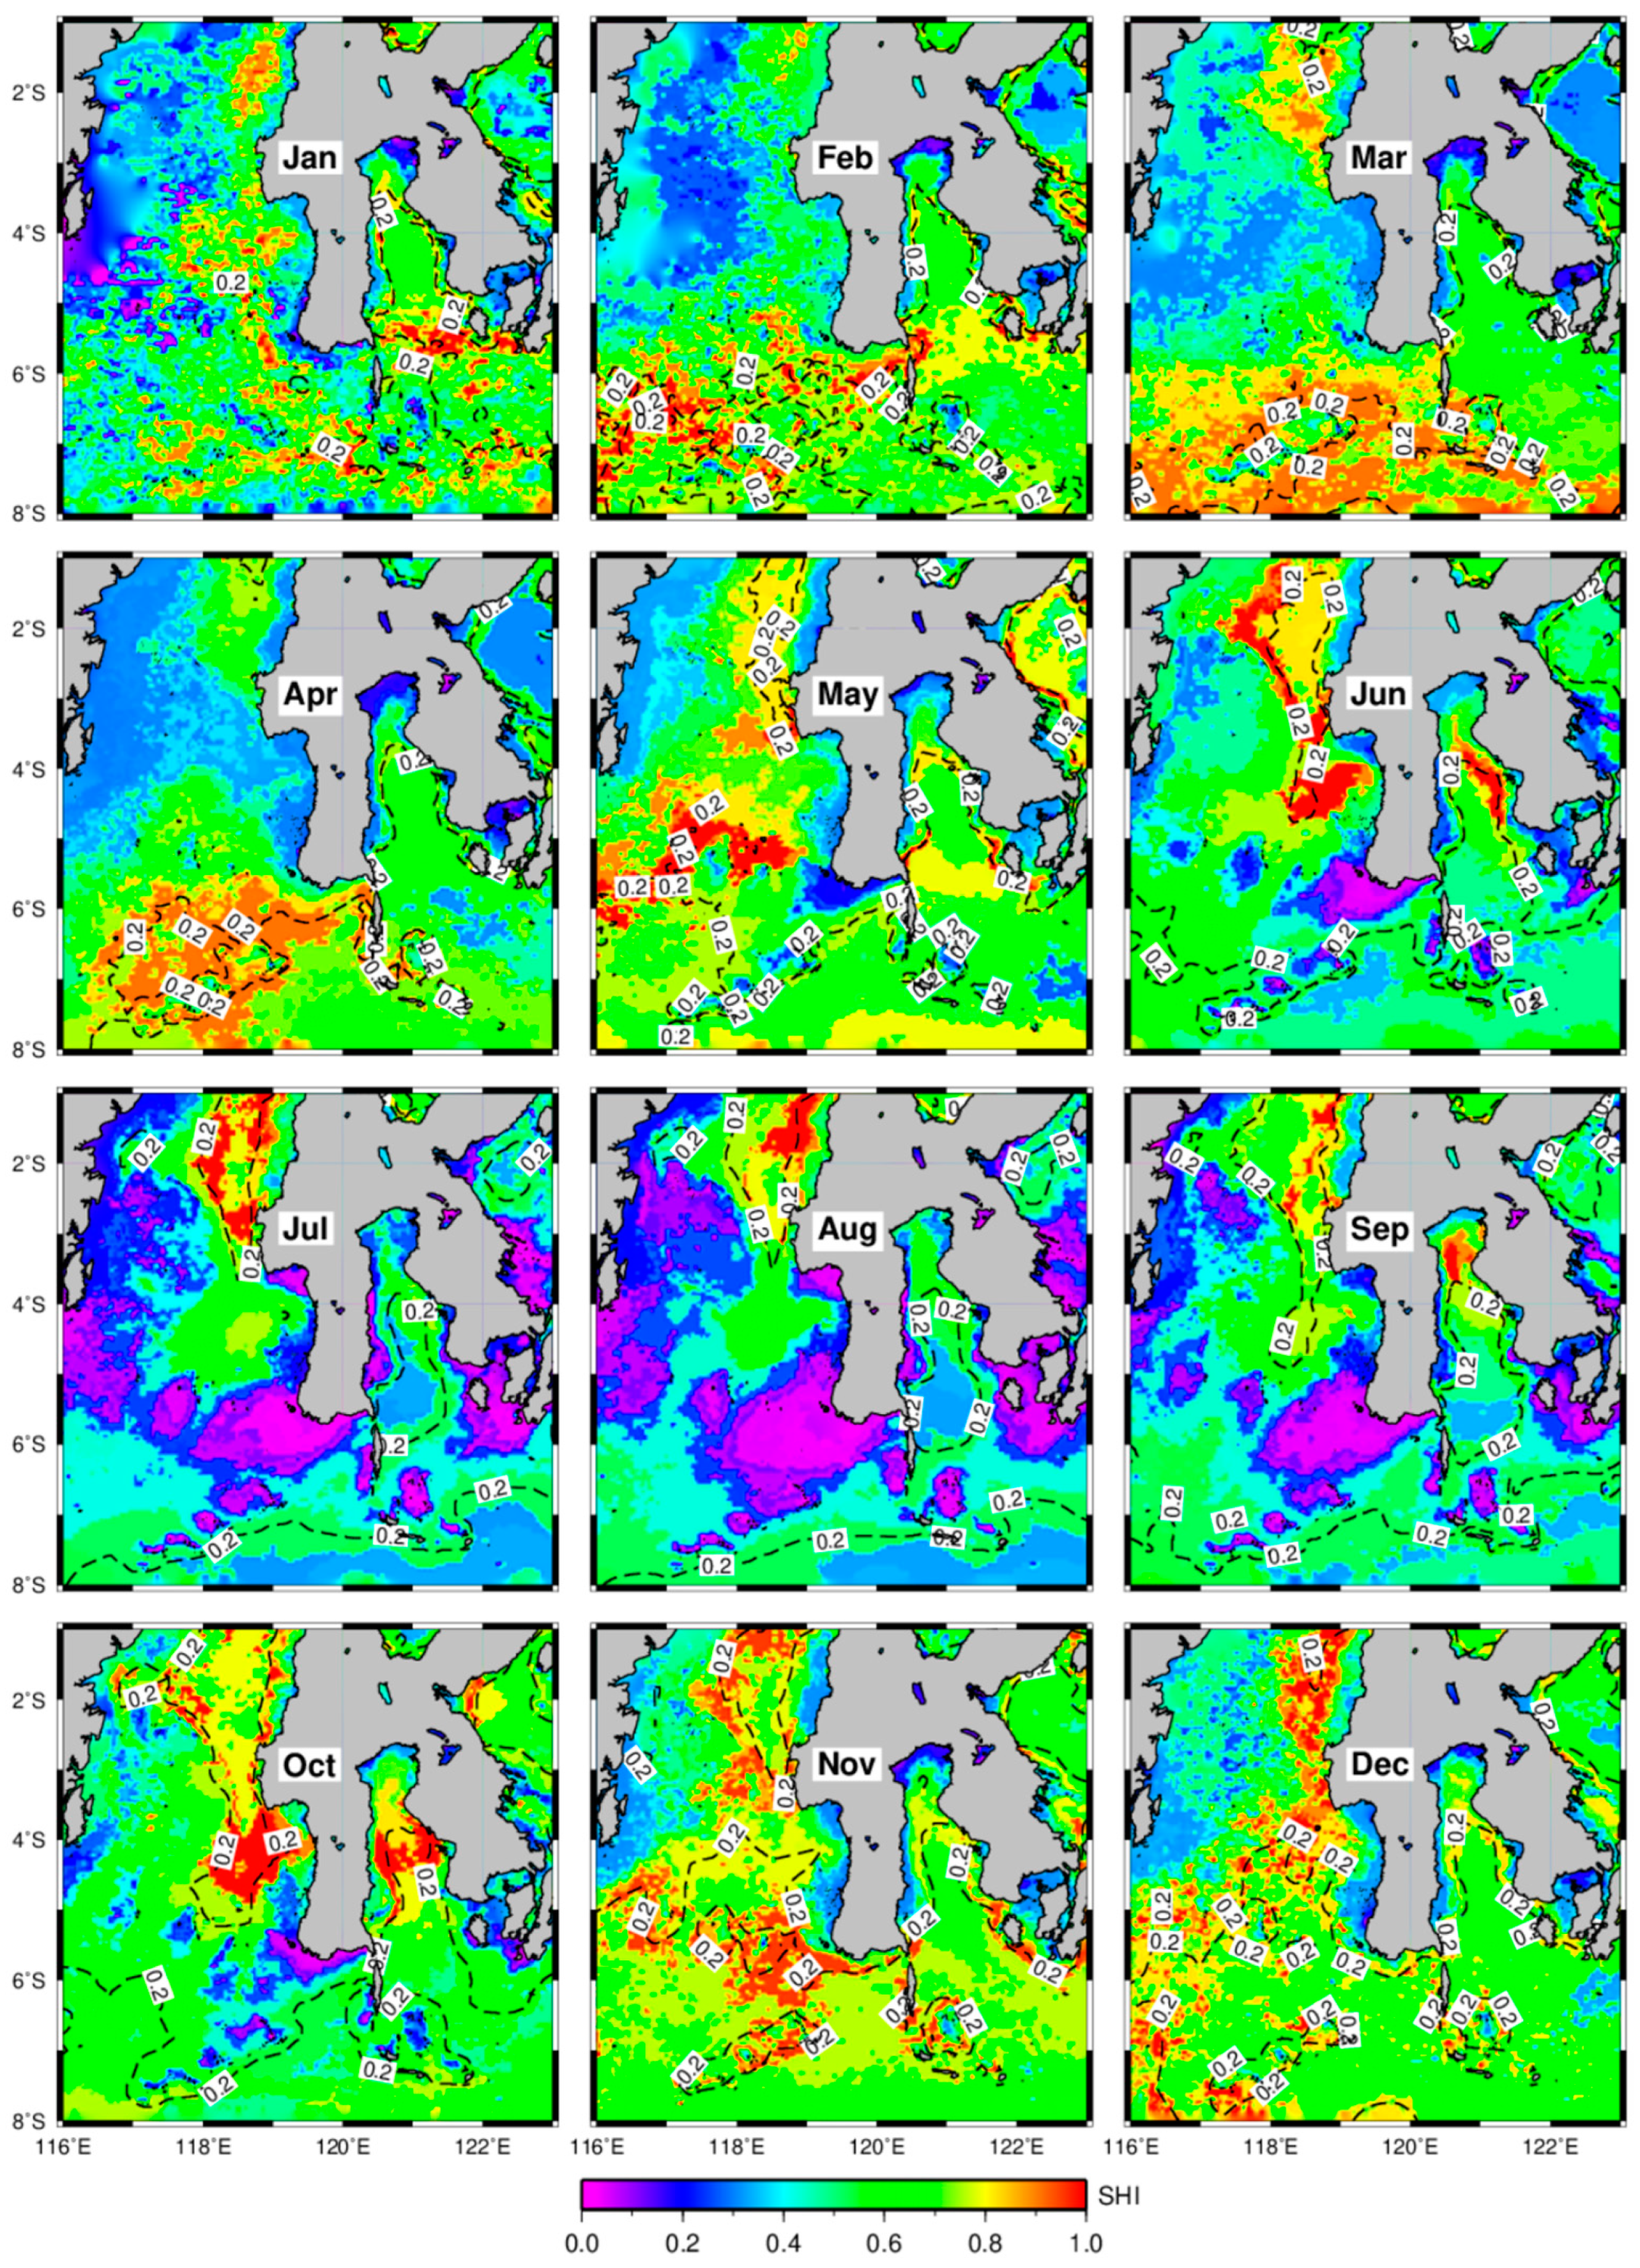
3.2. Distribution of Potential Skipjack Tuna Habitat in Space and Time

Figure 5 shows the spatial-temporal dynamics of prospective skipjack tuna habitats. In January, the potential area for skipjack is widely distributed throughout the study area. Key habitats began to develop in the southern Makassar Strait the following month and moved to the Flores Sea in March. In April, biologically rich areas were concentrated in the western Flores Sea and peaked in May, coinciding with the increase in skipjack CPUEs (Figure 6A) and skipjack habitat index (SHI) (Figure 6B). Potential fish habitats widely appeared in June from the northern area of the Makassar Strait to the south (1–5°S and 117–119°E). In this month, an enriched skipjack habitat was also detected in the Bone Gulf. This significant habitat remained, during the following three months, north of the Makassar Strait, in the latitude band of 1°S to 3.5°S and the longitude band of 118°E to 119°E. During this time, skipjack habitats in the study area were generally underdeveloped, especially from June to August, when tuna catches and SHI decreased (Figure 5). The highest SHI was strongly linked with the largest catches during the peak of the skipjack habitat in October and November. Ideal habitat areas for October were well developed in the east of the Makassar Strait along latitudes of 3–5°S and longitudes of 118–112°E, in close proximity to the greatest actual CPUEs and SHI (Figure 5 and Figure 6). A significant skipjack habitat developed during the southwest monsoon, notably in November, around the Makassar Strait, especially in the southern parts, followed by the Flores Sea and Bone Gulf (Figure 5). In December, the observed mean CPUEs and the predicted habitat intensity decreased (Figure 6).
It is important to highlight that with a chlorophyll indicator value of 0.2 mg m−3, the important skipjack habitats can be located spatially and temporally year-round (Figure 5). In areas with greater SHI values and CPUEs, the locations of the chlorophyll front matched up well (Figure 3, Figure 4 and Figure 5). Interestingly, these areas were primarily discovered within areas with preferable SST. Most potential skipjack fishing sites with densities of reliable SHI (above 90%) were found in October (Figure 6 and Figure 7). This fact demonstrates how the increase in CPUE in that month and the high SHI are clearly associated. Conversely, the low SHI between July and September also matches the decrease in catches (Figure 4, Figure 5 and Figure 6). The temporal variability of SHI indicated that an SHI of more than 75% occurred in two phases: (1) during May–June and (2) in the period of October–December (Figure 7).
Based on the decade of satellite environmental data for fisheries in 2007–2016, it was found that there was a statistically significant correlation between total CPUE and the skipjack habitat index (p < 0.001) (Figure 8). This relationship could be expressed exponentially by the equation Y = 15.191e5.639x with R2 = 0.70, where Y is the total CPUE and X is the skipjack hotspot habitat index (SHI). The increase in the habitat index for skipjack tuna tended to be followed by a significant increase in total CPUE, particularly starting from an SHI value of 0.60. The model accuracy assessment showed that the SHI values from January to December could explain 70% of the variability of total catches.

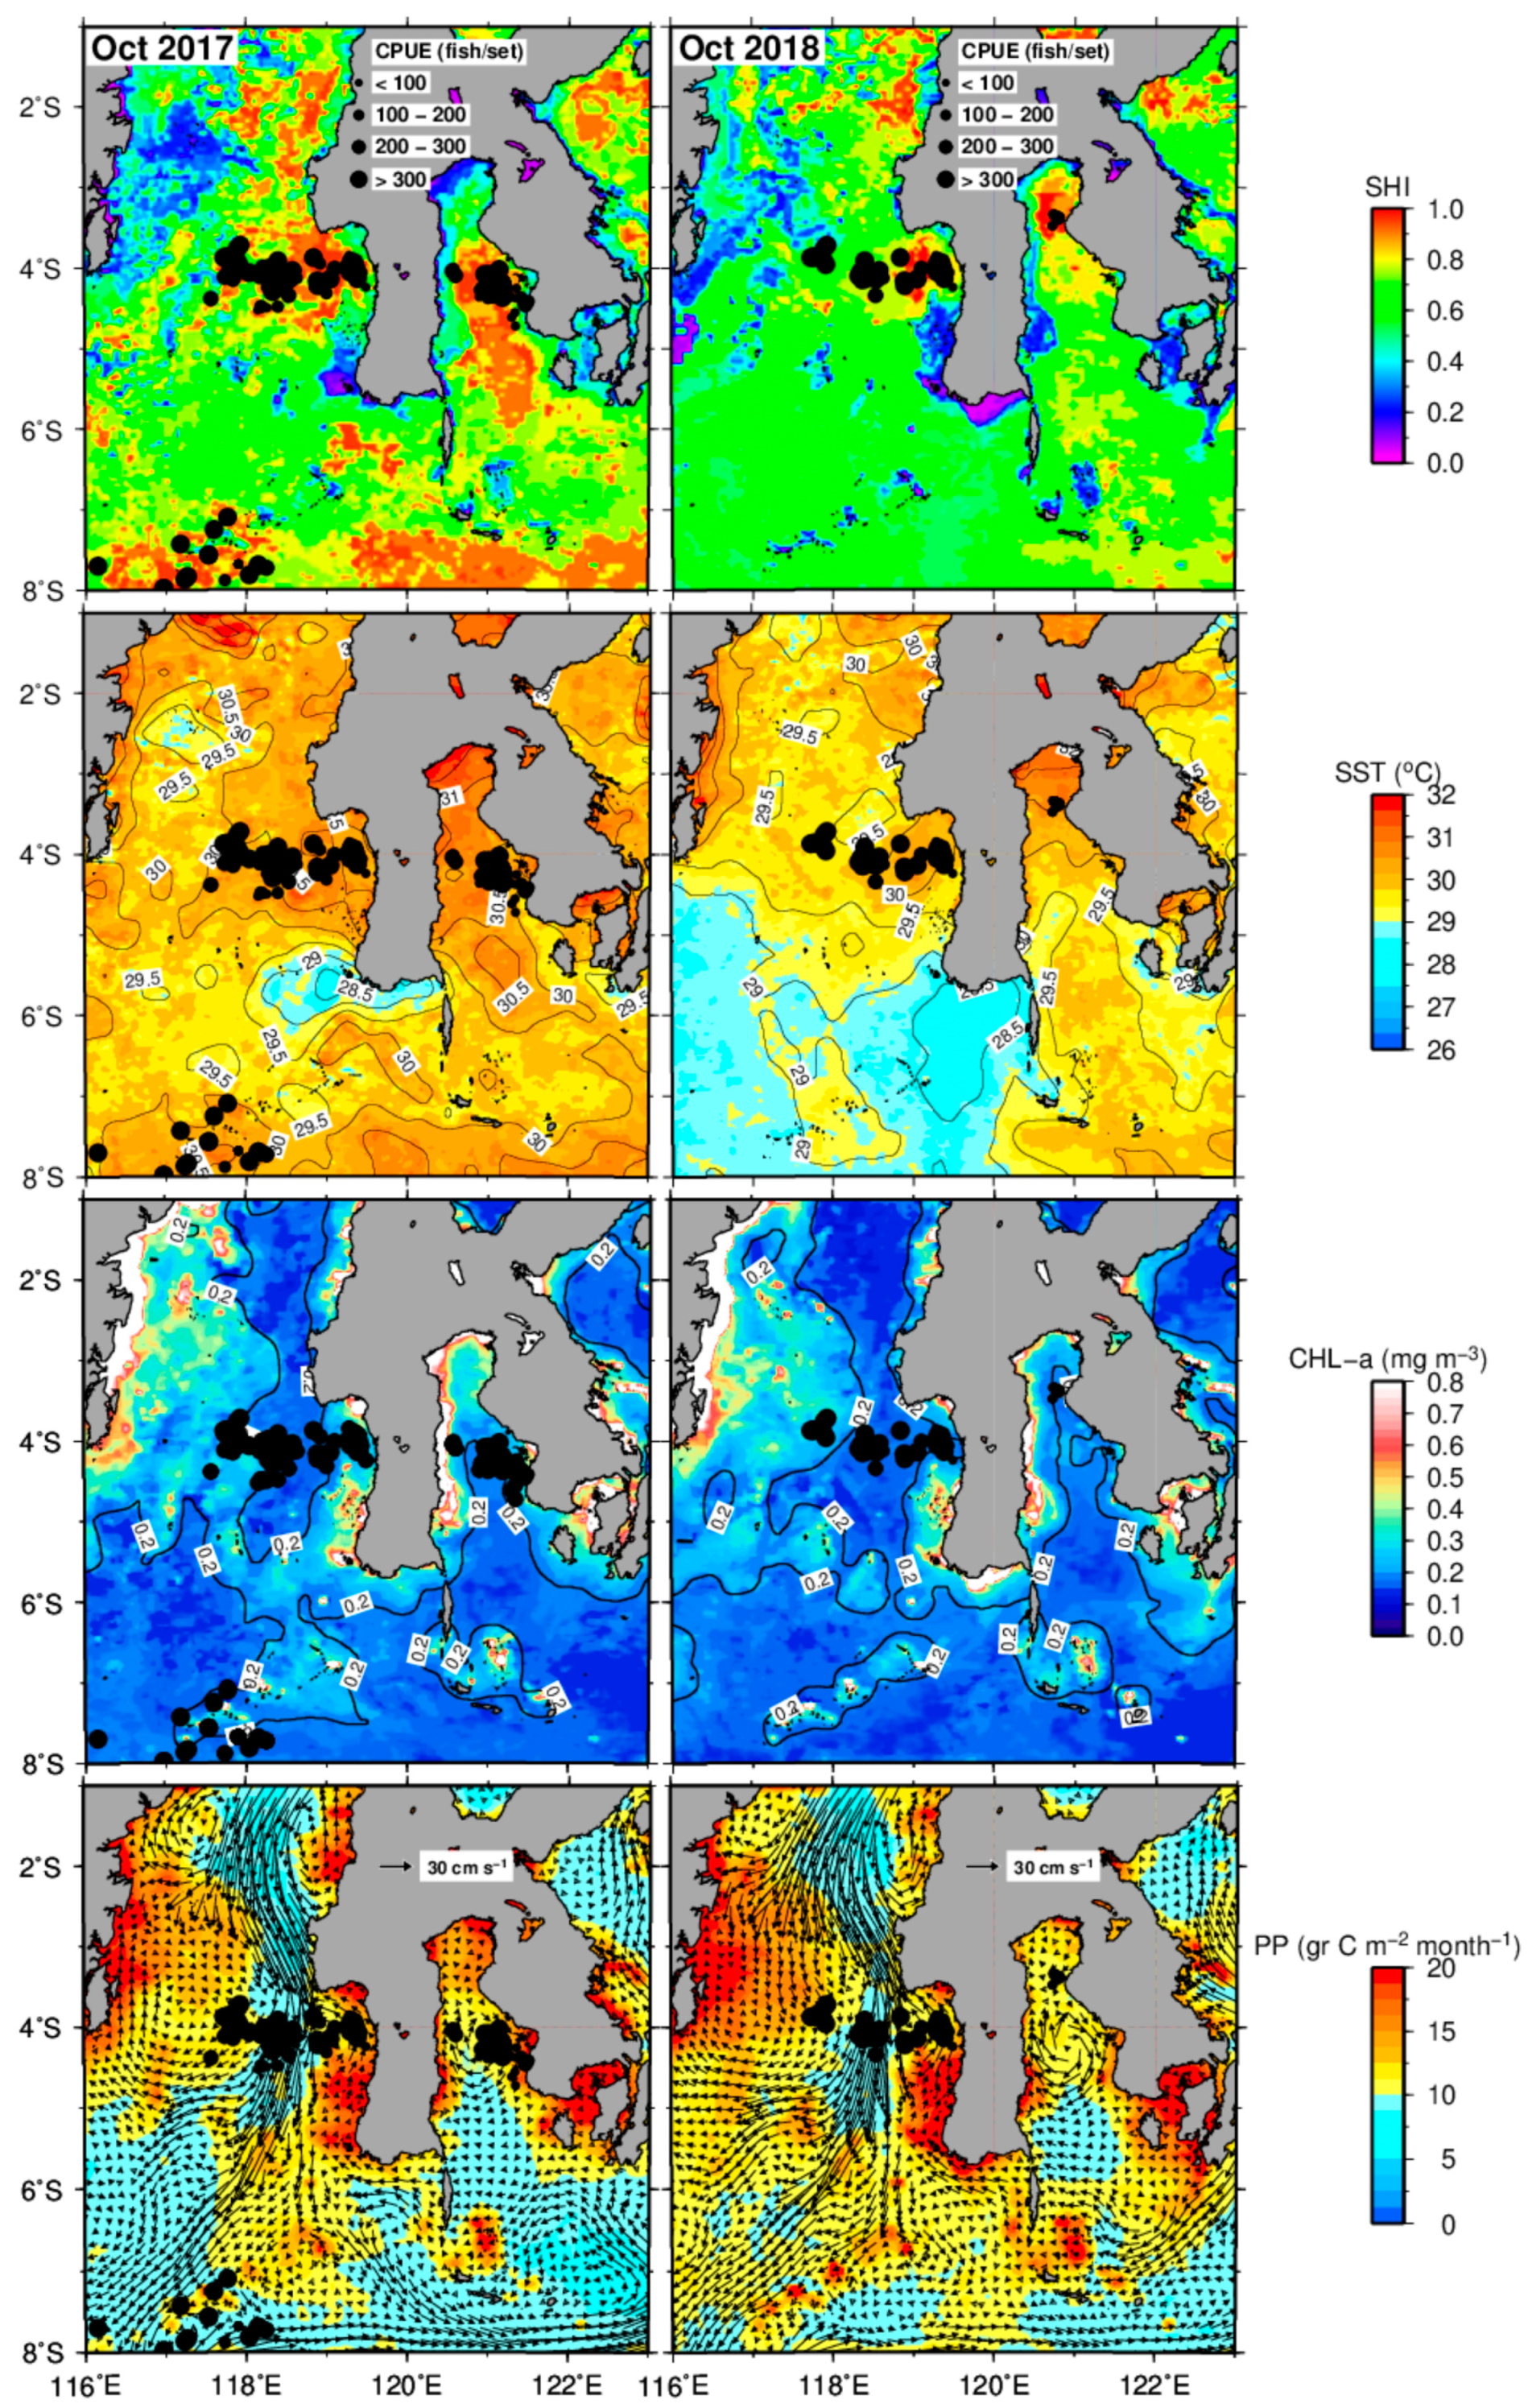
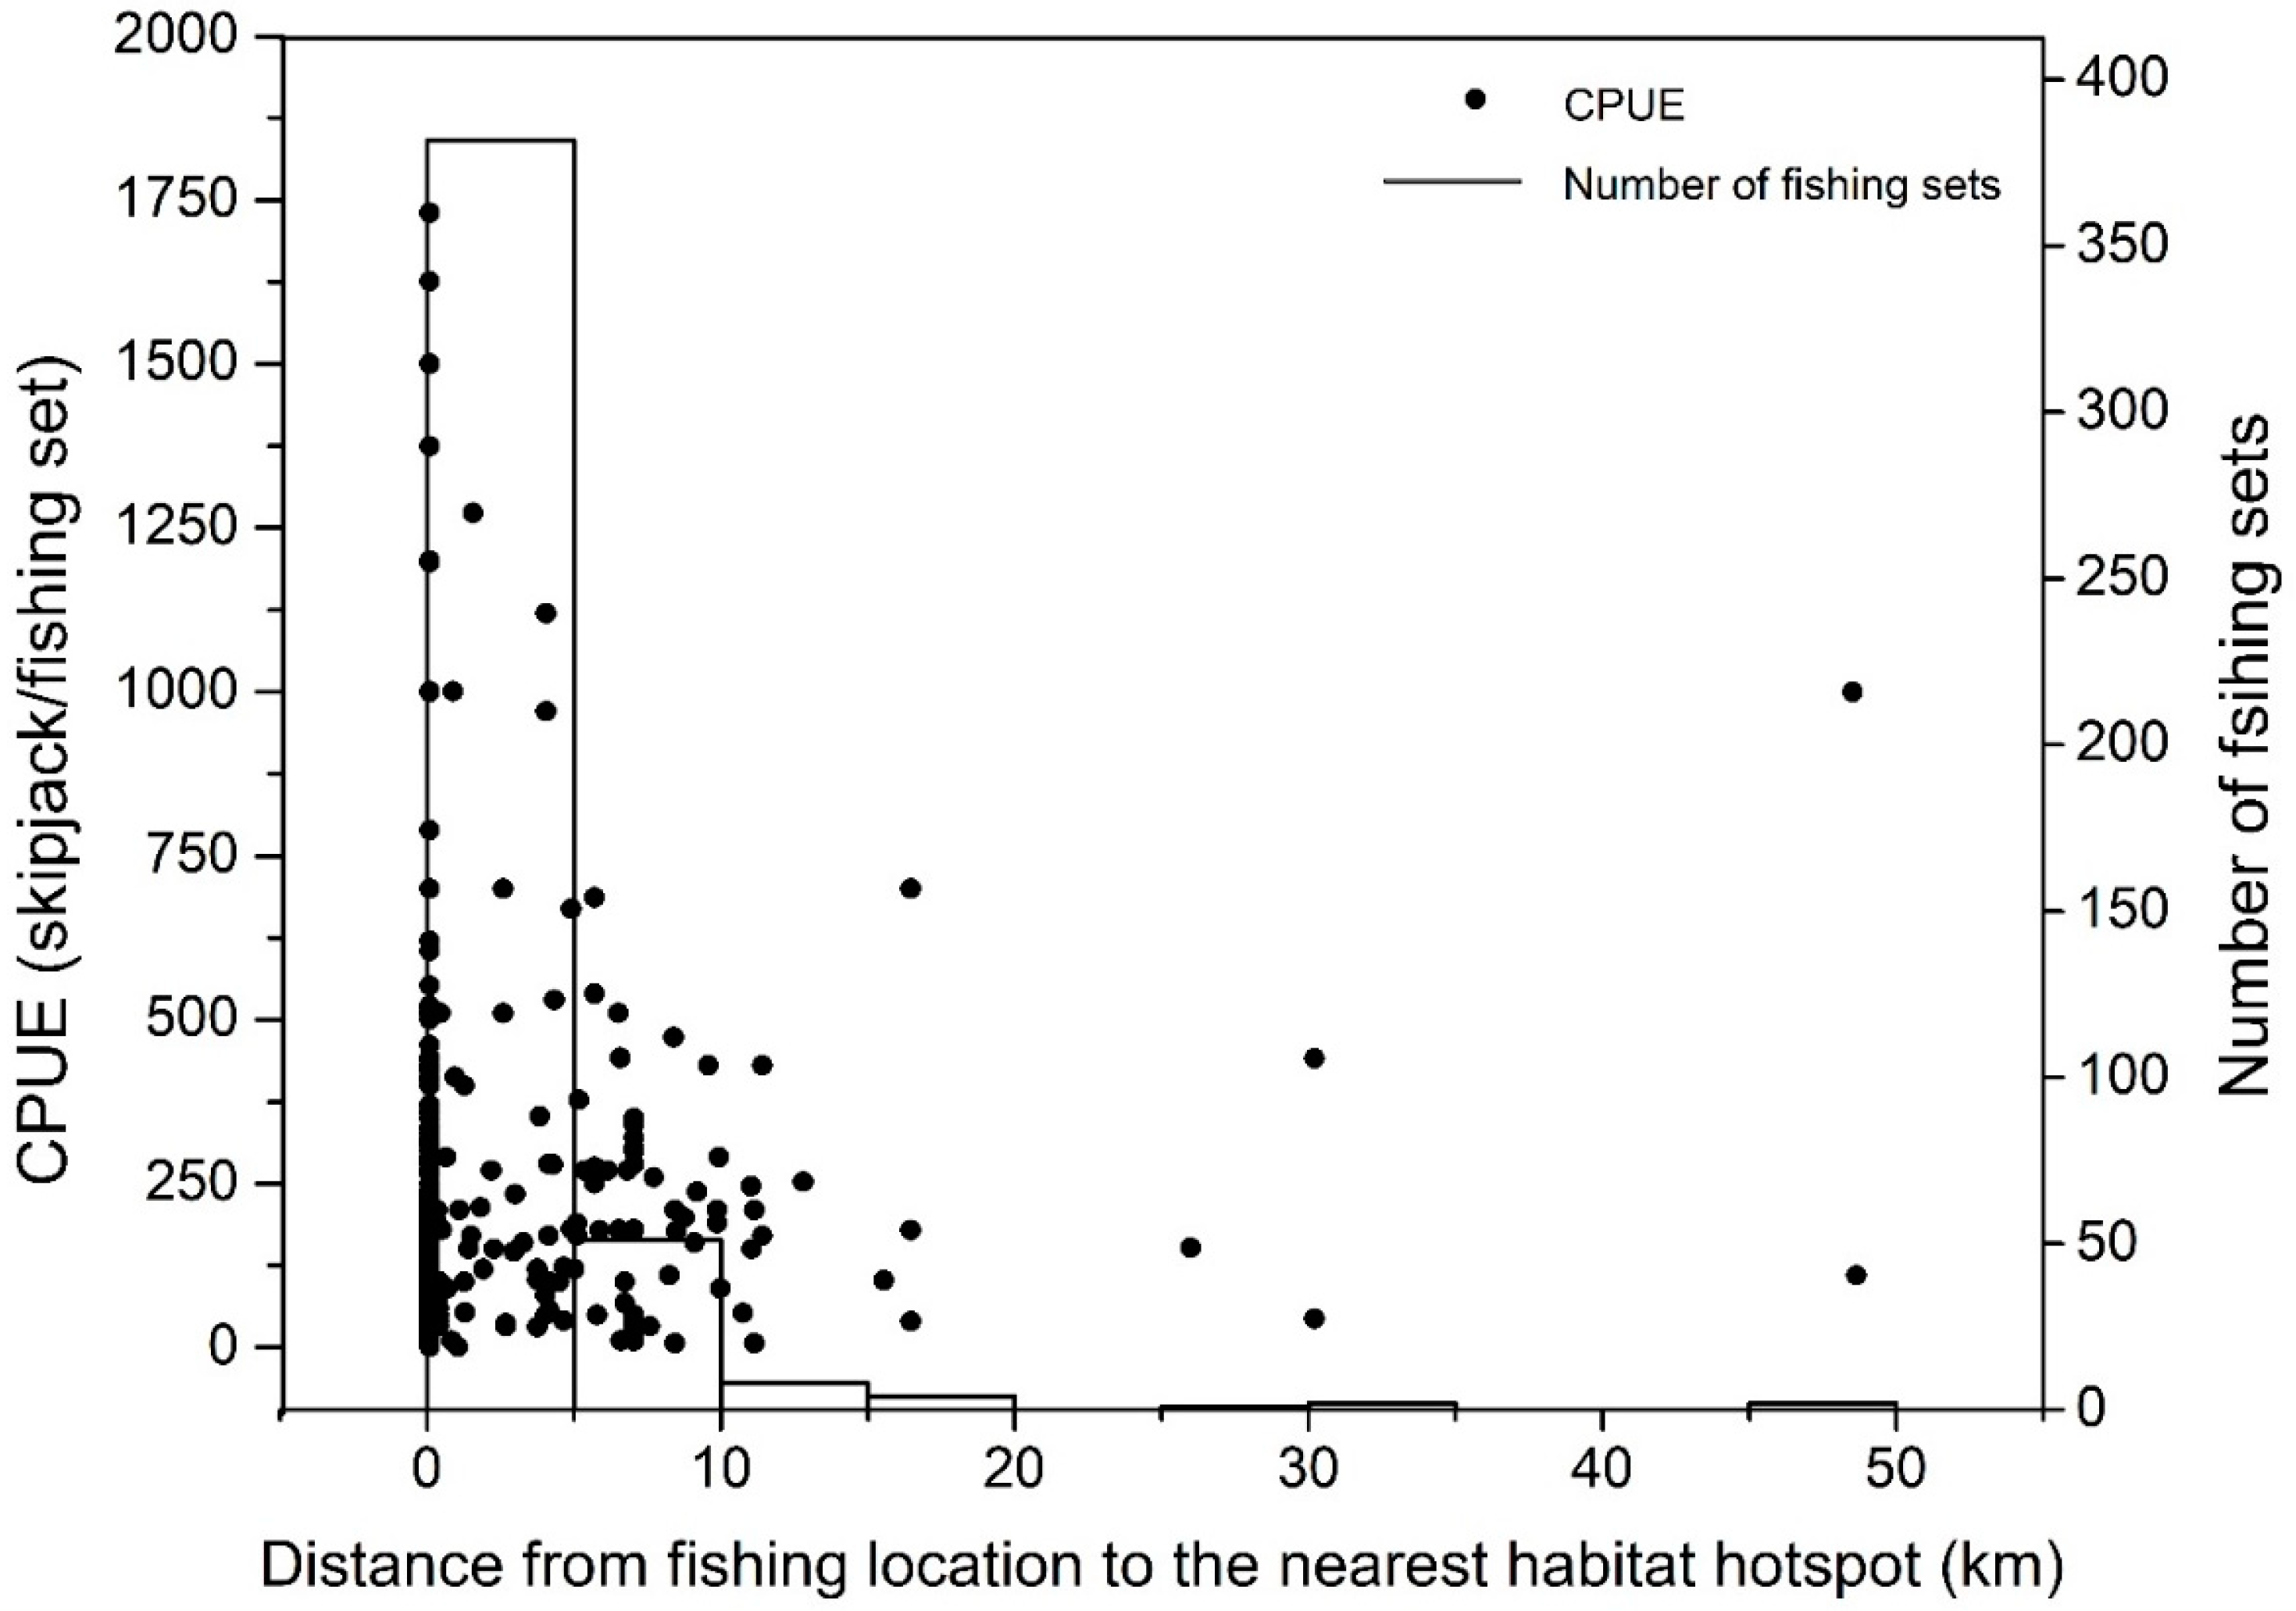
3.3. Validation of Skipjack Habitat Hotspot Prediction

The spatial distribution of observed skipjack tuna CPUEs overlaid on predicted habitat hotspots and multiple environmental habitat characteristics are shown in Figure 9. The model’s accuracy was evaluated using 116 untrained CPUE data sets from 2017 to 2018 that were not included in the spatial model analysis. Cross-validation data both in October 2017 and 2018 showed that tuna fishing points were concentrated in areas with a surface Chl-a concentration near 0.2 mg m−3 (the indication for a Chl-a front), an SST about 30–31 °C and a relatively high primary production (more than 10 gr C m−2 month−1). The biologically rich areas were also associated mainly with the convergent current and temporary anticyclonic eddy circulation in the waters of 4–5°S and 118–119°E. Greater CPUEs were mainly found near the peripheral areas of the eddy field and were closely correlated with the higher SHI, which defined the significant skipjack habitat hotspots, suggesting that the SHI was derived and confirmed by the fishing data. The quantitative cross-validation showed that the average CPUEs increase with increasing SHI (Table 3).

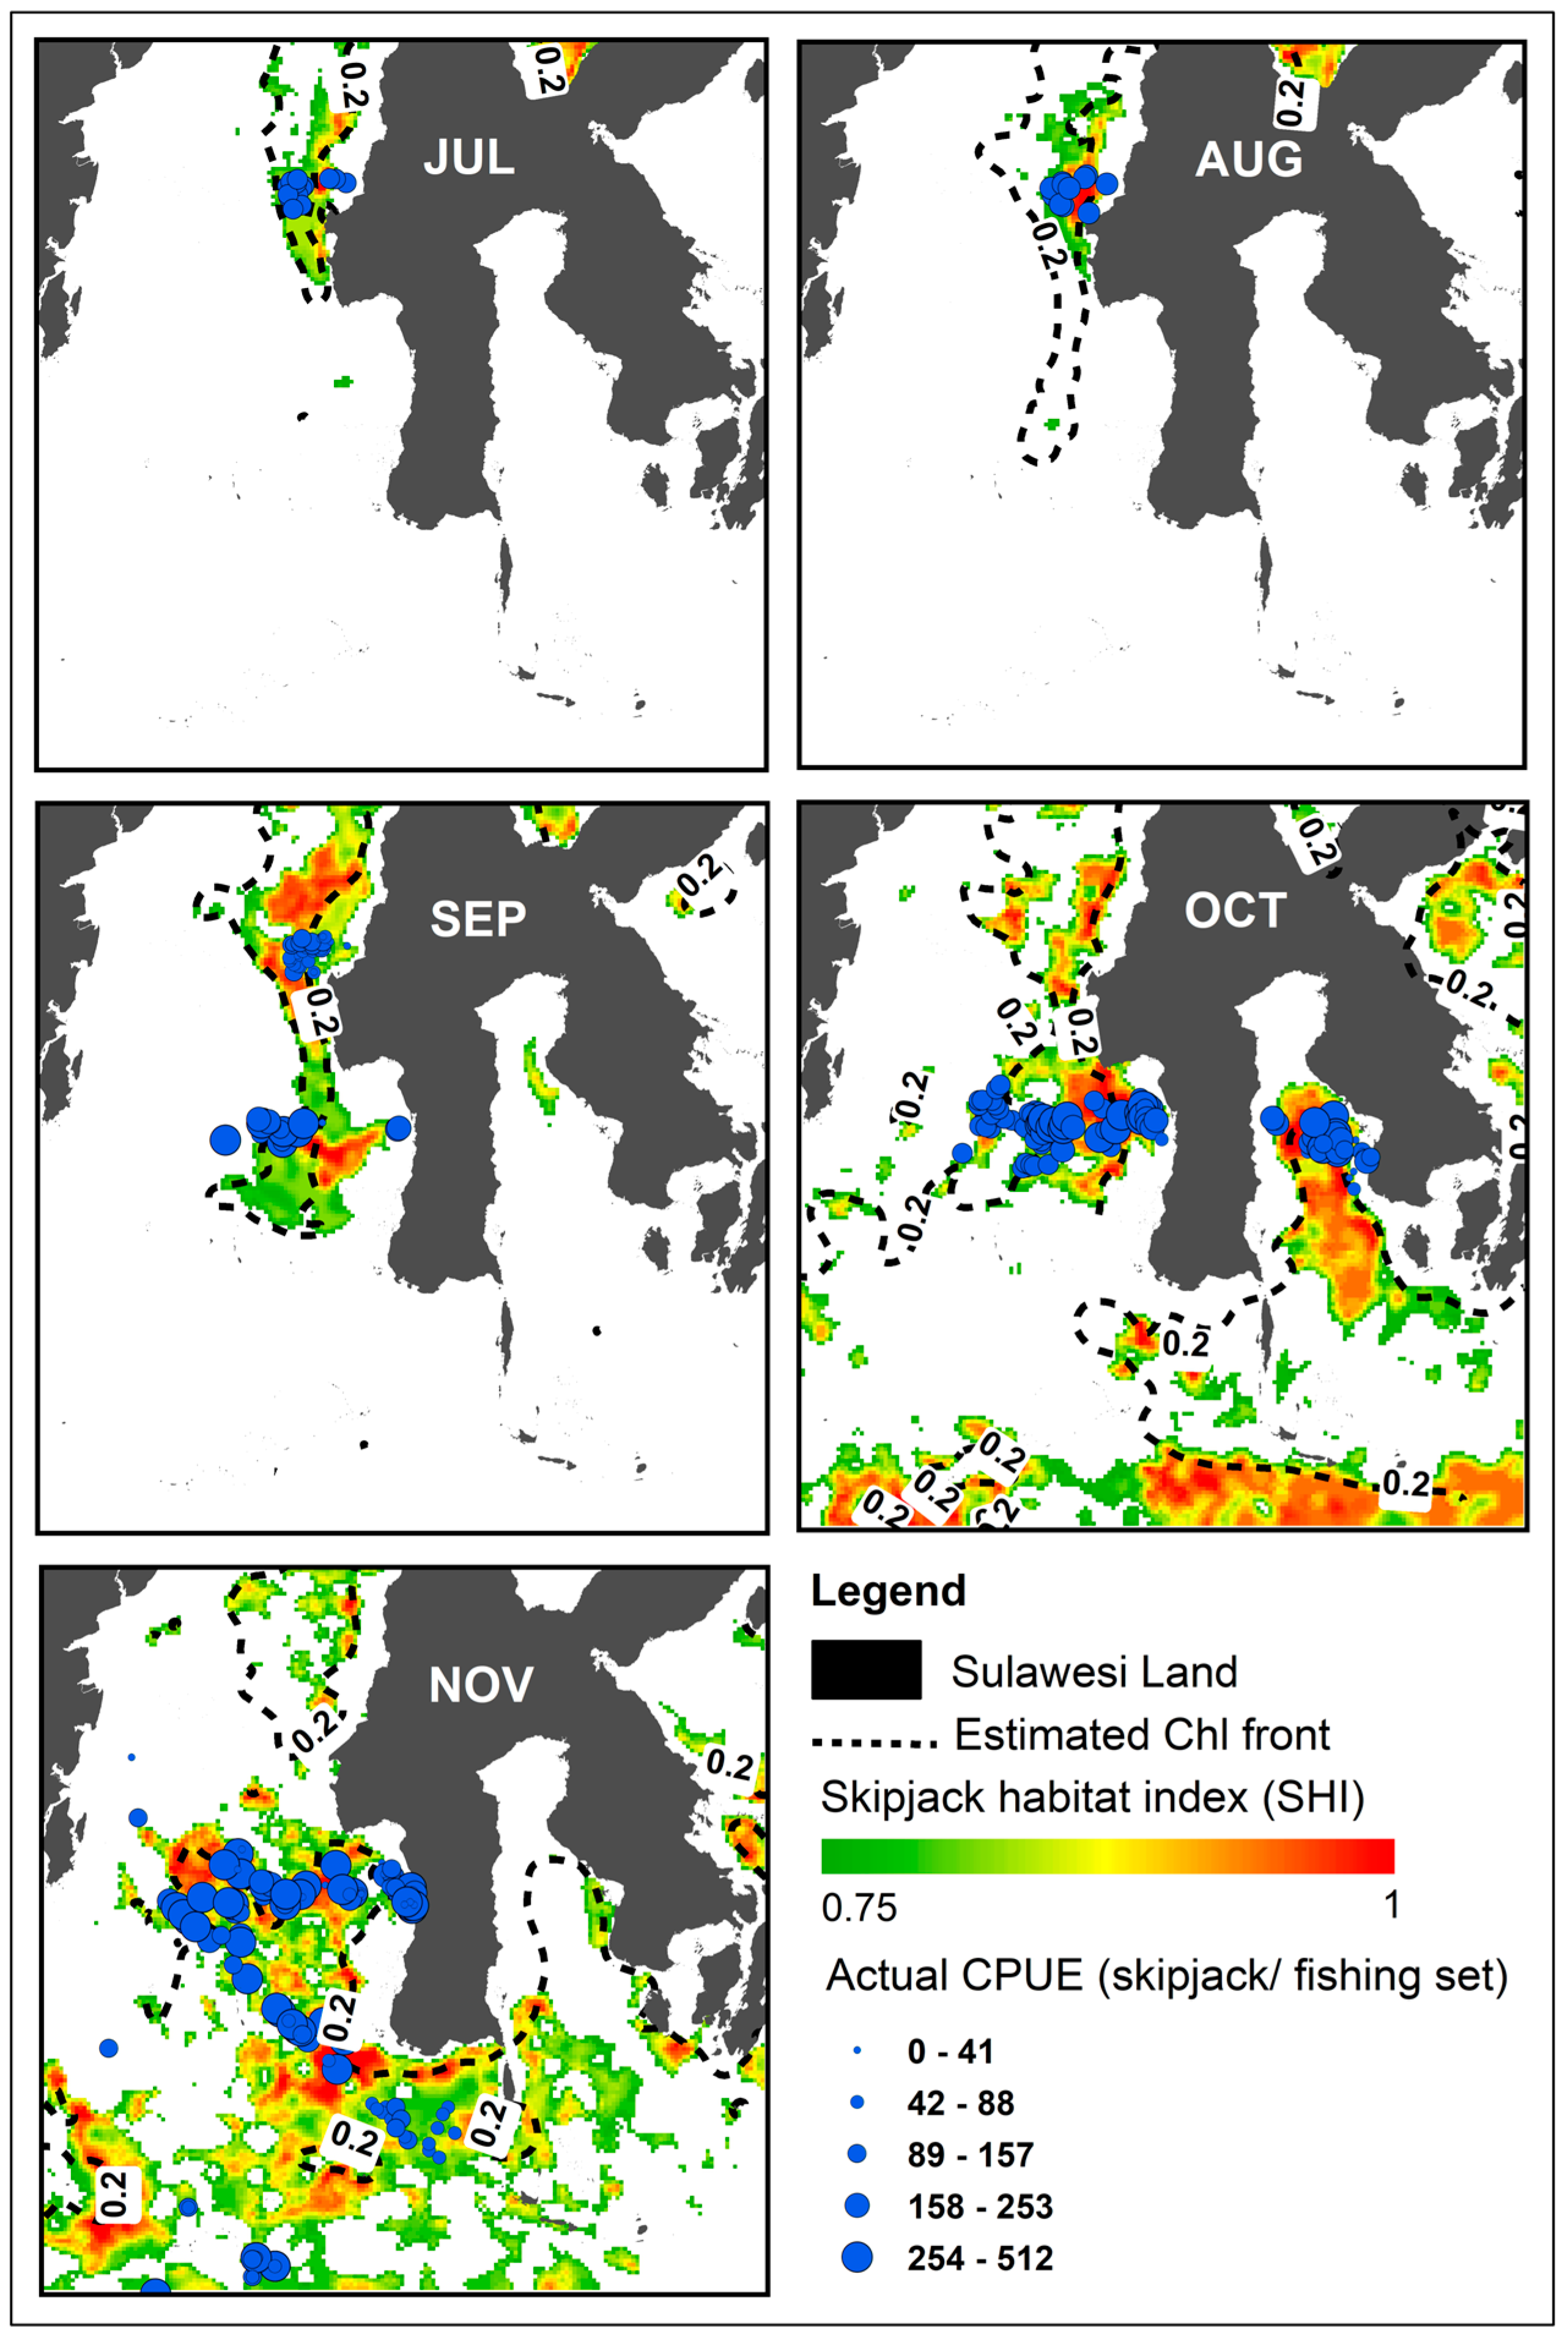
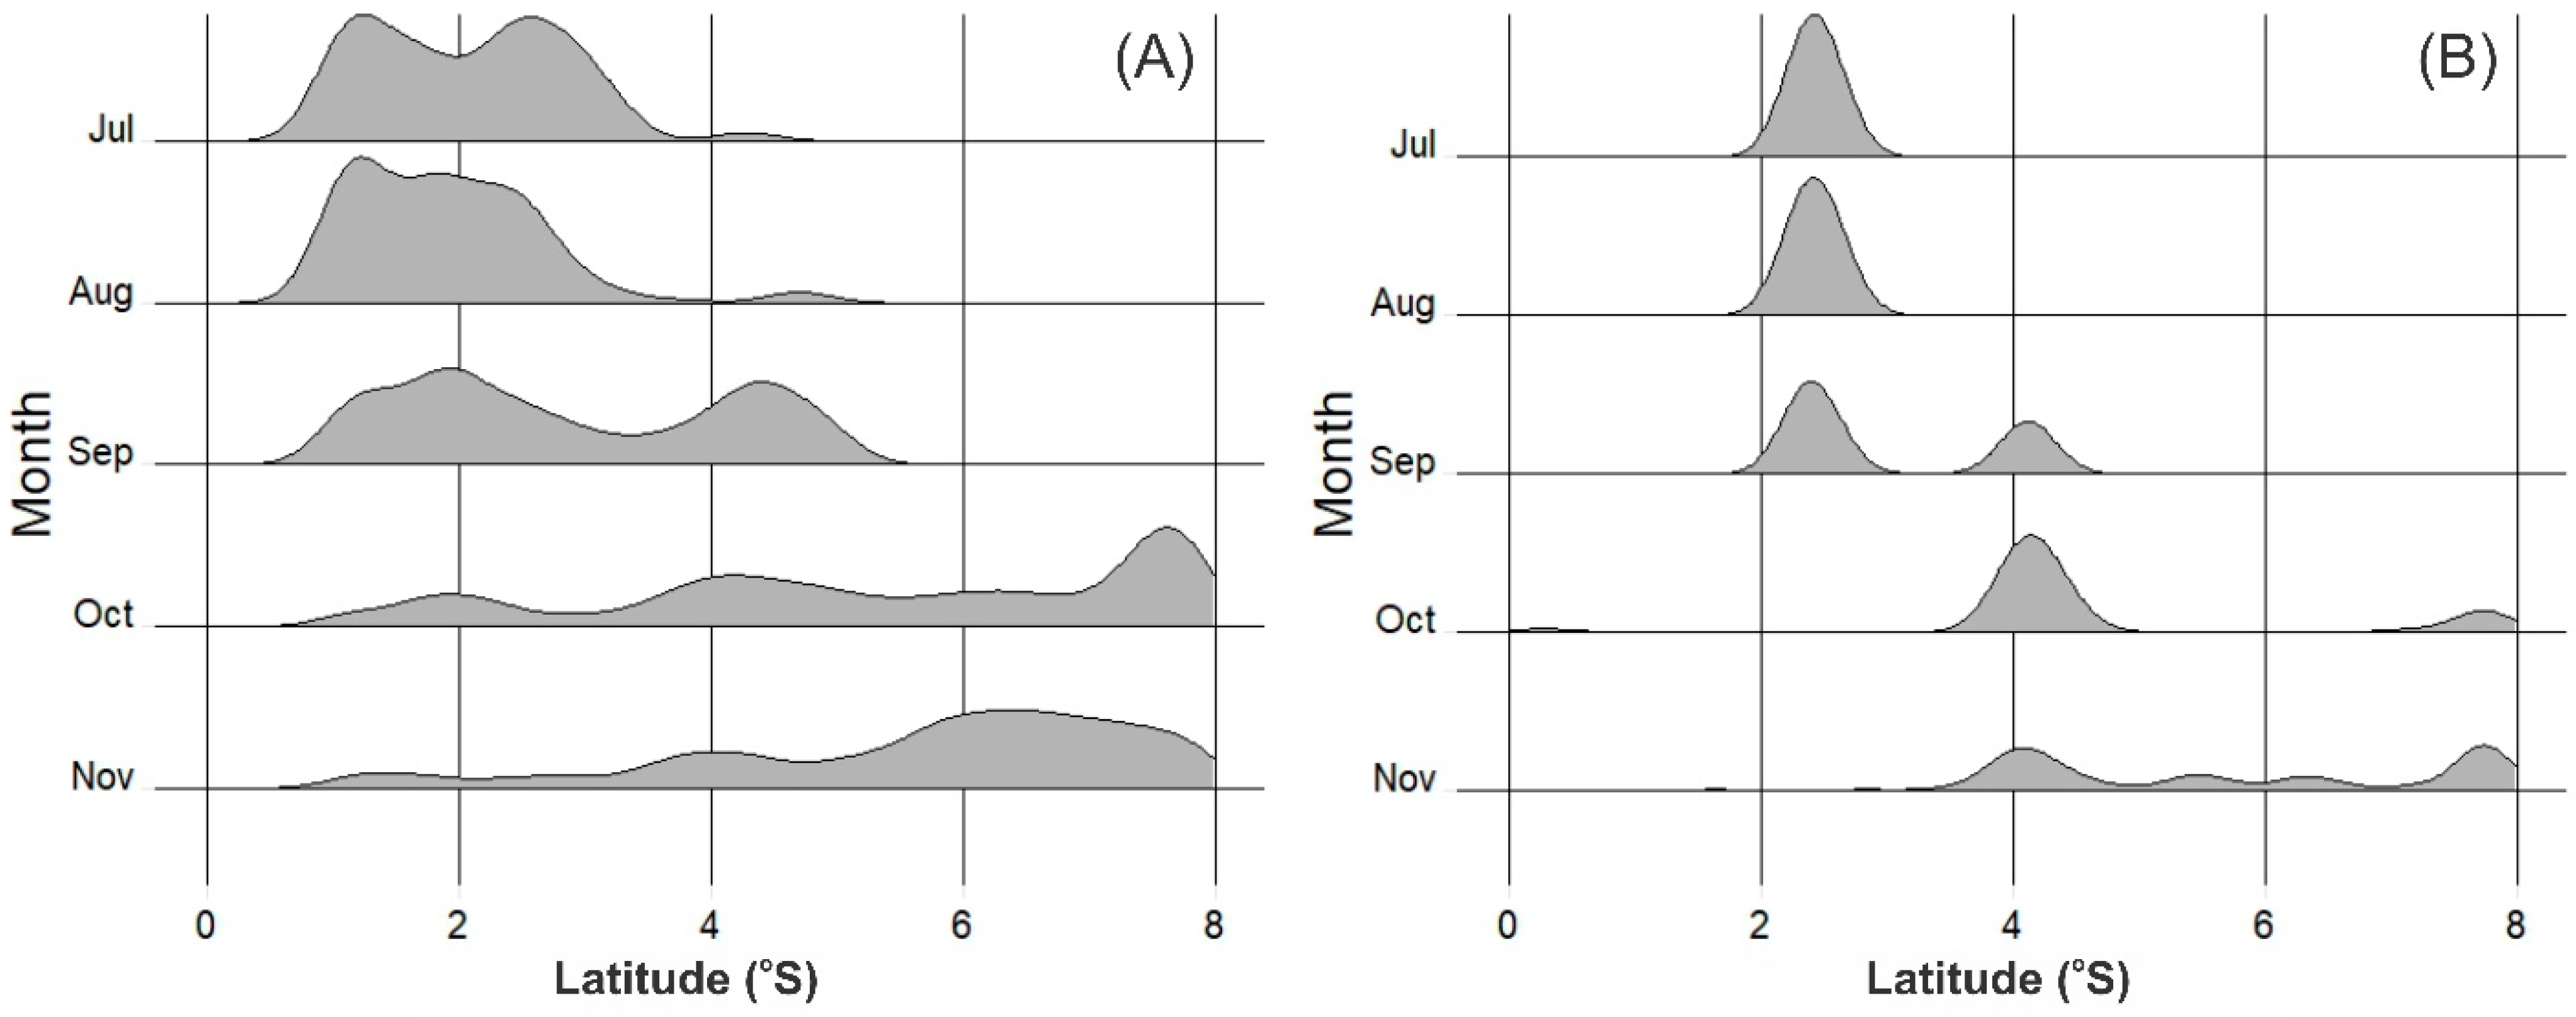
3.4. Movement Pattern of Skipjack Fishing Ground Relative to Habitat Hotspots

Based on the fishing returns of the fishing fleet standard targeting skipjack, the position of the fishing grounds from July through to November 2017 extended from the equator and the northern side of the Makassar Strait to the southern side. When the 0.2 mg m−3 chlorophyll-a isopleth, our proxy for the Chl-a front, was compared to the monthly distribution of CPUE, it was identified that both fishing efforts and the highest CPUEs were concentrated near the front (Figure 10). The purse seine fisheries followed the migrating skipjack, moving southwards from the equator, covering the areas of the Makassar Strait at about 2–3°S and 118–119°E in July–August to reach the Flores Sea in November. Most of the largest catches occurred within the habitat hotspot, especially with the formation of the Chl-a front, suggesting that the skipjack used the Chl-a front pattern as a habitat indicator and movement pathway (Figure 10). The spatial and temporal movement pattern of skipjack tuna density estimated from the SHI from the north of the Makassar Strait to the south (Flores Sea) is associated strongly with the chlorophyll front (Figure 11). This fact seems consistent with the observed fishery movement data (Figure 11). A significant agreement was observed between the distributions of the skipjack CPUE and habitat hotspots during the southward movement (July to November) (Kappa statistic: 0.79).
The skipjack fisheries were distributed within 10 km of the hotspot areas (Figure 12). Skipjack CPUE was specifically higher near the center of the habitat hotspot, i.e., Chl-a fronts (Figure 4 and Figure 10), with the mean CPUE being about 195 fish per fishing set within 5 km of the key habitat and less than 50% of that elsewhere (Figure 12). Skipjack fishermen in the study area apparently took a favorable position with regard to this association by fishing near as possible to the fronts, with 85% of their effort concentrated within 0–5 km of the fronts (Figure 12).

4. Discussion

In the present work, we developed a new spatial model of satellite-based biophysical environmental and catch data to identify the major habitat hotspots and migratory patterns for skipjack tuna in Indonesia Fisheries Management Area (IFMA) 713, western tropical Pacific. This model is constructed from the combination of the GAM and kernel density estimates (KDE). We selected the GAM since it has been proven to be a reliable model for predicting tuna abundance and habitat using remote sensing and fishery data [12,30,40,51,73]. KDE is an effective method for identifying data points with the highest density [54]. This paper uses the KDE to identify the most specific signature of skipjack fishing set intensity linked to their environments. For the commercial skipjack, we were able to characterize the highly productive habitat hotspots from this model (Figure 3, Figure 5 and Figure 9). It is worth noting that the hotspot dynamics may serve as a good predictor of the species’ migration pattern (Figure 10 and Figure 11).
Our study described the commercial skipjack tuna habitat hotspots in IFMA 713 of the western tropical Pacific. This area is the second most productive tuna fishing ground, particularly for skipjack, in Indonesian waters [8]. Most studies investigate tuna habitat and distribution in many different oceans, as characterized by a set of environmental variables for all skipjack catch sizes. However, a description of tuna habitat preferences concerning the feasible size for capture is rarely found in the literature. Here, we focus on analyzing the potential habitat of commercial fish ≥50 cm in fork length, reflecting mature skipjack that are feasible for sustainable fishing. It is interesting to point out that skipjack catch sizes of ≥50 cm were only found in about 27% of total fishing grounds in the IFMA (Figure 2), implying that locating commercial skipjack in a very specialized area considering environmentally friendly fishing poses a significant challenge. This study has global implications for a better understanding of the distribution of commercial skipjack habitat hotspots in the western equatorial Pacific. As a result of this study, sustainable tuna fisheries management and strategies can be improved worldwide.
Our findings highlight that the most preferred bio-physical environments define the commercial skipjack habitat hotspots, with the specific signatures of an SST of 29.5–31 °C and a Chl-a of 0.15–0.28 mg m−3 (Figure 2, Figure 3 and Figure 4). These areas are associated with an enhanced skipjack habitat index (SHI), which reflects the hotspot areas, i.e., a Chl-a front and anticyclonic and cyclonic eddy water circulation (Figure 5 and Figure 9). Eddy distribution and upwelling play significant roles in supporting high-biological-productivity areas in the Makassar Strait and Flores Sea during the southeast monsoon [58,61,62]. Secondary production in high-SHI areas creates promising habitats for skipjack and other tunas. For this reason, eddies, convergence zones, and fronts are important mechanisms for the accumulation of plankton and micronekton [42], which are frequently found around tuna aggregations [74,75]. The favorable SST range is supported by that proposed for skipjack tuna fisheries (around 29–31 °C) in the western and central Pacific Oceans, which has strong links with the SST front [29]. Our result is similar to that recommended for skipjack habitat hotspots in the western Pacific Ocean, which are associated with the salinity front and convergence zone identified by the 29 °C SST isotherm [10]. In the present study, we found a better SST range that is more specific than the previous analysis for all skipjack catch sizes in the Bone Gulf and Flores Sea [13]. In subtropical waters, the potential skipjack fishing grounds are also linked to the thermal front as a habitat hotspot, with an indication of lower SST than in the western tropical Pacific [36,76]. Therefore, it is most likely that commercial skipjack tuna hotspots in the western tropical Pacific are associated strongly with oceanic fronts (thermal, chlorophyll, and salinity fronts) [10,13,29].
Chlorophyll concentration is the sole biological element that can be measured by satellite remote sensing. This serves as an indicator of phytoplankton biomass, an essential indicator of trophic interactions, and provides a good proxy for food availability in marine ecosystems [39,77]. The Chl-a data are useful for identifying fronts and eddies that are not always visible on SST maps or even appear to be different in contrast and provide information on marine biological productivity [43,77,78]. Large schools of tuna congregate around this feature due to increased productivity in the area, where they feed on lower-trophic-level organisms [42,77]. Although SST is the most significant variable in predicting skipjack CPUE (Table 2), this is also strengthened by the previous studies [12,29]; in this paper, we found that the Chl-a front identified by 0.2 mg m−3 provides a reliable proxy for skipjack habitat hotspot throughout a year (Figure 5). This variable is the key factor since it indicates a more specific optimum value than SST (Figure 2 and Figure 3), leading to the best indicator for predicting skipjack forage habitats (Figure 4 and Figure 5).
In contrast, suitable skipjack feeding habitats with a wider range of Chl-a (0.12–5 mg m−3) occur in the eastern central Atlantic Ocean and the western Indian Ocean [39] and western North Pacific [12]. These facts may be related to the high dynamics of the oceanographic structures throughout these regions. The absence of strong hotspot intensity may be the reason for the low effect of Chl-a on the formation of the potential skipjack fishing grounds [29]. A Chl-a concentration near 0.2 mg m−3 is proposed to be a good indicator for favorable commercial skipjack feeding habitats (hotspot areas) in IFMA 713, the western Coral Triangle area, and the western tropical Pacific (Figure 4, Figure 5, Figure 9 and Figure 10). A chlorophyll density greater than 0.2 mg m−3 represents the concentration of planktonic life required for a sustainable and profitable fishery [79]. Albacore tuna in the North Pacific Ocean use areas with a Chl-a concentration of 0.2 mg m−3, known as the Transition Zone Chlorophyll Front, as their feeding habitat and migration route [43]. The possible reasons for the association of tunas with fronts, including the Chl-a front, could be linked to the accumulation of preferable food, confinement to a physiologically optimal temperature spectrum, the use of frontal gradients for thermoregulation, the restriction of visual hunting efficiency due to water clearness, forage habitat, and migration routes [16,43,75,80,81].
In the present paper, our work shows that all the key variables (SST and Chl-a) are highly significant in affecting the variability of skipjack abundance. The results are consistent with the previous findings in many different oceans [12,29,39]. Our models could explain the skipjack CPUE in approximately 30.3% of cases (Table 2), with an accuracy of about 70% (Figure 8), implying that skipjack catch per unit effort (CPUE) increased substantially in areas with the greatest pelagic hotspot indices (SHI) (Table 3). The peak of CPUEs is found in October, in good agreement with the highest SHI (Figure 6 and Figure 7). This month, the greatest CPUEs seem to be associated with an enhanced Chl-a front and the peripheral areas of anticyclonic eddy water circulation, especially in the eastern Indonesian throughflow (ITF) in the Makassar Strait and the cyclonic eddy in the Bone Gulf (Figure 9), creating enhanced forage opportunities (nutrient rich-water). The biophysical importance of the Chl-a front may maintain and increase the populations of species preyed upon by skipjack, such as cephalopods, crustaceans, and small pelagic fish within the area with the preferred temperature [25,26,82]. The local aggregation of prey species is mechanically influenced by the eddy habitat, which results in locally enhanced chlorophyll and zooplankton abundance [74,83], stimulating favorable feeding opportunities [84]. We further suggest that the formation of suitable skipjack potential fishing locations in the peak season was influenced by current circulation from the upwelling area that transferred nutrient-rich water to the fishing grounds in the center of the Makassar Strait [61,62,63]. The eddy-like characteristics then pinpointed the water’s nutrient-rich conditions (eutrophication) (Figure 9).
The monthly distribution of adult skipjack CPUEs and the 0.2 mg m−3 Chl-a isopleth, which serves as our proxy for the Chl-a front, shows that both the fishing set and the highest CPUEs were aggregated within the hotspot areas with the highest SHI (Figure 5, Figure 6, Figure 7, Figure 8, Figure 9 and Figure 10). The fisheries that followed the skipjack’s migration began in the Makassar Strait’s eastern Indonesian throughflow (ITF) waters in July, reached its peak in October, and arrived in the southern region in November (Figure 5 and Figure 9). All of the largest catches occurred within the hotspot points, suggesting that the commercial skipjack tuna used the front as their migration route (Figure 5 and Figure 10). This finding is consistent with the observed fishing ground displacement (Figure 11). The hotspot zones are important congregating spots that significantly improve tuna harvest [10,43]. Interestingly, both skipjack CPUE and the intensity of fishing sets accumulated within 5 km of the habitat hotspots (Figure 12), suggesting that the hotspot signature is an important indicator for successful adult skipjack fishing operations. Nonetheless, we believe that the skipjack hotspots are influenced not only by the eddies and the Chl-a front but also by the seasonal variability of other environmental features. Some possible environmental conditions include thermocline depth distribution, forage abundance, and significant wave heights [85], which may be related to technical fishing operations, intrinsic characteristics of the annual cycle of skipjack in the area (e.g., recruitment, spawning), and other biotic and abiotic variables [35]. These issues will undoubtedly be addressed in future investigations.
We observed that fishermen’s choice of fishing locations was mostly based on previous repetitive experience. The fishermen seem to have practical and effective knowledge concerning the space-time distribution and abundance of fishery resources. They have two fishing strategies: (1) using a fish aggregating device for capturing skipjack; (2) going to a predetermined location and searching for specific environmental indicators suitable for fishing, such as ocean color and temperature features and seabirds. Therefore, this study incorporates non-random sampling, which indeed biases the distribution of the observed field data. We found some fishing points near the port, such as in the Bone Gulf, and some fishing positions far from the fish landing site, such as in the Flores Sea. However, we consider that the hotspot locations (e.g., fronts and eddies) that fishermen search for probably correspond to the real variability of the high abundance and vulnerability of skipjack tuna schools. It is possible to forecast a regional pattern of the habitat hotspots for skipjack by using satellite sensors to characterize ocean color and temperature over vast geographic areas [11,12,29]. This study provides important insights for predicting the location and timing of commercial skipjack hotspot zones to enhance tuna fishing tactics and environmental management. Therefore, our findings have global significance for identifying spatial hotspots, monitoring sustainably harvested skipjack resources, and observing skipjack migration within the western Tropical Pacific.

5. Conclusions

Using a new model with relatively high accuracy based on the link between the key satellite-based environmental data and the best tuna fishery performance, this work defined specifically habitat hotspots for commercial skipjack tuna (with a fish size ≥50 cm) in IFMA 713, western Coral Triangle area, tropical Pacific Ocean. The enhanced skipjack habitat index (SHI) identifies biologically rich habitats, indicating favorable feeding habitats for skipjack tuna (preferred SST and Chl-a). SST is the most significant variable with a wider interval band, while Chl-a is an important predictor that provides a specific habitat signature known as the Chl-a front. We discovered that the Chl-a front and anticyclonic eddy water circulation are primarily linked to the potential habitat hotspots. Commercial skipjack catch per unit effort (CPUE) significantly increased in areas with the greatest SHI, indicating that pelagic hotspots are important in forecasting high-yielding fishing grounds, positioning efficient fish aggregating devices (FADs), monitoring sustainable skipjack fisheries, observing skipjack migration, and developing eco-friendly fishing management and regulation in the western Tropical Pacific. We propose that future studies using long-term fishery datasets with multi-environment remotely sensed satellite data at significantly greater temporal and spatial resolutions could produce better habitat hotspot models.

Supplementary Materials

The following supporting information can be downloaded at: https://www.mdpi.com/article/10.3390/rs15051268/s1, Figure S1: The statistical model predicted CPUEs vs. satellite-derived Chl-a; Figure S2: The statistical model predicted CPUEs vs. satellite-derived SST.

Author Contributions

All authors contributed to this work: conceptualization, M.Z. and B.B.; methodology, M.Z.; software, R.H. and M.B.S.; validation, R.H., Y.N.I. and M.R.; formal analysis, E.S.W. and A.F.; investigation, S.S. and A.F.; resources, M.S. and M.R.; writing—original draft preparation, M.Z.; writing—review and editing, E.S.W. and M.Z.; visualization, R.H. and M.S.; supervision, B.B.; funding acquisition, M.Z. and S.S. All authors have read and agreed to the published version of the manuscript.

Funding

This research was supported by the Indonesia Research Collaboration (R.K.I. 2022) of Hasanuddin University-IPB University-Padjajaran University (SK No.3147/UN4.1/KEP/2022 and Contract No.1377/UN4.22/PT.01.03/2022), and National Competitive Research Grant, PDUPT 2022 (1400/UN4.22/PT.01.03/2022), Ministry of Research, Technology and Higher Education of the Republic of Indonesia.

Data Availability Statement

Not applicable.

Acknowledgments

We acknowledge the use of sea surface temperature and Chl-a data from the ocean color data distributed by NASA via the ocean color portal (http://oceancolor.gsfc.nasa.gov, accessed on 1 March 2019). We thank the Incorporated Company of the Indonesian Government, Kendari Ocean Fishery Port, Southeast Sulawesi, and the Ministry of Marine Affairs and Fisheries of the Republic of Indonesia, Marine Affairs and Fisheries of the South Sulawesi Province, for providing fishery datasets.

Conflicts of Interest

The authors declare no conflict of interest.

References

  1. Arai, T.; Kotake, A.; Kayama, S.; Ogura, M.; Watanabe, Y. Movements and Life History Patterns of the Skipjack Tuna Katsuwonus pelamis in the Western Pacific, as Revealed by Otolith Sr: Ca Ratios. J. Mar. Biol. Assoc. UK 2005, 85, 1211–1216. [Google Scholar] [CrossRef]
  2. ISSF. Status of the World Fisheries for Tuna: Nov. 2022. ISSF Technical Report 2022-15; ISSF: Pittsburgh, PA, USA, 2022. [Google Scholar]
  3. FAO. The State of World Fisheries and Aquaculture 2020. Sustainability in Action; FAO: Roma, Italy, 2020. [Google Scholar]
  4. Hare, S.R.; Williams, P.G.; Jordan, C.C.; Hamer, P.A.; Hampton, W.J.; Scott, R.D. The Western and Central Pacific Tuna Fishery: 2020 Overview and Status of Stocks; Pacific Community: Noumea, New Caledonia, 2021; ISBN 9789820009509. [Google Scholar]
  5. Langley, A.; Hampton, J.; Ogura, M. Stock Assessment of Skipjack Tuna in the Western and Central Pacific Ocean. St Meeting of the Scientific Committee of the Western and Central Pacific Fisheries Commission WCPFC–SC1. 2005, pp. 1–69. Available online: https://www.semanticscholar.org/paper/Stock-assessment-of-skipjack-tuna-in-the-Western-Hoyle-Kleiber/0cc5043b07aa915f9a2ad87996083c7b75854d2a?p2df (accessed on 20 February 2023).
  6. Krogh-Poulsen, B.; McDonald, S.L.; Woodcock, T. Seafood Social Risk Tool: Identifying Risk of Forced Labor, Human Trafficking, and Hazardous Child Labor in the Seafood Industry; Monterey Bay Aquarium Foundation: Monterey, CA USA, 2022. [Google Scholar]
  7. Dignan, S.; Gascoigne, J.; Abdul, H. Indonesia Pole-and-Line and Handline, Skipjack and Yellowfin Tuna of Western and Central Pacific Archipelagic Waters. Public Certification Report. 2021. Available online: https://cert.msc.org/FileLoader/FileLinkDownload.asmx/GetFile?encryptedKey=u/HnmumOkSyuGS/2y9U8IyQB9M+H5lrnbvwCrDXpqrnbHwJpI5DlsM2xL9GlVkec (accessed on 20 February 2023).
  8. Koeshendrajana, S.; Rusastra, W. Potensi Sumber Daya Kelautan Dan Perikanan WPP-NRI 713; AMAFRAD Press: Jakarta, Indonesia, 2019; ISBN 9786025791710. [Google Scholar]
  9. Loneragan, N.; Wiryawan, B.; Hordyk, A.; Halim, A. Proceedings From Workshops on Management Strategy Evaluation of Data-Limited Fisheries; MurdochUniversity: Murdoch, Australia; IPB University: Bogor, Indonesia, 2021; ISBN 9780646829517. [Google Scholar]
  10. Lehodey, P.; Bertignac, M.; Hampton, J.; Lewis, A.; Picaut, J. El Niῆo Southern Oscillation and Tuna in the Western Pacific. Nature 1997, 389, 715–718. [Google Scholar] [CrossRef]
  11. Bertignac, P.; Lehodey, P.; Hampton, J. A Spatial Population Dynamics Simulation Model of Tropical Tunas Using a Habitat Index Based on Environmental Parameters. Fish. Oceanogr. 1998, 7, 326–334. [Google Scholar] [CrossRef]
  12. Mugo, R.; Saitoh, S.; Nihira, A.; Kuroyama, T. Habitat Characteristics of Skipjack Tuna ( Katsuwonus pelamis) in the Western North Pacific: A Remote Sensing Perspective. Fish. Oceanogr. 2010, 19, 382–396. [Google Scholar] [CrossRef]
  13. Zainuddin, M.; Farhum, A.; Safruddin, S.; Selamat, M.B.; Sudirman, S.; Nurdin, N.; Syamsuddin, M.; Ridwan, M.; Saitoh, S.-I. Detection of Pelagic Habitat Hotspots for Skipjack Tuna in the Gulf of Bone-Flores Sea, Southwestern Coral Triangle Tuna, Indonesia. PLoS ONE 2017, 12, e0185601. [Google Scholar] [CrossRef] [Green Version]
  14. Lehodey, P. Impacts of the El Niño Southern Oscillation on Tuna Populations and Fisheries in the Tropical Pacific Ocean. Prog. Oceanogr. 2001, 49, 439–468. [Google Scholar] [CrossRef]
  15. Brill, R.W. A Review of Temperature and Oxygen Tolerance Studies of Tunas Pertinent to Fisheries Oceanography, Movement Models and Stock Assessments. Fish. Oceanogr. 1994, 3, 204–216. [Google Scholar] [CrossRef]
  16. Barkley, A.; Neill, W.H.; Gooding, R.M. Skipjack Tuna, Katsuwonus pelamis, Habitat Based on Temperature and Oxygen Requirements. Fish. Bulletin. 1978, 76, 653–662. [Google Scholar]
  17. Chen, G.; Yang, J.; Han, G. Remote Sensing of Environment Eddy Morphology: Egg-like Shape, Overall Spinning, and Oceanographic Implications. Remote Sens. Environ. 2021, 257, 112348. [Google Scholar] [CrossRef]
  18. Kiyofuji, H.; Aoki, Y.; Kinoshita, J.; Okamoto, S.; Masujima, M.; Matsumoto, T.; Fujioka, K. Progress in Oceanography Northward Migration Dynamics of Skipjack Tuna (Katsuwonus pelamis) Associated with the Lower Thermal Limit in the Western Pacific Ocean. Prog. Oceanogr. 2019, 175, 55–67. [Google Scholar] [CrossRef]
  19. Alatorre-Ramirez, V.G.; Galván-Magaña, F.; Torres-Rojas, Y.E.; Olson, R.J. Trophic Segregation of Mixed Schools of Yellowfin Tuna (Thunnus albacares) and Skipjack Tuna (Katsuwonus pelamis) Caught in the Eastern Tropical Pacific Ocean. Fish. Bulletin. 2017, 115, 252–268. [Google Scholar] [CrossRef] [Green Version]
  20. Venegas, R.; Oliver, T.; Brainard, R.E.; Santos, M.; Geronimo, R.; Widlansky, M. Climate-Induced Vulnerability of Fisheries in the Coral Triangle: Skipjack Tuna Thermal Spawning Habitats. Fish. Oceanogr. 2019, 28, 117–130. [Google Scholar] [CrossRef]
  21. Sund, P.N.; Balckburn, M.; Williams, F. Tunas and Their Environment in the Pacific Ocean: A Review. Oceanogr. Mar. Biol. Ann. Rev. 1981, 19, 443–512. [Google Scholar]
  22. Lehodey, P.; Bertignac, M.; Stoens, A.; Memery, L.; Grima, N. Predicting Skipjack Tuna Forage Distributions in the Equatorial Pacific Using a Coupled Dynamical Bio-Geochemical Model. Fish. Oceanogr. 1998, 7, 317–325. [Google Scholar] [CrossRef]
  23. Evans, R.H.; McLain, D.R.; Bauer, R.A. Atlantic Skipjack Tuna: Their Vulnerability to Surface Fishing Gear. Mar. Fish. Rev. 1981, 43, 1–11. [Google Scholar]
  24. Ashida, H.; Gosho, T.; Watanabe, K.; Okazaki, M.; Tanabe, T. Reproductive Traits and Seasonal Variations in the Spawning Activity of Female Albacore, Thunnus alalunga, in the Subtropical Western North Pacific Ocean. J. Sea Res. 2020, 160–161, 101902. [Google Scholar] [CrossRef]
  25. Iizuka, K.; Asano, M.; Naganuma, A. Feeding Habits of Skipjack Tuna Katsuwonus-pelamis Linnaeus Caught by Pole and Line and the State of Young Skipjack Tuna Distribution in the Tropical Seas of the Western Pacific Ocean. Bull. Tohoku Natl. Fish. Res. Inst. 1989, 51, 107–116. [Google Scholar]
  26. Boehlert, G.W.; Mundy, B.C. Vertical and Onshore-Offshore Distributional Patterns of Tuna Larvae in Relation to Physical Habitat Features. Mar. Ecol. Prog. Ser. 1994, 107, 1–14. [Google Scholar] [CrossRef]
  27. Azwir, A.; Muchlisin, Z.A.; Ramadhani, I. The Study on the Fish Food Habits of Skipjack (Katsuwonus pelamis) and Frigate Tuna (Auxis thazard). J. Nat. 2004, 4, 20–23. (In Indonesian) [Google Scholar]
  28. Hany Restiangsih, Y.; Amri, K. Biological Aspects and Food Habits of Skipjack Tuna (Katsuwonus pelamis) in Flores Sea and Adjacent Waters. BAWAL 2018, 10, 187–196. [Google Scholar]
  29. Hsu, T.Y.; Chang, Y.; Lee, M.A.; Wu, R.F.; Hsiao, S.C. Predicting Skipjack Tuna Fishing Grounds in the Western and Central Pacific Ocean Based on High-spatial-Temporal-resolution Satellite Data. Remote Sens. 2021, 13, 861. [Google Scholar] [CrossRef]
  30. Arrizabalaga, H.; Dufour, F.; Kell, L.; Merino, G.; Ibaibarriaga, L.; Chust, G.; Irigoien, X.; Santiago, J.; Murua, H.; Fraile, I.; et al. Global Habitat Preferences of Commercially Valuable Tuna. Deep-Sea Res. II 2015, 113, 102–112. [Google Scholar] [CrossRef] [Green Version]
  31. Graham, J.B.; Dickson, K.A. Tuna Comparative Physiology. J. Exp. Biol. 2004, 207, 4015–4024. [Google Scholar] [CrossRef] [Green Version]
  32. Madureira, L.S.P.; Coletto, J.L.; Pinho, M.P.; Weigert, S.C.; Varela, C.M.; Campello, M.E.S.; Llopart, A. Skipjack (Katsuwonus pelamis) Fishery Improvement Project: From Satellite and 3D Oceanographic Models to Acoustics, towards Predator-Prey Landscapes. In Proceedings of the 2017 IEEE/OES Acoustics in Underwater Geosciences Symposium, RIO Acoustics 2017, Rio de Janeiro, Brazil, 25–27 January 2018; pp. 1–7. [Google Scholar] [CrossRef]
  33. Collette, B.B.; Nauen, C.E. FAO Species Catalogue Vol. 2. Scombrids of the World : An Annotated and Illustrated Catalogue of Tunas, Mackerels, Bonitos, and Related Species Known to Date. 1983, Volume 2. Available online: https://www.cabdirect.org/cabdirect/abstract/19841458934 (accessed on 20 February 2023).
  34. Stéquert, B.; Ramcharrun, B. La Reproduction Du Listao (Katsuwonus pelamis) Dans Le Bassin Ouest de l’ocean Indien. Aquat. Living Resour. 1996, 9, 235–247. [Google Scholar] [CrossRef] [Green Version]
  35. Andrade, H.A.; Garcia, C.A.E. Skipjack Tuna Fishery in Relation to Sea Surface Temperature off the Southern Brazilian Coast. Fish. Oceanogr. 1999, 8, 245–254. [Google Scholar] [CrossRef]
  36. Andrade, H.A. The Relationship between the Skipjack Tuna (Katsuwonus pelamis) Fishery and Seasonal Temperature Variability in the South-Western Atlantic. Fish. Oceanogr. 2003, 12, 10–18. [Google Scholar] [CrossRef]
  37. Ashida, H. Spatial and Temporal Differences in the Reproductive Traits of Skipjack Tuna Katsuwonus pelamis between the Subtropical and Temperate Western Pacific Ocean. Fish. Res. 2020, 221, 105352. [Google Scholar] [CrossRef]
  38. Druon, J.N.; Chassot, E.; Murua, H.; Soto, M. Preferred Feeding Habitat of Skipjack Tuna in the Eastern Central Atlantic and Western Indian Oceans: Relations with Carrying Capacity and Vulnerability to Purse Seine Fishing. In Proceedings of the IOTC Proceedings, Colombo, Sri Lanka, 6–10 September 2016. [Google Scholar]
  39. Druon, J.N.; Chassot, E.; Murua, H.; Lopez, J. Skipjack Tuna Availability for Purse Seine Fisheries Is Driven by Suitable Feeding Habitat Dynamics in the Atlantic and Indian Oceans. Front. Mar. Sci. 2017, 4. [Google Scholar] [CrossRef]
  40. Zainuddin, M.; Saitoh, K.; Saitoh, S.-I. Albacore (Thunnus alalunga) Fishing Ground in Relation to Oceanographic Conditions in the Western North Pacific Ocean Using Remotely Sensed Satellite Data. Fish. Oceanogr. 2008, 17, 61–73. [Google Scholar] [CrossRef] [Green Version]
  41. Laurs, R.M.; Fiedler, P.C.; Montgomery, D.R. Albacore Tuna Catch Distributions Relative to Environmental Features Observed from Satellites. Deep-Sea Res. 1984, 31, 1085–1099. [Google Scholar] [CrossRef]
  42. Zainuddin, M.; Kiyofuji, H.; Saitoh, K.; Saitoh, S. Using Multi-Sensor Satellite Remote Sensing and Catch Data to Detect Ocean Hot Spots for Albacore (Thunnus alalunga) in the Northwestern North Pacific. Deep-Sea Res. II 2006, 53, 419–431. [Google Scholar] [CrossRef]
  43. Polovina, J.J.; Howell, E.; Kobayashi, D.R.; Seki, M.P. The Transition Zone Chlorophyll Front, a Dynamic Global Feature Defining Migration and Forage Habitat for Marine Resources. Prog. Oceanogr. 2001, 49, 469–483. [Google Scholar] [CrossRef]
  44. Domokos, R.; Seki, M.P.; Polovina, J.J.; Hawn, D.R. Oceanographic Investigation of the American Samoa Albacore (Thunnus alalunga) Habitat and Longline Fishing Grounds. Fish. Oceanogr. 2007, 16, 555–572. [Google Scholar] [CrossRef]
  45. Harsono, G.; Manurung, D.; Atmadipoera, A.S.; Baskoro, M.S.; Syamsudin, F. Halmahera Eddy Displacement in Relation to Skipjack Productivity in Surrounding Waters. J. Teknol. Perikan. Dan Kelaut. 2014, 5, 147–154. [Google Scholar]
  46. Istnaeni, Z.D.; Zainuddin, M. The Impact of Oceanographic Parameters Changes on The Distribution and Abundance of Skipjack Tuna Katsuwonus pelamis in Makassar Strait. J. Ilmu Dan Teknol. Kelaut. Trop. 2019, 11, 171–180. [Google Scholar] [CrossRef]
  47. Hastie, T.; Tibshirani, R. Generalized Additive Models; Chapman and Hall: London, UK, 1990; p. 356. [Google Scholar]
  48. Drexler, M.; Ainsworth, C.H. Generalized Additive Models Used to Predict Species Abundance in the Gulf of Mexico: An Ecosystem Modeling Tool. PLoS ONE 2013, 8, e0064458. [Google Scholar] [CrossRef] [PubMed] [Green Version]
  49. Bigelow, K.A.; Boggs, C.H.; He, X. Environmental Effects on Swordfish and Blue Shark Catch Rates in the US North Pacific Longline Fishery. Fish. Oceanogr. 1999, 8, 178–198. [Google Scholar] [CrossRef]
  50. Moisen, G.G.; Frescino, T.S. Comparing Five Modelling Techniques for Predicting Forest Characteristics. Ecol. Model. 2002, 157, 209–225. [Google Scholar] [CrossRef] [Green Version]
  51. Mugo, R.; Saitoh, S.-I. Ensemble Modelling of Skipjack Tuna (Katsuwonus pelamis) Habitats in the Western North Pacific Using Satellite Remotely Sensed Data; a Comparative Analysis Using Machine-Learning Models. Remote Sens. 2020, 12, 2591. [Google Scholar] [CrossRef]
  52. Katsanevakis, S.; Maravelias, C.D. Bathymetric Distribution of Demersal Fish in the Aegean and Ionian Seas Based on Generalized Additive Modeling. Fish. Sci. 2009, 75, 13–23. [Google Scholar] [CrossRef]
  53. Chen, Q.; Wynne, R.J.; Goulding, P.; Sandoz, D. The Application of Principal Component Analysis and Kernel Density Estimation to Enhance Process Monitoring. Control. Eng. Pr. 2000, 8, 531–543. [Google Scholar] [CrossRef]
  54. Węglarczyk, S. Kernel Density Estimation and Its Application. ITM Web Conf. 2018, 23, 00037. [Google Scholar] [CrossRef]
  55. Ramos, A.G.; Santiago, J.; Sangra, P.; Canton, M. An Application of Satellite-Derived Sea Surface Temperature Data to the Skipjack (Katsuwonus pelamis Linnaeus, 1758) and Albacore Tuna (Thunnus alalunga Bonaterre, 1788) Fisheries in the North-East Atlantic. Int. J. Remote Sens. 1996, 17, 749–759. [Google Scholar] [CrossRef]
  56. Mallawa, A.; Amir, F.; Zainuddin, M. Biological Performance Aspect of Skipjack Tuna (Katsuwonus pelamis) Population Captured by Purse Seine in East Season at Flores Sea. J. IPTEKS PSP 2014, 1, 129–145. [Google Scholar]
  57. Mallawa, A.; Amir, F.; Mallawa, E. Sustainability of Fishing Technologies of Skipjack Tuna (Katsuwonus pelamis) in Bone Bay Waters, South Sulawesi Oleh. Mar. Fish. 2018, 9, 93–106. [Google Scholar]
  58. Gordon, A.L. Oceanography of the Indonesian Seas and their Throughflow. Oceanography 2005, 18, 14–27. [Google Scholar] [CrossRef] [Green Version]
  59. Qu, T.; Du, Y.; Strachan, J.; Meyers, G.; Slingo, J. Sea Surface Temperature and Its Variability in the Indonesian Region. Oceanography 2005, 18, 50–61. [Google Scholar] [CrossRef] [Green Version]
  60. Sprintall, J.; Liu, T. Ekman Mass and Heat Transport in the Indonesia Seas. Oceanography 2005, 18, 88–97. [Google Scholar] [CrossRef] [Green Version]
  61. Agus, S. Atmadipoera and Priska Widyastuti A Numerical Modeling Study on Upwelling Mechanism in Southern Makassar Strait. Ilmu Dan Teknol. Kelaut. Trop. 2014, 6, 355–372. [Google Scholar]
  62. Nuzula, F.; Syamsudin, M.L.; Yuliadi, L.P.S.; Purba, N.P. Martono Eddies Spatial Variability at Makassar Strait—Flores Sea. IOP Conf. Ser. Earth Environ. Sci. PAPER 2017, 54, 1–10. [Google Scholar] [CrossRef]
  63. Hendiarti, N.; Suwarso; Aldrian, E.; Amri, K.; Andiastuti, R.; Sachoemar, S.; Wahyono, I.B. Seasonal Variation of Pelagic Fish Catch Around Java. Oceanography 2005, 18, 112–123. [Google Scholar] [CrossRef]
  64. Ashida, H.; Tanabe, T.; Suzuki, N. Recent Progress on Reproductive Biology of Skipjack Tuna in the Tropical Region of the Western and Central Pacific Ocean. In Proceedings of the 5th Regular Session of the Scientific Committee, Port Vila, Vanuatu, 10–21 August 2009. [Google Scholar]
  65. Jamal, M.; Sondita, F.A.; Wiryawan, B.; Haluan, J.; Pemanfaatan, J.; Perikanan, S.; Perikanan, F.; Kelautan, I.; Pemanfaatan, D. Management Concept of Skipjack Tuna (Katsuwonus pelamis) Fisheries Within Bone Bay Zone in The Perspective of Sustainability. J. IPTEKS PSP 2014, 1, 196–207. [Google Scholar]
  66. Zainuddin, M.; Saitoh, S.-I.; Saitoh, K. Detection of Potential Fishing Ground for Albacore Tuna Using Synoptic Measurements of Ocean Color and Thermal Remote Sensing in the Northwestern North Pacific. Geophys. Res. Lett. 2004, 31. [Google Scholar] [CrossRef]
  67. Bertrand, A.; Josse, E.; Bach, P.; Gros, P.; Dagorn, L. Hydrological and Trophic Characteristics of Tuna Habitat: Consequences on Tuna Distribution and Longline Catchability Résumé. Can. J. Fish. Aquat. Sci. 2002, 59, 1002–1013. [Google Scholar] [CrossRef] [Green Version]
  68. Richards, L.J.; Schnute, J.T. An Experimental and Statistical Approach to the Question: Is CPUE an Index of Abundance? Can. J. Fish. Aquat. Sci. 1986, 43, 1214–1227. [Google Scholar] [CrossRef]
  69. Wood, S. Generalized Additive Models, An Introduction with R; Chapman and Hall: London, UK, 2006. [Google Scholar]
  70. Johnson, J.B.; Omland, K.S. Model Selection in Ecology and Evolution. Trends Ecol. Evol. 2004, 19, 101–108. [Google Scholar] [CrossRef]
  71. Nurdin, S.; Mustapha, M.A.; Lihan, T.; Zainuddin, M. Applicability of Remote Sensing Oceanographic Data in the Detection of Potential Fishing Grounds of Rastrelliger kanagurta in the Archipelagic Waters of Spermonde, Indonesia. Fish. Res. 2017, 196, 1–12. [Google Scholar] [CrossRef]
  72. Wessel, P.; Smith, W.H.F.; Scharroo, R.; Luis, J.; Wobbe, F. Generic Mapping Tools: Improved Version Released. EOS 2013, 94, 409–410. [Google Scholar] [CrossRef] [Green Version]
  73. Lan, K.; Shimada, T.; Lee, M.; Su, N.; Chang, Y. Using Remote-Sensing Environmental and Fishery Data to Map Potential Yellowfin Tuna Habitats in the Tropical Pacific Ocean. Remote Sens. 2017, 9, 444. [Google Scholar] [CrossRef] [Green Version]
  74. Owen, R.W. Fronts and Eddies in the Sea: Mechanisms, Interaction and Biological Effects; Academic Press: New York, NY, USA, 1981; pp. 197–234. [Google Scholar]
  75. Bakun, A. Fronts and Eddies as Key Structures in the Habitat of Marine Fish Larvae: Opportunity. Adapt. Response 2006, 70, 105–122. [Google Scholar]
  76. Uda, M. Pulsative Fluctuation of Oceanic Fronts in Association with Tuna Fishing Ground and Fisheries. J. Fac. Mar. Sci. Technol. Tokai Univ. 1973, 7, 245–266. [Google Scholar]
  77. Wilson, C.; Morales, J.; Nayak, S.; Asanuma, I.; Feldman, G. Ocean-color radiometry and fisheries. In Why OceanColour? The Societal Benefits of Ocean-Color Technology; Platt, T., Hoepffner, N., Stuart, V., Eds.; Reports ofthe International Ocean-Color Coordinating Group, No. 7; IOCCG: Dartmouth, NS, Canada, 2008; pp. 47–58. [Google Scholar]
  78. Seki, M.P.; Polovina, J.J.; Brainard, R.E.; Bidigare, R.R.; Leonard, C.L.; Foley, D.G. Biological Enhancement at Cyclonic Eddies Tracked with GOES Thermal Imagery in Hawaiian Waters. Geophys. Res. Lett. 2001, 28, 1583–1586. [Google Scholar] [CrossRef] [Green Version]
  79. Gower, J.F.R. A Survey of the Uses of Remote Sensing from Aircraft and Satellites in Oceanography and Hydrography. Pac. Mar. Sci. Rep. Inst. Ocean. Sci. 1972, 72, 39. [Google Scholar]
  80. Olson, B.D.B.; Hitchcock, G.L.; Mariano, A.J.; Ashjian, C.J.; Peng, G.; Nero, R.W.; Podest, G.P. Life on the Edge: Marine Life and Fronts. Oceanography 1994, 7, 52–60. [Google Scholar] [CrossRef] [Green Version]
  81. Kirby, D.S.; Fiksen, Y.; Hart, P.J.B. A Dynamic Optimisation Model for the Behaviour of Tunas at Ocean Fronts. Fish. Oceanogr. 2000, 9, 328–342. [Google Scholar] [CrossRef] [Green Version]
  82. Tanabe, T. Feeding Habits of Skipjack Tuna Katsuwonus pelamis and Other Tuna Thunnus Spp. Juveniles in the Tropical Western Pacific. Fish. Sci. 2001, 67, 563–570. [Google Scholar] [CrossRef]
  83. Zhang, J.-Z.; Wanninkhof, R.; Lee, K. Enhanced New Production Observed from the Diurnal Cycle of Nitrate in an Oligotrophic Anticyclonic Eddy. Geophys. Res. Lett. 2001, 28, 1579–1582. [Google Scholar] [CrossRef]
  84. Logerwell, E.A.; Smith, P.E. Mesoscale Eddies and Survival of Late Stage Pacific Sardine (Sardinops sagax) Larvae. Fish. Oceanogr. 2001, 10, 13–25. [Google Scholar] [CrossRef]
  85. Duan, W.; He, B.; Yi Wang, K. Climate Change Impacts on Wave Characteristics along the Coast of Japan from 1986 to 2012. J. Coast. Res. 2014, 68, 97104. [Google Scholar] [CrossRef]
Figure 1. The map of the study area, illustrating the major environmental characteristics of Indonesia Fisheries Management Area (IFMA) 713 (1–8°S and 116–123°E).
Remotesensing 15 01268 g001
Figure 2. Probability density distribution of SST (A) and Chl-a (B) estimated from Aqua/MODIS for all skipjack catches (n = 1248) and that of SST (C) and Chl-a (D) for commercial (mature) skipjack tuna (n = 333) caught in the study area (IFMA 713) from 2007 to 2016. The vertical dash line indicates the average of the data.
Remotesensing 15 01268 g002
Figure 3. The effects of SST and Chl-a on commercial skipjack deviance (log-transformed) were determined using a generalized additive model (GAM). The model incorporates all explanatory variables (GAM). On the x-axis, the rug plot indicates the relative frequency of data points. The dashed lines signify 95% confidence levels.
Remotesensing 15 01268 g003
Figure 4. Three-dimensional relationship between GAM predicted skipjack CPUE (catch per unit effort) (A) and the 2D relationship between KDE fishing sets and satellite data, SST, and Chl-a at the fishing ground spots (B).
Remotesensing 15 01268 g004
Figure 5. Spatial and temporal distribution of particular Chl-a signature 0.2 mg m−3 overlain on predicted habitat hotspot shown as averaged skipjack habitat index (SHI) image maps from January to December 2007–2016.
Remotesensing 15 01268 g005
Figure 6. Temporal variability of mean skipjack CPUE (A) and skipjack habitat index/SHI (B) from January to December 2007–2016.
Remotesensing 15 01268 g006
Figure 7. The study area’s temporal variability of SHI from January to December, especially in the main potential fishing grounds (3–5°S latitude and 118–122°E longitude). The dashed line indicates the average SHI.
Remotesensing 15 01268 g007
Figure 8. A scatter plot of the skipjack habitat index (SHI) against total CPUE values (p < 0.0001, R2 = 0.70).
Remotesensing 15 01268 g008
Figure 9. Cross-validation CPUE for skipjack tuna (shown as a black circle) in 2017 (left panel) and 2018 (right panel) superimposed on predicted habitat hotspots and multiple environmental habitat characteristics.
Remotesensing 15 01268 g009
Figure 10. Skipjack CPUE (fish/fishing set) spatial distribution pattern (shown as dots) for July–November 2017 overlain with habitat hotspots and a 0.2 mg m−3 surface chlorophyll concentration.
Remotesensing 15 01268 g010
Figure 11. Spatial and temporal movement of estimated SHI ≥ 0.75 from the model (A) and the density of observed skipjack fishery data (B).
Remotesensing 15 01268 g011
Figure 12. Catch per unit effort (skipjack/fishing set, black circles) and the number of fishing efforts (open black bars) for distance to nearest habitat hotspots with SHI ≥ 0.75 (N = 170).
Remotesensing 15 01268 g012
Table 1. List of remotely sensed satellite data used to define mature skipjack tuna habitat hotspots.
Oceanographic ParametersUnitSpatial FootprintTemporal Resolution
Sea Surface Temperature°C4 × 4 kmMonthly
Chl-a concentrationmg m−34 × 4 kmMonthly
Net primary productivitygr C m−2 month−19 × 9 kmMonthly
Current velocity (U,V)m s−18 km × 8 kmMonthly
Table 2. Final GAM construction summary for the approximate significance of smooth terms.
VariableEdfRef.dfFp-ValueCDE (%)
s(SST)8.5918.94712.688<2 × 10⁻¹⁶
s(Chl-a)6.9848.0192.7160.00632
Total 30.3
Table 3. Average skipjack CPUE against SHI for validating untrained data of 2017 and 2018.
SHIAverage Skipjack CPUE (Fish/Setting)
0.10
0.2110
0.3200
0.420
0.5398
0.6514
0.7940
0.81456
0.92008
1.02420
Disclaimer/Publisher’s Note: The statements, opinions and data contained in all publications are solely those of the individual author(s) and contributor(s) and not of MDPI and/or the editor(s). MDPI and/or the editor(s) disclaim responsibility for any injury to people or property resulting from any ideas, methods, instructions or products referred to in the content.

