Article

Evaluation of Hourly Precipitation Characteristics from a Global Reanalysis and Variable-Resolution Global Model over the Tibetan Plateau by Using a Satellite-Gauge Merged Rainfall Product

1
School of Atmospheric Science, Nanjing University of Information Science & Technology, Nanjing 210044, China
2
State Key Laboratory of Severe Weather and Institute of Tibetan Plateau Meteorology, Chinese Academy of Meteorological Sciences, China Meteorological Administration, Beijing 100081, China
3
Research Center for Disastrous Weather over Hengduan Mountains and Low-Latitude Plateau, China Meteorological Administration, Kunming 650034, China
4
State Key Laboratory of Severe Weather, Chinese Academy of Meteorological Sciences, China Meteorological Administration, Beijing 100081, China
5
2035 Future Laboratory, PIESAT Information Technology Co., Ltd., Beijing 100105, China
6
State Key Laboratory of Atmospheric Chemistry, Chinese Academy of Meteorological Sciences, China Meteorological Administration, Beijing 100081, China
*
Author to whom correspondence should be addressed.
Remote Sens. 2023, 15(4), 1013; https://doi.org/10.3390/rs15041013
Submission received: 13 December 2022 / Revised: 2 February 2023 / Accepted: 9 February 2023 / Published: 12 February 2023

Abstract

:
High-resolution meteorological datasets are urgently needed for understanding the hydrological cycle of the Tibetan Plateau (TP), where ground-based meteorological stations are sparse. Rapid advances in remote sensing create possibilities to represent spatiotemporal properties of precipitation at a high resolution. In this study, the hourly precipitation characteristics over the TP from two gridded precipitation products, one from global reanalysis (the fifth generation of the European Center for Medium-Range Weather Forecasts atmospheric reanalysis of the global climate; ERA5) and the other is simulated by Global-to-Regional Integrated forecast SysTem (GRIST) global nonhydrostatic model, are compared against satellite-gauge merged precipitation analysis (China Merged Precipitation Analysis; CMPA) from 27 July to 31 August 2014, and a satellite-retrieved precipitation estimate from the Integrated Multi-satellitE Retrievals for the Global Precipitation Measurement (IMERG) is also evolved. Two aspects are mainly focused on: the spatial distribution and the elevation dependence of hourly precipitation characteristics (including precipitation amount, frequency, intensity, diurnal variations, and frequency–intensity structure). Results indicate that: (1) The precipitation amount, frequency, and intensity of CMPA and IMERG decrease with altitude in the Yarlung Tsangpo river valley (YTRV), but increase at first and then decrease with altitude (except for intensity) in the eastern periphery of TP (EPTP). ERA5 performed well on the variation of precipitation amount with altitude (especially in EPTP), but poorly on the frequency and intensity. GRIST is the antithesis of ERA5, but they all overestimate (underestimate) the frequency (intensity) at all heights; (2) With increasing altitude, the diurnal phase of precipitation of CMPA and IMERG shifted from night to evening in the two sub-regions. IMERG’s diurnal phase is 1 to 3 h earlier than CMPA’s, and the discrepancy decreases (increases) as the altitude increases in YTRV (EPTP). The diurnal phase of precipitation amount and frequency in ERA5 and GRIST is significantly earlier than CMPA, and the frequency peaks around midday except in the basin. GRIST’s simulation of the diurnal variation in intensity at various altitudes is consistent with CMPA; (3) ERA5 and GRIST overestimate (underestimate) the frequency of weak (intense) precipitation, with ERA5’s deviance being the most severe. The deviations increased with altitude. These findings provide intensive metrics to evaluate precipitation in complex terrain and are helpful for deepening the understanding of simulated biases for further improving performance in high-resolution simulation.

1. Introduction

The Tibetan Plateau (TP), also called the Third Pole, is the highest and most extensive upland region in the world [1]. The thermodynamic and mechanical effects of the high terrain have crucial influences on global and regional atmospheric circulation. Many of Asia’s large rivers originate from the TP (e.g., Indus, Ganges, Brahmaputra, Yangtze, Yellow, and Mekong). It is also considered the “water tower of Asia” [2,3]. More accurate forecasting of precipitation over the TP is of critical significance for managing water resources in Asia [4].
However, precipitation can be extremely complicated in regions with complex terrain, including the TP. Precipitation over the TP exhibits complicated and various characteristics in different complex terrains. The precipitation’s well-known overall features over and around the TP are wet Indian plains, the dry interior of Tibet, an intense band of precipitation along the southern flank of the Himalayas, and a general drying trend toward the west [5]. In addition, there also shows some remarkable smaller-scale structures. A double band stretches along the central portion of the Himalayas and corresponds approximately to the Lesser and Great Himalaya; at the scale of the largest valleys and ridges (>30 km), valleys receive much more precipitation than adjacent ridges [6]. Significant precipitation is found to reach these high elevations even at smaller scales [7], presumably through the advection of cloud water and hydrometeors. This scale dependence of the precipitation pattern is an important aspect of orographic precipitation [8].
The hourly-scale precipitation characteristics over the TP are also influenced by topography. Early investigations of the diurnal variation of precipitation on the TP relied heavily on satellite data and limited ground-based observations [9,10,11,12]; these findings yielded some inconsistent results in this area. By using data collected from intensive observations across a mountain range in the southeastern plateau, Chen et al. [13] found that the diurnal variation is closely related to the locations of stations, i.e., precipitation over hillsides and mountaintops (in the valley) peaked in the afternoon (at night). Their findings also contribute to understanding the differences in diurnal phases between station observations and satellite data in regions with complex terrain. More recently, Ouyang et al. [14] using ground-based observations found that the monsoon precipitation diurnal variations of the valleys in central Himalaya present obvious afternoon and nighttime peaks at high altitudes and a single nighttime peak at low altitudes. The frequency–intensity structure is an important precipitation feature closely related to the precipitation mechanism. By statistically classifying the intensity and corresponding frequency of the hourly precipitation data on the TP, Li [15] obtained four categories of stations with distinct frequency–intensity structures, and the distribution of these four types of stations exhibits regional features. Both hourly frequency and intensity are high (low) over the southeastern (western and northern) plateau. In the Yarlung Tsangpo River valley, which is located on the central southern plateau, the precipitation frequency is low and the intensity is high. The proportion of strong (weak) precipitation, in terms of frequency, is relatively large (small) in this valley. Similar features with respect to the frequency–intensity structure were also found for the northeastern plateau. In contrast, precipitation over the southern edge of the plateau is characterized by high frequency and low intensity, and the percentage of weak precipitation hours is higher than in other regions.
Most of the climate models, as well as regional models, have trouble reasonably reproducing the precipitation on the TP [16,17,18,19,20]. For example, models from Phase 5 and 6 of the Coupled Model Intercomparison Project (CMP5 and CMIP6) greatly overestimate the precipitation amount over the TP [16,19,20]. Even the reanalysis data, in which surface precipitation is generated by model physics that is typically forced by relatively more realistic large-scale circulations and is only integrated for a few days, show an overestimation of the rainfall amount over the TP [21]. Previous studies show that increasing the spatial resolution of climate models can effectively improve simulation accuracy by resolving small-scale physical processes, especially over complex terrain [22,23,24]. With the advent of emerging supercomputing platforms and with the progress in kilometer-scale numerical modeling, there is now considerable research that has utilized kilometer-scale models to investigate precipitation in TP. The kilometer-scale model also has shown its ability to reproduce a more reasonable spatial pattern and more realistic diurnal cycle of the precipitation over the TP and other mountainous regions [25,26,27,28]. Lundquist et al. [29] even pointed out that, in mountainous areas, high-resolution atmospheric models can represent total annual precipitation better than the collective network of precipitation gauges.
With these high spatial and high temporal resolution, and potentially high accuracy results, there is still much to discover about what and how to evaluate these results in regions with complex topography. Prein et al. [30] reviewed the current research progress of high-resolution models and outlined the four main aspects of precipitation evaluation, spatial patterns, diurnal cycle, biases in mean and extreme precipitation, and soil moisture-precipitation feedback. However, in regions with complex terrain, new metrics are needed to assist us in better evaluating and interpreting the high spatial and temporal resolution model results. Some works on satellite or model precipitation evaluation have begun to incorporate the elevation dependence of precipitation. Li et al. [31] found that, in the glacierized regions of the western TP, while the precipitation amount was generally similar among the four datasets they evaluated (including observation-based gridded data APHRODITE, satellite product IMERG, reanalysis data ERA5, and WRF simulation HAR10) at lower altitudes, the altitudinal dependence of precipitation in high altitudes was markedly different among the products. Zhou et al. [32] evaluated three simulated precipitation and revealed that the simulations tend to show the precipitation maximum at a higher altitude compared to observational data.
To sum up, precipitation characteristics of the TP have strong correlations with its topography, but only a few evaluations paid attention to this. Therefore, this paper attempts to evaluate two sets of precipitation data from different sources in two aspects, the spatial distribution of hourly precipitation characteristics and the elevation dependence of hourly precipitation characteristics. The remainder of the article is organized as follows: Section 2 provides a brief description of the study case, model configuration, datasets, and methodology used in the study. Section 3 presents the evaluation results of precipitation over the TP. The discussion is provided in Section 4 and followed by a summary in Section 5.

2. Materials and Methods

2.1. Description of the Selected Case

The monsoon significantly impacts precipitation over and around the TP [5], and the summer monsoon develops in most of the TP until August. August 2014 was one of the wettest Augusts in recent decades due to active monsoon precipitation and embedded extreme precipitation episodes. This study’s core simulation period runs from 27 July 2014 at 00 UTC to 1 September 2014 at 00 UTC. Meanwhile, this is one of the three cases chosen by the Convection-Permitting Third Pole (CPTP, a Flagship Pilot Study launched by the Coordinated Regional Climate Downscaling Experiment in 2019) project as test experiments to enhance our understanding of the water cycle over the TP region through kilometer-scale climate modeling.

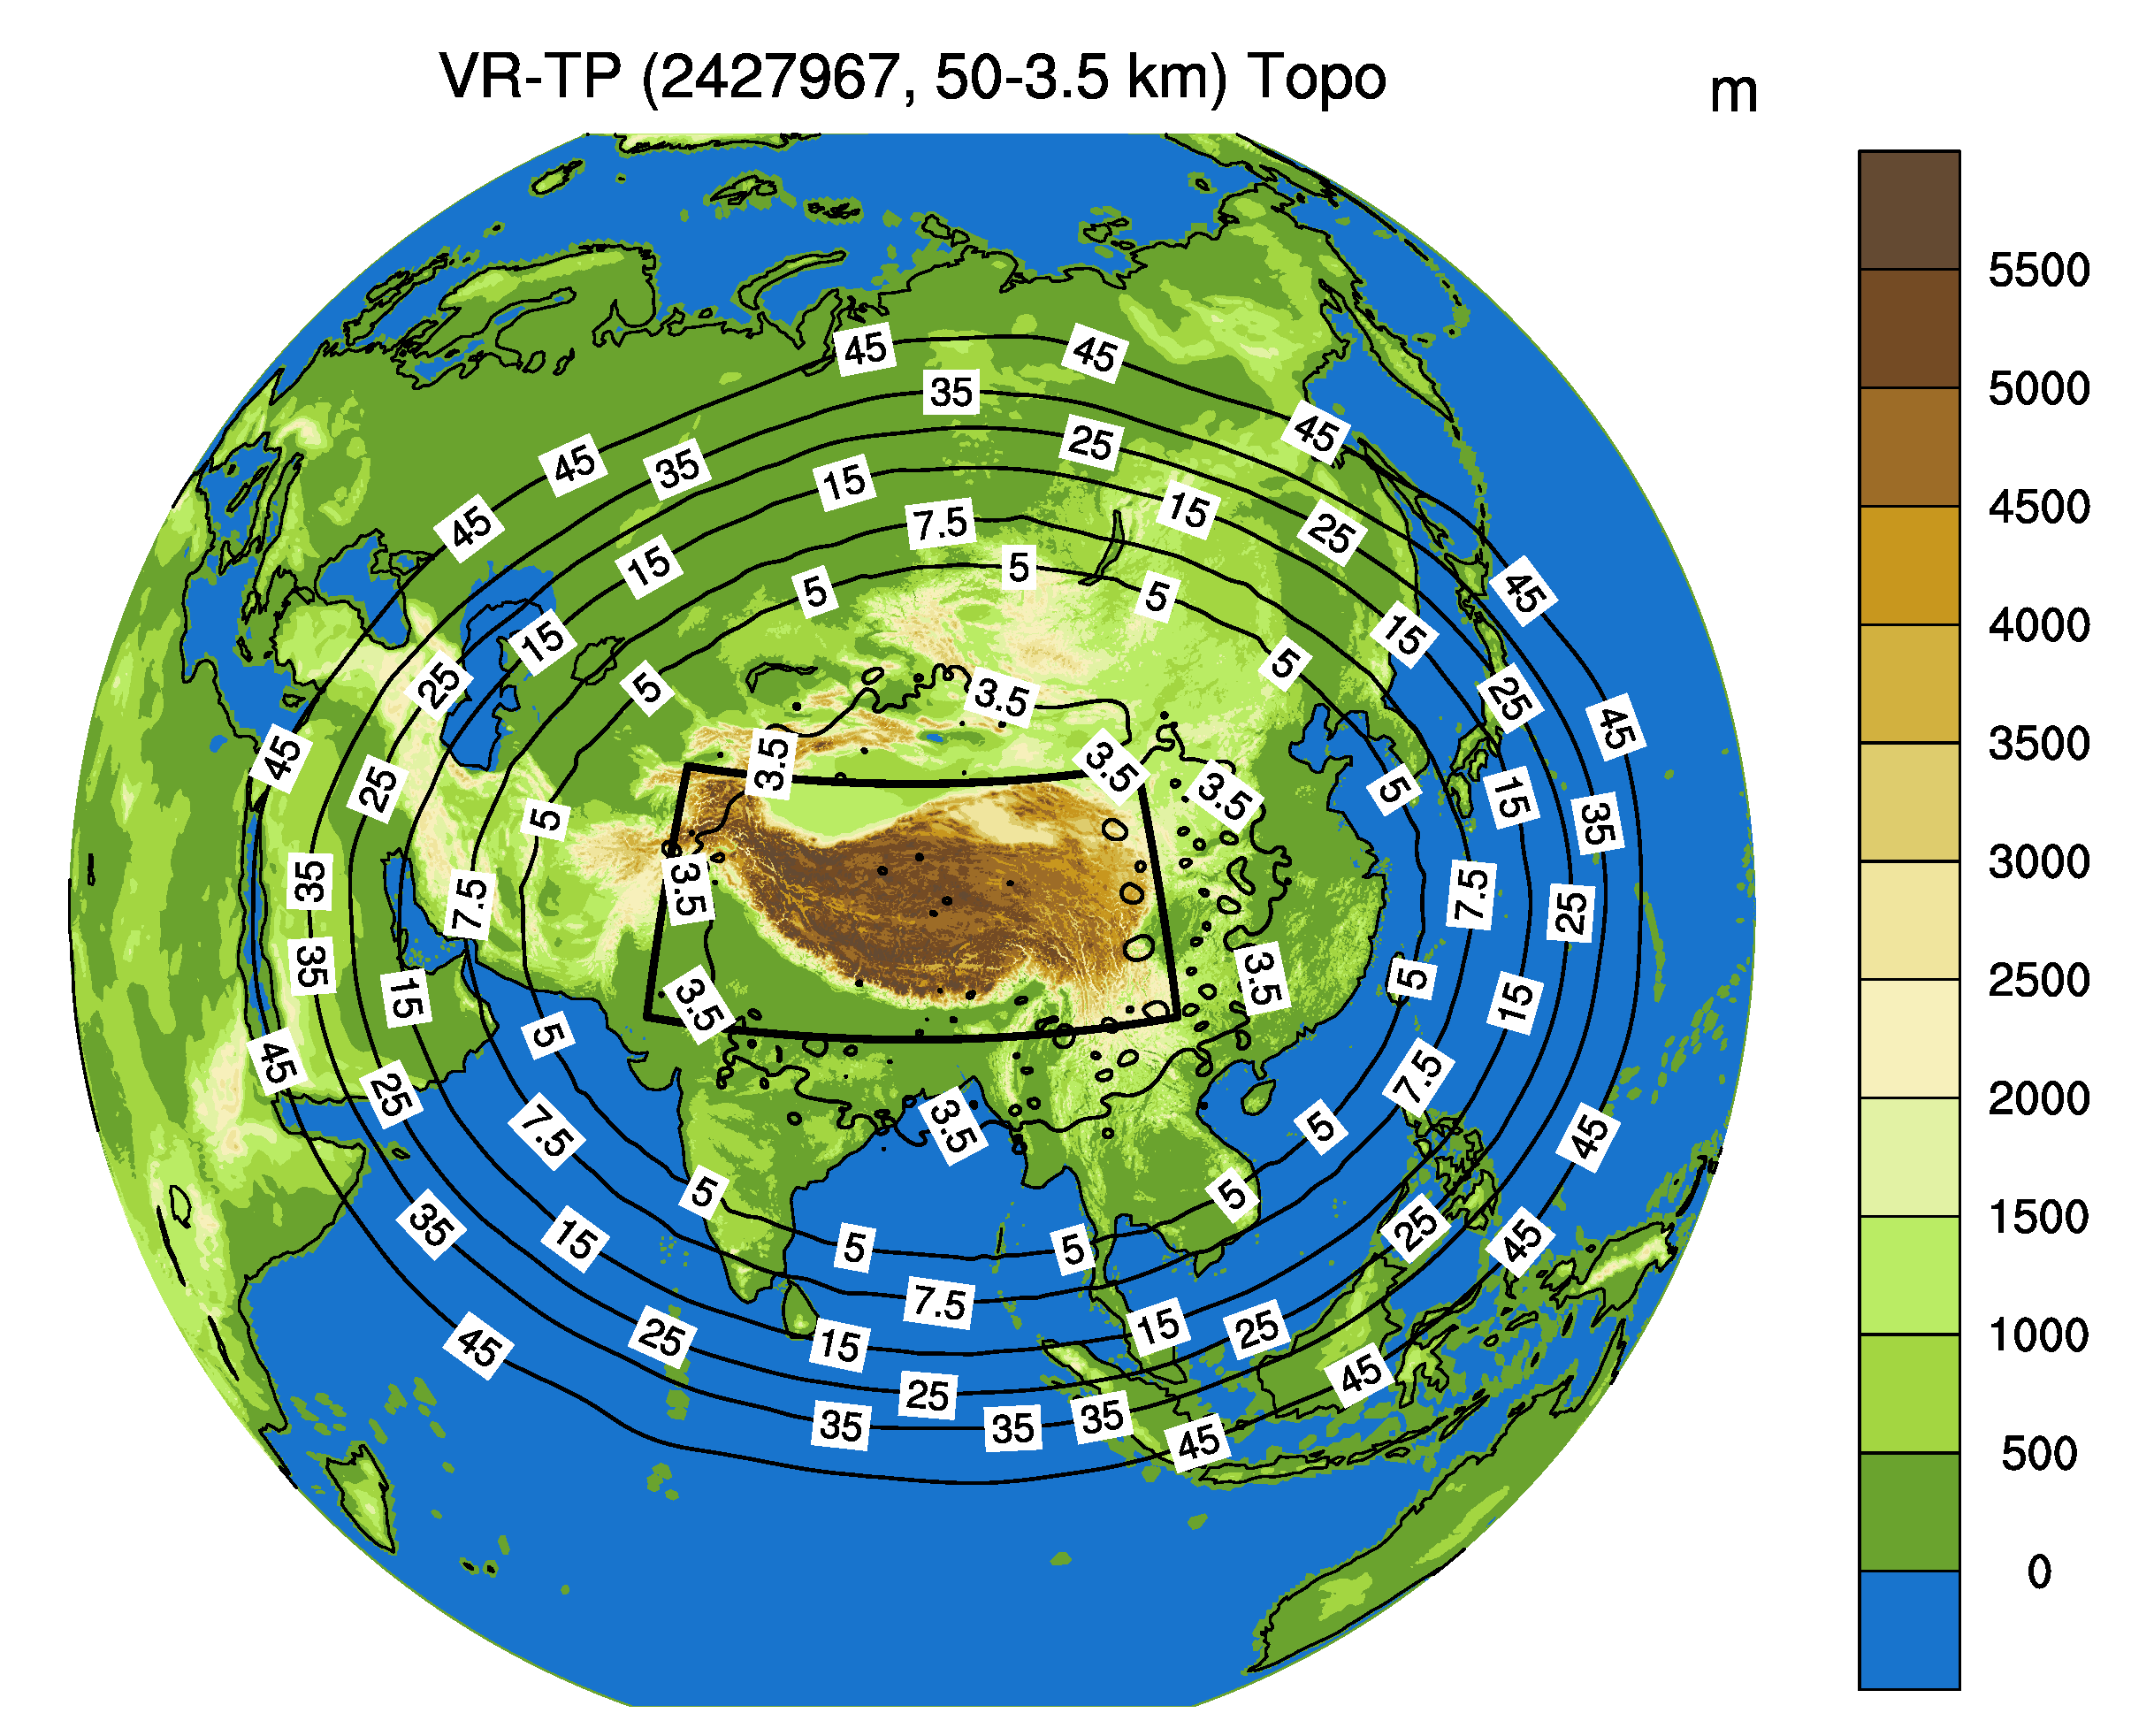
2.2. GRIST Model and Its Configuration

The Global-to-Regional Integrated forecast SysTem (GRIST) is a unified model system for global weather and climate modeling. Its layer-averaged dry-mass unstructured-mesh dynamical core solves the primitive equations but has an option to restore the vertical acceleration term for nonhydrostatic modeling [33,34]. The horizontal grid is fully unstructured, which permits the use of multiresolution modeling technique that enables variable-resolution simulations [35]. The moist-atmospheric model exactly conserves the dry air mass to within machine roundoff [34]. The full-physics model setup used here is based on a numerical weather prediction (NWP) physics suite as in Zhang et al. [36]. The nonhydrostatic dynamical core is used, following a similar configuration as in Zhang et al. [37] for kilometer-scale modeling, except that cumulus parameterization was activated here due to a varying global grid from 50 to 3.5 km. Some model configuration options are presented in Table 1. The study area of this paper is denoted by a black polygon in Figure 1, and the 3.5 km contour covers most of the area.

2.3. Datasets

  • The density of the rain-gauge stations is relatively sparse over the TP. To better understand the observed spatial distribution of precipitation characteristics, diurnal cycle, and the elevation dependence of precipitation, we used a merged satellite-gauge gridded hourly dataset for China (China Merged Precipitation Analysis; CMPA) with a horizontal resolution of 0.1 [44] that was developed by the National Meteorological Information Center of the China Meteorological Administration. Initially, the hourly precipitation measurements from nearly 30,000 automatic weather stations over China are interpolated into 0.1 × 0.1 grids. The raw Climate Prediction Center’s morphing technique (CMORPH [45]) estimates are then resampled and summed into 0.1 × 0.1 grids and hourly accumulation. The resampled CMORPH data are calibrated based on the probability density function technique and merged with gauge data using an improved optimum interpolation technique. The final CMPA estimate covers a period from January 2008 to the present. This merged precipitation estimate combines the advantages of both the raw satellite-based data and the gauge observations over Mainland China [46].
  • The Global Precipitation Measurement (GPM), which is led by the National Aeronautics and Space Administration and the Japan Aerospace Exploration Agency, provides the next generation of rainfall products at a temporal resolution of 30 min and spatial resolution of 0.1 [47,48]. The GPM core satellite carries a dual-frequency precipitation radar (DPR) and a conical-scanning multi-channel GPM Microwave Imager, which largely extends the sensor packages and expands the frequency of sensors. In addition, GPM has increased the orbital inclination of 65 from 35 of Tropical Rainfall Measuring Mission (TRMM), to afford wider coverage of important climate zones [49]. These upgraded sensors are used together with other sensors on the constellation satellites to develop the new Day-1 Integrated Multi-satellitE calibration algorithm for GPM (IMERG). IMERG is also utilized in this study to represent uncertainties among different observations.
  • ERA5 is the fifth generation European Center for Medium-Range Weather Forecast (ECMWF) atmospheric reanalysis of the global climate, with a horizontal resolution of 0.25 . ERA5 global reanalysis combines observations and models via 4D-Var data assimilation to provide a consistent record of the atmosphere, land, and ocean surfaces from 1979 [50]. Observations are assimilated in 12 h windows (09–21 UTC, and 21–09 UTC) within ECMWF’s Integrated Forecasting System (IFS) Cy41r2, with the atmosphere coupled to land and ocean. ERA5 has a finer spatiotemporal resolution (0.25 and hourly) than its predecessor, ERA-Interim, for capturing weather systems, as well as an improved representation of global precipitation. Furthermore, the diurnal cycle of convection is improved due to changes to the closure of CAPE [51], such that land-based precipitation now maximizes in the late afternoon rather than midday [50].
  • The Global 30 Arc Second Elevation (GTOPO30) dataset produced by the Earth Resources Observation Systems (EROS) Data Center of the U.S. Geological Survey was used to obtain the terrain height. Elevations in GTOPO30 are regularly spaced at 30-arc seconds. For this study, data were interpolated into the CMPA grids (0.1 × 0.1 ).

2.4. Methodology

To qualitatively evaluate the two datasets against CMPA, a series of statistical error indexes including Mean Bias (MB), Root Mean Square Error (RMSE), and Spatial Correlation Coefficient (CORR) were utilized. These metrics’ calculation formulas and best values are listed in Table 2.

3. Results

In this section, the reanalysis precipitation ERA5, and the simulation precipitation GRIST are evaluated against the merged observational precipitation CMPA. To describe the uncertainty of the observational data, the same analysis was conducted for the satellite precipitation IMERG. Before comparison, IMERG, ERA5, and GRIST data were bilinearly interpolated to the CMPA grids. The objective was to provide a general overview of how well the two simulation datasets can capture key features, including the precipitation’s spatial pattern, the precipitation diurnal cycle, and the elevation dependence of precipitation. The spatial statistical error metrics for precipitation amount, frequency, and intensity derived from IMERG, ERA5, and GRIST versus CMPA are given in Table 3.

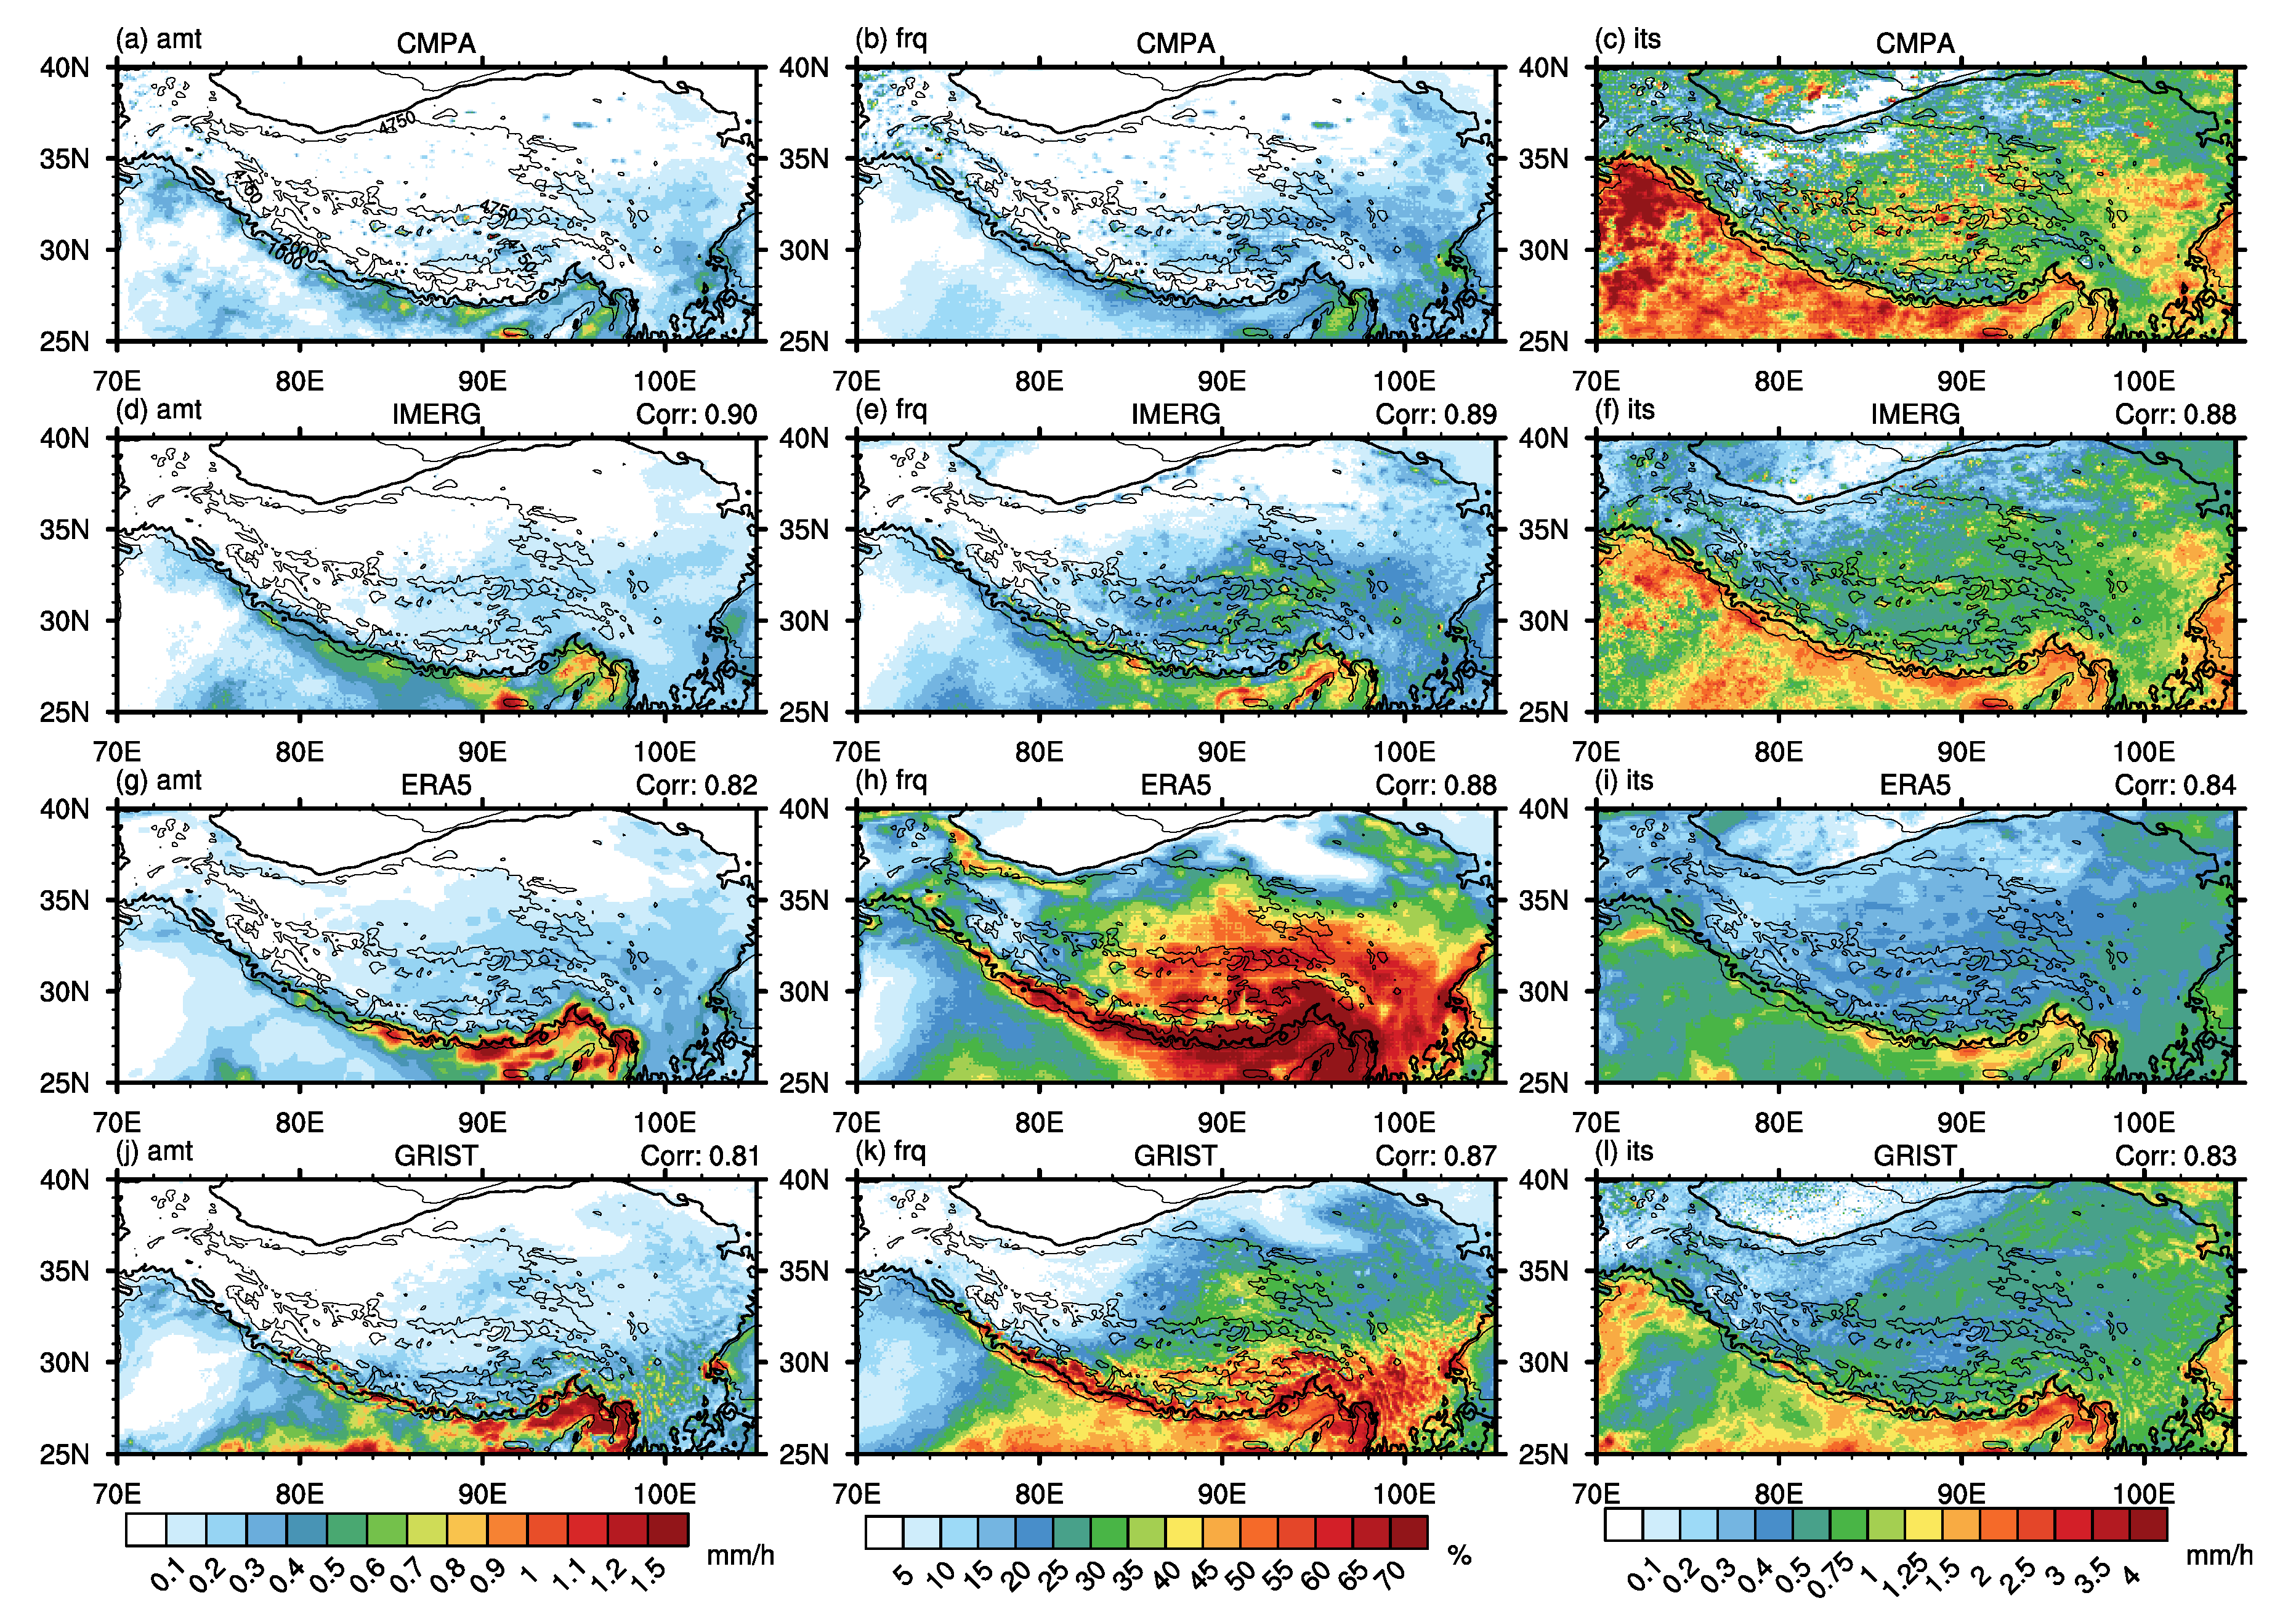
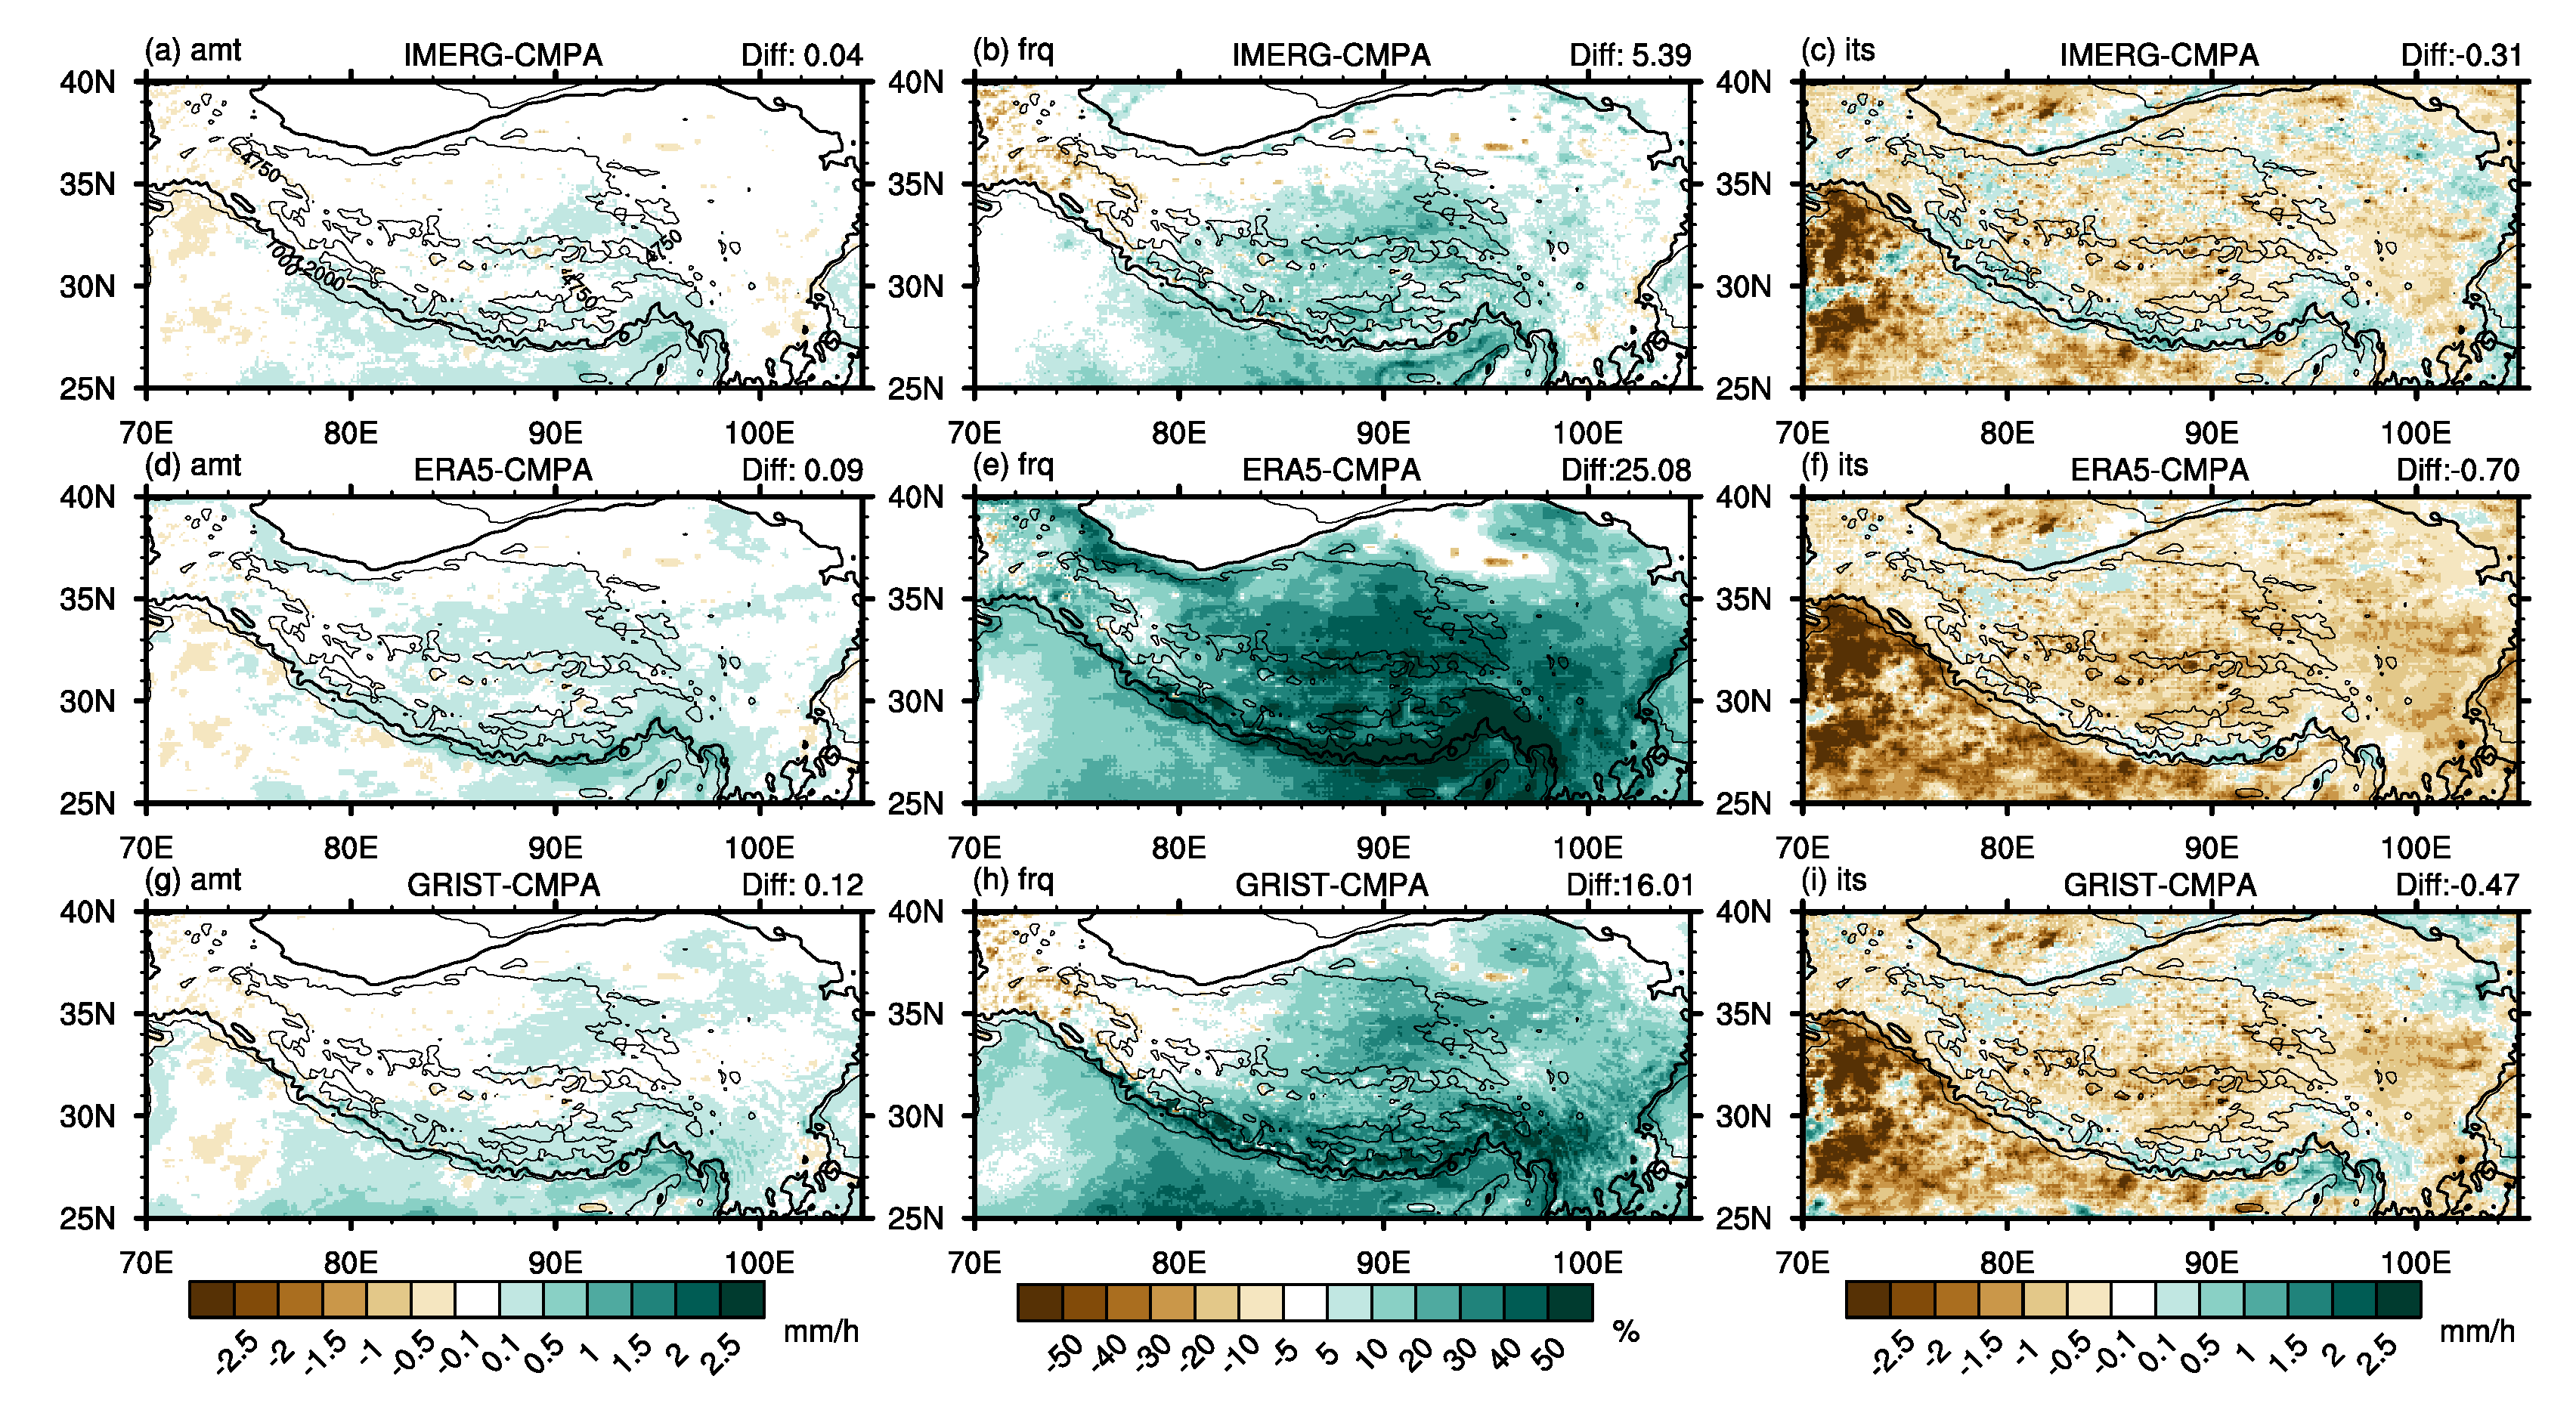
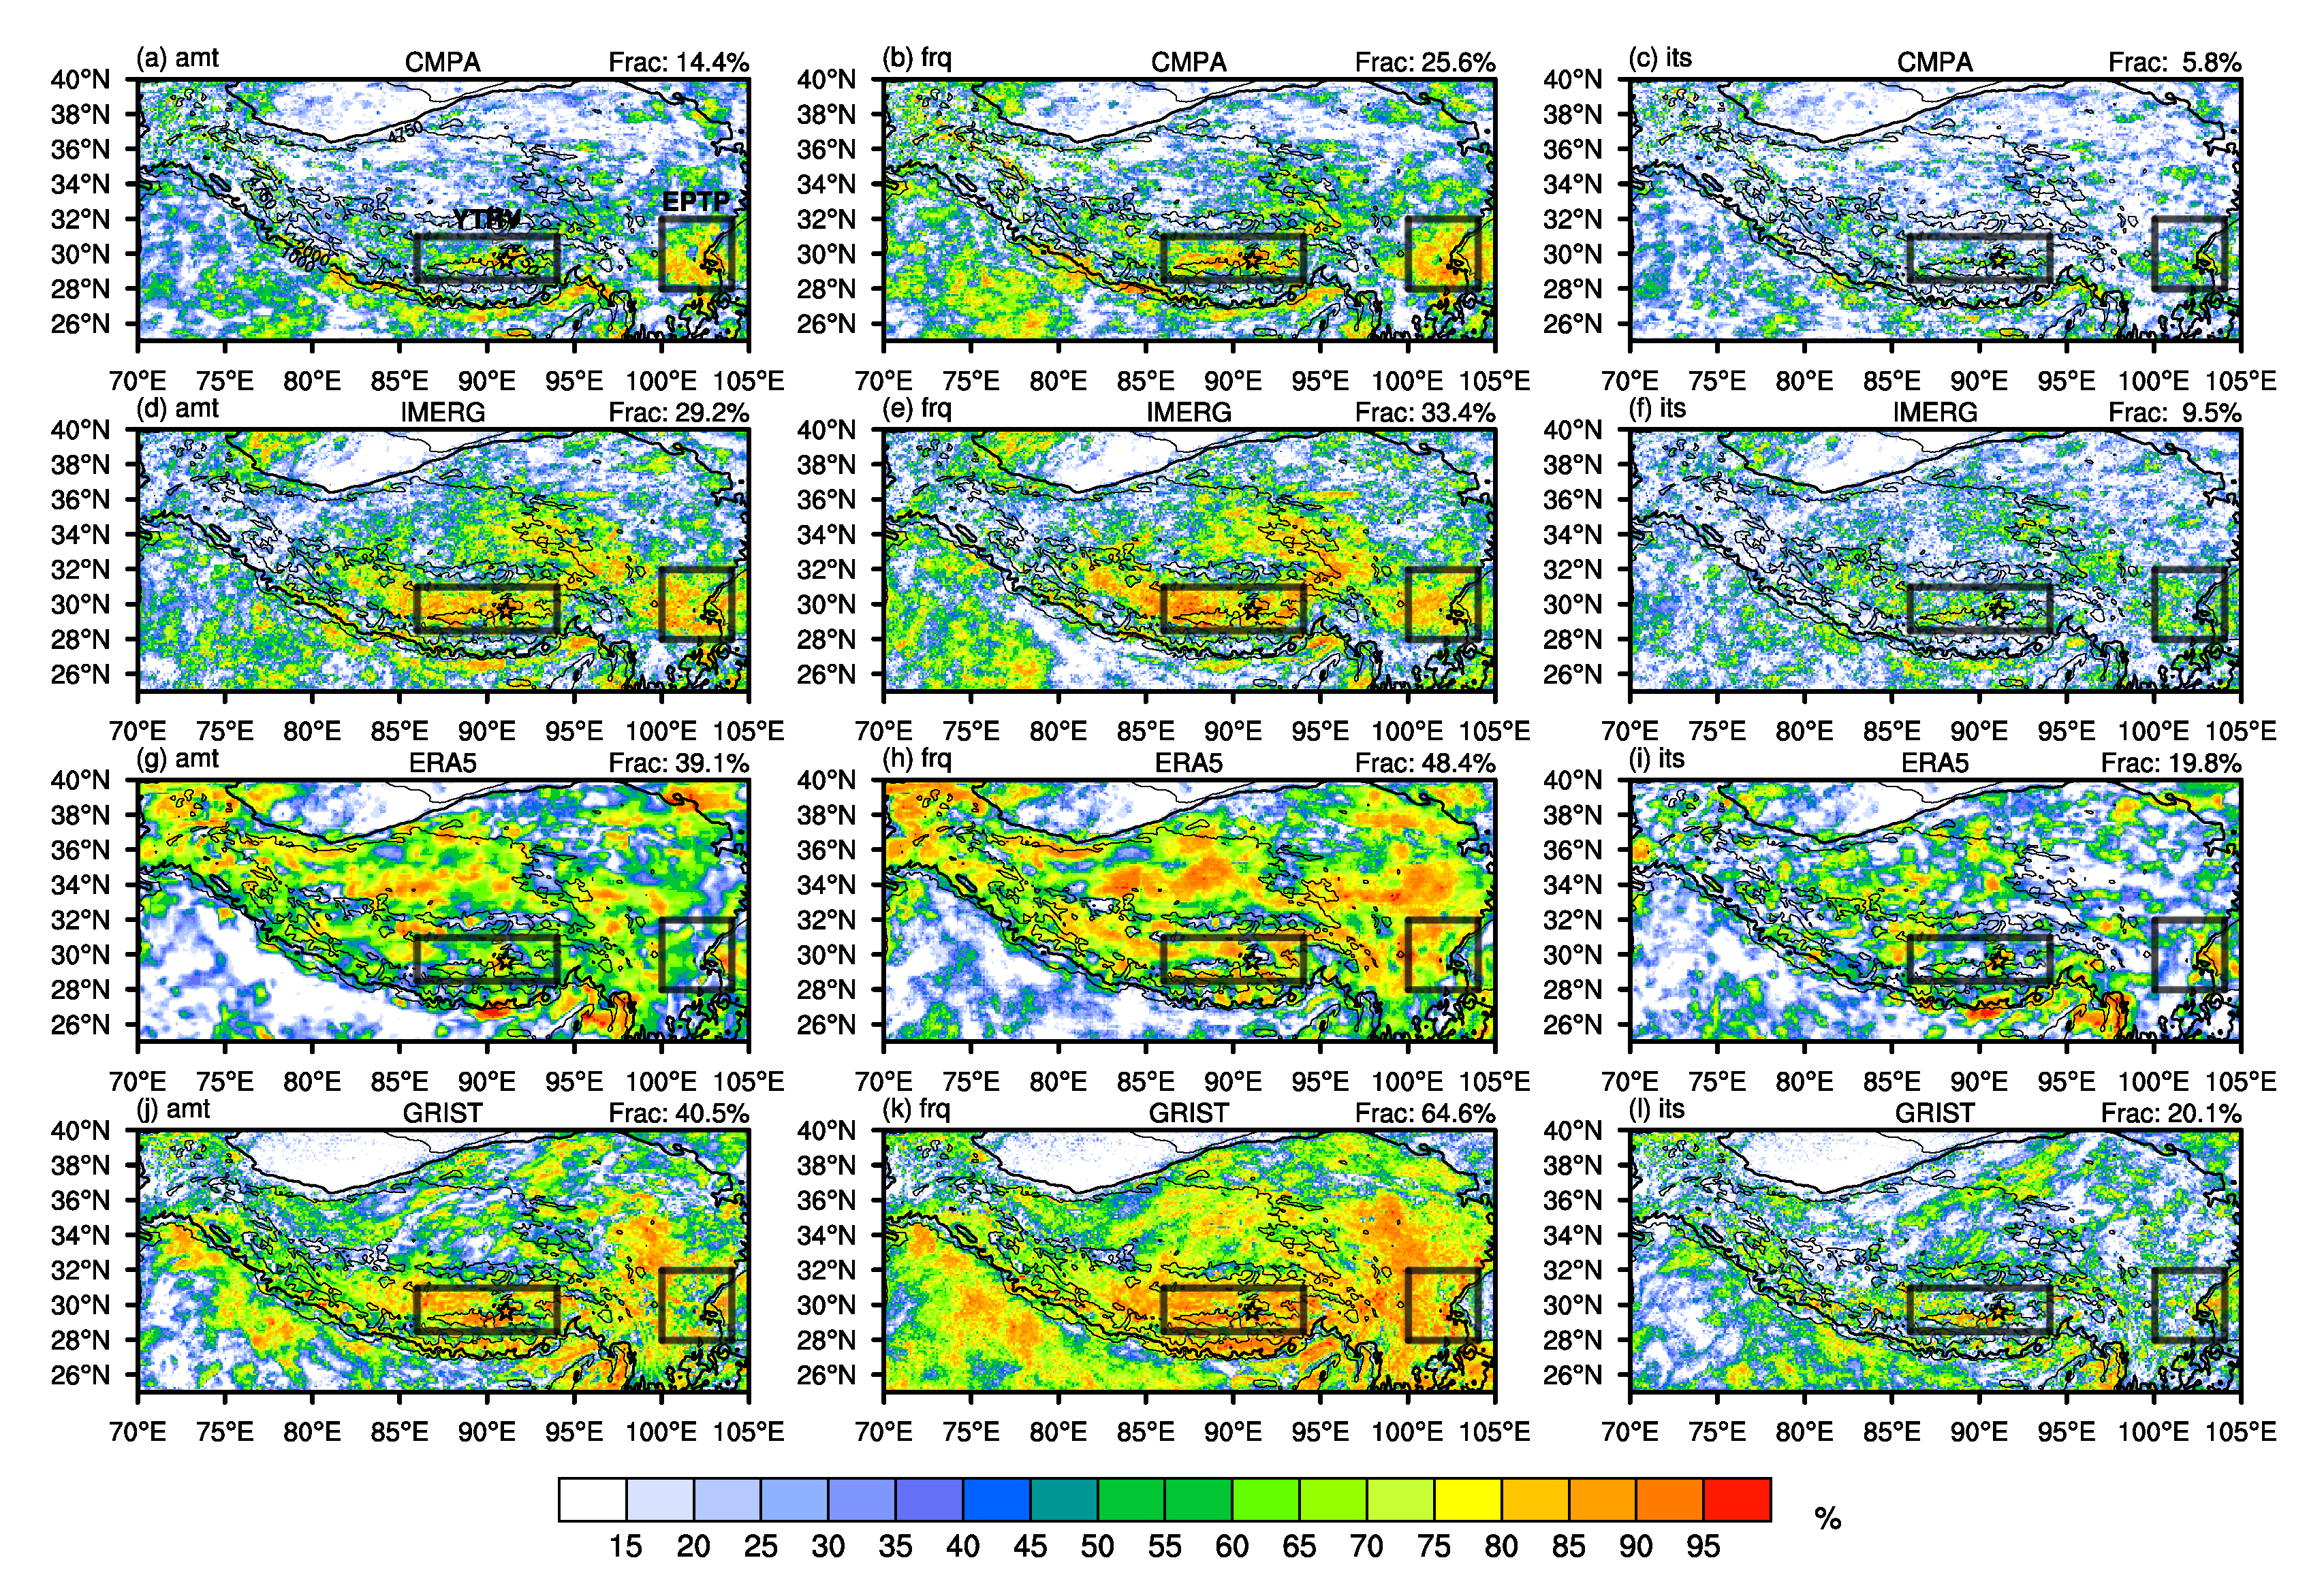
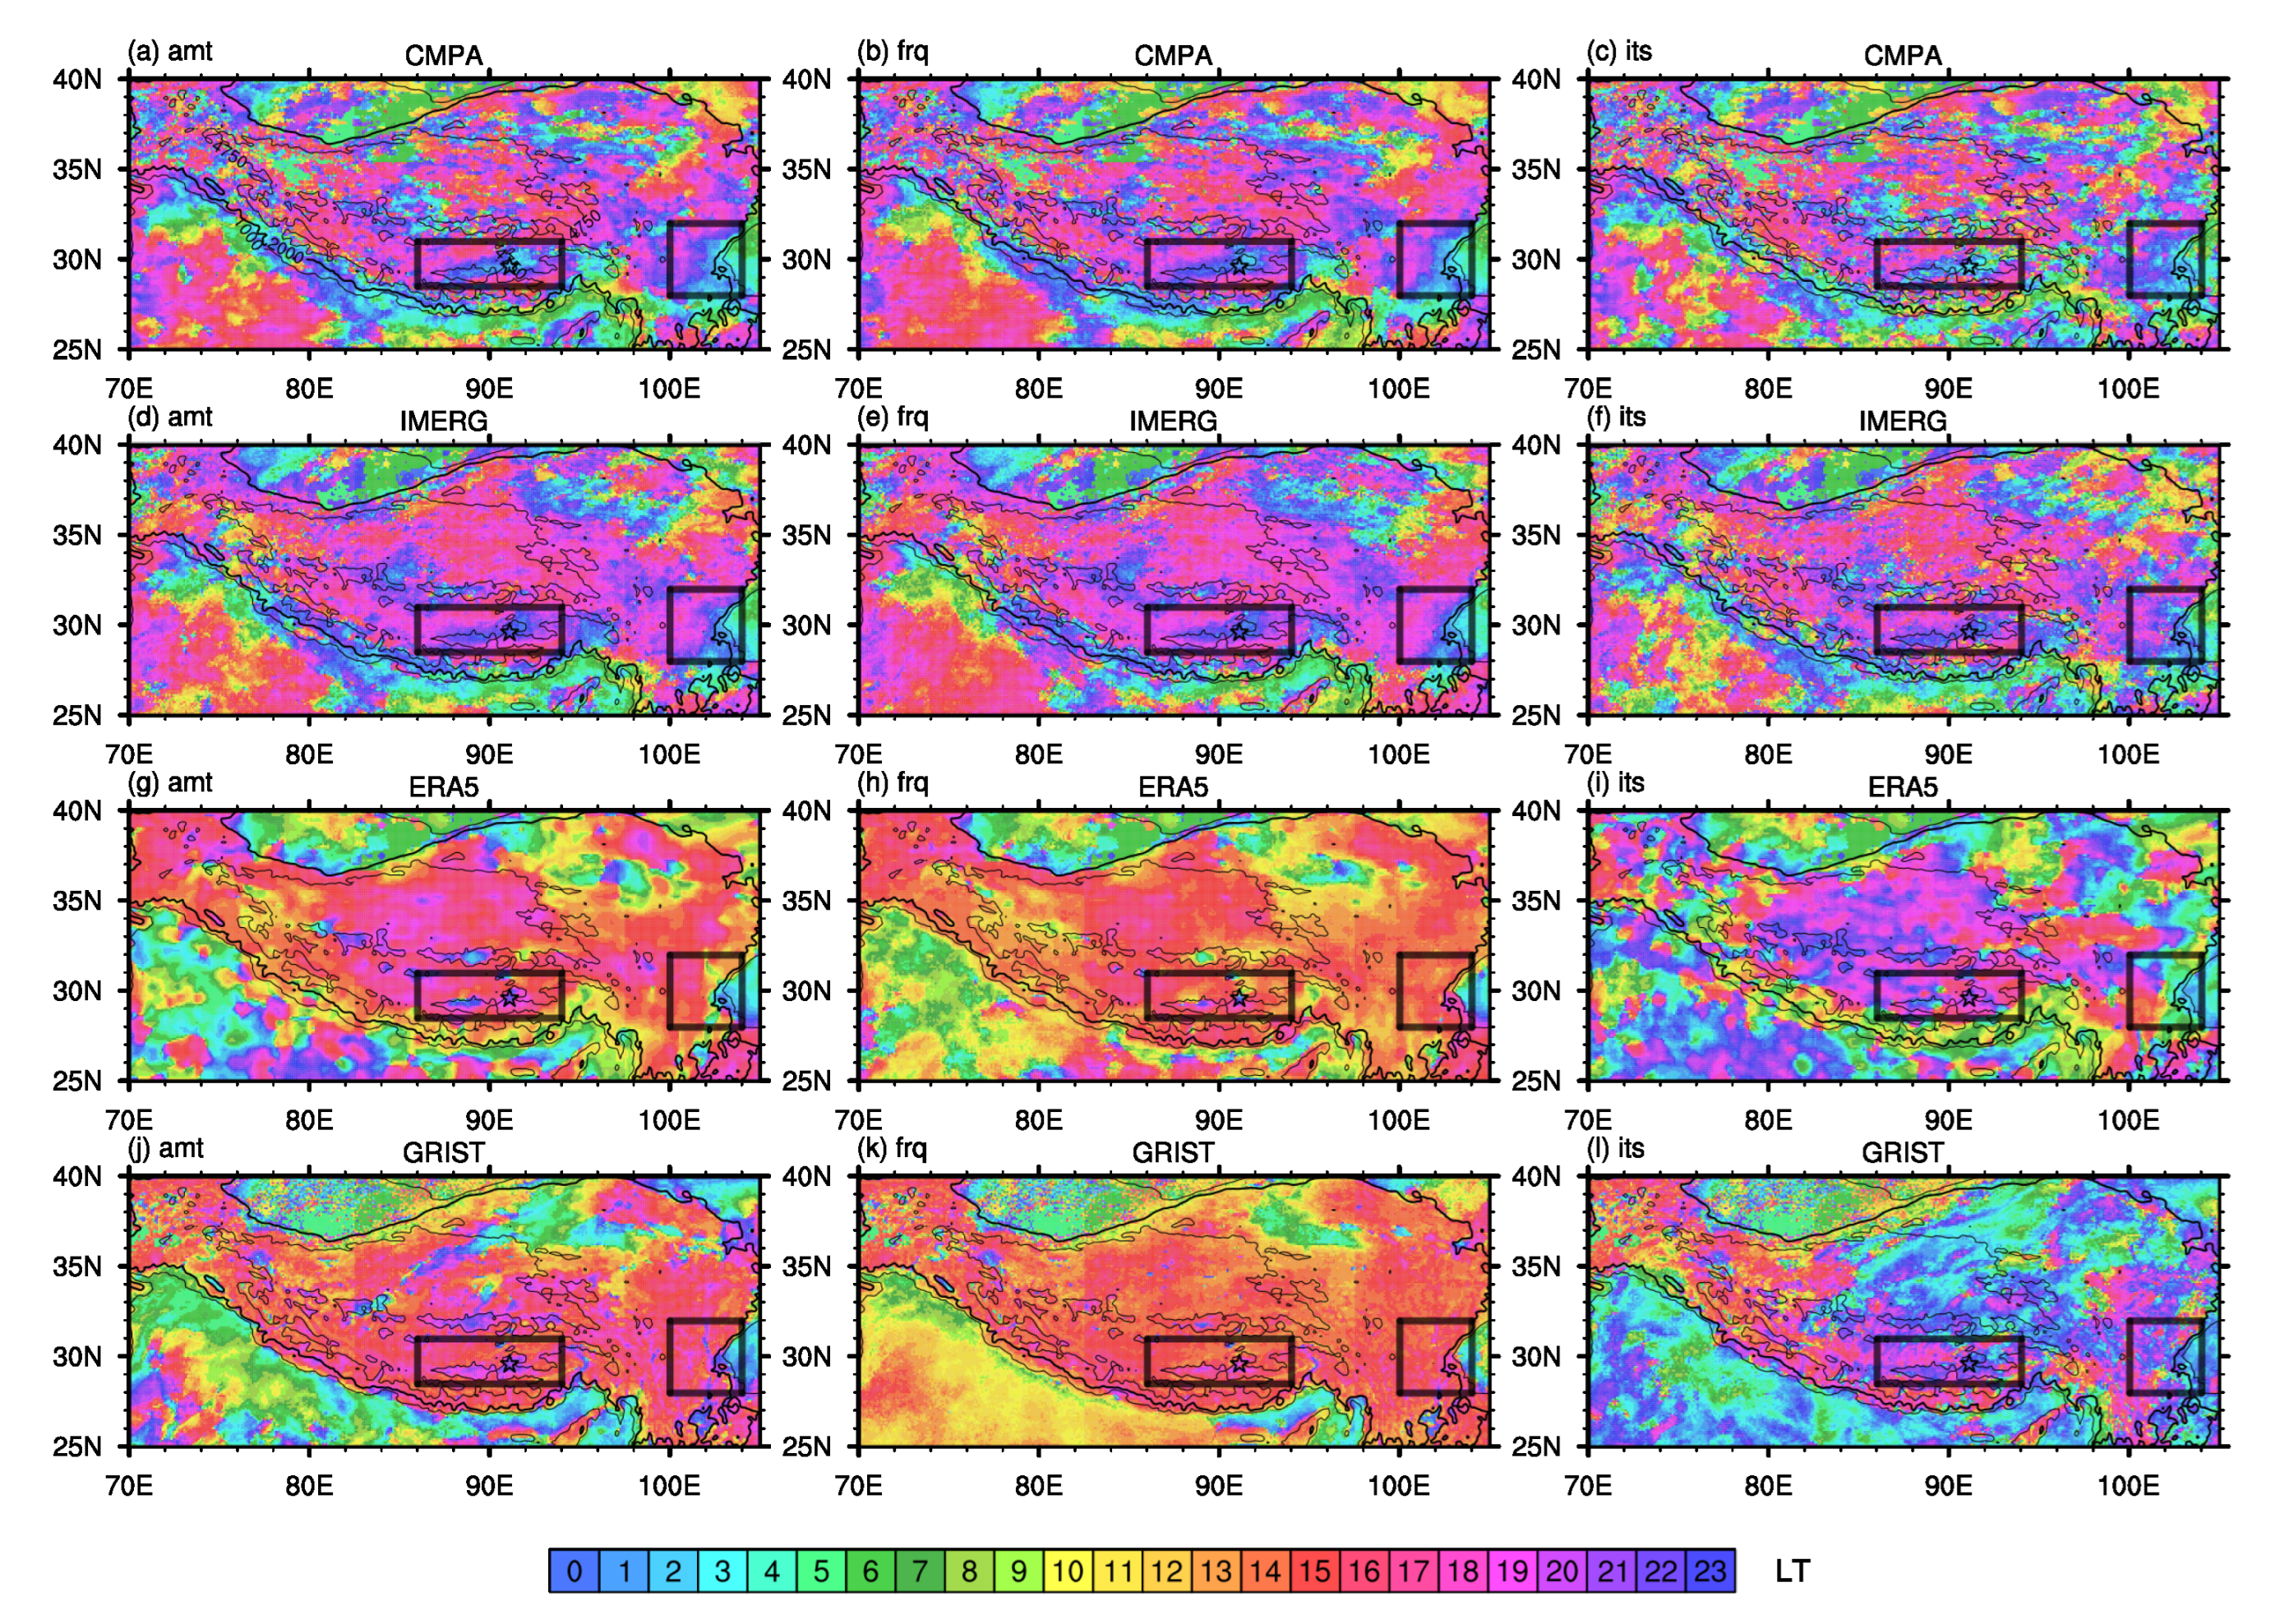
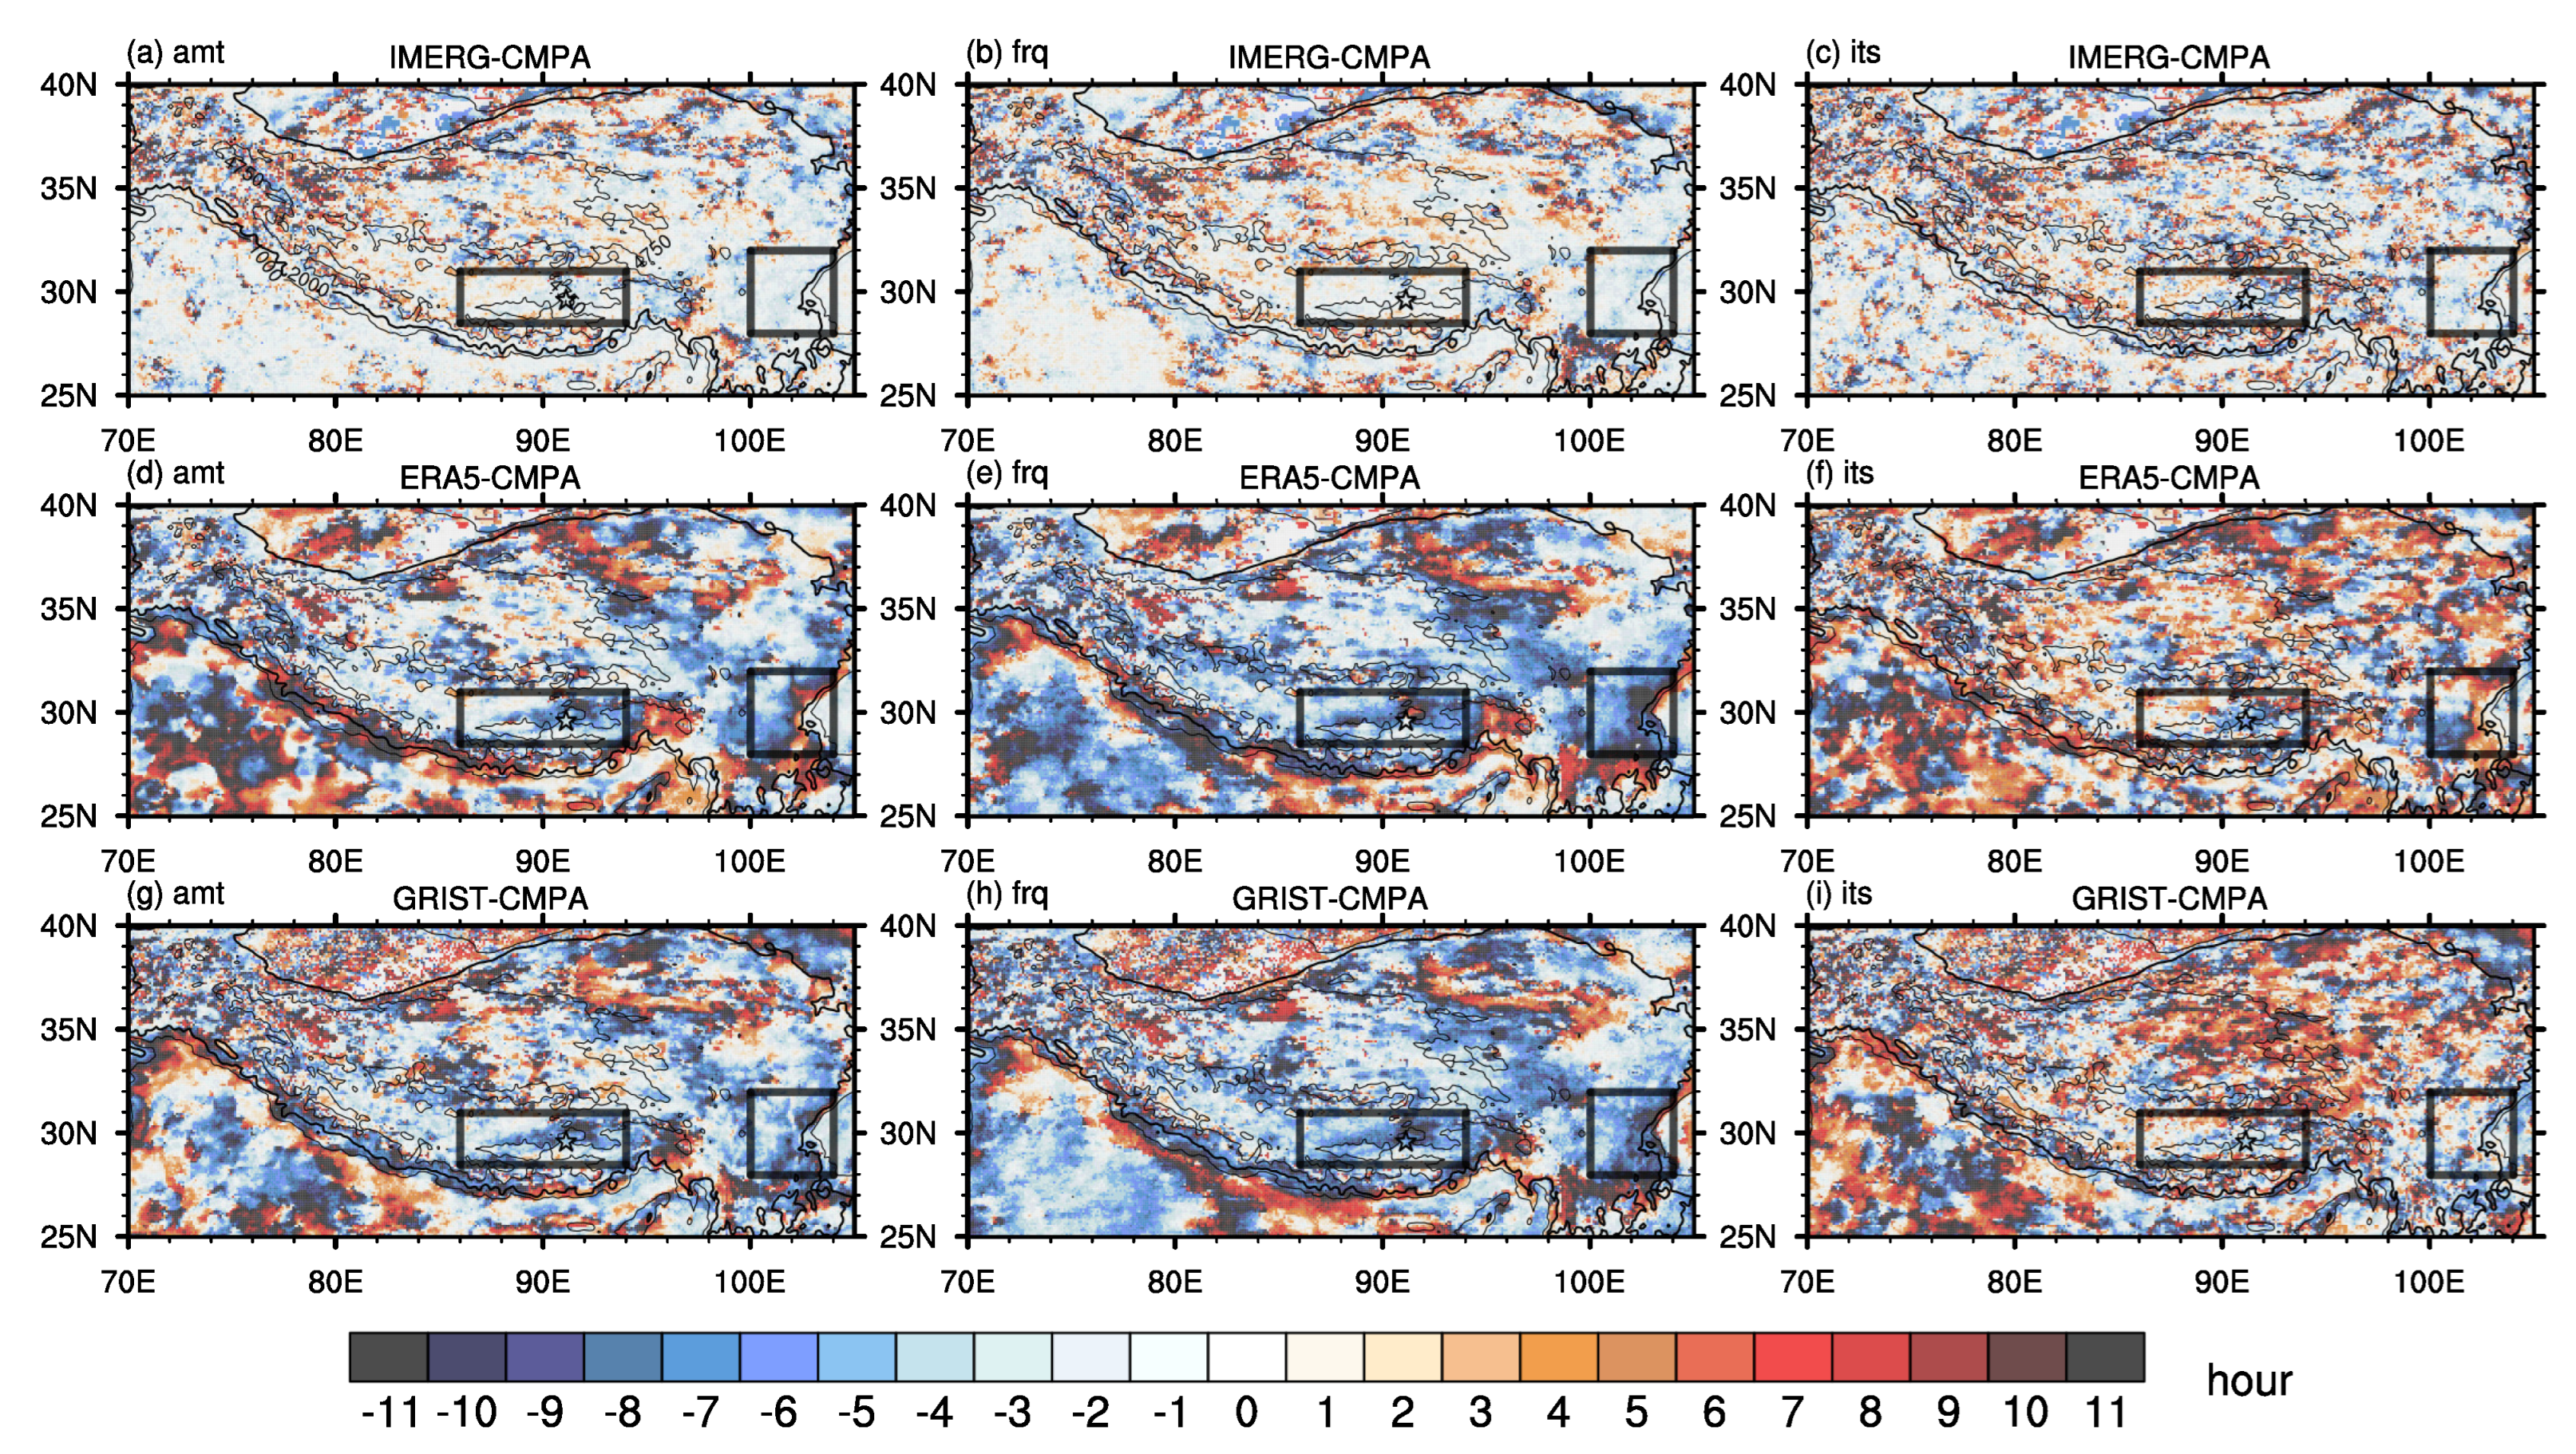
3.1. Spatial Pattern of Hourly Precipitation Characteristics

Figure 2 shows the mean precipitation distribution in CMPA, IMERG, ERA5, and GRIST averaged over the study period. The precipitation amount distribution (Figure 2a,d,g,j) is consistent among the four datasets: all show a large amount of precipitation along the Himalayas, and the amount decreases toward the northwest TP. Similar to the amount distribution, the frequency distribution (Figure 2b,e,h,k) exhibits a decreasing trend from the southeast TP to the northwest and has a large value center to the south of the Himalayas and the eastern periphery of the TP. The intensity (Figure 2c,f,i,l) is strongest over South Asia. Over the main body of the TP, the central and eastern areas see more intense precipitation than other parts of the TP. The CORRs between CMPA and the other three datasets are also calculated. Among the three sets of pattern correlations, the CORRs between CMPA and IMERG are the highest (0.9 for precipitation amount, 0.89 for frequency, and 0.88 for intensity). This demonstrates that the spatial distribution of IMERG satellite observation and CMPA, which combines station data with CMORPH satellite data, are well matched. The CORRs between CMPA and GRIST are higher than 0.8 (0.81 for amount, 0.87 for frequency, and 0.83 for intensity), which are very close to the correlations between CMPA and ERA5 (0.82 for amount, 0.88 for frequency, and 0.84 for intensity).
Though ERA5 and GRIST both show a strong pattern correlation with CMPA, these two obviously overestimated the amount (Figure 2g,j) and frequency (Figure 2h,k) over South Asia to the South of Himalaya and the southeastern part of TP, while underestimating the intensity across the whole study region (Figure 2i,l). The precipitation differences of precipitation estimated by IMERG, ERA5, and GRIST against CMPA are shown in Figure 3 separately. All simulation products indicate overestimates of the precipitation amount to a certain extent in the TP, with the most serious center mainly located in South Asia to the Himalayas. The average differences between IMERG and CMPA are 0.04 mm/h for precipitation amount, 5.39% for frequency, and −0.31 mm/h for intensity. ERA5’s precipitation amount bias (0.09 mm/h) is lower than that of IMERG, while its frequency (25.08%) and intensity (−0.7 mm/h) bias are far greater than those of IMERG (5.39% and −0.31 mm/h) and GRIST (16.01% and −0.47 mm/h). Comparing the two simulation results, ERA5’s and GRIST’s bias spatial distribution has similarities. Except for a significant overestimation of the precipitation amount along the Himalayas and the eastern edge of the TP, both datasets tend to overestimate the precipitation in the central TP. The overestimation is especially severe in regions with complex terrain. All of these amount’s wet biases mainly stem from an overestimation of frequency, with ERA5 and GRIST underestimating precipitation intensity in the study region, particularly in the south of the Himalayas and the central part of the TP. Furthermore, ERA5 and GRIST overestimate the precipitation intensity along the Himalayas to varying extents.
Furthermore, grids with elevations higher than 2000 m are considered as grids on the main body of the TP. These grids’ precipitation from IMERG, ERA5, and GRIST are evaluated against the precipitation from CMPA. The MB and RMSE are widely used to quantitatively represent the error characteristics between the estimates and reference value. In addition, the CORR describes the agreement between the precipitation estimates and CMPA with a value from 0 to 1. The equation and perfect values of these metrics are listed in Table 2. The difference between IMERG and CMPA is occasionally refferd to as “bias” (such as mean bias, etc.) for ease of writing, but this is not a bias strictly speaking.
According to Table 3, IMERG still corresponds well with CMPA over the main body of the TP. In terms of MB, IMERG shows less difference over the TP (0.03 mm/h for amount, 4.83% for frequency, and −0.15 mm/h for intensity) than the entire study region (0.04 mm/h, 5.39%, and −0.31 mm/h, respectively). This indicates that, on the one hand, IMERG can generally reflect the spatial pattern of precipitation; on the other hand, CMPA highly relies on satellite data due to the scarcity of weather stations on the main body of the TP. Compared to the MB of the study region, ERA5 exhibits a greater bias of amount (0.1 mm/h) and frequency (28.55%) over the main body of TP, indicating that ERA5’s simulation of precipitation at high elevations is relatively unsatisfactory. In contrast, GRIST exhibits smaller biases (0.08 mm/h for amount, 5.73% for frequency, and −0.3 mm/h for intensity) over the TP. RMSE presents similar features to MB because the three precipitation products generally exhibit consistent differences with CMPA of all grids at altitudes over 2000 m, namely negative bias in intensity and positive bias in amount and frequency. The CORRs with CMPA for all three datasets over the main body of TP are slightly lower than the CORRs over the study region. These results, together with Figure 2 and Figure 3, demonstrate that IMERG and CMPA have comparable spatial properties of TP precipitation. ERA5 and GRIST have moderate wet biases in precipitation amount but significant positive (negative) biases in frequency (intensity), with ERA5 exhibiting the largest biases.
The timing of the diurnal peak of precipitation can yield additional insights into a model’s performance when simulating subdiurnal-scale processes. Chen et al. [13] found that the precipitation diurnal phase is strongly related to the station’s location over the TP. They suggested that, when analyzing the rainfall diurnal variations in regions with complex topography, the combination of station observation and satellite products is essential. The CMPA data offer an excellent combination of raw satellite-based data and gauge observations for evaluation. The Fourier transformation and the component of the 24-h rainfall cycle are frequently used to analyze the phase of the diurnal cycle [52,53]. In this study, the time series of precipitation is averaged into a composite 24-h cycle, and the Fourier analysis is then applied to the 24-h cycle. The single-peak diurnal feature is more pronounced in grids with a greater first (diurnal) harmonic variance of Fourier analysis, and grids with a diurnal variance of at least 60% are referred to as single-peak grids.
Only 14.4% and 25.6% of grids in the spatial distribution of the diurnal variance of CMPA’s precipitation amount and frequency can be classified as single-peak grids (Figure 4a,b). The Himalayan ridge, the Yarlung Tsangpo river valley (YTRV), and the eastern periphery of the TP (EPTP) are the main locations for single-peak grids. In the spatial distribution of the diurnal variance of IMERG’s amount and frequency, about thirty percent of the grids (29.2% and 33.4%) are single-peak grids (Figure 4d,e). With a larger value and a wider area extent, IMERG’s precipitation amount and frequency in the three aforementioned sub-regions also present significant single-peak characteristics. Precipitation amount and frequency derived from ERA5 and GRIST all show a much stronger single-peak diurnal feature throughout the entire TP region compared to CMPA (Figure 4g,h,j,k). Especially for the GRIST’s diurnal variance of frequency, 64.6% of the grids is characterized by a single peak. However, ERA5 and GRIST failed to capture the frequency’s single-peak feature in areas with relatively low elevations (ERA5 in the lowlands of YTRV and GRIST in the areas where altitude is lower than 1000 m of EPTP). Compared to amount and frequency, all four datasets’ precipitation intensity shows fewer single-peak features over the TP. CMPA’s single-peak grids of rainfall intensity only take up 5.8% of the study region. With 20.1%, GRIST has the largest percentage of single-peak grids, though this is just a third of its frequency single-peak percentage.
YTRV and EPTP exhibit a notable single diurnal peak in all four datasets. ERA5 and GRIST also present a significant overestimation of the precipitation in these two sub-regions. Importantly, YTRV and EPTP represent two different topographic scales across the TP. YTRV refers to the valley with a scale of tens of kilometers, which requires modeling at the kilometer scale. EPTP refers to ascending terrain with a scale of hundreds of kilometers, which global climate models can describe, despite their coarse spatial resolution. Taking all these into account, YTRV and EPTP were the two sub-regions selected for further investigation of the diurnal cycle and the elevation dependence. The black rectangles in Figure 4 indicate the coverage of the two sub-regions.
Figure 5 presents the diurnal harmonic phase derived from CMPA, IMERG, ERA5, and GRIST. Over the main body of TP, the precipitation diurnal phase of most grids occurs in the late afternoon to midnight (around 18–00 LT, where LT stands for the local time) for the two observational datasets (CMPA and IMERG, Figure 5a–f). The two models’ (ERA5 and GRIST, Figure 5g,h,j,k) precipitation amount and frequency show a pronounced diurnal phase in the afternoon (around 12–18 LT) with only a few valleys and basins showing a morning phase. Finer details can be revealed when zooming in on smaller-scale regions. In YTRV, CMPA’s rainfall amount and frequency diurnal phase show a reliance on elevation (Figure 5a,b). In the low-lying river valley areas, especially the northern part of the valley and the northwest of Lhasa (marked by a pentagram), CMPA shows a rather late diurnal phase around midnight, while on the mountains to the north and south of the valley, the diurnal phase is more likely to occur in the late afternoon. IMERG’s diurnal phase in YTRV (Figure 5d,e) shows a similar pattern from afternoon to midnight, 1–2 h earlier than CMPA. GRIST also demonstrates the elevation dependence of precipitation amount and frequency’s diurnal phase (Figure 5 j,k) in YTRV. The valleys’ diurnal phase occurs in the late afternoon (18–20 LT), while the mountains’ diurnal phase occurs in the afternoon (13–16 LT). Though ERA5 underestimated frequency’s single-peak feature in YTRV, its amount and frequency diurnal phase have a similar distribution pattern to that of GRIST.
In the EPTP region, CMPA’s amount and frequency diurnal phase have an intriguing color pattern that changes from rose to dark blue and then to light blue and green from west to east, indicating a transition in phase time from the late afternoon to midnight, and then to the early morning (Figure 5a,b). IMERG also exhibits this color pattern, but with a greater proportion of rosy hues, suggesting that more grids have a diurnal phase in the late afternoon than CMPA (Figure 5d,e). ERA5 and GRIST failed to simulate the gentle transition of the diurnal phase from west to east, but they show an abrupt shift from the afternoon to late night. In the amount diurnal phase distribution (Figure 5g,j), grids with an elevation over 2000 m (thick black contour) present an afternoon diurnal phase. Grids between 1000 (thin black contour) and 2000 m show a mixture of a late night and early morning (ERA5) or of an afternoon and midnight (GRIST) diurnal phase, and grids with an elevation below 1000 m have a late night diurnal phase. However, in the frequency diurnal phase distribution (Figure 5h,k), grids with an elevation above (below) 1000 m show an afternoon (a late night) diurnal phase.
The intensity diurnal phase shows the fewest single-peak features among the three precipitation variables across the TP. Thus, the spatial distributions of the intensity diurnal phase in CMPA and IMERG both exhibit ‘image noises’ (Figure 5c,f). In other words, most grids present rose and blue tones (late afternoon to late night) mixed with some green and yellow tones (early morning to forenoon). Except for the image noises, CMPA’s and IMERG’s intensity diurnal phases are similar to their amount’s diurnal phases, respectively. ERA5’s and GRIST’s intensity diurnal phases, which differ from their amount and frequency afternoon phases, display more rose to light blue tones (late afternoon to late night) over the TP (Figure 5i,l). Particularly for ERA5, there are more green and yellow grids (early morning to afternoon) at the edge of the TP and large basins.
Figure 5 shows that, over the TP, the precipitation diurnal phases of ERA5 and GRIST tend to occur several hours earlier than CMPA. Even the satellite observation data, IMERG, show more late afternoon peaks, while CMPA presents more midnight to late night peaks. The diurnal phase difference between the three datasets and CMPA is shown in Figure 6. Blue (red) shading denotes an earlier (a later) diurnal phase than that of CMPA. The advance or delay phenomena are more pronounced as the shading becomes darker, and the dark gray shading denotes a diurnal phase difference of more than 10 h. Except for regions north of 35 N and the southeastern fringe of the TP, where the diurnal phase variation is small, the diurnal phase difference between IMERG and CMPA precipitation amount and frequency is minor (Figure 6a,b), ranging from 2 to 2 h (60.6% of the grids for amount, and 58.8% for frequency). Since the distribution characteristics of the precipitation amount and frequency diurnal phase difference of IMERG are relatively similar, the precipitation amount is used as a representative for analysis here. In YTRV, 51.6% of the grids are blue (phase difference between −1 and −10) and 29.8% are red (1 to 10), and the blue grids are mostly concentrated in the low-altitude areas with the late-night diurnal phase in CMPA. In EPTP, the coloring tone is almost exclusively light blue, and the phase difference primarily ranges from 0 to −2 (77.4%). For the two simulation datasets, ERA5 and GRIST, the diurnal phase differences in precipitation amount and frequency have darker hues. In addition to South Asia and the two major basins (Tarim and Qaidam), dark blue and dark red are predominantly distributed in locations with substantial relief amplitude, such as the edges of the TP and the river valleys on the TP. In the study area, the diurnal phase differences of the two datasets are mainly earlier than CMPA. Among them, 52.2% (63.7%) of the grids of ERA5 have a precipitation amount (frequency) with a diurnal phase deviation of −1 to −10 h, about 4.8 (5.2) h earlier than that of CMPA on average (Figure 6d,e). GRIST has 56.5% (65.8%) of the grids’ amount (frequency) diurnal phase deviations between −1 and −10 h, with an average advance of about 5 (5.1) h (Figure 6g,h). In the YTRV region, ERA5 and GRIST also largely underestimate nocturnal rainfall. The valley’s north side is dominated by dark blue and gray hues, while the color fades on the north and south sides of the mountain slopes. The diurnal phase difference of ERA5 rainfall frequency even has a small fraction of red area in the northeast of Lhasa, where ERA5 shows an early morning peak. In EPTP, the relationship between phase difference and terrain altitude is more visible. The dark area with a large deviation nearly never appears below 1000 m, and, with the ERA5 precipitation amount, it rarely appears below 2000 m. The dark color in Figure 6e,g,h is predominantly blue. These dark blue and black portions are mainly distributed around the 2000 m contour line, and the color blue becomes lighter (the diurnal phase difference decreases) in the western part of the TP. The diurnal phase difference of the ERA5 precipitation amount has a narrow red band to the west of the 2000 m contour line in EPTP. In this region, the amount of ERA5 peaks in the morning. This is mostly owing to the fact that the region’s rainfall intensity peaks in the early morning. Intensity shows the fewest single-peak features among the three precipitation features. Consequently, the distribution of the diurnal phase difference in precipitation across the three datasets is more disorderly (Figure 6c,f,i). In each set of data, the distribution of the intensity diurnal phase difference is analogous to that of the rainfall amount’s diurnal phase difference. However, there are fewer blue grids (50.2% for IMERG, 38.1% for ERA5, and 41% for GRIST) than those of the amount. In conjunction with altitude, the diurnal phase of intensity will be analyzed in more detail in Section 3.2.

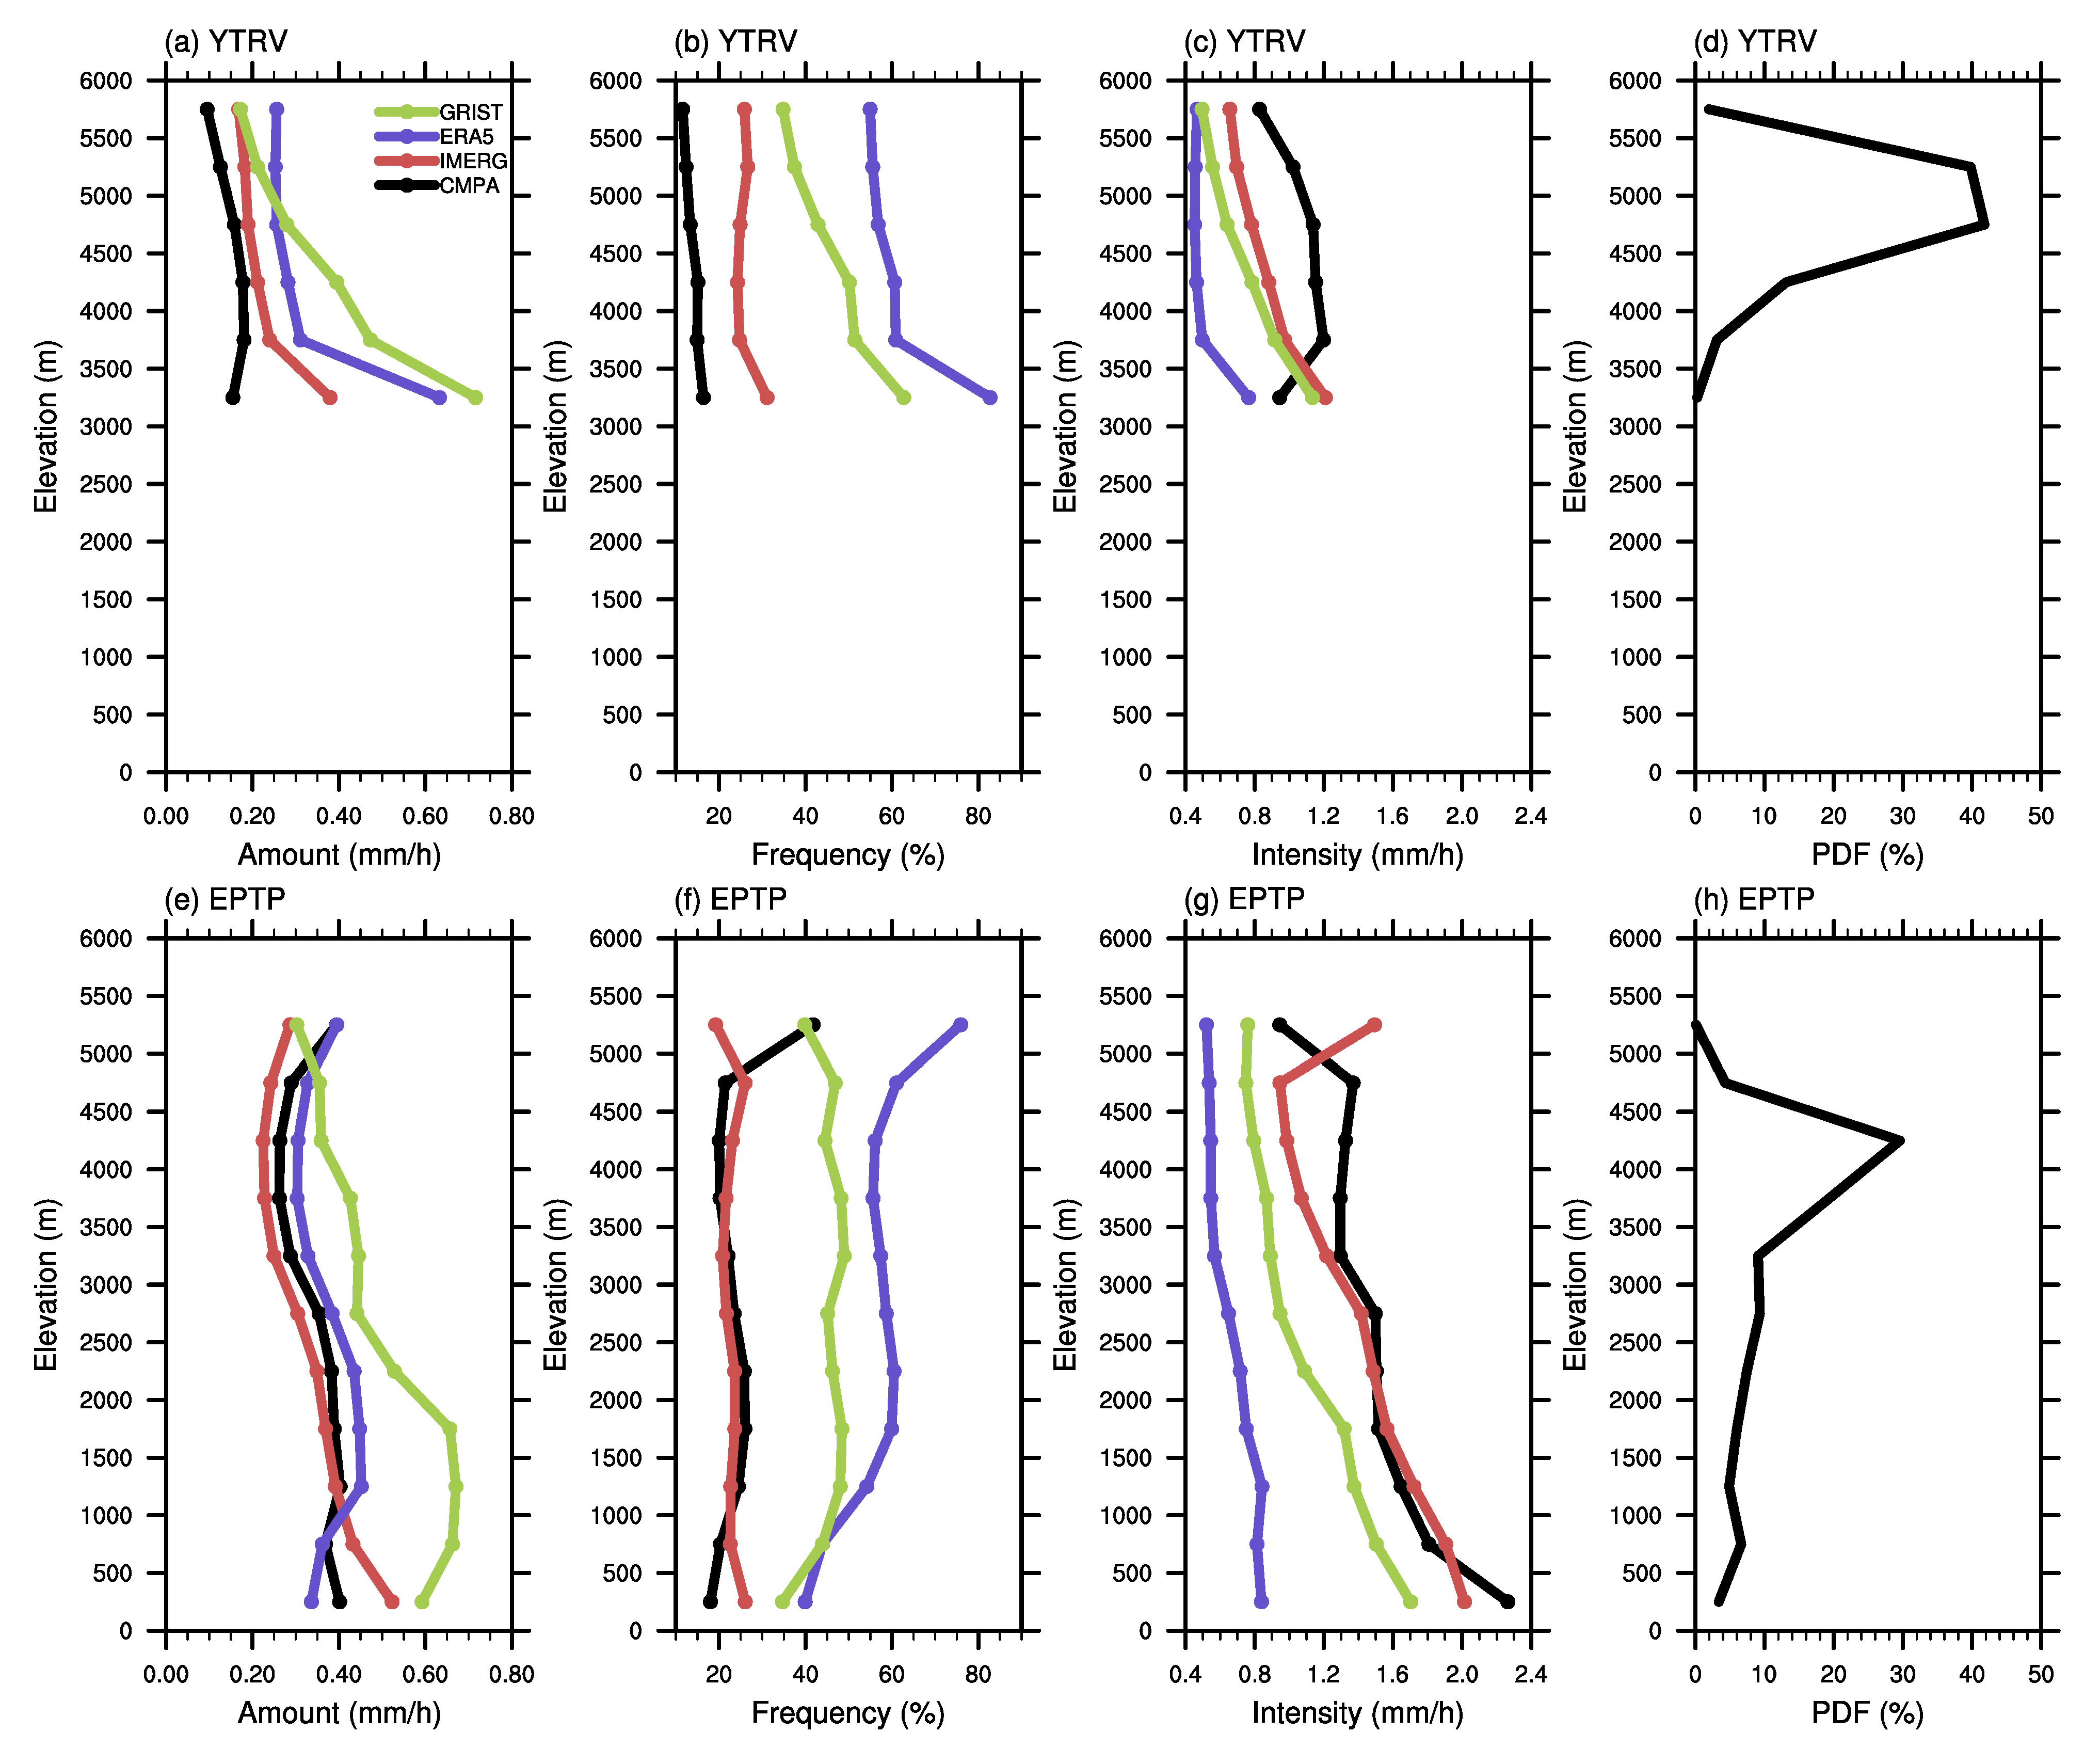
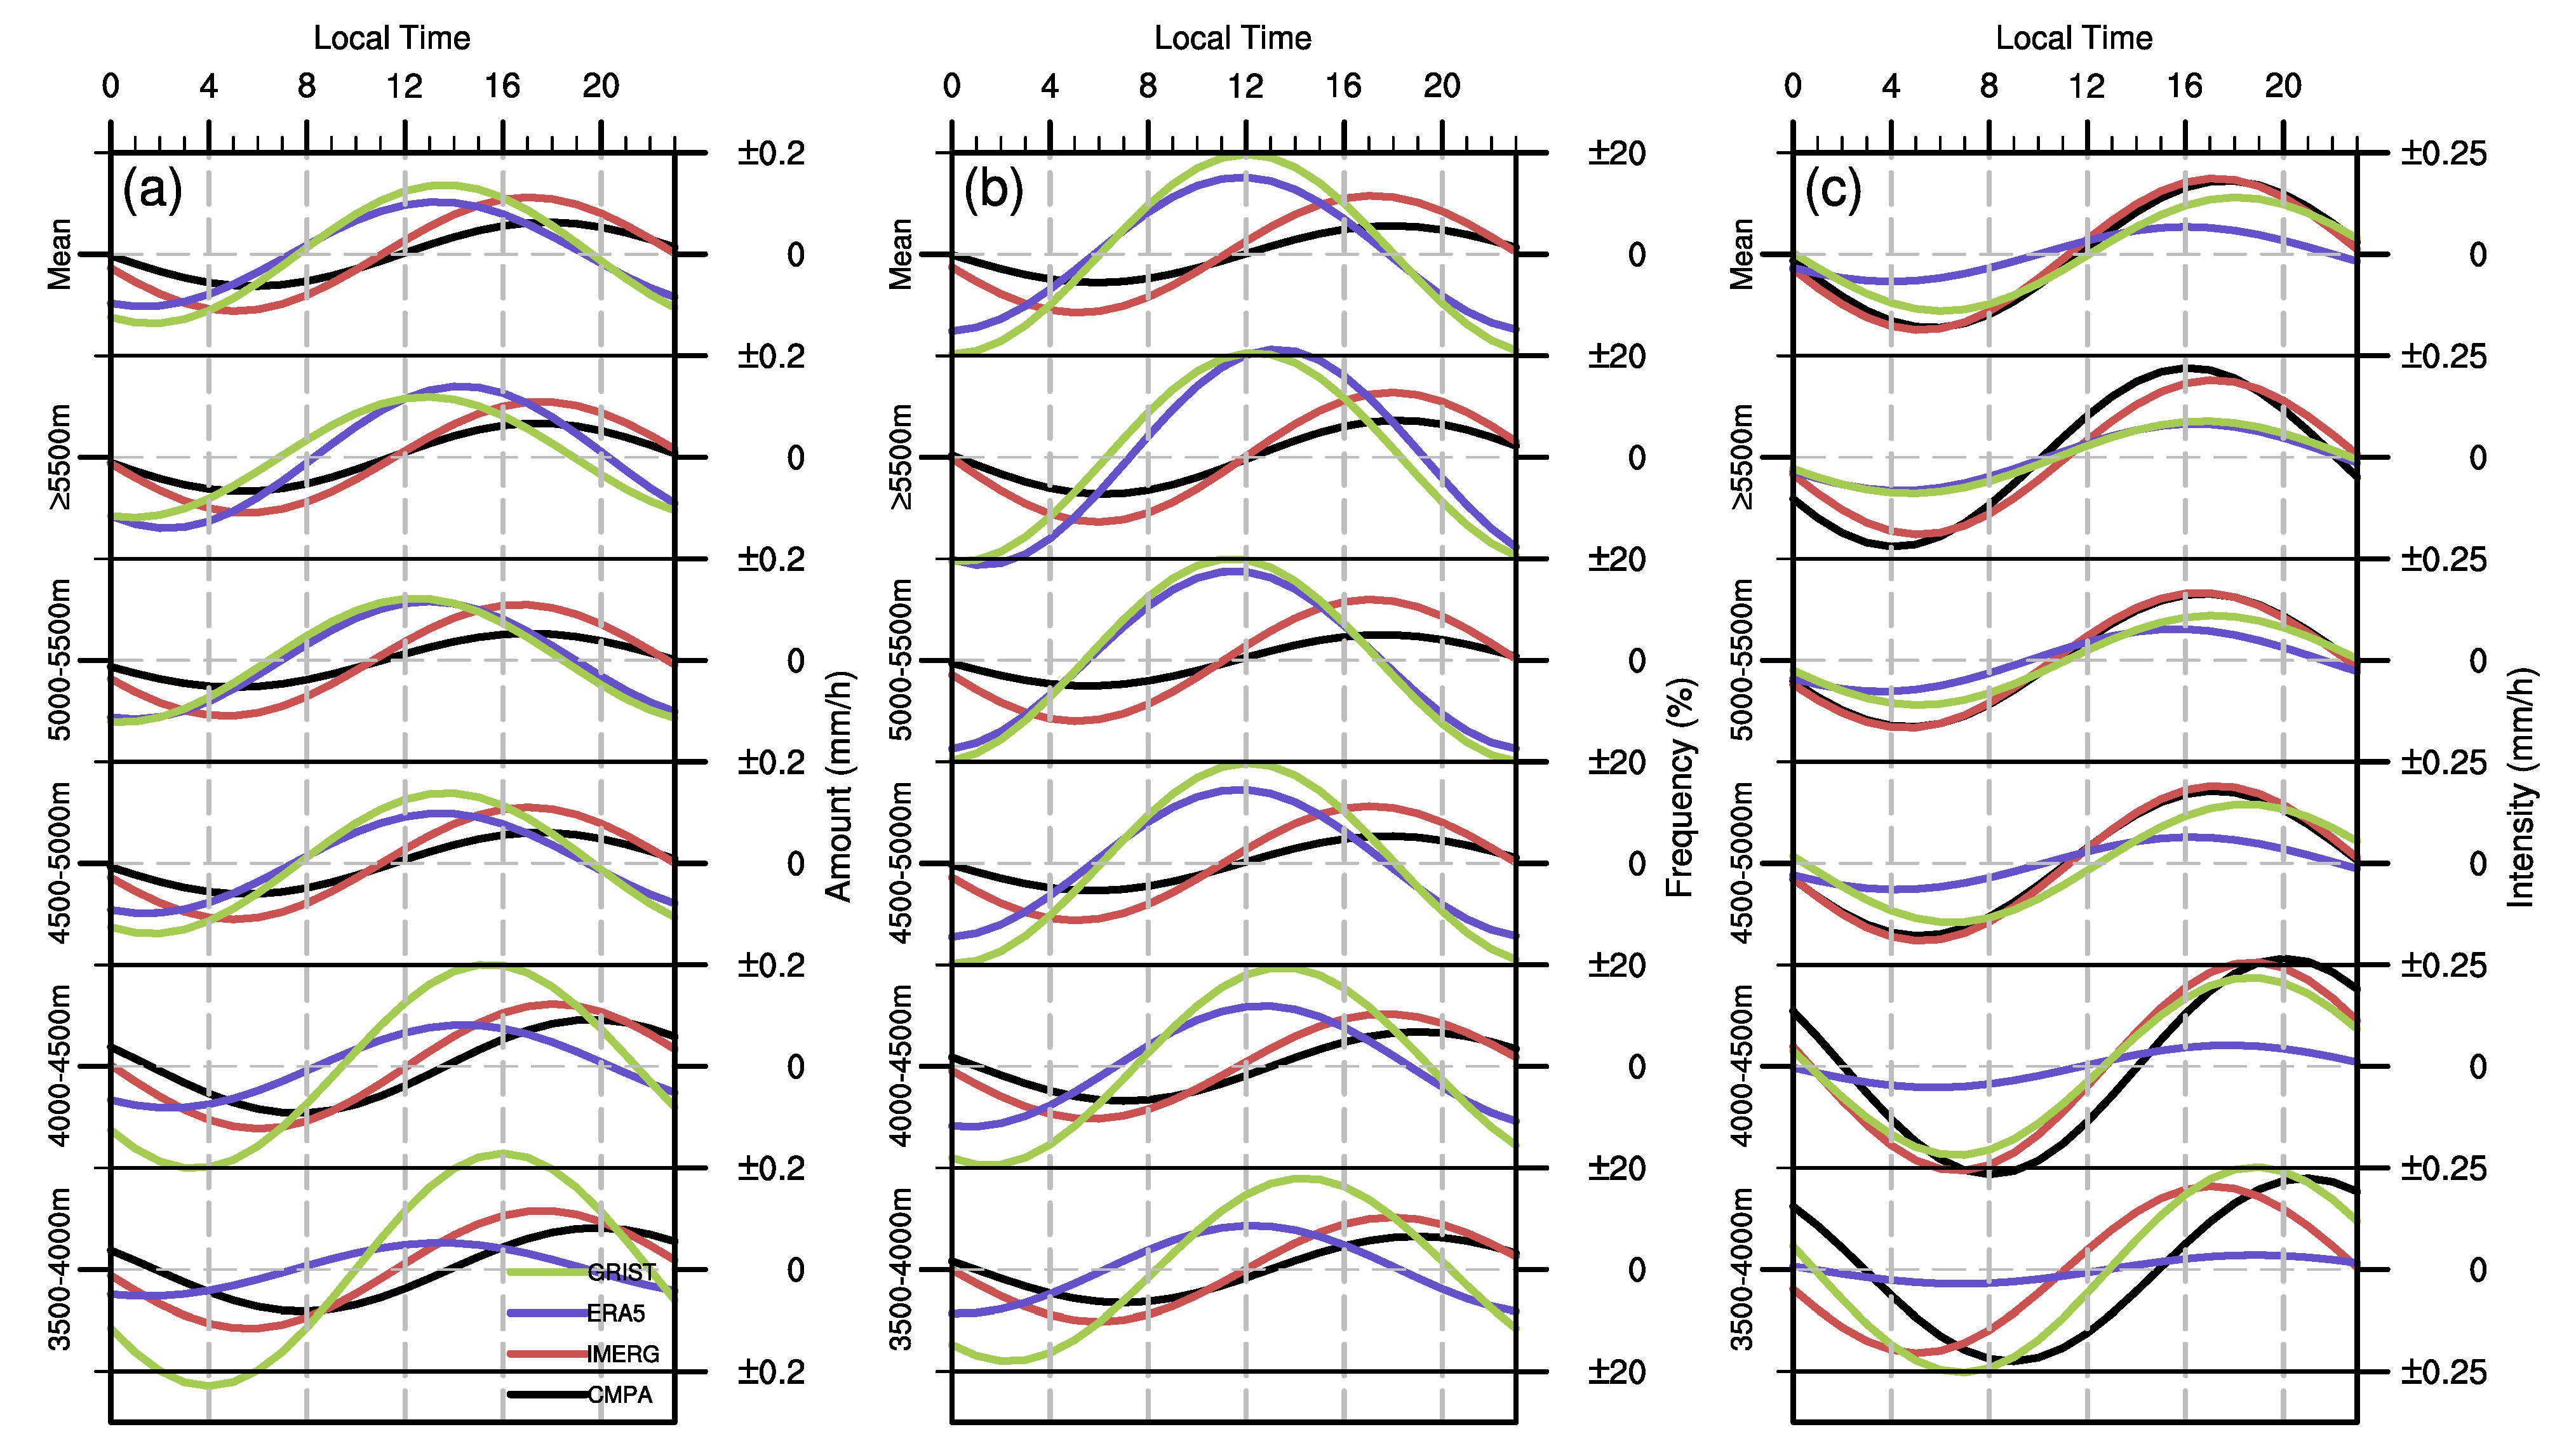
3.2. Elevation Dependence of Hourly Precipitation Characteristics

As shown in Section 3.1, ERA5 and GRIST can nicely reflect the spatial characteristics of precipitation amount over the TP. However, the evaluation of the distribution of frequency and intensity, as well as the diurnal phase of precipitation, has shown that these two products also possess issues in most numerical models that employ cumulus parameterization schemes. In addition, these issues are closely related to the elevation of the TP. Thus, the elevation dependence of different precipitation features is analyzed for further assessment.
Figure 7 shows the elevation dependence of precipitation amount, frequency, and intensity in the YTRV and EPTP regions. In YTRV, the two simulation datasets consistently overestimate the amount and frequency of precipitation at all elevations compared to CMPA (Figure 7a,b), whereas they all underestimate the intensity, except at 3000–3500 m (Figure 7c). Comparing IMERG and the two simulation datasets to CMPA, the deviation of the IMERG (red line and dots) precipitation is minimal at almost all heights. ERA5’s (violet line and dots) bias in frequency and intensity is the most severe at all heights; However, below 5000 m, GRIST (green line and dots) has the most significant deviation in precipitation amount. The probability distribution function (PDF) of elevation in YTRV is shown in Figure 7d. Most grids (81.6%) have an elevation between 4500 and 5500 m, whereas just 0.3% (5 grids) have an elevation between 3000 and 3500 m. Therefore, only the grids over 3500 m in YTRV are discussed. The amount and frequency of CMPA (black line and dots) peak between 4000 and 4500 m, while the intensity peaks at low altitudes; and all three variables decrease as altitude rises. Differing from CMPA, IMERG’s precipitation frequency increases as elevation rises and reaches a maximum between 5000 and 5500 m. Though ERA5’s rainfall intensity varies little with altitude, ERA5 and GRIST can reproduce the relationship between precipitation and altitude changes in YTRV.
The altitude range in the EPTP region is quite extensive, with the lowest altitude being 390 m and the highest being 5122 m. According to Figure 7h, the elevation of nearly half of the grids (48.9%) lies between 3500 and 4500 m, while only one grid is higher than 5000 m. The following analysis mainly focuses on grids below 5000 m in EPTP. Except for the underestimation of precipitation intensity above 3500 m, the precipitation with the altitude curve of IMERG in EPTP is nearly identical to that of CMPA (Figure 7e–g). The simulated precipitation amount against altitude curves generated by ERA5 is comparable to CMPA, with only a tiny overestimation above 1000 m (Figure 7e). In contrast, GRIST considerably overestimates the amount of EPTP at all altitudes, although this wet bias diminishes as height increases. However, ERA5 significantly overstates the frequency of precipitation (Figure 7f) at each height and underestimates the intensity (Figure 7g). In regions above 1000 m, the CMPA precipitation frequency is approximately 25%, whereas the ERA5 frequency surpasses 60% (Figure 7f). GRIST’s frequency is less than ERA5’s but still exceeds 45%. At an altitude of 3000–3500 m, CMPA precipitation intensity is at its lowest (Figure 7g). However, the intensity of precipitation simulated by ERA5 and GRIST diminishes with height. Furthermore, ERA5 has the most apparent underestimation of precipitation intensity in low-altitude regions (0–500 m, −1.42 mm/h) because its intensity remains weak at various altitudes. In contrast, GRIST’s intensity underestimation is more evident in high-altitude regions (4500–5000 m, −0.62 mm/h) since the model failed to replicate the rise in precipitation intensity above 3000 m.
Figure 8 and Figure 9 depict the elevation dependency of the diurnal harmonic in YTRV and EPTP, respectively. In YTRV, altitude ranges are separated into five 500 m blocks (e.g., 3500–4000 m, 4000–4500 m, etc.). In EPTP, altitude ranges are separated into five 1000 m blocks (e.g., 0–1000 m, 1000–2000 m, etc.). Horizontal solid black lines separate different altitude blocks, and the dashed gray line in the center of each block represents the zero line. The elevation of each panel rises from bottom to top, and the top panel displays the mean diurnal harmonic of the region. As the altitude of YTRV rises from 3500 to 6000 m, the diurnal phase of CMPA precipitation changes from 17 to 20 LT (Figure 8a). The diurnal phase changes from 18 to 19 LT and from 16 to 21 LT, respectively, for the CMPA’s frequency and intensity (Figure 8b,c). IMERG shows more high-altitude (less nocturnal precipitation) features here, with its diurnal phase in amount, frequency, and intensity all present 1–2 h earlier than CMPA at almost all heights. In YTRV, the ability of ERA5 to replicate the diurnal phase of precipitation with altitude is insufficient, and the diurnal phase precipitation amount and frequency are almost unchanged by height, remaining between 13–14 LT and 12–13 LT. Although the diurnal phase of ERA5 precipitation intensity changes from 19 to 16 LT as altitude increases, it occurs 1–2 h earlier than CMPA. GRIST can simulate the characteristic that the diurnal phase of precipitation advances gradually with altitude. The changes in the amount, frequency, and intensity’s diurnal phases with increases in altitude are from 16 to 13 LT, from 14 to 12 LT, and from 19 to 17 LT, respectively, all occurring earlier than CMPA. For ERA5 and GRIST’s precipitation diurnal phases in YTRV, the lower the altitude, the more pronounced this earlier characteristic.
With increasing elevation, the diurnal phase of precipitation amount, frequency, and intensity in CMPA transitioned from midnight to evening in EPTP (from 0 to 18 LT for amount, from 23 to 18 LT for frequency, and from 23 to 19 LT for intensity; Figure 9a–c). IMERG has the same characteristics as CMPA, but the diurnal phase is 1–3 h earlier, and the higher the altitude, the more pronounced this earlier characteristic becomes. Although ERA5 can simulate the midnight peak of amount and intensity below 2000 m, its forenoon (amount and frequency) or early morning (intensity) peak time in the region above 2000 m is dramatically different from CMPA and IMERG. Therefore, there is still a significant deviation in the simulation of the diurnal phase of precipitation in EPTP by ERA5. The characteristic that the diurnal phase of precipitation increases with altitude can be simulated by GRIST. The variations of the amount, frequency, and intensity’s diurnal phases with increases in altitude are from 21 to 12 LT, from 14 to 12 LT, and from 19 to 17 LT, respectively, and all occur earlier than CMPA with the maximum biases appearing at 2000–3000 m. Even so, the bias of GRIST intensity’s diurnal phase is relatively tiny, occurring no more than 2 h earlier than CMPA.
In addition, the diurnal harmonic curves can reflect the the elevation dependence of diurnal amplitude in each dataset. IMERG’s diurnal amplitudes in the two sub-regions are consistent with CMPA, except for its diurnal amplitudes of precipitation amount and frequency in YTRV, which are slightly larger than CMPA. ERA5 and GRIST, especially GRIST, significantly overstated the diurnal amplitude of precipitation frequency. ERA5 greatly underestimated the diurnal amplitude of precipitation intensity at all elevations. In the two sets of observational data, the diurnal amplitude of precipitation amount and intensity declines with height, and the diurnal amplitude of frequency does not exhibit a noticeable change pattern with height. However, the two models’ diurnal amplitude of frequency increases with altitude. Combining Figure 8b and Figure 9b indicate that, at areas above 1000 m, the precipitation frequencies of ERA5 and GRIST exhibit a fairly consistent peak around midday. It is nearly in the opposite phase of the observed data at certain heights. These two features of model precipitation frequency may have a strong connection to cumulus parameterization.
The frequency–intensity distribution is a critical element of climatological rainfall features and a crucial metric for assessing model competence [23]. Figure 10 and Figure 11 present the precipitation frequency–intensity structure at various altitudes averaged in YTRV and EPTP; the altitude bins are the same as Figure 8 and Figure 9, respectively. The precipitation frequency distribution for weak intensities (0.1–1 mm/h) is shown in the left column, and the frequency distribution for all intensities (0.1–5 mm/h) is shown in the right column with logarithmic coordinates. The bias in the precipitation intensity structure is a prevalent issue in climate models [23,54,55], where light precipitation is overestimated and heavy precipitation is underestimated The hourly frequencies of all three datasets are more than that of CMPA (black line) for intensities less than 0.7 mm/h (Figure 10a and Figure 11a) and less than that of CMPA for intensities greater than 1 mm/h (Figure 10b and Figure 11b). In YTRV and EPTP, the frequency of CMPA heavy precipitation varies little with height, whereas the frequency of light precipitation increases somewhat with altitude. The frequency–intensity structure of IMERG is the most similar to that of CMPA, followed by GRIST, while ERA5 is the worst. For these three datasets, the frequency of heavy precipitation reduces with height, and the increase of light rain with altitude is more pronounced than that of CMPA. Consequently, in the two studied sub-regions, the precipitation frequency–intensity structures of the three datasets are more consistent with CMPA at relatively lower altitudes, and the overestimation of the weak precipitation and the underestimation of the heavy rainfall become more apparent as the altitude increases.

4. Discussion

The diurnal phase deviation characteristics of the two sets of model results (ERA5 and GRIST) have a clear relation with the topography, and their deviations are similar. These biases in the diurnal phase may be related to the convective parameterization schemes, while the advantages of the two models manifest themselves in various ways. The relationship between elevation and precipitation amount of ERA5 is much closer to that of CMPA in EPTP. GRIST reproduces the spatial distribution of frequency and intensity, frequency–intensity structure, as well as their variations with altitude more realistically. This demonstrates that the realistic circulation in ERA5 can generate a more reliable precipitation amount under resolvable large-scale terrain. Nonetheless, the simulation of precipitation in ERA5 is less satisfactory under small-scale terrain that the grid spacing cannot resolve. The kilometer-scale GRIST depicts finer topography and performs more realistic hourly-scale precipitation characteristics as well as precipitation under small-scale terrain. Despite the metrics provided in this study, an in-depth investigation is still needed to understand the processes that terrain affects in complicated terrain areas in numerical models. Subsequent research may focus on the variable scale circulation and investigate the key parameters that influence the distribution and evolution of precipitation.
The horizontal resolution is another key element influencing the performance of the two datasets. We compared the current 36 day integration results and the 5 year integration results of GRIST. The two sets of GRIST model experiments with different resolutions and integration periods exhibit a similar diurnal phase of precipitation amount over the TP [56]. This demonstrates the consistency and robustness of the GRIST simulation under different resolutions. To further understand the influences of model resolution, future work is also needed to compare the results of GRIST with various resolutions.
CPTP is a project dedicated to enhancing our understanding of precipitation in the TP region with the help of high-resolution modeling. The study period coincides with the monsoon case of CPTP, with the vision of providing references for this project. To better comprehend the performance of high-resolution precipitation data, such as satellite and model products over the Tibetan Plateau, the elevation dependence of precipitation is a useful metric. At the same time, these features provide an insightful perspective to analyze the influence of topography on the bias of model precipitation.

5. Conclusions

In this study, the detailed hourly precipitation characteristics from two different precipitation products (i.e., global reanalysis ERA5 and variable-resolution global model GRIST) over the TP have been thoroughly investigated by using the satellite-gauge merged rainfall product (CMPA), and the satellite-retrieved precipitation estimate from IMERG is also evolved to represent uncertainties among different observations.
The main findings of this study are summarized as follows:
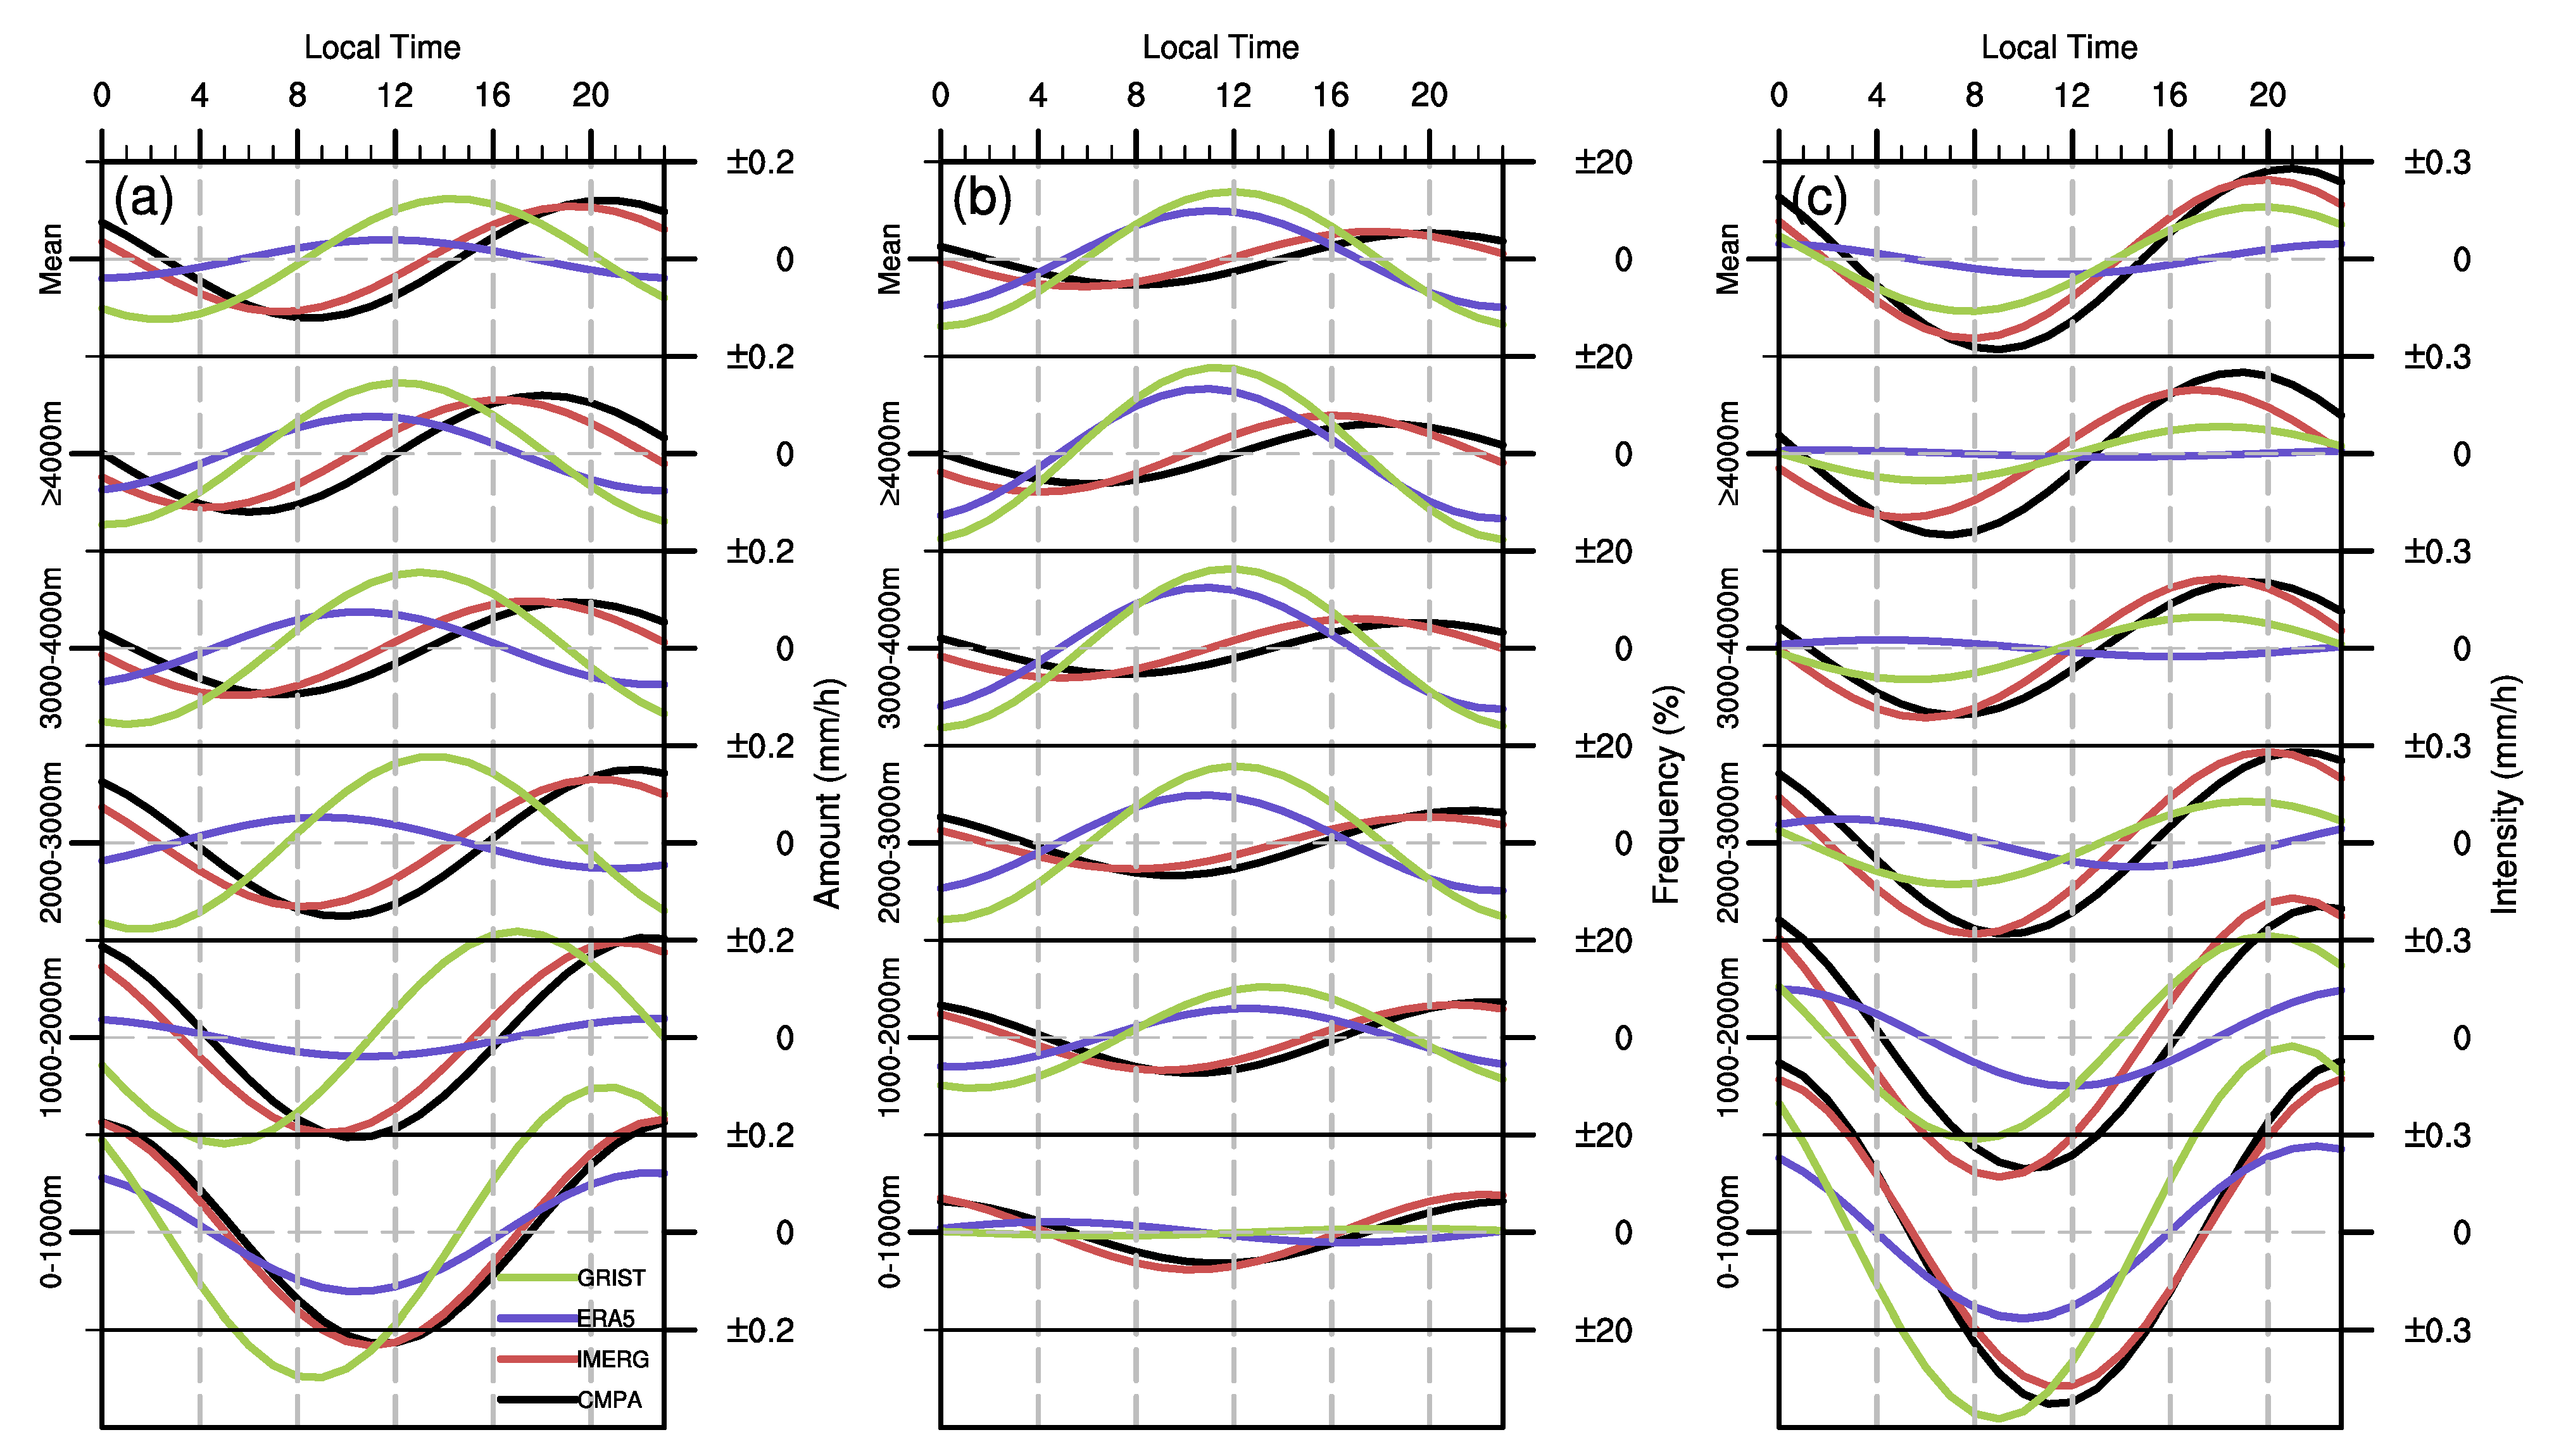
  • The precipitation of IMERG generally has a good consistency with CMPA, although its diurnal peak occurs 1–2 h earlier. This kind of difference in the diurnal variations exhibits different behaviors at different altitudes. Compared with CMPA, IMERG depicts the same midnight peak in low-altitude regions (namely the Sichuan Basin) but shows less nocturnal precipitation over the TP. Therefore, the difference between the precipitation phase of IMERG and CMPA in YTRV (EPTP) diminishes (increases) with altitude.
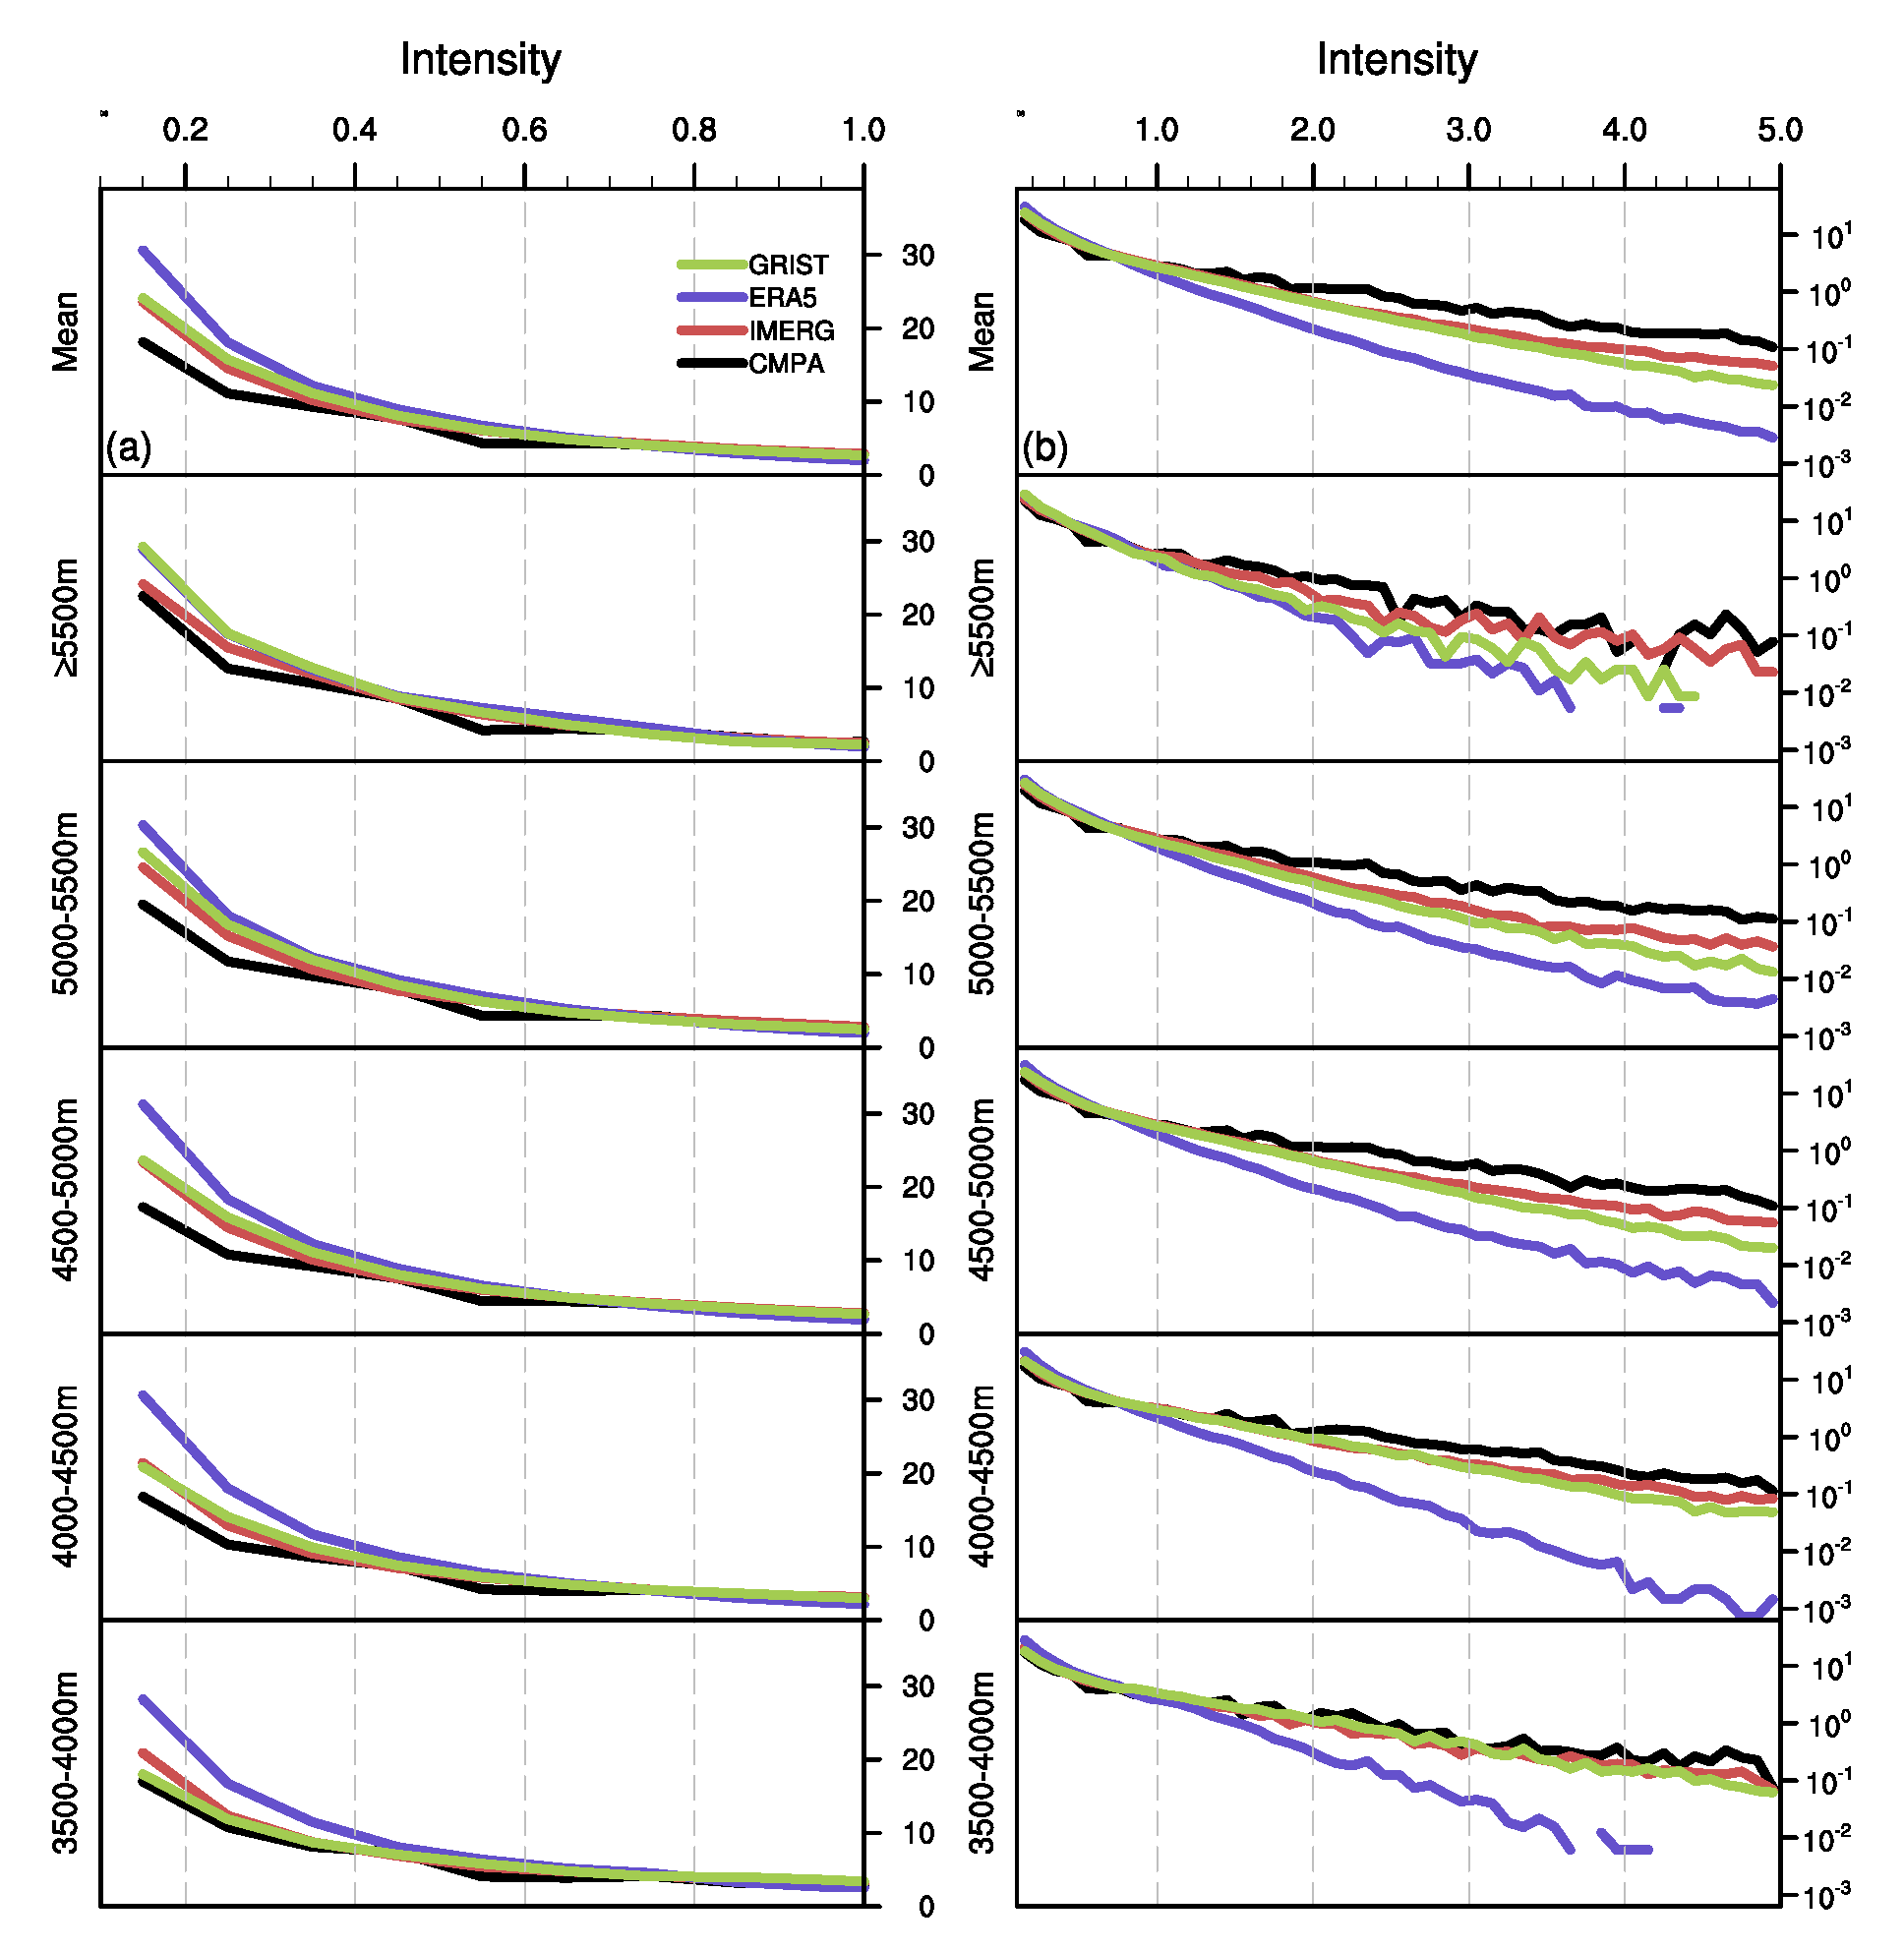
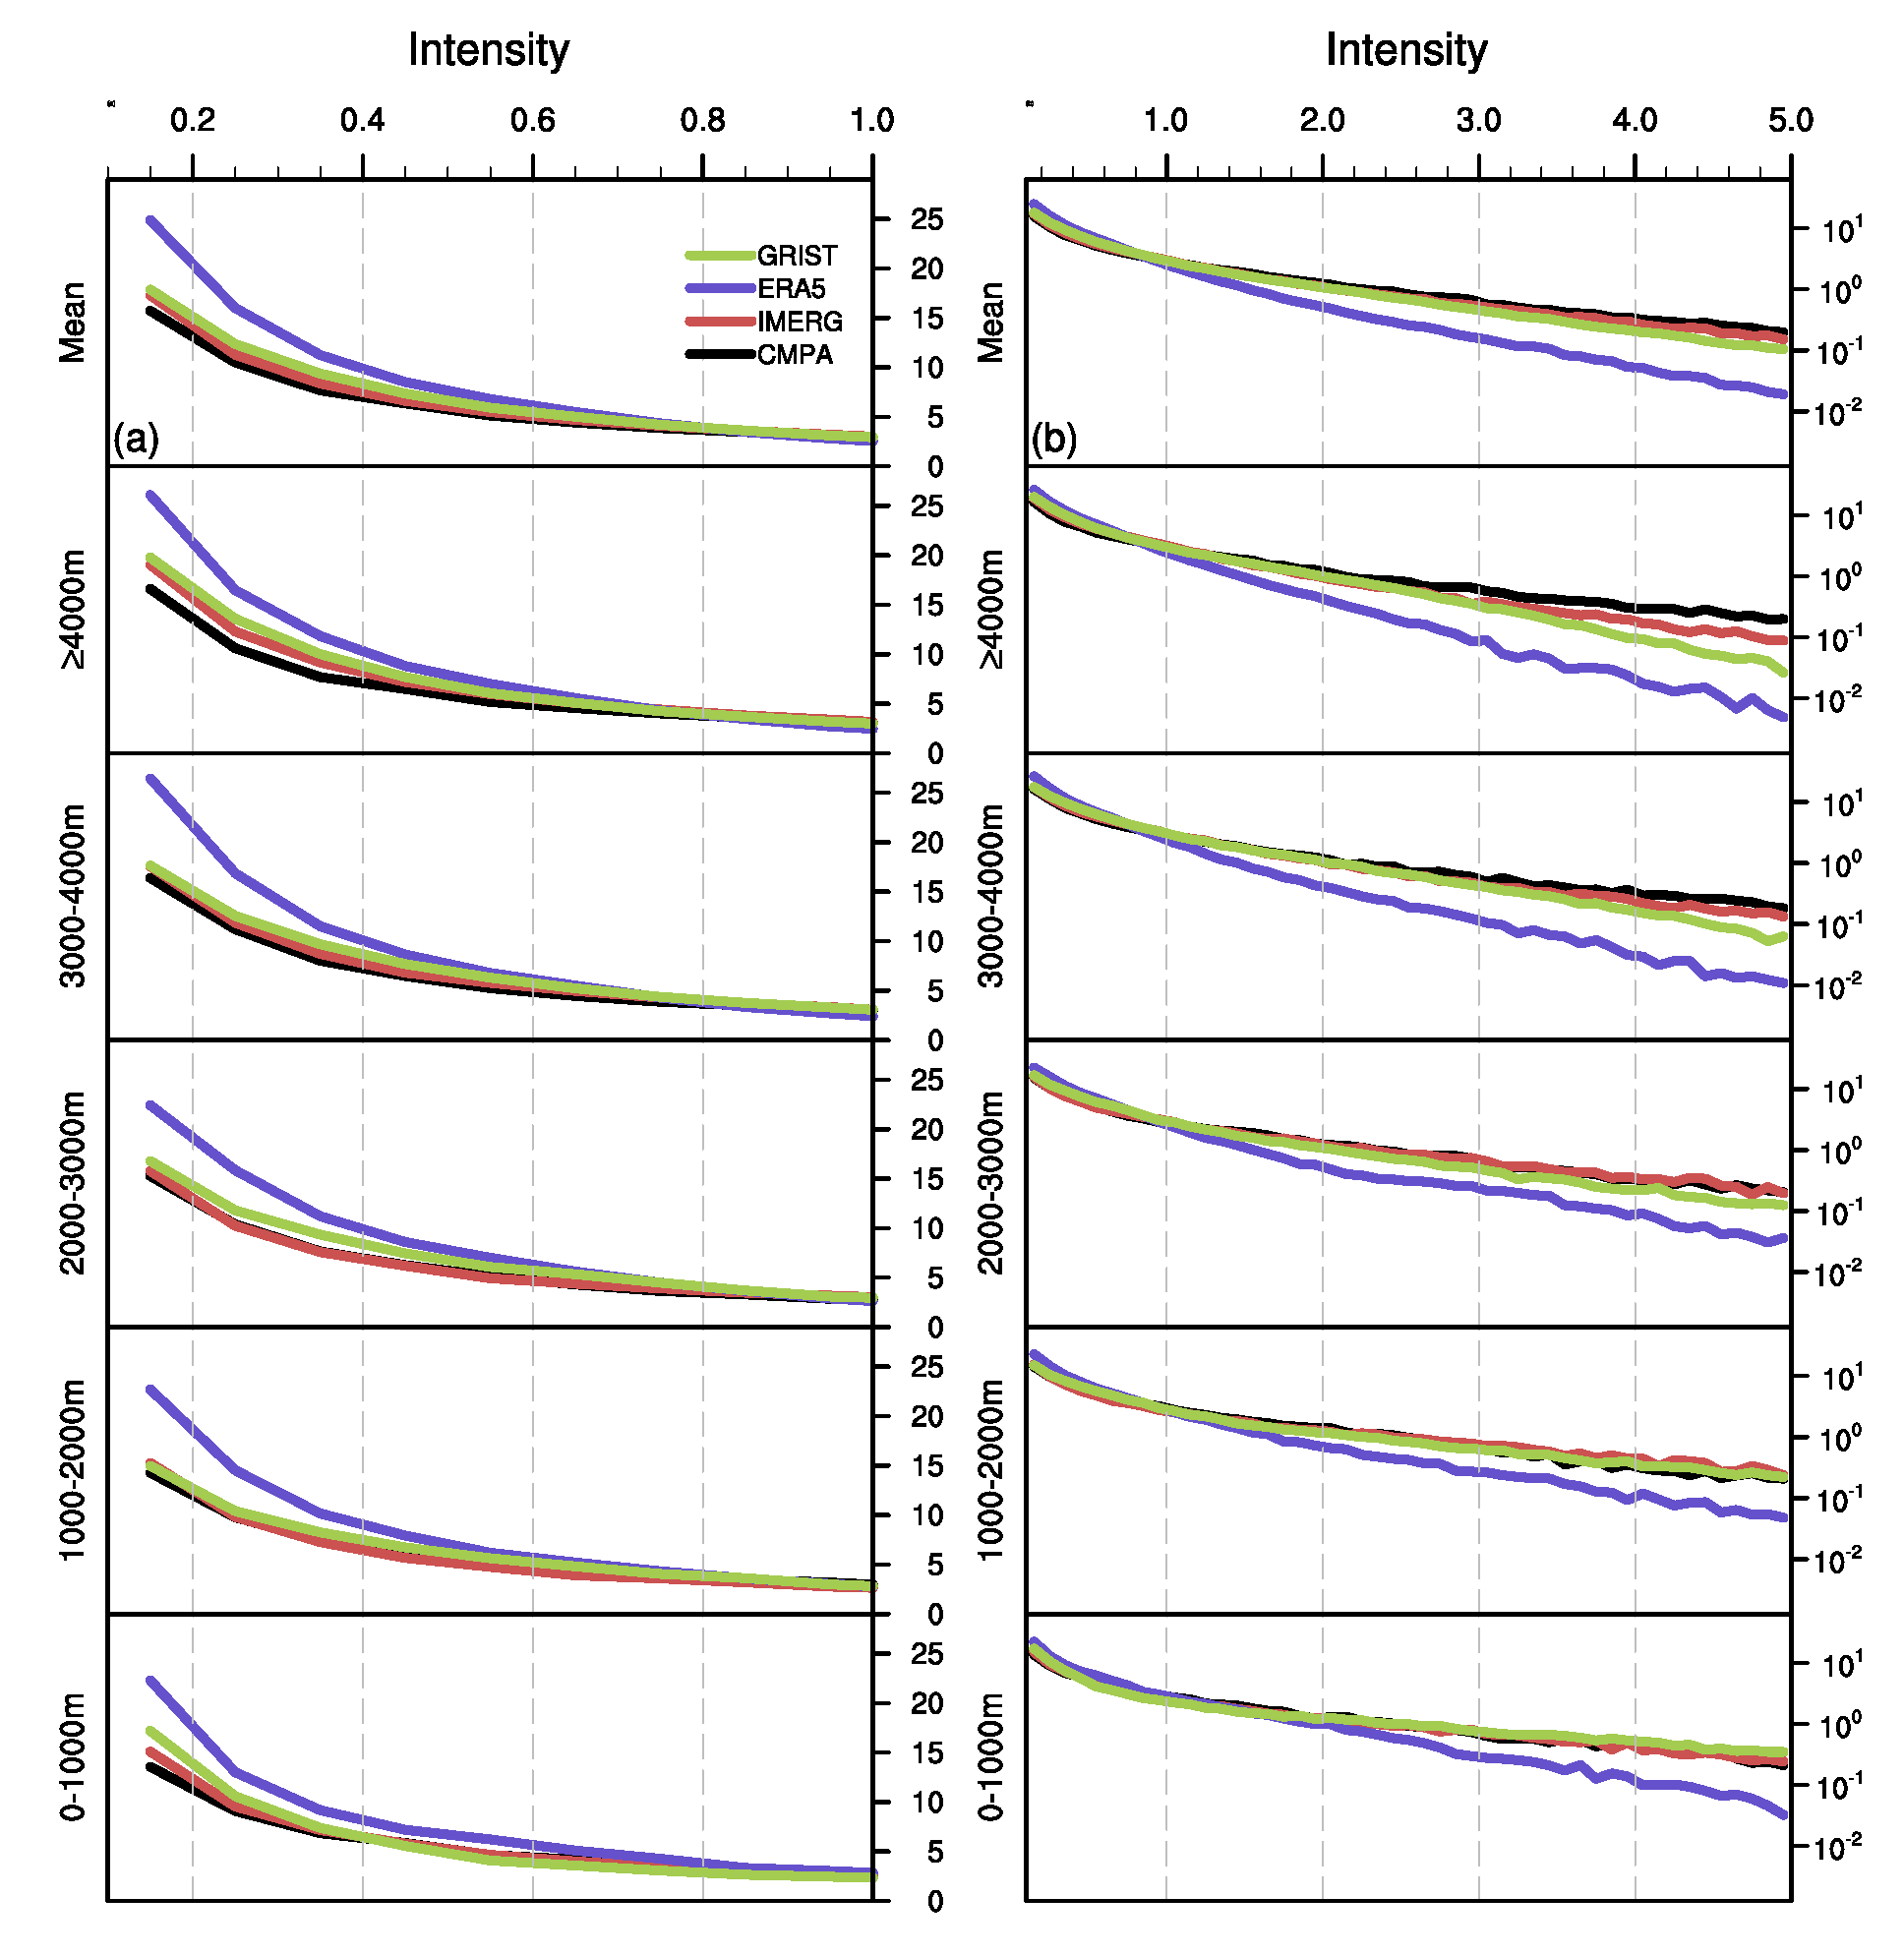
  • ERA5 could well represent the spatial distribution of the precipitation amount and its variations changing with altitudes (especially in a large-scale terrain such as EPTP). However, in terms of the diurnal variations, as well as the hourly precipitation frequency and intensity, there is a notable difference between ERA5 and CMPA. Over the TP, ERA5 failed to reproduce the diurnal phase and the amplitude of precipitation. The precipitation frequency in ERA5 has a near-uniform peak at local noon time above 1000 m, while the diurnal amplitude of precipitation intensity is small. ERA5 significantly overestimates (underestimates) the frequency (intensity) of precipitation at various altitudes because it frequently generates weak precipitation and underestimates the frequency of heavy precipitation.
  • GRIST has a greater resemblance to the CMPA, in terms of the spatial distribution of precipitation frequency and intensity, as well as the elevation dependence, compared with ERA5. Although the precipitation frequency in GRIST also tends to peak at noon time, the diurnal cycle of the precipitation intensity at different altitudes is comparable to CMPA, which contributes to its diurnal phase of the precipitation amount with a smaller bias than that of ERA5. In addition, the hourly precipitation frequency–intensity structure at various altitudes has also been well simulated in GRIST, although there is a larger overestimation (underestimation) of the frequency of light precipitation (heavy precipitation) as the altitude increases, which results in a negative bias of precipitation intensity, and a positive bias of amount and frequency over the TP.
This analysis provides important insight regarding the spatial distribution and elevation dependence of the hourly-scale precipitation characteristics of CMPA, IMERG, ERA5, and GRIST over the Tibetan Plateau. As such, the results are helpful for understanding the biases of simulated precipitation in complex terrain.

Author Contributions

Conceptualization, T.C. and J.L.; methodology, T.C., J.L. and Y.Z.; software, Y.Z.; validation, T.C.; formal analysis, T.C.; investigation, T.C.; resources, J.L.; data curation, T.C. and Y.Z.; writing—original draft preparation, T.C.; writing—review and editing, H.C. (Haoming Chen), P.L., Y.Z., J.L. and H.C. (Huizheng Che); visualization, T.C.; supervision, J.L.; project administration, J.L.; funding acquisition, J.L., H.C. (Haoming Chen) and P.L. All authors have read and agreed to the published version of the manuscript.

Funding

This research was funded by the National Natural Science Foundation of China, Grant No. 42225505, No. 42075154, No. U2142214, No. U2142204, No. 42005039, and the S&T Development Fund of Chinese Academy of Meteorological Sciences, No. 2022KJ007.

Data Availability Statement

IMERG, ERA5, and GTOPO30 datasets are publicly available. IMERG can be found here: https://pmm.nasa.gov/data-access/downloads/gpm (accessed on 1 June 2022). ERA5 can be found here: https://cds.climate.copernicus.eu/cdsapp#!/dataset/reanalysis-era5-single-levels?tab=overview/ (accessed on 1 June 2022). GTOPO30 can be found here: https://www.usgs.gov/centers/eros/science/usgs-eros-archive-digital-elevation-global-30-arc-second-elevation-gtopo30 (accessed on 28 Janurary 2021).

Conflicts of Interest

The authors declare no conflict of interest.

References

  1. Qiu, J. China: The third pole. Nature 2008, 454, 393–397. [Google Scholar] [CrossRef] [PubMed]
  2. Immerzeel, W.W.; Van Beek, L.P.; Bierkens, M.F. Climate change will affect the Asian water towers. Science 2010, 328, 1382–1385. [Google Scholar] [CrossRef] [PubMed]
  3. Xu, X.; Zhao, T.; Lu, C.; Guo, Y.; Chen, B.; Liu, R.; Li, Y.; Shi, X. An important mechanism sustaining the atmospheric “water tower” over the Tibetan Plateau. Atmos. Chem. Phys. 2014, 14, 11287–11295. [Google Scholar] [CrossRef]
  4. Wang, X.; Pang, G.; Yang, M. Precipitation over the Tibetan Plateau during recent decades: A review based on observations and simulations. Int. J. Climatol. 2018, 38, 1116–1131. [Google Scholar] [CrossRef]
  5. Ye, D.; Gao, Y. Meteorology of the Qinghai-Xizang (Tibet) Plateau; Science Press: Beijing, China, 1979. (In Chinese) [Google Scholar]
  6. Anders, A.M.; Roe, G.H.; Hallet, B.; Montgomery, D.R.; Finnegan, N.J.; Putkonen, J. Spatial patterns of precipitation and topography in the Himalaya. Spec. Pap. Geol. Soc. Am. 2006, 398, 39–53. [Google Scholar]
  7. Barros, A.P.; Joshi, M.; Putkonen, J.; Burbank, D. A study of the 1999 monsoon rainfall in a mountainous region in central Nepal using TRMM products and rain gauge observations. Geophys. Res. Lett. 2000, 27, 3683–3686. [Google Scholar] [CrossRef]
  8. Roe, G.H. Orographic precipitation. Annu. Rev. Earth Planet. Sci. 2005, 33, 645–671. [Google Scholar] [CrossRef]
  9. Kuwagata, T.; Numaguti, A.; Endo, N. Diurnal variation of water vapor over the central Tibetan Plateau during summer. J. Meteorol. Soc. Jpn. Ser. II 2001, 79, 401–418. [Google Scholar] [CrossRef]
  10. Ueno, K.; Fujii, H.; Yamada, H.; Liu, L. Weak and frequent monsoon precipitation over the Tibetan Plateau. J. Meteorol. Soc. Jpn. Ser. II 2001, 79, 419–434. [Google Scholar] [CrossRef]
  11. Wang, C.C.; Chen, G.T.J.; Carbone, R.E. A climatology of warm-season cloud patterns over East Asia based on GMS infrared brightness temperature observations. Mon. Weather. Rev. 2004, 132, 1606–1629. [Google Scholar] [CrossRef]
  12. Liu, X.; Bai, A.; Liu, C. Diurnal variations of summertime precipitation over the Tibetan Plateau in relation to orographically-induced regional circulations. Environ. Res. Lett. 2009, 4, 045203. [Google Scholar] [CrossRef]
  13. Chen, H.; Yuan, W.; Li, J.; Yu, R. A possible cause for different diurnal variations of warm season rainfall as shown in station observations and TRMM 3B42 data over the southeastern Tibetan Plateau. Adv. Atmos. Sci. 2012, 29, 193–200. [Google Scholar] [CrossRef]
  14. Ouyang, L.; Yang, K.; Lu, H.; Chen, Y.; Zhou, X.; Wang, Y. Ground-based observations reveal unique valley precipitation patterns in the central Himalaya. J. Geophys. Res. Atmos. 2020, 125, e2019JD031502. [Google Scholar] [CrossRef]
  15. Li, J. Hourly station-based precipitation characteristics over the Tibetan Plateau. Int. J. Climatol. 2018, 38, 1560–1570. [Google Scholar] [CrossRef]
  16. Su, F.; Duan, X.; Chen, D.; Hao, Z.; Cuo, L. Evaluation of the global climate models in the CMIP5 over the Tibetan Plateau. J. Clim. 2013, 26, 3187–3208. [Google Scholar] [CrossRef]
  17. Gao, Y.; Xu, J.; Chen, D. Evaluation of WRF mesoscale climate simulations over the Tibetan Plateau during 1979–2011. J. Clim. 2015, 28, 2823–2841. [Google Scholar] [CrossRef]
  18. Bao, Q.; Li, J. Progress in climate modeling of precipitation over the Tibetan Plateau. Natl. Sci. Rev. 2020, 7, 486–487. [Google Scholar] [CrossRef] [PubMed]
  19. Zhu, H.; Jiang, Z.; Li, J.; Li, W.; Sun, C.; Li, L. Does CMIP6 inspire more confidence in simulating climate extremes over China? Adv. Atmos. Sci. 2020, 37, 1119–1132. [Google Scholar] [CrossRef]
  20. Luo, N.; Guo, Y.; Chou, J.; Gao, Z. Added value of CMIP6 models over CMIP5 models in simulating the climatological precipitation extremes in China. Int. J. Climatol. 2022, 42, 1148–1164. [Google Scholar] [CrossRef]
  21. Zhang, Y.; Li, J. Impact of moisture divergence on systematic errors in precipitation around the Tibetan Plateau in a general circulation model. Clim. Dyn. 2016, 47, 2923–2934. [Google Scholar] [CrossRef]
  22. Maussion, F.; Scherer, D.; Finkelnburg, R.; Richters, J.; Yang, W.; Yao, T. WRF simulation of a precipitation event over the Tibetan Plateau, China–an assessment using remote sensing and ground observations. Hydrol. Earth Syst. Sci. 2011, 15, 1795–1817. [Google Scholar] [CrossRef] [Green Version]
  23. Li, J.; Yu, R.; Yuan, W.; Chen, H.; Sun, W.; Zhang, Y. Precipitation over E ast A sia simulated by NCAR CAM5 at different horizontal resolutions. J. Adv. Model. Earth Syst. 2015, 7, 774–790. [Google Scholar] [CrossRef]
  24. Lin, C.; Chen, D.; Yang, K.; Ou, T. Impact of model resolution on simulating the water vapor transport through the central Himalayas: Implication for models’ wet bias over the Tibetan Plateau. Clim. Dyn. 2018, 51, 3195–3207. [Google Scholar] [CrossRef]
  25. Prein, A.; Gobiet, A.; Suklitsch, M.; Truhetz, H.; Awan, N.; Keuler, K.; Georgievski, G. Added value of convection permitting seasonal simulations. Clim. Dyn. 2013, 41, 2655–2677. [Google Scholar] [CrossRef]
  26. Norris, J.; Carvalho, L.; Jones, C.; Cannon, F.; Bookhagen, B.; Palazzi, E.; Tahir, A.A. The spatiotemporal variability of precipitation over the Himalaya: Evaluation of one-year WRF model simulation. Clim. Dyn. 2017, 49, 2179–2204. [Google Scholar] [CrossRef]
  27. Li, P.; Furtado, K.; Zhou, T.; Chen, H.; Li, J. Convection-permitting modelling improves simulated precipitation over the central and eastern Tibetan Plateau. Q. J. R. Meteorol. Soc. 2021, 147, 341–362. [Google Scholar] [CrossRef]
  28. Liu, Z.; Gao, Y.; Zhang, G. How well can a convection-permitting-modelling improve the simulation of summer precipitation diurnal cycle over the Tibetan Plateau? Clim. Dyn. 2022, 58, 3121–3138. [Google Scholar] [CrossRef]
  29. Lundquist, J.; Hughes, M.; Gutmann, E.; Kapnick, S. Our skill in modeling mountain rain and snow is bypassing the skill of our observational networks. Bull. Am. Meteorol. Soc. 2019, 100, 2473–2490. [Google Scholar] [CrossRef]
  30. Prein, A.F.; Langhans, W.; Fosser, G.; Ferrone, A.; Ban, N.; Goergen, K.; Keller, M.; Tölle, M.; Gutjahr, O.; Feser, F.; et al. A review on regional convection-permitting climate modeling: Demonstrations, prospects, and challenges. Rev. Geophys. 2015, 53, 323–361. [Google Scholar] [CrossRef]
  31. Li, D.; Yang, K.; Tang, W.; Li, X.; Zhou, X.; Guo, D. Characterizing precipitation in high altitudes of the western Tibetan plateau with a focus on major glacier areas. Int. J. Climatol. 2020, 40, 5114–5127. [Google Scholar] [CrossRef]
  32. Zhou, X.; Yang, K.; Ouyang, L.; Wang, Y.; Jiang, Y.; Li, X.; Chen, D.; Prein, A. Added value of kilometer-scale modeling over the third pole region: A CORDEX-CPTP pilot study. Clim. Dyn. 2021, 57, 1673–1687. [Google Scholar] [CrossRef]
  33. Zhang, Y.; Li, J.; Yu, R.; Zhang, S.; Liu, Z.; Huang, J.; Zhou, Y. A layer-averaged nonhydrostatic dynamical framework on an unstructured mesh for global and regional atmospheric modeling: Model description, baseline evaluation, and sensitivity exploration. J. Adv. Model. Earth Syst. 2019, 11, 1685–1714. [Google Scholar] [CrossRef]
  34. Zhang, Y.; Li, J.; Yu, R.; Liu, Z.; Zhou, Y.; Li, X.; Huang, X. A multiscale dynamical model in a dry-mass coordinate for weather and climate modeling: Moist dynamics and its coupling to physics. Mon. Weather. Rev. 2020, 148, 2671–2699. [Google Scholar] [CrossRef]
  35. Zhou, Y.; Zhang, Y.; Li, J.; Yu, R.; Liu, Z. Configuration and evaluation of a global unstructured mesh atmospheric model (GRIST-A20. 9) based on the variable-resolution approach. Geosci. Model Dev. 2020, 13, 6325–6348. [Google Scholar] [CrossRef]
  36. Zhang, Y.; Yu, R.; Li, J.; Li, X.; Rong, X.; Peng, X.; Zhou, Y. AMIP Simulations of a Global Model for Unified Weather-Climate Forecast: Understanding Precipitation Characteristics and Sensitivity Over East Asia. J. Adv. Model. Earth Syst. 2021, 13, e2021MS002592. [Google Scholar] [CrossRef]
  37. Zhang, Y.; Li, X.; Liu, Z.; Rong, X.; Li, J.; Zhou, Y.; Chen, S. Resolution Sensitivity of the GRIST Nonhydrostatic Model from 120 to 5 km (3.75 km) during the DYAMOND winter. Earth Space Sci. 2022, 9, e2022EA002401. [Google Scholar] [CrossRef]
  38. Clough, S.; Shephard, M.; Mlawer, E.; Delamere, J.; Iacono, M.; Cady-Pereira, K.; Boukabara, S.; Brown, P. Atmospheric radiative transfer modeling: A summary of the AER codes. J. Quant. Spectrosc. Radiat. Transf. 2005, 91, 233–244. [Google Scholar] [CrossRef]
  39. Bechtold, P.; Sandu, I.; Klocke, D.; Semane, N.; Ahlgrimm, M.; Beljaars, A.; Forbes, R.; Rodwell, M. The Role of Shallow Convection in ECMWF’s Integrated Forecasting System; European Center for Medium-RangeWeather Forecasts: Reading, UK, 2014; p. 27. [Google Scholar] [CrossRef]
  40. Zhang, C.; Wang, Y. Projected future changes of tropical cyclone activity over the western North and South Pacific in a 20-km-mesh regional climate model. J. Clim. 2017, 30, 5923–5941. [Google Scholar] [CrossRef]
  41. Hong, S.Y.; Lim, J.O.J. The WRF single-moment 6-class microphysics scheme (WSM6). Asia Pac. J. Atmos. Sci. 2006, 42, 129–151. [Google Scholar]
  42. Niu, G.Y.; Yang, Z.L.; Mitchell, K.E.; Chen, F.; Ek, M.B.; Barlage, M.; Kumar, A.; Manning, K.; Niyogi, D.; Rosero, E.; et al. The community Noah land surface model with multiparameterization options (Noah-MP): 1. Model description and evaluation with local-scale measurements. J. Geophys. Res. Atmos. 2011, 116. [Google Scholar] [CrossRef]
  43. Hong, S.Y.; Noh, Y.; Dudhia, J. A new vertical diffusion package with an explicit treatment of entrainment processes. Mon. Weather. Rev. 2006, 134, 2318–2341. [Google Scholar] [CrossRef] [Green Version]
  44. Shen, Y.; Zhao, P.; Pan, Y.; Yu, J. A high spatiotemporal gauge-satellite merged precipitation analysis over China. J. Geophys. Res. Atmos. 2014, 119, 3063–3075. [Google Scholar] [CrossRef]
  45. Joyce, R.J.; Janowiak, J.E.; Arkin, P.A.; Xie, P. CMORPH: A method that produces global precipitation estimates from passive microwave and infrared data at high spatial and temporal resolution. J. Hydrometeorol. 2004, 5, 487–503. [Google Scholar] [CrossRef]
  46. Chen, S.; Behrangi, A.; Tian, Y.; Hu, J.; Hong, Y.; Tang, Q.; Hu, X.M.; Stepanian, P.M.; Hu, B.; Zhang, X. Precipitation spectra analysis over China with high-resolution measurements from optimally-merged satellite/gauge observations—part II: Diurnal variability analysis. IEEE J. Sel. Top. Appl. Earth Obs. Remote Sens. 2016, 9, 2979–2988. [Google Scholar] [CrossRef]
  47. Hou, A.Y.; Skofronick-Jackson, G.; Kummerow, C.D.; Shepherd, J.M. Global precipitation measurement. In Precipitation: Advances in Measurement, Estimation and Prediction; Springer: Berlin/Heidelberg, Germany, 2008; pp. 131–169. [Google Scholar]
  48. Hou, A.Y.; Kakar, R.K.; Neeck, S.; Azarbarzin, A.A.; Kummerow, C.D.; Kojima, M.; Oki, R.; Nakamura, K.; Iguchi, T. The global precipitation measurement mission. Bull. Am. Meteorol. Soc. 2014, 95, 701–722. [Google Scholar] [CrossRef]
  49. Huffman, G.; Bolvin, D.; Braithwaite, D.; Hsu, K.; Joyce, R.; Kidd, C.; Nelkin, E.; Sorooshian, S.; Tan, J.; Xie, P.; et al. NASA Global Precipitation Measurement (GPM) Integrated Multi-Satellite Retrievals for GPM (IMERG); Algorithm Theoretical Basis Document (ATBD) Version 06; NASA: Washington, DC, USA, 2019. [Google Scholar]
  50. Hersbach, H.; Bell, B.; Berrisford, P.; Hirahara, S.; Horányi, A.; Muñoz-Sabater, J.; Nicolas, J.; Peubey, C.; Radu, R.; Schepers, D.; et al. The ERA5 global reanalysis. Q. J. R. Meteorol. Soc. 2020, 146, 1999–2049. [Google Scholar] [CrossRef]
  51. Bechtold, P.; Semane, N.; Lopez, P.; Chaboureau, J.P.; Beljaars, A.; Bormann, N. Representing equilibrium and nonequilibrium convection in large-scale models. J. Atmos. Sci. 2014, 71, 734–753. [Google Scholar] [CrossRef]
  52. McGarry, M.M.; Reed, R.J. Diurnal variations in convective activity and precipitation during phases II and III of GATE. Mon. Weather. Rev. 1978, 106, 101–113. [Google Scholar] [CrossRef]
  53. Oki, T.; Musiake, K. Seasonal change of the diurnal cycle of precipitation over Japan and Malaysia. J. Appl. Meteorol. Climatol. 1994, 33, 1445–1463. [Google Scholar] [CrossRef]
  54. Chen, M.; Dickinson, R.E.; Zeng, X.; Hahmann, A.N. Comparison of precipitation observed over the continental United States to that simulated by a climate model. J. Clim. 1996, 9, 2233–2249. [Google Scholar] [CrossRef]
  55. Dai, A.; Trenberth, K.E. The diurnal cycle and its depiction in the Community Climate System Model. J. Clim. 2004, 17, 930–951. [Google Scholar] [CrossRef]
  56. Zhou, Y.; Yu, R.; Zhang, Y.; Li, J. Dynamic and thermodynamic processes related to precipitation diurnal cycle simulated by GRIST. Clim. Dyn. submitted.
Figure 1. The variable-resolution (VR) mesh of GRIST with 2,427,967 horizontal cells (3.5–50 km). The filled color area denotes the surface elevation used in GRIST (m). The black contour with a label presents the horizontal resolution (km), and the black polygon indicates the study region.
Remotesensing 15 01013 g001
Figure 2. Precipitation spatial pattern (left: amount (mm/h), middle: frequency (%), right: intensity (mm/h)) derived from CMPA (ac), GPM (df), ERA5 (gi), and GRIST (jl). The superscript numbers in the rightmost trio of columns are the pattern correlations between CMPA and the other three datasets separately. The thick black contour depicts terrain heights of 2000 m, and the thin black contours represent 1000 and 4750 m.
Remotesensing 15 01013 g002
Figure 3. Precipitation difference between GPM and CMPA (ac), between ERA5 and CMPA (df), and between GRIST and CMPA (gi) (left: amount (mm/h); middle: frequency (%); right: intensity (mm/h)). The superscript numbers are the area mean differences correspondingly. The thick black contour depicts terrain heights of 2000 m, and the thin black contours represent 1000 and 4750 m.
Remotesensing 15 01013 g003
Figure 4. Spatial distribution of the first harmonic’s variance of Fourier analysis (%; left: amount; middle: frequency; right: intensity). Fourier transformation is applied to the 24-h rainfall cycle of CMPA (ac), GPM (df), ERA5 (gi), and GRIST (jl). The superscript numbers are the fraction of single-peak grids. The two black rectangles indicate selected sub-regions with a strong diurnal features (YTRV: Yarlung Tsangpo River Valley; EPTP: Eastern Periphery of Tibetan Plateau). The pentagram indicates the location of Lhasa. The thick black contour depicts terrain heights of 2000 m, and the thin black contours represent 1000 and 4750 m.
Remotesensing 15 01013 g004
Figure 5. Spatial distribution of the diurnal peaks (LT, left: amount, middle: frequency, right: intensity) derived from CMPA (ac), IMERG (df), ERA5 (gi), and GRIST (jl). The pentagram indicates the location of Lhasa. The thick black contour depicts terrain heights of 2000 m, and the thin black contours represent 1000 and 4750 m.
Remotesensing 15 01013 g005
Figure 6. Spatial distribution of the diurnal phase differences (hour, left: amount; middle: frequency; right: intensity) between IMERG and CMPA (ac), between ERA5 and CMPA (df), and between GRIST and CMPA (gi).The pentagram indicates the location of Lhasa. The thick black contour depicts terrain heights of 2000 m, and the thin black contours represent 1000 and 4750 m.
Remotesensing 15 01013 g006
Figure 7. Elevation dependence of mean precipitation variables (first column: amount (mm/h); second column: frequency (%); third column: intensity (mm/h)) in selected sub-regions, YTRV (ac) and EPTP (eg). The black line and dots stand for the CMPA dataset, red for IMERG, violet for ERA5, and green for GRIST. The right-most column shows the probability density function (PDF) of elevation ((d): YTRV and (h): EPTP).
Remotesensing 15 01013 g007
Figure 8. Elevation dependence of the diurnal harmonic of precipitation variables ((a) amount (mm/h); (b) frequency (%); (c) intensity (mm/h)) in YTRV. Horizontal solid black lines separate different altitude blocks, and the horizontal dashed gray line in the center of each block marks the zero line. The altitude of each block increases from bottom to top, with the mean diurnal harmonic of YTRV displayed in the block at the top. The labels on the right Y-axis represent the values of the diurnal harmonic curve, with positive (negative) values above (below) the zero line (negative). The labels on the left Y-axis indicate the altitude intervals represented by each subgraph. The X-axis indicates the hour (local time) of the 24-h rainfall cycle. Black stands in for the CMPA dataset, red for IMERG, violet for ERA5, and green for GRIST.
Remotesensing 15 01013 g008
Figure 9. Elevation dependence of the diurnal harmonic of precipitation variables ((a) amount (mm/h); (b) frequency (%); (c) intensity (mm/h)) in EPTP. Horizontal solid black lines separate different altitude blocks, and the horizontal dashed gray line in the center of each block marks the zero line. The altitude of each block increases from bottom to top, with the mean diurnal harmonic of EPTP displayed in the block at the top. The labels on the right Y-axis represent the values of the diurnal harmonic curve, with positive (negative) values above (below) the zero line (negative). The labels on the left Y-axis indicate the altitude intervals represented by each subgraph. The X-axis indicates the hour (local time) of the 24-h rainfall cycle. Black stands in for the CMPA dataset, red for IMERG, violet for ERA5, and green for GRIST.
Remotesensing 15 01013 g009
Figure 10. Elevation dependence of frequency–intensity structure in YTRV. (a) precipitation frequency distribution for weak intensities (0.1–1 mm/h); (b) precipitation frequency distribution for all intensities (0.1–5 mm/h) with logarithmic coordinates. Horizontal solid black lines separate different altitude blocks. The altitude of each block increases from bottom to top, with the mean frequency–intensity structure of YTRV displayed in the block at the top. The labels on the right Y-axis represent the frequency (%). The labels on the left Y-axis indicate the altitude intervals represented by each subgraph. The X-axis indicated different rainfall intensities (mm/h). Black stands in for the CMPA dataset, red for IMERG, violet for ERA5, and green for GRIST.
Remotesensing 15 01013 g010
Figure 11. Elevation dependence of frequency–intensity structure in EPTP. (a) precipitation frequency distribution for weak intensities (0.1–1 mm/h); (b) precipitation frequency distribution for all intensities (0.1–5 mm/h) with logarithmic coordinates. Horizontal solid black lines separate different altitude blocks. The altitude of each block increases from bottom to top, with the mean frequency–intensity structure of EPTP displayed in the block at the top. The labels on the right Y-axis represent the frequency (%). The labels on the left Y-axis indicate the altitude intervals represented by each subgraph. The X-axis indicated different rainfall intensities (mm/h). Black stands in for the CMPA dataset, red for IMERG, violet for ERA5, and green for GRIST.
Remotesensing 15 01013 g011
Table 1. Model configuration of GRIST used in the study.
DomainVertical levels30
Horizontal resolution3.5–50 km
TimeSimulation period27 July 2014–1 September 2014
Time stepsDycore = 4 s, Tracer = 20 s
Forcing strategyInitial conditionsERA5
SSTERA5
Run start time00:00 UTC
Run duration36 days
Physical schemeRadiationRRTMG [38]
ConvectionTiedtke-Betchtold [39,40]
MicrophysicsWSM6 [41]
Land modelNoah-MP [42]
Boundary layerYSU [43]
“Dycore” denotes dry dynamical core, and “tracer” denotes the transport of moist species.
Table 2. Equations and the best values of three statistical indices.
Statistic IndexEquation 1Perfect Value
MB (Mean Bias) M B = i = 1 n P i O i i = 1 n O i × 100 % 0
RMSE (Root Mean Square Error) R M S E = 1 n i = 1 n P i O i 2 0
CORR (Spatial Correlation Coefficient) C O R R = i = 1 n O i O ¯ 2 P i P ¯ 2 i = 1 n O i O ¯ 2 × i = 1 n P i P ¯ 2 1
1 Notation: Oi, the precipitation variables of CMPA; O ¯ , the average values of CMPA; Pi, the estimated precipitation of IMERG, ERA5 and GRIST, respectively; P ¯ , the average values of IMERG, ERA5 and GRIST, respectively; n, the corresponding grids of CMPA and the other three datasets.
Table 3. Statistical error metrics of precipitation derived from IMERG, ERA5, and GRIST versus CMPA at the grids’ elevation levels higher than 2000 m for the study period.
VariablesMetricsCMPAIMERGERA5GRIST
Amount
(mm/h, except
CORR)
Mean0.090.120.190.18
MB/0.030.100.08
RMSE/0.080.170.17
CORR/0.850.770.75
Frequency
(%, except CORR)
Mean8.6913.5237.2424.43
MB/4.8328.5515.73
RMSE/9.0133.1021.32
CORR/0.850.840.83
Intensity
(mm/h, except
CORR)
Mean0.900.750.450.60
MB/−0.15−0.45−0.30
RMSE/0.470.640.56
CORR/0.890.880.87
MB is the mean difference, RMSE is the root mean square error, and CORR is the spatial pattern correlation coefficient.
Disclaimer/Publisher’s Note: The statements, opinions and data contained in all publications are solely those of the individual author(s) and contributor(s) and not of MDPI and/or the editor(s). MDPI and/or the editor(s) disclaim responsibility for any injury to people or property resulting from any ideas, methods, instructions or products referred to in the content.

