Article

Autonomous Satellite Wildfire Detection Using Hyperspectral Imagery and Neural Networks: A Case Study on Australian Wildfire

by
Kathiravan Thangavel
1,2,6,
Dario Spiller
2,1,
Roberto Sabatini
3,1,6,*,
Stefania Amici
4,
Sarathchandrakumar Thottuchirayil Sasidharan
2,
Haytham Fayek
5,6 and
Pier Marzocca
1,6
1
Sir Lawrence Wackett Defence and Aerospace Centre, RMIT University, Melbourne, VIC 3083, Australia
2
School of Aerospace Engineering, Sapienza University of Rome, 00138 Rome, Italy
3
Department of Aerospace Engineering, Khalifa University of Science and Technology, Abu Dhabi 127788, United Arab Emirates
4
National Institute of Geophysics and Volcanology (INGV), 00143 Rome, Italy
5
School of Computing Technologies, RMIT University, Melbourne, VIC 3000, Australia
6
SmartSat Cooperative Research Centre, North Terrace, Adelaide, SA 5000, Australia
*
Author to whom correspondence should be addressed.
Remote Sens. 2023, 15(3), 720; https://doi.org/10.3390/rs15030720
Submission received: 21 November 2022 / Revised: 20 January 2023 / Accepted: 23 January 2023 / Published: 26 January 2023

Abstract

:
One of the United Nations (UN) Sustainable Development Goals is climate action (SDG-13), and wildfire is among the catastrophic events that both impact climate change and are aggravated by it. In Australia and other countries, large-scale wildfires have dramatically grown in frequency and size in recent years. These fires threaten the world’s forests and urban woods, cause enormous environmental and property damage, and quite often result in fatalities. As a result of their increasing frequency, there is an ongoing debate over how to handle catastrophic wildfires and mitigate their social, economic, and environmental repercussions. Effective prevention, early warning, and response strategies must be well-planned and carefully coordinated to minimise harmful consequences to people and the environment. Rapid advancements in remote sensing technologies such as ground-based, aerial surveillance vehicle-based, and satellite-based systems have been used for efficient wildfire surveillance. This study focuses on the application of space-borne technology for very accurate fire detection under challenging conditions. Due to the significant advances in artificial intelligence (AI) techniques in recent years, numerous studies have previously been conducted to examine how AI might be applied in various situations. As a result of its special physical and operational requirements, spaceflight has emerged as one of the most challenging application fields. This work contains a feasibility study as well as a model and scenario prototype for a satellite AI system. With the intention of swiftly generating alerts and enabling immediate actions, the detection of wildfires has been studied with reference to the Australian events that occurred in December 2019. Convolutional neural networks (CNNs) were developed, trained, and used from the ground up to detect wildfires while also adjusting their complexity to meet onboard implementation requirements for trusted autonomous satellite operations (TASO). The capability of a 1-dimensional convolution neural network (1-DCNN) to classify wildfires is demonstrated in this research and the results are assessed against those reported in the literature. In order to enable autonomous onboard data processing, various hardware accelerators were considered and evaluated for onboard implementation. The trained model was then implemented in the following: Intel Movidius NCS-2 and Nvidia Jetson Nano and Nvidia Jetson TX2. Using the selected onboard hardware, the developed model was then put into practice and analysis was carried out. The results were positive and in favour of using the technology that has been proposed for onboard data processing to enable TASO on future missions. The findings indicate that data processing onboard can be very beneficial in disaster management and climate change mitigation by facilitating the generation of timely alerts for users and by enabling rapid and appropriate responses.

1. Introduction

In recent years, climate change and other environmental issues associated with human activities have received much attention in the scientific literature [1]. Such issues include extreme weather events [2], droughts [3], sandstorms [4], rising sea levels [5], tornados [6], volcanic eruption [7], and wildfires [8]. Wildfires decimate global and regional ecosystems and cause a lot of damage to structures, injuries, and deaths [9,10]. Due to this, it is becoming more and more important to find fires and keep track of their type, size, and effects over large areas [11]. To try to avoid or lessen these effects, early fire detection and fire risk mapping are used [12]. In the past, wildfires were mostly found by people monitoring wide areas from fire observation towers and using simple devices like the Osborne fire finder [13]. Nevertheless, such methods were not very accurate, and their effectiveness could be affected by human fatigue accumulated during long observation periods. On the other hand, alternative sensors designed to detect gasses, flame, smoke, and heat emissions usually need extended measurement times for molecules to approach the sensors. Additionally, since the range of these sensors is small, wide areas can only be covered using a large number of sensors [14]. Rapid advancements in object recognition, deep learning, and remote sensing have given us new ways to find and track wildfire. New materials and microelectronics have also made it easier for sensors to find active wildfires [15,16].
There are three primary classifications of the extensively used technologies that can identify or observe active fire or smoke conditions in real or near-real-time, namely, terrestrial, aerial, and satellite systems. These technologies are typically incorporated with visible, infrared, multispectral, or hyperspectral sensors; once the data have been collected, they can be processed by applicable artificial intelligence (AI) algorithms, usually a machine learning (ML) methodology. These techniques rely on either extracting hand-crafted features or on robust AI methods in order to detect wildfires in their earliest stages and to simulate how smoke and fires behave [15,17,18]. The different types of fire detection methods are shown in Figure 1.
This research work focuses on satellite-based fire detection by including appropriate AI approaches for onboard computation and analysis. Before introducing our proposed solution, a detailed discussion of the satellite-based wildfire detection approach is provided. There have been numerous research efforts to identify wildfires from satellite imagery in recent years, mostly as a result of the vast number of satellites that have been launched and the drop in the associated costs. Specifically, a constellation of satellites (e.g., Planet Lab) was developed for Earth observation (EO) [19]. Satellites can generally be grouped into different categories based on their orbit, each of which has its own set of advantages and disadvantages. Table 1 shows the most significant categories.
Currently, remote sensing satellites take photos of the Earth, and the images are downlinked to the ground as soon as the satellite makes contact with the ground station network. From here, images can be loaded into machines that extract various forms of actionable knowledge such as wildfire. Downloading imagery is an O n 2 problem, which usually provides significant latency when considering critical operations for extreme events management. If time is of the essence for detecting ignitions and thus speeding up the suppression response, it would be much quicker to have the fire mapping analytics right onboard the satellite and only download the vector data (either point or polygon) of the fire with the data already flagged to be forwarded to the appropriate wildland fire dispatcher (based on location). Having the coordinates of the event would allow for satellite managers, or even the satellite itself, to prioritize the transmission of the imagery associated with the AI-generated wildland fire event. The mission architecture would be even more effective when considering a constellation of satellites properly designed for the management of extreme events. Having artificial intelligence onboard the satellites, we would be able to process the data in real-time, and when a wildfire is spotted from one satellite, it will communicate this information to the other satellites in the constellation, thereby enabling trusted autonomous satellite operation (TASO). The most important part of this is to show that the data can be processed and shared with the help of the AI that is onboard, and that only the information that can be used is downlinked rather than all of the data. Preliminary analyses and the results of a mission concept based on a distributed satellite system for wildfire management are reported in [21].
The majority of low Earth polar SSO orbits of EO satellites have precise altitude and inclination estimations to guarantee that the spacecraft observes the very same scenario every time with same angle of light from the Sun, and that on each pass, the shadows appear the same [22]. The spatial resolution of Sun-synchronous satellite data is high, but the temporal resolution is low (LandSat-7/8 [23] has an eight-day repeat cycle, whereas Sentinel 2A/2B [24] has a two-to-three-day repeat cycle at mid-latitudes), while GEO satellites have lower spatial resolution contrasts with their high temporal resolution. As a result, they are ineffective for detecting active wildfires in real-time; rather, they are better suited for much less time-sensitive tasks such as estimating the burnt area [25]. EO satellite systems have been able to find wildfires because they can see a large area. Most satellites that take pictures of the Earth use multispectral imaging sensors and are either in a geostationary orbit or a Sun-synchronous orbit near the polar regions.
Improvements in nanomaterials and microelectronics have made it possible to use CubeSats, which are small spacecraft that orbit close to the Earth. PhiSat-1 (Φ-Sat-1), launched on 3 September 2020 [26,27,28], is a six-unit (6U) European satellite and is the first to show how transmitting down EO data can be made more efficient using onboard intelligence using AI. It is part of the Federated Satellite System (FSSCat), which is made up of two CubeSats [29,30,31,32] carrying AI technologies. The two CubeSats collect data utilising hyperspectral optical equipment and state-of-the-art dual microwaves. They also test intersatellite communications. One of the CubeSats’ hyperspectral cameras takes many pictures of Earth, some of which are cloudy. The Φ-Sat AI chip filters out erroneous cloudy photos before transmitting them to Earth, sending only the usable data. CubeSats are more cost-effective, are smaller than regular satellites, and require less time to launch than traditional satellites. The detailed classification and their parameters are listed in Table 2. Currently, most of the data processes are performed on the ground, but there is significant interest in bringing at least some of the computing efforts onboard satellites. The employment of AI algorithms onboard satellites for analysis and segmentation, classification, cloud masking, and potential risk detection shows the potential of satellite remote sensing.
The European Space Agency (ESA) has been a leader in taking the first steps in this direction with the PhiSat-1 satellite. CNNs for detecting volcanic eruptions using satellite optical/multispectral imaging were proposed in [26], with the main goal of presenting a feasible CNN architecture for onboard computing. P. Xu et al. [33] presented an onboard real-time ship detection based on deep learning and utilising SAR data. Predicting, detecting, and monitoring the occurrence of wildfires obviously benefits officials, civilians, and the ecosystem, with advantages in preparedness, reaction times, and damage control. OroraTech which was created in 2018, already has a range of international customers for its own wildfire service, notably SOPFEU Quebec, Forestry Corporation NSW in Australia, and Arauco in Chile. To offer intelligence to contribute to environmental protection and other properties, the system uses sensor data from a range of existing satellites. OroraTech has launched a thermal infrared (TIR) imager on a Spire 6U CubeSat featuring TIR and optical imaging equipment and Edge AI processing in a first step toward vertical integration.
The goal of our study was to see whether AI approaches and onboard computing resources can be used to monitor hazardous events such as wildfire detections by utilising optical/multispectral/hyperspectral satellite imagery. This kind of analyses could be useful to inform Design, Development, Test and Evaluation (DDT&E) activities of future satellite missions such as the ESA Phisat 2 program. In this study, hyperspectral images taken from the PRISMA (PRecursore IperSpettrale della Missione Applicativa) satellite and the following contributions were made:
  • A one-dimensional (1D) CNN for detecting wildfires using PRISMA hyperspectral imagery was considered, and promising results are shown for the edge implementation on three different hardware accelerators (i.e., computer hardware designed to perform specific functions more efficiently when compared to software running on a general-purpose central processing unit).
  • We demonstrate that AI-on-the-edge paradigms are feasible for future mission concepts using appropriate CNN architectures and mature astrionics technologies to perform time- and power-efficient inferences.
The proposed CNN is described in terms of the constraints imposed by the onboard implementation, meaning that the initial network has been streamlined and adjusted to comply with the intended hardware designs. It is worth noting that the detection of wildfires should be considered as the example test case, and that the proposed methodology (or similar ones) can be successfully applied to other scenarios or tasks, as already discussed and demonstrated in other works [26].
The rest of this article is organised as follows: after the Introduction, Section 2 discusses the methods and analysis, beginning with an overview of the wildfires, followed by information that is more in-depth regarding the description of the study area, and subsequently, information regarding the PRISMA data and the definition of the dataset. The onboard implementation and a description of hardware accelerators are covered in Section 3. The results are covered in Section 4, and the findings and their applicability are covered in depth in Section 5, which is followed by our conclusions in Section 6.

2. Current Detection Methods
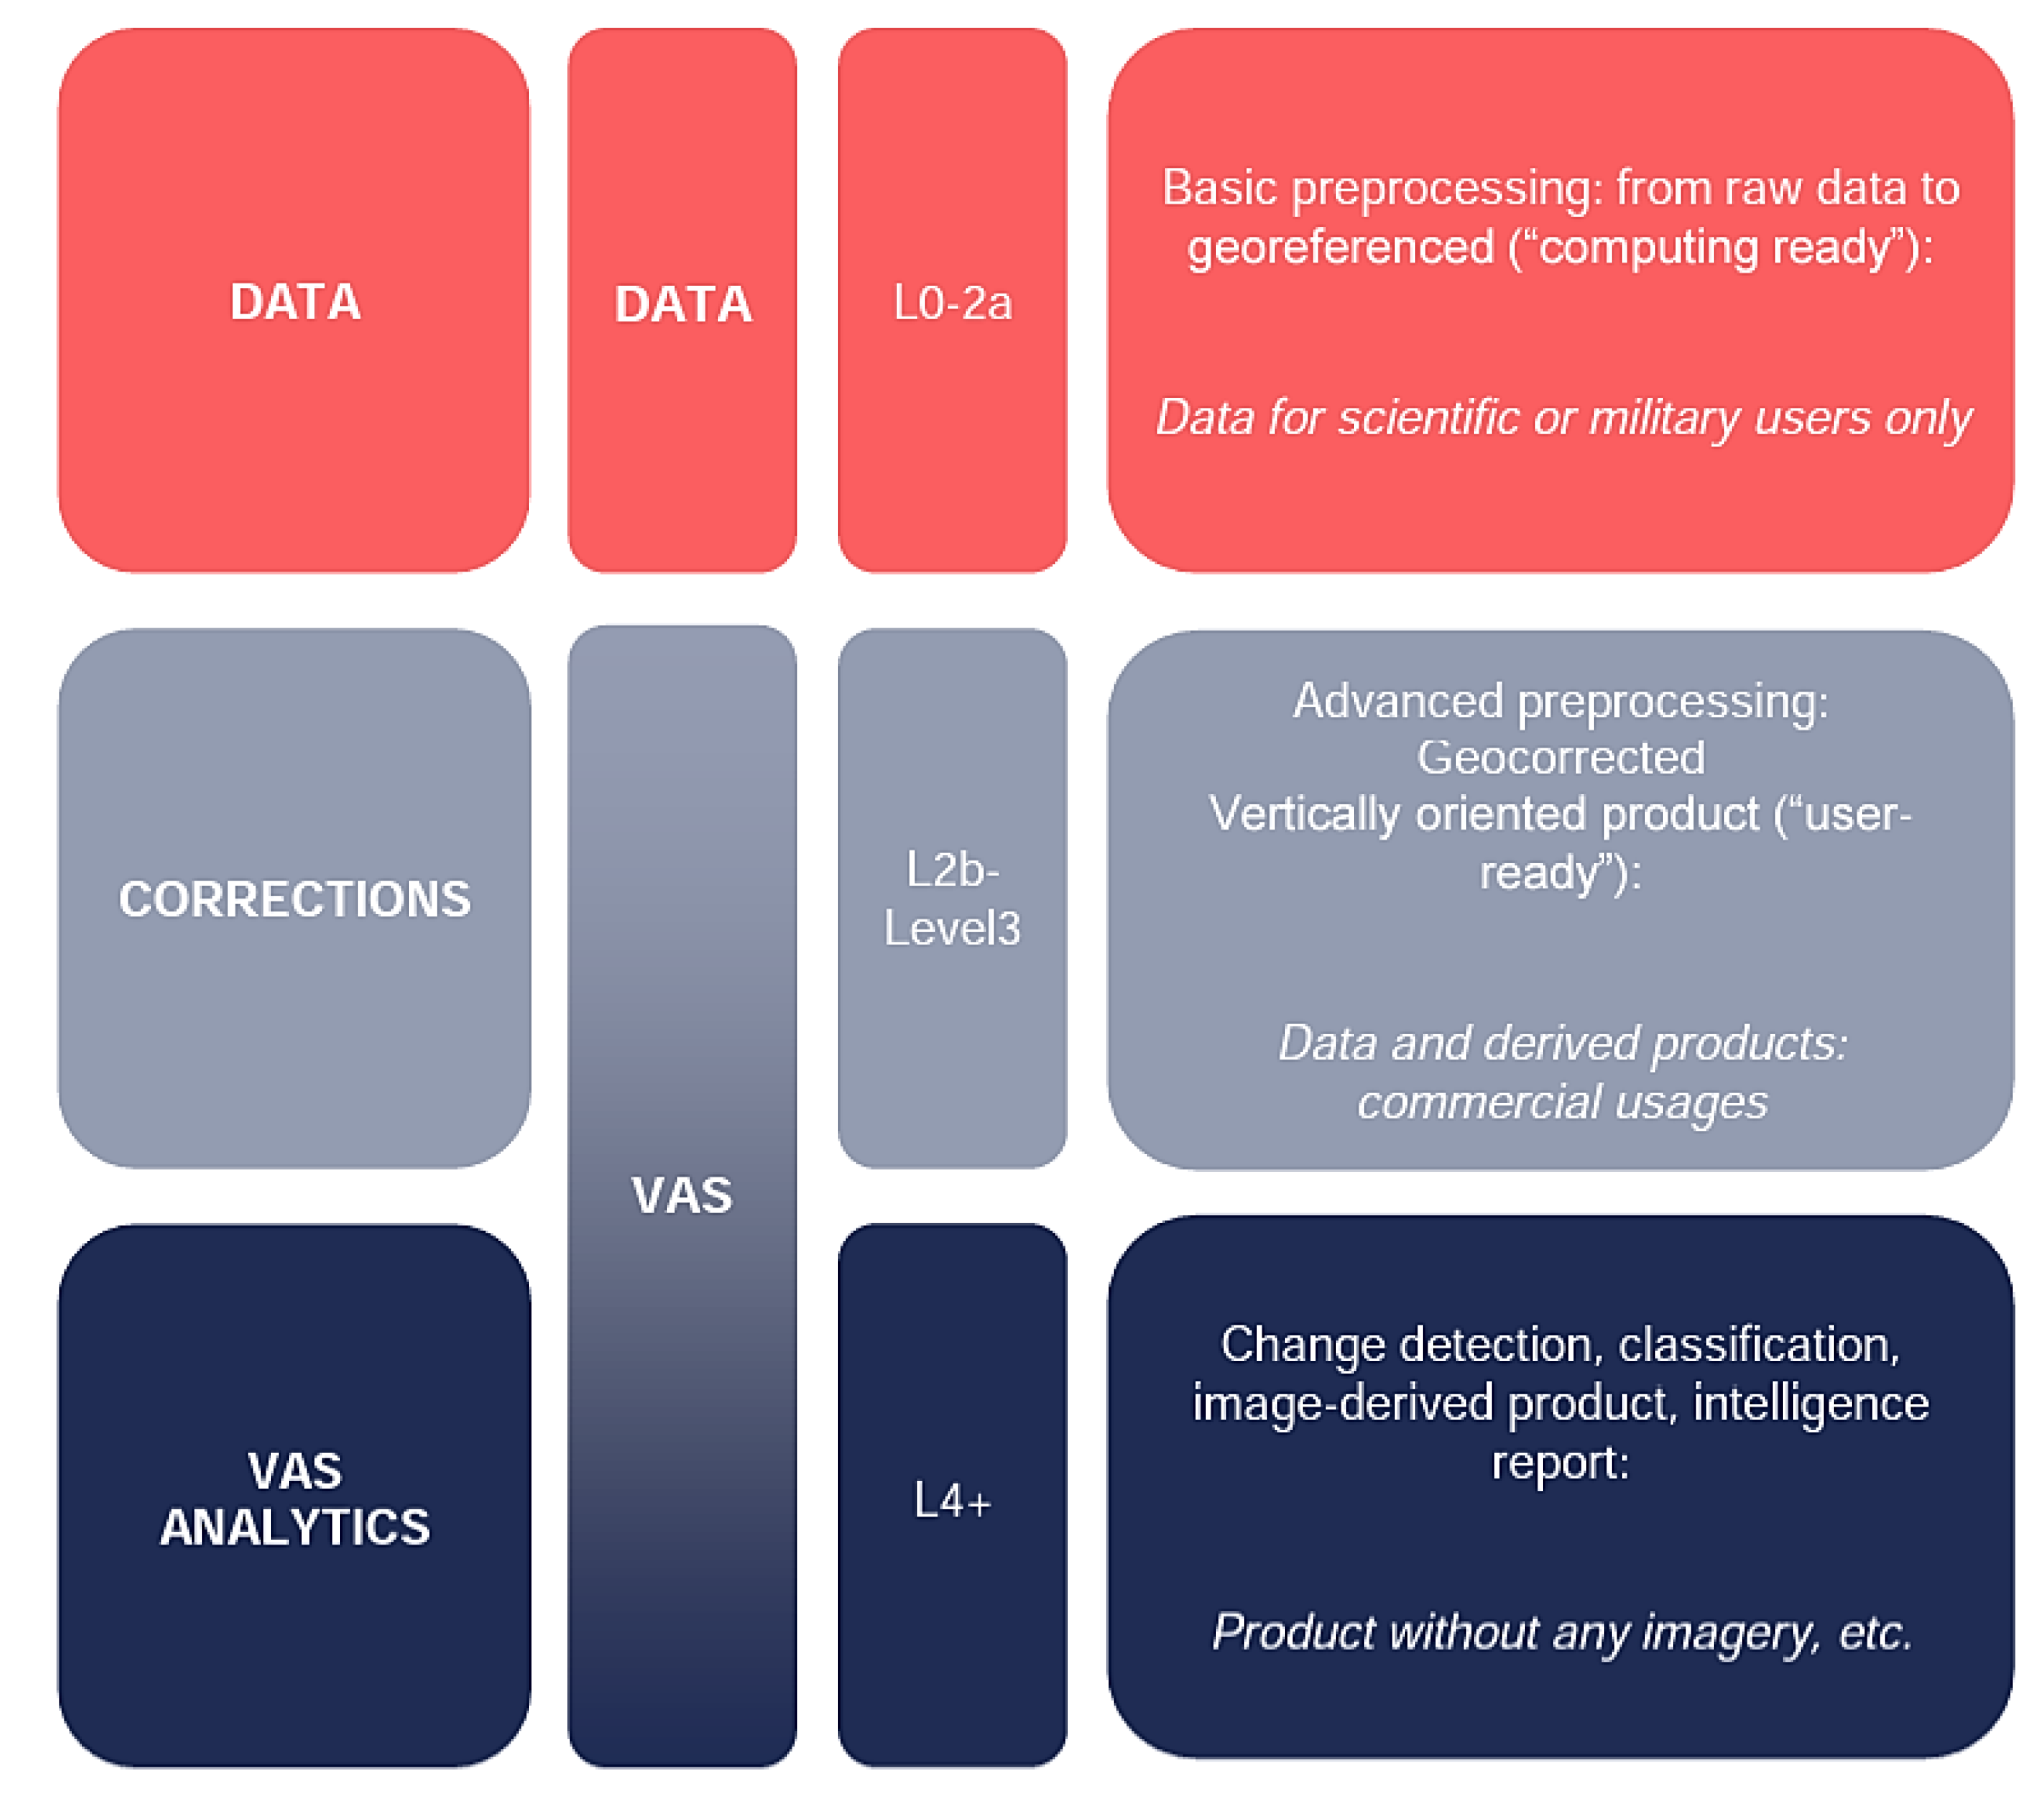
A wildfire is a dynamic phenomenon that changes its behaviour over time. The spread of fire is aided by the presence of forest fuel and is carried out by a series of intricate heat transmission and thermochemical processes that control fire behaviour [34]. There are several mathematical models created to characterise wildfire behaviour; each model was built based on the diverse wildfire experiences in various nations. According to the input and environmental parameters, each model differs from the others (fuel indexing [35,36]). Some researchers have been able to incorporate some of these models into simulation programs, or even develop their own ways for mapping the terrain and fire behaviour on monitoring screens for the study and prediction of fire behaviour [37]. The form of a wildfire burning in a steady environment is an ellipse [38]. The environment can change over time, and different portions of a fire may burn in different environments such as humidity levels, wind speed, wind direction, slope, and so on. The heterogeneity of the environment could result in a very complicated fire form [35,39].
F. Tedim et al. [38] made an initial attempt to develop a gravity scale for wildfires that was comparable to the scales used for hurricanes (Saffir–Simpson scale) and tornadoes (Fujita scale). The first four categories are labelled as “normal fires,” or incidents that can generally be put out within the bounds of technology and physical limits. Based on the assessments of recent extreme wildfire incidents and a consolidation of the literature, the three remaining categories are grouped as extreme wildfire events (EWEs; see Table 3) [38]. Table 4 shows a list with the most recent and significant wildfire incidents in Australia from 2007 until today. Some of the fires may have been caused by natural disasters or may have been caused directly or indirectly by human recklessness and environmental misuse (particularly the rise in temperature linked to global warming). One of the worst wildfires (Black Saturday wildfires) in Australian history ravaged Victoria. Many people were killed or injured in the wildfire, which ravaged many towns and cities, destroying homes, businesses, schools, and kindergartens [40,41]. From Table 4, it is evident that wildfire events are happening regularly. Since wildfires occur on a regular basis, there is a clear need for wildfire detection. To address this, the recent Australian wildfires were investigated, and an analysis was carried out. The designated area of interest (AOI) is located around 250 km north of Sydney in Ben Halls Gap National Park (BHGNP), which comprises 2500 hectares and is 60 kilometres south of Tamworth and 10 kilometres from Nundle. Because the park is located at a high elevation, it receives a lot of rain and has cool temperatures. However, in late 2019, a combination of high temperatures and wind speeds as well as low relative humidity created the conditions for high-intensity wildfire behaviour to develop. There are different levels of data available, and the differences are reported in Figure 2. As can be observed in the PRISMA image (Figure 3) acquired on 27 December 2019, active wildfires can be spotted across this AOI.

3. PRISMA Mission

A scientific and demonstration mission called PRISMA was launched aboard the VEGA rocket on 22 March 2019. The research based on the HyperSpectral Earth Observer (HypSEO) project [47], which was a product of a partnership between ASI and the Canadian Space Agency, served as the foundation for the early conceptual studies. Due to its ability to capture data globally with a very high spectral resolution and in a wide variety of spectral wavelengths, PRISMA plays an important role in the current and future international setting of EO for both the scientific community and for end users. PRISMA offers the ability to collect, downlink, and preserve the imagery of all panchromatic/hyperspectral channels totalling 200,000 km2 daily practically on the entire global region, obtaining 30 km by 30 km square Earth tiles. There are two operational modes for the PRISMA mission: a primary mode as well as a secondary mode. The main method of operation is the gathering of panchromatic and hyperspectral data from specified individual targets as demanded by the end users. The mission will have a setup of continual “background” work in the auxiliary mode of operation that will collect imagery to fully utilise the system’s resources.
One modest class spacecraft makes up the PRISMA space segment. A hyperspectral/panchromatic camera featuring VNIR and SWIR detectors is part of the PRISMA payload. It consists of a medium resolution panchromatic camera (PAN, from 400 nm to 700 nm) with a 5 m resolution and an imaging spectrometer with a 30 m spatial resolution that can acquire in a continuum of spectral bands from 400 nm to 2505 nm (i.e., from 400 nm to 700 nm in VNIR and from 920 nm to 2505 nm in SWIR). The PRISMA hyperspectral sensor makes use of the prism to measure the incoming radiation’s dispersion on 2-D matrix detectors in order to collect many spectral bands from the same ground strip. The 2-D detectors immediately provide the “instantaneous” spectral and spatial dimensions (across track) of the spectral cube, while the satellite motion (pushbroom scanning concept) provides the “temporal” dimension (along track). The following references [48,49,50] contain some works on wildfires using PRISMA.
PRISMA data are made freely accessible for research purposes by the Italian Space Agency (ASI) [51]. In Hierarchical Data Format version 5 (HDF5), the 30 m and 5 m resolution hyperspectral and panchromatic data are given with four choices:
  • Level 1, radiometrically corrected and calibrated top of atmosphere (TOA) data.
  • Level 2B, Geolocated at-ground spectral radiance product.
  • Level 2C, Geolocated at-surface reflectance product.
  • Level 2D, Geocoded version of the Level 2C product.
The analysis in this paper was conducted with Level 2D data. Preliminary, direct information can be retrieved by looking at single bands. For instance, smoke can be recognized by looking at the very near infrared (VNIR) bands of the L2D data, while active wildfires can be retrieved by looking at saturated pixels in the short-wave infrared (SWIR) bands. Indeed, in the interval of 2000–2400 nm, the signal easily saturates when looking at active wildfires, as the signal captured from Earth is greater than the signal coming from the Sun (since the wildfires behave as active power emitters). However, analysing the entire spectral signature by means of the convolutional neural network allows us to avoid errors and increase the reliability of the classification.

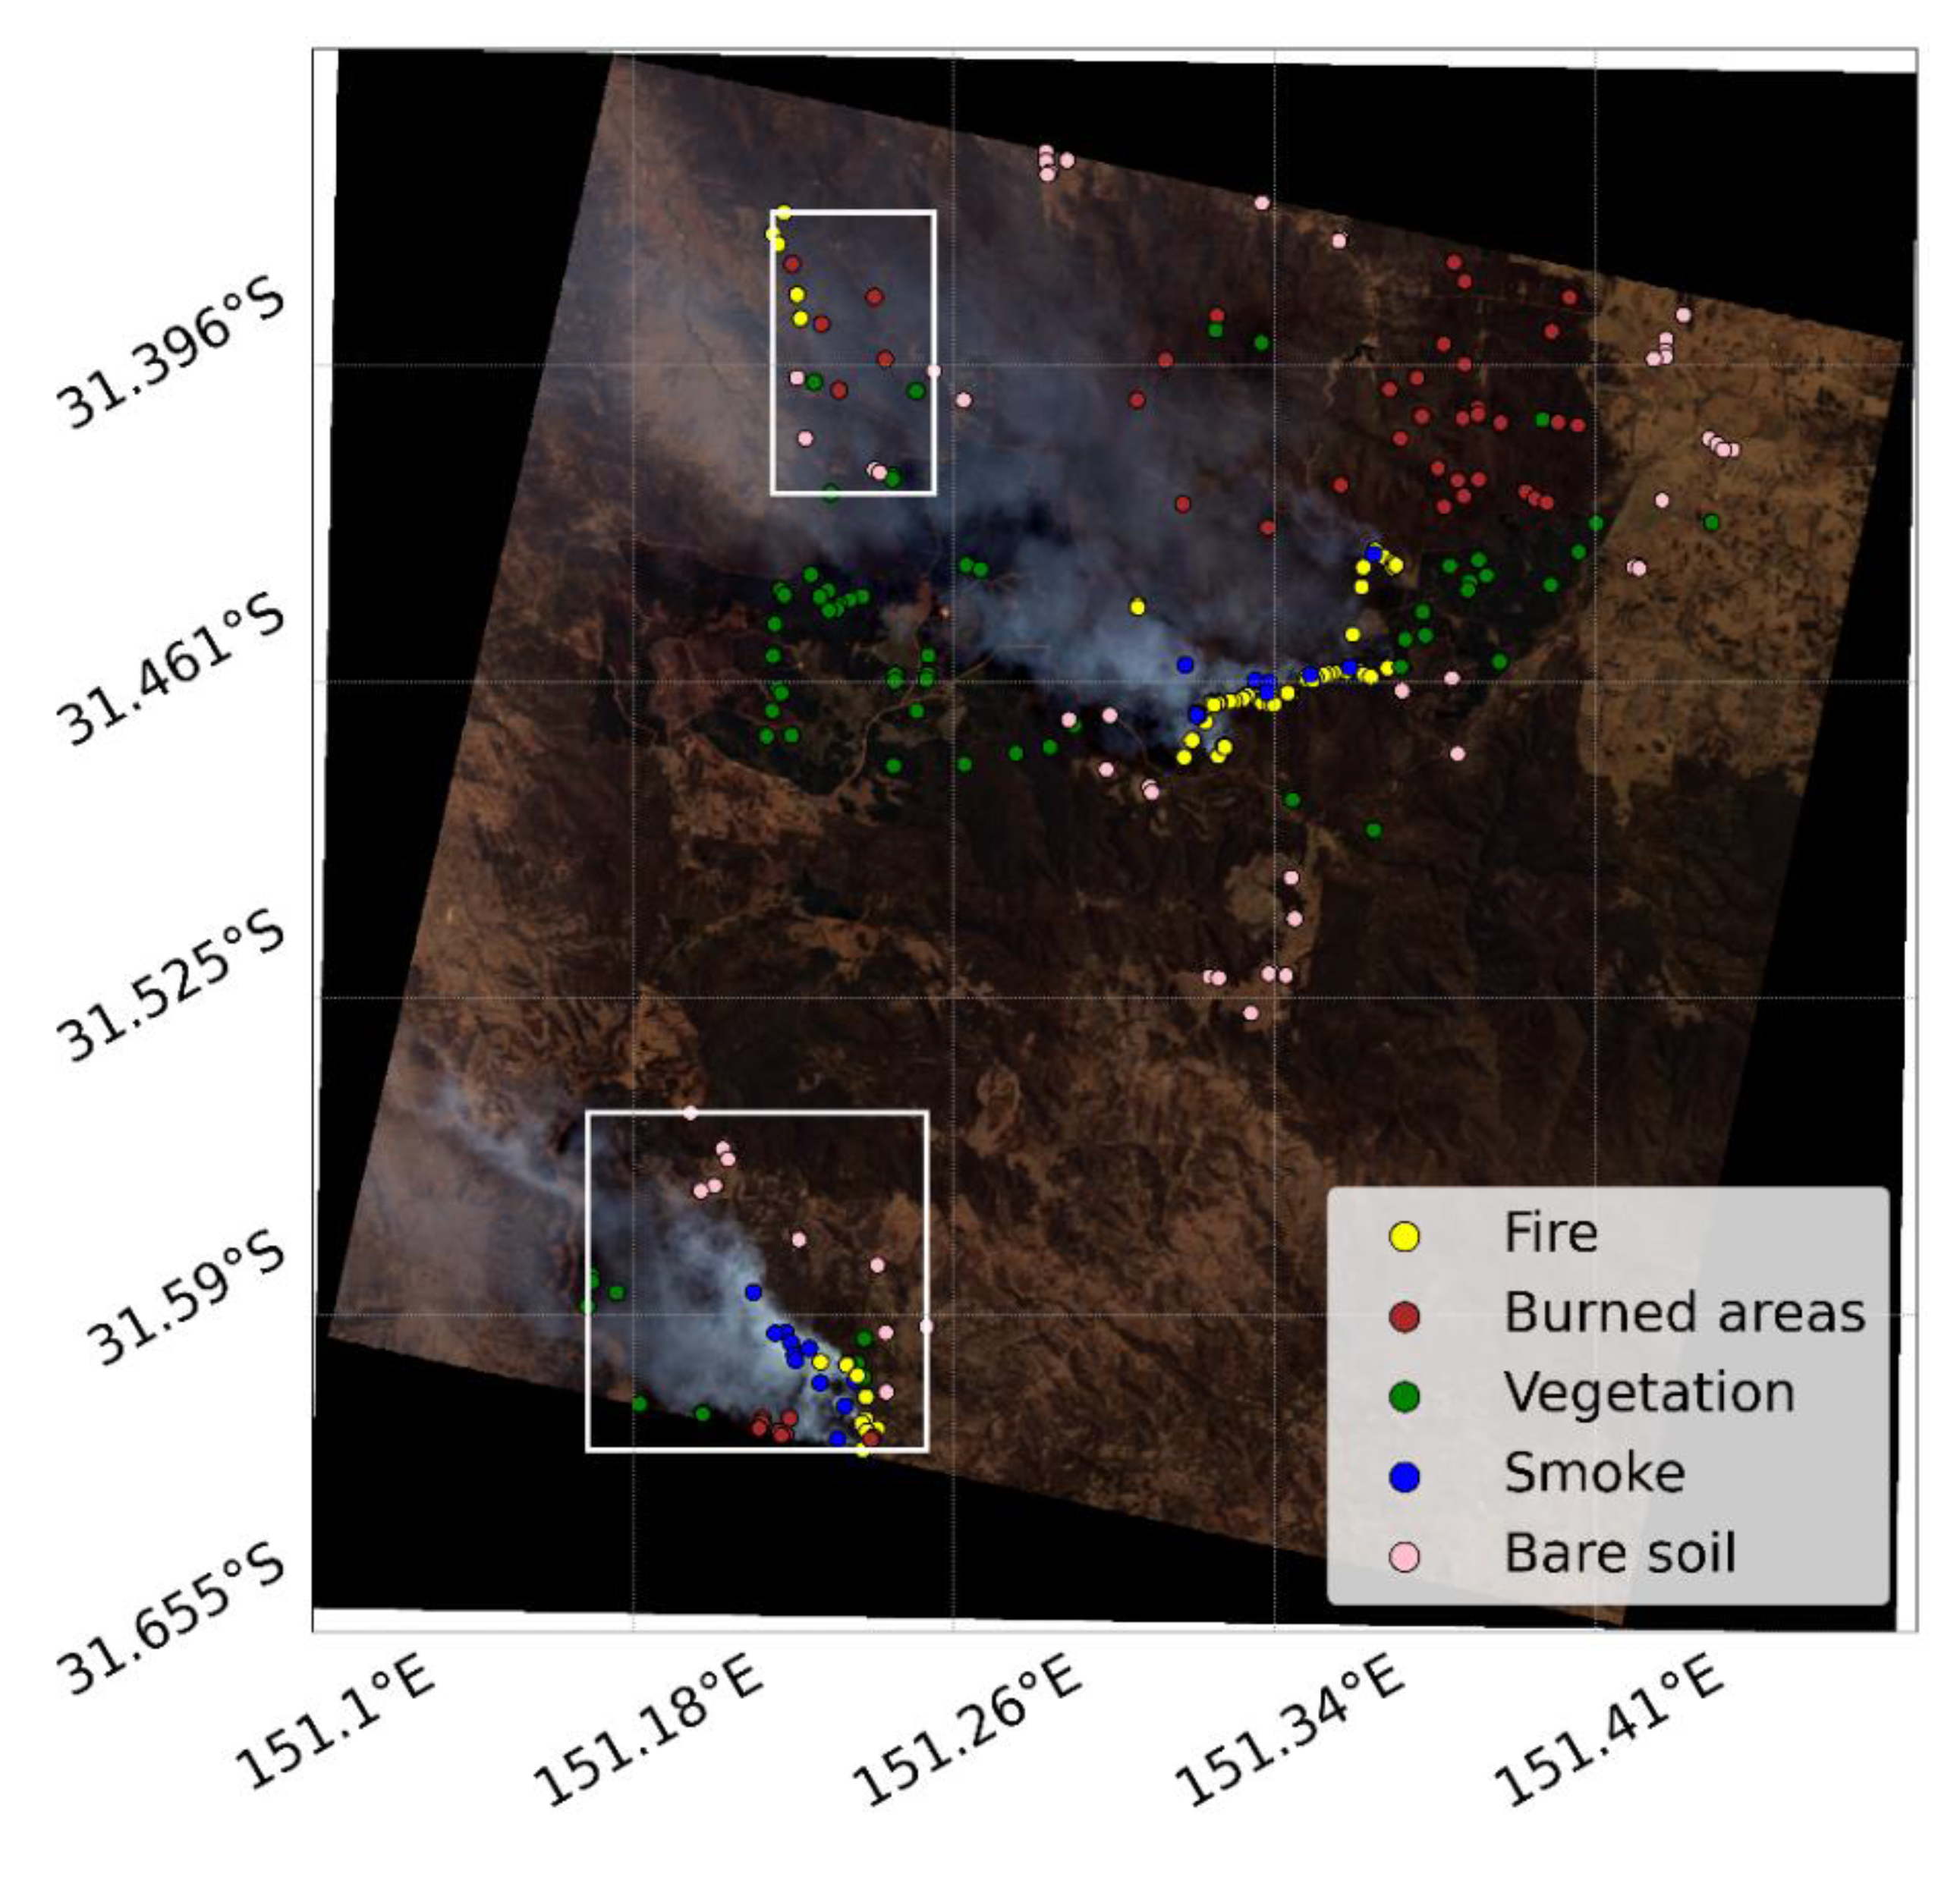
3.1. Dataset Definition

The AI approach was used to implement automatic segmentation from the obtained image. From Figure 3, three active wildfires can be observed. The southern and the north-east wildfires are the bigger ones, whereas the north-west wildfire is quite small. For the training and validation, the reference pixels must first be labelled. The reference pixels used in this investigation were manually labelled and are shown in Figure 3. The number of labelled pixels selected from the PRISMA image (after investigation of the spectra and looking at the false colour composites) is reported in Table 5. The north-east wildfire was used as the training and validation dataset, while the south and north-west datasets were used as the test datasets. The training set accounted for 70% of the labelled data of the north-east wildfire, while the remaining 30% was chosen for validation. In this research, the training was carried out by utilising the computational capabilities of the ground (i.e., a personal computer equipped with Nvidia RTX2060).

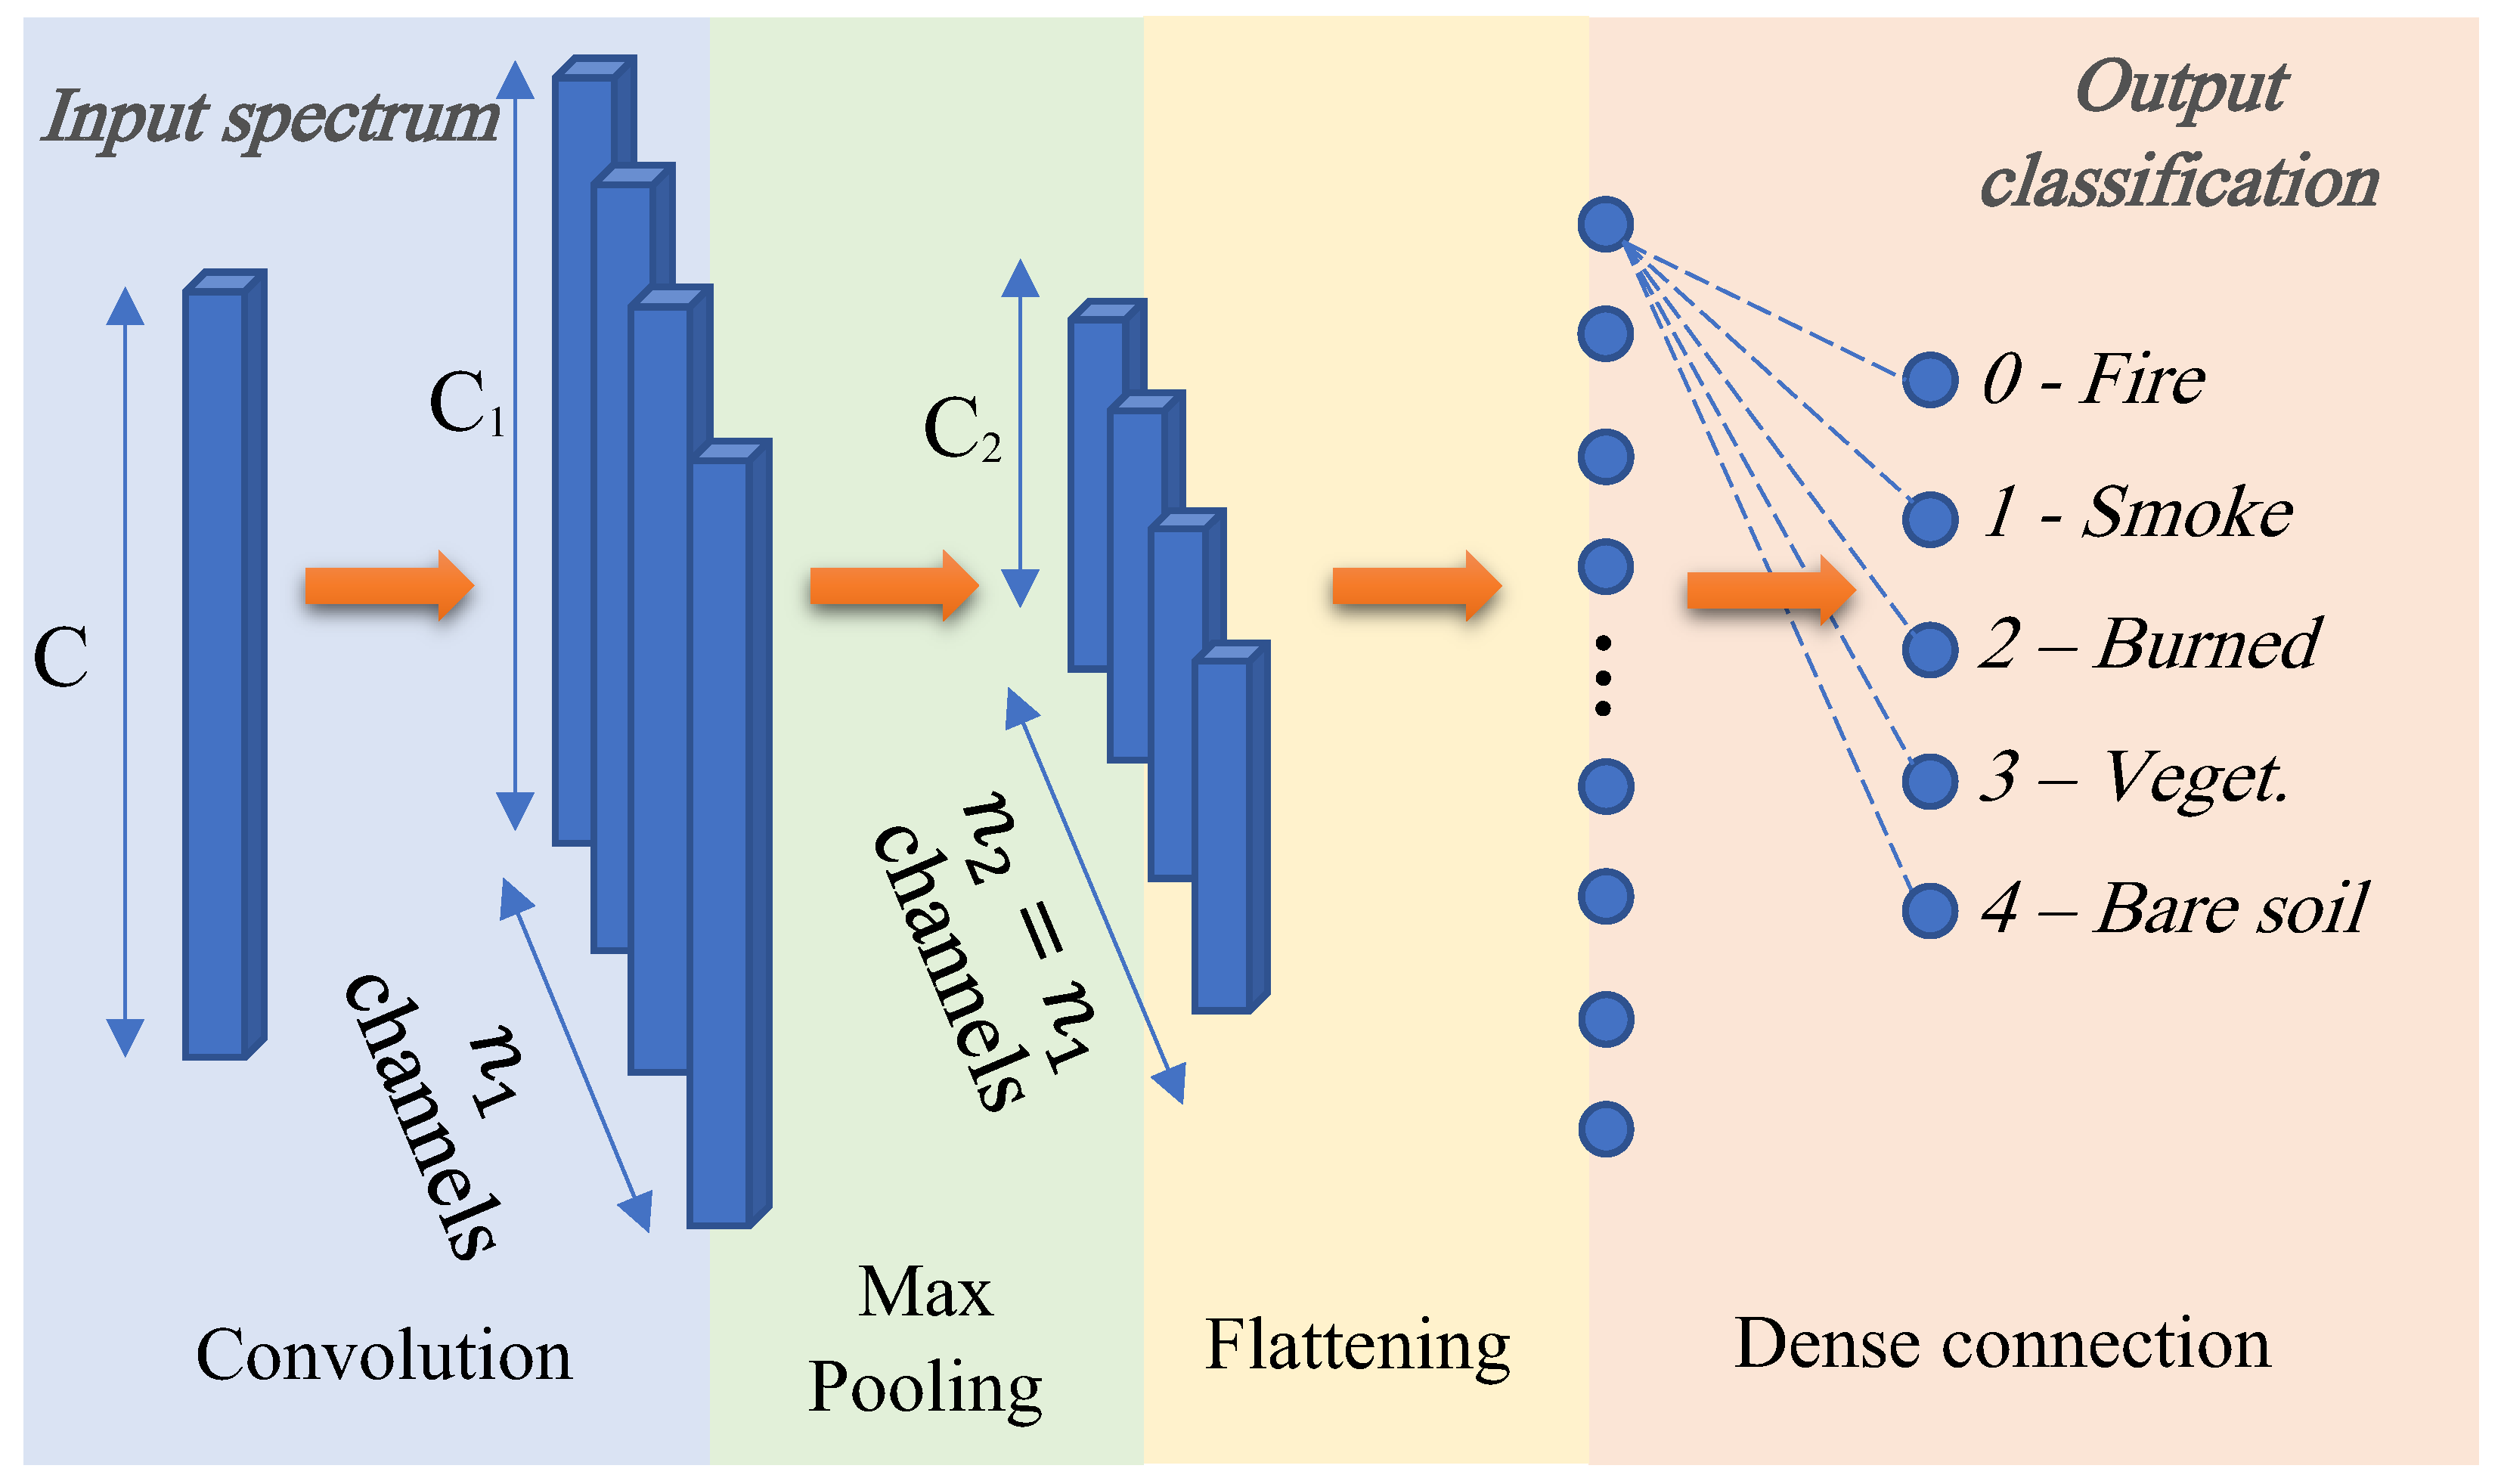
3.2. Automatic Classification with a 1D CNN Approach

The categorisation model utilised in this study was inspired by the model by Hu et al. [53], which is depicted in Figure 4. The input pixel spectrum of the PRISMA data includes the SWIR and VNIR channels. Thus, it is an array with C = 234 elements (after removal of some useless original data in the input hyper-cube). A 1-D convolutional layer with a kernel of 3, n 1 = 112 filter, the same padding, ReLU activation function, and l 2 kernel regulariser is the first hidden layer. After the convolutional layer, there is a max pooling layer with a pool size of 2 and a stride of 2 (notice that n 2 = n 1 in Figure 4). The result of this max pooling is then sent through a flattening layer before being connected to a 128-unit fully connected layer with ReLU activation. The last layer is a dense unit with the SoftMax activation function for multiclass classification. It is worth noting that the values of C 1 and C 2 in the diagram are easily evaluable and rely on the network’s architecture. The Adam optimiser and the categorical cross-entropy loss function were used to train the model. Python and Keras were used to build the entire network [17,18,54].

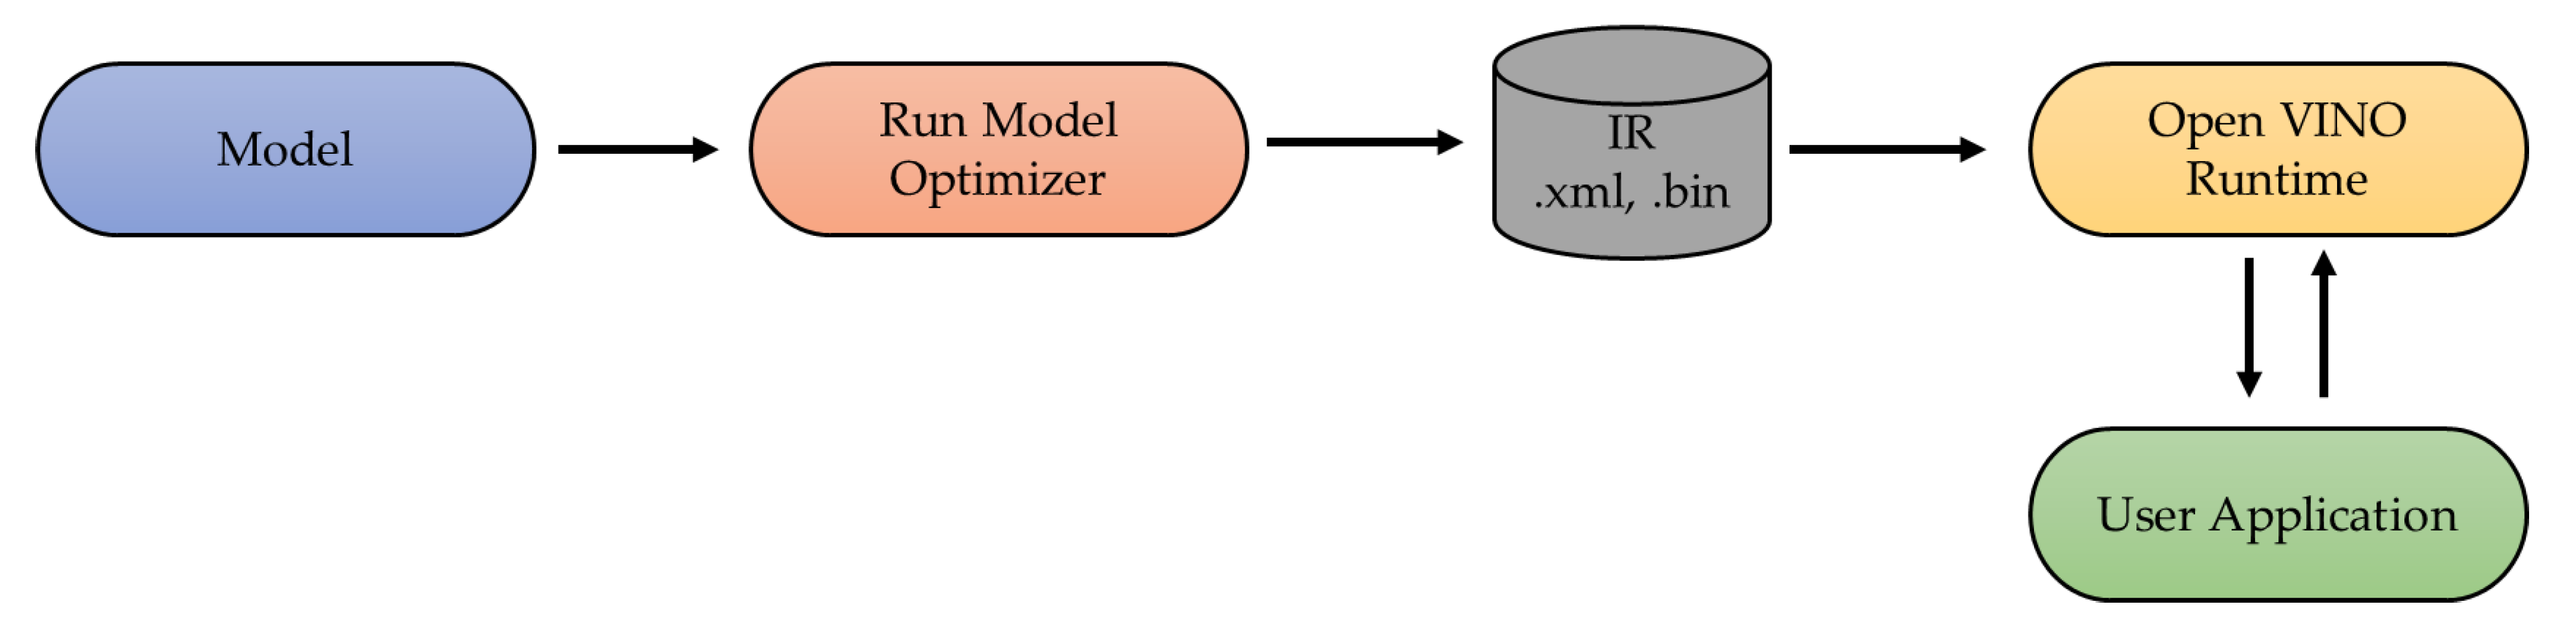
4. Astrionics Implementation

The ultimate aim is to build a model that can be uploaded to an onboard astrionics system, so the network complexity, parameter count, and inference execution time must all be optimised. Due to the chip’s restricted elaboration power, the utilisation of a small chip limits the ability to execute the specific classification model, necessitating the development of an accurate model. A prototype for executing the analysis was created in order to evaluate the proposed methodology. To begin, the model was modified to work with the chosen hardware and to detect wildfires onboard.
A significant component of the architecture of many current AI solutions is cloud computing or storage. Several sectors are finding it challenging to apply the technology for real-world use cases due to worries regarding confidentiality, latency, dependability, and bandwidth. Despite its resource restrictions, edge computing can somewhat help to ease these difficulties. The claim that edge and cloud computing are incompatible is untrue; edge computing actually enhances cloud computing. Inflated expectations for edge AI and edge analytics have peaked, according to the Gartner hype cycles for 2019 and 2018 [55]. Although the sector is still in its infancy, software frameworks and hardware platforms will advance with time to deliver value at a reasonable price. Three important AI industry leaders—Intel, Google, and Nvidia—are supporting edge AI by offering hardware platforms and accelerators with compact form dimensions. Although each of the three has benefits and drawbacks, it all depends on the application, budget, and amount of experience that is available. Table 6 presents the comparison of the hardware accelerators [55].
The Intel Movidius Neural Compute Stick (NCS) is a high-performance, affordable USB stick that may be used to implement deep learning inference applications, according to the comparison above. Great AI solutions are provided by the Google Edge TPU. The NVIDIA Jetson Nano, in conclusion, crams a lot of AI power into a little package. We used the Intel Movidius stick and two Nvidia variants, the Jetson and TX2, for our research [56].

4.1. Description of the hardware accelerators

In this section, we provide a description of the three selected astrionics hardware components, with specific reference to the accelerators (i.e., the Movidius Stick in section b, the Jetson Nano in section c, and Jetson TX2 in section d).

4.2. Movidius Stick

The Intel Movidius NCS is a compact fanless deep learning USB drive that is intended to be used for learning AI programming techniques. The Movidius Visual Processing Unit, which is minimal in power but high in performance, drives the stick. It is equipped with an Intel Movidius Myriad 2 Vision Processing Unit. These are the main specifications [26]:
  • Supporting CNN profiling, prototyping and tuning workflow;
  • Real-time on-device inference (Cloud connectivity not required);
  • Features the Movidius Vision Processing Unit with energy-efficient CNN processing;
  • All data and power provided over a single USB type-A port;
  • Run multiple devices on the same platform to scale performance.
The workflow for executing the software modules on the hardware system is depicted in Figure 5. Prior to running the experiments on the Movidius Stick, the CNN must be translated from its original format (for example, the Keras model) to an OpenVino format, which may be accomplished through the use of the OpenVino library. Because of the Movidius Stick, deep learning coprocessors that are inserted into the USB socket can be inferred more quickly than before. Before transferring the CNN onto the Movidius, it is necessary to optimise the network, which may be accomplished by utilising the OpenVino Intel’s hardware-optimised computer vision library. Intel Distribution, the OpenVino toolkit, is extremely easy to use and is included with the Intel processors. Indeed, once the target CPU has been determined, the OpenCV optimised for OpenVino can handle the rest of the setup. The toolkit supports heterogeneous execution across computer vision accelerators (such as GPU, CPU, and FPGA) using a standard API, in addition to enabling deep learning inference at the edge. It also decreases the time to market by utilising a library of functions and preoptimised kernels, and it includes optimised calls for OpenCV.
Following the model’s implementation on Movidius, it was tested against the PRISMA hyperspectral images. Using the same settings used for the training and validation datasets, the image was processed. Figure 6 depicts the high-level block diagram for the installation and optimisation of OpenVino. The internal data structure or program that a compiler or virtual machine uses to represent source code is known as an intermediate representation (IR).
An IR is made to facilitate additional processing such as optimisation and translation. The model is fed to the Model Optimiser before being delivered to IR, from which we can obtain the .xml and .bin files required to execute OpenVino. The weight and biases are saved in binary form in a .bin file, while the standardised architectural arrangement (and other metadata) is stored in a .xml file, as shown in Figure 7. Model optimisation was performed on a Windows machine and the IR model was implemented on a Windows system with NCS2, as depicted in Figure 8.

4.3. Jetson Nano

The recently released JetPack offers a complete desktop Linux environment for Jetson Nano that is built on Ubuntu. Major open-source frameworks such as TensorFlow, MXNet, Keras, Caffe, PyTorch, and the SDK enable the native installation of frameworks for robotics and computer vision development like OpenCV. Thanks to complete interoperability with all of these frameworks and NVIDIA’s high Calibre platform, it has become simpler than ever before to deploy AI-based inference applications to Jetson. The Jetson Nano makes real-time computer vision and inference possible for a wide range of intricate deep neural network (DNN) models. Advanced AI systems, IoT devices with intelligent edge analytics, and multi-sensor autonomous robots are made possible by these capabilities. Using the ML frameworks, it is even possible to carry out transfer learning while retraining networks locally on the Jetson Nano [55,57,58,59,60]. This procedure is shown in Figure 9, and the implementation procedure is the same as the Intel Movidius Stick.

4.4. Jetson TX2

The Nvidia Jetson series of embedded platforms provides edge devices with server-class AI computation capabilities. When it comes to deep learning inference, Jetson TX2 is twice as energy efficient as its precursor, Jetson TX1, and it performs better than the Xenon server CPU built by Intel. This increase in productivity reframes the potential for moving advanced AI from the cloud to the edge. With support from long short-term memory networks (LSTMs), recurrent neural networks (RNNs), TensorRT libraries, and the NVIDIACUDA Deep Neural Network library (cuDNN), Jetson TX2 accelerates cutting-edge deep neural network (DNN) designs. The conversion of the Keras model to the TensorFlow model is represented in the deployment process in Figure 10, which illustrates this by simply using TensorFlow and TensorFlow TFT integration to show the important distinction. To run NN inferences on their hardware, Nvidia developed the TensorRT NN framework, and the implementation procedure is the same as the Intel Movidius Stick. TensorRT is highly performance-optimised on NVIDIA GPUs. Currently, it is probably the quickest method for running models. NVIDIA’s TensorRT inference acceleration library enables the utilisation of NVIDIA GPU resources to the fullest extent possible at the cutting edge [60,61,62].

5. Results

The results of the classification are shown by means of the segmentation map reported in Figure 11. The classified areas look pretty well-defined, with a very low level of noise.
Table 7 summarises the outcomes of the training section conducted over the southern wildfire. Using the validation dataset, the final overall accuracy of the model was 97.83 percent, which was marginally higher than the 96.87 percent reported in Amici et al. [63], where a support vector machine (SVM) was employed to achieve the accuracy.
Only the inference problem is considered when evaluating machine learning implementation on hardware accelerators. This indicates that the training is carried out on a computer with advanced capabilities capable of handling the large amount of data needed for the training. As a result, the training in this paper was in the ground with sophisticated computing capabilities (i.e., a computer with an Nvidia RTX2060), and we describe the findings acquired from the authors’ earlier work [18] in Table 8.
The results that were obtained by deploying the CNN into the three hardware accelerators revealed that the performances that were stated in Table 8 were not affected by the deployment of the CNN. As a result, this section describes the deployment performance in terms of the inference time and the amount of power consumed.
  • Results on the Movidius: The results of the deployment on the Movidius indicate that the accuracy did not vary in comparison to the values that were presented in Table 9. At the same time, the inference time was approximately 5.8 milliseconds, and the computing power was 1.4 watts on average.
  • Results on the Jetson TX2: The results of the deployment on the Jetson TX2 revealed that the accuracy did not change in comparison to the values that were reported in Table 9. On the other hand, the inference time was approximately 3.0 milliseconds, and the computational power was 4.8 W on average (2.1 W if considering the power consumed by the GPU only). It is important to note that these results are related to the TX2 setup that provided the least inference time and the maximum power consumption. Other configurations can be set up to lower the amount of power that is consumed, so it is important to keep this in mind (and increase the inference time).
  • Results on the Jetson Nano: The findings of the deployment on the Jetson Nano demonstrate that the accuracy did not change compared to the values reported in Table 9. On the other hand, the inference time was approximately 3.4 milliseconds, and the computational power was 2.6 watts on average (2.0 W if considering the power consumed by the GPU only). Concerning the Jetson TX2, these findings are associated with the configuration that offers the quickest possible inference time at the expense of the highest possible power consumption.

6. Discussion

In light of the findings discussed above, the following is worth further investigation. The deployment of the hardware accelerators in all of the reported studies used final models with weights given in float 32. As a result, the precision, recall, and F1 results remained unchanged from those achieved during the PC training and testing method. On one hand, this result was possible due to the small dimension of the CNN model, and further weight quantisation was not required (i.e., results in inference time and power consumption were already consistent with the expected and/or required values without additional weights quantisation). Nevertheless, it should be noted that if the model needs to be improved further in terms of weight compression, embedding, or quantisation, the classification performance may suffer. In any case, this investigation’s findings show that the weights’ data format does not need to be changed for the proposed application, and the classification performances were nearly identical while using a PC or a hardware accelerator.
Table 9 shows that the inference timings are perfectly consistent with a real-time early detection service. It should be noted that this time only pertains to the CNN model’s inference time and does not include the pre-processing of the image or the extraction of the spectral signature for the pixel of interest. The inference time reported in Table 9 refers to the analysis of a single pixel. However, it is noteworthy that there is no need to run the classification for all pixels of all detected images. Indeed, a pre-processing based on the saturation of SWIR channels or the usage of specialized indices such as the hyperspectral fire detection index (HFDI) already discussed in [64] can provide a list of candidate pixels where an active fire could be present. Then, the inference can be run on a small neighbourhood of those pixels, so that the analysis can be performed in a few seconds, at most (the reader should note that the acquisition of a scene, considering a multi- or hyper-spectral payload, generally requires few seconds—for PRISMA, it is 4 s). However, these kinds of analyses should be performed along with several other considerations impacting the whole design of the satellite platform. The contribution of this paper is the demonstration of the feasibility of the design of these new mission concepts.
Table 9 also reports the power usage that is generally in line with space missions. When it comes to large platforms like PRISMA, all of the reported solutions are in line with the platform’s total power budget; however, when it comes to CubeSats or small satellites, the Movidius Stick and the Jetson Nano appear to be the most promising options. The maximum power budgets for 1U, 2U, and 3U CubeSats typically fall within the following ranges: 1 to 2.5 Watts, 2 to 5 Watts, and 7 to 20 Watts, accordingly [65]. Therefore, the Jetson Nano and the Intel Movidius are more appropriate for the performance of a CubeSat when taking into consideration the power budget. It is worthy to note that in other works such as in [17], the authors investigated the preliminary generalization performances of the model on other areas of the world with promising outcomes.
As a review of the preceding arguments, this study highlights the potential for future missions to include onboard hardware accelerators to provide early-warning services [66]. We established that this is possible when considering the wildfire analysis that was investigated in this study. Even though we did not take into consideration other important elements impacting on time and power (such as image pre-processing), our results demonstrate the feasibility of the proposed approach. Moreover, if the input data and model complexity are consistent with the ones mentioned here, these conclusions could be applied to other image processing jobs. The comparison of the three hardware solutions revealed that the Jetson Nano is the most promising technology as it offers the best combination of power consumption and inference time (even though the final choice may be influenced by other factors such as the hardware accelerator’s compatibility with the onboard computer, mechanical, and/or electrical interfaces, overall platform dimensions and characteristics, and so on). Furthermore, it is important to remind the reader that this comparison of accelerator technologies is far from complete, as additional boards exist that were not examined in this work for the sake of simplicity (for instance, the Google Coral TPU or FPGA system-on-chips). This work, on the other hand, answers the question of whether or not AI can be used to handle complex data like in hyper-spectral photography, indicating that the current technology is ready and efficient.
DSSs are a relatively new entrant in the realm of small satellite missions. This innovation boosts the value of the mission and paves the way for a variety of new applications. DSSs, or distributed satellite systems, are mission-oriented systems that consist of two or more satellites or modules cooperating with one another to fulfil goals that cannot be accomplished with a single satellite. In recent years, the application of DSS mission architecture has become increasingly widespread. Due to recent advancements in satellite technology and the ability to mass create low-cost small satellites in huge quantities, there has been a resurgence of interest in DSSs such as LEO satellite constellations. The results of the research show that edge computing in space is plausible. Furthermore the findings are promising to enable the TASO in space with a single satellite. Additionally, the same can be implemented and tested for distributed satellite systems. With the use of the Inter Satellite Link (ISL), which connects the satellites that make up the DSS, the system transforms into an intelligent-DSS (i-DSS), which allows for the data to be shared, analysed, and can be employed to provide real-time or near-real-time wildfire management [21,67].

7. Conclusions

The goal of this paper was to examine the performance of hardware accelerators for the edge computing of wildfires for real-time alerts using convolutional neural network models and hyperspectral data analysis. The analysis of the wildfires that occurred in Australia served as a practical example, and the data from PRISMA was utilised in the investigation. Considering three distinct hard-ware accelerators—the Intel Movidius Myriad 2, the Nvidia Jetson Nano, and the Nvidia Jetson TX2—showed that the onboard application is possible in terms of both the inference time and power consumption. These accelerators were employed to show that the onboard application is practicable. In line with other earlier works in the literature, this paper suggests the opportunity to investigate hardware accelerators for onboard edge computing in upcoming space missions in order to improve the services, better manage the entire space-to-ground data-flow, start providing real-time information, and enabling the trusted autonomous satellite operation (TASO), which could be really important in the event of disasters and extreme event management. Other accelerators will be evaluated in future research including field programmable gate arrays (FPGA) and the Google Coral Tensor Processing Unit (TPU). The proposed method will be evaluated in the distributed satellite system (DSS) for real-time disaster management and will increase the area of interest (AOI) coverage and decrease the revisit time. In the future, the methodology will be examined for its applicability to other types of Earth observation (EO) missions, and hardware-in-the-loop experiments will be conducted to demonstrate its effectiveness. Furthermore, transfer learning will be introduced in order to generalise the proposed model for the detection of wildfires and to study its possible applicability to other EO/disaster-relief missions.

Author Contributions

Conceptualisation, K.T., D.S. and R.S.; Methodology, D.S, K.T., and S.T.S.; Software, D.S., K.T., S.T.S., and S.A.; Formal analysis, K.T. and D.S.; Investigation, K.T., S.T.S., D.S., and S.A.; Validation, K.T., S.T.S., D.S., and S.A.; Writing—original draft preparation, K.T., D.S., and S.T.S.; Writing—review and editing, S.A., R.S., H.F., and P.M.; Visualisation, K.T., D.S., and S.T.S.; Supervision, S.A., D.S., R.S., H.F., and P.M. All authors have read and agreed to the published version of the manuscript.

Funding

The authors would like to thank the SmartSat Cooperative Research Centre (CRC) and The Andy Thomas Space Foundation for their support of this work through the collaborative research project No. 2.13s and Pluto program 2022.

Data Availability Statement

The code and data are available at: https://github.com/DarioSpiller/Tutorial_PRISMA_IGARSS_wildfires (accessed on 11 November 2022).

Acknowledgments

RISMA L1 and L2 data are available free of charge under the PRISMA data license policy and can be accessed online at the official Italian Space Agency website www.prisma.asi.it (accessed on 11 November 2022).

Conflicts of Interest

The authors declare no conflict of interest.

References

  1. Tol, R.S. The economic effects of climate change. J. Econ. Perspect. 2009, 23, 29–51. [Google Scholar] [CrossRef] [Green Version]
  2. Lubchenco, J.; Karl, T. Extreme weather events. Phys. Today 2012, 65, 31. [Google Scholar] [CrossRef]
  3. Kallis, G. Droughts. Annu. Rev. Environ. Resour. 2008, 33, 85–118. [Google Scholar] [CrossRef]
  4. Han, J.; Dai, H.; Gu, Z. Sandstorms and desertification in Mongolia, an example of future climate events: A review. Environ. Chem. Lett. 2021, 19, 4063–4073. [Google Scholar] [CrossRef]
  5. Lindsey, R. Climate Change: Global Sea Level. 2020. Available online: https://www.climate.gov/ (accessed on 14 August 2022).
  6. Lee, C.C. Utilizing synoptic climatological methods to assess the impacts of climate change on future tornado-favorable environments. Nat. Hazards 2012, 62, 325–343. [Google Scholar] [CrossRef]
  7. Robock, A. Volcanic eruptions and climate. Rev. Geophys. 2000, 38, 191–219. [Google Scholar] [CrossRef]
  8. Xu, R.; Yu, P.; Abramson, M.J.; Johnston, F.H.; Samet, J.M.; Bell, M.L.; Haines, A.; Ebi, K.L.; Li, S.; Guo, Y. Wildfires, Global Climate Change, and Human Health. New Engl. J. Med. 2020, 383, 2173–2181. [Google Scholar] [CrossRef]
  9. Vukomanovic, J.; Steelman, T. A systematic review of relationships between mountain wildfire and ecosystem services. Landsc. Ecol. 2019, 34, 1179–1194. [Google Scholar] [CrossRef]
  10. Finlay, S.E.; Moffat, A.; Gazzard, R.; Baker, D.; Murray, V. Health impacts of wildfires. PLoS Curr. 2012, 4. Available online: https://currents.plos.org/disasters/article/health-impacts-of-wildfires/ (accessed on 11 November 2022). [CrossRef]
  11. Tanase, M.A.; Aponte, C.; Mermoz, S.; Bouvet, A.; Le Toan, T.; Heurich, M. Detection of windthrows and insect outbreaks by L-band SAR: A case study in the Bavarian Forest National Park. Remote Sens. Environ. 2018, 209, 700–711. [Google Scholar] [CrossRef]
  12. Pradhan, B.; Dini Hairi Bin Suliman, M.; Arshad Bin Awang, M. Forest fire susceptibility and risk mapping using remote sensing and geographical information systems (GIS). Disaster Prev. Manag. Int. J. 2007, 16, 344–352. [Google Scholar] [CrossRef]
  13. Guth, P.L.; Craven, T.; Chester, T.; O’Leary, Z.; Shotwell, J. Fire location from a single osborne firefinder and a dem. Proceedings of ASPRS Annual Conference Geospatial Goes Global: From Your Neighborhood to the Whole Planet, Maryland, MD, USA, 7–11 March 2005. [Google Scholar]
  14. Bouabdellah, K.; Noureddine, H.; Larbi, S. Using Wireless Sensor Networks for Reliable Forest Fires Detection. Procedia Comput. Sci. 2013, 19, 794–801. [Google Scholar] [CrossRef] [Green Version]
  15. Barmpoutis, P.; Papaioannou, P.; Dimitropoulos, K.; Grammalidis, N. A review on early forest fire detection systems using optical remote sensing. Sensors 2020, 20, 6442. [Google Scholar] [CrossRef] [PubMed]
  16. Bu, F.; Gharajeh, M.S. Intelligent and vision-based fire detection systems: A survey. Image Vis. Comput. 2019, 91, 103803. [Google Scholar] [CrossRef]
  17. Spiller, S.A.D.; Ansalone, L. Transfer learning analysis for wildfire segmenta-tion using PRISMA hyperspectral imagery and convolutional neural networks. In Proceedings of the IEEE WHISPERS, Rome, Italy, 13–16 September 2022. [Google Scholar]
  18. Spiller, D.; Ansalone, L.; Amici, S.; Piscini, A.; Mathieu, P.P. Analysis and Detection of Wildfires by Using Prisma Hyperspectral Imagery. Int. Arch. Photogramm. Remote Sens. Spat. Inf. Sci. 2021, 43, 215–222. [Google Scholar] [CrossRef]
  19. Boshuizen, C.; Mason, J.; Klupar, P.; Spanhake, S. Results from the Planet Labs Flock Constellation. Small Satellite Conference. 2014. Available online: https://digitalcommons.usu.edu/smallsat/2014/PrivEnd/1/ (accessed on 11 November 2022).
  20. Zhu, L.; Suomalainen, J.; Liu, J.; Hyyppä, J.; Kaartinen, H.; Haggren, H. A review: Remote sensing sensors. In Multi-Purposeful Application of Geospatial Data; Intech Open: London, UK, 2018; pp. 19–42. [Google Scholar]
  21. Thangavel, K.; Spiller, D.; Sabatini, R.; Marzocca, P.; Esposito, M. Near Real-time Wildfire Management Using Distributed Satellite System. IEEE Geosci. Remote Sens. Lett. 2022. [Google Scholar] [CrossRef]
  22. Ulivieri, C.; Anselmo, L. Multi-sun-synchronous (MSS) orbits for earth observation. Astrodynamics 1991, 1992, 123–133. [Google Scholar]
  23. Bernstein, R. Digital image processing of earth observation sensor data. IBM J. Res. Dev. 1976, 20, 40–57. [Google Scholar] [CrossRef] [Green Version]
  24. Showstack, R. Sentinel Satellites Initiate New Era in Earth Observation; Wiley Online Library: Hoboken, NJ, USA, 2014. [Google Scholar]
  25. Shah, S.B.; Grübler, T.; Krempel, L.; Ernst, S.; Mauracher, F.; Contractor, S. Real-Time Wildfire Detection from Space—A Trade-Off Between Sensor Quality, Physical Limitations and Payload Size. Int. Arch. Photogramm. Remote Sens. Spatial Inf. Sci. 2019, 42, 209–213. [Google Scholar] [CrossRef] [Green Version]
  26. Del Rosso, M.P.; Sebastianelli, A.; Spiller, D.; Mathieu, P.P.; Ullo, S.L. On-Board Volcanic Eruption Detection through CNNs and Satellite Multispectral Imagery. Remote Sens. 2021, 13, 3479. [Google Scholar] [CrossRef]
  27. Esposito, M.; Dominguez, B.C.; Pastena, M.; Vercruyssen, N.; Conticello, S.S.; van Dijk, C.; Manzillo, P.F.; Koeleman, R. Highly Integration of Hyperspectral, Thermal and Artificial Intelligence for the Esa Phisat-1 Mission. Proceedings of International Airborne Conference 2019, Washington, DC, USA, 15–16 October 2019. [Google Scholar]
  28. Pastena, M.; Domínguez, B.C.; Mathieu, P.P.; Regan, A.; Esposito, M.; Conticello, S.; Dijk, C.V.; Vercruyssen, N.; Foglia, P. ESA Earth Observation Directorate NewSpace Initiatives. In Proceedings of the 33rd Annual AIAA/USU Conference on Small Satellites, Logan, UT, USA, 3–8 August 2019. [Google Scholar]
  29. Ruiz-de-Azua, J.A.; Fernandez, L.; Muñoz, J.F.; Badia, M.; Castella, R.; Diez, C.; Aguilella, A.; Briatore, S.; Garzaniti, N.; Calveras, A.; et al. Proof-of-Concept of a Federated Satellite System Between Two 6-Unit CubeSats for Distributed Earth Observation Satellite Systems. In Proceedings of the IGARSS 2019—2019 IEEE International Geoscience and Remote Sensing Symposium, Yokohama, Japan, 28 July–2 August 2019. [Google Scholar]
  30. Akhtyamov, R.; Vingerhoeds, R.; Golkar, A. Identifying Retrofitting Opportunities for Federated Satellite Systems. J. Spacecr. Rocket. 2019, 56, 620–629. [Google Scholar] [CrossRef] [Green Version]
  31. Golkar, A.; Lluch i Cruz, I. The Federated Satellite Systems paradigm: Concept and business case evaluation. Acta Astronaut. 2015, 111, 230–248. [Google Scholar] [CrossRef]
  32. Lluch, I.; Golkar, A. Design Implications for Missions Participating in Federated Satellite Systems. J. Spacecr. Rocket. 2015, 52, 1361–1374. [Google Scholar] [CrossRef]
  33. Xu, P.; Li, Q.; Zhang, B.; Wu, F.; Zhao, K.; Du, X.; Yang, C.; Zhong, R. On-Board Real-Time Ship Detection in HISEA-1 SAR Images Based on CFAR and Lightweight Deep Learning. Remote Sens. 2021, 13, 1995. [Google Scholar] [CrossRef]
  34. Viegas, D. Fire behaviour and fire-line safety. Ann. Medit. Burn. Club 1993, 6, 1998. [Google Scholar]
  35. Finney, M.A. FARSITE, Fire Area Simulator—Model Development and Evaluation; US Department of Agriculture, Forest Service, Rocky Mountain Research Station: Fort Collins, CO, USA, 1998. [Google Scholar]
  36. Pastor, E.; Zárate, L.; Planas, E.; Arnaldos, J. Mathematical models and calculation systems for the study of wildland fire behaviour. Prog. Energy Combust. Sci. 2003, 29, 139–153. [Google Scholar] [CrossRef]
  37. Alkhatib, A. Forest Fire Monitoring. In Forest Fire; Szmyt, J., Ed.; IntechOpen: London, UK, 2018. [Google Scholar] [CrossRef] [Green Version]
  38. Tedim, F.; Leone, V.; Amraoui, M.; Bouillon, C.; Coughlan, M.R.; Delogu, G.M.; Fernandes, P.M.; Ferreira, C.; McCaffrey, S.; McGee, T.K.; et al. Defining Extreme Wildfire Events: Difficulties, Challenges, and Impacts. Fire 2018, 1, 9. [Google Scholar] [CrossRef] [Green Version]
  39. Scott, J.H. Introduction to wildfire behavior modeling. In National Interagency Fuel, Fire, & Vegetation Technology Transfer; 2012; Available online: http://pyrologix.com/wp-content/uploads/2014/04/Scott_20121.pdf (accessed on 11 November 2022).
  40. Yu, P.; Xu, R.; Abramson, M.J.; Li, S.; Guo, Y. Bushfires in Australia: A serious health emergency under climate change. Lancet Planet. Health 2020, 4, e7–e8. [Google Scholar] [CrossRef] [Green Version]
  41. Gill, A.M. Biodiversity and bushfires: An Australia-wide perspective on plant-species changes after a fire event. Australia’s biodiversity–responses to fire: Plants, birds and invertebrates. Environ. Aust. Biodivers. Tech. Pap. 1999, 1, 9–53. [Google Scholar]
  42. Canadell, J.G.; Meyer, C.P.; Cook, G.D.; Dowdy, A.; Briggs, P.R.; Knauer, J.; Pepler, A.; Haverd, V. Multi-decadal increase of forest burned area in Australia is linked to climate change. Nat. Commun. 2021, 12, 6921. [Google Scholar] [CrossRef]
  43. Buergelt, P.T.; Smith, R. Chapter 6–Wildfires: An Australian Perspective. In Wildfire Hazards, Risks and Disasters; Shroder, J., Paton, D., Eds.; Elsevier: Oxford, UK, 2015; pp. 101–121. [Google Scholar]
  44. Tran, B.N.; Tanase, M.A.; Bennett, L.T.; Aponte, C. High-severity wildfires in temperate Australian forests have increased in extent and aggregation in recent decades. PLoS ONE 2020, 15, e0242484. [Google Scholar] [CrossRef] [PubMed]
  45. Haque, M.K.; Azad, M.A.K.; Hossain, M.Y.; Ahmed, T.; Uddin, M.; Hossain, M.M. Wildfire in Australia during 2019–2020, Its Impact on Health, Biodiversity and Environment with Some Proposals for Risk Management: A Review. J. Environ. Prot. 2021, 12, 391–414. [Google Scholar] [CrossRef]
  46. Tricot, R. Venture capital investments in artificial intelligence: Analysing trends in VC in AI companies from 2012 through 2020. OECD Digital Economy Papers, No. 319; OECD Publishing: Paris, France. [CrossRef]
  47. Loizzo, R.; Ananasso, C.; Guarini, R.; Lopinto, E.; Candela, L.; Pisani, A.R. The Prisma Hyperspectral Mission. In Proceedings of the Living Planet Symposium, Prague, Czech Republic, 9–13 May 2016. [Google Scholar]
  48. Shaik, R.; Laneve, G.; Fusilli, L. An Automatic Procedure for Forest Fire Fuel Mapping Using Hyperspectral (PRISMA) Imagery: A Semi-Supervised Classification Approach. Remote Sens. 2022, 14, 1264. [Google Scholar] [CrossRef]
  49. Shaik, R.; Giovanni, L.; Fusilli, L. Dynamic Wildfire Fuel Mapping Using Sentinel—2 and Prisma Hyperspectral Imagery. In Proceedings of the 2022 IEEE International Geoscience and Remote Sensing Symposium, Kuala Lumpur, Malaysia, 17–22 July 2022; pp. 5973–5976. [Google Scholar]
  50. Costantini, M.; Laneve, G.; Magliozzi, M.; Pietranera, L.; Sacco, P.; Shaik, R.; Tapete, D.; Tricomi, A.; Zavagli, M. Forest Fire Fuel Map from PRISMA Hyperspectral Data: Algorithms and First Results. Proceedings of Living Planet Symposium 2022, Bonn, Germany, 23–27 May 2022. [Google Scholar] [CrossRef]
  51. Guarini, R.; Loizzo, R.; Facchinetti, C.; Longo, F.; Ponticelli, B.; Faraci, M.; Dami, M.; Cosi, M.; Amoruso, L.; De Pasquale, V.; et al. Prisma Hyperspectral Mission Products. In Proceedings of the 2018 IEEE International Geoscience and Remote Sensing Symposium, Valencia, Spain, 22–27 July 2018; pp. 179–182. [Google Scholar]
  52. Spiller, D.; Thangavel, K.; Sasidharan, S.T.; Amici, S.; Ansalone, L.; Sabatini, R. Wildfire Segmentation Analysis from Edge Computing for On-Board Real-Time Alerts Using Hyperspectral Imagery. In Proceedings of the 2022 IEEE International Conference on Metrology for Extended Reality, Artificial Intelligence and Neural Engineering (MetroXRAINE), Rome, Italy, 26–28 October 2022. [Google Scholar]
  53. Hu, W.; Huang, Y.; Wei, L.; Zhang, F.; Li, H. Deep Convolutional Neural Networks for Hyperspectral Image Classification. J. Sens. 2015, 2015, 258619. [Google Scholar] [CrossRef] [Green Version]
  54. Spiller, D.; Ansalone, L.; Carotenuto, F.; Mathieu, P.P. Crop type mapping using prisma hyperspectral images and one-dimensional convolutional neural network. Proceedings of IEEE International Geoscience and Remote Sensing Symposium IGARSS 2021, Virtual Conference, 12–16 July 2021. [Google Scholar]
  55. Bangash, I. NVIDIA Jetson Nano vs. Google Coral vs. Intel NCS. A Comparison. 2020. Available online: https://towardsdatascience.com/nvidia-jetson-nano-vs-google-coral-vs-intel-ncs-a-comparison-9f950ee88f0d (accessed on 12 September 2022).
  56. Thangavel, K.; Spiller, D.; Sabatini, R.; Marzocca, P. On-board Data Processing of Earth Observation Data Using 1-D CNN. Proceedings of SmartSat CRC Conference, Sydneyy, NSW, Australia, 12–13 September 2022. [Google Scholar] [CrossRef]
  57. Kurniawan, A. Administering NVIDIA Jetson Nano. In IoT Projects with NVIDIA Jetson Nano; Springer: Berlin/Heidelberg, Germany, 2021; pp. 21–47. [Google Scholar]
  58. Kurniawan, A. Introduction to NVIDIA Jetson Nano. In IoT Projects with NVIDIA Jetson Nano; Springer: Berlin/Heidelberg, Germany, 2021; pp. 1–6. [Google Scholar]
  59. Kurniawan, A. NVIDIA Jetson Nano Programming. In IoT Projects with NVIDIA Jetson Nano; Springer: Berlin/Heidelberg, Germany, 2021; pp. 49–62. [Google Scholar]
  60. Süzen, A.; Duman, B.; Şen, E.B. Benchmark Analysis of Jetson TX2, Jetson Nano and Raspberry PI using Deep CNN. In Proceedings of the 2020 International Congress on Human-Computer Interaction, Optimization and Robotic Applications (HORA), Ankara, Turkey, 26–28 June 2020. [Google Scholar]
  61. Cui, H.; Dahnoun, N. Real-Time Stereo Vision Implementation on Nvidia Jetson TX2. In Proceedings of the 2019 8th Mediterranean Conference on Embedded Computing (MECO), Budva, Montenegro, 10–14 June 2019; pp. 1–5. [Google Scholar]
  62. Nguyen, H.H.; Trần, Đ.; Jeon, J. Towards Real-Time Vehicle Detection on Edge Devices with Nvidia Jetson TX2. In Proceedings of the 2020 IEEE International Conference on Consumer Electronics—Asia (ICCE-Asia), Seoul, Republic of Korea, 1–3 November 2020; pp. 1–4. [Google Scholar]
  63. Amici, S.; Piscini, A. Exploring PRISMA Scene for Fire Detection: Case Study of 2019 Bushfires in Ben Halls Gap National Park, NSW, Australia. Remote Sens. 2021, 13, 1410. [Google Scholar] [CrossRef]
  64. Amici, S.; Spiller, D.; Ansalone, L.; Miller, L. Wildfires Temperature Estimation by Complementary Use of Hyperspectral PRISMA and Thermal (ECOSTRESS &L8). J. Geophys. Res. Biogeosci. 2022, 127, e2022JG007055. [Google Scholar]
  65. Arnold, S.; Nuzzaci, R.; Gordon-Ross, A. Energy budgeting for CubeSats with an integrated FPGA. In Proceedings of the IEEE Aerospace Conference Proceedings, Big Sky, MT, USA, 3–10 March 2012. [Google Scholar]
  66. Ranasinghe, K.; Sabatini, R.; Gardi, A.; Bijjahalli, S.; Kapoor, R.; Fahey, T.; Thangavel, K. Advances in Integrated System Health Management for mission-essential and safety-critical aerospace applications. Prog. Aerosp. Sci. 2022, 128, 100758. [Google Scholar] [CrossRef]
  67. Wischert, D.; Baranwal, P.; Bonnart, S.; Álvarez, M.C.; Colpari, R.; Daryabari, M.; Desai, S.; Dhoju, S.; Fajardo, G.; Faldu, B.; et al. Conceptual design of a mars constellation for global communication services using small satellites. In Proceedings of the 71st International Astronautical Congress, IAC 2020, Virtual, 12–14 October 2020. [Google Scholar]
Figure 1. Fire detection methods.
Remotesensing 15 00720 g001
Figure 2. Levels of processing from data to services [46].
Remotesensing 15 00720 g002
Figure 3. The RGB PRISMA composite image with labelled points defined for the five classes. Pixels within the white rectangles are used for the test, the others for training and validation.
Remotesensing 15 00720 g003
Figure 4. Multi-class classification CNN model [18].
Remotesensing 15 00720 g004
Figure 5. Block schematic for the Movidius Stick implementation.
Remotesensing 15 00720 g005
Figure 6. Block diagram for the optimisation and implementation with Intel OpenVino.
Remotesensing 15 00720 g006
Figure 7. High-level representation of the Keras model to IR model conversion through the TF saved model and model optimiser.
Remotesensing 15 00720 g007
Figure 8. Deployment procedure on NCS2 where the pre-processed data and IR model is fed to the inference engine and the results are acquired.
Remotesensing 15 00720 g008
Figure 9. Conversion of a Keras model to a TF SavedModel through the various stages in the process.
Remotesensing 15 00720 g009
Figure 10. Inferencing procedure in Nvidia Jetson TX2 in which additional steps (green) were employed.
Remotesensing 15 00720 g010
Figure 11. Segmentation map obtained from the trained model.
Remotesensing 15 00720 g011
Table 1. Satellite categories, Adapted from [20].
OrbitAltitudeAdvantages
Geostationary Earth Orbit (GEO)Circular orbit with an altitude of 35,786 km and zero inclination
  • The satellite does not move at all relative to the ground,
  • Providing a constant view of the same surface area,
  • High temporal resolution.
Low Earth Orbit (LEO)Altitude of 2000 km or less
  • Requires the lowest amount of energy for satellite placement;
  • Provides high bandwidth,
  • Low communication latency.
Sun-Synchronous Orbit (SSO)Nearly polar orbit that passes the equator at the same local time on every pass. Typical Sun-synchronous Earth orbits are 600–800 km.
  • Satellite will always observe the same scene with the same angle of illumination coming from the Sun,
  • Has high spatial resolution.
Table 2. List of some reference remote sensing satellite systems and their characteristics. Adapted from [15].
(Satellite)-SensorSpectral BandsAccess to the DataSpatial ScaleSpatial ResolutionSpecs/Advantages/LimitationsData CoverageAccuracy Range
Terra/Aqua-MODIS36 (0.4–14.4 µm)Registration Required (NASA)Global0.25 km (bands 1–2) 0.5 km (bands 3–7) 1 km (bands 8–36)Easily accessible, limited spatial resolution, revisit time: 1–2 daysEarth92.75–98.32%
Himawari-8/9—AHI-816 (0.4–13.4 µm)Registration Required/ (Himawari Cloud)Regional0.5 km or 1 km for visible and near-infrared bands and 2 km for infrared bandsImaging sensors with high radiometric, spectral, and temporal resolution. 10 min (Full disk), revisit time: 5 min for areas in Japan/Australia)East Asia and Western Pacific75–99.5%
MSG—SEVIRI12 (0.4–13.4 µm)Registration Required (EUMETSAT)Regional1 km for the high-resolution visible channel, 3 km for the infrared and the 3 other visible channelsLow noise in the long-wave IR channels, tracking of dust storms in near-real-time, susceptibility of the larger field of view to contamination by cloud and lack of dual-view capability, revisit time: 5–15 minAtlantic Ocean, Europe and Africa71.1–98%
GOES-16 and 1816 (0.4–13.4 µm)Registration Required (NOAA)Regional0.5 km for the 0.64 µm visible channel 1 km for other visible/near-IR 2 km for bands > 2 µmInfrared resolutions allow the detection of much smaller wildland fires with high temporal resolution but relatively low spatial resolution, and delays in data delivery, revisit time: 5–15 minWestern Hemisphere (North and South America)94–98%
HuanJing (HJ)-1B—WVC (Wide View CCD Camera)/IRMSS (Infrared Multispectral Scanner)WVC: 4 (0.43–0.9 µm) IRMSS: 4 (0.75–12.5 µm)Registration RequiredRegionalWVC: 30 m IRMSS: 150–300 mLack of an onboard calibration system to track HJ-1 sensors’ on-orbit behaviour throughout the life of the mission, revisit time: 4 daysAsian and Pacific Region94.45%
POES/MetOp—AVHRR6 (0.58–12.5 µm)Registration Required (NOAA)Global1.1 km by 4 km at nadirCoarse spatial resolution, revisit time: 6 hEarth99.6%
S-NPP/ NOAA-20/NOAA— VIIRS-375 m16 M-bands (0.4–12.5 µm) 5 I-bands (0.6–12.4 µm) 1 DNB (0.5–0.9 µm)Registration Required (NASA)Global0.75 km (M-bands) 0.375 km (I-bands) 0.75 km (DNB)Increased spatial resolution, improved mapping of large fire perimeters, revisit time: 12 hEarth89–98.8%
CubeSats (data refer to a specific design from [25])2: MWIR (3–5 µm) and LWIR (8–12 µm)Commercial access plannedGlobal0.2 kmSmall physical size, reduced cost, improved temporal resolution/response time, Revisit time: less than 1 h.Wide coverage in orbit-
Table 3. Classification of wildfires based on fire behaviour and the capacity of control. Adapted from [38].
Fire
Category
Real-Time Measurable
Behaviour Parameters
Real-Time Observable
Manifestations of Extreme Fire Behaviour ((EFB)
Type of Fire and Capacity of Control
Fireline Intensities (FLI) (kWm−1)Rate Of Spread (ROS) (m/min)Flame Length (FL) (m)Pyrocumulonimbus (PyroCb)DowndraftsSpotting
Activity
Spotting
Distance (m)
Normal Fires1<500<5 a
<15 b
<1.5AbsentAbsentAbsent0Surface fire
Fairly easy
2500–2000<15 a
<30 b
<2.5AbsentAbsentLow<100Surface fire
Moderately difficult
32000–4000<20 c
<50 d
2.5–3.5AbsentAbsentHigh≥100Surface fire, torching possible
Very difficult
44000–10,000<50 c
<100 d
3.5–10UnlikelyIn some localised casesProlific500–1000Surface fire, crowning likely depending on vegetation type and stand structure
Extremely difficult
Extreme Wildfire Events510,000–30,000<150 c
<250 d
10–50PossiblePresentProlific>1000Crown fire, either wind- or plume-driven
Spotting plays a relevant role in fire growth
Possible fire breaching across an extended obstacle to local spread
Chaotic and unpredictable fire spread
Virtually impossible
630,000–100,000<30050–100ProbablePresentMassive Spotting>2000Plume-driven, highly turbulent fire
Chaotic and unpredictable fire spread
Spotting, including long distance, plays a relevant role in fire growth
Possible fire breaching across an extended obstacle to local spread
Impossible
7>100,000 (possible)>300 (possible)>100 (possible)PresentPresentMassive Spotting>5000Plume-driven, highly turbulent fire
Area-wide ignition and firestorm development non-organised flame fronts because of extreme turbulence/vorticity and massive spotting
Impossible
Note: a Forest and shrubland; b Grassland; c Forest; d Shrubland and grassland.
Table 4. Mos relevant wildfires that took place in Australia from 2007 to 2021 [42,43,44,45].
YearEvent NameAffected AreaBurned Area
(Approx. Acres)
1 June 2020–1 June 20212020–2021 Australian wildfire seasonsNationwide617,763
5 September 2019–2 March 20202019–2020 Australian wildfire season (Black Summer)Nationwide46,030,000
February 2019Tingha wildfireNew South Wales57,870
11–14 February 20172017 New South Wales wildfiresNew South Wales130,000
January 20162016 Murray Road wildfire (Waroona and Harvey)Western Australia170,910
25 November–2 December 20152015 Pinery wildfireSouth Australia210,000
15–24 November 2015Perth Hills wildfire complex–Solus GroupWestern Australia24,750
October–November 20152015 Esperance wildfiresWestern Australia490,000
29 January–20 February 20152015 O’Sullivan wildfire (Northcliffe–Windy Harbour)Western Australia244,440
2–9 January 20152015 Sampson Flat wildfiresSouth Australia49,000
January 20152015 Lower Hotham wildfire (Boddington)Western Australia129,420
1 August–9 August 20152015 Wentworth Falls Winter FireNew South Wales2,000
17–28 October 20132013 New South Wales wildfiresNew South Wales250,000
18 January 2013Warrumbungle wildfireNew South Wales130,000
4 January 2013Tasmanian wildfiresTasmania49,000
27 December 2011–3 February 2012Carnarvon wildfire complexWestern Australia2,000,000
7 February–14 March 2009Black Saturday wildfiresVictoria1,100,000
30 December 2007Boorabbin National ParkWestern Australia99,000
Table 5. Number of labelled reference pixels in Australia used for training and testing the CNN [52].
Pixels per Classes
Wildfire LocationUsage0
Fire
1
Smoke
2
Burned Areas
3
Vegetation
4
Bare Soil
Total
North-EastTrain & Val5810305040188
SouthTest11119101051
North-WestTest5055520
Table 6. Edge AI hardware comparison [55].
ParametersNvidia Jetson NanoGoogle Coral USBIntel Movidius NCS
Inference time~38 ms~70–92.32 ms~225–227 ms
fps~25~9–7~4.43–4.39
CPU usage47–50%135%87–90%
Memory usage32 %8.7%~7%
OSUbuntu 18.04 aarch64Raspbian GNU/License 10 (Buster)Raspbian GNU/License 9 (Stretch)
Table 7. Validation dataset accuracy.
PrecisionRecallF1 Score
0—Fire1.001.001.00
1—Smoke1.001.001.00
2—Burned1.001.001.00
3—Vegetation0.921.000.96
4—Bare soil1.000.920.96
Accuracy 0.98
Macro average0.980.980.98
Weighted average0.980.980.98
Table 8. In the three areas indicated, the precision, recall, and F1 scores were calculated. The dataset from north-east Australia was utilised for training, while the others were used for testing.
Wildfire Location Precision Recall F1 Score
Australia, North-East0.980.980.98
Australia, South0.980.980.98
Australia, North-West1.000.950.97
Table 9. Inference time and power consumption on the three hardware accelerators.
HW AcceleratorInference Time (ms)Power Consumption (W)
Movidius5.81.4
Jetson TX23.04.8 (2.1 GPU only)
Jetson Nano3.42.6 (2.0 GPU only)
Disclaimer/Publisher’s Note: The statements, opinions and data contained in all publications are solely those of the individual author(s) and contributor(s) and not of MDPI and/or the editor(s). MDPI and/or the editor(s) disclaim responsibility for any injury to people or property resulting from any ideas, methods, instructions or products referred to in the content.

