Article

An Improved Approach to Monitoring Wheat Stripe Rust with Sun-Induced Chlorophyll Fluorescence

1
College of Geomatics, Xi’an University of Science and Technology, Xi’an 710054, China
2
College of Land Science and Technology, China Agricultural University, Beijing 100083, China
*
Author to whom correspondence should be addressed.
Remote Sens. 2023, 15(3), 693; https://doi.org/10.3390/rs15030693
Submission received: 24 December 2022 / Revised: 20 January 2023 / Accepted: 22 January 2023 / Published: 24 January 2023
(This article belongs to the Special Issue Crop Quantitative Monitoring with Remote Sensing)

Abstract

:
Sun-induced chlorophyll fluorescence (SIF) has shown potential in quantifying plant responses to environmental changes by which abiotic drivers are dominated. However, SIF is a mixed signal influenced by factors such as leaf physiology, canopy structure, and sun-sensor geometry. Whether the physiological information contained in SIF can better quantify crop disease stresses dominated by biological drivers, and clearly explain the physiological variability of stressed crops, has not yet been sufficiently explored. On this basis, we took winter wheat naturally infected with stripe rust as the research object and conducted a study on the responses of physiological signals and reflectivity spectrum signals to crop disease stress dominated by biological drivers, based on in situ canopy-scale and leaf-scale data. Physiological signals include SIF, SIFyield (normalized by absorbed photosynthetically active radiation), fluorescence yield (ΦF) retrieved by NIRvP (non-physiological components of canopy SIF) and relative fluorescence yield (ΦF-r) retrieved by near-infrared radiance of vegetation (NIRvR). Reflectance spectrum signals include normalized difference vegetation index (NDVI) and near-infrared reflectance of vegetation (NIRv). At the canopy scale, six signals reached extremely significant correlations (P < 0.001) with disease severity levels (SL) under comprehensive experimental conditions (SL without dividing the experimental samples) and light disease conditions (SL < 20%). The strongest correlation between NDVI and SL (R = 0.69) was observed under the comprehensive experimental conditions, followed by NIRv (R = 0.56), ΦF-r (R = 0.53) and SIF (R = 0.51), and the response of ΦF (R = 0.45) and SIFyield (R = 0.34) to SL was weak. Under lightly diseased conditions, ΦF-r (R = 0.62) showed the strongest response to disease, followed by SIFyield (R = 0.60), SIF (R = 0.56) and NIRv (R = 0.54). The weakest correlation was observed between ΦF and SL (R = 0.51), which also showed a result approximating NDVI (R = 0.52). In the case of a high level of crop disease severity, NDVI showed advantages in disease monitoring. In the early stage of crop diseases, which we pay more attention to, compared with SIF and reflectivity spectrum signals, ΦF-r estimated by the newly proposed ‘NIRvR approach’ (which uses SIF together with NIRvR (i.e., SIF/ NIRvR) as a substitute for ΦF) showed superior ability to monitor crop physiological stress, and was more sensitive to plant physiological variation. At the leaf scale, the response of SIF to SL was stronger than that of NDVI. These results validate the potential of ΦF-r estimated by the NIRvR approach to monitoring disease stress dominated by biological drivers, thus providing a new research avenue for quantifying crop responses to disease stress.

1. Introduction

Wheat stripe rust is a devastating hazard to wheat production. In epidemic years, wheat stripe rust can cause more than a 40% yield reduction and, in some cases, no harvest [1]. Wheat stripe rust occurs mainly on the leaves of the plant, with a few occurrences on the leaf sheaths, stalks and spikes [2]. Initially, small chlorotic spots form at the diseased site, followed by the development of summer spore mounds arranged in dashed segments parallel to the leaf veins [3]. In the late stage of the disease, short thread-like black winter spore mounds appear, the epidermis of the plant leaves breaks down and rust-colored powdery material appears, leading to dryness and death of the leaves [4]. In recent years, crop pests and diseases have become commonplace, with more than 566,700 ha of wheat fields in Shaanxi Province alone experiencing outbreaks of stripe rust in 2020. Moreover, the frequent occurrence of pests and diseases has become a major limiting factor for stable crop yields.
Sun-induced chlorophyll fluorescence (SIF) is an optical signal emitted in the spectral range of 650–850 nm from chlorophyll a molecules in vegetation, and is a direct probe of photosynthesis with good sensitivity and accuracy in assessing the physiological state of plants and their responses to environmental changes [5,6]. The SIF data obtained from sensors at different spatial scales provide a basis for studying the structural and physiological information contained in the SIF in response to different environments and different stresses. Large-scale SIF data are acquired via unmanned aerial vehicles or satellites to assess the variability of SIF on spatial scales and seasonal variation on temporal scales [7,8,9,10,11]. Continuous datasets obtained from tower-based measurements or other ground-based fixed measurements combined with meteorological variable data allow for the assessment of observed plant physiological variability [12,13,14,15]. Ground-based portable systems such as ASD spectrometers, QE-pro spectrometers, and canopy analyzers were used to acquire data in experimental areas where crops were subjected to physiological or non-physiological stress to assess the ability of SIF to quantify different categories of stress [16,17,18]. However, the SIF acquired using a sensor is a mixed signal influenced by factors such as leaf physiology, canopy structure, and sun-sensor geometry. To better study the effects of disease stress on crops and improve the accuracy of remote-sensing monitoring of crop diseases, it is necessary to distinguish between structural and physiological influences that cause canopy SIF variation and test whether the isolated physiological signals can quantify the physiological variation of crops under disease stress conditions, and whether they are more advantageous in disease monitoring compared to canopy SIF or the vegetation index.
Recent studies have shown that near-infrared reflectance of vegetation (NIRv) and near-infrared radiance of vegetation (NIRvR) can better explain changes to the non-physiological information in SIF [19,20,21]. However, the contribution of physiological information contained in SIF to SIF variability is still being explored. Kimm et al. (2021) found that fluorescence yield (ΦF) can better reflect the effects of a high-temperature and high vapor pressure deficit on crops than SIF through analyzing different spectral datasets [22]. Wu et al. (2022) found that the increased ΦF dominated the SIF variation during the early stages of herbicide stress, while the influence of the non-physiological components (NIRvP, which is calculated as NIRv multiplied by incoming photosynthetically active radiation (PAR), i.e., NIRvP = NIRv × PAR) of canopy SIF was prominent in the variability of SIF in the absence of herbicide [23]. The study by Xu et al. (2021) showed that the influence of ΦF was prominent in the diurnal SIF response to water stress, with reduced fluorescence efficiencies in stressed plants [24]. Recently, Zeng et al. (2022) proposed an improved approach for estimating ΦF (NIRvR approach, this approach uses SIF together with NIRvR (i.e., SIF/ NIRvR) as a substitute for ΦF. SIF/NIRvR does not represent the absolute value of ΦF, but instead serves as a linear approximation of ΦF to indicate its response to stress. Hereafter, SIF/NIRvR is denoted by ΦF-r.), and their estimated ΦF-r captured seasonal changes in fluorescence and showed sensitivity to physiological responses induced by changes in light, temperature and moisture dynamics [25]. However, the studies mentioned above all analyze the responses of fluorescence yield to dynamic changes in abiotic drivers. Studies on remote-sensing monitoring of crop physiological stresses caused by dynamic changes in biological drivers such as pest and disease stresses and using fluorescence yield have not yet been reported.
The current research is mainly focused on the monitoring of wheat stripe rust using reflectance spectra, with information extraction and detection around the spectral bands that are sensitive to the crop disease. Some studies have also taken advantage of the ability of SIF to sensitively reflect the physiological changes caused by the disease to detect wheat under stripe rust stress. However, reflectance spectra cannot directly reveal the physiological state of vegetation photosynthesis, and the SIF signal is also a mixed signal influenced by leaf physiology, canopy structure and other factors.
Considering this background, we investigated the responses of four physiological signals and two reflectivity spectrum signals to biotic-driver-dominated wheat stripe rust stress, using field-based canopy-scale data, in winter wheat with the natural occurrence of stripe rust. Among them, physiological signals include ΦF estimated using the NIRvP approach (this approach uses NIRv and PAR together with SIF to approximate ΦF; i.e., the effect of abiotic changes and stress is detected as SIF/ (PAR × NIRv)), ΦF-r estimated using the NIRvR approach, SIF and SIFyield (normalized by absorbed photosynthetically active radiation (APAR)). Additionally, reflectivity spectrum signals include the normalized difference vegetation index (NDVI) and NIRv. Our primary objectives were to investigate whether the canopy ΦF-r estimated by the NIRvR approach could capture or quantify the physiological variation of wheat under stripe rust stress conditions, whether ΦF-r could improve the remote-sensing monitoring precision of wheat stripe rust under low disease levels, and whether ΦF-r was more advantageous than SIF or vegetation index-based disease monitoring. We then explore the relative contribution of the structural and physiological information to SIF variability under disease stress conditions. Finally, we discuss the applicability of SIF-derived physiological signals for the detection of other crops and stresses.

2. Materials and Methods

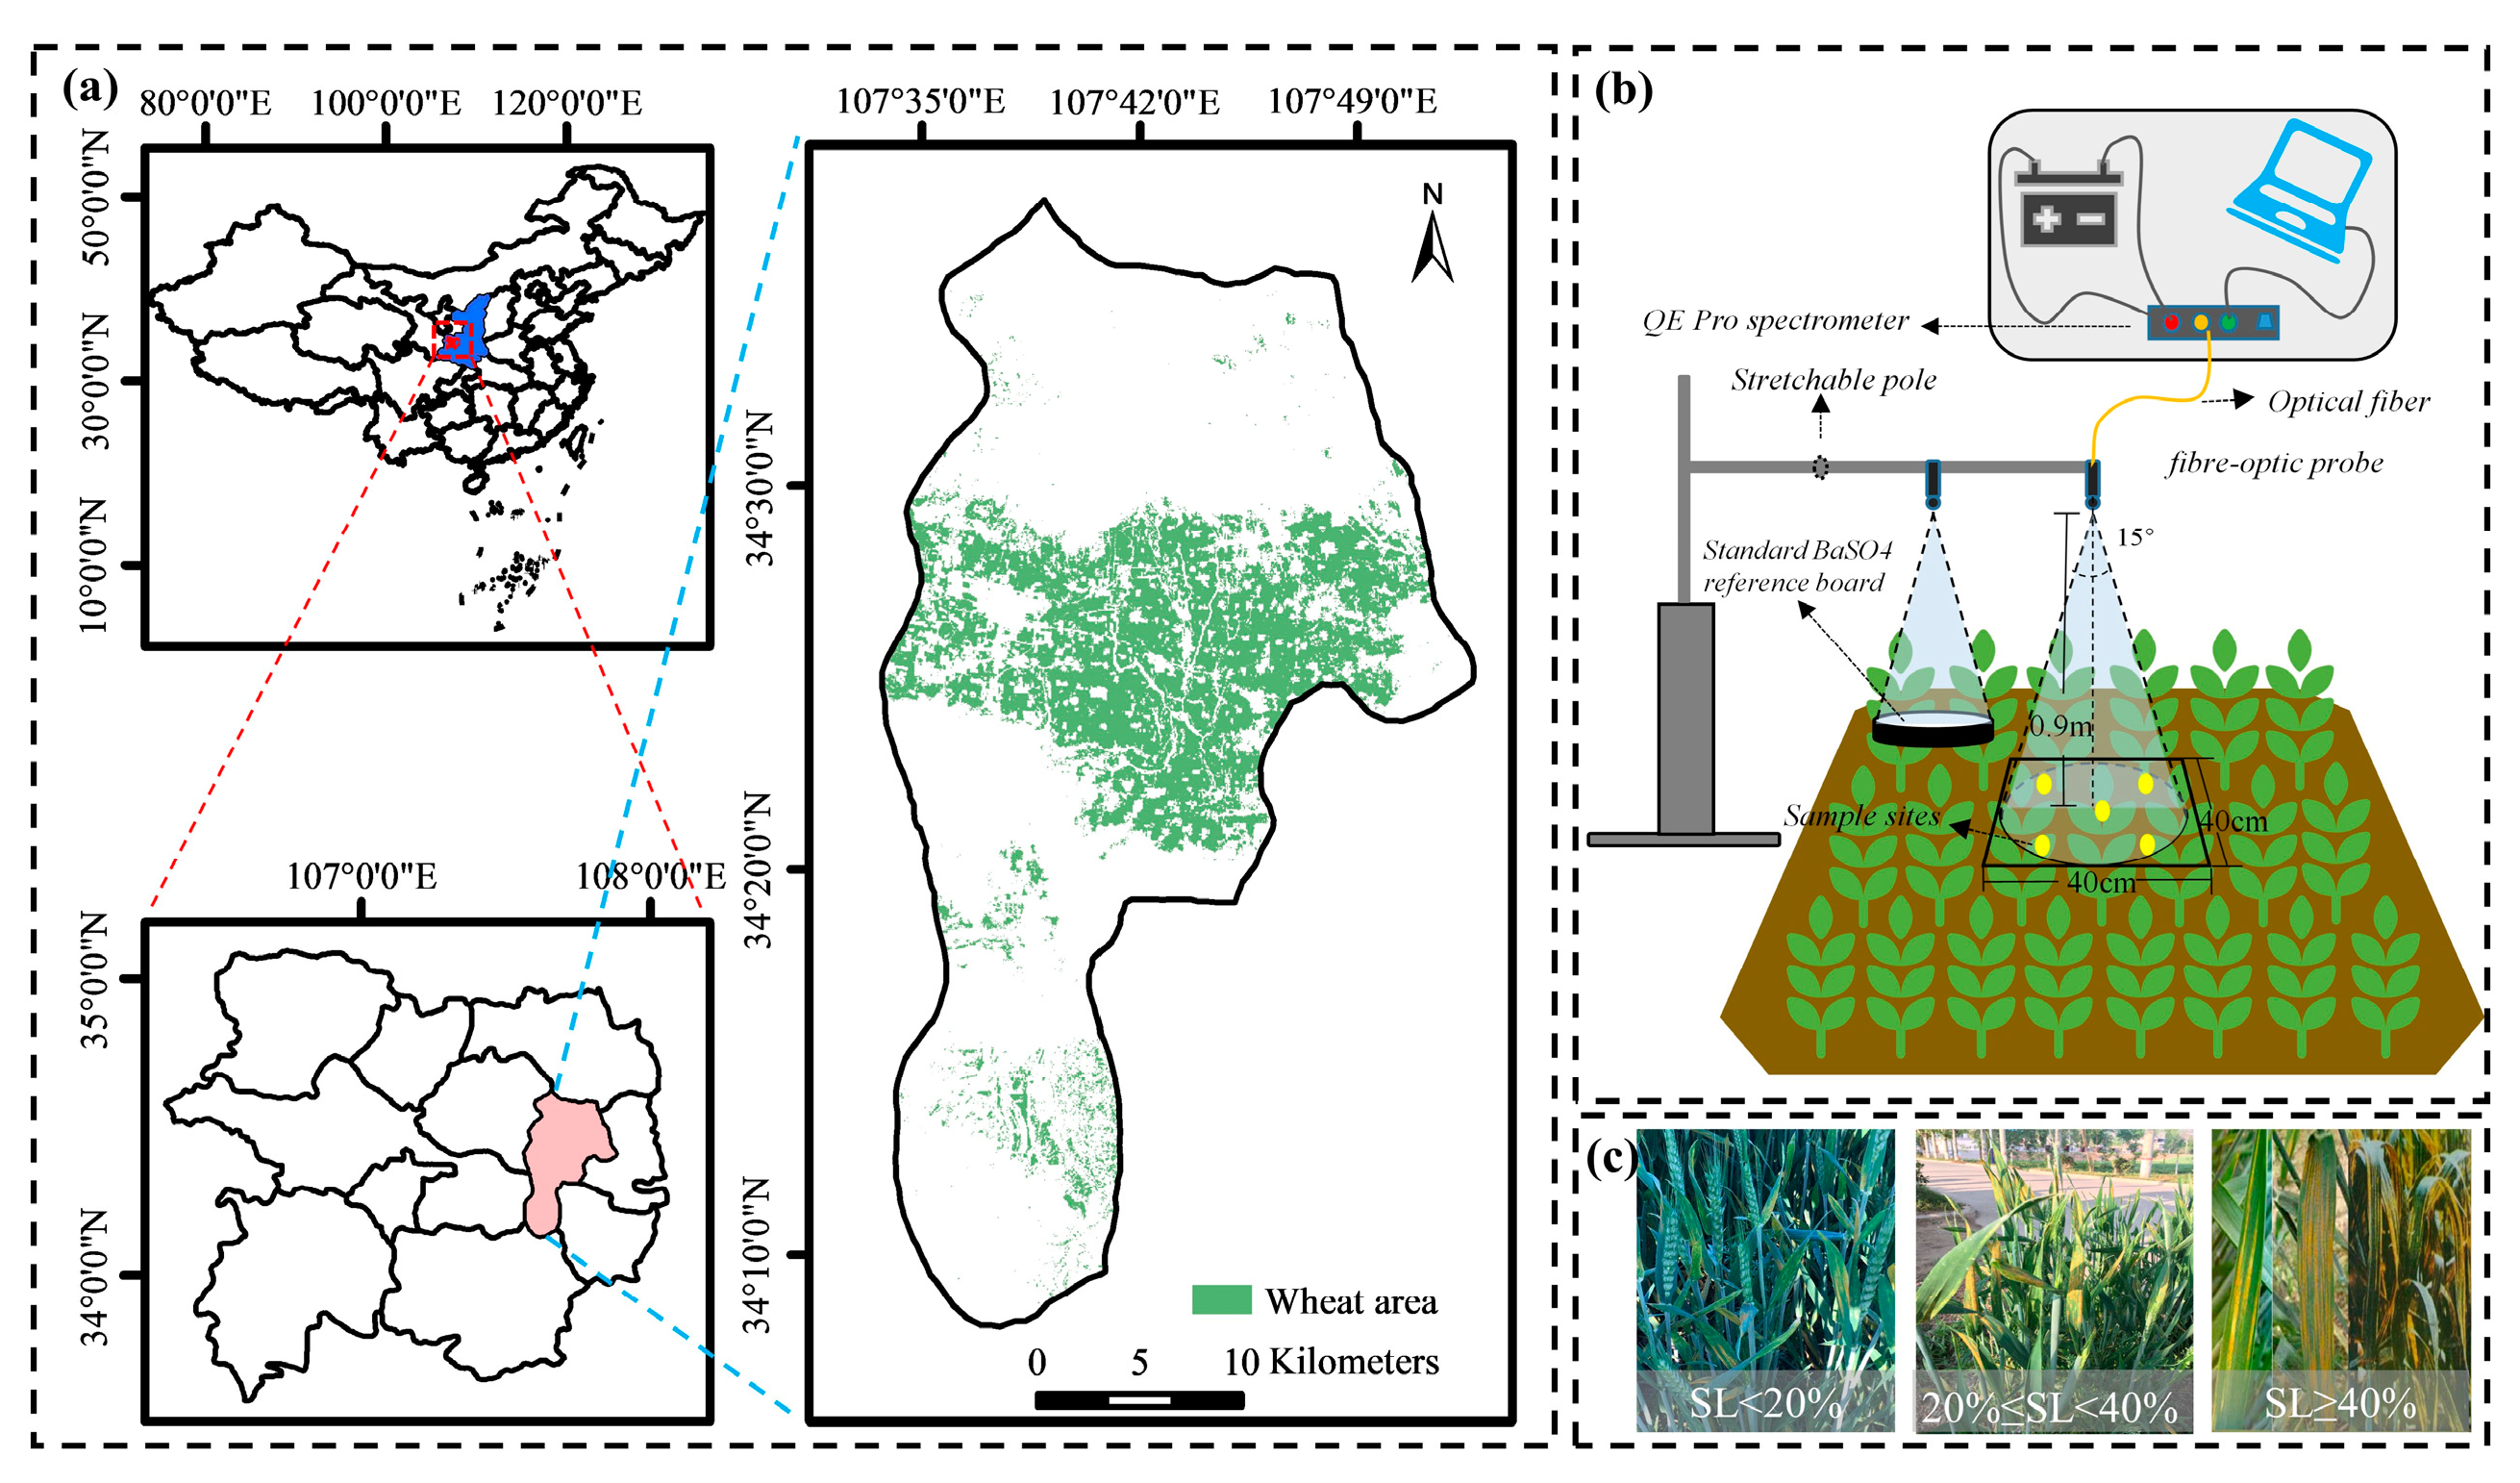
2.1. Experimental Areas

Field data were collected in Qishan (Figure 1), Shaanxi Province (34°26′52″N, 107°37′42″E), in April 2021. This region is a mid-latitude warm temperate zone that experiences a continental monsoon climate with mild weather and sufficient rainfall. The annual average temperature is 12 ℃, the annual sunshine hours are 2053 hours, and the annual average precipitation is 615 mm. The wheat variety planted was Xinong 822. The sowing dates of wheat are mainly concentrated from 28 September to 3 October 2020. The following year, in late May to early June, wheat matures.

2.2. Data Acquisition and Processing

2.2.1. Canopy-Level Spectrum Measurement

Canopy spectral observations of all samples were obtained in a 40 × 40 cm wheat quadrat. A QE Pro spectrometer (Ocean Optics Inc., Dunedin, FL, USA) was used for spectrum measurements, with an FWHM of 0.3 nm, a spectral sampling interval of 0.15 nm, and a spectral range of 640–800 nm. The probe height was 0.9 m from the wheat canopy, and the field of the probe view is 15°. The canopy spectrum was measured at 11:00–14:00 Beijing time. Each sample (number of canopy samples: 247, Figure 2) was continuously observed 10 times and averaged as the spectral data. Canopy spectral measurements were performed in three separate sessions (first: 28–30 April 2021; second: 5–6 May 2021; and third: 12–13 May 2021), and weather conditions were predicted in advance of each measurement through the weather platform. The weather conditions on the measurement dates were all clear and cloudless.

2.2.2. Leaf-Level Spectrum Measurement

We performed leaf-scale spectral measurements on the flag leaves of the diseased plants. The same QE Pro spectrometer was used for the leaf-scale spectral measurements. However, when using this device, observation of the leaf samples was performed by the observer holding a bare fiber probe close to, and perpendicular to, the blade surface for continuous observations. The probe height was 3 cm from the wheat leaf (number of leaf samples: 311, Figure 2). Leaf spectral measurements were performed in two separate sessions (first: 5–6 May 2021 and second: 9 May 2021).

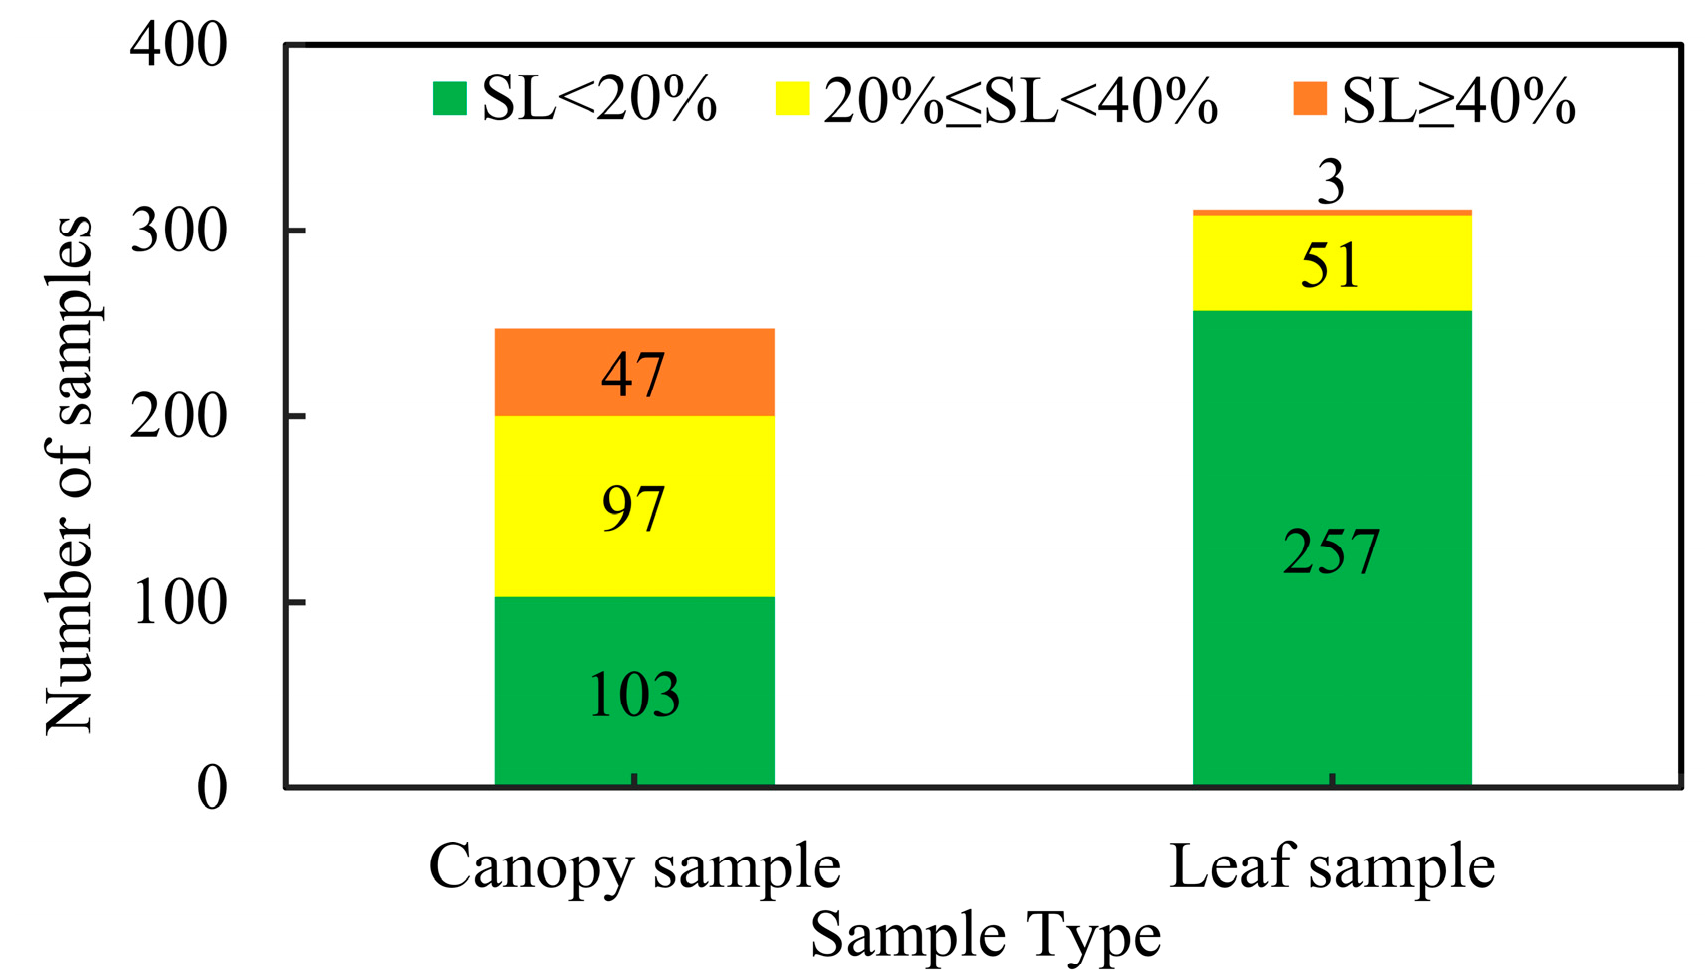
2.2.3. Severity Level (SL) Survey

Five sample sites were selected in a diagonal manner within an area of about 40 × 40 cm. Two flag leaves were selected for each sample site, and all of the sampled leaves were inspected using the Rules for the Monitoring and Forecast of Wheat Stripe Rust (GB/T 15795-2011) [26]. The SL of disease (the percentage of diseased spot area on the diseased leaf relative to the total leaf area) on wheat leaves was divided into eight levels (1%, 5%, 10%, 20%, 40%, 60%, 80%, and 100%). The SL of the canopy sample was calculated using Equation (1). The SL of the leaf sample was expressed as the percentage of diseased spot area on the diseased leaf relative to the total leaf area:
S L = ( i × l i ) / L
where i is the level value, li is the number of diseased leaves corresponding to the ith gradient value, and L is the number of leaves investigated.

2.3. SIF Retrieval Method and Vegetation Indices Calculation

SIF retrieval algorithms are generally based on the Fraunhofer line depth (FLD) principle. To derive SIF from the spectral data, we used the 3FLD method [27], which is improved from the FLD method [28]. Studies have shown that the 3FLD algorithm is the most robust algorithm for detecting single-band SIF [29,30]. The algorithm assumes that chlorophyll fluorescence and reflectance spectra vary linearly around the absorption line band, and calculates SIF using one band within the Fraunhofer line and two bands located on both sides of the Fraunhofer line.
{ W left = ( λ right λ in / λ right λ left ) W right = ( λ in λ left / λ right λ left ) SIF = ( I left W left + I right W right ) L in I in ( L left W left + L right W right ) I left W left + I right W right I in
where Wleft and Wright are the weights of the left and right reference bands of the absorption line; λleft, λright, and λin are the wavelengths of bands to the left, right, and inside of the absorption band; Lleft, Lright and Lin are the vegetation canopy upwelling radiance values on the left, right and inside of the absorption line; Ileft, Iright and Iin refer to the incoming solar irradiance values on the left, right and inside of the absorption line, respectively.
Since no directly measured PAR data are available, a solar irradiance value between 645~800 nm was selected as a proxy of the PAR because of their significantly linear relationship [31,32].
PAR = 1.17 × S o l a r   i r r d i a n c e ( 645 ~ 800   nm )
The detailed calculation of APAR and SIFyield are described in the following equation (5) [31]. The red-edge normalized difference vegetation index (RNDVI) was used to approximate the fraction of APAR (fAPAR) [33].
RNDVI = ( R 750 R 705 ) / ( R 750 + R 705 )
{ f APRA = 1.33 × RRNDVI 0.15 APAR = PAR × f APAR SIF yield = SIF / APAR
where R750 and R705 are the canopy reflectance of the experimental sample at 750 nm and 705 nm.

2.4. Extraction Fluorescence Yield

2.4.1. ΦF Derivation Based on NIRvP

The canopy SIF signal can be decomposed into physiological and non-physiological signals [34]. According to the method (NIRvP approach) proposed by Kimm et al. (2021), NIRvP is used here as a substitute for the non-physiological signal contained in SIF, and ΦF, which can be estimated from NIRvP and SIF, is calculated as follows:
NIRvP = NIRv · PAR
where NIRv is an approximation of the near-infrared reflectance of vegetation. ΦF (unit: nm−1) is then derived using NIRvP (unit: µmol photon m−2 s−1) and calculated as follows [35]:
SIF = PAR · fAPAR chl · f esc · Φ F
f esc = NIRv / fAPAR chl
Φ F = SIF / NIRvP
where SIF is the far-red SIF at 760 nm (unit: mW m−2 sr−1 nm−1) and fesc (unit: sr−1) is the fraction of all SIF photons emitted from all leaves that escape from the canopy [36].

2.4.2. ΦF-r Derivation Based on NIRvR

The SIF dynamics at the canopy scale can be described as the product of three factors: APAR, ΦF, and canopy structure (fesc). Some studies have shown that SIF can respond early in stress, but the effects of fesc driven by canopy structure and sun-sensor geometry have not been clearly explained. If the fluorescence yield is not separated from the influence of fesc, the changes of fesc and spatial observation geometry may lead to deviation in understanding SIF dynamics.
According to Zeng et al. (2019), at a given sun-sensor geometry, the link between the sensor-observed far-red SIF and NIRvR of a canopy can be expressed using Equations (7) and (10) [35].
NIRvR can be expressed by Equation (10) as follows:
NIRvR = INIR · i 0 ,   green · w N · f esc = INIR · NIRv INIR · NDVI · NIR = NDVI · NIR rad
where INIR is the incoming irradiance at the bottom of the atmosphere for a certain NIR wavelength, NIRrad is the upwelling NIR radiance, wN is the NIR leaf albedo, i0,green is the canopy directional interceptance of green components with chlorophyll, and, considering the possible contribution of non-green leaves in the abiotic change process, i0,green is not the total interceptance of all vegetation components. By definition, the non-green components will not contribute to i0,green and NIRvR. In practice, NIRvR is calculated as NDVI×NIRrad, so that non-green components have non-zero NIR reflectance and radiance, but have near-zero NDVI and NIRvR. Therefore, NIRvR is minimally affected by non-green components.
fesc can be cancelled by dividing Equation (7) by Equation (10) as follows:
Φ F r = SIF / NIRvR · ( INIR / PAR ) · ( i 0 , green / fAPAR chl ) · w N
where INIR is stably correlated to the incoming PAR at a given ratio of diffuse radiation, fAPARchl is a good approximation of the directional interceptance i0,green by chlorophyll at different canopy structure/sun-sensor geometry on sunny days, and wN does not vary with leaf chlorophyll content and can be regarded as a constant term.
Therefore, ΦF-r is proportional to SIF/NIRvR, and SIF/NIRvR can represent the variability of ΦF-r.
Φ F r SIF / NIRvR

3. Results

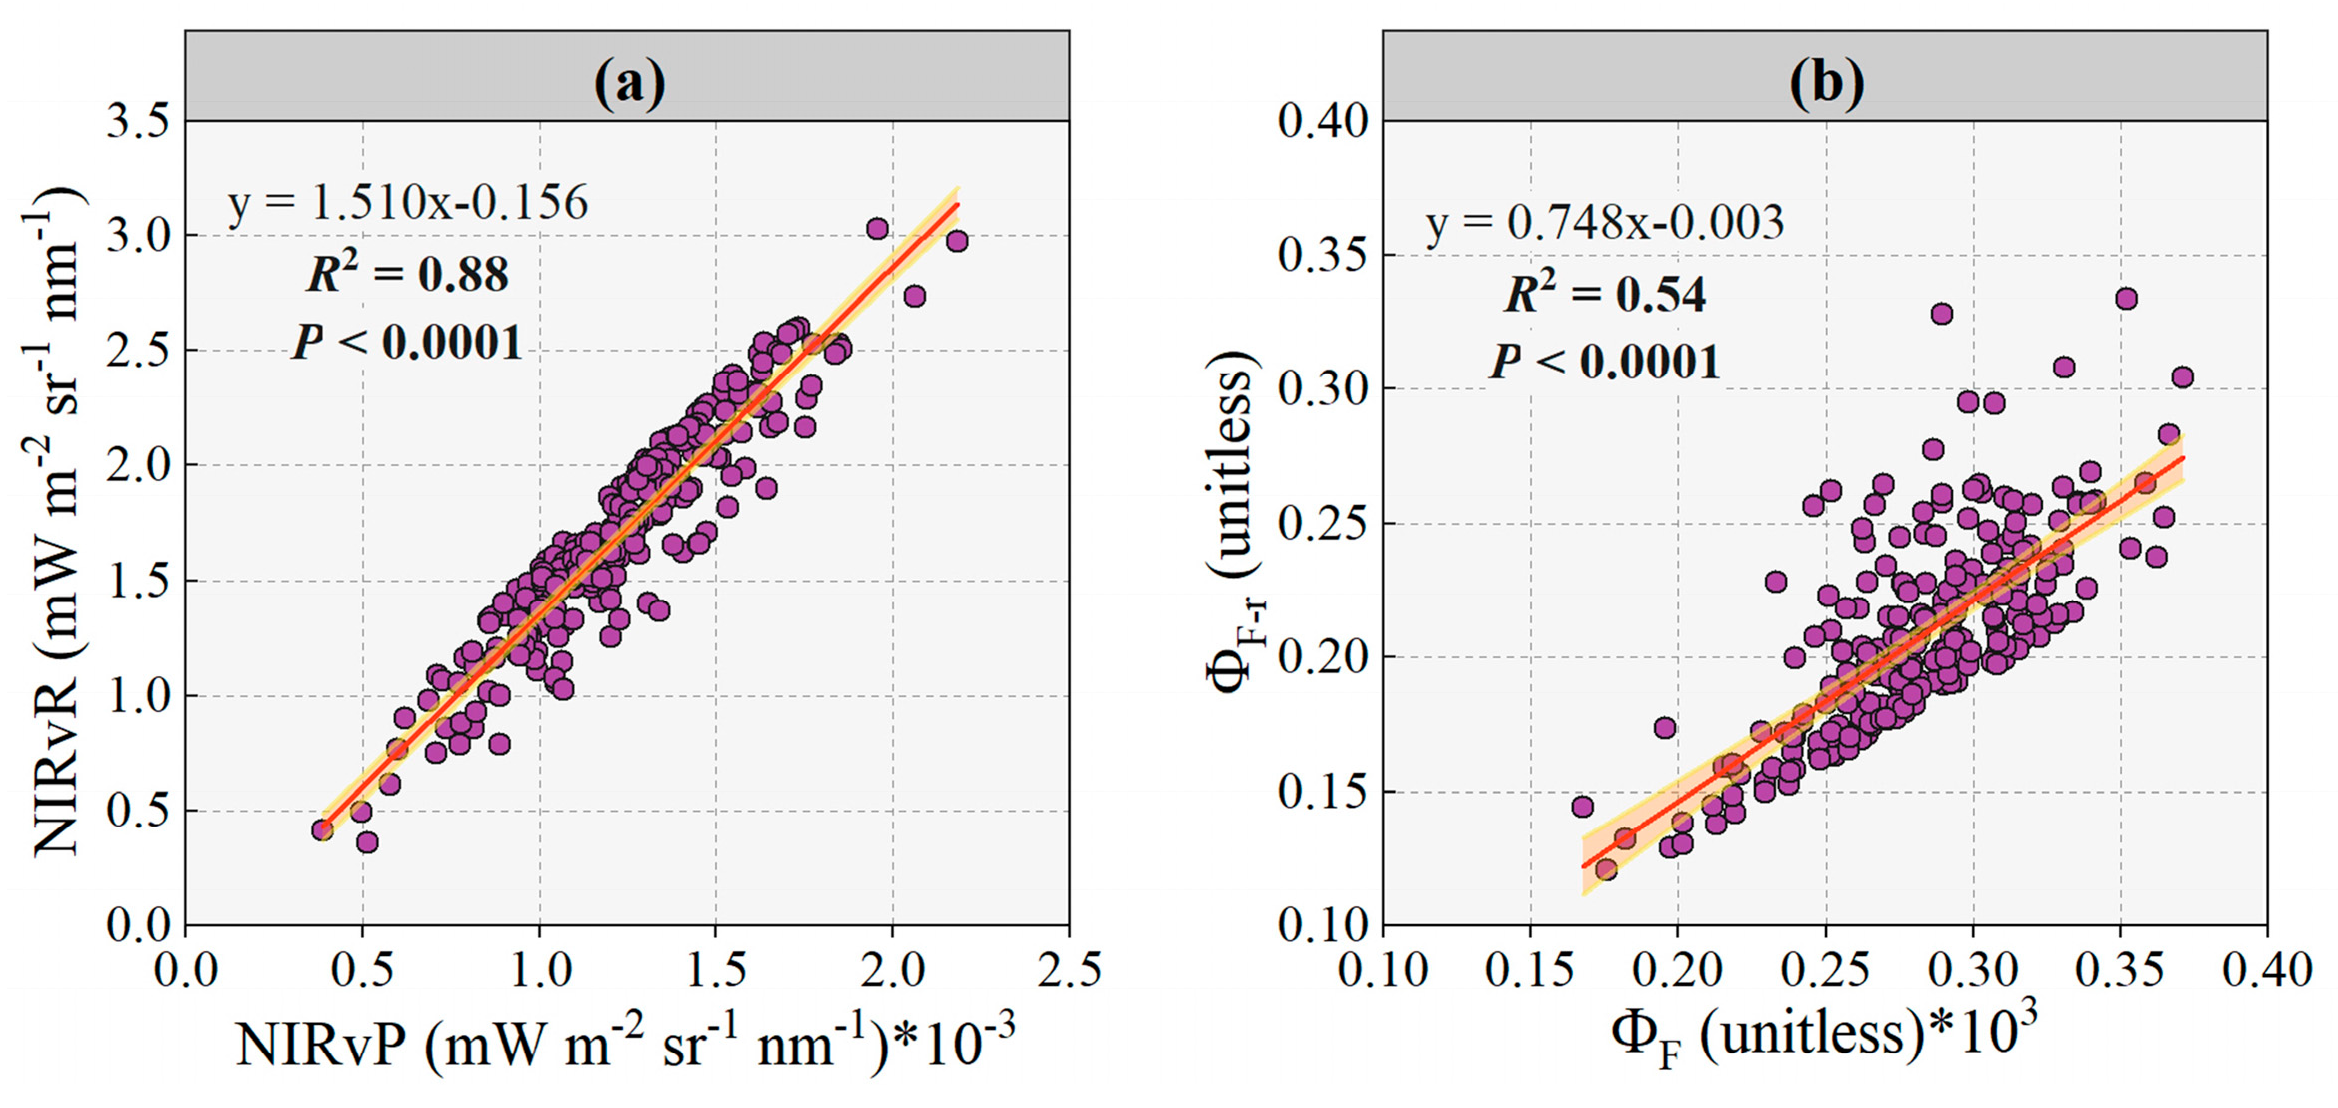
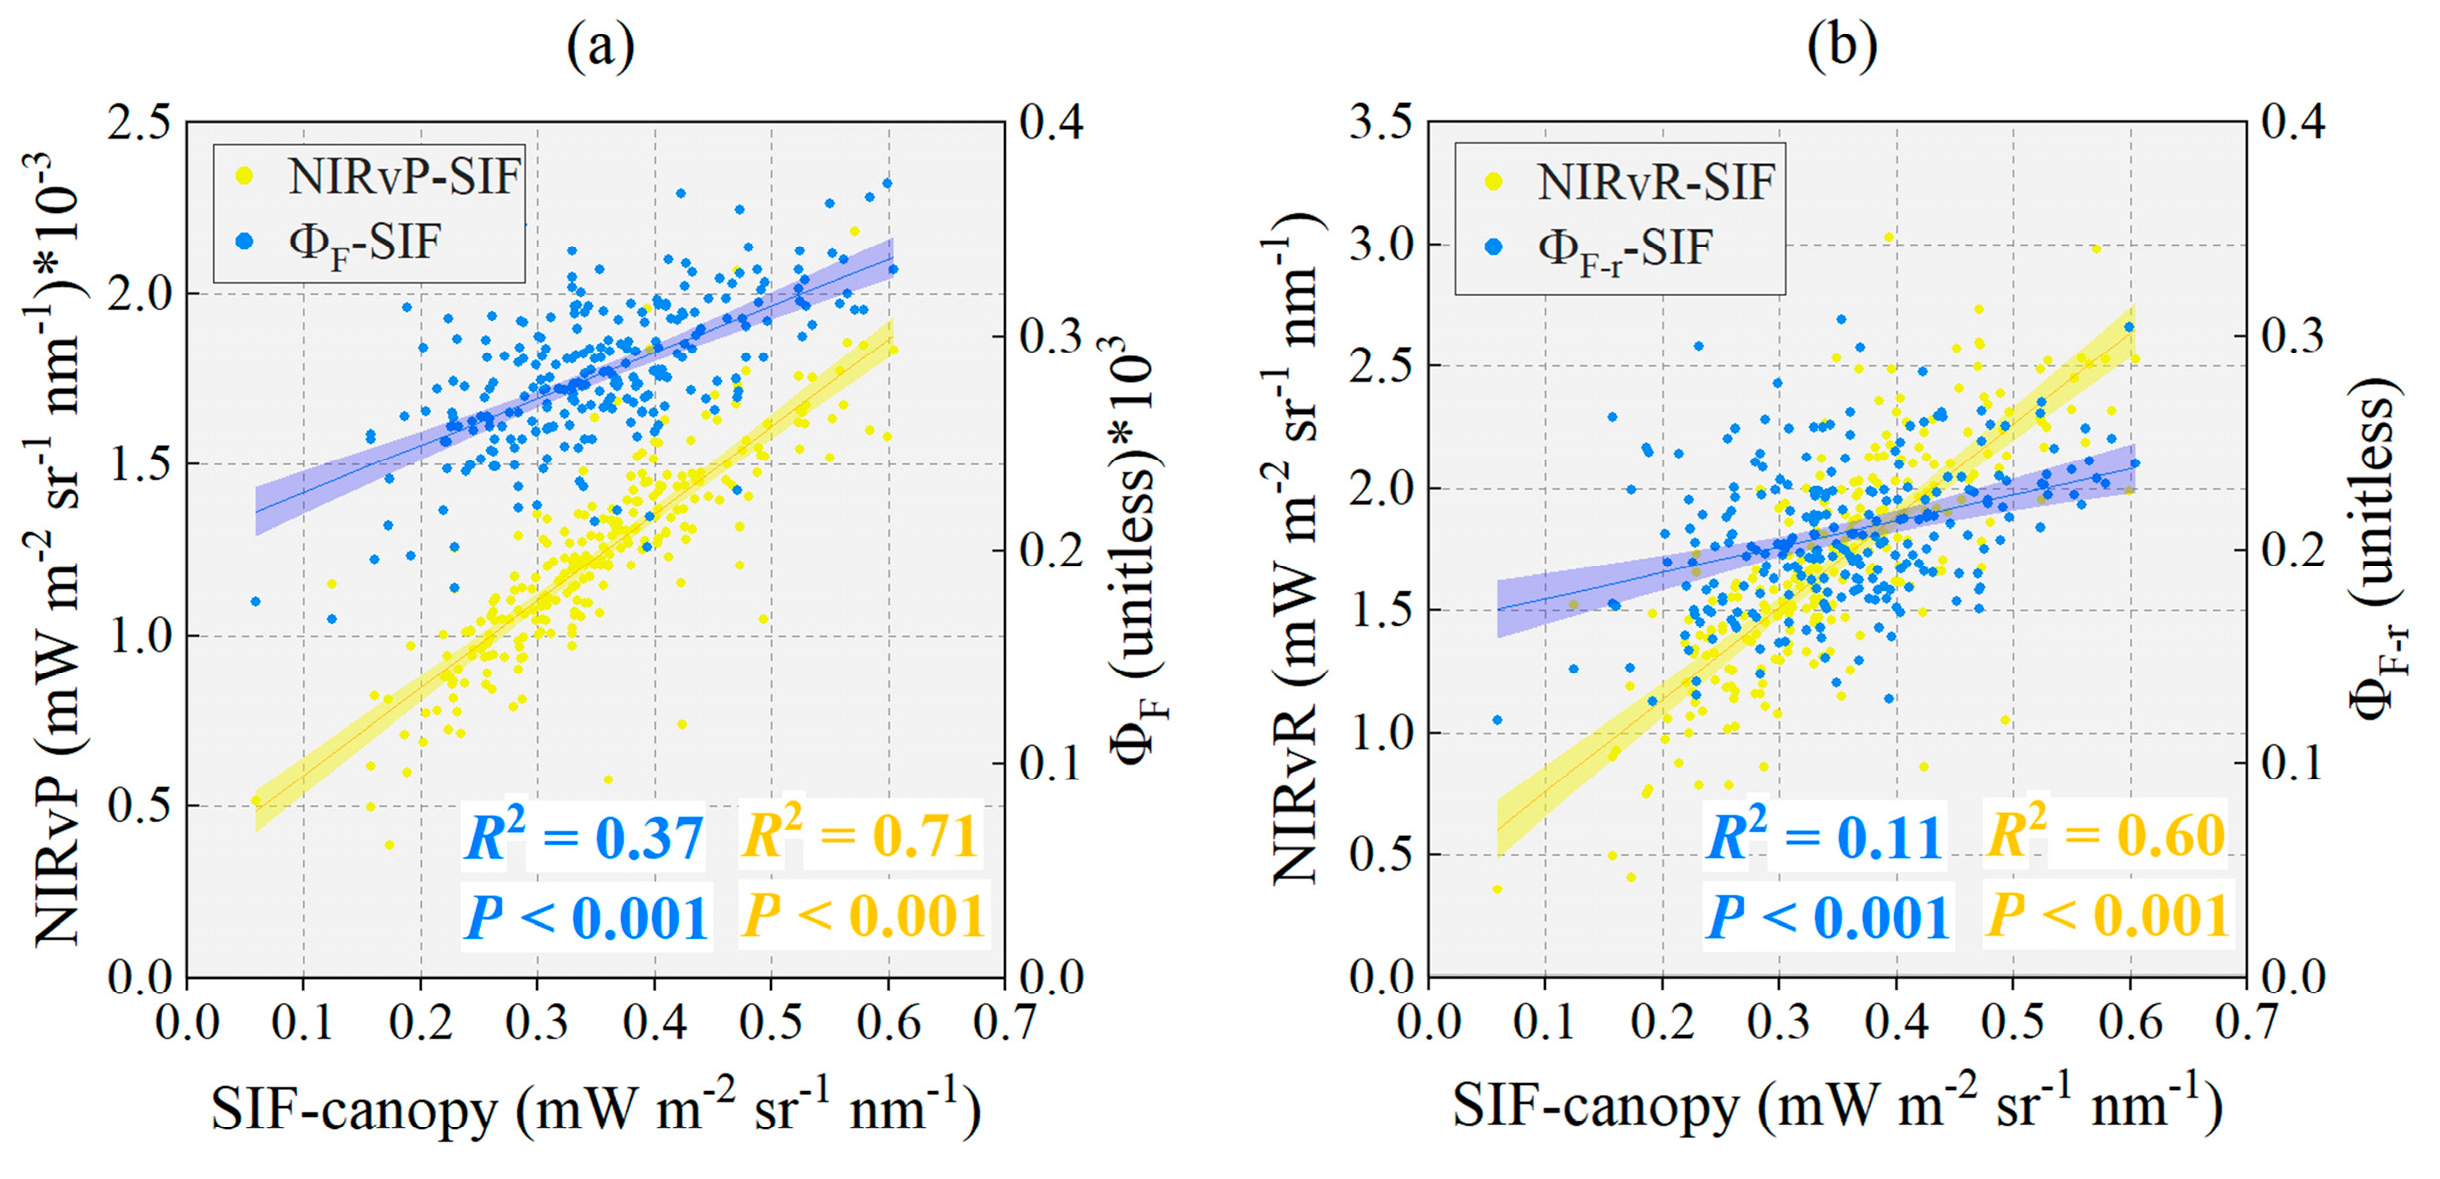
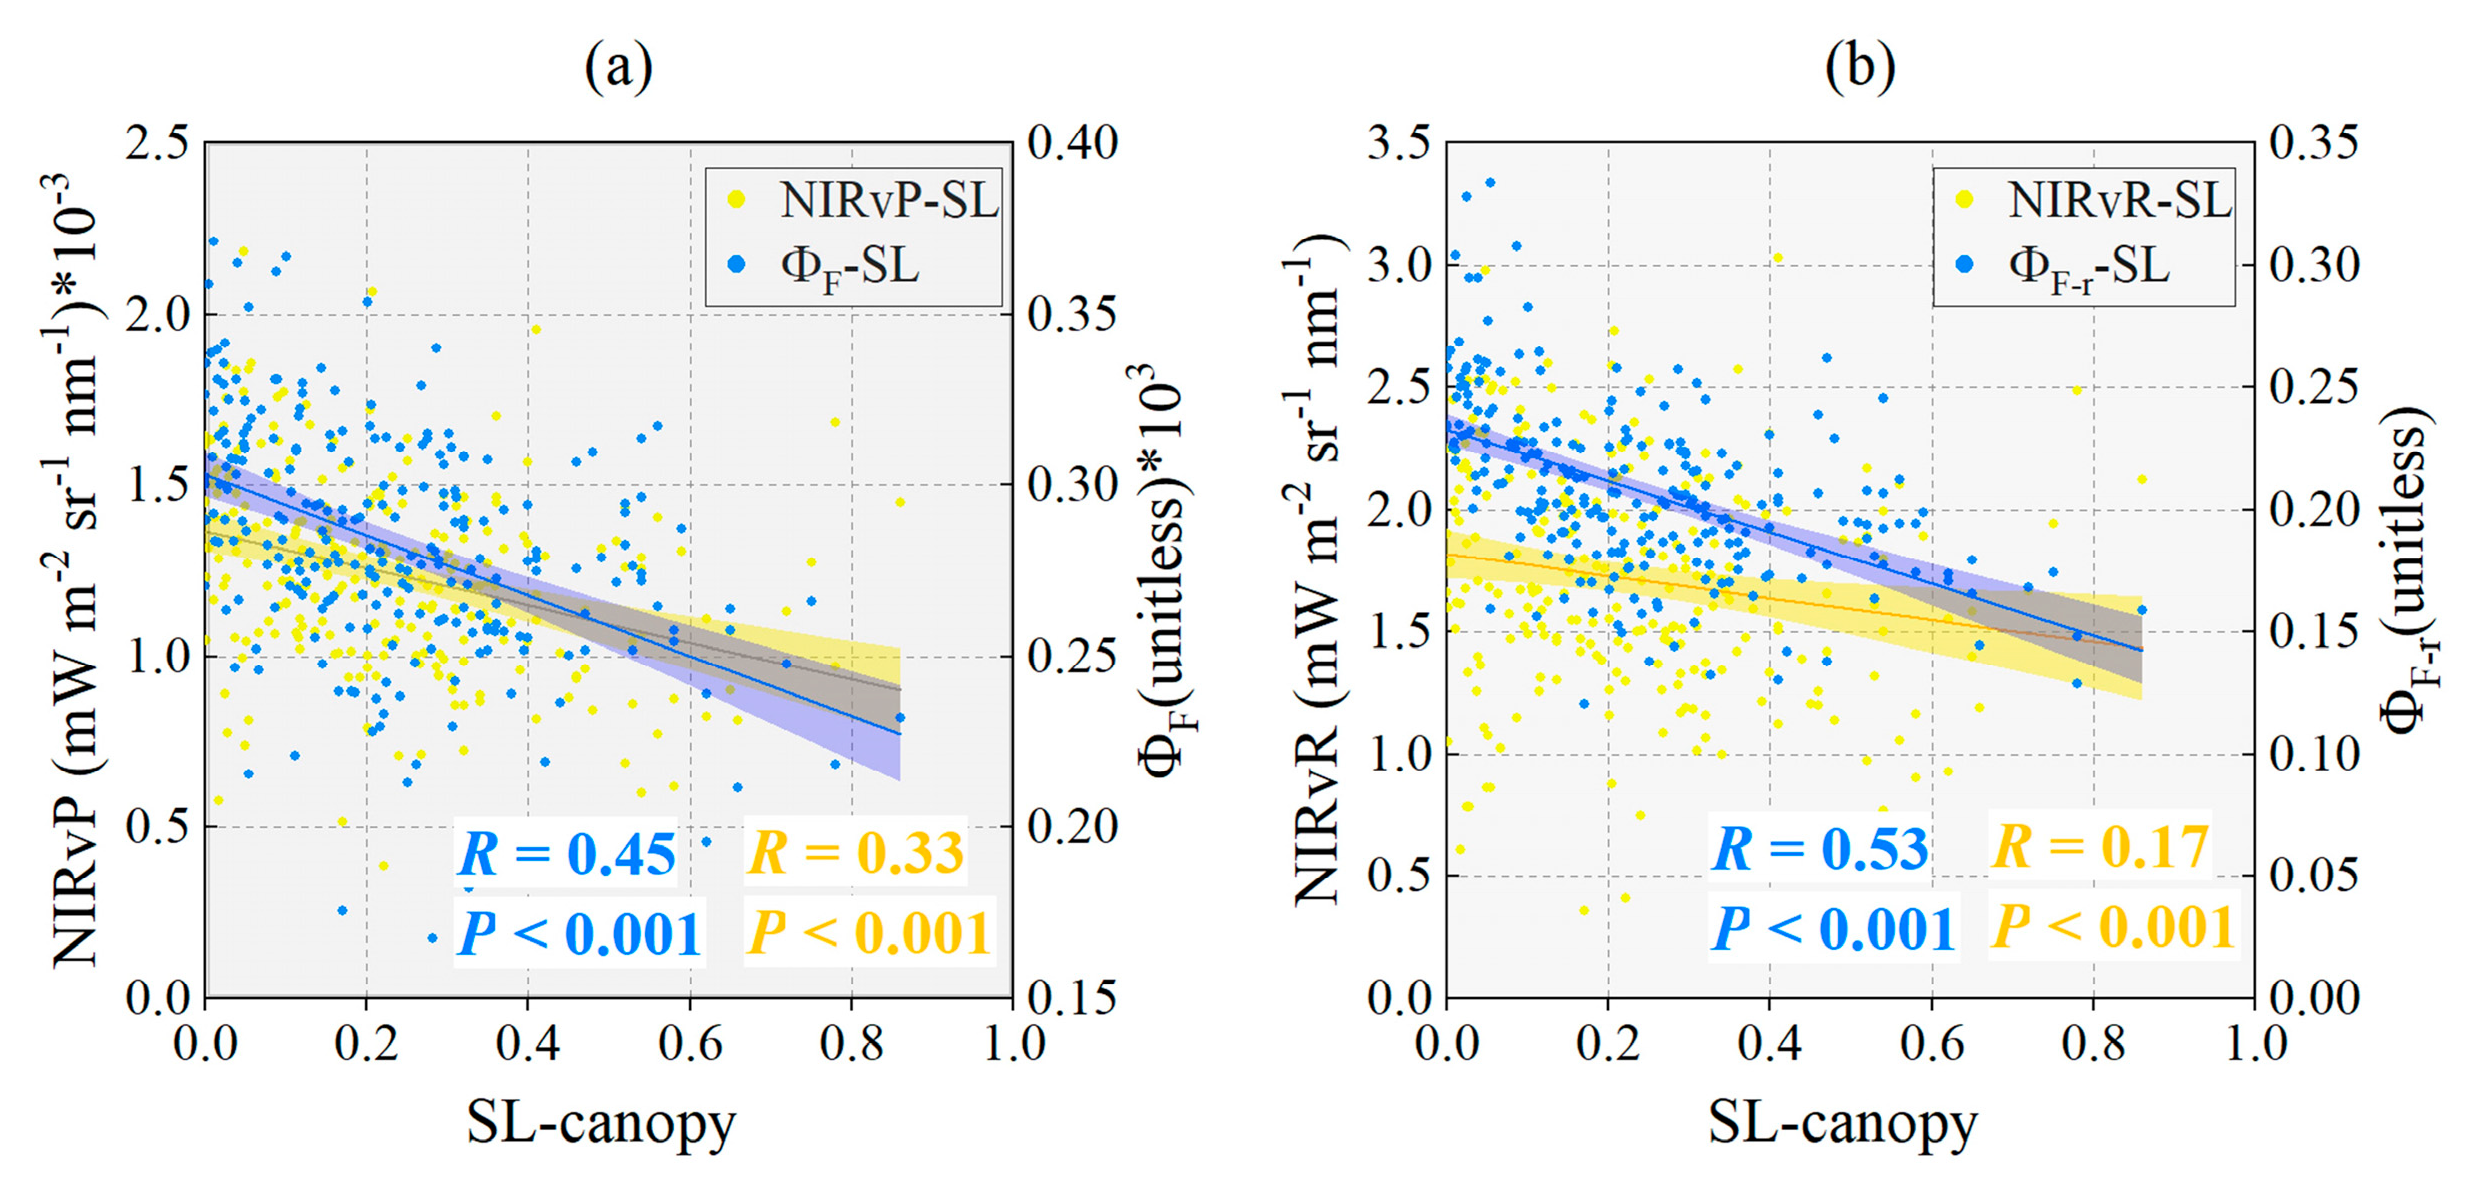
3.1. Evaluation Fluorescence Yield under Disease Stress Conditions Retrieved by NIRvP Approach and NIRvR Approach

We explored the correlation between NIRvP and NIRvR at the canopy scale using s Pearson correlation analysis and a t-test for regression coefficient significance, to evaluate whether SIF-derived ΦF and ΦF-r can quantify the effects of physiological stress on crops and detect disease stress.
The coefficient of determination (R2) between NIRvP and NIRvR for the canopy-scale experimental samples was 0.88 (Figure 3a). The comparison between ΦF obtained using the NIRvP approach and ΦF-r obtained using the NIRvR approach indicates strong covariance (R2 = 0.54, Figure 3b). These results show that the ΦF and ΦF-r derived from the two approaches are consistent in their overall trends and that both methods can effectively estimate or capture variation in the fluorescence yield.

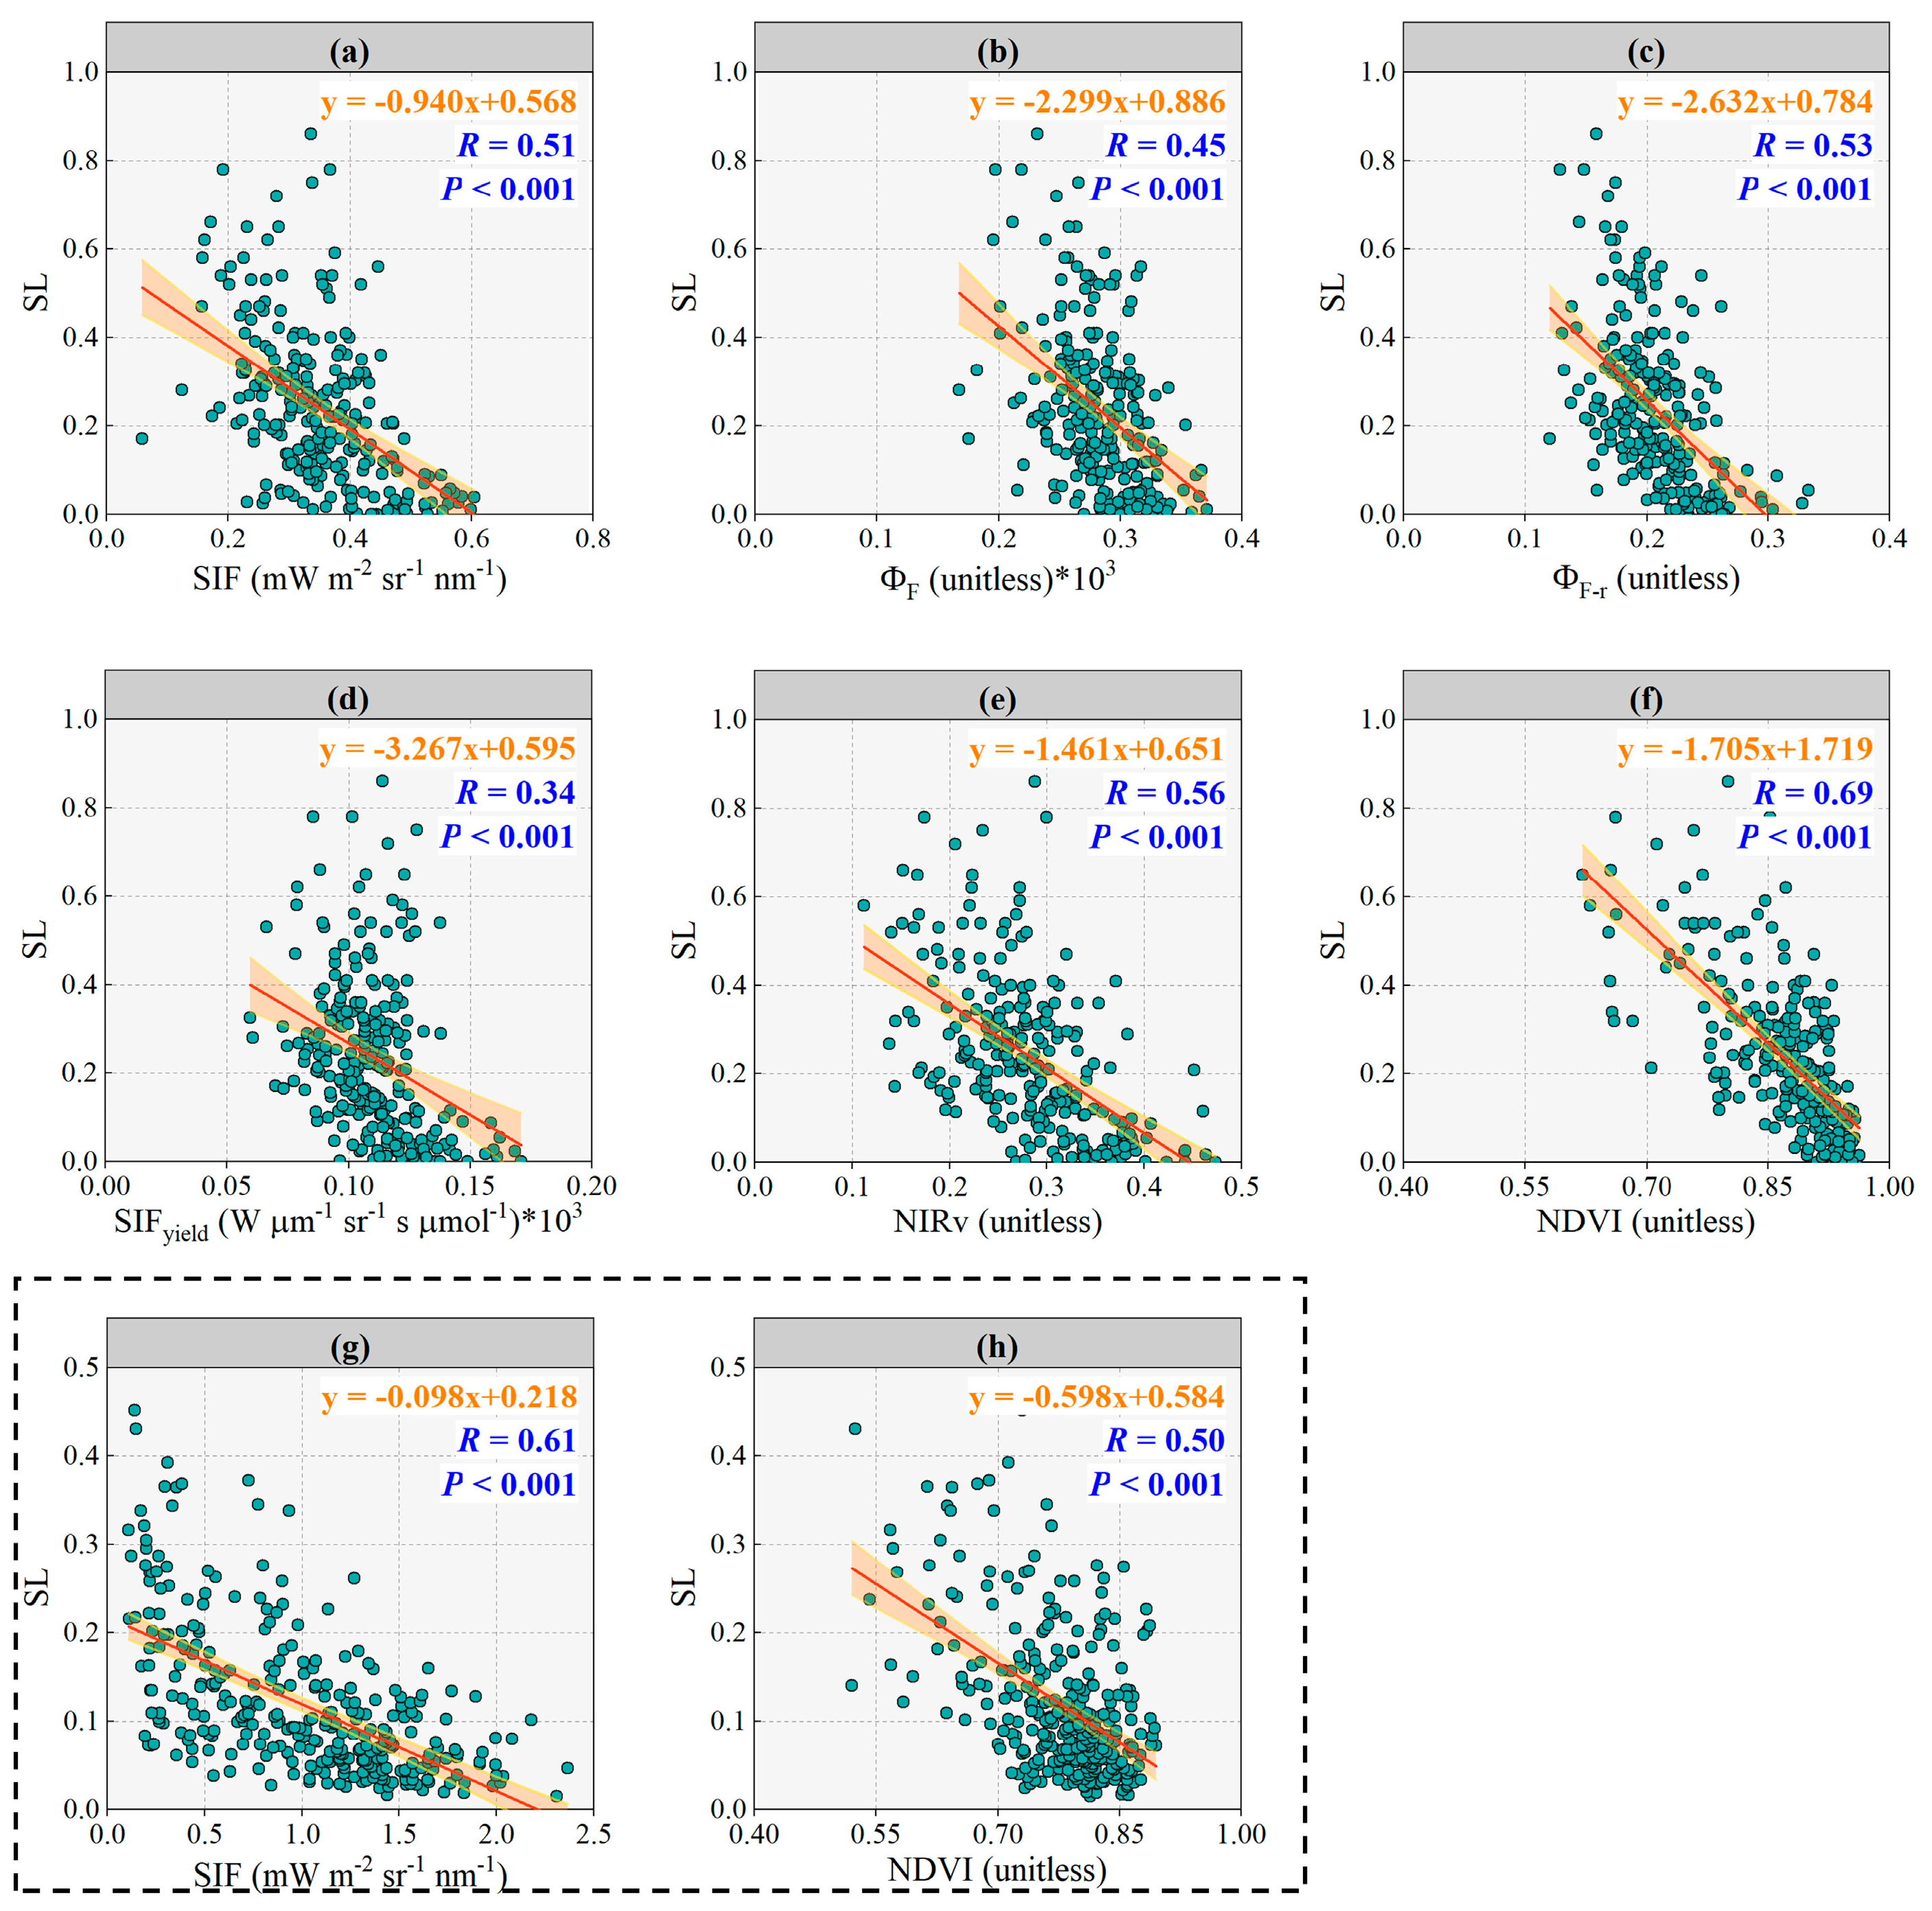
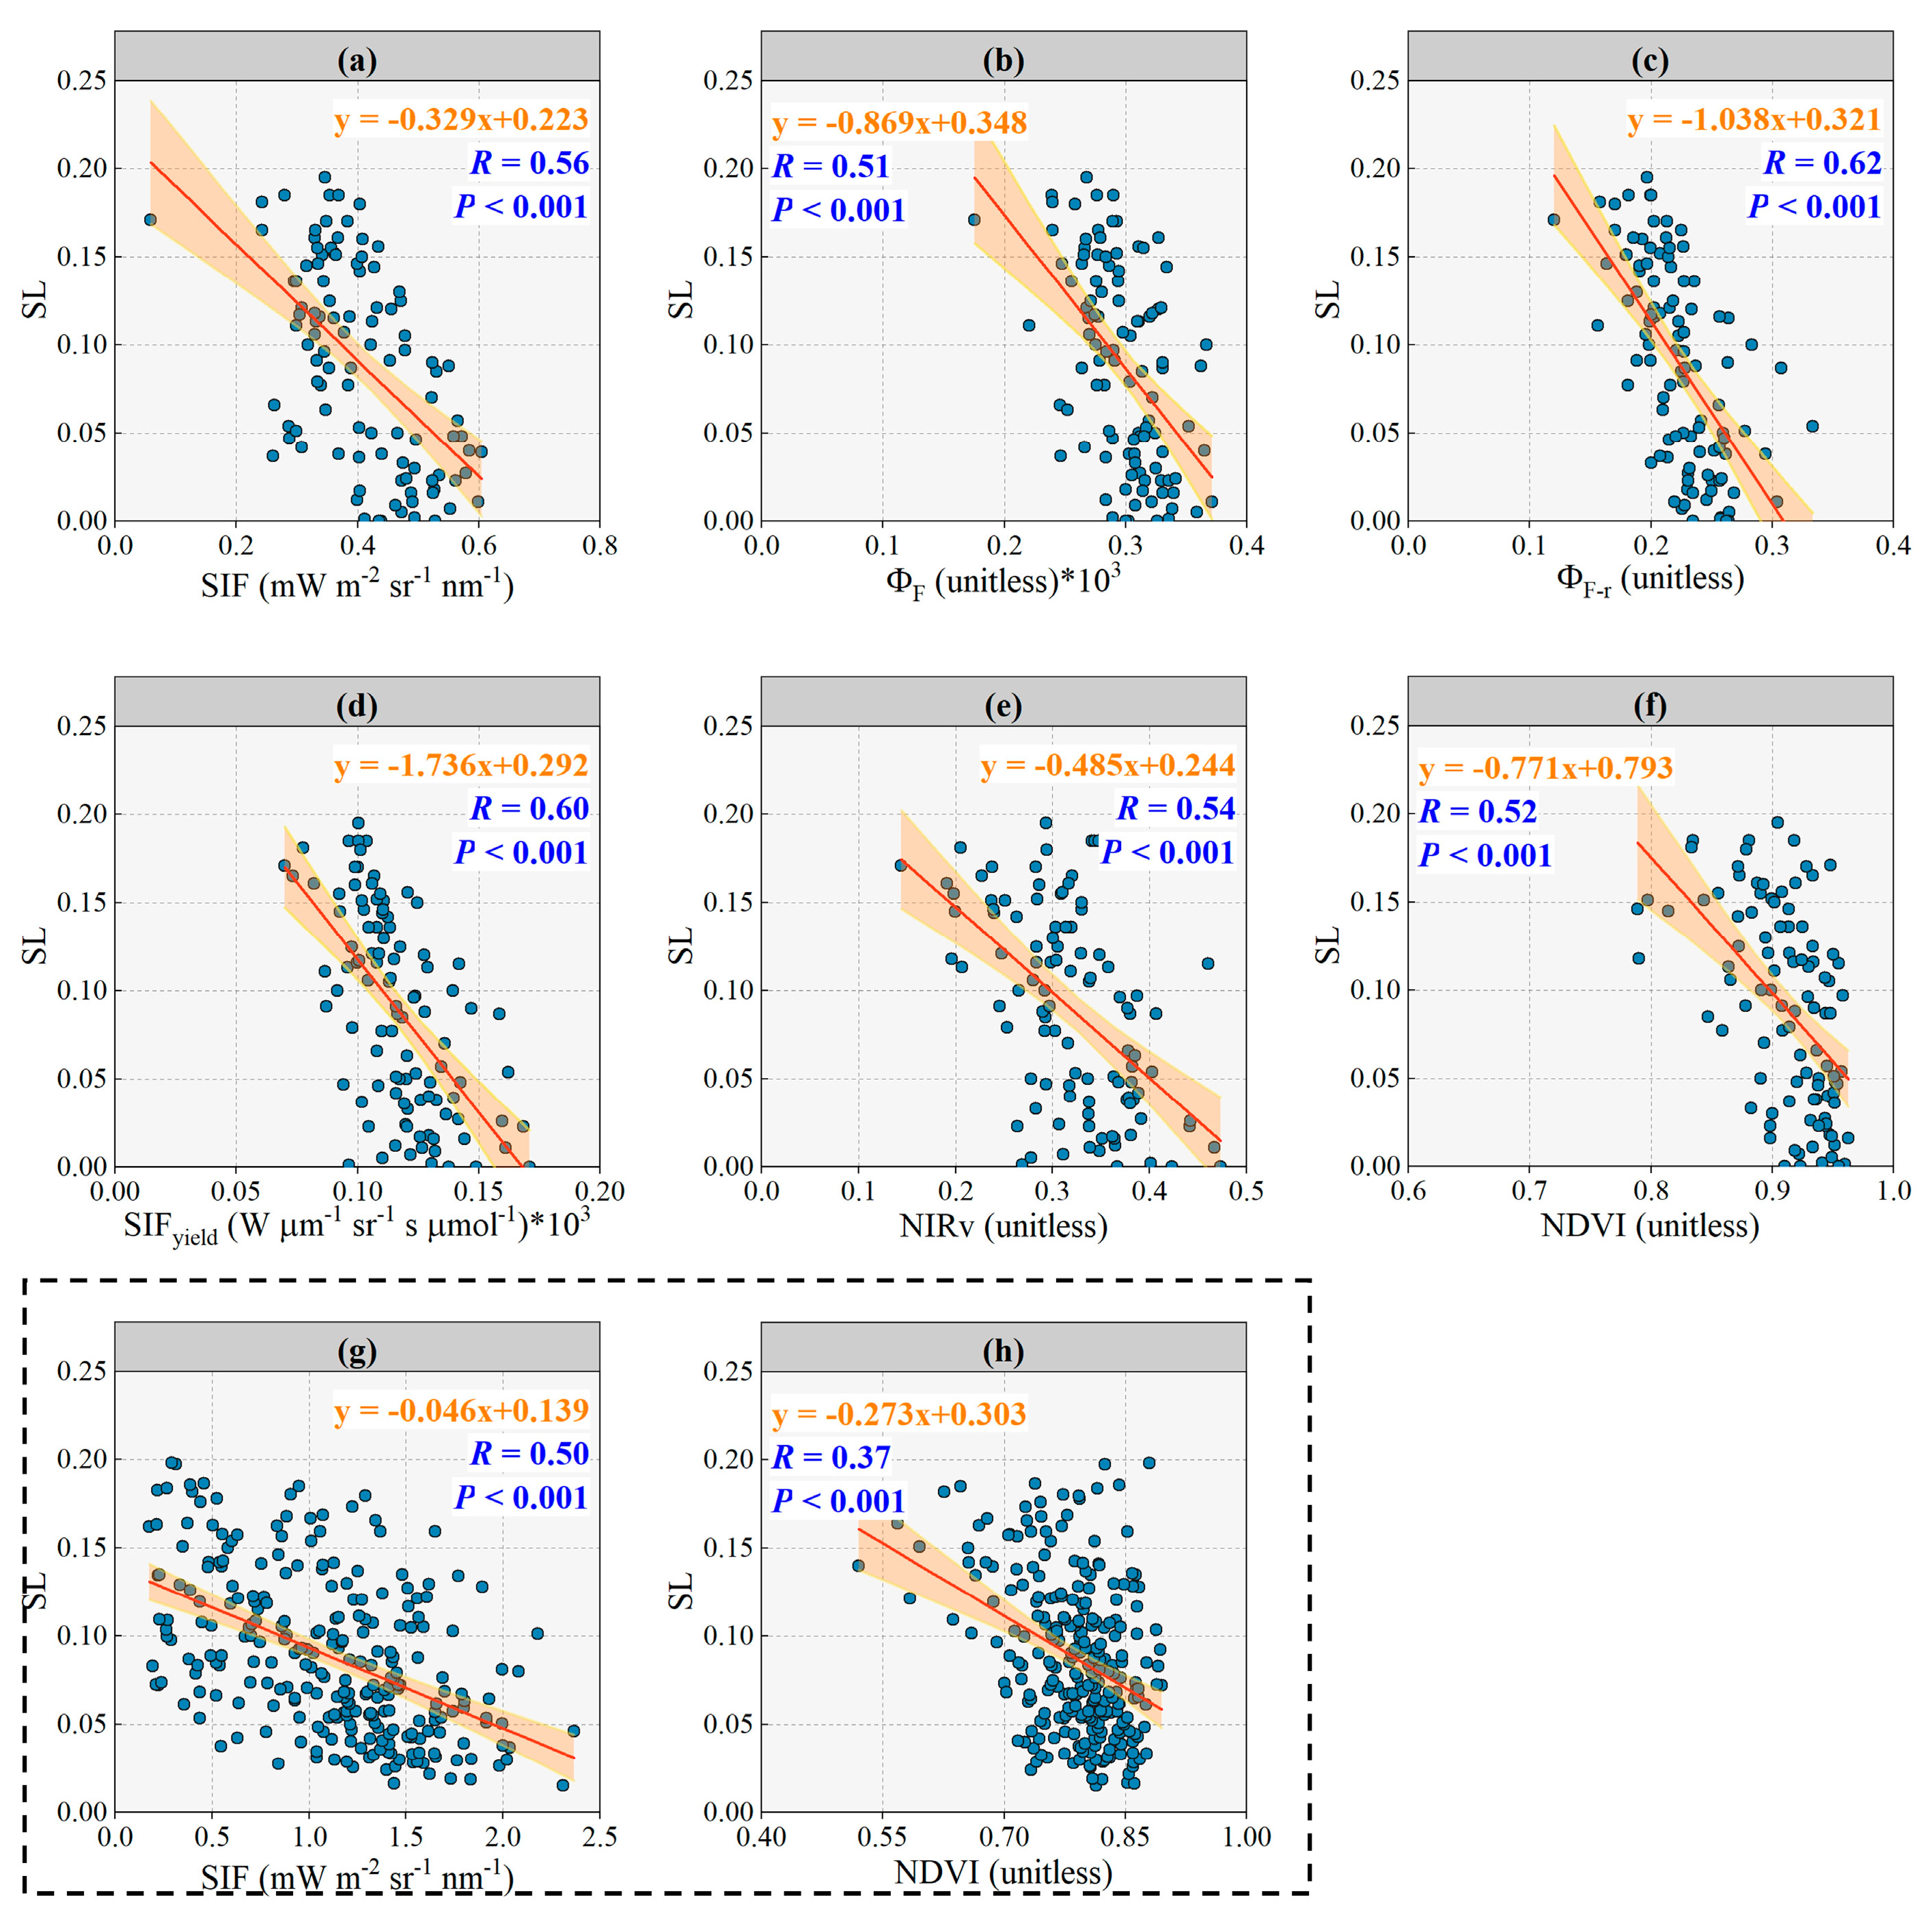
3.2. Response of SIF, ΦF, ΦF-r, SIFyield, NIRv and NDVI to Disease Severity Level

To explore to what extent SIF-derived ΦF and ΦF-r can quantify the effects of disease stress on crops, and whether SIF-derived physiological signals are more advantageous than SIF and reflectance spectroscopy-derived vegetation indexes in crop disease monitoring, we combined datasets (a comprehensive experiment without distinguishing the disease severity levels of the experimental samples) acquired on different dates for analysis, and assessed the association of each signal (ΦF, ΦF-r, SIF, SIFyield, NIRv and NDVI) with SL through the correlation coefficient (R) and P-value.
Figure 4a–f shows the responses of ΦF, ΦF-r, SIF, SIFyield, NIRv and NDVI to SL for canopy-scale experimental samples. Correlation analysis of canopy-scale data showed that the correlation between the six signals and SL was extremely significant (P < 0.001). The correlation between NDVI and SL was the strongest (R = 0.69, NDVI-SL), followed by NIRv, ΦF-r and SIF (R = 0.56, NIRv-SL; R = 0.53, ΦF-r-SL; R = 0.51, SIF-SL). Lastly, the response of ΦF and SIFyield to SL was lower than that of SIF (R = 0.45, ΦF-SL; R = 0.34, SIFyield-SL). These results suggest that under comprehensive experimental conditions, the NDVI, NIRv, ΦF-r and SIF have good physiological stress monitoring abilities and can monitor the SL of stripe rust. Correlation analysis was performed on SIF and NDVI with the SL of the experimental samples at the leaf scale (Figure 4g,h). Both signals were significantly correlated with SL (P < 0.001). However, the performance order of the SIF and NDVI responses to SL differed from that at the canopy scale. At the leaf scale, the correlation between SIF and SL was better than that between NDVI and SL (R = 0.61, SIF-SL; R = 0.50, NDVI-SL).
Overall, the six signals can monitor the physiological stress of crops. Under comprehensive experimental conditions, the sensitivity of both SIF and SIF-derived physiological signals to SL was lower than that of NDVI and NIRv at the canopy scale. This result differs from the results of some recent studies. The reason for these differences may be that the high SL of the experimental samples of the canopy-scale (moderate (20% ≤ SL < 40%) and severe (SL ≥ 40%) experimental samples accounted for 58.3% of the total number, Figure 3). Moreover, Puccinia striiformis continued to infect plant tissues; the canopy structure showed significant differences in the SL gradient of the samples, and the physiological and biochemical parameters and population biomass of the wheat changed [37]. Therefore, NDVI and NIRv were more sensitive to SL than SIF in the comprehensive experiment. The results at the leaf-scale also support this hypothesis to some extent. The experimental samples at the leaf observation scale had low SL, and SIF was more sensitive than NDVI to physiological variation in wheat plants under lightly diseased conditions (Figure 4g,h). Compared to wheat diseased plants with higher disease SL, we paid more attention to the sensitivity of the six signals to SL under three conditions: incubation period wheat plants that were infested with P. striiformis but had not yet become symptomatic, plants that had just become symptomatic, and plants in the early stages of disease. For remote-sensing monitoring of crop diseases, we focused on determining whether crop diseases can be detected and prevented early.

3.3. Response of SIF, ΦF, ΦF-r, SIFyield, NIRv and NDVI to SL with Lightly Diseased Status

To evaluate the applicability of the six signals, SIF, ΦF, ΦF-r, SIFyield, NIRv and NDVI, to the remote-sensing monitoring of stripe rust under light wheat infection, we analyzed experimental samples of light disease with SL < 20% [38]. We assessed the association of the six signals with SL under lightly diseased conditions, using NDVI as a reference as it had performed well in comprehensive experiments. The purpose of this process was first to evaluate whether the NDVI performed equally well in the early stages of the disease, and second to verify our speculation that the superior performance of NDVI was associated with higher SL values (see Section 3.2).
The data analysis of the light disease condition (Figure 5) differed from that of the comprehensive experiment (Figure 4). At the canopy scale, ΦF-r showed the strongest response to disease among the six physiological signals (R = 0.62, ΦF-r-SL). SIFyield had the next strongest correlation with SL, with a R of 0.60, followed by SIF and NIRv (R = 0.56, SIF-SL; R = 0.54, NIRv-SL). The correlation between ΦF and SL was the weakest, yet also presented a result approximating NDVI, with an R slightly lower than that of NDVI and SL (R = 0.51, ΦF-SL; R = 0.52, NDVI-SL). ΦF and SL also passed the significance test at a P < 0.001 level. At the leaf scale, the order of responses of SIF and NDVI to SL was the same as that in the comprehensive experiment (Figure 4g,h and Figure 5g,h), and the response of SIF to SL was much stronger than that of NDVI to SL. However, in the comprehensive experiment, the performance order of SIF and NDVI at the two scales was reversed (Figure 4a,f–h).
At the canopy scale, the performance order of each signal in response to SL under light disease conditions was ΦF < NDVI < NIRv < SIF < SIFyield < ΦF-r. The performance order of each signal in response to SL under comprehensive experimental conditions was SIFyield < ΦF < SIF < ΦF-r < NIRv < NDVI. The performance of ΦF-r was stable and accurate under both experimental conditions.

4. Discussion

4.1. Relative Contribution of Structural and Physiological Information to SIF Variability under Disease Stress Conditions

We tested the responses of structural (NIRvP and NIRvR) and physiological (ΦF and ΦF-r) information to SIF variability and analyzed their sensitivity to SL to explore the relative contribution of structural and physiological information to SIF variability under disease stress conditions.
Figure 6 shows the responses of structural (NIRvP and NIRvR) and physiological (ΦF and ΦF-r) information to SIF variability at the canopy observation scale. It can be seen that there is a strong correlation between the structural signal and SIF (R2 = 0.71, NIRvP-SIF; R2 = 0.6, NIRvR-SIF), where structural information plays a dominant role in explaining SIF variability. This result is consistent with the findings of Dechant et al. (2020) and Kimm et al. (2021) at the canopy scale [22,34]. Earlier studies showed that both leaf inclination and chlorophyll content can respond to environmental changes and stresses [39]. Changes in leaf inclination can have two causes: one is that the leaves droop when they lose a large amount of water, and the other is that the plant avoids strong light by reducing absorption, making the leaves more curled or upright [40]. Additionally, NIRvP is not only determined by canopy structure, but also by leaf pigments (nevertheless, leaf pigments only played a minor role compared to canopy structure) [41,42]. Therefore, SIF, which mixes structural information and physiological information, may present the same or opposite trend to ΦF in terms of stress responses. The opposite trend especially highlights the stress monitoring value of ΦF in practical applications. Compared to NIRvP and NIRvR, the physiological information contained in SIF is less pronounced in response to SIF variability (R2 = 0.37, ΦF-SIF; R2 = 0.11, ΦF-r-SIF, Figure 6), and only a small fraction of SIF variation is attributable to plant physiological information.
However, fluorescence yield (ΦF and ΦF-r) explains the physiological variability of plants under disease stress conditions (Figure 7). NIRvP and NIRvR, which characterize the structural and radiometric information of vegetation, presented a lower response to SL (R = 0.33, NIRvP-SL; R = 0.17, NIRvR-SL), while ΦF and ΦF-r, which characterize the physiological information, showed a much stronger response (R = 0.45, ΦF-SL; R = 0.53, ΦF-r-SL) to SL than NIRvP and NIRvR. This difference highlights the validity of the fluorescence yield estimated by the two methods in assessing physiological stress. This result also indicates that compared with NIRvP and NIRvR, ΦF and ΦF-r are more useful for quantifying the physiological variation of plants under disease stress. The relative importance of ΦF and ΦF-r was higher in the remote-sensing monitoring of wheat stripe rust.

4.2. The Performance of SIF and NDVI at Two Observation Scales and under Two Experimental Conditions

We found that SIF and NDVI showed different performance orders in response to SL under the two experimental conditions and observation scales. Under the comprehensive experimental conditions, at the canopy scale, NDVI showed the strongest response to SL, and the correlation between SIF and SL was lower than that of NDVI and SL. At the leaf scale, the correlation between SIF and SL was better than that of NDVI and SL. The response of SIF to SL was stronger than NDVI at both observation scales under lightly diseased conditions.
Under the comprehensive experimental conditions, the experimental samples with moderate and severe disease (SL ≥ 20%) exceeded 50% of the total sample. When the wheat infection was at a moderate or severe level (SL > 20%), P. striiformis continued to infect plant tissues; disease stress became the main factor affecting the canopy reflectance spectrum and wheat canopy structure, and the physiological and biochemical parameters, population biomass, and leaf inclination changed [43]. The normal growth of wheat was severely affected.
NDVI can characterize the growth status of vegetation while reflecting the population biomass of crops [44]. This may be the reason that the correlation between NDVI and SL was higher than that between SIF and SL for the experimental samples at the canopy scale under comprehensive experimental conditions. When wheat infection was light, disease spots were scattered and symptoms were not sufficiently obvious. The reflection spectrum signal has characteristic spectral sensitivity to crop population biomass, and can effectively reflect changes in canopy geometry and vegetation biochemical components [45]. However, it remains difficult to detect the disease status of stripe rust [46,47]. At this time, SIF containing crop physiological information can characterize the stress status of plants before changes in the canopy structure and leaf area index of wheat, which can better reflect the stress status of the crops [48]. The reflectance spectrum mainly indicates the concentration information for vegetation biochemical components and cannot directly reveal the physiological state of vegetation photosynthesis [49]. In contrast, SIF is sensitive to changes in plant photosynthetic physiology, which may lead to a reversed order of responses of SIF and NDVI to SL under comprehensive experimental conditions. This phenomenon explains why the correlation between SIF and SL was higher than that between NDVI and SL under light disease conditions. At the same time, this result confirms to a certain extent that the separation of physiological information in SIF has advantages for vegetation monitoring.

4.3. The Performance of Four Physiological Signals and Two Spectral Signals at the Canopy Scale

At the canopy scale, the sensitivities of the six signals to SL showed different performance orders under the two experimental conditions. The performance order of the correlation between each signal and SL under comprehensive experimental conditions was SIFyield < ΦF < SIF < ΦF-r < NIRv < NDVI. The performance order under lightly disease conditions was ΦF < NDVI < NIRv < SIF < SIFyield < ΦF-r.
SIF is a mixed signal affected by many factors, such as leaf physiology, canopy structure, and sun-sensor geometry. Under comprehensive experimental conditions, the response of ΦF and SIFyield to the physiological stress suffered by the crop at the canopy scale was lower than that of SIF. We speculate that this discrepancy may be due to the fact that SIF is more strongly affected by structural changes in the canopy when the severity of the disease is greater, which leads to an increase in the weight of structural information in the SIF signal when it is reflected in the severity of the disease. Consequently, the relative importance of ΦF decreases, and its response to SL decreases. SIFyield is obtained by removing APAR information (i.e., main structure information) from the SIF signal. Studies have shown that for soybean crops, SIFyield responds to canopy structure and physiological stress [22]. When wheat is in a moderate (20% < SL ≤ 40%) or severe (SL > 40%) disease state, with the accumulation of physiological stress, the canopy structural variation tends to be consistent with the physiological variation, and the weight of structural information contained in the SIF signal reflecting the disease severity increases, while the SIFyield that attenuates the influence of structural information will lead to incomplete interpretation of disease information; this may explain the lower response of SIFyield to SL. This phenomenon also indicates that SIF can capture crop responses to stress from both the canopy structure and plant physiology. NIRv is directly related to the number of near-infrared photons reflected by plants and serves as a comprehensive index, integrating the influence of leaf area, leaf orientation, and overall canopy structure, which is only affected by changes in the canopy structure [19]. NIRv minimizes the effect of soil reflectance on the retrieved reflectance values, which is insensitive to non-vegetation targets [20,50]. This may be the reason why NIRv performed better than SIF at higher levels of wheat disease severity.
Previous studies have shown that SIF has the ability to monitor crop diseases earlier than conventional vegetation indexes. However, based on changes in SIF, it is difficult to distinguish whether these changes occur in response to physiological stress or in response to structural information variation. Our results show that ΦF accounts for only a small fraction of SIF variability (Figure 6a) but is much more strongly responsive to the physiological stress conditions experienced by the crop than NIRvP (Figure 7a). Even so, the performance of ΦF under both experimental conditions was still at a low level. Kimm et al. (2021) proposed that NIRvP characterizes the structure and radiation information of crops, and that ΦF derived from SIF characterizes the physiological influence on the crops. The authors verified this conjecture using a canopy warming experiment [51]. In contrast, our results are based on the effects of naturally occurring stripe rust stress on winter wheat, which may differ from the stress coping mechanisms of the target plants under artificial treatments. Additionally, our evaluation considered the responses of ΦF-r and ΦF to SL under different growth cycles of wheat. The results of the evaluation indicate that ΦF-r estimated by NIRvR approach has a well-defined response to the SL of stripe rust disease.
Under light disease conditions, due to the small SL values of the experimental samples, the reflectance spectrum cannot directly reveal the physiological state of vegetation photosynthesis [49], making it difficult to achieve early detection of crop diseases based only on the reflectance spectrum. Compared to the reflectance spectrum, the physiological information of SIF is clearer. The chlorophyll fluorescence spectrum can reflect physiological changes caused by disease earlier and more sensitively than the reflectance spectrum [52], and the physiological status and stress state of vegetation can be understood through the fluorescence spectrum [53]. This is also the reason that the response of SIF to SL under light disease conditions was found to be stronger than that of NIRv and NDVI. We found that SIFyield accurately captured the physiological variation in wheat at the early stage of disease stress. Although SIFyield is normalized by APAR, the SIFyield may still carry both canopy structural information and plant physiological signals [54]. When wheat canopy structure is at a relatively consistent level (SL < 20%), the physiological variation in the crop may result in significant differences in SIFyield. This may be the reason for the excellent performance of SIFyield under lightly disease conditions. As seen in Figure 6 and Figure 7, ΦF and ΦF-r isolated from the SIF signal explained the variability of SIF only to a small extent, but quantified the physiological variability of plants under stress conditions to a large extent. Data analysis of lightly diseased samples showed that ΦF-r better reflected the physiological response of winter wheat to disease stress than SIF, and had the highest sensitivity to SL. The ΦF-r estimated using the NIRvR approach provided a clear response of the leaf physiological to stress. This response could be minimally affected by PAR, sun-sensor geometry, and diurnal or seasonal variations in structural information [24]. The advantage of this approach is that changes in SIF can be clearly attributed to different factors. Despite large uncertainties, ΦF-r has a stronger ability to monitor stress under disease stress conditions than SIF and can detect plant stress symptoms on a shorter time scale than NIRvR. Among the six signals, ΦF-r was more stable and stronger in its ability to monitor crop disease stress. Since ΦF-r mainly contains physiological information, abiotic changes and disease stress may lead to changes in crop canopy structure and leaf optical properties. Therefore, we suggest not relying solely on ΦF or ΦF-r for stress monitoring, but instead using a combination of SIF, SIFyield, NIRV, and fluorescence yield to make complementary contributions to crop disease stress monitoring.

4.4. Applicability of SIF-Derived Physiological Signals for Monitoring Other Crops and Stresses

Our results show that at the early stage of wheat infected by stripe rust, ΦF-r estimated using the NIRvR approach showed a superior ability to monitor crop disease stress than SIF and reflectivity spectrum signals. SIF-derived physiological signals are more sensitive to physiological variation in plants than structural and radiation information. Additionally, the separation of physiological information from SIF helped us more clearly observe physiological stress effects without superimposing relevant structural effects. However, wheat has some differences from other crops, so we cannot directly apply the results of wheat studies to other crops.
Recent studies have different explanations for the contribution of fluorescence yield to SIF. One explanation is that physiological signals have a small contribution to SIF variation and the physiological signals relatively constant throughout their datasets [55,56,57]; the other is that ΦF or ΦF-r has strong sensitivity to the stresses suffered by the crop [24,51]. The first explanation may be related to the fact that previous studies observed crops that were not usually subjected to stress, resulting in observed physiological signals that did not change significantly and were relatively constant in value. In 2020, Dechant et al. showed that the estimated fluorescence yields of two crops, maize and rice, were almost completely uncorrelated with light use efficiency (LUEP) at seasonal and daily scales, except for wheat [34]. In the authors’ experiments, the experimental results for rice and maize fit the strong form of the relationship between fesc and LUEP much better than the relationship between ΦF and LUEP; wheat satisfies this hypothesis, but only to a weaker extent. The ΦF of wheat showed different states at different time scales. It was fairly stable at seasonal scales, but showed a marked decrease at stages of wheat senescence, which coincided with a decrease in chlorophyll content [58]. The ΦF of wheat was more strongly correlated with LUEP than fesc, only at daily scales. Therefore, although light acclimation studies in sugar beet fields, water stress studies in maize belts, sugar beet fields and potato crops, and high temperature stress studies in oilseed rape, barley, soybean, and wheat fields have shown the monitoring advantages of physiological signals for different crops and different stresses [22,24,25,51], specific analysis is still required when monitoring remote sensing for specific crops.

4.5. Prediction and Warning of Wheat Stripe Rust

In this study, the SIF signals and spectral signals of infected wheat were analyzed on the basis of the known occurrence of stripe rust. The purpose of this analysis was to study the characteristics of various signals under disease stress conditions and assess the applicability of each signal at different stress stages to enable farm management to make timely and appropriate management decisions. However, the occurrence of wheat stripe rust is by nature a stochastic event, and its degree of occurrence is closely related to factors such as the crop growth period, the amount of fungal sources, temperature, humidity and precipitation. Existing studies usually use meteorological data combined with a remote-sensing image of a single date to predict diseases [15,59,60]. The meteorological data and remotely sensed observations were combined with crop characteristics and habitat traits to simulate the probability of crop disease occurrence. By feature selection of four meteorological factors, including precipitation, temperature, solar radiation, and humidity, and two remote-sensing features including visible band reflectance and near-infrared band reflectance, a disease risk map was constructed to depict the approximate spatial distribution of crop diseases and their temporal dynamics in the study area. However, wheat stripe rust occurs almost throughout the wheat growth period. In actual field management, wheat phenology may also be different in the same period due to factors such as climate, planting and management. Changes in wheat growth conditions caused by phenological differences may cause greater interference to physiological changes caused by stripe rust stress. The physiological signals derived from SIF are sensitive to the physiological variation of crops in the early stage of disease occurrence, and have the potential to be the sensitive characteristics of diseases. Therefore, combining meteorological factors, habitat factors, physiological signals more sensitive to physiological variations caused by diseases, crop growth and other factors to construct a wheat stripe rust prediction model, or using other methods to reduce the impact of phenological differences on prediction accuracy, may be the basis of subsequent crop disease-prediction research.

5. Conclusions

Overall, we found strong covariance between NIRvP and NIRvR at the canopy scale. Additionally, ΦF and ΦF-r obtained using the two methods were consistent in their overall trends; they explained the variability of SIF only to a small extent, but quantified the physiological variability of plants under stress conditions to a large extent. In the case of a high level of crop disease severity, NDVI showed advantages in disease monitoring. In the early stages of crop disease, which we pay more attention to, compared with SIF and reflectivity spectrum signals, ΦF-r showed superior ability to monitor crop physiological stress and was more sensitive to plant physiological variation. At the leaf-scale, the response of SIF to physiological stress was stronger than that of NDVI. These results verify the potential of ΦF-r estimated using the NIRvR approach to understand the physiological variation of crops to different environmental conditions, understand and the stress coping mechanisms of crops and provide new ideas for quantifying the effects of disease stress on crops. With the continuous expansion of the scope and research scales of SIF applications, our future studies will emphasize canopy-scale and leaf-scale SIF and explore finer signals; this will enable us to avoid misinterpretation of the canopy signal as much as possible, and help us observe and understand the responses and changing relationships of SIF and its internal signals under different environments.

Author Contributions

Conceptualization, writing—original draft preparation, visualization, K.D.; writing—review and editing, K.D., Y.Z., J.H. and X.J.; resources, project administration and funding acquisition, J.H. and X.J.; investigation, K.D., Q.Y. and B.L. All authors have read and agreed to the published version of the manuscript.

Funding

This research was funded by National Natural Science Foundation of China, grant number 41971383; 42171394.

Data Availability Statement

Due to the nature of this research, participants of this study did not agree for their data to be shared publicly, so supporting data is not available.

Conflicts of Interest

The authors declare no conflict of interest.

References

  1. Chen, X. Pathogens Which Threaten Food Security: Puccinia Striiformis, the Wheat Stripe Rust Pathogen. Food Secur. 2020, 12, 239–251. [Google Scholar] [CrossRef]
  2. Huang, W.; Lamb, D.W.; Niu, Z.; Zhang, Y.; Liu, L.; Wang, J. Identification of Yellow Rust in Wheat Using In-Situ Spectral Reflectance Measurements and Airborne Hyperspectral Imaging. Precis. Agric. 2007, 8, 187–197. [Google Scholar] [CrossRef]
  3. Schwessinger, B. Tansley Insight Fundamental Wheat Stripe Rust Research in The. New Phytol. 2016, 213, 1625–1631. [Google Scholar] [CrossRef] [PubMed]
  4. He, R.; Li, H.; Qiao, X.; Jiang, J. Using Wavelet Analysis of Hyperspectral Remote-Sensing Data to Estimate Canopy Chlorophyll Content of Winter Wheat under Stripe Rust Stress. Int. J. Remote Sens. 2018, 39, 4059–4076. [Google Scholar] [CrossRef]
  5. Lichtenthaler, H.K.; Buschmann, C.; Rinderle, U.; Schmuck, G. Application of Chlorophyll Fluorescence in Ecophysiology. Radiat. Environ. Biophys. 1986, 25, 297–308. [Google Scholar] [CrossRef]
  6. Song, L.; Guanter, L.; Guan, K.; You, L.; Huete, A.; Ju, W.; Zhang, Y. Satellite Sun-Induced Chlorophyll Fluorescence Detects Early Response of Winter Wheat to Heat Stress in the Indian Indo-Gangetic Plains. Glob. Chang. Biol. 2018, 24, 4023–4037. [Google Scholar] [CrossRef] [Green Version]
  7. Deng, J.; Zhou, H.; Lv, X.; Yang, L.; Shang, J.; Sun, Q.; Zheng, X.; Zhou, C.; Zhao, B.; Wu, J.; et al. Applying Convolutional Neural Networks for Detecting Wheat Stripe Rust Transmission Centers under Complex Field Conditions Using RGB-Based High Spatial Resolution Images from UAVs. Comput. Electron. Agric. 2022, 200, 107211. [Google Scholar] [CrossRef]
  8. Guan, K.; Berry, J.A.; Zhang, Y.; Joiner, J.; Guanter, L.; Badgley, G.; Lobell, D.B. Improving the Monitoring of Crop Productivity Using Spaceborne Solar-Induced Fluorescence. Glob. Chang. Biol. 2016, 22, 716–726. [Google Scholar] [CrossRef]
  9. Hao, D.; Asrar, G.R.; Zeng, Y.; Yang, X.; Li, X.; Xiao, J.; Guan, K.; Wen, J.; Xiao, Q.; Berry, J.A.; et al. Potential of Hotspot Solar-Induced Chlorophyll Fluorescence for Better Tracking Terrestrial Photosynthesis. Glob. Chang. Biol. 2021, 27, 2144–2158. [Google Scholar] [CrossRef]
  10. Li, X.; Xiao, J.; Kimball, J.S.; Reichle, R.H.; Scott, R.L.; Litvak, M.E.; Bohrer, G.; Frankenberg, C. Synergistic Use of SMAP and OCO-2 Data in Assessing the Responses of Ecosystem Productivity to the 2018 U.S. Drought. Remote Sens. Environ. 2020, 251, 112062. [Google Scholar] [CrossRef]
  11. Sun, Y.; Fu, R.; Dickinson, R.; Joiner, J.; Frankenberg, C.; Gu, L.; Xia, Y.; Fernando, N. Drought Onset Mechanisms Revealed by Satellite Solar-Induced Chlorophyll Fluorescence: Insights from Two Contrasting Extreme Events. J. Geophys. Res. Biogeosciences 2015, 120, 2427–2440. [Google Scholar] [CrossRef] [Green Version]
  12. Liu, L.; Guan, L.; Liu, X. Directly Estimating Diurnal Changes in GPP for C3 and C4 Crops Using Far-Red Sun-Induced Chlorophyll Fluorescence. Agric. For. Meteorol. 2017, 232, 1–9. [Google Scholar] [CrossRef]
  13. Miao, G.; Guan, K.; Suyker, A.E.; Yang, X.; Arkebauer, T.J.; Walter-Shea, E.A.; Kimm, H.; Hmimina, G.Y.; Gamon, J.A.; Franz, T.E.; et al. Varying Contributions of Drivers to the Relationship Between Canopy Photosynthesis and Far-Red Sun-Induced Fluorescence for Two Maize Sites at Different Temporal Scales. J. Geophys. Res. Biogeosciences 2020, 125, e2019JG005051. [Google Scholar] [CrossRef] [Green Version]
  14. Ruan, C.; Dong, Y.; Huang, W.; Huang, L.; Ye, H.; Ma, H.; Guo, A.; Sun, R. Integrating Remote Sensing and Meteorological Data to Predict Wheat Stripe Rust. Remote Sens. 2022, 14, 1221. [Google Scholar] [CrossRef]
  15. Zheng, Q.; Ye, H.; Huang, W.; Dong, Y.; Jiang, H.; Wang, C.; Li, D.; Wang, L.; Chen, S. Integrating Spectral Information and Meteorological Data to Monitor Wheat Yellow Rust at a Regional Scale: A Case Study. Remote Sens. 2021, 13, 278. [Google Scholar] [CrossRef]
  16. Huang, L.; Liu, Y.; Huang, W.; Dong, Y.; Ma, H.; Wu, K.; Guo, A. Combining Random Forest and XGBoost Methods in Detecting Early and Mid-Term Winter Wheat Stripe Rust Using Canopy Level Hyperspectral Measurements. Agriculture 2022, 12, 74. [Google Scholar] [CrossRef]
  17. Jing, X.; Zou, Q.; Yan, J.; Dong, Y.; Li, B. Remote Sensing Monitoring of Winter Wheat Stripe Rust Based on MRMR-XGBoost Algorithm. Remote Sens. 2022, 14, 756. [Google Scholar] [CrossRef]
  18. Zhang, J.; Wang, B.; Zhang, X.; Liu, P.; Dong, Y.; Wu, K.; Huang, W. Impact of Spectral Interval on Wavelet Features for Detecting Wheat Yellow Rust with Hyperspectral Data. Int. J. Agric. Biol. Eng. 2018, 11, 138–144. [Google Scholar] [CrossRef] [Green Version]
  19. Badgley, G.; Anderegg, L.D.L.; Berry, J.A.; Field, C.B. Terrestrial Gross Primary Production: Using NIRV to Scale from Site to Globe. Glob. Chang. Biol. 2019, 25, 3731–3740. [Google Scholar] [CrossRef]
  20. Baldocchi, D.D.; Ryu, Y.; Dechant, B.; Eichelmann, E.; Hemes, K.; Ma, S.; Sanchez, C.R.; Shortt, R.; Szutu, D.; Valach, A.; et al. Outgoing Near-Infrared Radiation From Vegetation Scales With Canopy Photosynthesis Across a Spectrum of Function, Structure, Physiological Capacity, and Weather. J. Geophys. Res. Biogeosciences 2020, 125, e2019JG005534. [Google Scholar] [CrossRef]
  21. Wu, G.; Guan, K.; Jiang, C.; Peng, B.; Kimm, H.; Chen, M.; Yang, X.; Wang, S.; Suyker, A.E.; Bernacchi, C.J.; et al. Radiance-Based NIR v as a Proxy for GPP of Corn and Soybean. Environ. Res. Lett. 2020, 15, 034009. [Google Scholar] [CrossRef]
  22. Kimm, H.; Guan, K.; Jiang, C.; Miao, G.; Wu, G.; Suyker, A.E.; Ainsworth, E.A.; Bernacchi, C.J.; Montes, C.M.; Berry, J.A.; et al. A Physiological Signal Derived from Sun-Induced Chlorophyll Fluorescence Quantifies Crop Physiological Response to Environmental Stresses in the U.S. Corn Belt. Environ. Res. Lett. 2021, 16, 124051. [Google Scholar] [CrossRef]
  23. Wu, L.; Zhang, X.; Rossini, M.; Wu, Y.; Zhang, Z.; Zhang, Y. Physiological Dynamics Dominate the Response of Canopy Far-Red Solar-Induced Fluorescence to Herbicide Treatment. Agric. For. Meteorol. 2022, 323, 109063. [Google Scholar] [CrossRef]
  24. Xu, S.; Atherton, J.; Riikonen, A.; Zhang, C.; Oivukkamäki, J.; MacArthur, A.; Honkavaara, E.; Hakala, T.; Koivumäki, N.; Liu, Z.; et al. Structural and Photosynthetic Dynamics Mediate the Response of SIF to Water Stress in a Potato Crop. Remote Sens. Environ. 2021, 263, 112555. [Google Scholar] [CrossRef]
  25. Zeng, Y.; Chen, M.; Hao, D.; Damm, A.; Badgley, G.; Rascher, U.; Johnson, J.E.; Dechant, B.; Siegmann, B.; Ryu, Y.; et al. Combining Near-Infrared Radiance of Vegetation and Fluorescence Spectroscopy to Detect Effects of Abiotic Changes and Stresses. Remote Sens. Environ. 2022, 270, 112856. [Google Scholar] [CrossRef]
  26. General Administration of Quality Supervision, Inspection and Quarantine of the People’s Republic of China; China National Standardization Management Committee. Technical Specifications for Forecasting Wheat Stripe Rust. 2011. Available online: https://kns.cnki.net/kcms/detail/detail.aspx?FileName=SCSF00036649&DbName=SCSF (accessed on 29 September 2011).
  27. Maier, S.W.; Günther, K.P.; Stellmes, M. Sun-Induced Fluorescence: A New Tool for Precision Farming. In Analytical Biotechnology; Birkhäuser Basel: Basel, Switzerland, 2002; pp. 43–92. [Google Scholar]
  28. Plascyk, J.A. The MK II Fraunhofer Line Discriminator (FLD-II) for Airborne and Orbital Remote Sensing of Solar-Stimulated Luminescence. Opt. Eng. 1975, 14, 339–340. [Google Scholar] [CrossRef]
  29. Liu, X.; Liu, L. Improving Chlorophyll Fluorescence Retrieval Using Reflectance Reconstruction Based on Principal Components Analysis. IEEE Geosci. Remote Sens. Lett. 2015, 12, 1645–1649. [Google Scholar] [CrossRef]
  30. Liu, X.; Liu, L. Assessing Band Sensitivity to Atmospheric Radiation Transfer for Space-Based Retrieval of Solar-Induced Chlorophyll Fluorescence. Remote Sens. 2014, 6, 10656–10675. [Google Scholar] [CrossRef] [Green Version]
  31. Du, S.; Liu, L.; Liu, X.; Hu, J. Response of Canopy Solar-Induced Chlorophyll Fluorescence to the Absorbed Photosynthetically Active Radiation Absorbed by Chlorophyll. Remote Sens. 2017, 9, 911. [Google Scholar] [CrossRef] [Green Version]
  32. Liu, L.; Zhao, W.; Shen, Q.; Wu, J.; Teng, Y.; Yang, J.; Han, X.; Tian, F. Nonlinear Relationship between the Yield of Solar-Induced Chlorophyll Fluorescence and Photosynthetic Efficiency in Senescent Crops. Remote Sens. 2020, 12, 1518. [Google Scholar] [CrossRef]
  33. Viña, A.; Gitelson, A.A. New Developments in the Remote Estimation of the Fraction of Absorbed Photosynthetically Active Radiation in Crops. Geophys. Res. Lett. 2005, 32, 1–4. [Google Scholar] [CrossRef] [Green Version]
  34. Dechant, B.; Ryu, Y.; Badgley, G.; Zeng, Y.; Berry, J.A.; Zhang, Y.; Goulas, Y.; Li, Z.; Zhang, Q.; Kang, M.; et al. Canopy Structure Explains the Relationship between Photosynthesis and Sun-Induced Chlorophyll Fluorescence in Crops. Remote Sens. Environ. 2020, 241, 111733. [Google Scholar] [CrossRef] [Green Version]
  35. Zeng, Y.; Badgley, G.; Dechant, B.; Ryu, Y.; Chen, M.; Berry, J.A. A Practical Approach for Estimating the Escape Ratio of Near-Infrared Solar-Induced Chlorophyll Fluorescence. Remote Sens. Environ. 2019, 232, 111209. [Google Scholar] [CrossRef] [Green Version]
  36. Guanter, L.; Zhang, Y.; Jung, M.; Joiner, J.; Voigt, M.; Berry, J.A.; Frankenberg, C.; Huete, A.R.; Zarco-Tejada, P.; Lee, J.E.; et al. Global and Time-Resolved Monitoring of Crop Photosynthesis with Chlorophyll Fluorescence. Proc. Natl. Acad. Sci. USA. 2014, 111, E1327-33. [Google Scholar] [CrossRef] [Green Version]
  37. Milus, E.A.; Seyran, E.; McNew, R. Aggressiveness of Puccinia Striiformis f. Sp. Tritici Isolates in the South-Central United States. Plant Dis. 2006, 90, 847–852. [Google Scholar] [CrossRef] [PubMed] [Green Version]
  38. Shi, Y.; Huang, W.; Luo, J.; Huang, L.; Zhou, X. Detection and Discrimination of Pests and Diseases in Winter Wheat Based on Spectral Indices and Kernel Discriminant Analysis. Comput. Electron. Agric. 2017, 141, 171–180. [Google Scholar] [CrossRef]
  39. Sanchez, R.A.; Hall, A.J.; Trapani, N.; de Hunau, R.C. Effects of Water Stress on the Chlorophyll Content, Nitrogen Level and Photosynthesis of Leaves of Two Maize Genotypes. Photosynth. Res. 1983, 4, 35–47. [Google Scholar] [CrossRef]
  40. Werner, C.; Correia, O.; Beyschlag, W. Two Different Strategies of Mediterranean Macchia Plants to Avoid Photoinhibitory Damage by Excessive Radiation Levels during Summer Drought. Acta Oecologica 1999, 20, 15–23. [Google Scholar] [CrossRef]
  41. Luo, X.; Croft, H.; Chen, J.M.; He, L.; Keenan, T.F. Improved Estimates of Global Terrestrial Photosynthesis Using Information on Leaf Chlorophyll Content. Glob. Chang. Biol. 2019, 25, 2499–2514. [Google Scholar] [CrossRef] [Green Version]
  42. van der Tol, C.; Vilfan, N.; Dauwe, D.; Cendrero-Mateo, M.P.; Yang, P. The Scattering and Re-Absorption of Red and near-Infrared Chlorophyll Fluorescence in the Models Fluspect and SCOPE. Remote Sens. Environ. 2019, 232, 111292. [Google Scholar] [CrossRef]
  43. Wan, A.M.; Chen, X.M.; He, Z.H. Wheat Stripe Rust in China. Aust. J. Agric. Res. 2007, 58, 605–619. [Google Scholar] [CrossRef]
  44. Merzlyak, M.N.; Gitelson, A.A.; Chivkunova, O.B.; Rakitin, V.Y. Non-Destructive Optical Detection of Pigment Changes during Leaf Senescence and Fruit Ripening. Physiol. Plant. 1999, 106, 135–141. [Google Scholar] [CrossRef] [Green Version]
  45. Gamon, J.A.; Kovalchuck, O.; Wong, C.Y.S.; Harris, A.; Garrity, S.R. Monitoring Seasonal and Diurnal Changes in Photosynthetic Pigments with Automated PRI and NDVI Sensors. Biogeosciences 2015, 12, 4149–4159. [Google Scholar] [CrossRef] [Green Version]
  46. Peñuelas, J.; Gamon, J.A.; Fredeen, A.L.; Merino, J.; Field, C.B. Reflectance Indices Associated with Physiological Changes in Nitrogen- and Water-Limited Sunflower Leaves. Remote Sens. Environ. 1994, 48, 135–146. [Google Scholar] [CrossRef]
  47. Wang, H.; Qin, F.; Liu, Q.; Ruan, L.; Wang, R.; Ma, Z.; Li, X.; Cheng, P.; Wang, H. Identification and Disease Index Inversion of Wheat Stripe Rust and Wheat Leaf Rust Based on Hyperspectral Data at Canopy Level. J. Spectrosc. 2015, 2015, 651810. [Google Scholar] [CrossRef] [Green Version]
  48. Zhang, J.; Huang, Y.; Pu, R.; Gonzalez-Moreno, P.; Yuan, L.; Wu, K.; Huang, W. Monitoring Plant Diseases and Pests through Remote Sensing Technology: A Review. Comput. Electron. Agric. 2019, 165, 104943. [Google Scholar] [CrossRef]
  49. Corp, L.A.; Middleton, E.M.; McMurtrey, J.E.; Campbell, P.K.E.; Butcher, L.M. Fluorescence Sensing Techniques for Vegetation Assessment. Appl. Opt. 2006, 45, 1023–1033. [Google Scholar] [CrossRef]
  50. Badgley, G.; Field, C.B.; Berry, J.A. Canopy Near-Infrared Reflectance and Terrestrial Photosynthesis. Sci. Adv. 2017, 3, e1602244. [Google Scholar] [CrossRef] [Green Version]
  51. Kimm, H.; Guan, K.; Burroughs, C.H.; Peng, B.; Ainsworth, E.A.; Bernacchi, C.J.; Moore, C.E.; Kumagai, E.; Yang, X.; Berry, J.A.; et al. Quantifying High-Temperature Stress on Soybean Canopy Photosynthesis: The Unique Role of Sun-Induced Chlorophyll Fluorescence. Glob. Chang. Biol. 2021, 27, 2403–2415. [Google Scholar] [CrossRef] [PubMed]
  52. Raji, S.N.; Subhash, N.; Ravi, V.; Saravanan, R.; Mohanan, C.N.; Nita, S.; Kumar, T.M. Detection of Mosaic Virus Disease in Cassava Plants by Sunlight-Induced Fluorescence Imaging: A Pilot Study for Proximal Sensing. Int. J. Remote Sens. 2015, 36, 2880–2897. [Google Scholar] [CrossRef]
  53. Liu, L.; Zhao, J.; Guan, L. Tracking Photosynthetic Injury of Paraquat-Treated Crop Using Chlorophyll Fluorescence from Hyperspectral Data. Eur. J. Remote Sens. 2013, 46, 459–473. [Google Scholar] [CrossRef] [Green Version]
  54. Wang, C.; Guan, K.; Peng, B.; Chen, M.; Jiang, C.; Zeng, Y.; Wu, G.; Wang, S.; Wu, J.; Yang, X.; et al. Satellite Footprint Data from OCO-2 and TROPOMI Reveal Significant Spatio-Temporal and Inter-Vegetation Type Variabilities of Solar-Induced Fluorescence Yield in the U.S. Midwest. Remote Sens. Environ. 2020, 241, 111728. [Google Scholar] [CrossRef]
  55. Liu, L.; Liu, X.; Chen, J.; Du, S.; Ma, Y.; Qian, X.; Chen, S.; Peng, D. Estimating Maize GPP Using Near-Infrared Radiance of Vegetation. Sci. Remote Sens. 2020, 2, 100009. [Google Scholar] [CrossRef]
  56. Miao, G.; Guan, K.; Yang, X.; Bernacchi, C.J.; Berry, J.A.; DeLucia, E.H.; Wu, J.; Moore, C.E.; Meacham, K.; Cai, Y.; et al. Sun-Induced Chlorophyll Fluorescence, Photosynthesis, and Light Use Efficiency of a Soybean Field from Seasonally Continuous Measurements. J. Geophys. Res. Biogeosciences 2018, 123, 610–623. [Google Scholar] [CrossRef]
  57. Yang, K.; Ryu, Y.; Dechant, B.; Berry, J.A.; Hwang, Y.; Jiang, C.; Kang, M.; Kim, J.; Kimm, H.; Kornfeld, A.; et al. Sun-Induced Chlorophyll Fluorescence Is More Strongly Related to Absorbed Light than to Photosynthesis at Half-Hourly Resolution in a Rice Paddy. Remote Sens. Environ. 2018, 216, 658–673. [Google Scholar] [CrossRef]
  58. Goulas, Y.; Fournier, A.; Daumard, F.; Champagne, S.; Ounis, A.; Marloie, O.; Moya, I. Gross Primary Production of a Wheat Canopy Relates Stronger to Far Red Than to Red Solar-Induced Chlorophyll Fluorescence. Remote Sens. 2017, 9, 97. [Google Scholar] [CrossRef] [Green Version]
  59. Xiao, Y.; Dong, Y.; Huang, W.; Liu, L.; Ma, H.; Ye, H.; Wang, K. Dynamic Remote Sensing Prediction for Wheat Fusarium Head Blight by Combining Host and Habitat Conditions. Remote Sens. 2020, 12, 3046. [Google Scholar] [CrossRef]
  60. Zhang, J.; Pu, R.; Yuan, L.; Huang, W.; Nie, C.; Yang, G. Integrating Remotely Sensed and Meteorological Observations to Forecast Wheat Powdery Mildew at a Regional Scale. IEEE J. Sel. Top. Appl. Earth Obs. Remote Sens. 2014, 7, 4328–4339. [Google Scholar] [CrossRef]
Figure 1. Study area (a), experimental set-up of canopy spectral measurements (b), and three morphological of wheat in study area (c).
Remotesensing 15 00693 g001
Figure 2. Distribution of disease-severity levels of experimental samples and number of samples.
Remotesensing 15 00693 g002
Figure 3. Comparison of structural signals and comparison of physiological signals. Comparison between NIRvP and NIRvR (a), and comparison between ΦF and ΦF-r (b). The red lines with band denote the regression line and 95% confidence interval.
Remotesensing 15 00693 g003
Figure 4. Relationship between different signals and SL under comprehensive experimental conditions. SIF (a), ΦF (b), ΦF-r (c), SIFyield (d), NIRv (e), NDVI (f). (af) are canopy-scale data; (g,h) are leaf-scale data. The red lines with band denote the regression line and 95% confidence interval.
Remotesensing 15 00693 g004
Figure 5. Relationship between different signals and SL under light disease conditions (SL<20%). SIF (a), ΦF (b), ΦF-r (c), SIFyield (d), NIRv (e), NDVI (f). (af) are canopy-scale data; (g,h) are leaf-scale data. The red lines with band denote the regression line and 95% confidence interval.
Remotesensing 15 00693 g005
Figure 6. Response of physiological and structural signals to SIF variability. Response of NIRvP and ΦF to SIF variability (a), response of NIRvR and ΦF-r to SIF variability (b). SIF-canopy denotes the SIF value of the canopy sample. The blue or golden lines with band denote the regression line and 95% confidence interval, respectively.
Remotesensing 15 00693 g006
Figure 7. Responses of physiological and structural signals to SL. Response of NIRvP and ΦF to SL (a), response of NIRvR and ΦF-r to SL (b). SL-canopy denotes the disease severity level of the canopy samples. The blue or golden lines with band denote the regression line and 95% confidence interval, respectively.
Remotesensing 15 00693 g007
Disclaimer/Publisher’s Note: The statements, opinions and data contained in all publications are solely those of the individual author(s) and contributor(s) and not of MDPI and/or the editor(s). MDPI and/or the editor(s) disclaim responsibility for any injury to people or property resulting from any ideas, methods, instructions or products referred to in the content.

