Article

Spatio-Temporal Evolution of Glacial Lakes in the Tibetan Plateau over the Past 30 Years

1
State Key Laboratory of Geohazard Prevention and Geoenvironment Protection, Chengdu University of Technology, Chengdu 610059, China
2
Department of Earth and Environmental Sciences, Indian Institute of Science Education and Research Mohali, Mohali 140306, Punjab, India
3
School of Architecture and Civil Engineering, Chengdu University, Chengdu 310106, China
4
Faculty of Geo-Information Science and Earth Observation (ITC), University of Twente, 7500 AE Enschede, The Netherlands
*
Author to whom correspondence should be addressed.
Remote Sens. 2023, 15(2), 416; https://doi.org/10.3390/rs15020416
Submission received: 23 November 2022 / Revised: 31 December 2022 / Accepted: 7 January 2023 / Published: 10 January 2023
(This article belongs to the Special Issue Study on Cryospheric Sciences Using Remote Sensing Technology)

Abstract

:
As the Third Pole of the Earth and the Water Tower of Asia, the Tibetan Plateau (TP) nurtures large numbers of glacial lakes, which are sensitive to global climate change. These lakes modulate the freshwater ecosystem in the region but concurrently pose severe threats to the valley population by means of sudden glacial lake outbursts and consequent floods (GLOFs). The lack of high-resolution multi-temporal inventory of glacial lakes in TP hampers a better understanding and prediction of the future trend and risk of glacial lakes. Here, we created a multi-temporal inventory of glacial lakes in TP using a 30-year record of 42,833 satellite images (1990–2019), and we discussed their characteristics and spatio-temporal evolution over the years. Results showed that their number and area had increased by 3285 and 258.82 km2 in the last 3 decades, respectively. We noticed that different regions of the TP exhibited varying change rates in glacial lake size; most regions show a trend of expansion and increase in glacial lakes, while some regions show a trend of decreasing such as the western Pamir and the eastern Hindu Kush. The mapping uncertainty is about 17.5%, which is lower than other available datasets, thus making our inventory reliable for the spatio-temporal evolution analysis of glacial lakes in the TP. Our lake inventory data are publicly published, it can help to study climate change–glacier–glacial lake–GLOF interactions in the Third Pole and serve as input to various hydro-climatic studies.

Graphical Abstract

1. Introduction

The “Third Pole of the Earth” [1], the Tibetan Plateau (TP), contains the most significant number and area of glaciers outside the Antarctic and the Arctic [2]. With the aggravated climate change in the anthropocene, the retreat and loss of glacier mass increased in many parts of the TP [3,4,5,6,7,8,9]. This trend intensified in the last few decades, with an accelerated rate (−0.18 to −0.7 m w.e. yr−1) since the mid-1990s [3,4]. The melting snow and ice present a chance for the development of glacial lakes [10,11]. Many glacial lakes form in the low-lying land, such as depressions and troughs, and gradually expand with precipitation or glacial retreat and melt supply [12,13,14,15].
Glacial lakes, which are formed directly or indirectly due to glaciation [15,16,17,18,19,20], are temporary reservoirs of glacial meltwater and potential sources of flooding [15]. Although the frequency of GLOFs in the TP region has not increased significantly in recent years [21], the potential risk posed by glacial lake expansion remains. Unanticipated GLOFs bring potential dangers to downstream communities and their infrastructure as well as affecting the regional ecological environment [3,22,23]. In addition, these glacial lakes play an important role in the ecosystem dynamics and hydrological cycle of the region. A growing number of scientific research and policy concerns are therefore recognized in the TP dealing with the aforementioned two issues related to glacial lakes [24,25,26].
Since the 1980s, scholars have been continuously studying the glacial lakes in the TP and mapped them based on different methods and means [13,15,27,28,29,30]. Thanks to the development of various remote-sensing technology and the massive leap in computing power, large-scale regional studies have been increasingly applied in the field of geological disasters and cryosphere environment [31,32,33]. In particular, Landsat satellites, with their free access, high-revisit ability (16 days) and high spatial resolution, have become the preferred data source for long-term monitoring and research in most regions [34]. At the same time, the improvement of cloud-computing power, such as the application of Google Earth Engine (GEE), has dramatically improved the efficiency of regional spatial analysis [35]. All these have greatly improved the accuracy of automatic and semi-automatic glacier lake boundary vectorization. Compared with manual visual interpretation of lake mapping, automated techniques are more efficient and have been widely used in lake extraction studies [36,37]. Nevertheless, to reduce the systematic error in automation, some amount of manual correction is still indispensable [15].
To our best knowledge, about 30 glacial lake datasets or reports have been published in the TP area, each using different extraction methods and data sources [15]. Most of them adopted the supervised classification of normalized difference water index (NDWI) to extract the lake boundaries [13,30,38,39,40,41,42,43,44,45,46,47,48,49,50,51,52]; some researchers used the linear spectral unmixing method [53,54], while some others used manual interpretation and auxiliary technologies, such as the “global–local” iterative scheme, band ratio threshold condition, integrated nonlocal active contour approach, machine learning models, etc. [14,20,27,55,56,57,58,59,60,61,62,63,64,65].
Despite the large volume of studies, there was no unified standard about the minimum threshold area applied to extract the glacial lakes. Different studies adopted different area thresholds in the literature. The currently popular thresholds range from 0.001 to 0.1 km2. The main selections include 0.001 km2 used by Salerno et al. [10], 0.002 km2 used by Wang et al. [50], 0.0027 km2 used by Zhang et al. [20], 0.0036 km2 used by Gardelle et al. [41] and Luo et al. [66], 0.0045 km2 used by Li and Sheng [29], 0.0054 km2 used by Wang et al. [15], and 0.0081 km2 used by Nie et al. [45]. The remaining larger minimum area thresholds include 0.02 km2 used by Li et al. [67] and Worni et al. [52], and 0.05 and 0.1 km2 used for the GLOF study [40,65,68,69,70,71]. According to the properties of the satellite images, the minimum pixel length used to extract the glacial lake is 30 m, which means that some glacial lakes cannot ideally occupy a complete number of pure pixels but are more likely to be partially surrounded by one to eight mixed water body pixels [15]. Studies have shown that applying a smaller minimum threshold area under the same spatial resolution will significantly increase the total number of glacial lakes, but the general area of the lakes will not change significantly [45]. Furthermore, choosing a minimum threshold area that is too small will lead to substantial uncertainty (see Section 4.1) and significantly increase the workload of meaningless cross-validation and manual correction [10], resulting in a negative impact on extracting glacial lakes in the TP.
The aforementioned literature demonstrated systematic studies on the glacial lakes, but many of them focused on a specific region rather than the whole of the Tibetan Plateau. While some works covered the entire range, there is still a lack of multi-temporal, long-term monitoring and comprehensive analysis of the glacial lakes over the entire TP region [15,30,72,73]. In the time of increased warming trends, it is of great significance to study the change trends of glacial lakes in the TP over a long time period. In order to address the above problems of incomplete spatial and temporal coverage of glacial lake data on the TP, this study mapped an updated inventory of glacial lakes covering the entire TP including three periods of data, aiming to solve the above problems and provide a database for cryosphere studies.

2. Study Area

The Tibetan Plateau, also called the “the Roof of the World” [1,74], has a mean elevation of ~4000 m a.s.l., with higher elevation in the west and lower in the east. Since the definition of the Tibetan Plateau was first elaborated by the Hungarian geologist Lóczy in 1899 [75], researchers have had different understandings and representations of the specific extent and exact boundaries of the TP [76,77,78]. In this paper, we use the dataset of river basins map over the TP proposed by Zhang [79] based on the 2500 m contour as the study area for the TP [76]. The total area of the TP is ~3 × 10⁶ km2, most of which is in China, with other parts in India, Pakistan, Afghanistan, Tajikistan, Kyrgyzstan, Nepal, Bhutan and Myanmar [74]. Many high mountains surrounded the TP, including the Pamirs and Hindu Kush Mountains in the west, Altun Mountains, Kunlun Mountains and Qilian Mountains in the north, the Himalayas in the south, and Hengduan Mountains in the east (Figure 1). Among these mountains, only the Hengduan Mountains are a north–south range; the rest of the mountains are aligned in generally east–west orientation [30,74].
As “the Water Tower of Asia” [80,81], the TP and the surroundings contain the most significant number of glaciers outside the polar regions, and they are the sources of several great rivers [2], including the Amu Darya, Indus, Ganges, Yangtze, Mekong, Yellow, Salween, Brahmaputra and Irrawaddy. These rivers, which pass through many countries in Asia, especially China, India and Southeast Asia, play an irreplaceable hydrological role in providing water for domestic and industrial use to billions of people downstream [82,83]. Existing studies have analyzed the state of the cryosphere of the TP from various aspects, such as changes in glacier area [84], glacier thickness [85], glacier mass balance [33], and changes in the number and area of glacial lakes [15,30].

3. Data and Methods

Many image composite algorithms have been proposed for Landsat images [86]. Roy et al. [87] first proposed an image compositing method for Landsat ETM+, and then, this remote sensing method by compositing multiple images into one image has been applied in feature extraction and has achieved good results in automatic extraction work such as glacial landscapes [88,89]. This method can be run directly on Google Earth Engine (GEE) to obtain all images of a specific area at a selected time directly based on the parameter settings, and it can automatically select the parts that meet the parameter requirements and are of high quality to produce a composite image [88,89,90,91,92]. We applied a two-step method to construct the Tibetan Plateau Glacial Lake database (TPGL) from 1990 to 2019. A total of 42,833 (12,224, 14,670, and 15,939 for the periods 1990–1999, 2000–2012, and 2013–2019, respectively) Landsat Surface Reflectance (SR) images were composited into three images on GEE, which has mighty computing power based on cloud computing to cope with complex and large workloads [35,93]. Subsequent processing was handled by © ArcGIS Pro and © ENVI software, including manual cross-checking and correction by image interpreters. The general workflow of method is shown in Figure 2.

3.1. Data

Because of data strip issues in Landsat 7 ETM+ caused by sensor failure, we used Landsat 5 Thematic Mapper (TM) SR and Landsat 8 Operational Land Imager (OLI) SR images for image processing. Typically, the period of July to September months corresponding to summer months is considered to be the ideal time for glacial lake mapping. During this period, the coverage of snow and ice is minimal, while the glacial lake area usually reaches its maximum. The glacial lake area does not produce large fluctuations with the action of glacial meltwater and precipitation [20,45]. In the absence of cloud-free data, images from the nearest time period can be selected as a substitute [30,45]. Although the melting rate of snow and ice peaks in July and August with an increase in surface temperature [94,95], we chose a conservative range in this study, i.e., from July to November with the consideration of obtaining more available cloud-free remote sensing images.
Since the original images may contain clouds and mountain shadows, essential preprocessing was carried out in GEE to mask clouds and cloud shadows [96,97,98,99]. The temporal composite image method can efficiently integrate a large amount of data according to the parameter settings; the higher-quality parts of all images are selected for compositing, and the lower-quality parts of the input image (such as cloud and its shadows) were discarding [88,100]. Here, the C Function of Mask (CFMask) algorithm performs the necessary masking of the clouds and their shadows in GEE [101], with the given thresholds 1–5 and 1–3 that have been applied and validated many times [102,103]. The ALOS AW3D-30m digital elevation model (AW3D30 DEM) was then used to set the slope of 7° as a masking threshold to avoid the interference of the slope and its shadows on the extraction results [29,104]. After processing the original individual images above, we composite them into three different images by periods through median filtering [88,105]. These three composite images would work as the base map for the next step of the extraction. Since the production time of AW3D30 DEM data was not consistent with the acquisition time of Landsat SR images used for glacial lakes mapping, the resulting slope and terrain may not match the actual terrain completely, leading to minor errors in masking glacial lakes. These errors were corrected as much as possible in the subsequent cross-validation and manual correction steps (see Section 3.4).

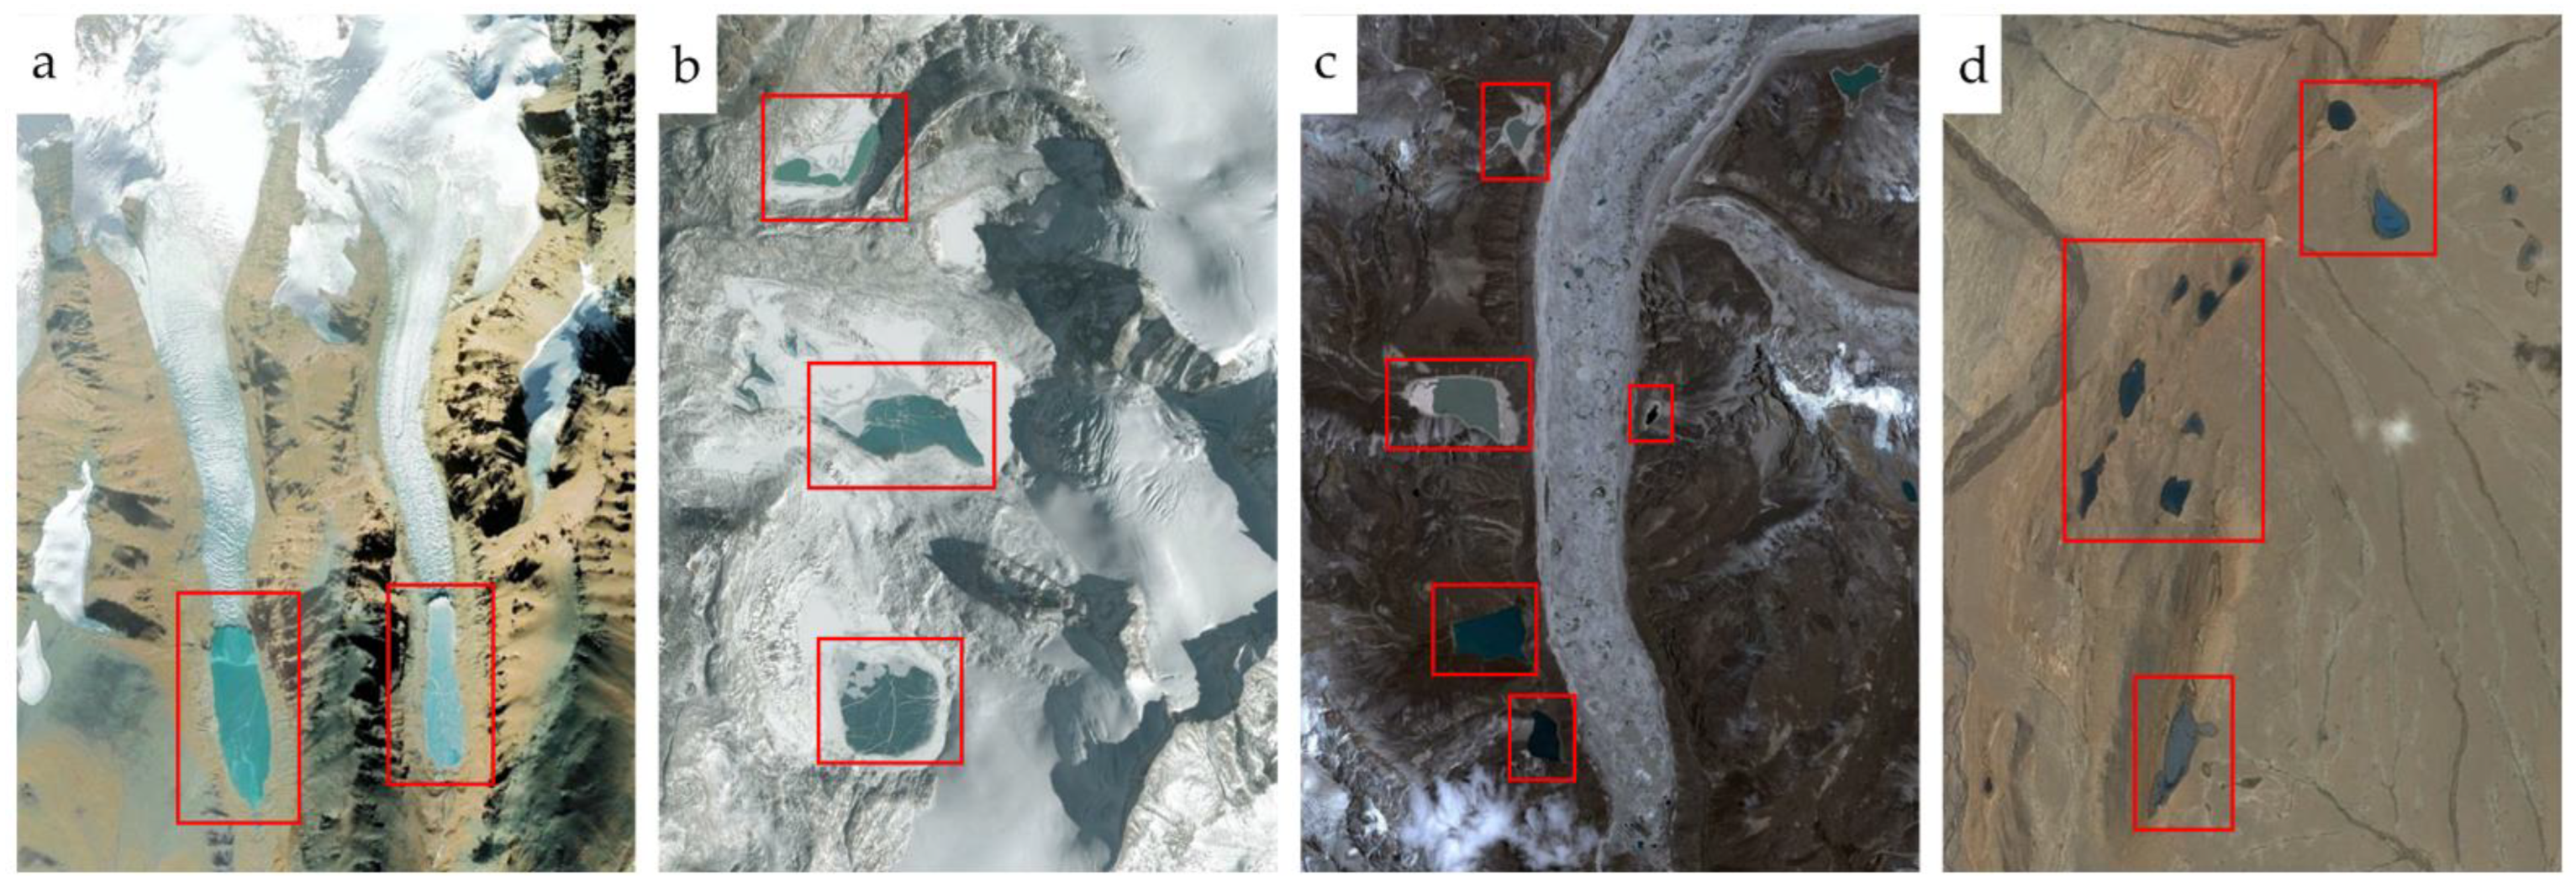
3.2. Glacial Lake Mapping

The distance between the glacial lake and its nearest glacier outlines is one of the criteria of identifying a glacial lake. In previous studies, several distance values, such as 2, 3, 5, 10, and 20 km, were used as the maximum threshold value for glacial lake identification [20,50,57,61]. Nie et al. [45] and Zhang et al. [20] attributed a distance of 10 km from the nearest glacier as a reasonable threshold. To ensure the consistency and comparability of the data, we selected the buffer of 10 km distance as the spatial distribution range of the glacial lakes in this study. After comparing the published glacier inventories covering the TP, including the Global Land Ice Measurements from Space (GLIMS) glacier database [106], the Randolph Glacier Inventory version 6.0 (RGI 6.0) [107,108], the Glacier Area Mapping for Discharge from the Asian Mountains (GAMDAM) glacier inventory [109,110], the First and Second Chinese Glacier Inventory (CGI) (only covered the Tibet Autonomous Region of China) [111,112], and many others e.g., [113,114,115,116], we believe that GAMDAM is superior in terms of data accuracy (based on the fact that it is performed entirely by manual mapping) and published time (2018) [117], and therefore, we use GAMDAM to determine the extent of glacial lake distribution.
Different indices were proposed and employed to extract water bodies based on remote sensing imagery, such as the normalized difference water index (NDWI) and the modified normalized difference water index (MNDWI). These two indices utilize green and NIR or SWIR bands to extract water pixels (the relevant formulae can be found in references, e.g., [118,119,120,121,122]); both indexes are currently used extensively in the extraction of glacial lakes in different regions of the TP [29,65,122,123,124]. Before properly extracting the lakes of the whole TP, we carefully studied the methodologies in the above literature, randomly selected several areas, and employed MNDWI and NDWI to extract the lake pixels as a test case. Based on the existing research and test results, NDWI has a better extraction effect and accuracy than MNDWI, so NDWI was finally used in this study to extract the lake outlines automatically.
Because Landsat 5 TM and Landsat 8 OLI SR images have different band properties for NDWI implementation, a universal threshold cannot be simply applied to the automatic extraction of glacial lakes in different periods. In this study, a dynamic range from −0.1 to 0.2 was determined based on the careful consideration of the thresholds used by predecessors [125,126]. The best threshold is selected based on the degree of matching by manually checking the processed images and the extraction results of multiple attempts with different thresholds. After GEE implementation, we carried out further processing of NDWI output of Landsat images by using the Majority Analysis and Clump Classification function of © ENVI to reduce the noise, such as “Salt and Pepper”. Finally, the raster dataset was converted into vector files in © ArcGIS Pro, achieving the outlines of glacial lakes. Thus, based on the uncertainty and spatial resolution, this study set 0.0081 km2 (3 × 3 pixels) as the minimum threshold area according to experience and multiple attempts in different regions of the TP [45]. The use of this threshold allows both for the most basic stable glacial lake mapping needs and for direct comparative analysis with existing glacial lake inventories. Further cross-validation, manual vectorization, and correction were all based on this precondition.

3.3. Glacial Lake Classification

Due to the spatial resolution and imaging quality of Landsat series satellite images, as well as the inability to conduct field surveys of each glacial lake, it is difficult for us to delineate the specific types of glacial lakes by remote sensing techniques. According to the definition of glacial lakes and the classification of glacial lakes used in existing studies [15,16,30,45,127,128], we classified the mapped lakes into the following four types (as shown in Figure 3), and the types were classified by dozens of trained experts, taking into account the location of the lakes in Google Earth Pro and satellite images:
  • Proglacial lakes (PGL): The lakes are connected to the glacier and located in the front of the glacier (glacier tongue), usually dammed by moraines. Some of them are fed directly by glaciers [16,129];
  • Supraglacial lakes (SGL): The lakes developed on the glacier surface, surrounded in the whole or in part by glaciers [130,131];
  • Ice-marginal lakes (IML): These lakes are usually located on the side of the glacier tongue and dammed by lateral moraines, and they are commonly found in areas such as Alaska and have only a small distribution in the TP [132,133];
  • Unconnected glacial lakes (UGL): The lakes are not directly connected to the parent glaciers, but they may have evolved from a proglacial lake or supraglacial lake as glaciers retreat [30]. Some researchers further categorized them into glacier-fed and non-glacier-fed lakes [20,43].

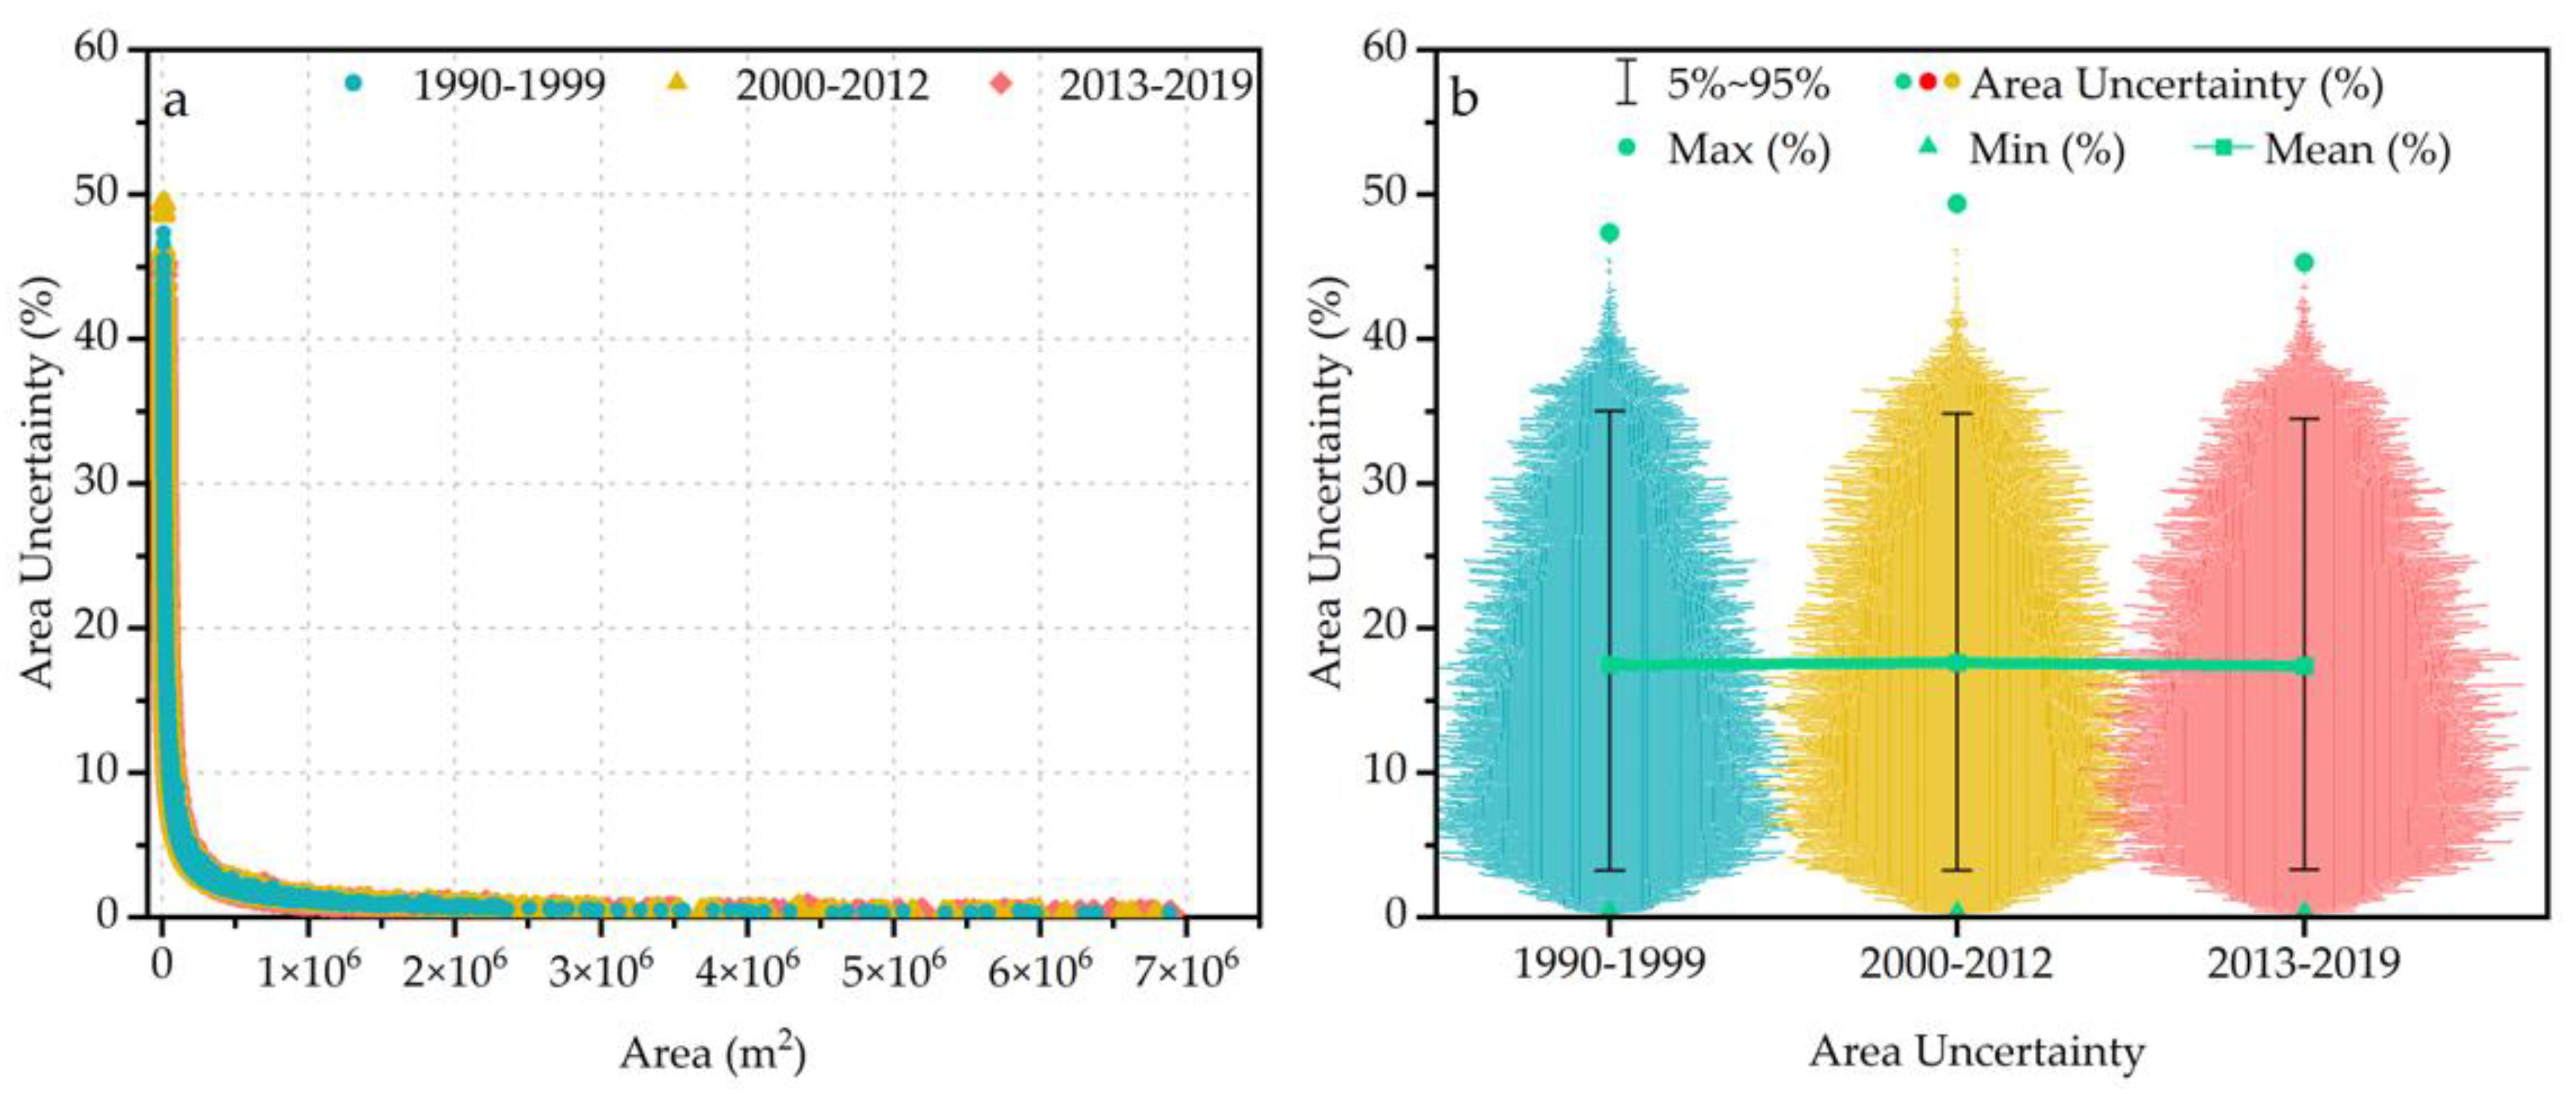
3.4. Estimation Method of Mapping Uncertainties

To further improve the accuracy and reliability of the glacial lake inventory, manual vectorization was carried out by trained interpreters. Necessary corrections for each glacial lake were made, and their types were identified. Although this work involves much time and human resources, it can significantly improve the data quality.
The spatial resolution of satellite images affects the mapping uncertainty [10,11,15,30], and the subjectivity and experience of interpreters will also lead to errors. Considering the spatial resolution of images used in this study (30 m), and for a better cross-validation with other inventories using this threshold, Equation (1) from Krumwiede et al. [134] was applied to analyze the uncertainty estimation of glacial lake area delineation.
Aer = 100∙(n1/2∙m/Agl),
where Aer is the percentage error of area determinations, which is proportional to satellite sensor resolution. N is the pixel number occupied by the glacial lake boundary, in which it can be represented by the ratio of perimeter length to spatial resolution. M is the area of a pixel in the image (m2, e.g., 900 m2 for a pixel in the Landsat imagery). Agl is the lake area (m2), and the factor 100 is the coefficient to convert to a percentage.

4. Results

4.1. The Uncertainty of Glacial Lake Area

The number of glacial lakes extracted in three periods (1990–1999, 2000–2012, and 2013–2019) is 19,183, 20,655 and 22,468, and the total area is 1509.17 km2, 1637.01 km2 and 1767.99 km2, respectively. Taking ±1 pixel (30 m) as the uncertainty of glacier lake boundaries, we calculated the systemic errors of all glacial lakes in the TP with the three periods (as shown in Figure 4). The average uncertainty for all glacial lakes is 17.50%, with a standard deviation of 9.91% and overall uncertainty in the range of 0.2–50%. Due to improved Landsat 8 OLI SR image quality, the average uncertainty for 2013–2019 was found to be the lowest. As can be seen from Equation (1) and Figure 4, the smaller the area of a glacial lake, the higher the area uncertainty, which indicates that the area uncertainty is directly related to the size and shape of a glacial lake [30].

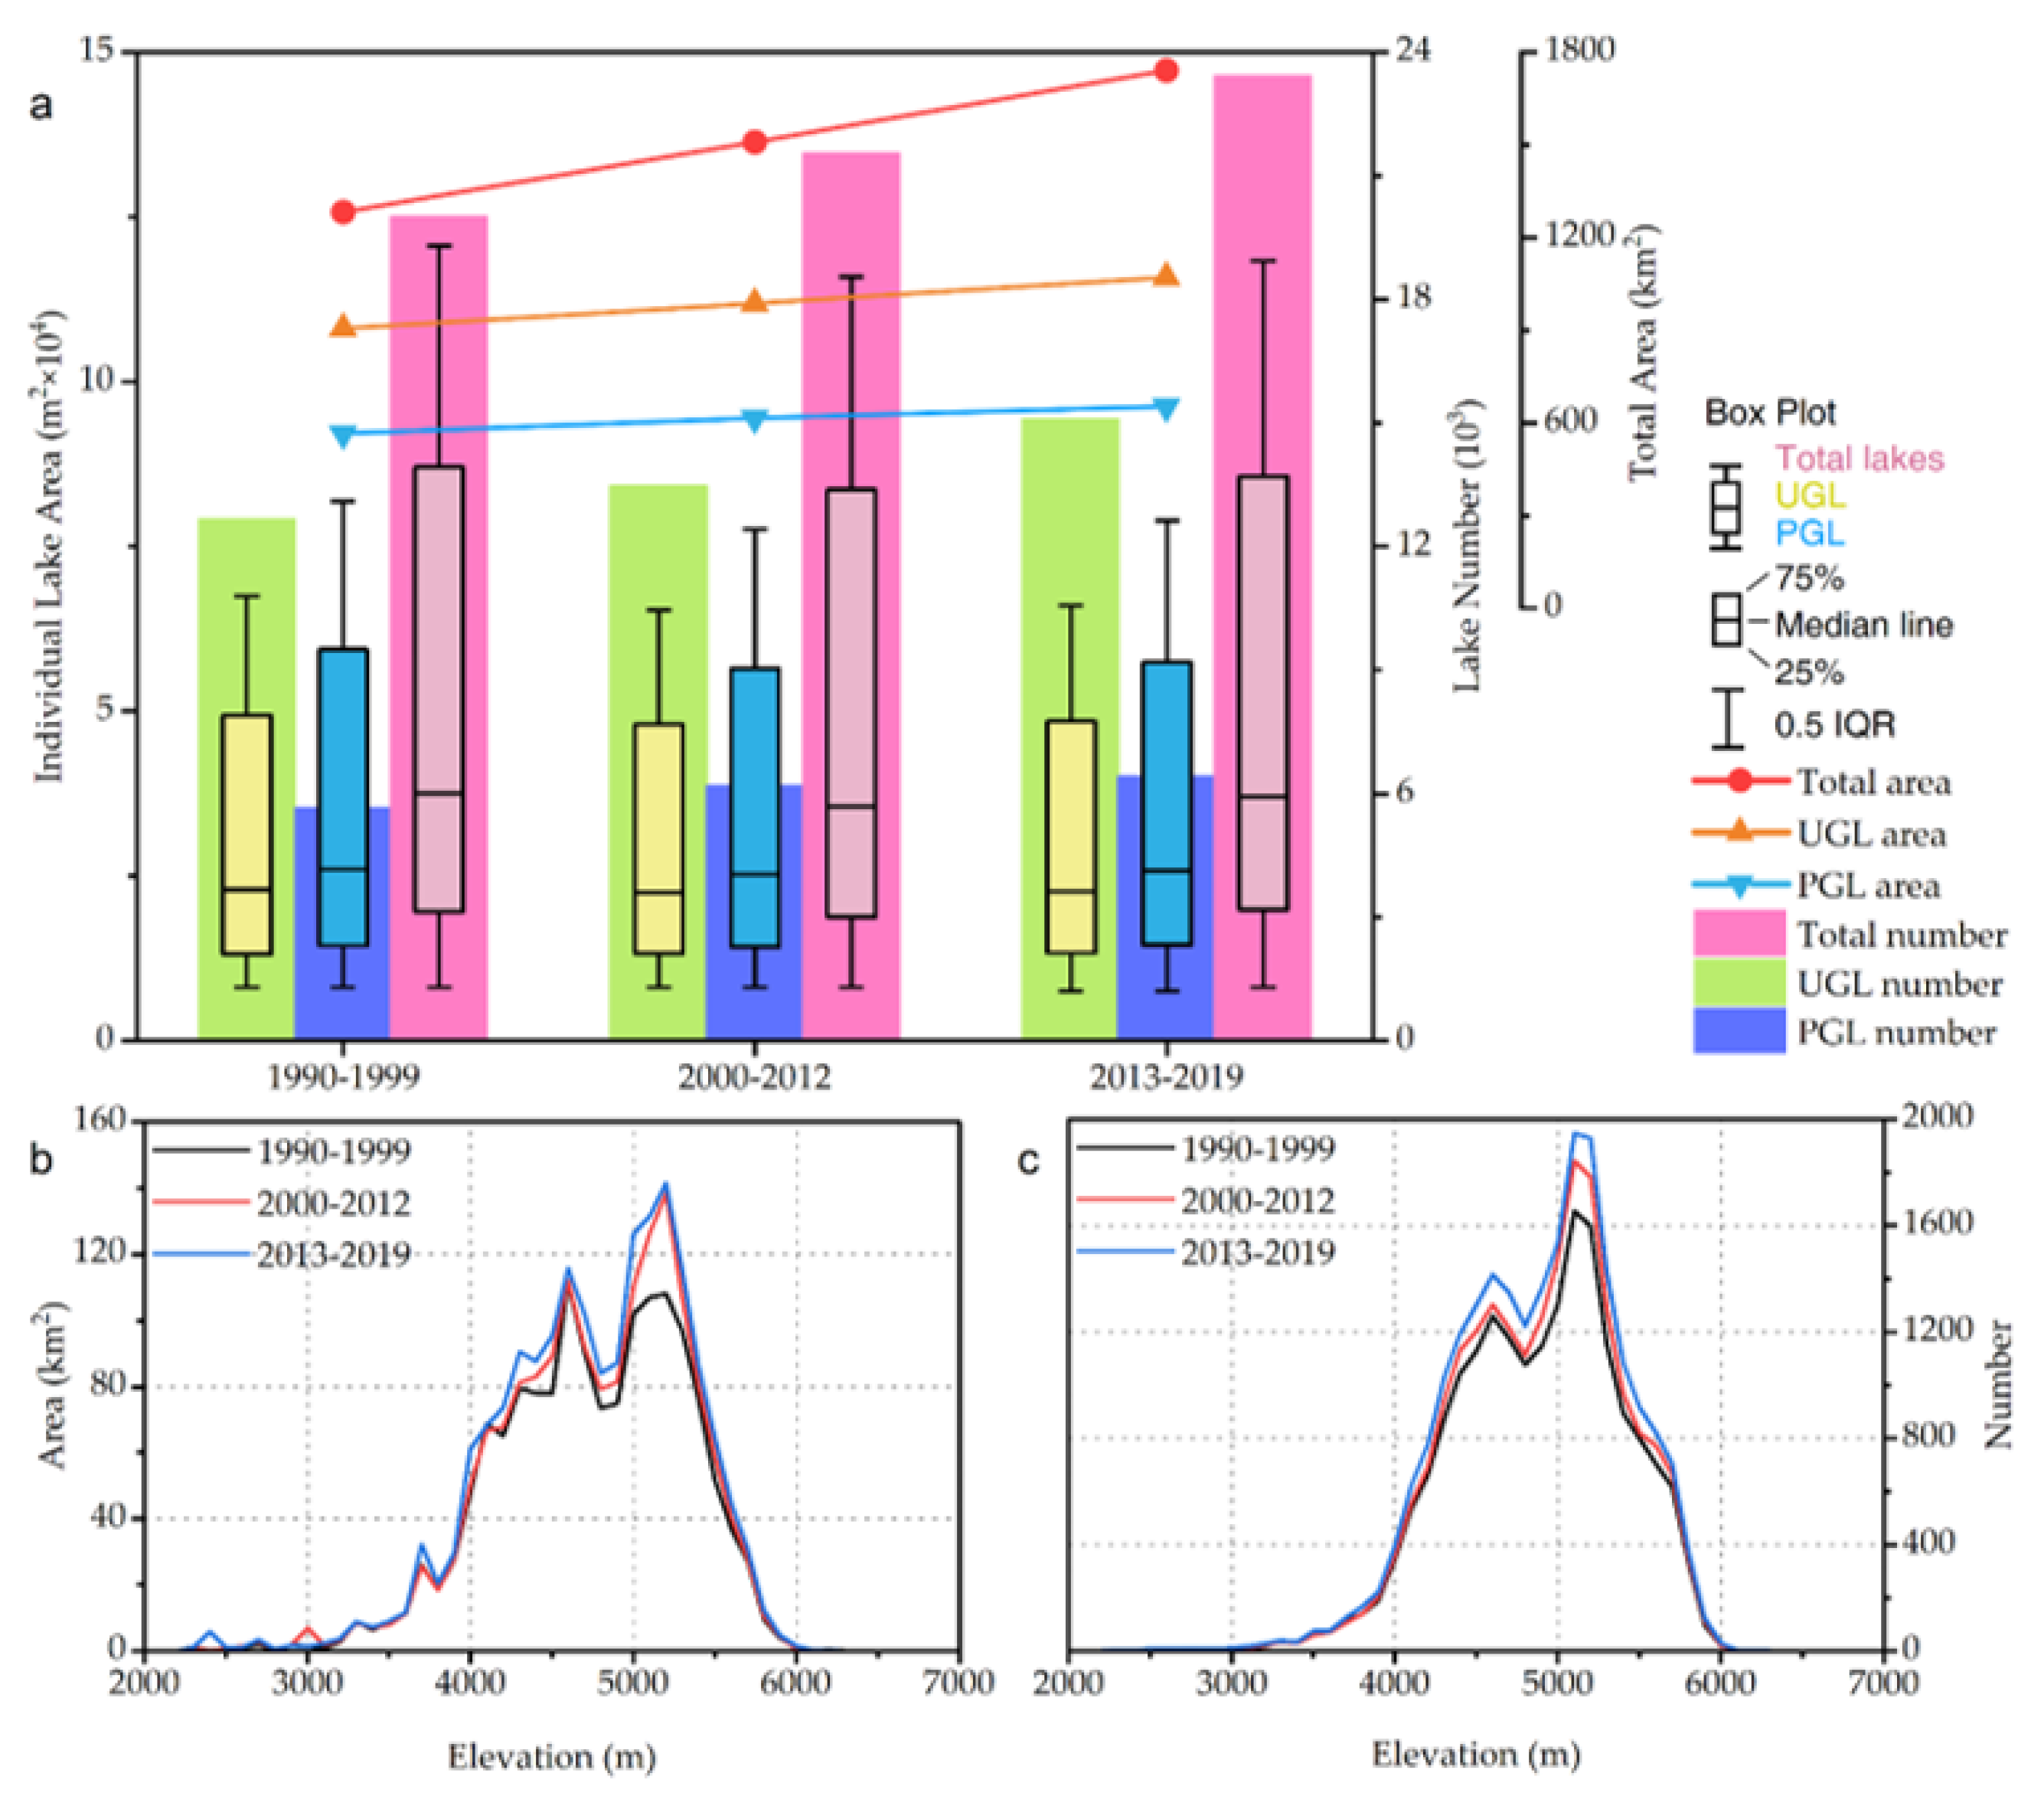
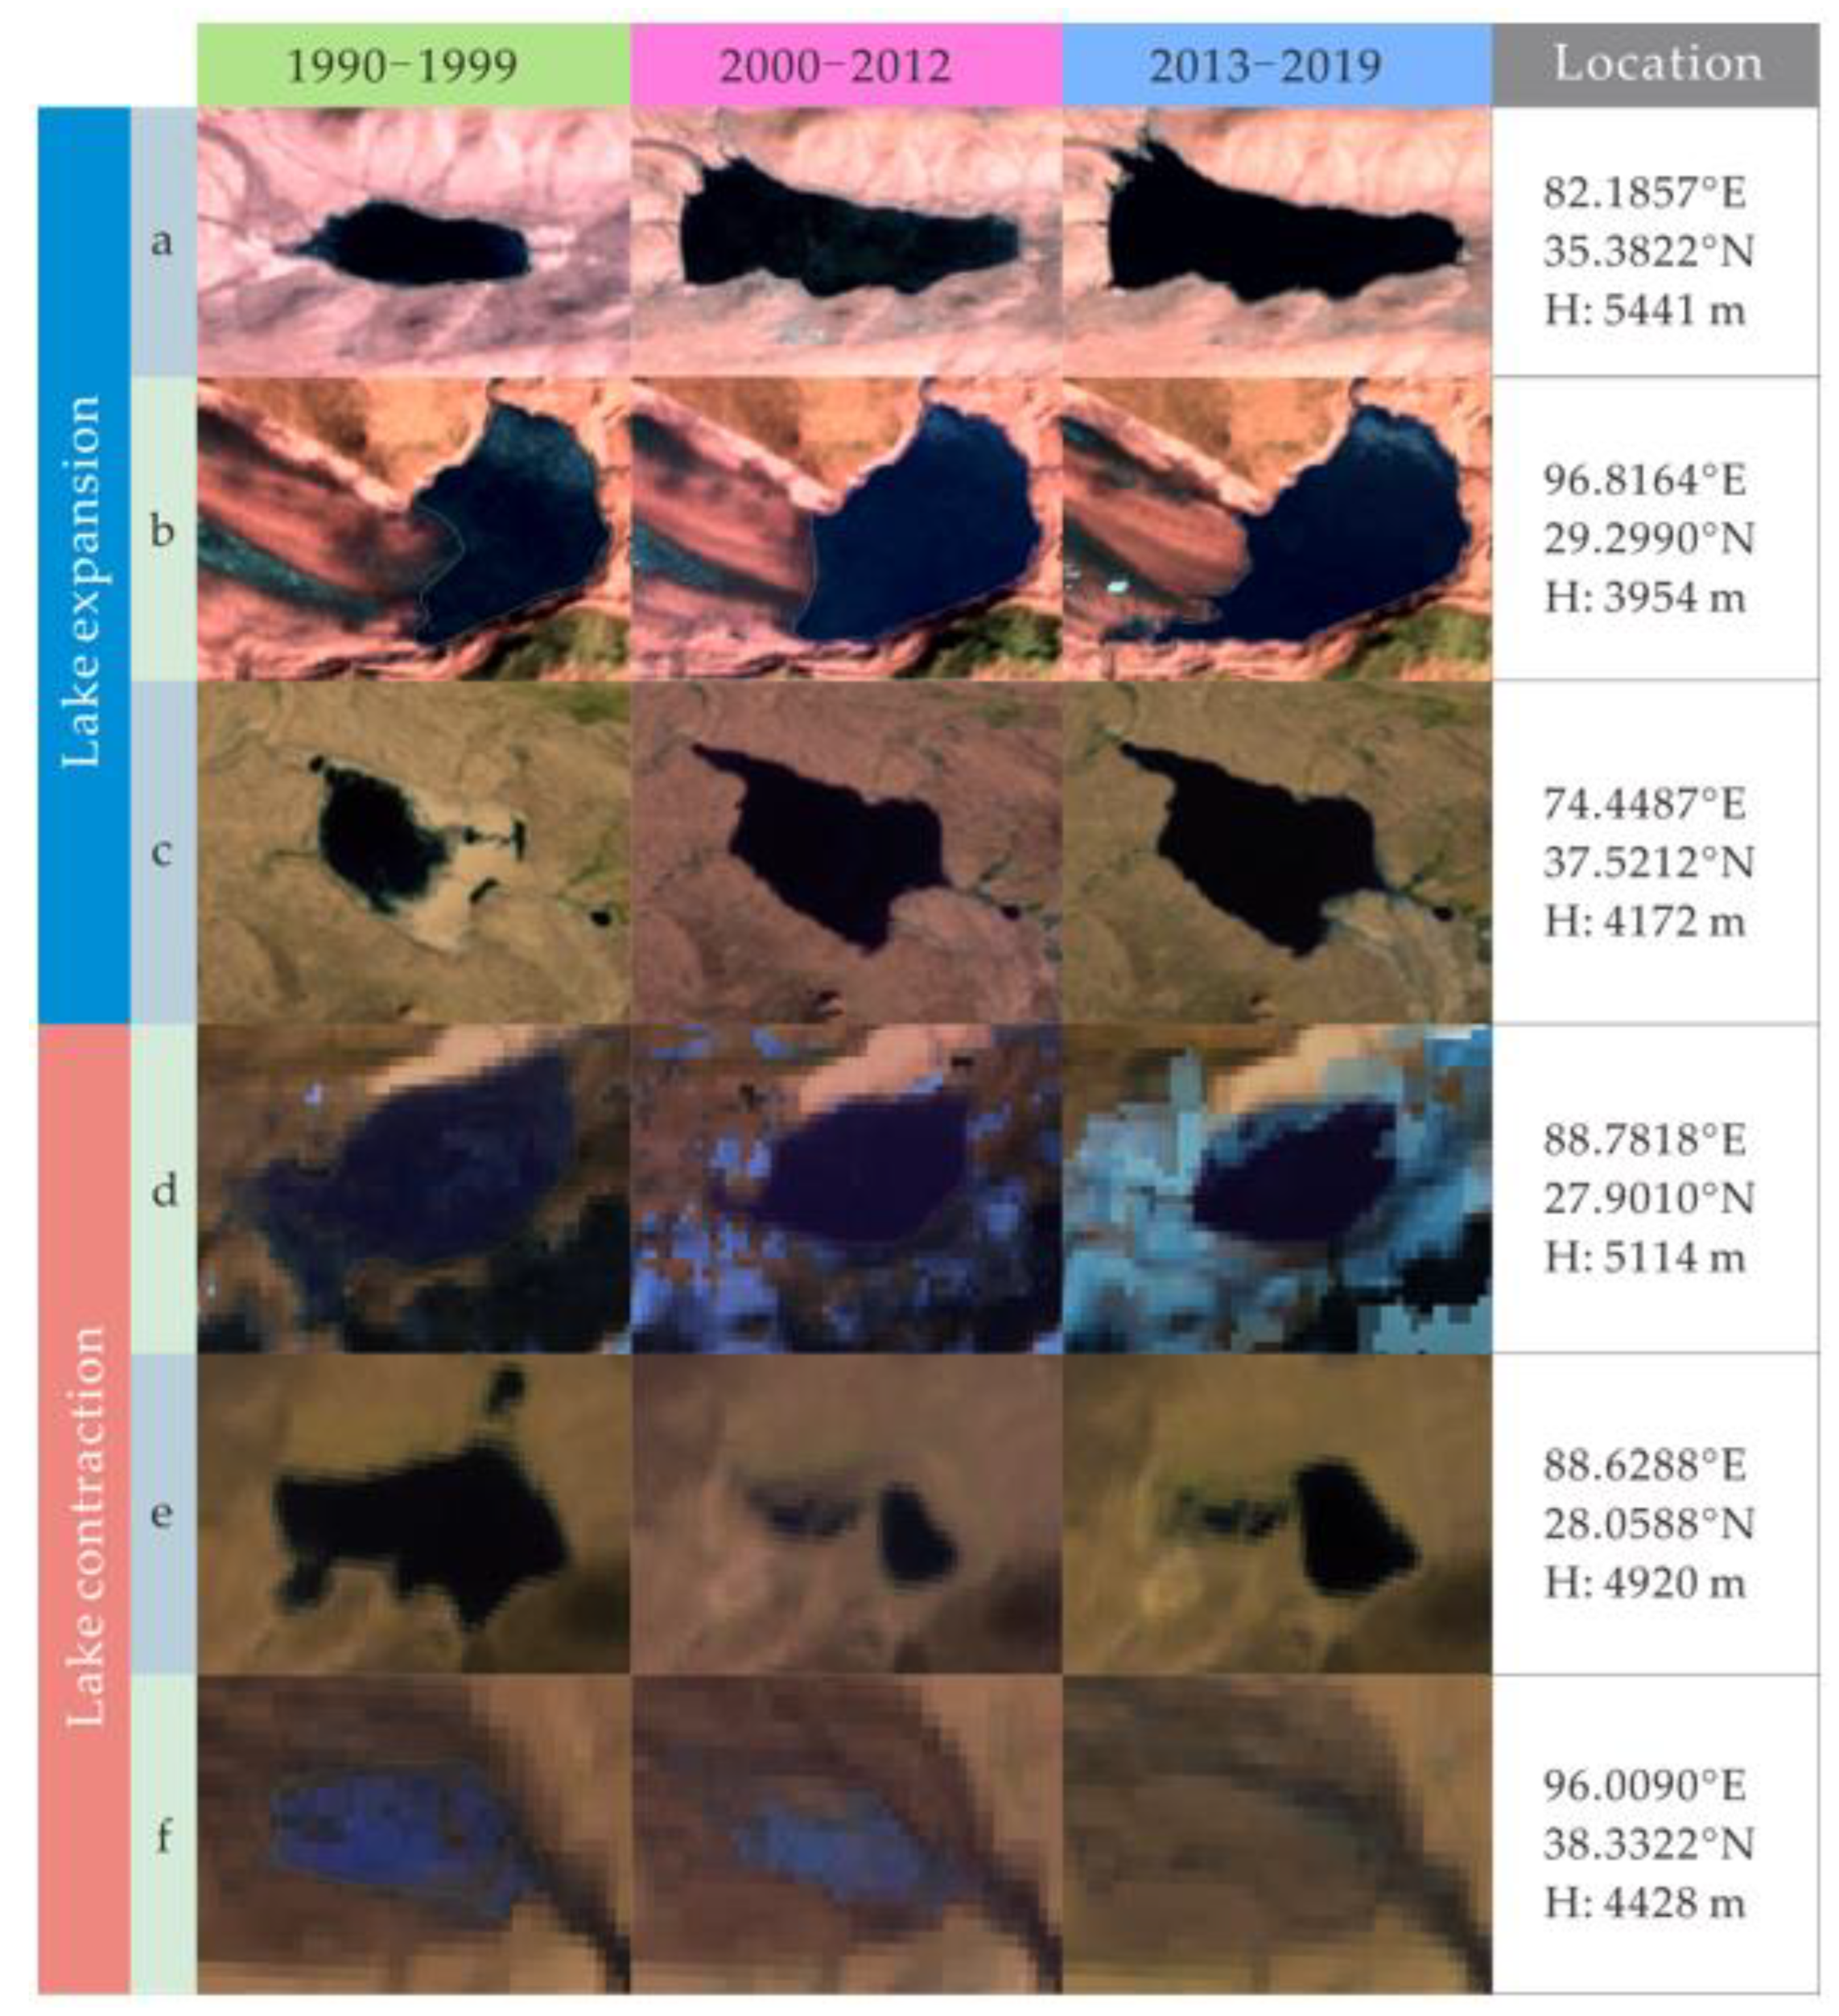
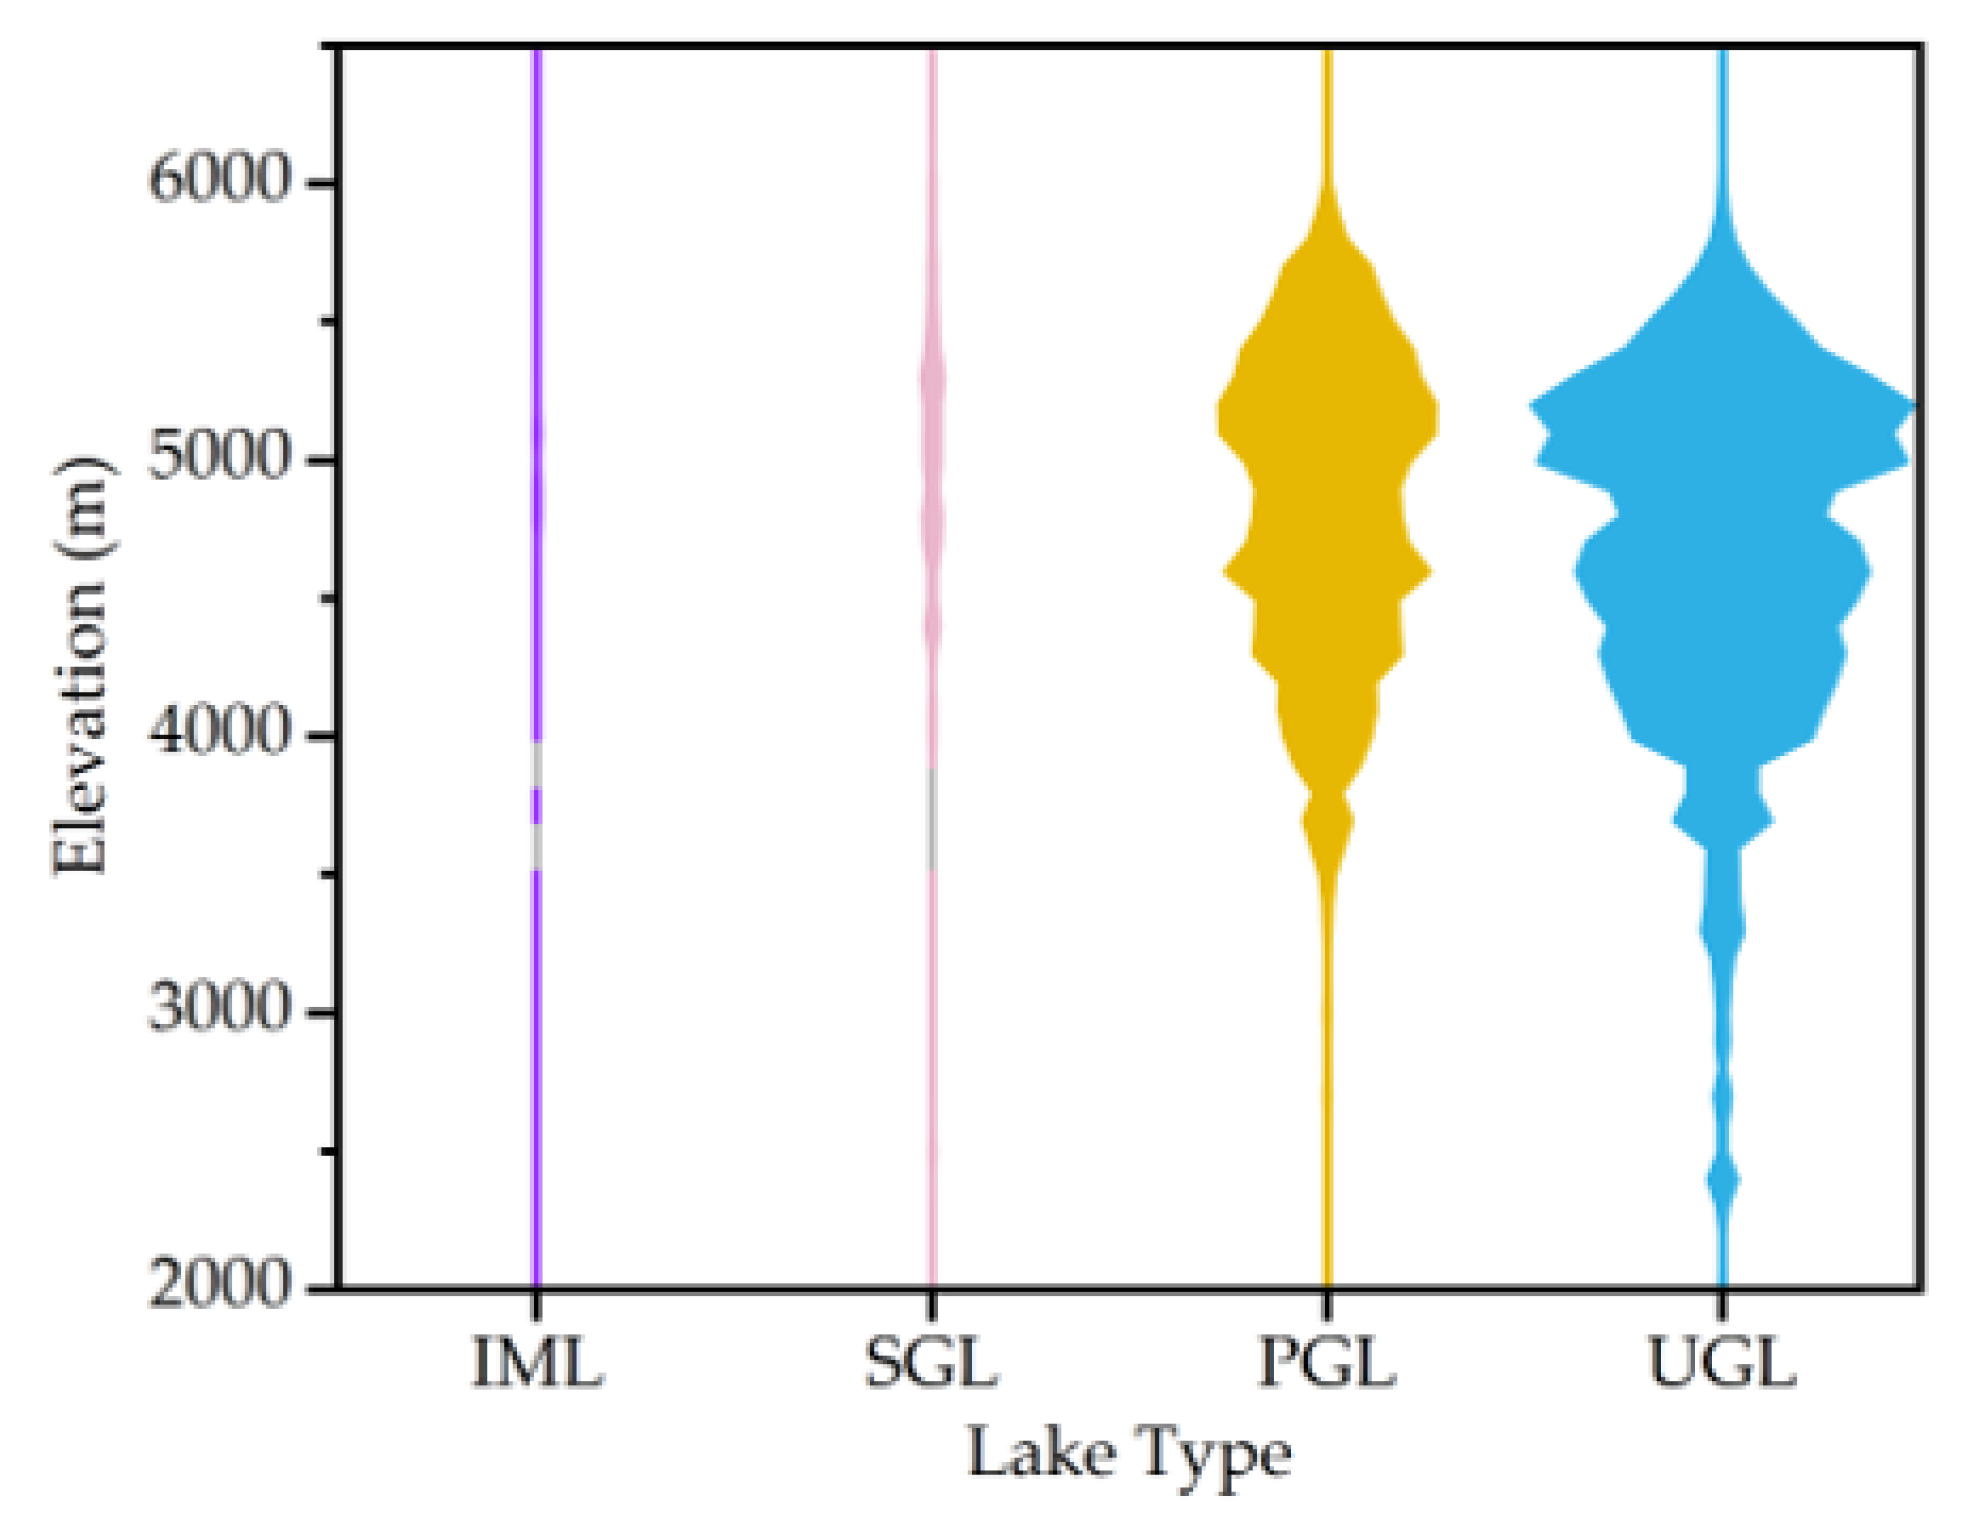
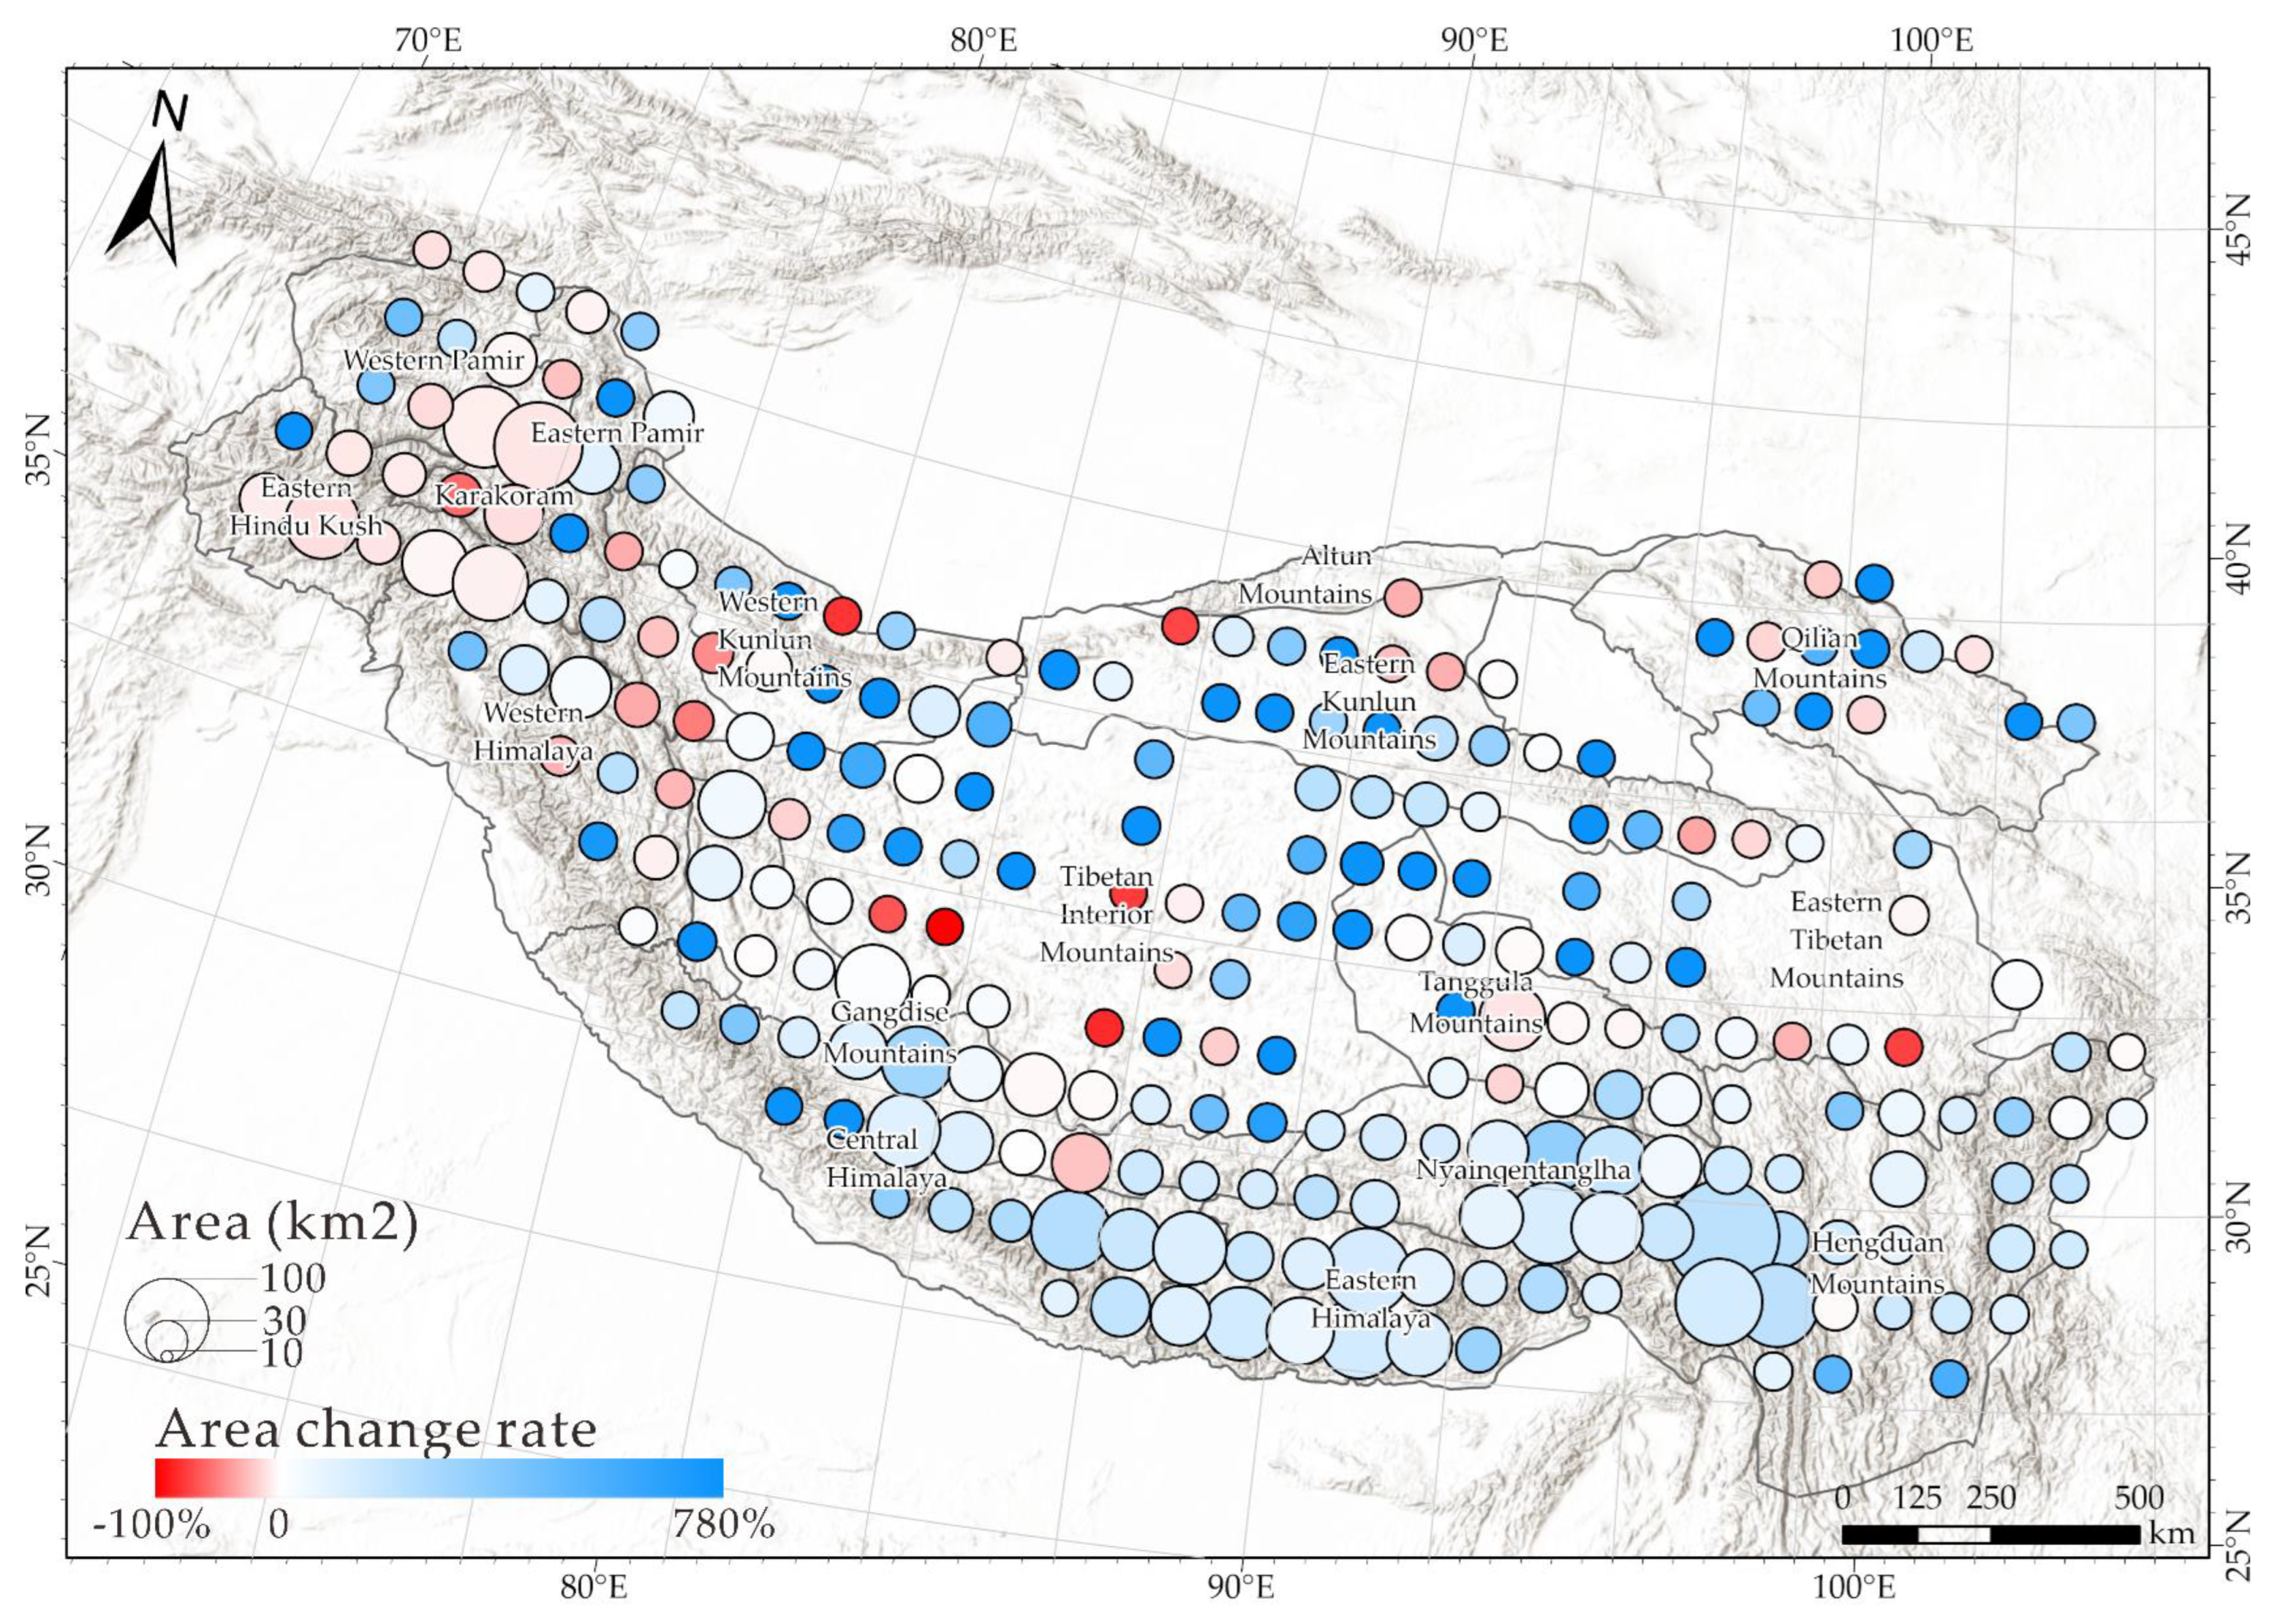
4.2. Temporal and Spatial Distribution of Glacial Lakes

From the first period (1990–1999) to the last period (2013–2019), the overall numbers and cumulative areas of glacial lakes are all increased, in which the UGL and PGL make the largest contribution to the lake area increase under the effect of glacial retreat (see Figure 5a). Although some glacial lakes are contracting or even disappearing, six glacial lakes with significantly expanded or contracted changes were selected as examples to show their detailed outline changes in Figure 6. The area of glacier lakes distributed at elevation from 4000 to 5300 m above sea level (a.s.l.) increased most apparently (about 199.32 km2), while the number increased most sharply (about 3136) for the lakes with elevation from 4000 to 5900 m (see Figure 5b,c). Between 5300 and 5900 m, the number of glacial lakes has increased as well, but the area expansion was smaller compared to the range of 4000 to 5300 m (exception of a few glacial lakes with a dramatic increase in area, e.g., Figure 6), indicating many small glacial lakes are formed within this elevation range. The increase in glacial lake number at higher elevations (above than 4000 m a.s.l.), as well as the number of ultra-small glacial lakes (the area is between 0.001 and 0.0081 km2) that have been studied but not considered in this paper [10], suggests that glaciers start retreating at higher elevations [30,45].
Different glacial lake types have distinct characteristics in altitude distribution, and their numbers and areal distribution show the same increasing or decreasing trend with the increase in altitude. Most of the glacial lakes are distributed within the range of 3000 to 6000 m a.s.l., in which UGLand PGL are the dominant cases (see Figure 5). Whereas SGL and IML are small in number and area, their changing trends were not prominent and do not play a large role in driving the overall glacial lake trends in the TP (e.g., in the last period of 2013–2019, see Figure 7).
The number and area change rate of glacial lakes for the three study periods were analyzed in different mountain regions (Figure 8 and Table 1). Figure 8 and Figure 9 show the lake types and area change rate on 1° × 1° grids. Table 1 lists the tabulated data of glacial lake changes. The results show that Western Pamir and Eastern Hindu Kush presented a noticeable negative change in glacial lake areas, with decreases of 2.937 km2 and 8.651 km2, respectively. By contrast, the total area of glacial lakes in the Western Kunlun Mountains, Eastern Kunlun Mountains, and Tibetan Interior Mountains increased significantly, owing to the retreating and thinning of the glaciers [14,30,135,136,137]. The increase in glacial lake areas was also observed in the Qilian Mountains, Central Himalaya, Nyainqêntanglha, and Hengduan Mountains. No significant change of glacial lakes was observed in the Karakoram.
In order to observe the changes of glacial lake areas in a more detailed manner, we took 1° × 1° as a grid unit to make the analysis (see Figure 8). As can be seen from Figure 8, in some mountain-wide regions, the number and area change trends of glacial lake areas in some places are contrary to the overall trend of the whole region (such as the west edge of the West Pamir and Qilian Mountains). Current studies targeting the TP glacial lakes did not provide an in-depth analysis of interior TP [15,26,30], since there are fewer glaciers in the interior TP. Therefore, fewer glacial lakes are developed within 10 km of the glacier outline compared to the entire TP, which does not have a dominant effect on the overall variability of all glacial lakes within the TP. In addition, the distribution percentages of the four types of glacial lakes were counted with the data of the third period (2013–2019) as an example (Figure 9). SGL was mainly distributed in the Nyainqêntanglha region, and a small amount was also distributed in the Himalayas. The west–south–southeast zone of the TP is composed of Western Pamir, Eastern Hindu Kush, Karakoram, the Himalayas and Nyainqêntanglha. The area of PGL accounts for about half of all glacial lakes, and the trend is expanding. In the interior, north and east of the TP, the UGL occupies the vast majority of glacial lakes. There are no large-scale glaciers in these areas, most of them are small independent glaciers, and the interaction between glacial lakes and glaciers is weak [30], so climate factors such as precipitation are easier to affect the change of glacial lakes. Zhang et al. [74] also found that the Inner TP is becoming wetter, while the southern TP is becoming dryer.

5. Discussion

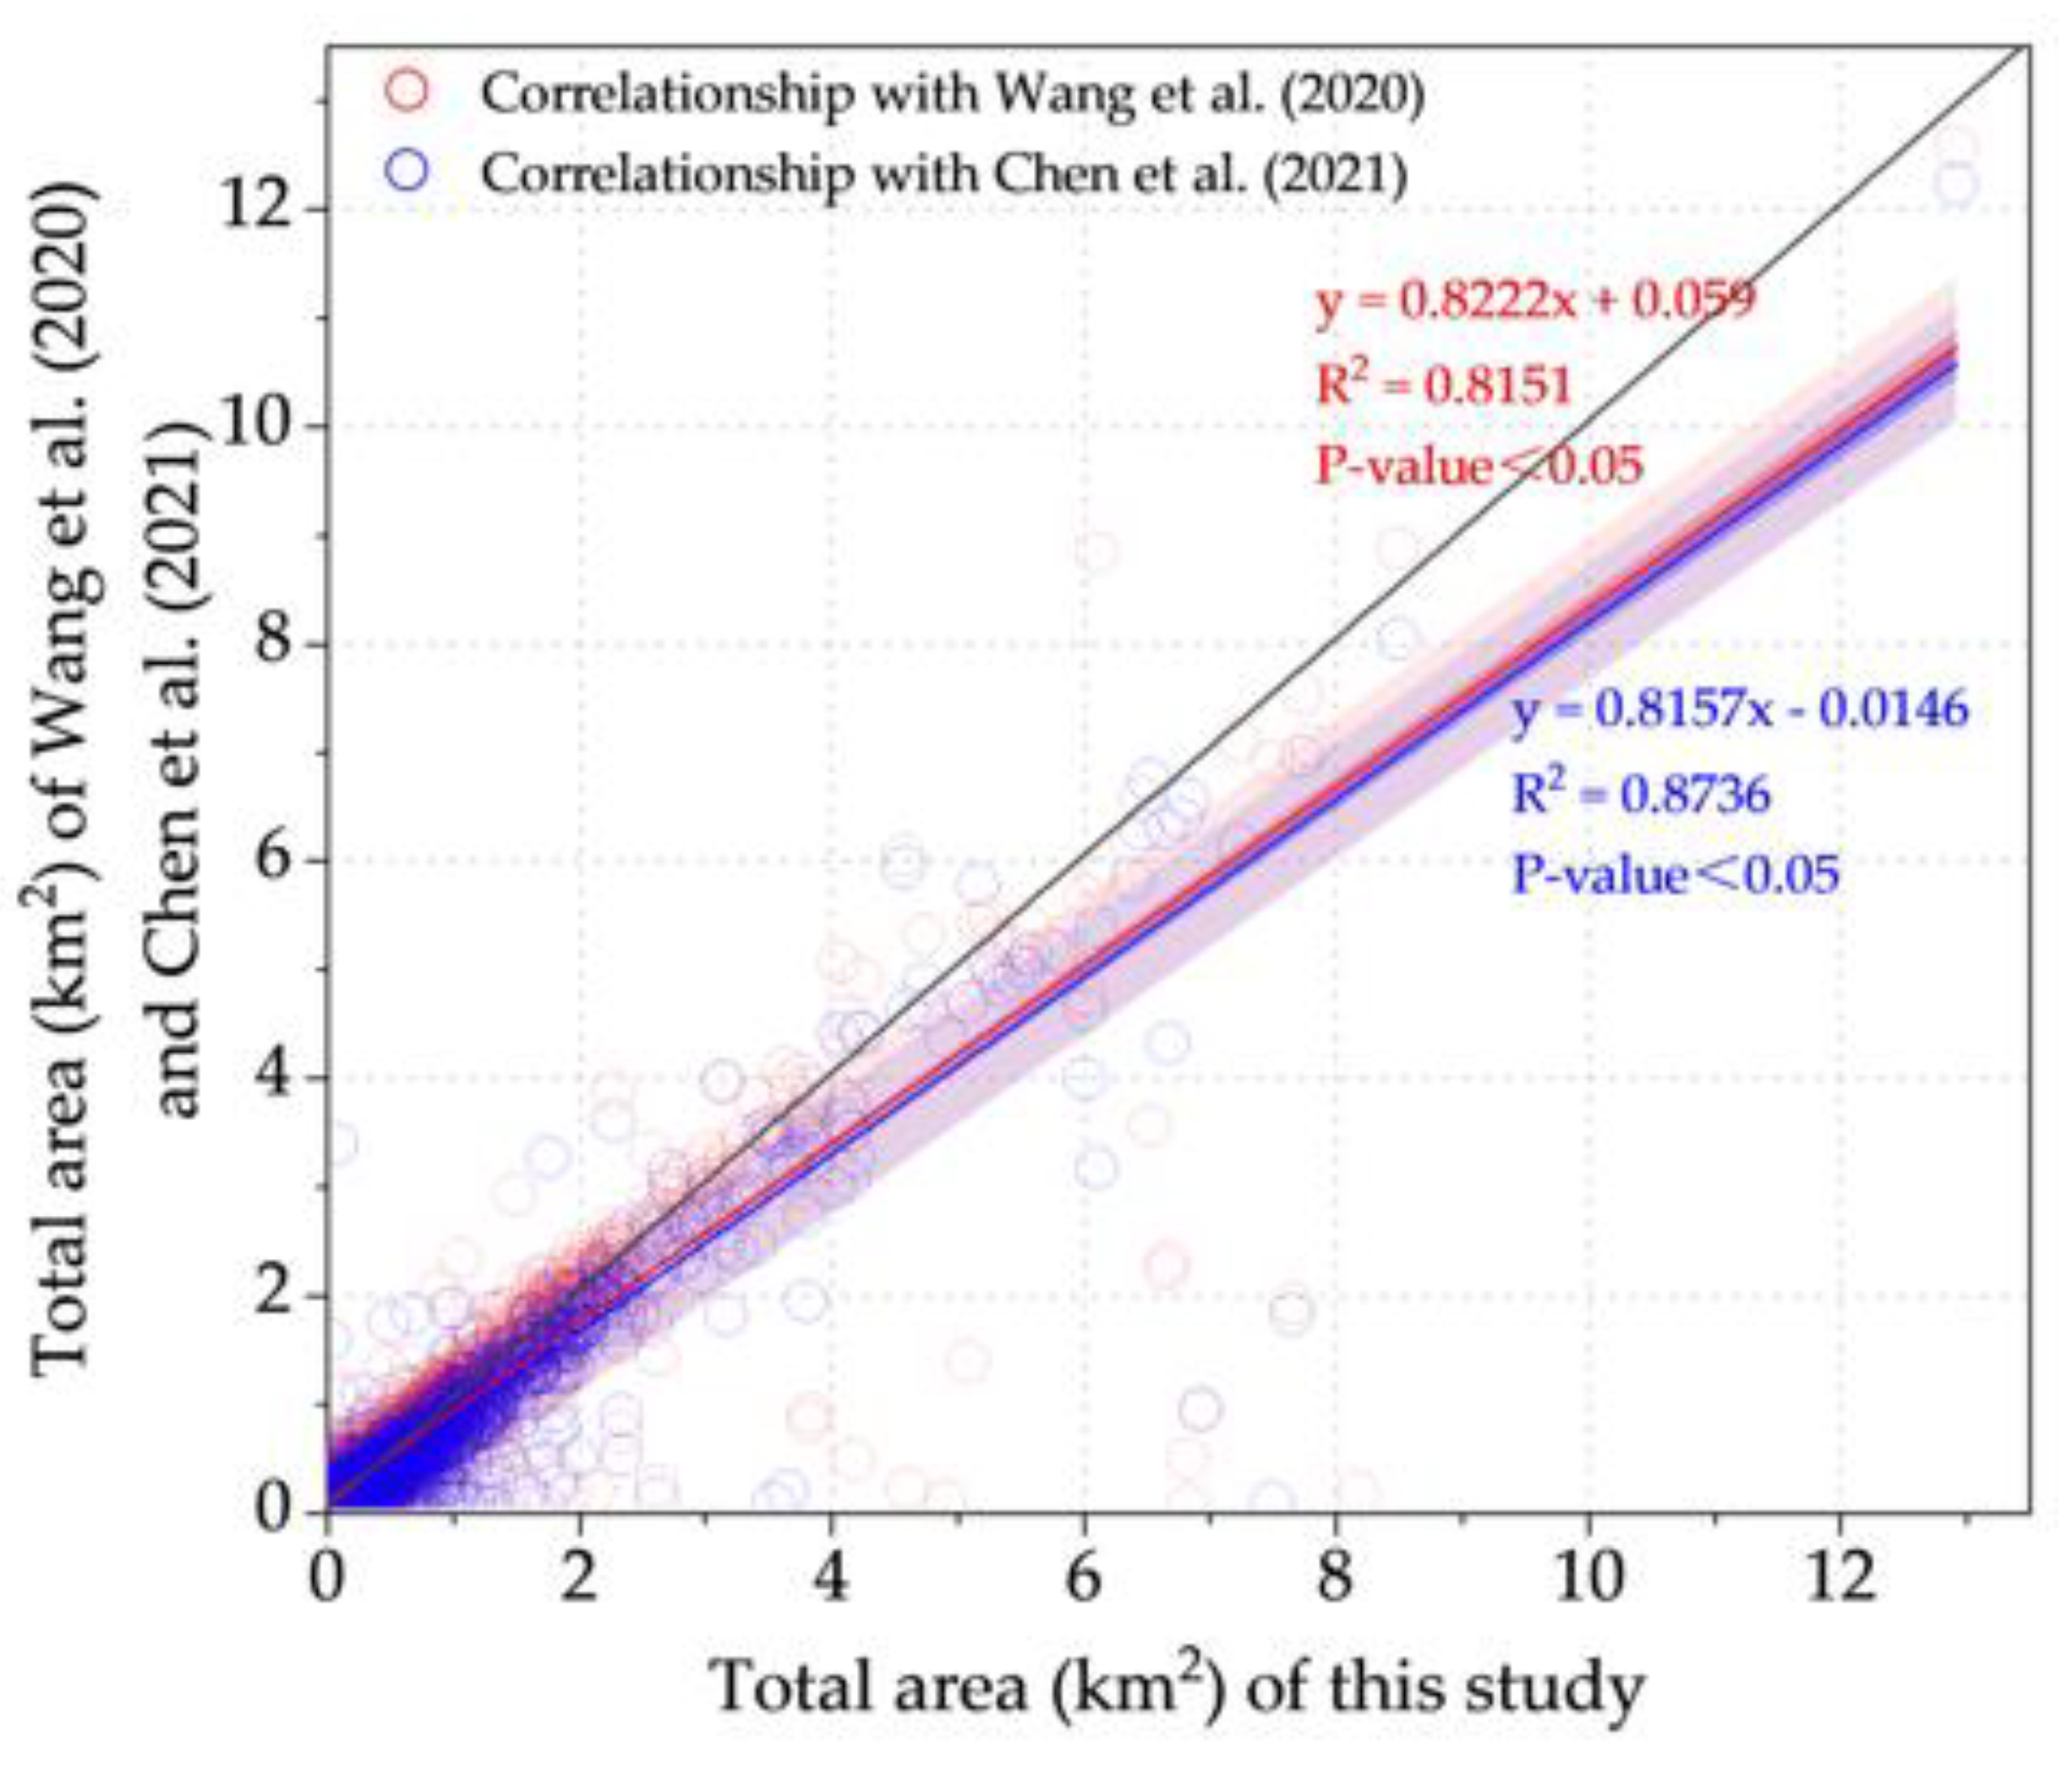
5.1. Comparison with Other Glacial Lake Datasets

The deficiencies of state-of-the-art glacial lake inventories of the TP lie in the limited spatial and temporal resolution. Some inventories only cover small regions with significant missing data [64]; others have only one to two periods of mapping data [15,20] or cover only recent periods [30]. However, limited by the quality and quantity of early satellite images, it is difficult to conduct year-by-year mapping of the whole TP glacial lakes. In this regard, we adopted a composite image technique that has not been applied in the field of glacial lake mapping on the whole TP. Multi-year composited images with no or few clouds and no terrain shading were selected and fused into a single image, and glacial lake boundaries were mapped.
However, the differences in spatial and temporal coverage, as well as the different minimum threshold areas used in lake mapping, also brings difficulties to a comparative evaluation. Because of these limitations, we compared only those studies having a glacier area larger or equal to 0.0081 km2 for the comparison analysis. With the same or larger study area (TP or HMA), the same minimum threshold area (0.0081 km2), and definition of the location of a glacial lake (with the distance of 10 km from the nearest glacier outline), we found that the glacial inventories of Chen et al. [30] and Wang et al. [15] are analogous and hence used to make a comparative analysis with our inventory.
Within the same minimum threshold area and spatial region (only glaciers within the TP range in their database are considered), glacial lakes number and total area are statistically analyzed. As shown in Table 2, there are noticeable differences among the three datasets. The inventory from Chen et al. [30] has the least number and smallest total area, whereas the inventory from Wang et al. [15] is closer to this study.
Since Chen et al. [30] focused on short-term variability in recent years, their inventory is annual-based covering the time period from 2008 to 2017, which was greatly constrained by the image quality of the analyzed years. Hence, many lakes are omitted, which may be the main reason for the significant difference between the two inventories. Although Wang et al. [15] mapped more glacial lakes compared to Chen et al. [30], they only mapped two separate periods of data for 1990 and 2018, leaving considerable data gaps. To further compare, we put the three data inventories together for examination and randomly selected the more prominent parts of the regions of discrepancy for double-checking. According to Figures S1–S3 (Supplement), Wang et al. [15]’s inventory does not cover well in some regions and omits a considerable number of glacial lakes, and Figures S4 and S5 (Supplement) show the omission of Chen et al. [30]’s data in some regions. These comparisons prove that the proposed research can better fill the gaps in Chen et al. [30]’s inventory in terms of temporal coverage, and they can also better fill the gaps in Wang et al. [15]’s regional coverage.
After carefully examining these three inventories, five reasons that may lead to significant differences were found: (i) To obtain a more accurate distribution range of glacial lakes, the GAMDAM glacier inventory with higher quality was selected in our study to create the buffer of 10 km of distance from the glacier outlines to lakes [109,110,117], while the other two datasets applied RGI and other glacier inventories. Different glacier inventories are bound to create a difference in buffers, which leads to different numbers in the glacial lake datasets; (ii) due to the limited quality of satellite imagery in the early stages, we categorized time-series satellite images into three periods to extract the glacial lake boundaries, respectively. However, the other two datasets took images from each year or the closest year to the given one; (iii) there are differences in the acquisition month on the selection of imagery. We chose July to November as a conservative range, but Wang et al. [15] chose a loose time of June to November; (iv) we applied more accurate terrain data of AW3D30 DEM to avoid the influence of mountain shadow and some glaciers. On the other hand, Chen et al. [30] and Wang et al. [15] chose SRTM DEM, which has comparatively lower in accuracy in steep mountains e.g., [138,139]; (v) the difference caused by cross-validation and manual correction. Each interpreter will inevitably have subjective differences in their understanding of glacial lakes, which also leads to differences in results.
Considering the difference in time coverage of the three datasets, we selected the most recent inventory from the three datasets, i.e., 2013–2019 of our dataset, 2018 of Wang et al. [15] and 2017 of Chen et al. [30] to conduct the correlation analysis on spatial distributions. To make statistics clear, we composited the total glacial lake areas in the TP on the 0.1° × 0.1° grids and then conducted correlation analysis. As shown in Figure 10, the inventory of this study is significantly correlated with the datasets of Wang et al. [15] and Chen et al. [30]. The distribution of most points is close, and two curves with high correlation are fitted. Combined with the comparison made by Chen et al. [30], it is proved that there is an excellent consistency among the three sets of data.
Above all, compared with other glacial lake inventories, our inventory covers a long temporal range and counts most glacial lakes in the TP with a reasonable uncertainty to the maximum extent possible. The high correlation with other datasets confirms the effectiveness and reliability of the results.

5.2. Limitations and Perspectives

In the process of this study, there were some known but not fully resolved problems and limitations that need to be acknowledged. Firstly, restricted by the spatial resolution of satellite images, not all glacial lakes of all sizes were mapped; parts of glacial lakes with an area of less than 0.0081 km2 were excluded. Next, although we applied a fusion image approach to maximize the quality of the images, there were still some unavoidable clouds or mountain shadows ignored. As a result, a portion of the glacial lake would be missed. Meanwhile, due to the occurrence of extreme weather, some lakes were covered by snow or ice floes, making it difficult to map the boundaries of all the glacial lakes. As more satellites with high-resolution and high revisit capabilities are launched and more powerful cloud computing platforms are established, it is possible to extend our datasets better and track the change of glacial lakes in the TP for mapping and monitoring resources as well as associated hazards.

6. Conclusions

Integrating Landsat remote sensing images with GEE cloud-computing power, a detailed glacial lake inventory of the whole TP was mapped. The ID, area, length, mountain-wide range, and river basin of the glacial lakes were recorded in the attribute table of the dataset. Uncertainty analysis for glacial lakes shows that the average uncertainty for the whole region is about 17.5%. The inventory has a high degree of consistency with other published works through the correlation analysis, which thoroughly verifies its reliability and scientificity.
We mapped a total of 22,468 glacial lakes during 2013–2019 with the area of 1767.99 km2, which makes our inventory the largest known dataset of glacial lakes in the TP. Compared with the first period (1990–1999), the number of glacial lakes increased by 3285 (17.12%) and the area increased by 258.82 km2 (17.15%). Glacial lakes are distributed unevenly in all the 17 mountains of the TP, and the change rate of the area is different in each subregion. The elevation distribution of the glacial lake is analyzed with an interval of 100 m, and it is found that glacial lakes are mainly distributed in the range of 4400~5400 m a.s.l., with an evident expansion trend in recent decades. As glaciers retreat and the climate changes, the expansion of glacial lakes is still ongoing, especially for UGL and PGL. This freely available dataset will provide primary glacial lake data for all researchers interested in the TP. Based on this multi-period glacial lake inventory, the historical evolution of hazardous glacial lakes can be analyzed and their future stable states can be predicted. This will support the study of climate change–glacier–glacial lake–GLOF interactions and hydro-climate models throughout the cryosphere.

Supplementary Materials

The following are available online at https://www.mdpi.com/article/10.3390/rs15020416/s1, Figure S1: The glacial lake boundaries from these three inventories for randomly selected region #1. The base maps are sourced from (a) Landsat 5 composite imagery and (b) ESRI online maps. The blue polygons are from the 1990–1999 period of this study; red polygons are from 1990 and those of Wang et al. [15]; yellow polygons are from 2008 and those of Chen et al. [30], Figure S2: The glacial lake boundaries from these three inventories for randomly selected region #2. The base maps are sourced from (a) Landsat 8 composite imagery and (b) ESRI online maps. The blue polygons are from the 2013–2019 period of this study; the red polygons are from 2018 and those of Wang et al. [15]; yellow polygons are from 2017 and those of Chen et al. [30], Figure S3: The glacial lake boundaries from these three inventories for randomly selected region #3. The base maps are sourced from (a) Landsat 8 composite imagery and (b) ESRI online maps. The blue polygons are from the 2013–2019 period of this study; the red polygons are from 2018 and those of Wang et al. [15]; the yellow polygons are from 2017 and those of Chen et al. [30], Figure S4: The glacial lake boundaries from these three inventories for randomly selected region #4. The base map is sourced from ESRI online maps. The blue polygons are from the 2013–2019 period of this study; the red polygons are from 2018 and those of Wang et al. [15]; the yellow polygons are from 2017 and those of Chen et al. [30], Figure S5: The glacial lake boundaries from these three inventories for randomly selected region #5. The base map is sourced from ESRI online maps. The blue polygons are from the 2013–2019 period of this study; the red polygons are from 2018 and those of Wang et al. [15]; the yellow polygons are from 2017 and those of Chen et al. [30].

Author Contributions

Conceptualization, X.D. and X.F.; methodology, X.D., X.F. and A.P.Y.; software, X.D. and A.P.Y.; validation, X.W. and R.T.; formal analysis, X.D. and J.X.; writing—original draft preparation, X.D., X.F., A.P.Y.; writing—review and editing, X.W., J.X., R.T., M.L., C.v.W. and Q.X.; supervision, X.F. and Q.X.; project administration, X.F. and Q.X.; funding acquisition, X.F. and Q.X. All authors have read and agreed to the published version of the manuscript.

Funding

This research was funded by the National Science Fund for Distinguished Young Scholars of China, grant number 42125702, the Natural Science Foundation of Sichuan Province, grant No. 2022NSFSC0003 and 2022NSFSC1083, and the Fund of SKLGP, grant number SKLGP2019Z002.

Data Availability Statement

“The Tibetan Plateau Glacial Lake Inventory (TPGL)” at https://doi.org/10.5281/zenodo.5574289 accessed on 22 November 2022.

Acknowledgments

The authors would like to thank the following personnel for their participation in manual vectorization and correction: Lan Chen, Chengyong Fang, Liyang Jiang, Shikang Liu, Xinxin Tao, Zehao Xu, and Yinshuang Yang.

Conflicts of Interest

The authors declare no conflict of interest.

References

  1. Qiu, J. China: The third pole. Nature 2008, 454, 393–396. [Google Scholar] [CrossRef] [PubMed] [Green Version]
  2. Yao, T.D.; Thompson, L.; Yang, W.; Yu, W.S.; Gao, Y.; Guo, X.J.; Yang, X.X.; Duan, K.Q.; Zhao, H.B.; Xu, B.Q.; et al. Different glacier status with atmospheric circulations in Tibetan Plateau and surroundings. Nat. Clim. Change 2012, 2, 663–667. [Google Scholar] [CrossRef]
  3. Bolch, T.; Kulkarni, A.; Kaab, A.; Huggel, C.; Paul, F.; Cogley, J.G.; Frey, H.; Kargel, J.S.; Fujita, K.; Scheel, M.; et al. The state and fate of Himalayan glaciers. Science 2012, 336, 310–314. [Google Scholar] [CrossRef] [Green Version]
  4. Brun, F.; Berthier, E.; Wagnon, P.; Kaab, A.; Treichler, D. A spatially resolved estimate of High Mountain Asia glacier mass balances, 2000–2016. Nat. Geosci. 2017, 10, 668–673. [Google Scholar] [CrossRef] [Green Version]
  5. Gardner, A.S.; Moholdt, G.; Cogley, J.G.; Wouters, B.; Arendt, A.A.; Wahr, J.; Berthier, E.; Hock, R.; Pfeffer, W.T.; Kaser, G.; et al. A reconciled estimate of glacier contributions to sea level rise: 2003 to 2009. Science 2013, 340, 852–857. [Google Scholar] [CrossRef] [PubMed] [Green Version]
  6. Kääb, A.; Treichler, D.; Nuth, C.; Berthier, E. Brief Communication: Contending estimates of 2003–2008 glacier mass balance over the Pamir–Karakoram–Himalaya. Cryosphere 2015, 9, 557–564. [Google Scholar] [CrossRef] [Green Version]
  7. Zemp, M.; Huss, M.; Thibert, E.; Eckert, N.; McNabb, R.; Huber, J.; Barandun, M.; Machguth, H.; Nussbaumer, S.U.; Gartner-Roer, I.; et al. Global glacier mass changes and their contributions to sea-level rise from 1961 to 2016. Nature 2019, 568, 382–386. [Google Scholar] [CrossRef] [Green Version]
  8. Shean, D.E.; Bhushan, S.; Montesano, P.; Rounce, D.R.; Arendt, A.; Osmanoglu, B. A Systematic, Regional Assessment of High Mountain Asia Glacier Mass Balance. Front. Earth Sci. 2020, 7, 363. [Google Scholar] [CrossRef] [Green Version]
  9. Hugonnet, R.; McNabb, R.; Berthier, E.; Menounos, B.; Nuth, C.; Girod, L.; Farinotti, D.; Huss, M.; Dussaillant, I.; Brun, F.; et al. Accelerated global glacier mass loss in the early twenty-first century. Nature 2021, 592, 726–731. [Google Scholar] [CrossRef]
  10. Salerno, F.; Thakuri, S.; D’Agata, C.; Smiraglia, C.; Manfredi, E.C.; Viviano, G.; Tartari, G. Glacial lake distribution in the Mount Everest region: Uncertainty of measurement and conditions of formation. Global Planet. Change 2012, 92–93, 30–39. [Google Scholar] [CrossRef]
  11. Fujita, K.; Sakai, A.; Nuimura, T.; Yamaguchi, S.; Sharma, R.R. Recent changes in Imja Glacial Lake and its damming moraine in the Nepal Himalaya revealed by in situ surveys and multi-temporal ASTER imagery. Environ. Res. Lett. 2009, 4, 045205. [Google Scholar] [CrossRef]
  12. Clague, J.J.; Evans, S.G. A review of catastrophic drainage of moraine-dammed lakes in British Columbia. Quat. Sci. Rev. 2000, 19, 1763–1783. [Google Scholar] [CrossRef]
  13. Mool, P.K.; Wangda, D.; Bajracharya, S.R.; Kunzang, K.; Gurung, D.R.; Joshi, S.P. Inventory of Glaciers, Glacial Lakes and Glacial Lake Outburst Floods. Monitoring and Early Warning Systems in the Hindu Kush-Himalayan Region: Bhutan; International Centre for Integrated Mountain Development: Kathmandu, Nepal, 2001; p. 227. Available online: https://lib.icimod.org/record/21962 (accessed on 22 November 2022).
  14. Song, C.Q.; Sheng, Y.W.; Ke, L.H.; Nie, Y.; Wang, J.D. Glacial lake evolution in the southeastern Tibetan Plateau and the cause of rapid expansion of proglacial lakes linked to glacial-hydrogeomorphic processes. J. Hydrol. 2016, 540, 504–514. [Google Scholar] [CrossRef] [Green Version]
  15. Wang, X.; Guo, X.Y.; Yang, C.D.; Liu, Q.H.; Wei, J.F.; Zhang, Y.; Liu, S.Y.; Zhang, Y.L.; Jiang, Z.L.; Tang, Z.G. Glacial lake inventory of high-mountain Asia in 1990 and 2018 derived from Landsat images. Earth Syst. Sci. Data 2020, 12, 2169–2182. [Google Scholar] [CrossRef]
  16. Yao, X.J.; Liu, S.Y.; Han, L.; Sun, M.P.; Zhao, L.L. Definition and classification system of glacial lake for inventory and hazards study. J. Geog. Sci. 2018, 28, 193–205. [Google Scholar] [CrossRef] [Green Version]
  17. Qin, D.H.; Yao, T.D.; Ding, Y.J.; Ren, J.W. Glossary of Cryosphere Science; China Meteorological Press: Beijing, China, 2014. [Google Scholar]
  18. Cao, X.C.; Liu, Z.Z.; Li, W.S. Glacial lake mapping and analysis of the potentially dangerous glacial lakes before Nepal 4 25 Earthquake in 2015. J. Glaciol. Geocryol. 2016, 38, 573–583. [Google Scholar]
  19. Chen, C.; Zheng, J.H.; Liu, Y.Q.; Xu, Z.L. The response of glacial lakes in the Altay Mountains of China to climate change during 1992–2013. Geogr. Res. 2015, 34, 270–284. [Google Scholar]
  20. Zhang, G.Q.; Yao, T.D.; Xie, H.J.; Wang, W.C.; Yang, W. An inventory of glacial lakes in the Third Pole region and their changes in response to global warming. Global Planet. Change 2015, 131, 148–157. [Google Scholar] [CrossRef]
  21. Veh, G.; Korup, O.; von Specht, S.; Roessner, S.; Walz, A. Unchanged frequency of moraine-dammed glacial lake outburst floods in the Himalaya. Nat. Clim. Change 2019, 9, 379–383. [Google Scholar] [CrossRef]
  22. Haeberli, W.; Schaub, Y.; Huggel, C. Increasing risks related to landslides from degrading permafrost into new lakes in de-glaciating mountain ranges. Geomorphology 2017, 293, 405–417. [Google Scholar] [CrossRef]
  23. Huggel, C.; Kaab, A.; Haeberli, W.; Teysseire, P.; Paul, F. Remote sensing based assessment of hazards from glacier lake outbursts: A case study in the Swiss Alps. Can. Geotech. J. 2002, 39, 316–330. [Google Scholar] [CrossRef] [Green Version]
  24. Woolway, R.I.; Kraemer, B.M.; Lenters, J.D.; Merchant, C.J.; O’Reilly, C.M.; Sharma, S. Global lake responses to climate change. Nat. Rev. Earth Environ. 2020, 1, 388–403. [Google Scholar] [CrossRef]
  25. Yang, K.; Ye, B.S.; Zhou, D.G.; Wu, B.Y.; Foken, T.; Qin, J.; Zhou, Z.Y. Response of hydrological cycle to recent climate changes in the Tibetan Plateau. Clim. Change 2011, 109, 517–534. [Google Scholar] [CrossRef]
  26. Zhang, G.Q.; Chen, W.F.; Li, G.; Yang, W.; Yi, S.; Luo, W. Lake water and glacier mass gains in the northwestern Tibetan Plateau observed from multi-sensor remote sensing data: Implication of an enhanced hydrological cycle. Remote Sens. Environ. 2020, 237, 111554. [Google Scholar] [CrossRef]
  27. Liu, C.; Mayor-Mora, R.; Sharma, C.K.; Xing, H.; Wu, S. Report on First Expedition to Glaciers and Glacier Lakes in the Pumqu (Arun) and Poiqu (Bhote-Sun Kosi) River Basins, Xizang (Tibet), China: Sino-Nepalese Investigation of Glacier Lake Outburst Floods in the Himalayas; Science Press: Beijing, China, 1988; pp. 1–192. [Google Scholar]
  28. Mool, P.K.; Bajracharya, S.R. Inventory of Glaciers and Glacial Lakes and the Identification of Potential Glacial Lake Outburst Floods (GLOFs) Affected by Global Warming in the Mountains of Himalayan Region; ICIMOD: Lalitpur, Nepal, 2003; Available online: https://data.tpdc.ac.cn/zh-hans/data/8bce06f3-c2ed-46a1-872e-6a80a660f225 (accessed on 22 November 2022).
  29. Li, J.; Sheng, Y. An automated scheme for glacial lake dynamics mapping using Landsat imagery and digital elevation models: A case study in the Himalayas. Int. J. Remote Sens. 2012, 33, 5194–5213. [Google Scholar] [CrossRef]
  30. Chen, F.; Zhang, M.; Guo, H.; Allen, S.; Kargel, J.S.; Haritashya, U.K.; Watson, C.S. Annual 30 m dataset for glacial lakes in High Mountain Asia from 2008 to 2017. Earth Syst. Sci. Data 2021, 13, 741–766. [Google Scholar] [CrossRef]
  31. Fang, C.Y.; Fan, X.M.; Zhong, H.; Lombardo, L.; Tanyas, H.; Wang, X. A Novel Historical Landslide Detection Approach Based on LiDAR and Lightweight Attention U-Net. Remote Sens. 2022, 14, 4357. [Google Scholar] [CrossRef]
  32. Wang, X.; Du, P.J.; Liu, S.C.; Senyshen, M.; Zhang, W.; Fang, H.; Fan, X.M. A novel multiple change detection approach based on tri-temporal logic-verified change vector analysis in posterior probability space. Int. J. Appl. Earth Obs. Geoinf. 2022, 111, 102852. [Google Scholar] [CrossRef]
  33. Zhao, F.Y.; Long, D.; Li, X.D.; Huang, Q.; Han, P.F. Rapid glacier mass loss in the Southeastern Tibetan Plateau since the year 2000 from satellite observations. Remote Sens. Environ. 2022, 270, 112853. [Google Scholar] [CrossRef]
  34. Irons, J.R.; Dwyer, J.L.; Barsi, J.A. The next Landsat satellite: The Landsat Data Continuity Mission. Remote Sens. Environ. 2012, 122, 11–21. [Google Scholar] [CrossRef] [Green Version]
  35. Gorelick, N.; Hancher, M.; Dixon, M.; Ilyushchenko, S.; Thau, D.; Moore, R. Google Earth Engine: Planetary-scale geospatial analysis for everyone. Remote Sens. Environ. 2017, 202, 18–27. [Google Scholar] [CrossRef]
  36. He, Y.; Yao, S.; Yang, W.; Yan, H.W.; Zhang, L.F.; Wen, Z.Q.; Zhang, Y.L.; Liu, T. An Extraction Method for Glacial Lakes Based on Landsat-8 Imagery Using an Improved U-Net Network. IEEE J. Sel. Top. Appl. Earth Obs. Remote Sens. 2021, 14, 6544–6558. [Google Scholar] [CrossRef]
  37. Zhao, H.; Chen, F.; Zhang, M.M. A Systematic Extraction Approach for Mapping Glacial Lakes in High Mountain Regions of Asia. IEEE J. Sel. Top. Appl. Earth Obs. Remote Sens. 2018, 11, 2788–2799. [Google Scholar] [CrossRef]
  38. Ashraf, A.; Roohi, R.; Naz, R.; Mustafa, N. Monitoring cryosphere and associated flood hazards in high mountain ranges of Pakistan using remote sensing technique. Nat. Hazards 2014, 73, 933–949. [Google Scholar] [CrossRef]
  39. Bolch, T.; Buchroithner, M.F.; Peters, J.; Baessler, M.; Bajracharya, S. Identification of glacier motion and potentially dangerous glacial lakes in the Mt. Everest region/Nepal using spaceborne imagery. Nat. Hazards Earth Syst. Sci. 2008, 8, 1329–1340. [Google Scholar] [CrossRef] [Green Version]
  40. Bolch, T.; Peters, J.; Yegorov, A.; Pradhan, B.; Buchroithner, M.; Blagoveshchensky, V. Identification of potentially dangerous glacial lakes in the northern Tien Shan. Nat. Hazards 2011, 59, 1691–1714. [Google Scholar] [CrossRef] [Green Version]
  41. Gardelle, J.; Arnaud, Y.; Berthier, E. Contrasted evolution of glacial lakes along the Hindu Kush Himalaya mountain range between 1990 and 2009. Global Planet. Change 2011, 75, 47–55. [Google Scholar] [CrossRef] [Green Version]
  42. Jain, S.K.; Sinha, R.K.; Chaudhary, A.; Shukla, S. Expansion of a glacial lake, Tsho Chubda, Chamkhar Chu Basin, Hindukush Himalaya, Bhutan. Nat. Hazards 2015, 75, 1451–1464. [Google Scholar] [CrossRef]
  43. Khadka, N.; Zhang, G.; Thakuri, S. Glacial Lakes in the Nepal Himalaya: Inventory and Decadal Dynamics (1977–2017). Remote Sens. 2018, 10, 1913. [Google Scholar] [CrossRef] [Green Version]
  44. Nie, Y.; Liu, Q.; Liu, S. Glacial lake expansion in the central Himalayas by Landsat images, 1990–2010. PLoS ONE 2013, 8, e83973. [Google Scholar] [CrossRef] [Green Version]
  45. Nie, Y.; Sheng, Y.W.; Liu, Q.; Liu, L.S.; Liu, S.Y.; Zhang, Y.L.; Song, C.Q. A regional-scale assessment of Himalayan glacial lake changes using satellite observations from 1990 to 2015. Remote Sens. Environ. 2017, 189, 1–13. [Google Scholar] [CrossRef] [Green Version]
  46. Prakash, C.; Nagarajan, R. Glacial lake changes and outburst flood hazard in Chandra basin, North-Western Indian Himalaya. Geomat. Nat. Hazards Risk 2018, 9, 337–355. [Google Scholar] [CrossRef]
  47. Shrestha, F.; Gao, X.; Khanal, N.R.; Maharjan, S.B.; Shrestha, R.B.; Wu, L.-Z.; Mool, P.K.; Bajracharya, S.R. Decadal glacial lake changes in the Koshi basin, central Himalaya, from 1977 to 2010, derived from Landsat satellite images. J. Mt. Sci. 2017, 14, 1969–1984. [Google Scholar] [CrossRef] [Green Version]
  48. Shukla, A.; Garg, P.K.; Srivastava, S. Evolution of Glacial and High-Altitude Lakes in the Sikkim, Eastern Himalaya over the Past Four Decades (1975–2017). Front. Environ. Sci. 2018, 6, 81. [Google Scholar] [CrossRef] [Green Version]
  49. Wang, X.; Chai, K.G.; Liu, S.Y.; Wei, J.F.; Jiang, Z.L.; Liu, Q.H. Changes of glaciers and glacial lakes implying corridor-barrier effects and climate change in the Hengduan Shan, southeastern Tibetan Plateau. J. Glaciol. 2017, 63, 535–542. [Google Scholar] [CrossRef] [Green Version]
  50. Wang, X.; Ding, Y.J.; Liu, S.Y.; Jiang, L.H.; Wu, K.P.; Jiang, Z.L.; Guo, W.Q. Changes of glacial lakes and implications in Tian Shan, central Asia, based on remote sensing data from 1990 to 2010. Environ. Res. Lett. 2013, 8, 044052. [Google Scholar] [CrossRef]
  51. Wang, X.; Liu, Q.H.; Liu, S.Y.; Wei, J.F.; Jiang, Z.L. Heterogeneity of glacial lake expansion and its contrasting signals with climate change in Tarim Basin, Central Asia. Environ. Earth Sci. 2016, 75, 696. [Google Scholar] [CrossRef]
  52. Worni, R.; Huggel, C.; Stoffel, M. Glacial lakes in the Indian Himalayas—From an area-wide glacial lake inventory to on-site and modeling based risk assessment of critical glacial lakes. Sci. Total Environ. 2013, 468, S71–S84. [Google Scholar] [CrossRef] [PubMed]
  53. Kneib, M.; Miles, E.S.; Jola, S.; Buri, P.; Herreid, S.; Bhattacharya, A.; Watson, C.S.; Bolch, T.; Quincey, D.; Pellicciotti, F. Mapping ice cliffs on debris-covered glaciers using multispectral satellite images. Remote Sens. Environ. 2021, 253, 112201. [Google Scholar] [CrossRef]
  54. Racoviteanu, A.E.; Nicholson, L.; Glasser, N.F. Surface composition of debris-covered glaciers across the Himalaya using linear spectral unmixing of Landsat 8 OLI imagery. Cryosphere 2021, 15, 4557–4588. [Google Scholar] [CrossRef]
  55. Li, J.L.; Sheng, Y.W.; Luo, J.C. Automatic extraction of Himalayan glacial lakes with remote sensing. J. Remote Sens. 2011, 15, 29–43. [Google Scholar] [CrossRef]
  56. Maharjan, S.B.; Mool, P.K.; Lizong, W.; Xiao, G.; Shrestha, F.; Shrestha, R.B.; Khanal, N.R.; Bajracharya, S.R.; Joshi, S.; Shai, S.; et al. The Status of Glacial Lakes in the Hindu Kush Himalaya; ICIMOD Research Report 2018/1; ICIMOD: Kathmandu, Nepal, 2018. [Google Scholar]
  57. Petrov, M.A.; Sabitov, T.Y.; Tomashevskaya, I.G.; Glazirin, G.E.; Chernomorets, S.S.; Savernyuk, E.A.; Tutubalina, O.V.; Petrakov, D.A.; Sokolov, L.S.; Dokukin, M.D.; et al. Glacial lake inventory and lake outburst potential in Uzbekistan. Sci. Total Environ. 2017, 592, 228–242. [Google Scholar] [CrossRef]
  58. Raj, K.B.G.; Kumar, K.V. Inventory of Glacial Lakes and its Evolution in Uttarakhand Himalaya Using Time Series Satellite Data. J. Indian Soc. Remote Sens. 2016, 44, 959–976. [Google Scholar] [CrossRef]
  59. Senese, A.; Maragno, D.; Fugazza, D.; Soncini, A.; D’Agata, C.; Azzoni, R.S.; Minora, U.; Ul-Hassan, R.; Vuillermoz, E.; Asif Khan, M.; et al. Inventory of glaciers and glacial lakes of the Central Karakoram National Park (CKNP—Pakistan). J. Maps 2018, 14, 189–198. [Google Scholar] [CrossRef] [Green Version]
  60. Song, C.; Sheng, Y.; Wang, J.; Ke, L.; Madson, A.; Nie, Y. Heterogeneous glacial lake changes and links of lake expansions to the rapid thinning of adjacent glacier termini in the Himalayas. Geomorphology 2017, 280, 30–38. [Google Scholar] [CrossRef] [Green Version]
  61. Veh, G.; Korup, O.; Roessner, S.; Walz, A. Detecting Himalayan glacial lake outburst floods from Landsat time series. Remote Sens. Environ. 2018, 207, 84–97. [Google Scholar] [CrossRef]
  62. Wang, W.C.; Xiang, Y.; Gao, Y.; Lu, A.X.; Yao, T.D. Rapid expansion of glacial lakes caused by climate and glacier retreat in the Central Himalayas. Hydrol. Process. 2015, 29, 859–874. [Google Scholar] [CrossRef]
  63. Wang, X.; Siegert, F.; Zhou, A.G.; Franke, J. Glacier and glacial lake changes and their relationship in the context of climate change, Central Tibetan Plateau 1972–2010. Global Planet. Change 2013, 111, 246–257. [Google Scholar] [CrossRef]
  64. Zhang, M.M.; Chen, F.; Tian, B.S. Glacial Lake Detection from GaoFen-2 Multispectral Imagery Using an Integrated Nonlocal Active Contour Approach: A Case Study of the Altai Mountains, Northern Xinjiang Province. Water 2018, 10, 455. [Google Scholar] [CrossRef] [Green Version]
  65. Shugar, D.H.; Burr, A.; Haritashya, U.K.; Kargel, J.S.; Watson, C.S.; Kennedy, M.C.; Bevington, A.R.; Betts, R.A.; Harrison, S.; Strattman, K. Rapid worldwide growth of glacial lakes since 1990. Nat. Clim. Change 2020, 10, 939–945. [Google Scholar] [CrossRef]
  66. Luo, W.; Zhang, G.; Chen, W.; Xu, F. Response of glacial lakes to glacier and climate changes in the western Nyainqentanglha range. Sci. Total Environ. 2020, 735, 139607. [Google Scholar] [CrossRef] [PubMed]
  67. Li, D.; Shangguan, D.H.; Anjum, M.N. Glacial Lake Inventory Derived from Landsat 8 OLI in 2016–2018 in China-Pakistan Economic Corridor. ISPRS Int. J. Geo-Inf. 2020, 9, 294. [Google Scholar] [CrossRef]
  68. Allen, S.K.; Zhang, G.Q.; Wang, W.C.; Yao, T.D.; Bolch, T. Potentially dangerous glacial lakes across the Tibetan Plateau revealed using a large-scale automated assessment approach. Sci. Bull. 2019, 64, 435–445. [Google Scholar] [CrossRef]
  69. Bajracharya, S.R.; Mool, P. Glaciers, glacial lakes and glacial lake outburst floods in the Mount Everest region, Nepal. Ann. Glaciol. 2017, 50, 81–86. [Google Scholar] [CrossRef] [Green Version]
  70. Wang, W.; Yao, T.; Yang, X. Variations of glacial lakes and glaciers in the Boshula mountain range, southeast Tibet, from the 1970s to 2009. Ann. Glaciol. 2017, 52, 9–17. [Google Scholar] [CrossRef] [Green Version]
  71. Zhang, G.Q.; Bolch, T.; Allen, S.; Linsbauer, A.; Chen, W.F.; Wang, W.C. Glacial lake evolution and glacier-lake interactions in the Poiqu River basin, central Himalaya, 1964–2017. J. Glaciol. 2019, 65, 347–365. [Google Scholar] [CrossRef] [Green Version]
  72. Aggarwal, S.; Rai, S.C.; Thakur, P.K.; Emmer, A. Inventory and recently increasing GLOF susceptibility of glacial lakes in Sikkim, Eastern Himalaya. Geomorphology 2017, 295, 39–54. [Google Scholar] [CrossRef]
  73. Chen, X.-q.; Cui, P.; Li, Y.; Yang, Z.; Qi, Y.-q. Changes in glacial lakes and glaciers of post-1986 in the Poiqu River basin, Nyalam, Xizang (Tibet). Geomorphology 2007, 88, 298–311. [Google Scholar] [CrossRef]
  74. Zhang, G.Q.; Yao, T.D.; Xie, H.J.; Yang, K.; Zhu, L.P.; Shum, C.K.; Bolch, T.; Yi, S.; Allen, S.; Jiang, L.G.; et al. Response of Tibetan Plateau lakes to climate change: Trends, patterns, and mechanisms. Earth Sci. Rev. 2020, 208, 103269. [Google Scholar] [CrossRef]
  75. Lóczy. The scientific results of the expedition through Eastern Asia with B.Szechenyi, 1899. In Encyclopaedia Britannica. The New Encyclopaedia Britannica, CD2000 (Deluxe Edition); Encyclopaedia Britannica: London, UK, 2000. [Google Scholar]
  76. Zhang, G.Q.; Yao, T.D.; Xie, H.J.; Kang, S.C.; Lei, Y.B. Increased mass over the Tibetan Plateau: From lakes or glaciers? Geophys. Res. Lett. 2013, 40, 2125–2130. [Google Scholar] [CrossRef]
  77. Zhang, Y.L.; Li, B.Y.; Liu, L.S.; Zheng, D. Redetermine the region and boundaries of Tibetan Plateau. Geogr. Res. 2021, 40, 1543–1553. (In Chinese) [Google Scholar] [CrossRef]
  78. Zhang, Y.L.; Li, B.Y.; Zheng, D. A discussion on the boundary and area of the Tibetan Plateau in China. Geogr. Res. 2002, 21, 1–8. (In Chinese) [Google Scholar] [CrossRef]
  79. Zhang, G.Q. Dataset of River Basins Map over the TP (2016); National Tibetan Plateau/Third Pole Environment Data Center: Beijing, China, 2019. [Google Scholar] [CrossRef]
  80. Barnett, T.P.; Adam, J.C.; Lettenmaier, D.P. Potential impacts of a warming climate on water availability in snow-dominated regions. Nature 2005, 438, 303–309. [Google Scholar] [CrossRef] [PubMed]
  81. Immerzeel, W.W.; van Beek, L.P.; Bierkens, M.F. Climate change will affect the Asian water towers. Science 2010, 328, 1382–1385. [Google Scholar] [CrossRef] [PubMed]
  82. Immerzeel, W.W.; Bierkens, M.F.P. Seasonal prediction of monsoon rainfall in three Asian river basins: The importance of snow cover on the Tibetan Plateau. Int. J. Climatol. 2010, 30, 1835–1842. [Google Scholar] [CrossRef]
  83. Immerzeel, W.W.; Lutz, A.F.; Andrade, M.; Bahl, A.; Biemans, H.; Bolch, T.; Hyde, S.; Brumby, S.; Davies, B.J.; Elmore, A.C.; et al. Importance and vulnerability of the world’s water towers. Nature 2020, 577, 364–369. [Google Scholar] [CrossRef]
  84. Ye, Q.H.; Zong, J.B.A.; Tian, L.D.; Cogley, J.G.; Song, C.Q.; Guo, W.Q. Glacier changes on the Tibetan Plateau derived from Landsat imagery: Mid-1970s-2000-13. J. Glaciol. 2017, 63, 273–287. [Google Scholar] [CrossRef] [Green Version]
  85. Zhang, T.; Wang, W.; An, B.; Gao, T.; Yao, T. Ice thickness and morphological analysis reveal the future glacial lake distribution and formation probability in the Tibetan Plateau and its surroundings. Global Planet. Change 2022, 216, 103923. [Google Scholar] [CrossRef]
  86. Zhu, Z. Change detection using landsat time series: A review of frequencies, preprocessing, algorithms, and applications. ISPRS J. Photogramm. Remote Sens. 2017, 130, 370–384. [Google Scholar] [CrossRef]
  87. Roy, D.P.; Ju, J.C.; Kline, K.; Scaramuzza, P.L.; Kovalskyy, V.; Hansen, M.; Loveland, T.R.; Vermote, E.; Zhang, C.S. Web-enabled Landsat Data (WELD): Landsat ETM plus composited mosaics of the conterminous United States. Remote Sens. Environ. 2010, 114, 35–49. [Google Scholar] [CrossRef]
  88. Lindsay, E.; Frauenfelder, R.; Ruther, D.; Nava, L.; Rubensdotter, L.; Strout, J.; Nordal, S. Multi-Temporal Satellite Image Composites in Google Earth Engine for Improved Landslide Visibility: A Case Study of a Glacial Landscape. Remote Sens. 2022, 14, 2301. [Google Scholar] [CrossRef]
  89. Flood, N. Seasonal Composite Landsat TM/ETM plus Images Using the Medoid (a Multi-Dimensional Median). Remote Sens. 2013, 5, 6481–6500. [Google Scholar] [CrossRef] [Green Version]
  90. Adepoju, K.A.; Adelabu, S.A. Improving accuracy of Landsat-8 OLI classification using image composite and multisource data with Google Earth Engine. Remote Sens. Lett. 2020, 11, 107–116. [Google Scholar] [CrossRef]
  91. Li, H.; Wan, W.; Fang, Y.; Zhu, S.Y.; Chen, X.; Liu, B.J.; Hong, Y. A Google Earth Engine-enabled software for efficiently generating high-quality user-ready Landsat mosaic images. Environ. Model. Softw. 2019, 112, 16–22. [Google Scholar] [CrossRef]
  92. Hemati, M.; Hasanlou, M.; Mahdianpari, M.; Mohammadimanesh, F. A Systematic Review of Landsat Data for Change Detection Applications: 50 Years of Monitoring the Earth. Remote Sens. 2021, 13, 2869. [Google Scholar] [CrossRef]
  93. Kumar, L.; Mutanga, O. Google Earth Engine Applications Since Inception: Usage, Trends, and Potential. Remote Sens. 2018, 10, 1509. [Google Scholar] [CrossRef] [Green Version]
  94. Ding, J.; Cuo, L.; Zhang, Y.; Zhu, F. Monthly and annual temperature extremes and their changes on the Tibetan Plateau and its surroundings during 1963–2015. Sci. Rep. 2018, 8, 11860. [Google Scholar] [CrossRef] [PubMed] [Green Version]
  95. Gardelle, J.; Berthier, E.; Arnaud, Y.; Kääb, A. Region-wide glacier mass balances over the Pamir-Karakoram-Himalaya during 1999–2011. Cryosphere 2013, 7, 1263–1286. [Google Scholar] [CrossRef] [Green Version]
  96. Beckschäfer, P. Obtaining rubber plantation age information from very dense Landsat TM & ETM + time series data and pixel-based image compositing. Remote Sens. Environ. 2017, 196, 89–100. [Google Scholar] [CrossRef]
  97. Li, L.L.; Vrieling, A.; Skidmore, A.; Wang, T.J.; Turak, E. Monitoring the dynamics of surface water fraction from MODIS time series in a Mediterranean environment. Int. J. Appl. Earth Obs. Geoinf. 2018, 66, 135–145. [Google Scholar] [CrossRef]
  98. Skakun, S.; Vermote, E.F.; Roger, J.C.; Justice, C.O.; Masek, J.G. Validation of the LaSRC Cloud Detection Algorithm for Landsat 8 Images. IEEE J. Sel. Top. Appl. Earth Obs. Remote Sens. 2019, 12, 2439–2446. [Google Scholar] [CrossRef]
  99. Zhu, Z.; Woodcock, C.E. Object-based cloud and cloud shadow detection in Landsat imagery. Remote Sens. Environ. 2012, 118, 83–94. [Google Scholar] [CrossRef]
  100. Carrasco, L.; O’Neil, A.W.; Morton, R.D.; Rowland, C.S. Evaluating Combinations of Temporally Aggregated Sentinel-1, Sentinel-2 and Landsat 8 for Land Cover Mapping with Google Earth Engine. Remote Sens. 2019, 11, 288. [Google Scholar] [CrossRef] [Green Version]
  101. Foga, S.; Scaramuzza, P.L.; Guo, S.; Zhu, Z.; Dilley, R.D.; Beckmann, T.; Schmidt, G.L.; Dwyer, J.L.; Hughes, M.J.; Laue, B. Cloud detection algorithm comparison and validation for operational Landsat data products. Remote Sens. Environ. 2017, 194, 379–390. [Google Scholar] [CrossRef] [Green Version]
  102. Gomez-Chova, L.; Amoros-Lopez, J.; Mateo-Garcia, G.; Munoz-Mari, J.; Camps-Valls, G. Cloud masking and removal in remote sensing image time series. J. Appl. Remote Sens. 2017, 11, 015005. [Google Scholar] [CrossRef]
  103. Mateo-García, G.; Gómez-Chova, L.; Amorós-López, J.; Muñoz-Marí, J.; Camps-Valls, G. Multitemporal Cloud Masking in the Google Earth Engine. Remote Sens. 2018, 10, 1079. [Google Scholar] [CrossRef] [Green Version]
  104. Quincey, D.J.; Richardson, S.D.; Luckman, A.; Lucas, R.M.; Reynolds, J.M.; Hambrey, M.J.; Glasser, N.F. Early recognition of glacial lake hazards in the Himalaya using remote sensing datasets. Global Planet. Change 2007, 56, 137–152. [Google Scholar] [CrossRef]
  105. Leclercq, P.W.; Kaab, A.; Altena, B. Brief communication: Detection of glacier surge activity using cloud computing of Sentinel-1 radar data. Cryosphere 2021, 15, 4901–4907. [Google Scholar] [CrossRef]
  106. Raup, B.; Racoviteanu, A.; Khalsa, S.J.S.; Helm, C.; Armstrong, R.; Arnaud, Y. The GLIMS geospatial glacier database: A new tool for studying glacier change. Global Planet. Change 2007, 56, 101–110. [Google Scholar] [CrossRef]
  107. RGI Consortium. Randolph Glacier Inventory—A Dataset of Global Glacier Outlines; Version 6 [Data Set]; National Snow and Ice Data Center: Boulder, CO, USA, 2017; Available online: https://www.elibrary.ru/item.asp?id=42892985 (accessed on 22 November 2022).
  108. Pfeffer, W.T.; Arendt, A.A.; Bliss, A.; Bolch, T.; Cogley, J.G.; Gardner, A.S.; Hagen, J.O.; Hock, R.; Kaser, G.; Kienholz, C.; et al. The Randolph Glacier Inventory: A globally complete inventory of glaciers. J. Glaciol. 2014, 60, 537–552. [Google Scholar] [CrossRef] [Green Version]
  109. Nuimura, T.; Sakai, A.; Taniguchi, K.; Nagai, H.; Lamsal, D.; Tsutaki, S.; Kozawa, A.; Hoshina, Y.; Takenaka, S.; Omiya, S.; et al. The GAMDAM glacier inventory: A quality-controlled inventory of Asian glaciers. Cryosphere 2015, 9, 849–864. [Google Scholar] [CrossRef]
  110. Sakai, A. Brief communication: Updated GAMDAM glacier inventory over high-mountain Asia. Cryosphere 2019, 13, 2043–2049. [Google Scholar] [CrossRef] [Green Version]
  111. Guo, W.Q.; Liu, S.Y.; Xu, L.; Wu, L.Z.; Shangguan, D.H.; Yao, X.J.; Wei, J.F.; Bao, W.J.; Yu, P.C.; Liu, Q.; et al. The second Chinese glacier inventory: Data, methods and results. J. Glaciol. 2015, 61, 357–372. [Google Scholar] [CrossRef] [Green Version]
  112. Shi, Y.F.; Liu, C.H.; Kang, E. The Glacier Inventory of China. Ann. Glaciol. 2009, 50, 1–4. [Google Scholar] [CrossRef] [Green Version]
  113. Jiang, S.; Nie, Y.; Liu, Q.; Wang, J.D.; Liu, L.S.; Hassan, J.; Liu, X.Y.; Xu, X. Glacier Change, Supraglacial Debris Expansion and Glacial Lake Evolution in the Gyirong River Basin, Central Himalayas, between 1988 and 2015. Remote Sens. 2018, 10, 986. [Google Scholar] [CrossRef] [Green Version]
  114. Paul, F.; Raup, B.H.; Zemp, M. GTN-G, WGI, RGI, DCW, GLIMS, WGMS, GCOS—What’s all this about? (Invited). In Proceedings of the AGU Fall Meeting Abstracts; University of Zurich, Zurich, Switzerland, 1 December 2013; Volume 2013, p. C41E-01. [Google Scholar]
  115. Raup, B.; Arendt, A.; Armstrong, R.; Barrett, A.; Jodha Khalsa, S.; Racoviteanu, A. GLIMS and the RGI: Relationships present and future. In Proceedings of the EGU General Assembly Conference Abstracts, Vienna, Austria, 7–12 April 2013; p. EGU2013-11831. [Google Scholar]
  116. Smith, T.; Bookhagen, B.; Cannon, F. Improving semi-automated glacier mapping with a multi-method approach: Applications in central Asia. Cryosphere 2015, 9, 1747–1759. [Google Scholar] [CrossRef] [Green Version]
  117. Yao, T.D.; Bolch, T.; Chen, D.L.; Gao, J.; Immerzeel, W.; Piao, S.; Su, F.G.; Thompson, L.; Wada, Y.; Wang, L.; et al. The imbalance of the Asian water tower. Nat. Rev. Earth Environ. 2022, 3, 618–632. [Google Scholar] [CrossRef]
  118. Li, Y.Z.; Gong, X.Q.; Guo, Z.; Xu, K.P.; Hu, D.; Zhou, H.X. An index and approach for water extraction using Landsat-OLI data. Int. J. Remote Sens. 2016, 37, 3611–3635. [Google Scholar] [CrossRef]
  119. McFeeters, S.K. The use of the Normalized Difference Water Index (NDWI) in the delineation of open water features. Int. J. Remote Sens. 2007, 17, 1425–1432. [Google Scholar] [CrossRef]
  120. Xu, H. Modification of normalised difference water index (NDWI) to enhance open water features in remotely sensed imagery. Int. J. Remote Sens. 2007, 27, 3025–3033. [Google Scholar] [CrossRef]
  121. Zhai, K.; Wu, X.; Qin, Y.; Du, P. Comparison of surface water extraction performances of different classic water indices using OLI and TM imageries in different situations. Geo-Spat. Inf. Sci. 2015, 18, 32–42. [Google Scholar] [CrossRef]
  122. Zhang, M.M.; Chen, F.; Tian, B.S. An automated method for glacial lake mapping in High Mountain Asia using Landsat 8 imagery. J. Mt. Sci. 2018, 15, 13–24. [Google Scholar] [CrossRef]
  123. Zhang, B.; Liu, G.X.; Zhang, R.; Fu, Y.; Liu, Q.; Cai, J.L.; Wang, X.W.; Li, Z.L. Monitoring Dynamic Evolution of the Glacial Lakes by Using Time Series of Sentinel-1A SAR Images. Remote Sens. 2021, 13, 1313. [Google Scholar] [CrossRef]
  124. Ahmed, R.; Ahmad, S.T.; Wani, G.F.; Mir, R.A.; Almazroui, M.; Bansal, J.K.; Ahmed, P. Glacial lake changes and the identification of Potentially Dangerous Glacial Lakes (PDGLs) under warming climate in the Dibang River Basin, Eastern Himalaya, India. Geocarto Int. 2022, 1–24. [Google Scholar] [CrossRef]
  125. Du, Z.Q.; Li, W.B.; Zhou, D.B.; Tian, L.Q.; Ling, F.; Wang, H.L.; Gui, Y.M.; Sun, B.Y. Analysis of Landsat-8 OLI imagery for land surface water mapping. Remote Sens. Lett. 2014, 5, 672–681. [Google Scholar] [CrossRef]
  126. Liu, Z.F.; Yao, Z.J.; Wang, R. Assessing methods of identifying open water bodies using Landsat 8 OLI imagery. Environ. Earth Sci. 2016, 75, 873. [Google Scholar] [CrossRef]
  127. Vilímek, V.; Emmer, A.; Huggel, C.; Schaub, Y.; Würmli, S. Database of glacial lake outburst floods (GLOFs)–IPL project No. 179. Landslides 2013, 11, 161–165. [Google Scholar] [CrossRef]
  128. Rick, B.; McGrath, D.; Armstrong, W.; McCoy, S.W. Dam type and lake location characterize ice-marginal lake area change in Alaska and NW Canada between 1984 and 2019. Cryosphere 2022, 16, 297–314. [Google Scholar] [CrossRef]
  129. Carrivick, J.L.; Tweed, F.S. Proglacial lakes: Character, behaviour and geological importance. Quat. Sci. Rev. 2013, 78, 34–52. [Google Scholar] [CrossRef] [Green Version]
  130. Benn, D.I.; Wiseman, S.; Hands, K.A. Growth and drainage of supraglacial lakes on debris-mantled Ngozumpa Glacier, Khumbu Himal, Nepal. J. Glaciol. 2017, 47, 626–638. [Google Scholar] [CrossRef] [Green Version]
  131. Reynolds, J.M. On the Formation of Supraglacial Lakes on Debris-Covered Glaciers; IAHS Publication; UKCEH: Wallingford, UK, 2000; pp. 153–164. [Google Scholar]
  132. Armstrong, W.H.; Anderson, R.S. Ice-marginal lake hydrology and the seasonal dynamical evolution of Kennicott Glacier, Alaska. J. Glaciol. 2020, 66, 699–713. [Google Scholar] [CrossRef]
  133. Capps, D.M.; Wiles, G.C.; Clague, J.J.; Luckman, B.H. Tree-ring dating of the nineteenth-century advance of Brady Glacier and the evolution of two ice-marginal lakes, Alaska. Holocene 2011, 21, 641–649. [Google Scholar] [CrossRef] [Green Version]
  134. Krumwiede, B.S.; Kamp, U.; Leonard, G.J.; Kargel, J.S.; Dashtseren, A.; Walther, M. Recent Glacier Changes in the Mongolian Altai Mountains: Case Studies from Munkh Khairkhan and Tavan Bogd. In Global Land Ice Measurements from Space; Kargel, J., Leonard, G., Bishop, M., Kääb, A.B.R., Eds.; Springer: Berlin/Heidelberg, Germany, 2014; pp. 481–508. [Google Scholar] [CrossRef]
  135. Bao, W.-J.; Liu, S.-Y.; Wei, J.-F.; Guo, W.-Q. Glacier changes during the past 40 years in the West Kunlun Shan. J. Mt. Sci. 2015, 12, 344–357. [Google Scholar] [CrossRef]
  136. Shangguan, D.; Liu, S.; Ding, Y.; Li, J.; Zhang, Y.; Ding, L.; Wang, X.; Xie, C.; Li, G. Glacier changes in the west Kunlun Shan from 1970 to 2001 derived from Landsat TM/ETM+ and Chinese glacier inventory data. Ann. Glaciol. 2017, 46, 204–208. [Google Scholar] [CrossRef] [Green Version]
  137. Cao, B.; Guan, W.J.; Li, K.J.; Wen, Z.L.; Han, H.; Pan, B.T. Area and Mass Changes of Glaciers in the West Kunlun Mountains Based on the Analysis of Multi-Temporal Remote Sensing Images and DEMs from 1970 to 2018. Remote Sens. 2020, 12, 2632. [Google Scholar] [CrossRef]
  138. Avtar, R.; Yunus, A.P.; Kraines, S.; Yamamuro, M. Evaluation of DEM generation based on Interferometric SAR using TanDEM-X data in Tokyo. Phys. Chem. Earth Parts A/B/C 2015, 83–84, 166–177. [Google Scholar] [CrossRef]
  139. Purinton, B.; Bookhagen, B. Validation of digital elevation models (DEMs) and comparison of geomorphic metrics on the southern Central Andean Plateau. Earth Surf. Dyn. 2017, 5, 211–237. [Google Scholar] [CrossRef]
Figure 1. Distribution of glaciers, glacial lakes and major rivers on the Tibetan Plateau (TP). The TP was divided into 17 mountains (http://geo.uzh.ch/~tbolch/data/regions_hma_v03.zip (accessed on 22 November 2022)) [3]. The large-scale atmospheric circulations are also included. The terrain basemap is sourced from ESRI.
Remotesensing 15 00416 g001
Figure 2. Flowchart of the glacial lake automatic extraction and mapping workflow.
Remotesensing 15 00416 g002
Figure 3. Example pictures of each type of glacial lake (in red rectangle) in the TP: (a) proglacial lakes; (b) supraglacial lakes; (c) ice-marginal lakes; (d) unconnected glacial lakes. Background imageries were obtained from © Google Earth Pro.
Remotesensing 15 00416 g003
Figure 4. (a) Relationship between the area of each glacial lake and its uncertainty in the TP; (b) descriptive statistics of the glacial lake area uncertainty; the swarm plots for each time period represent the uncertainty distribution of all glacial lakes in that period.
Remotesensing 15 00416 g004
Figure 5. (a) Numbers and areas with three periods of all glacial lakes and PGL, UGL; (b) altitudinal distribution (100 m bin sizes) of lake areas; (c) altitudinal distribution (100 m bin sizes) of lake numbers.
Remotesensing 15 00416 g005
Figure 6. (af) Examples of glacial lake expansion and contraction, the location was the approximate latitude and longitude and the height of the lake’s center. The scale of all three images within each grouping is consistent. Background imageries were obtained from Landsat satellite images preprocessed by GEE (for automatic extraction, see Section 3.1).
Remotesensing 15 00416 g006
Figure 7. Altitudinal characteristics of various types of glacial lake areas in 2013–2019. The width of the colored pattern in the figure represents the area of different types of glacial lakes at different altitudes. The wider the pattern, the larger the area.
Remotesensing 15 00416 g007
Figure 8. Area change rate of glacial lakes from the first period (1990−1999) to the last period (2013−2019) on 1° × 1° grids in various mountain regions. The circle size represents the total glacial lake area in the first period of each grid. The hillshade basemap is sourced from ESRI.
Remotesensing 15 00416 g008
Figure 9. Proportional area distribution of four types of glacial lakes in the last period (2013−2019) on 1° × 1° grids. The circle size represents the total glacial lake area in the last period of each grid. The hillshade basemap is sourced from ESRI.
Remotesensing 15 00416 g009
Figure 10. Total area correlation of our inventory with Wang et al. [15] and Chen et al. [30], respectively. The red and blue lines are the correlation fitting curves with each of them, and the black line is the 1:1 diagonal line.
Remotesensing 15 00416 g010
Table 1. Regional summary of lake numbers and areas in each period.
RegionNumberTotal Area (km2)
1990−19992000−20122013−2019Change Rate (%)1990−19992000−20122013−2019Change Rate (%)
Altun Mountains251818−28.000.4290.5110.4474.20
Central Himalaya24812619276811.57211.261236.093261.69523.87
Eastern Himalaya25832825316022.34205.757216.980245.66219.39
Eastern Hindu Kush1743179518465.91111.026106.020102.375−7.79
Eastern Kunlun Mountains50159561422.5520.16134.66430.35050.54
Eastern Pamir1011021042.9714.40420.58715.7649.44
Eastern Tibetan Mountains26825230614.1818.49620.75121.38415.61
Gangdise Mountains16311770185613.80131.147140.392141.7698.10
Hengduan Mountains15961796210832.0893.48498.435112.16319.98
Karakoram243209229−5.7623.90321.43524.6563.15
Nyainqêntanglha38794016478823.43322.247325.930396.05422.90
Qilian Mountains13117216727.487.95111.50211.68646.98
Tanggula Mountains1348134613681.4859.66972.74069.92017.18
Tibetan Interior Mountains61694688443.5145.74574.68869.62652.20
Western Himalaya11081275126313.99103.49499.547110.4586.73
Western Kunlun Mountains17120820318.7127.37345.10044.29561.82
Western Pamir7587117863.69112.628111.629109.691−2.61
Table 2. Number and area of glacial lakes in different datasets within the TP range.
Dataset SourcesTimeNumberArea (km2)
This study1990–199919,1831509.17
2000–201220,6551637.01
2013–201922,4681767.99
Wang et al. [15]199018,0251349.214
201820,2501579.009
Chen et al. [30]200811,1491199.478
200911,5721149.932
201011,5901218.32
201111,7121212.695
201211,7581194.173
201312,4731222.587
201412,3851238.371
201513,3561267.209
201613,0731260.805
201713,6011273.41
Disclaimer/Publisher’s Note: The statements, opinions and data contained in all publications are solely those of the individual author(s) and contributor(s) and not of MDPI and/or the editor(s). MDPI and/or the editor(s) disclaim responsibility for any injury to people or property resulting from any ideas, methods, instructions or products referred to in the content.

