
Monitoring of Monthly Height Growth of Individual Trees in a Subtropical Mixed Plantation Using UAV Data


1
College of Geomatics and Geoinformation, Guilin University of Technology, No. 12 Jian’gan Road, Guilin 541006, China
2
Guangxi Key Laboratory of Spatial Information and Geomatics, Guilin University of Technology, No. 12 Jian’gan Road, Guilin 541004, China
*
Author to whom correspondence should be addressed.
Remote Sens. 2023, 15(2), 326; https://doi.org/10.3390/rs15020326
Submission received: 12 December 2022
/
Revised: 30 December 2022
/
Accepted: 3 January 2023
/
Published: 5 January 2023
(This article belongs to the Collection Feature Paper Special Issue on Forest Remote Sensing)
Abstract
:The assessment of changes in the height growth of trees can serve as an accurate basis for the simulation of various ecological processes. However, most studies conducted on changes in the height growth of trees are on an annual scale. This makes it difficult to obtain basic data for correcting time differences in the height growth estimates of trees within a year. In this study, the digital elevation models (DEMs) were produced based on stereo images and light detection and ranging (LiDAR) data obtained by unmanned aerial vehicles (UAVs). Individual tree crowns were segmented by employing the watershed segmentation algorithm and the maximum value within each crown was extracted as the height of each tree. Subsequently, the height growth of each tree on a monthly-scale time series was extracted to simulate the time difference correction of regional tree height estimates within a year. This was used to verify the feasibility of the time difference correction method on a monthly scale. It is evident from the results that the DEM based on UAV stereo images was closely related to the DEM based on UAV LiDAR, with correlation coefficients of R2 = 0.96 and RMSE = 0.28 m. There was a close correlation between the tree height extracted from canopy height models (CHMs) based on UAV images and the measured tree height, with correlation coefficients of R2 = 0.99, and RMSE = 0.36 m. Regardless of the tree species, the total height growth in each month throughout the year was 46.53 cm. The most significant changes in the height growth of trees occurred in May (14.26 cm) and June (14.67 cm). In the case of the Liriodendron chinense tree species, the annual height growth was the highest (58.64 cm) while that of the Osmanthus fragrans tree species was the lowest (34.00 cm). By analyzing the height growth estimates of trees each month, it was concluded that there were significant differences among various tree species. In the case of the Liriodendron chinense tree species, the growth season occurred primarily from April to July. During this season, 56.92 cm of growth was recorded, which accounted for 97.08% of the annual growth. In the case of the Ficus concinna tree species, the tree height was in a state of growth during each month of the year. The changes in the height growth estimates of the tree were higher from May to August (44.24 cm of growth, accounting for 77.09% of the annual growth). After applying the time difference correction to the regional tree growth estimates, the extraction results of the changes in the height growth estimates of the tree (based on a monthly scale) were correlated with the height of the UAV image-derived tree. The correlation coefficients of R2 = 0.99 and RMSE = 0.26 m were obtained. The results demonstrate that changes in the height growth estimates on a monthly scale can be accurately determined by employing UAV stereo images. Furthermore, the results can provide basic data for the correction of the time differences in the growth of regional trees and further provide technical and methodological guidance for regional time difference correction of other forest structure parameters.

1. Introduction
The height growth estimates of trees refer to the rate at which the height of a tree increases over time. Accurate measurements of tree height growth can provide basic data for the simulation of various ecological processes. Additionally, it is of critical significance in management of forest resources, volume and biomass prediction, forest carbon storage assessment, and change monitoring. According to the rules of tree growth, tree height growth is a process of intermittent change, which is closely related to phenological changes. For example, in the case of temperate forests, tree height increases more during the growing season; however, only minor changes occur during the non-growing season. This is primarily due to the changes in phenology during the growing and non-growing seasons. However, in tropical and subtropical regions, the climatic conditions are optimal for vegetation growth. The majority of tree species remain evergreen throughout the year. In tropical and subtropical forests, there may be more than one growing season, and different tree species may grow during different months. Therefore, it is essential to monitor the monthly-scale changes in the height growth estimates of the trees.
LiDAR data can be used to obtain horizontal and vertical structural parameters of forests. It has been widely utilized in research on forest tree height estimation and growth monitoring. For example, Yu et al. [1] studied the height growth estimates of 80 Scots pine trees in the boreal forest of Helsinki, Finland, between 1998 and 2003 by utilizing LiDAR data. The results indicate that the height growth estimates of individual trees can be measured using multi-temporal LiDAR data, with correlation coefficients R2 of 0.68 and an RMSE of 43 cm. By employing ground-based laser scanning technology, Lin et al. [2] conducted a study in which they found that the minimum time interval necessary for detecting growth in the height of trees is one month. The aforementioned research results show that LiDAR data is capable of effectively monitoring the height growth estimates of trees. However, due to the high financial cost of the data acquisition process, the monitoring is mainly on an annual or longer time scale, whereas research on a short time scale is less common.
Due to advances in sensor and image processing technology over the last several years, there has been a significant increase in the number of studies conducted on the inversion of forest structure parameters based on the generation of three-dimensional point clouds by employing digital aerial photogrammetry [3,4]. By utilizing digital aerial photogrammetry, it is possible to reduce the financial costs of 3D point cloud data acquisition by approximately one-third to one-half of the cost of airborne LiDAR data [5,6]. However, the data acquisition process based on conventional fixed wings or helicopters for acquiring high temporal resolution images is still expensive. Unmanned Aerial Vehicles (UAVs) can fly at low altitudes, operate flexibly, and are cost-efficient, making them an effective alternative to traditional digital aerial photogrammetry image acquisition [7]. Due to the development of the structure from motion and multiple view stereo vision technology, it is possible to quickly extract high-density point cloud data based on UAV stereo images [8]. As a result, it can also improve forestry applications based on UAV digital photogrammetry [9]. In recent years, using light UAVs equipped with inexpensive consumer cameras has become an effective method for studying the individual tree structure parameters of plantations [10]. For example, Karpina et al. [11] measured the tree heights of 22 Scotch pine plantations by employing point cloud data generated from images obtained from a consumer camera mounted on a UAV, with an average accuracy of 5 cm. Guerra-Hernández et al. [12] estimated the height of several individual trees in eucalyptus plantations by utilizing high-density point cloud data derived from airborne LiDAR and UAV images. According to the results, it is evident that UAV image-derived point clouds and LiDAR point clouds exhibit similar results in estimating the height of individual trees. Guerra-Hernández et al. [13] used LiDAR and UAV image-derived point cloud data to estimate the volume of individual trees in eucalyptus plantations. The RMSE of the volume estimation results based on UAV image-derived point cloud and LiDAR data were 0.030 m3 and 0.026 m3, respectively. The aforementioned research results indicate that the high-precision inversion of the individual tree structure parameters of the plantation can be accurately measured based on UAV images. The results are similar to those obtained using the LiDAR data.
Collecting high temporal resolution stereo images by employing UAVs can serve as an economical and feasible alternative for monitoring growth and changes in the structural parameters of forests in a short period [14]. For example, Guerra-Hernández et al. [12] estimated tree height growth in a pine plantation from 2015 to 2017 by utilizing point cloud data generated from multi-temporal UAV imagery. The growth of tree height and biomass were found to be 0.45 m ± 0.12 m and 198.7 ± 93.9 kg, respectively. Dempewolf et al. [15] measured the tree height growth of different tree species in temperate mixed forests during a single growing season by employing UAV stereo images. During one growing season (three months), the height growth estimates of the Norway spruce, Scots pine, silver birch and European beech were 68 cm, 93 cm, 106 cm and 26 cm, respectively. The results indicate that high temporal resolution images obtained through UAVs can be used to monitor growth of individual tree structure parameters on a relatively short time frequency. However, most previous studies focused on the growth of temperate forests on an annual scale or the scale of one growing season. Only a few studies have attempted to investigate the height growth estimates of tropical and subtropical forest tree species during other months of the year. Therefore, the growth rules of tropical and subtropical forests in different months are still unclear.
By monitoring results of the monthly growth, it is possible to reveal the growth rules of tropical and subtropical forest tree species during different months of the year. It can also serve as data support for the correction of temporal differences between multi-source data. For example, in previous studies, there were often a number of temporal differences between field data and remote sensing data for some reason. These differences range from several months to one year. The time differences are likely to lead to errors in calculating the inversion results of remote sensing data. Based on the results of monthly-scale growth monitoring, the time difference between field data and remote sensing data can be corrected within the same month. Thus, it is possible to eliminate the impact of time differences on the estimation results to further improve their accuracy. Similarly, the results of the monitoring of monthly changes in the height growth estimates of trees can also serve as data support for the correction of time differences between different phases of the same data in large regions.
The coverage area of a single satellite image is limited. For example, the width of a Landsat−8 image is 185 km × 185 km, while that of Sentinel−2 image is relatively large (290 km × 290 km). Therefore, in cases where the study area is large, multiple images are often required to be spliced. The spliced images may have been captured in other months. The time difference between images leads to certain time differences in the forest structure parameters obtained through image inversion. Generally, the time difference is a few months, but the maximum time difference can exceed one year. This, in turn, leads to inaccurate monitoring results for annual dynamic changes in some regions. The annual change may actually be only the change of a few months rather than an entire year. At the same time, the time differences between the spliced images may also limit the time frequency of dynamic change monitoring results to the annual scale, making it difficult to accurately monitor the monthly scale. Therefore, the key to improving the accuracy and time frequency of the monitoring results of dynamic changes in forest structure parameters is to eliminate the impact of time differences in mosaic images on the estimation results of forest structure parameters based on monthly growth monitoring results. Thereby, it is possible to obtain the forest structure parameters of the unified regional time.
Taking the aforementioned considerations into account, UAVs were employed in this study to collect monthly time-frequency image data of mixed plantations. Furthermore, this study was conducted to clarify the rules of monthly changes in the height growth estimates of trees. The study also aimed to investigate the changes of different tree species in subtropical forests and to provide solutions for correcting time differences between image data. The specific goals of this study were as follows: (1) verify the differences between DEMs beneath forests by utilizing UAV LiDAR and UAV stereo images; (2) verify the feasibility of estimating the tree height of individual trees by utilizing UAV stereo images, and analyze the differences in individual tree height extraction results of different tree species; (3) extract the height growth estimates of trees on a monthly scale based on high time-frequency UAV stereo images, and to clarify the annual growth rules of different tree species in the subtropical monsoon season; and (4) simulate the correction of time differences in the measurement of the height of regional trees based on the results of the monthly height growth estimates of trees, in order to verify the feasibility of the correction method for the regional time differences.
2. Materials and Methods
2.1. Study Area
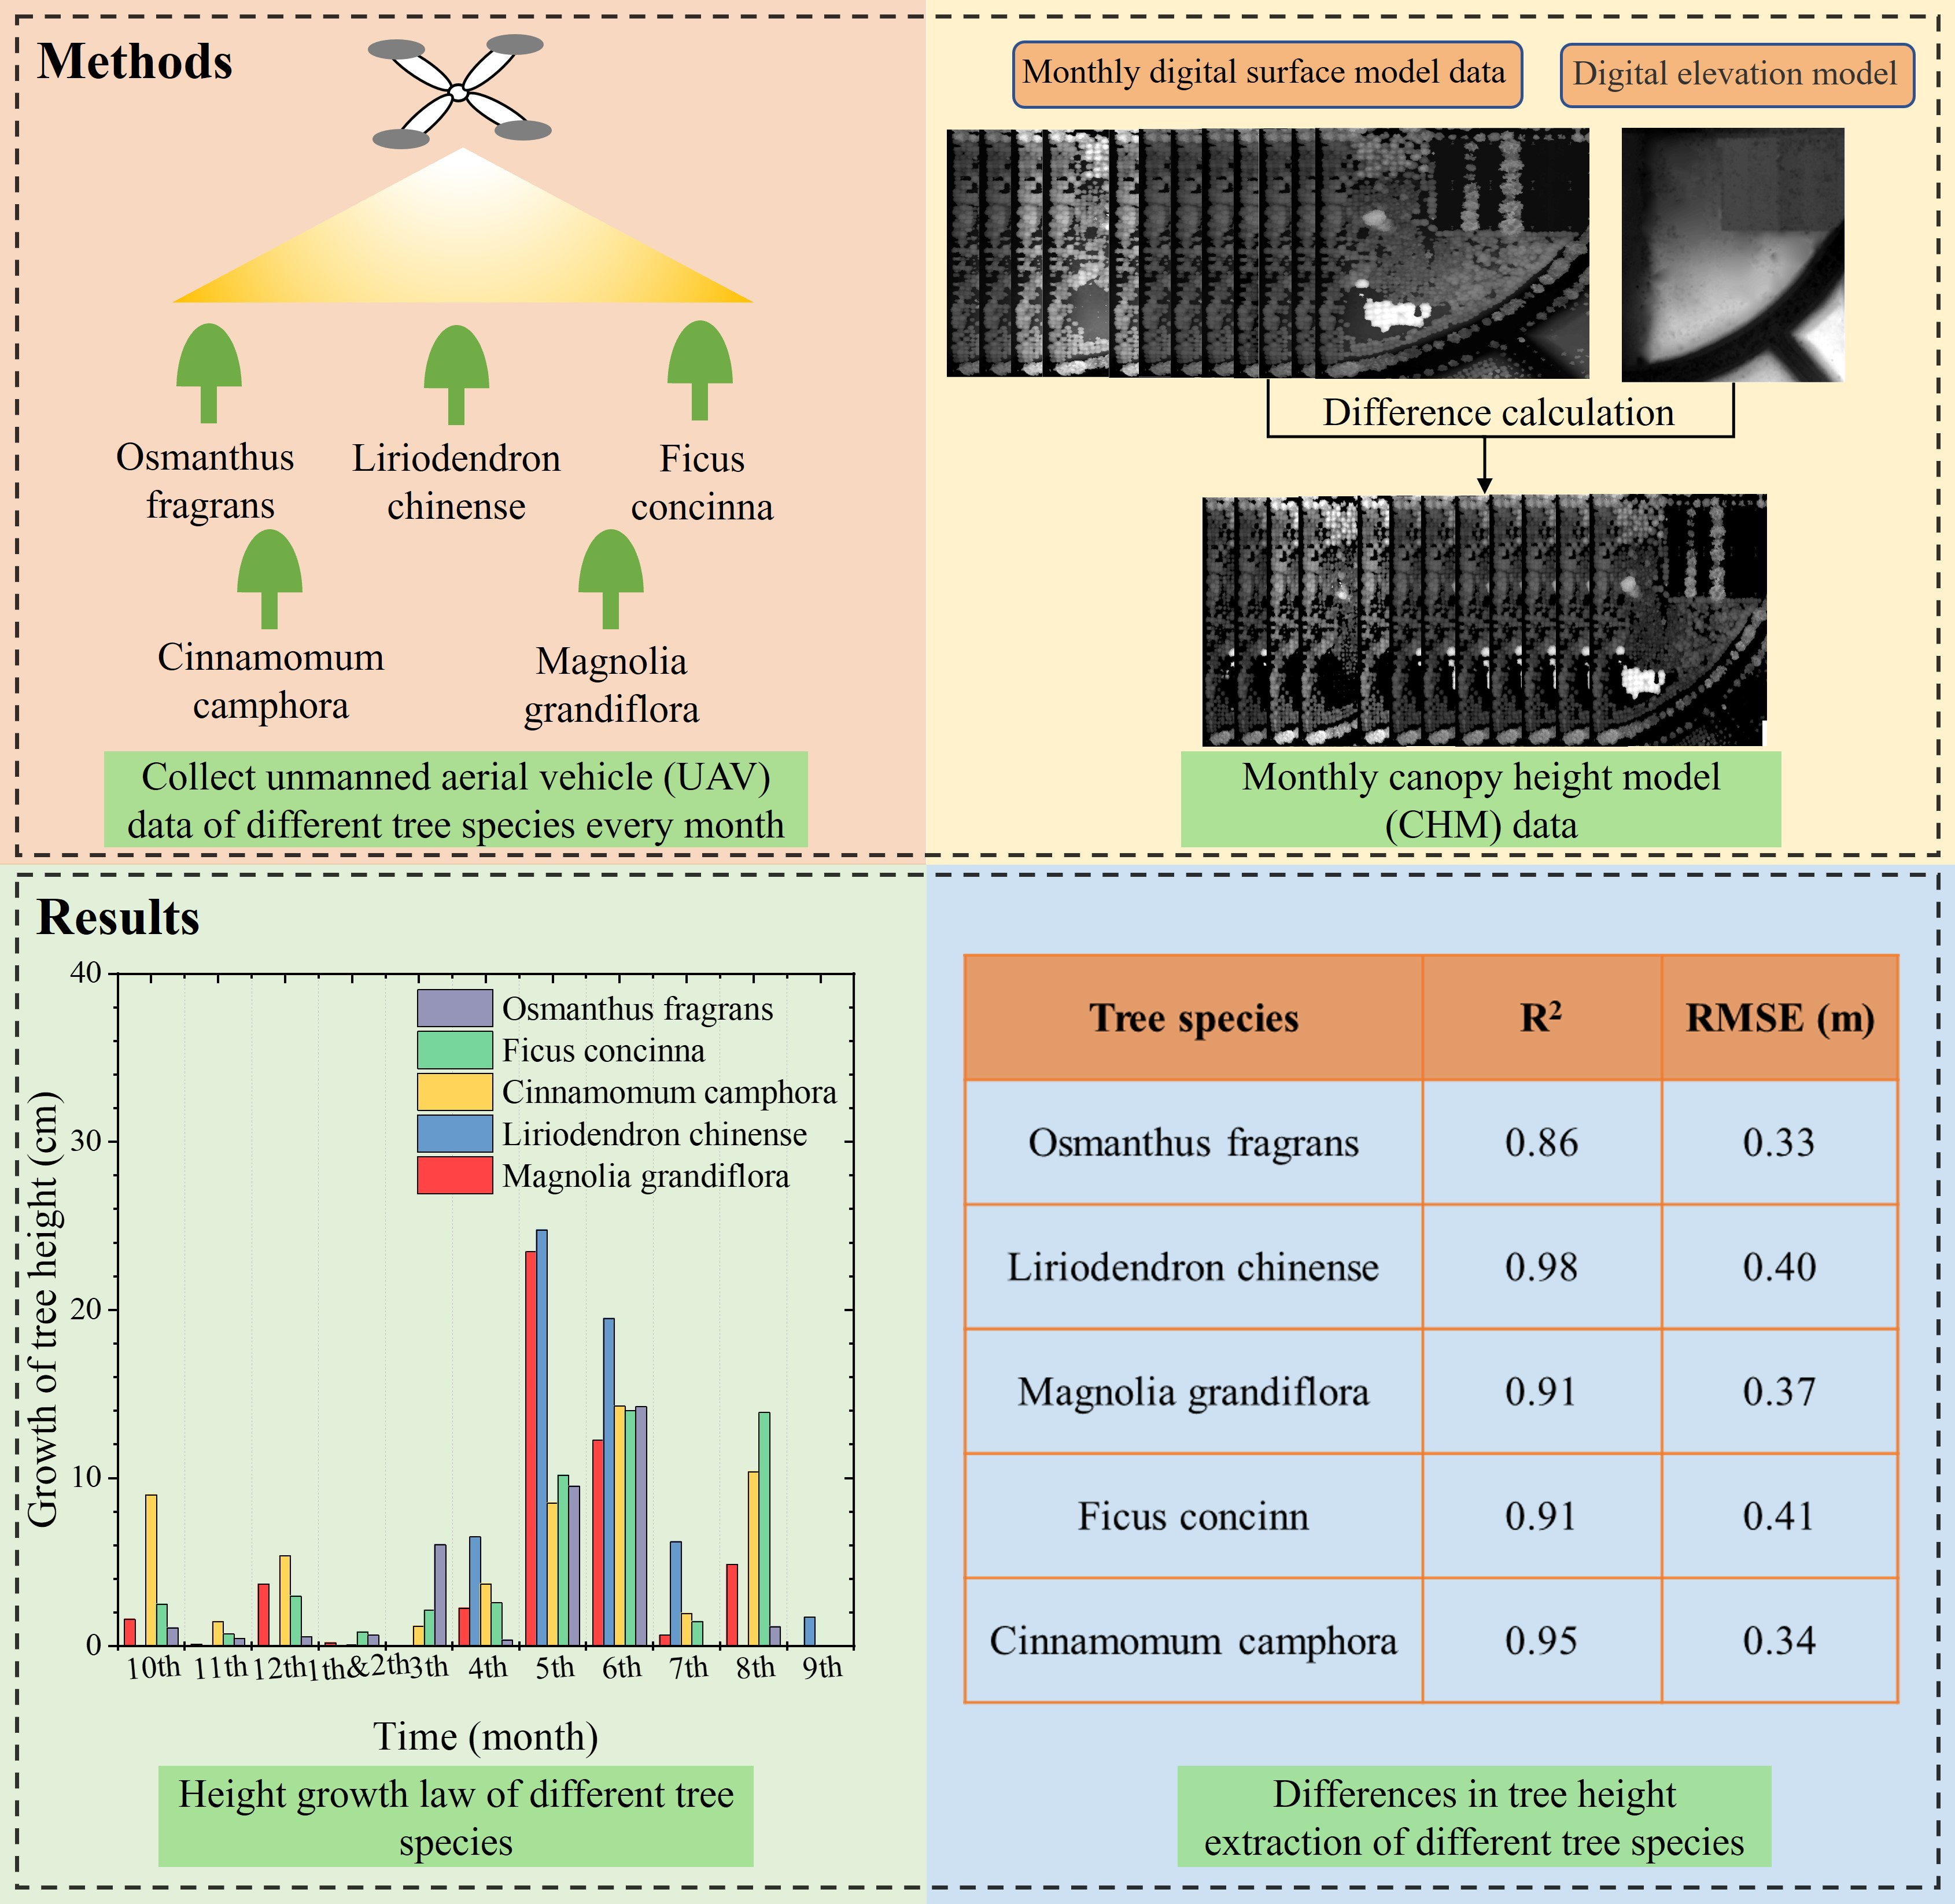
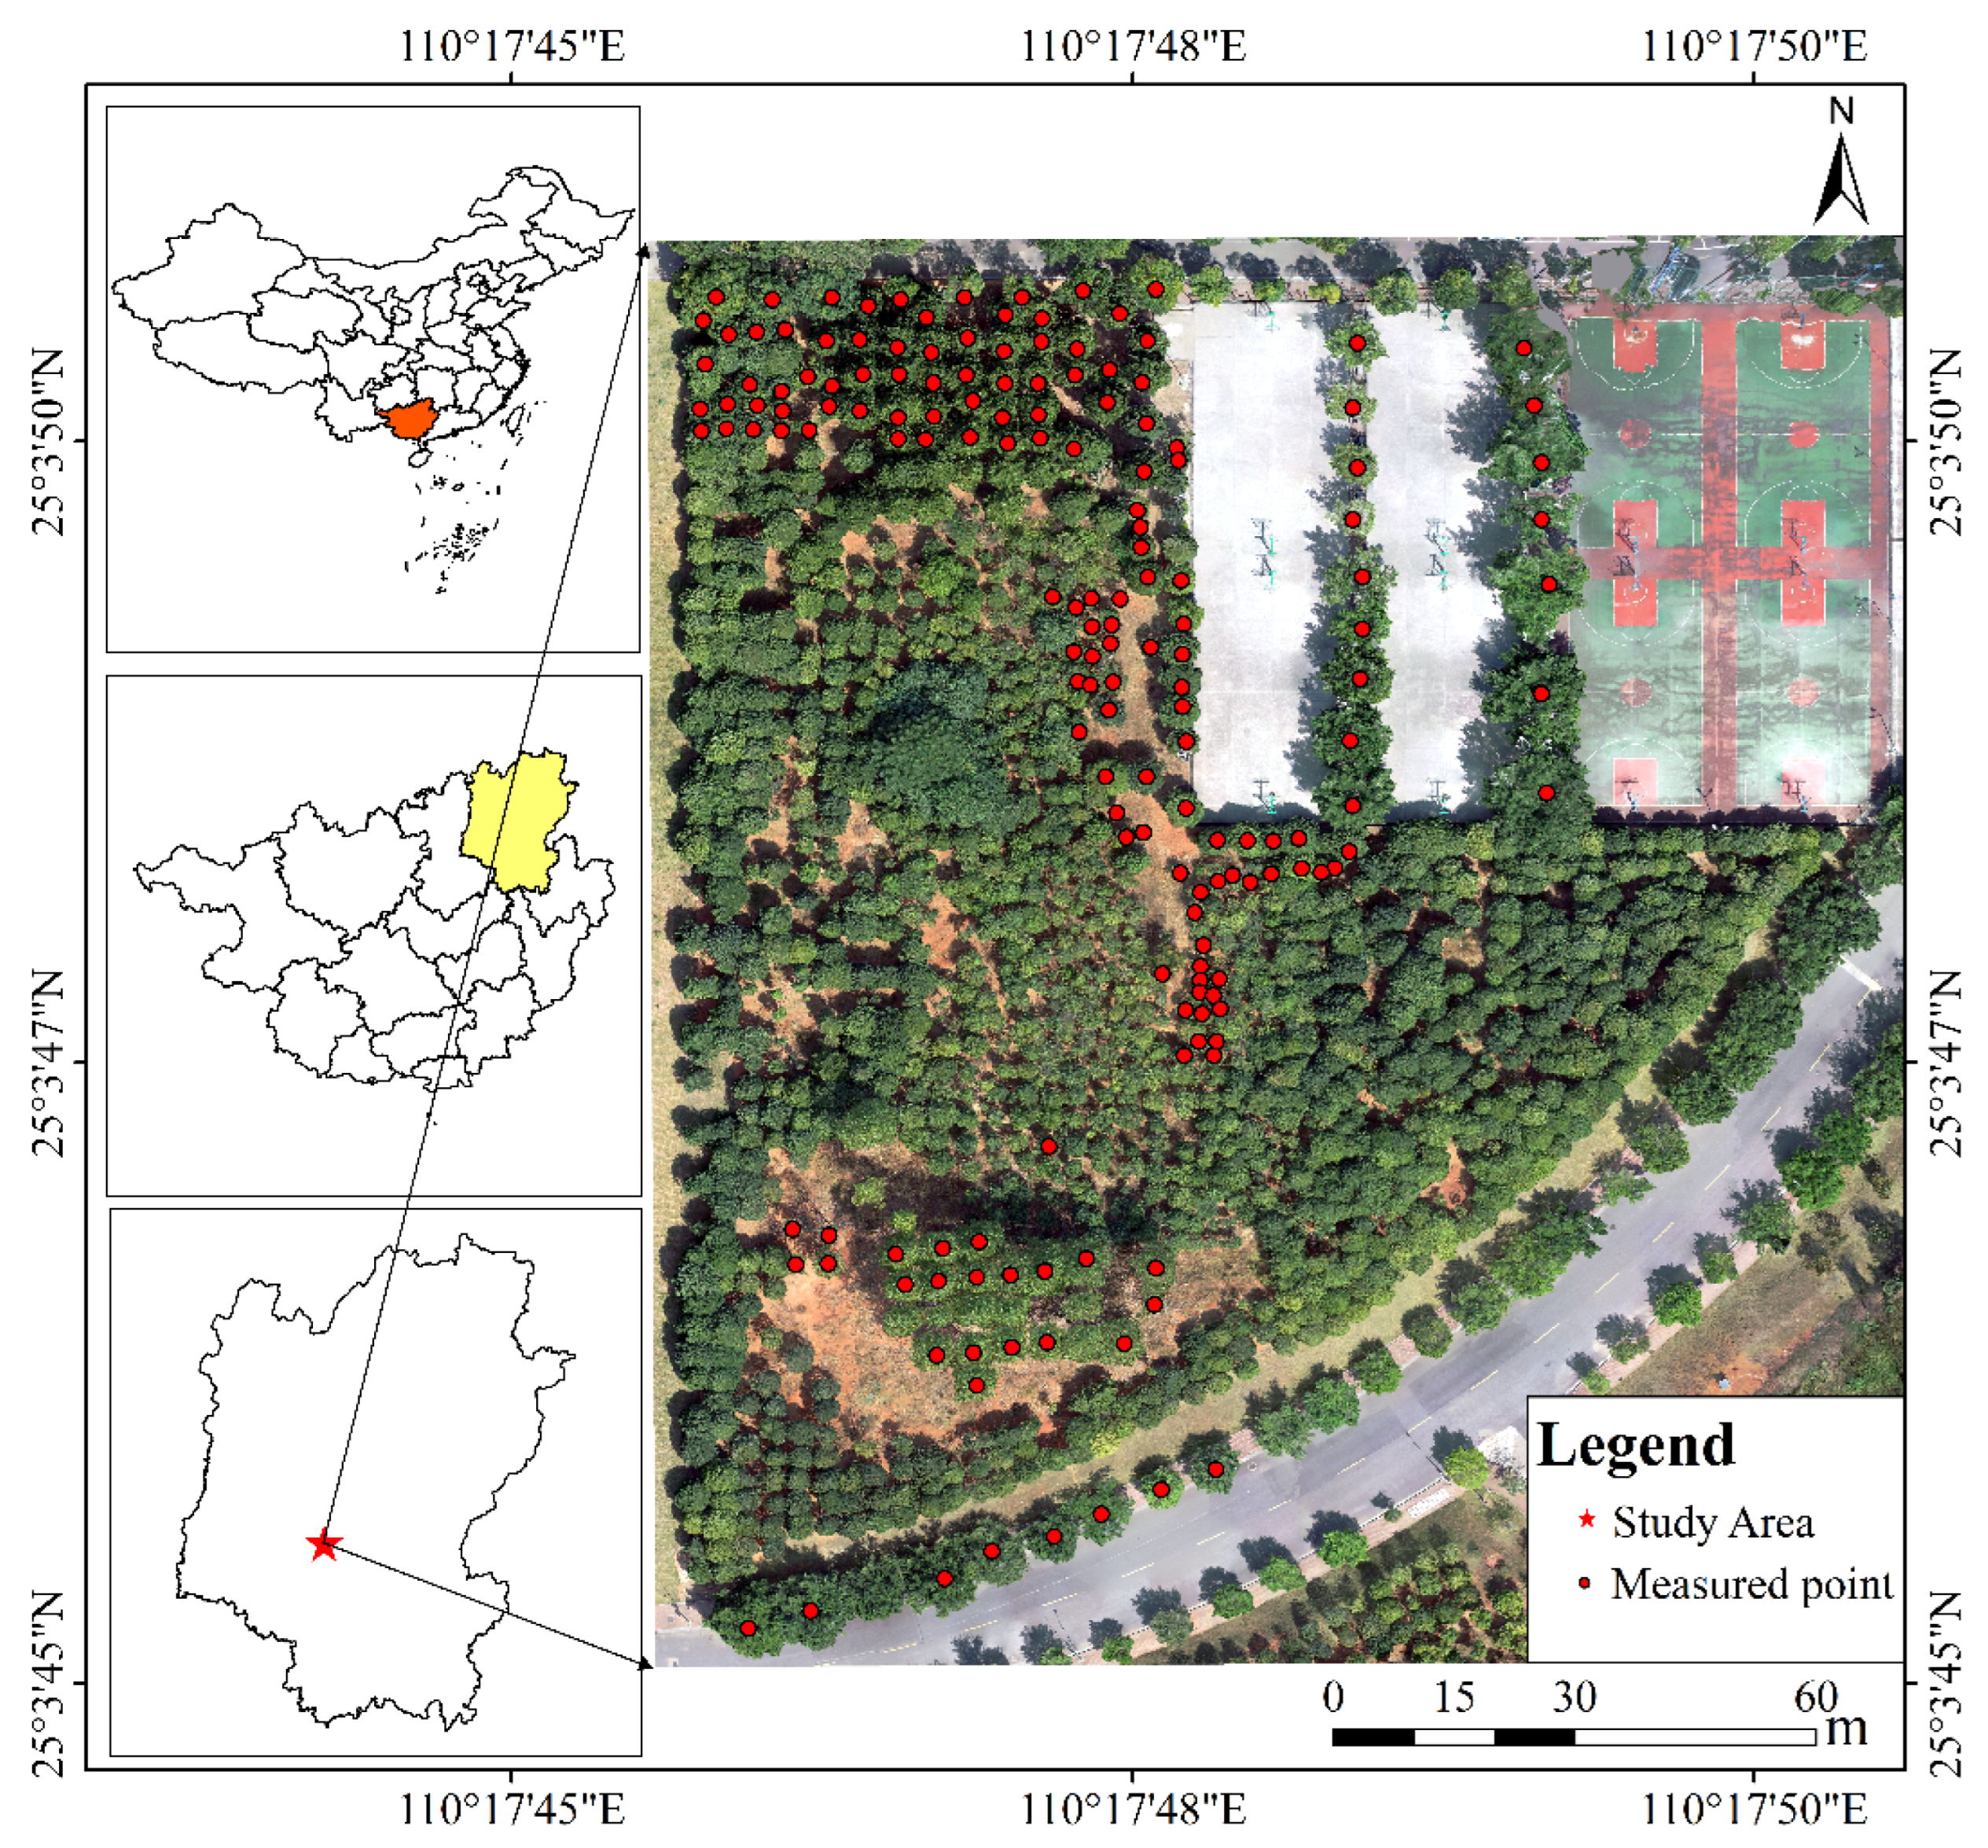
The study was undertaken in a mixed plantation with an area of 2 hectares (110°17′43″E–110°17′50″E, 25°3′45″N–25°3′50″N) on the campus of Guilin University of Technology, Guilin, Guangxi Zhuang Autonomous Region, China, (Figure 1). Guilin is a world-renowned scenic tourist city located in low latitudes. It has a mild subtropical monsoon climate, abundant rainfall, long frost-free periods, sufficient sunlight, a long summer, and a short winter. The annual average temperature is approximately 19.1 °C. July and August are the hottest months of the year, with an average temperature of about 28 °C. January and February are the coldest months, with an average temperature of about 9 °C. The annual average rainfall days are 166, the longest continuous rainfall days are 30, the annual average rainfall is 1887.6 mm, and annual average relative humidity is 76%. The climatic conditions are conducive to vegetation growth. The study area is predominantly covered by Osmanthus fragrans (Osmanthus sp.), Magnolia grandiflora (Magnolia grandiflora L.), Liriodendron chinense (Liriodendron chinense (Hemsl.) Sarg.), Ficus concinna (Ficus concinna L. f.), and Cinnamomum camphora tree species (Cinnamomum camphora (L.) Presl). Although the five tree species belong to broad-leaved trees, Osmanthus fragrans, Magnolia grandiflora, Ficus concinna and Cinnamomum camphora belong to evergreen broad-leaved trees, while Liriodendron chinense belongs to deciduous broad-leaved trees, with leaves falling in October and regrowing in March of next year.
2.2. Data Introduction
2.2.1. Field Data
The field data collection was carried out in the study area on 4 July 2022. The data collected mainly included the following: the location of individual trees, tree species, tree height, and ground point elevation. The positions of individual trees and ground point elevation information were measured using real time kinematic (RTK) and total stations. The tree height was measured using a height measuring rod; the crown width was determined using a tape measure by measuring the sizes in the east-west and north-south directions, respectively. A total of 175 trees were measured, consisting of 85 Osmanthus fragrans, 21 Liriodendron chinense, 37 Magnolia grandiflora, 8 Cinnamomum camphora, and 24 Ficus concinna tree species. The specific statistical results are shown in Table 1.
2.2.2. UAV Data
In order to verify the difference between the performance of UAV LiDAR and stereo images in obtaining understory terrain, the DJI Matrice 300 RTK UAV equipped with Zenmuse L1 sensor and DJI Phantom 4 RTK UAV were used to collect data on 4 July 2022. The specific flight parameters are shown in Table 2.
Under the same flight parameters, the DJI Phantom 4 RTK UAV was used to collect stereo image data in the study area in different months. In February 2022, no UAV-RGB data collection was conducted due to the impact of COVID-19. The specific time of image acquisition is shown in Table 3. In the study, the image data acquired between October 2021 and October 2022 were utilized to measure monthly tree height growth, while the image data acquired between June 2020 and October 2020 under the conditions of no wind or breeze on similar dates every month were utilized to correct the time differences in tree height and to verify the accuracy of previous monthly tree height growth results.
2.3. Method
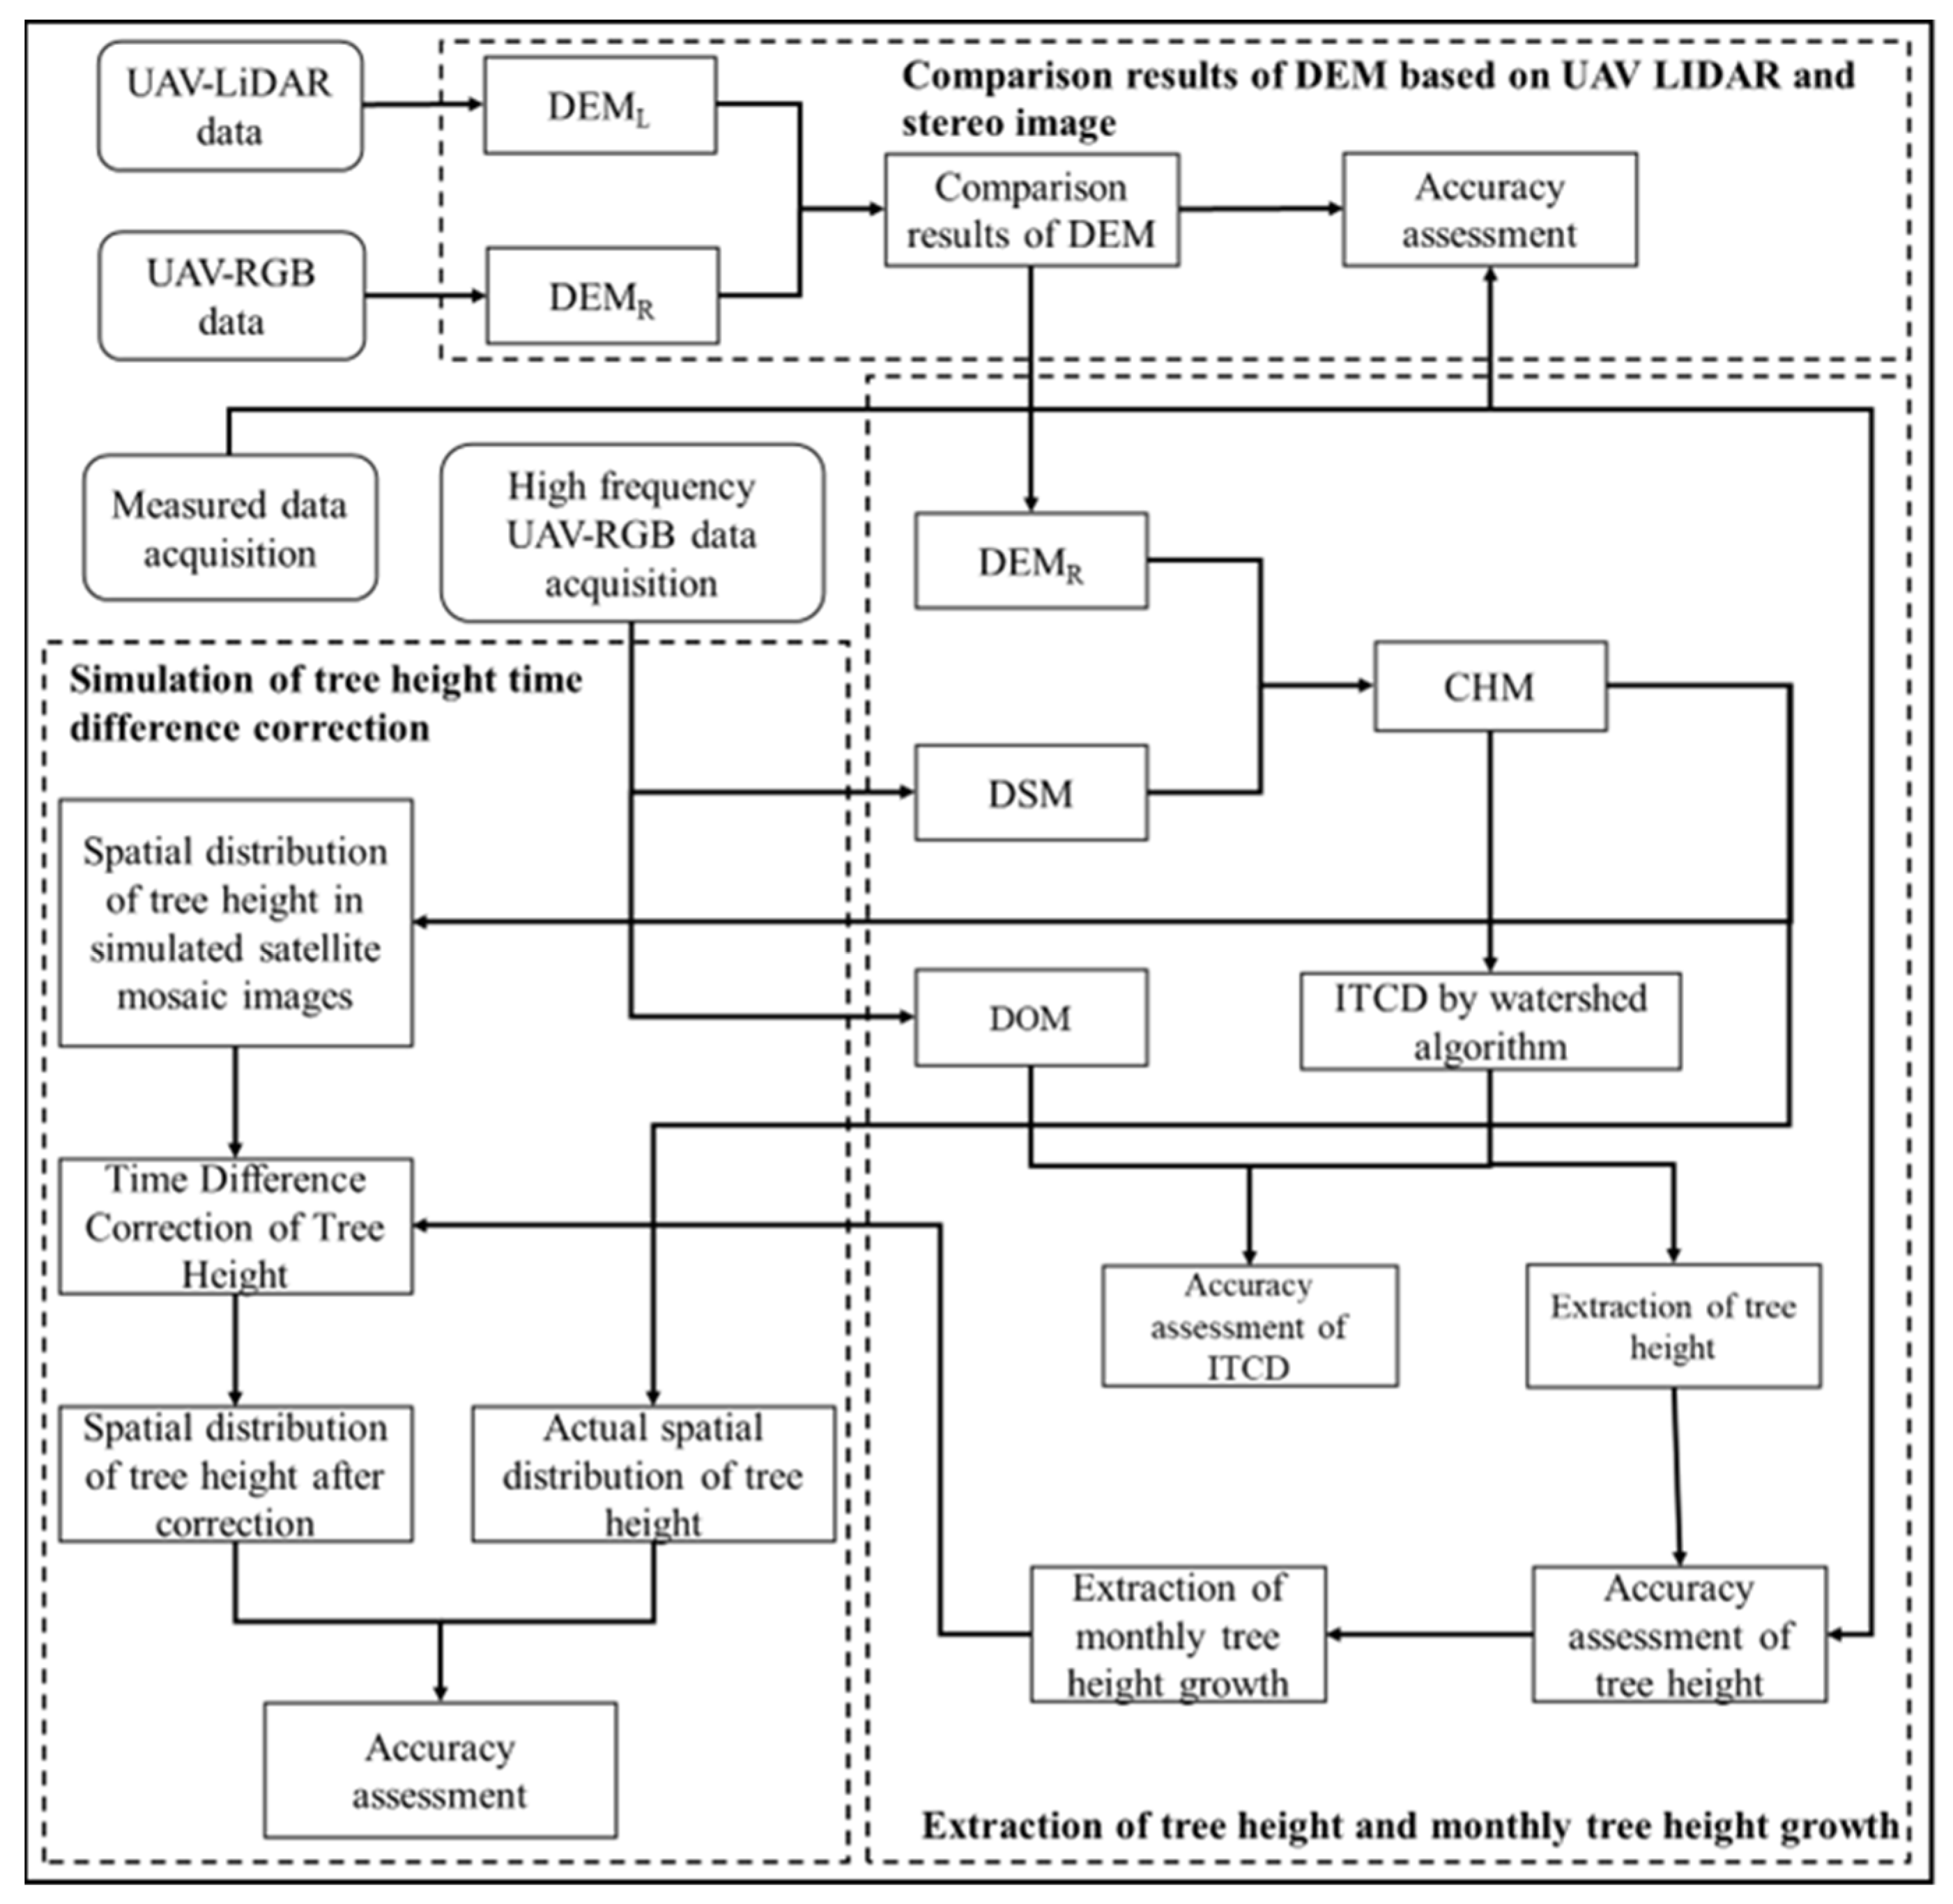
In this paper, UAV LiDAR and stereo images were acquired and processed. The differences in DEMs generated from UAV LiDAR and stereo images were compared and analyzed to evaluate the feasibility of generating understory DEMs based on the UAV stereo images. The CHM was generated based on the Digital Surface Model (DSM) and DEM was generated from UAV stereo images, and the watershed segmentation algorithm was used to segment the individual trees based on the CHM data. The tree height was extracted from the results of the individual tree segmentation process using the maximum algorithm and the field survey data. Subsequently, the monthly changes in the height growth estimates of the trees in a year were extracted and analyzed to study the growth change rules of different subtropical tree species. Based on the extraction results of the monthly changes in the height growth estimates of trees, the correction of time differences in the growth of regional trees was simulated. This was done to verify the feasibility of using the monthly growth changes to correct the regional time difference and further provide a method for the correction of future significant regional time differences. The flowchart used in this study is shown in Figure 2.
2.3.1. UAV Data Process
Based on the stereo images obtained by the UAV, the Context Capture software was used to develop a DSM with a spatial resolution of 2 cm, which was recorded as a DSMR. Meanwhile, Pix4D software was used to perform spatial triangulation to develop point cloud data. Then, LiDAR360 software was employed to de-noise and classify the point cloud data to obtain ground and non-ground points [16]. Finally, the DEM data with a spatial resolution of 2 cm was obtained by employing the Inverse Distance Weight (IDW) interpolation method based on the classified ground points, which was recorded as DEMR.
Meanwhile, the LiDAR data was preprocessed using DJI Map software to develop LAS data. The LiDAR360 software was utilized to de-noise and classify them to obtain ground points and non-ground points. Finally, the classified ground points were interpolated using the IDW interpolation method to obtain a DEM with a spatial resolution of 2 cm, which was recorded as DEML.
2.3.2. Individual Tree Crown Detection Method
Using the extracted DEM and DSM, the Canopy Height Model (CHM) was derived from the difference between DSM and DEM. According to the field survey, the maximum and minimum tree heights were 17 m and 2.6 m, respectively, as shown in Table 1. At the same time, with considering the effect of tree height measurement error, the maximum and minimum tree height threshold is set to 18 m and 2 m, respectively. Therefore, the CHM values greater than 18 m or less than 2 m were removed before the individual tree segmentation.
The watershed segmentation algorithm was used to undertake Individual Tree Crown Delineation (ITCD). The watershed algorithm is a mathematical morphological segmentation method based on topology theory. Its basic idea is to treat the image as a topological landform in geodesy. The gray value of each point in the image represents the elevation of the point. Each local minimum value and image area is called a catchment basin, and the boundary points between the catchment basins are called watersheds [17]. The calculation of the watershed algorithm is an iterative process that primarily consists of two steps: sorting and submerging. First, the gray level of each pixel is sorted from low to high, and then, during the submerging process, the FIFO structure is used to judge and label each minimum in the image domain at a certain height. The watershed algorithm responds well to weak edges, and thus it has been used successfully in ITCD research [4,18,19,20]. In cases where the watershed algorithm is used to segment ITCD, the Gaussian smoothing factor and the smoothing window radius are also required to be determined. As a result of repeated experiments, it is evident that when the Gaussian smoothing factor is set to 16 and the smoothing window radius is set to 111 pixels, the ITCD result of the watershed algorithm is relatively favorable. The results of individual crown segmentation are manually modified to minimize the impact of inaccurate crown segmentation boundary on tree height extraction.
2.3.3. Calculation of Tree Height and Monthly Tree Height Growth
The optimal individual tree crown segmentation vector map was obtained based on the ITCD results of the watershed segmentation algorithm supplemented with manual adjustment. In addition, utilizing the maximum local method, the maximum value of CHM within the individual tree crown segmentation vector area was determined as the corresponding tree height. The same operation was performed based on the monthly CHM extracted from UAV stereo images to achieve the monthly individual tree height extraction within the study area. Using the monthly extraction results of individual tree heights, it was possible to obtain the differences in individual tree heights over two months by subtracting the individual tree height of the previous month from the individual tree height of the following month (in other words, the height growth of one month). By analogy, the monthly height growth of individual trees in the study area was obtained.
Based on the extraction of individual tree heights and the monthly tree height growth, the tree heights and monthly changes in the height growth of different tree species within the study area were calculated separately. This was done to examine the differences in the estimation results in the cases of different tree species and the annual growth change rules, as well as to provide basic data for the subsequent time difference correction of the height growth estimates of the trees.
2.3.4. Simulation of Tree Height Time Difference Correction
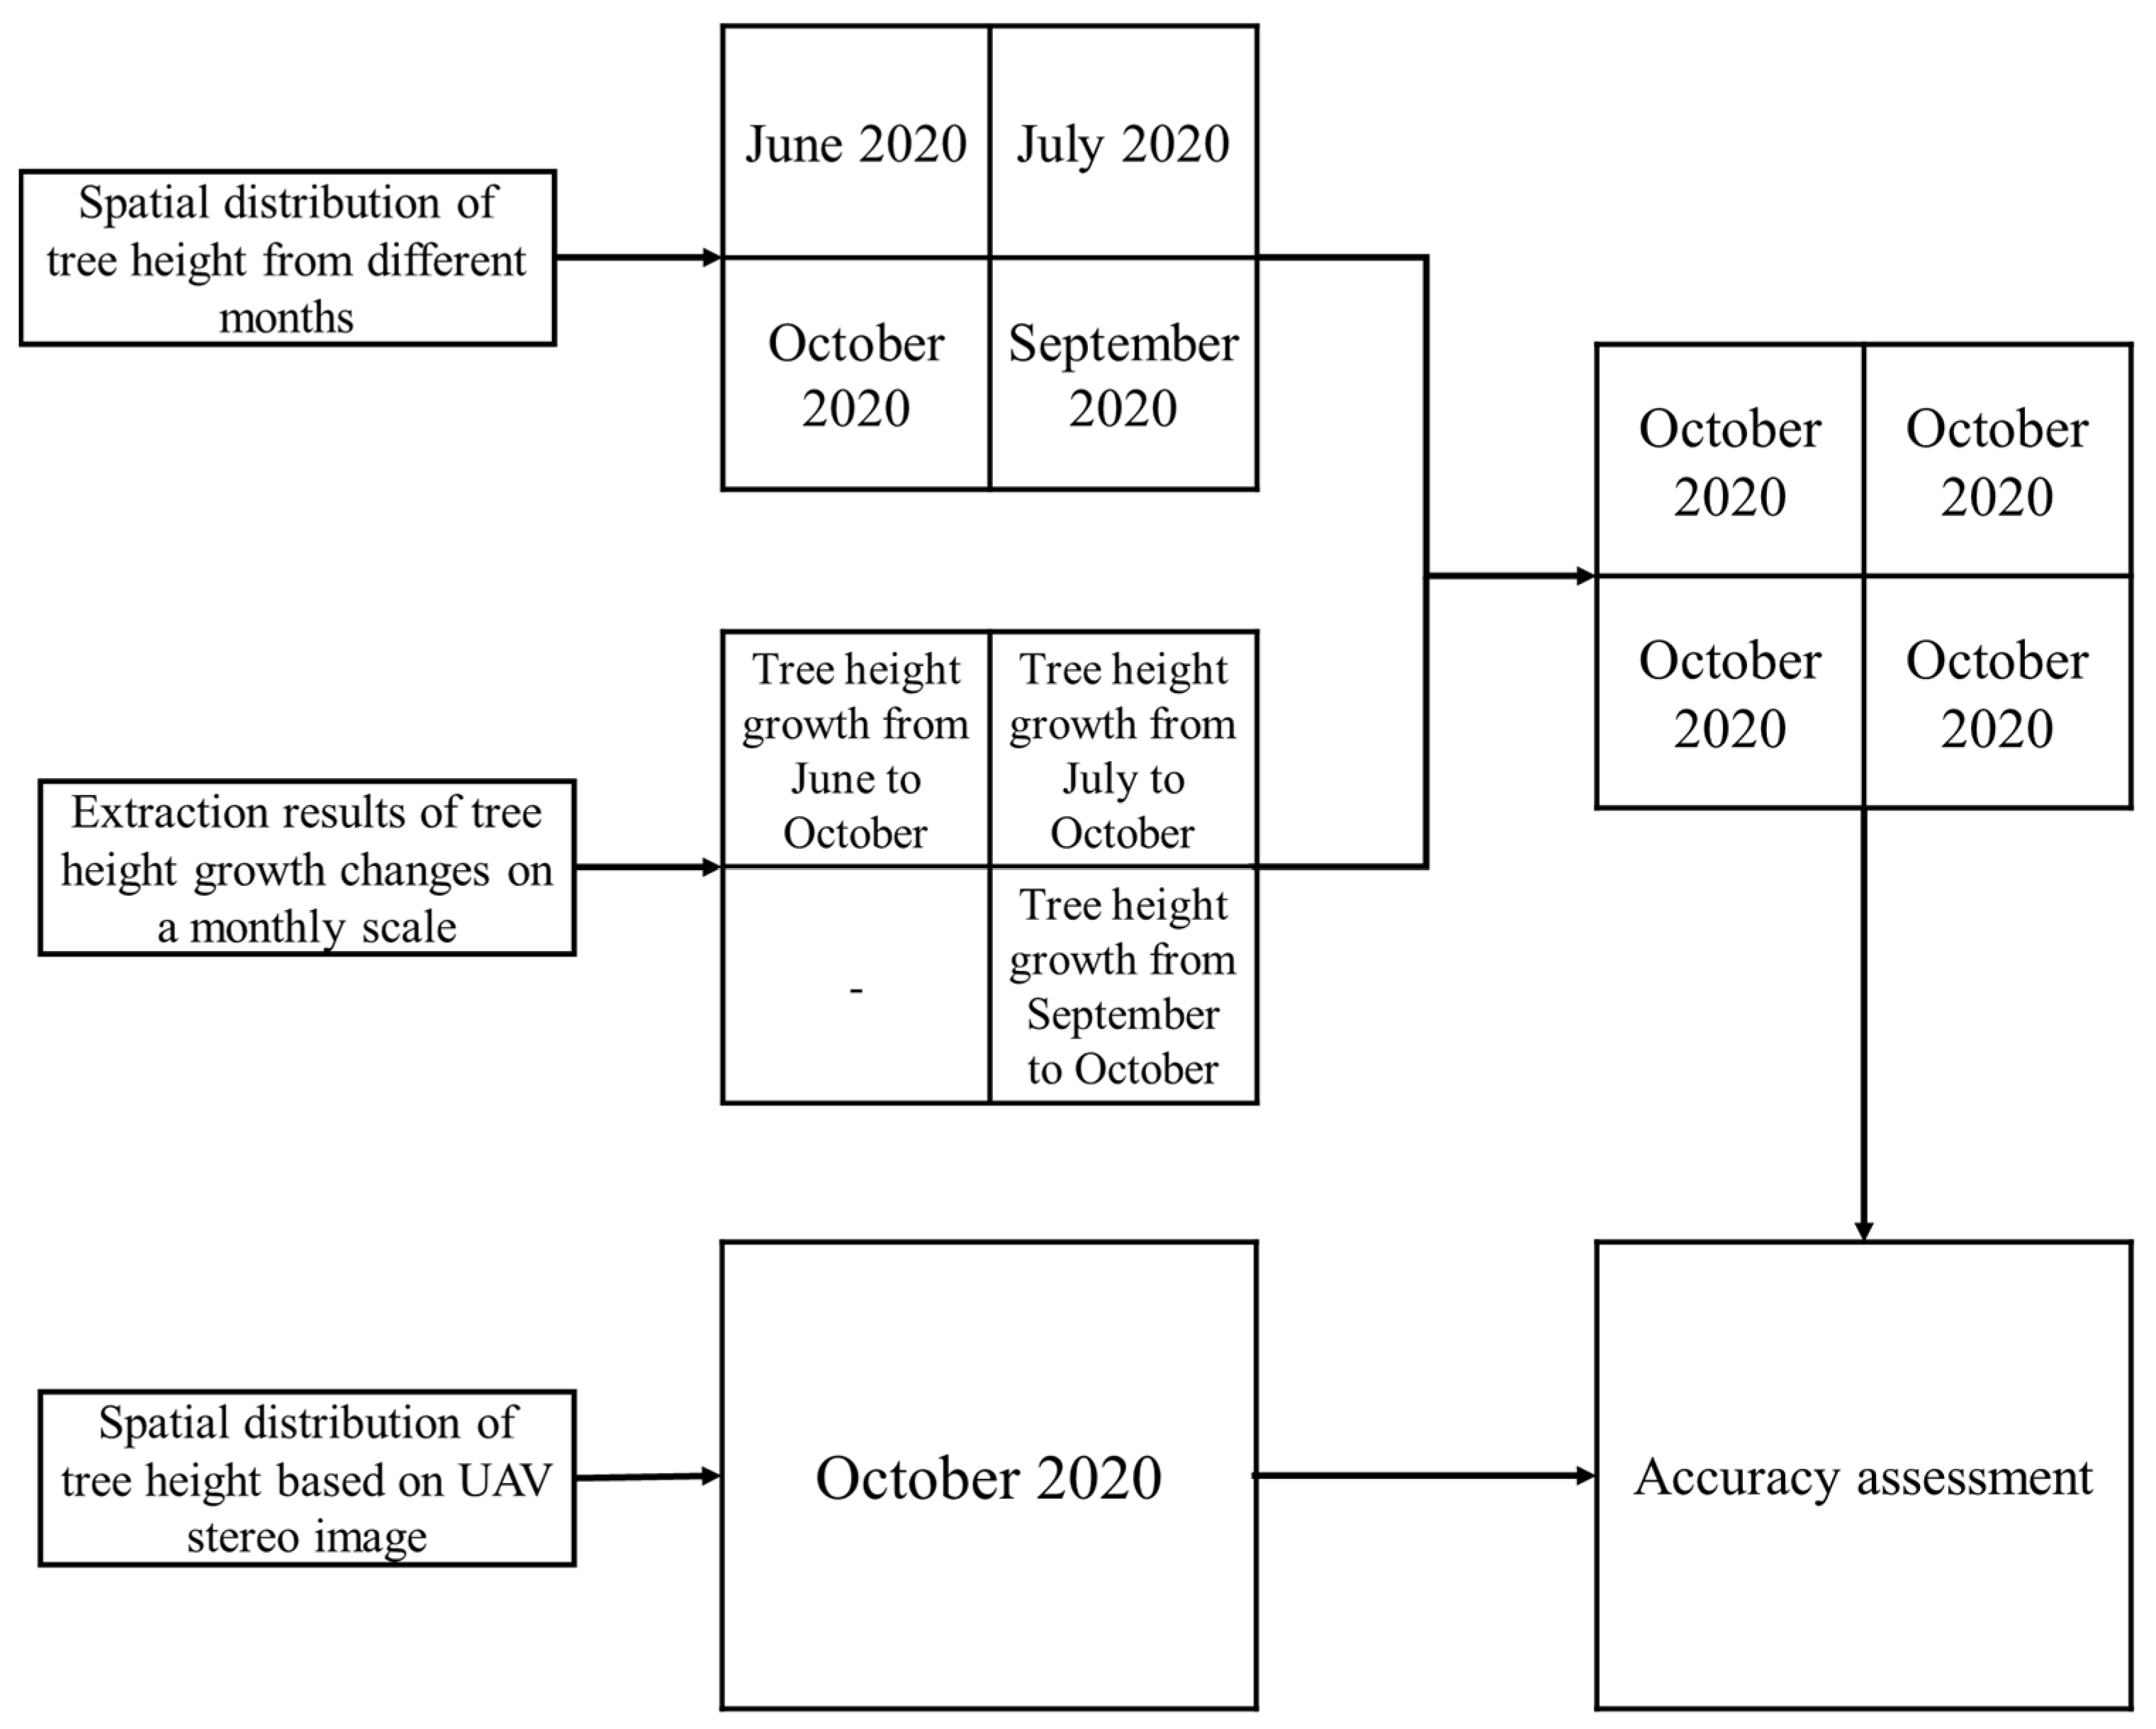
To further verify the feasibility of the extraction of monthly individual tree height growth to correct the regional time difference in tree heights, the study area was first divided artificially into four parts following the principle of regional satellite image splicing, with each part representing a different month of the year. Subsequently, the monthly height growth of the trees between 2021 and 2022 were obtained using the UAV stereo images collected between October 2021 and October 2022. The spatial distribution of tree height in the study area was corrected to the same month based on the monthly tree height growth in the case of four different months. Finally, in order to verify the feasibility of the correction of the time differences in the height growth estimates of regional trees in accordance with the monthly tree height growth changes, it was necessary to calculate the spatial distribution results of the height growth of the trees after the time difference correction and the spatial distribution results of tree height generated directly from UAV images. The specific process is shown in Figure 3.
2.3.5. Accuracy Evaluation
- (1)
- Accuracy Evaluation of DEM Data
The accuracy of DEM data is closely related to the accuracy of CHM data and the subsequent extraction of individual tree heights. Therefore, it is necessary to evaluate the accuracy of the DEM data developed based on data obtained by UAVs. At first, the accuracy of the difference between DEM data developed based on UAV LiDAR and stereo images and the measured field elevation was evaluated. Subsequently, the correlation and difference between the DEM data developed from LiDAR and stereo images were evaluated. The evaluation indicators used were R2 and RMSE. The specific calculation formula is as follows:
where i indicates the sample index; n is the number of samples; hi is the estimated elevation; Hi is the measured elevation; R2 is the correlation coefficient; and RMSE is the root mean square error.
- (2)
- Accuracy evaluation of Individual Tree Crown Delineation results
The individual tree height is the maximum estimated value on the basis of the ITCD results. In other words, the accuracy of the ITCD results is closely related to the accuracy of each tree height estimation. As a means to further evaluate the accuracy of the ITCD results, the watershed algorithm segmentation results were compared with the visual interpretation results. The Recall (R), Precision (P), and F-score (F) were used to evaluate the accuracy of ITCD results. The specific formula was as follows [21,22]:
where nTP is the number of correctly segmented canopies; nFN is the number of incorrectly segmented canopies; and nFP is the number of tree crowns that are missing segmentation.
- (3)
- Accuracy evaluation of individual Tree Height Extraction Results
To verify the accuracy of individual tree height extractions, a correlation analysis between the extracted tree height and the field-measured tree height was carried out. The tree height extraction results were evaluated using correlation coefficients R2 and RMSE. The calculation formulas for R2 and RMSE are shown in Equations (1) and (2).
3. Results
3.1. Results of DEM Generated from UAV LiDAR and Stereo Images
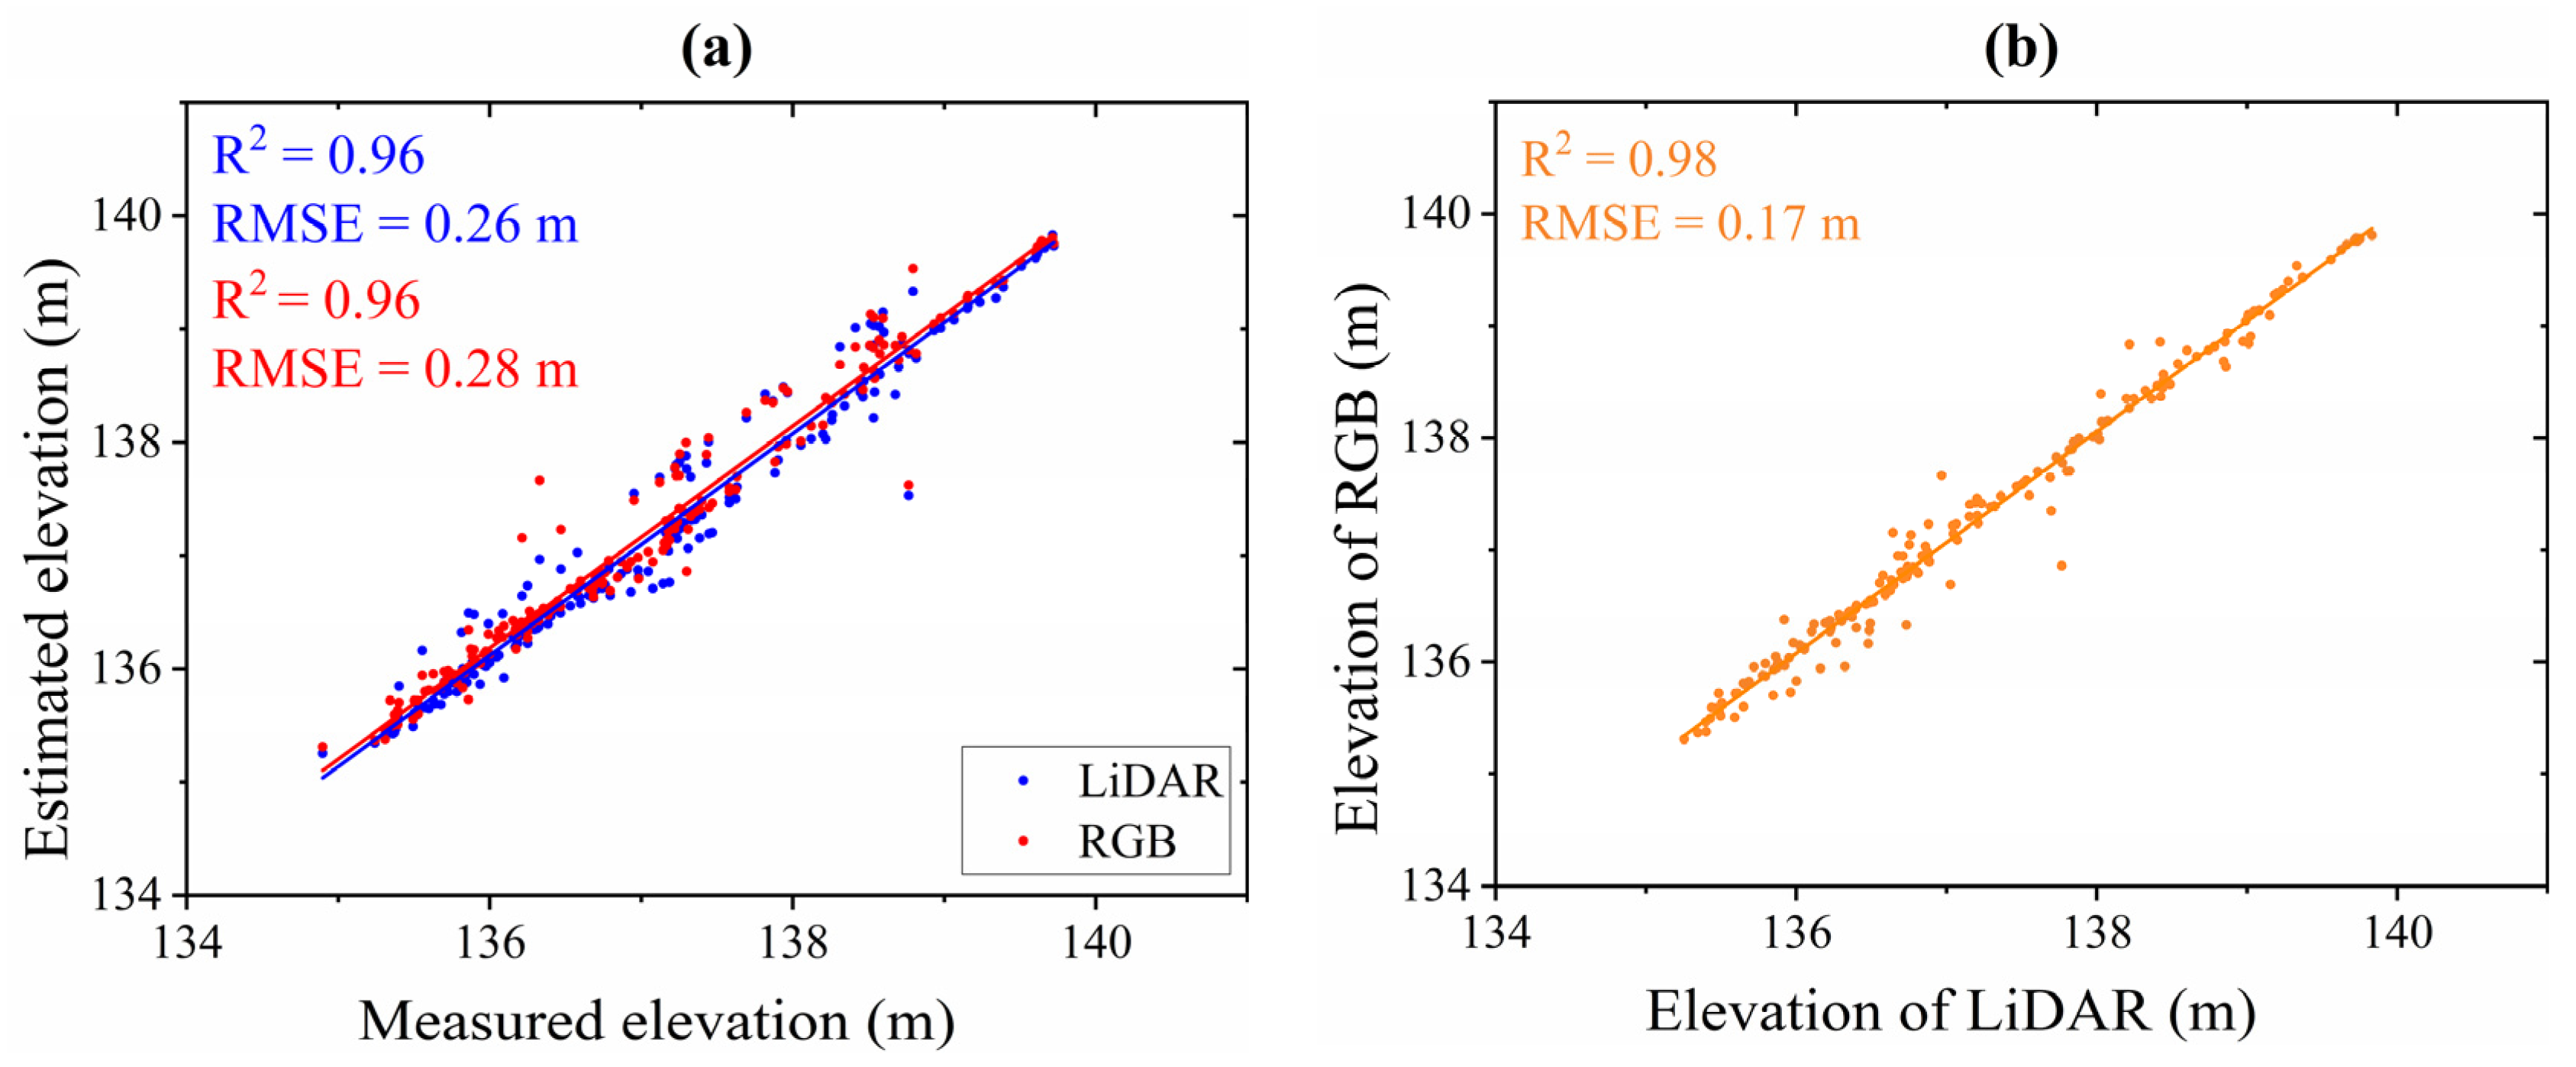
The correlation between the field-measured elevation, and the corresponding elevation values of DEMR and DEML is shown in Figure 4a, and the correlation between the elevation values of DEMR and DEML is shown in Figure 4b.
Both DEMR and DEML were well correlated with the field-measured elevation, with an R2 of 0.96 (Figure 4a). The RMSE between DEML and the field-measured elevation was 0.26 m, while the RMSE between DEMR and the field-measured elevation was 0.28 (a difference of 0.02 m). The results demonstrated that DEML was superior to DEMR; however, the difference between them was not significant. This is relatively consistent with the results shown in Figure 4b. The correlation R2 of DEMR and DEML was as high as 0.98 (Figure 4b). Thus, it can be concluded that DEMR derived from UAV stereo images is closely related to DEML derived from UAV LiDAR data and that the difference is not significant. In this study, DEMR was utilized to replace DEML for subsequent CHM generations. The detail analysis of the elevation difference between DEMR and DEML can be found in the Supplementary Materials.
3.2. Results of Individual Tree Crown Delineation
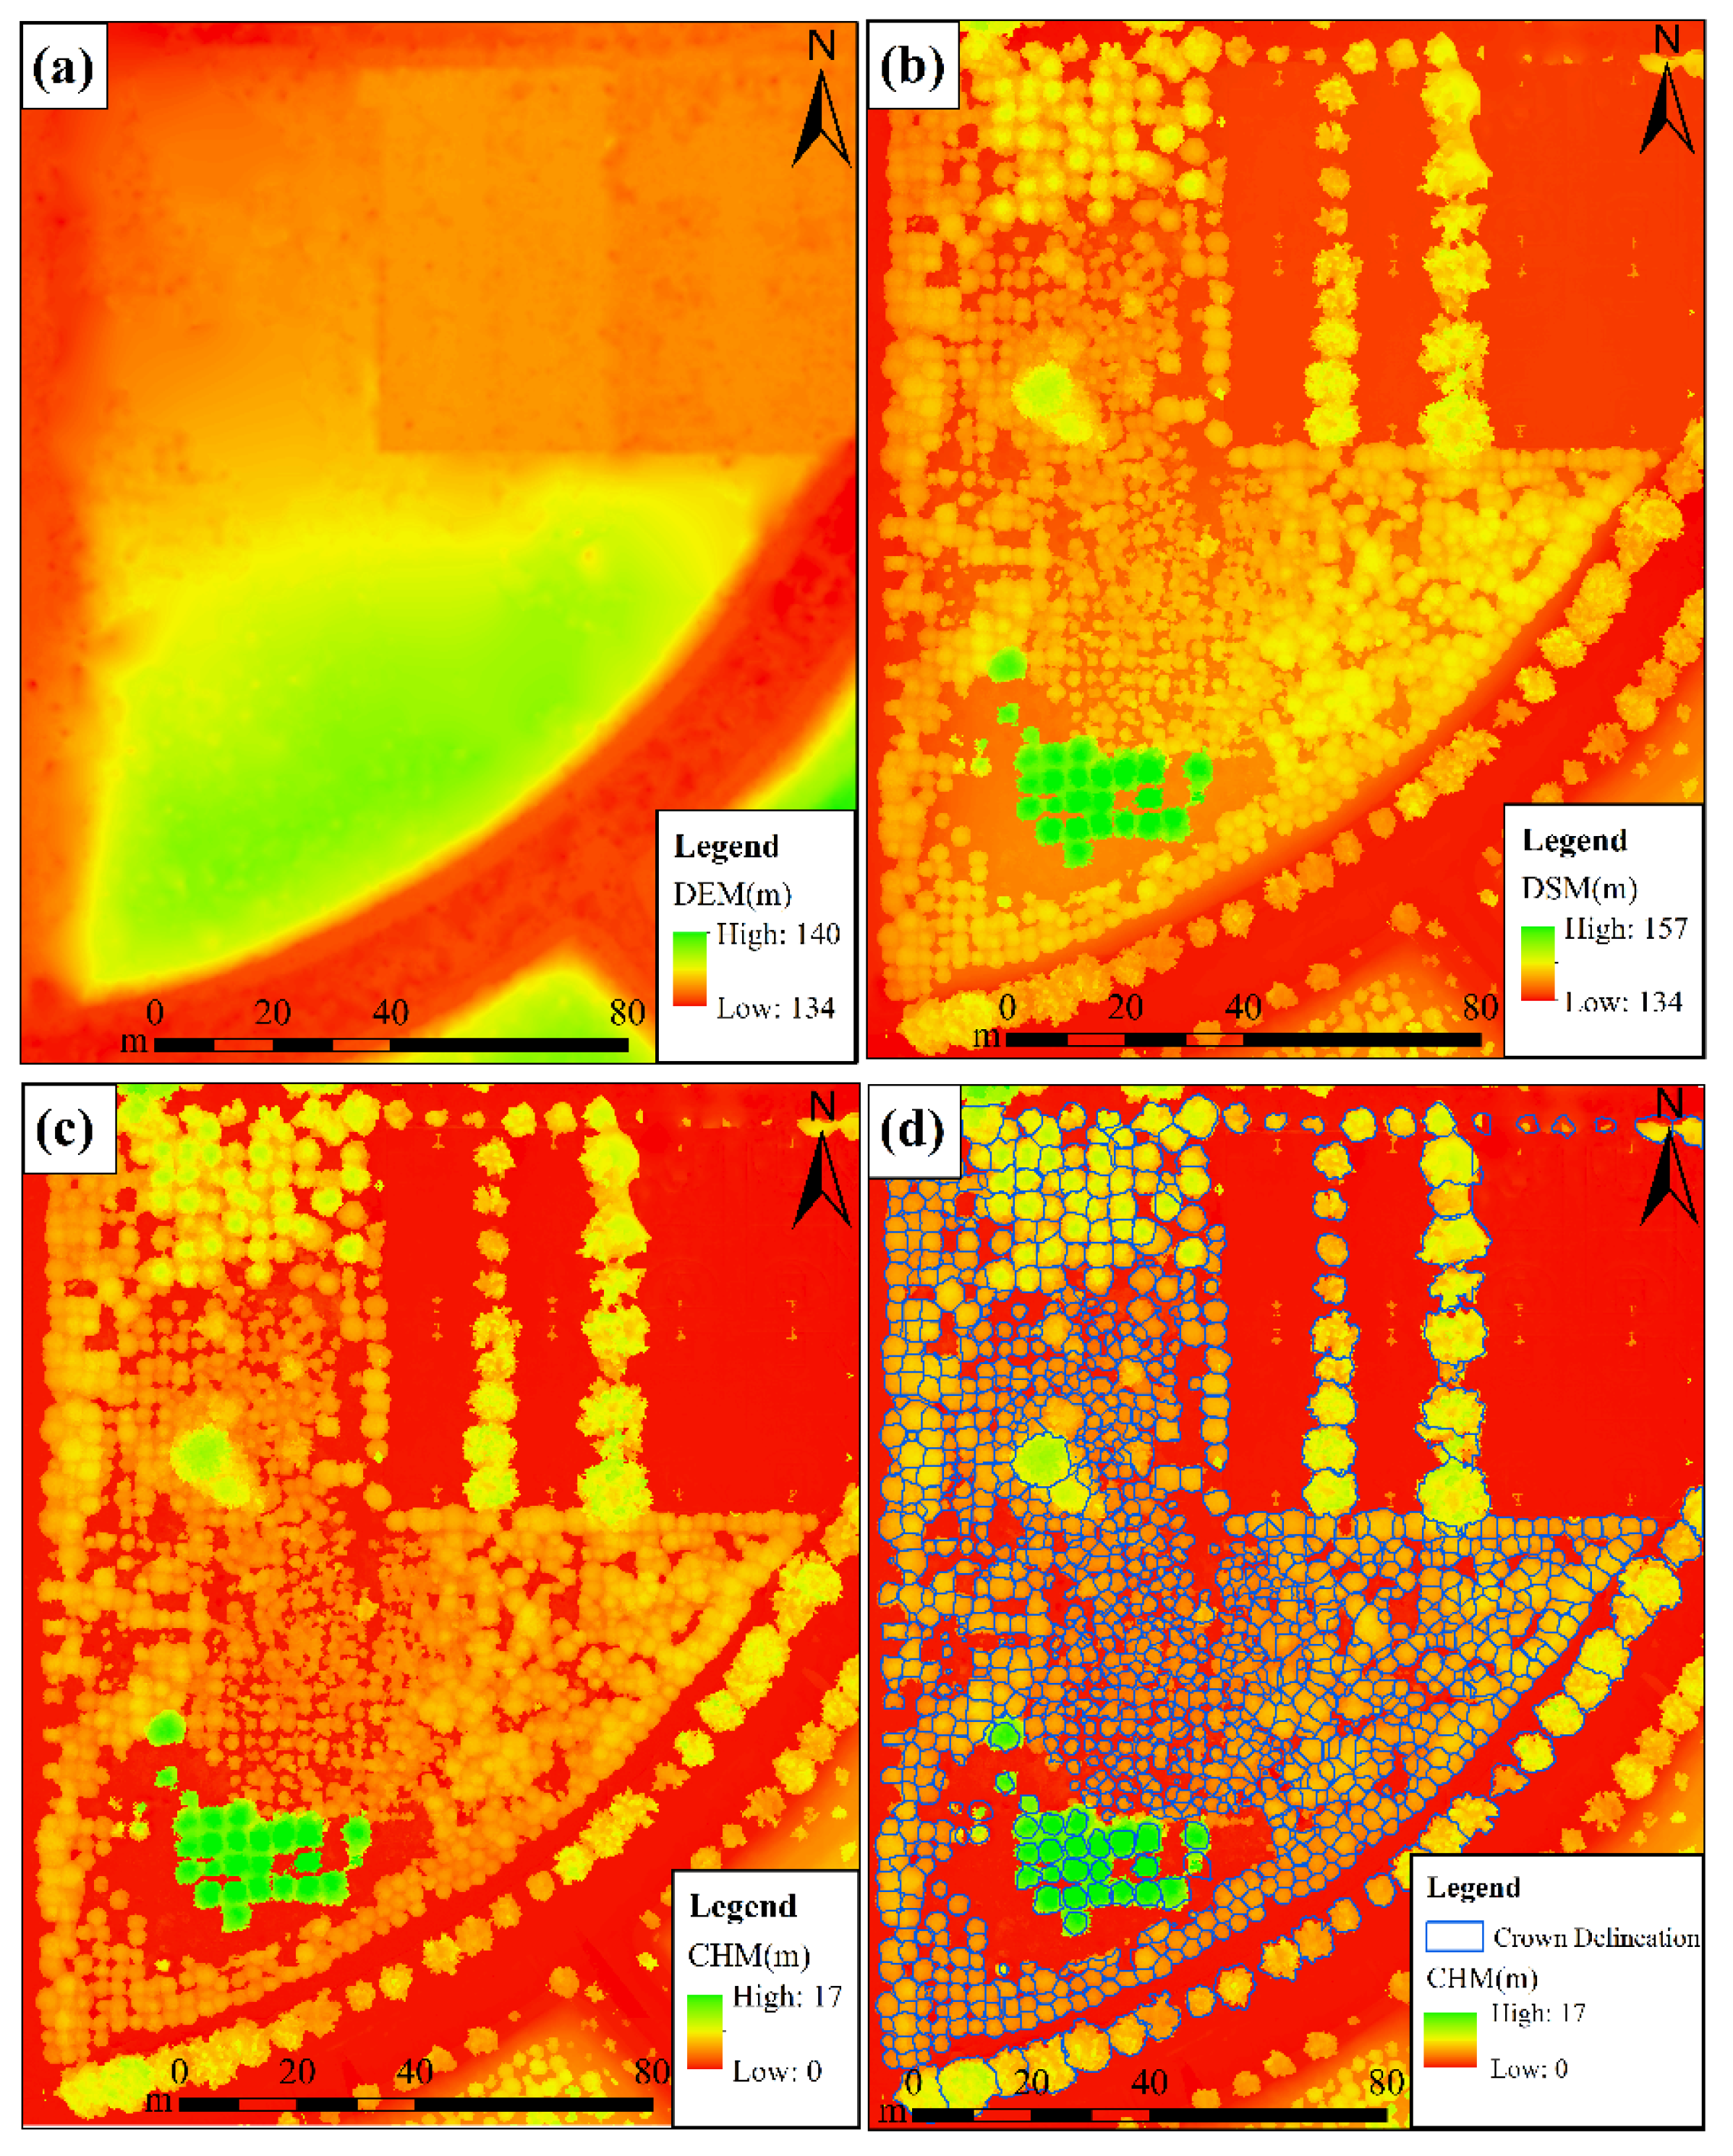
It is evident that the DEMR derived from UAV-RGB data is relatively similar to the DEML derived from UAV LiDAR data. However, the cost of obtaining DEM data based on UAV-RGB data is far lower than that of developing DEM based on UAV-LiDAR data. Given its data accuracy and cost-efficiency, DEMR derived from UAV-RGB data was selected as the basic data for subsequent CHM data development. The DEM, DSM, CHM, and ITCD results are shown in Figure 5.
The tallest trees within the study area were no more than 17 m (Figure 5c). These were mostly Liriodendron chinense trees located in the lower-left corner of the study area. In addition, Osmanthus fragrans trees were more abundant within the study area, and the canopy density was high; however, this tree species was relatively short. The ITCD results based on the watershed algorithm are shown in Figure 5d. In most areas, the ITCD results were relatively accurate; however, there were cases of over- and under-segmentation in areas with large canopy closures. By comparing the segmentation results with the field-measured individual trees, it was found that one hundred sixty-one of the one hundred seventy-five trees measured in the field were correctly segmented, nine were over-segmented, and five were under-segmented. The segmentation accuracy evaluation indices were calculated as follows: R = 94.71%, P = 96.98%, and F = 95.83%. The results indicate that the watershed algorithm is capable of accurately segmenting the individual trees in the study area.
3.3. Extraction Results of Tree Height
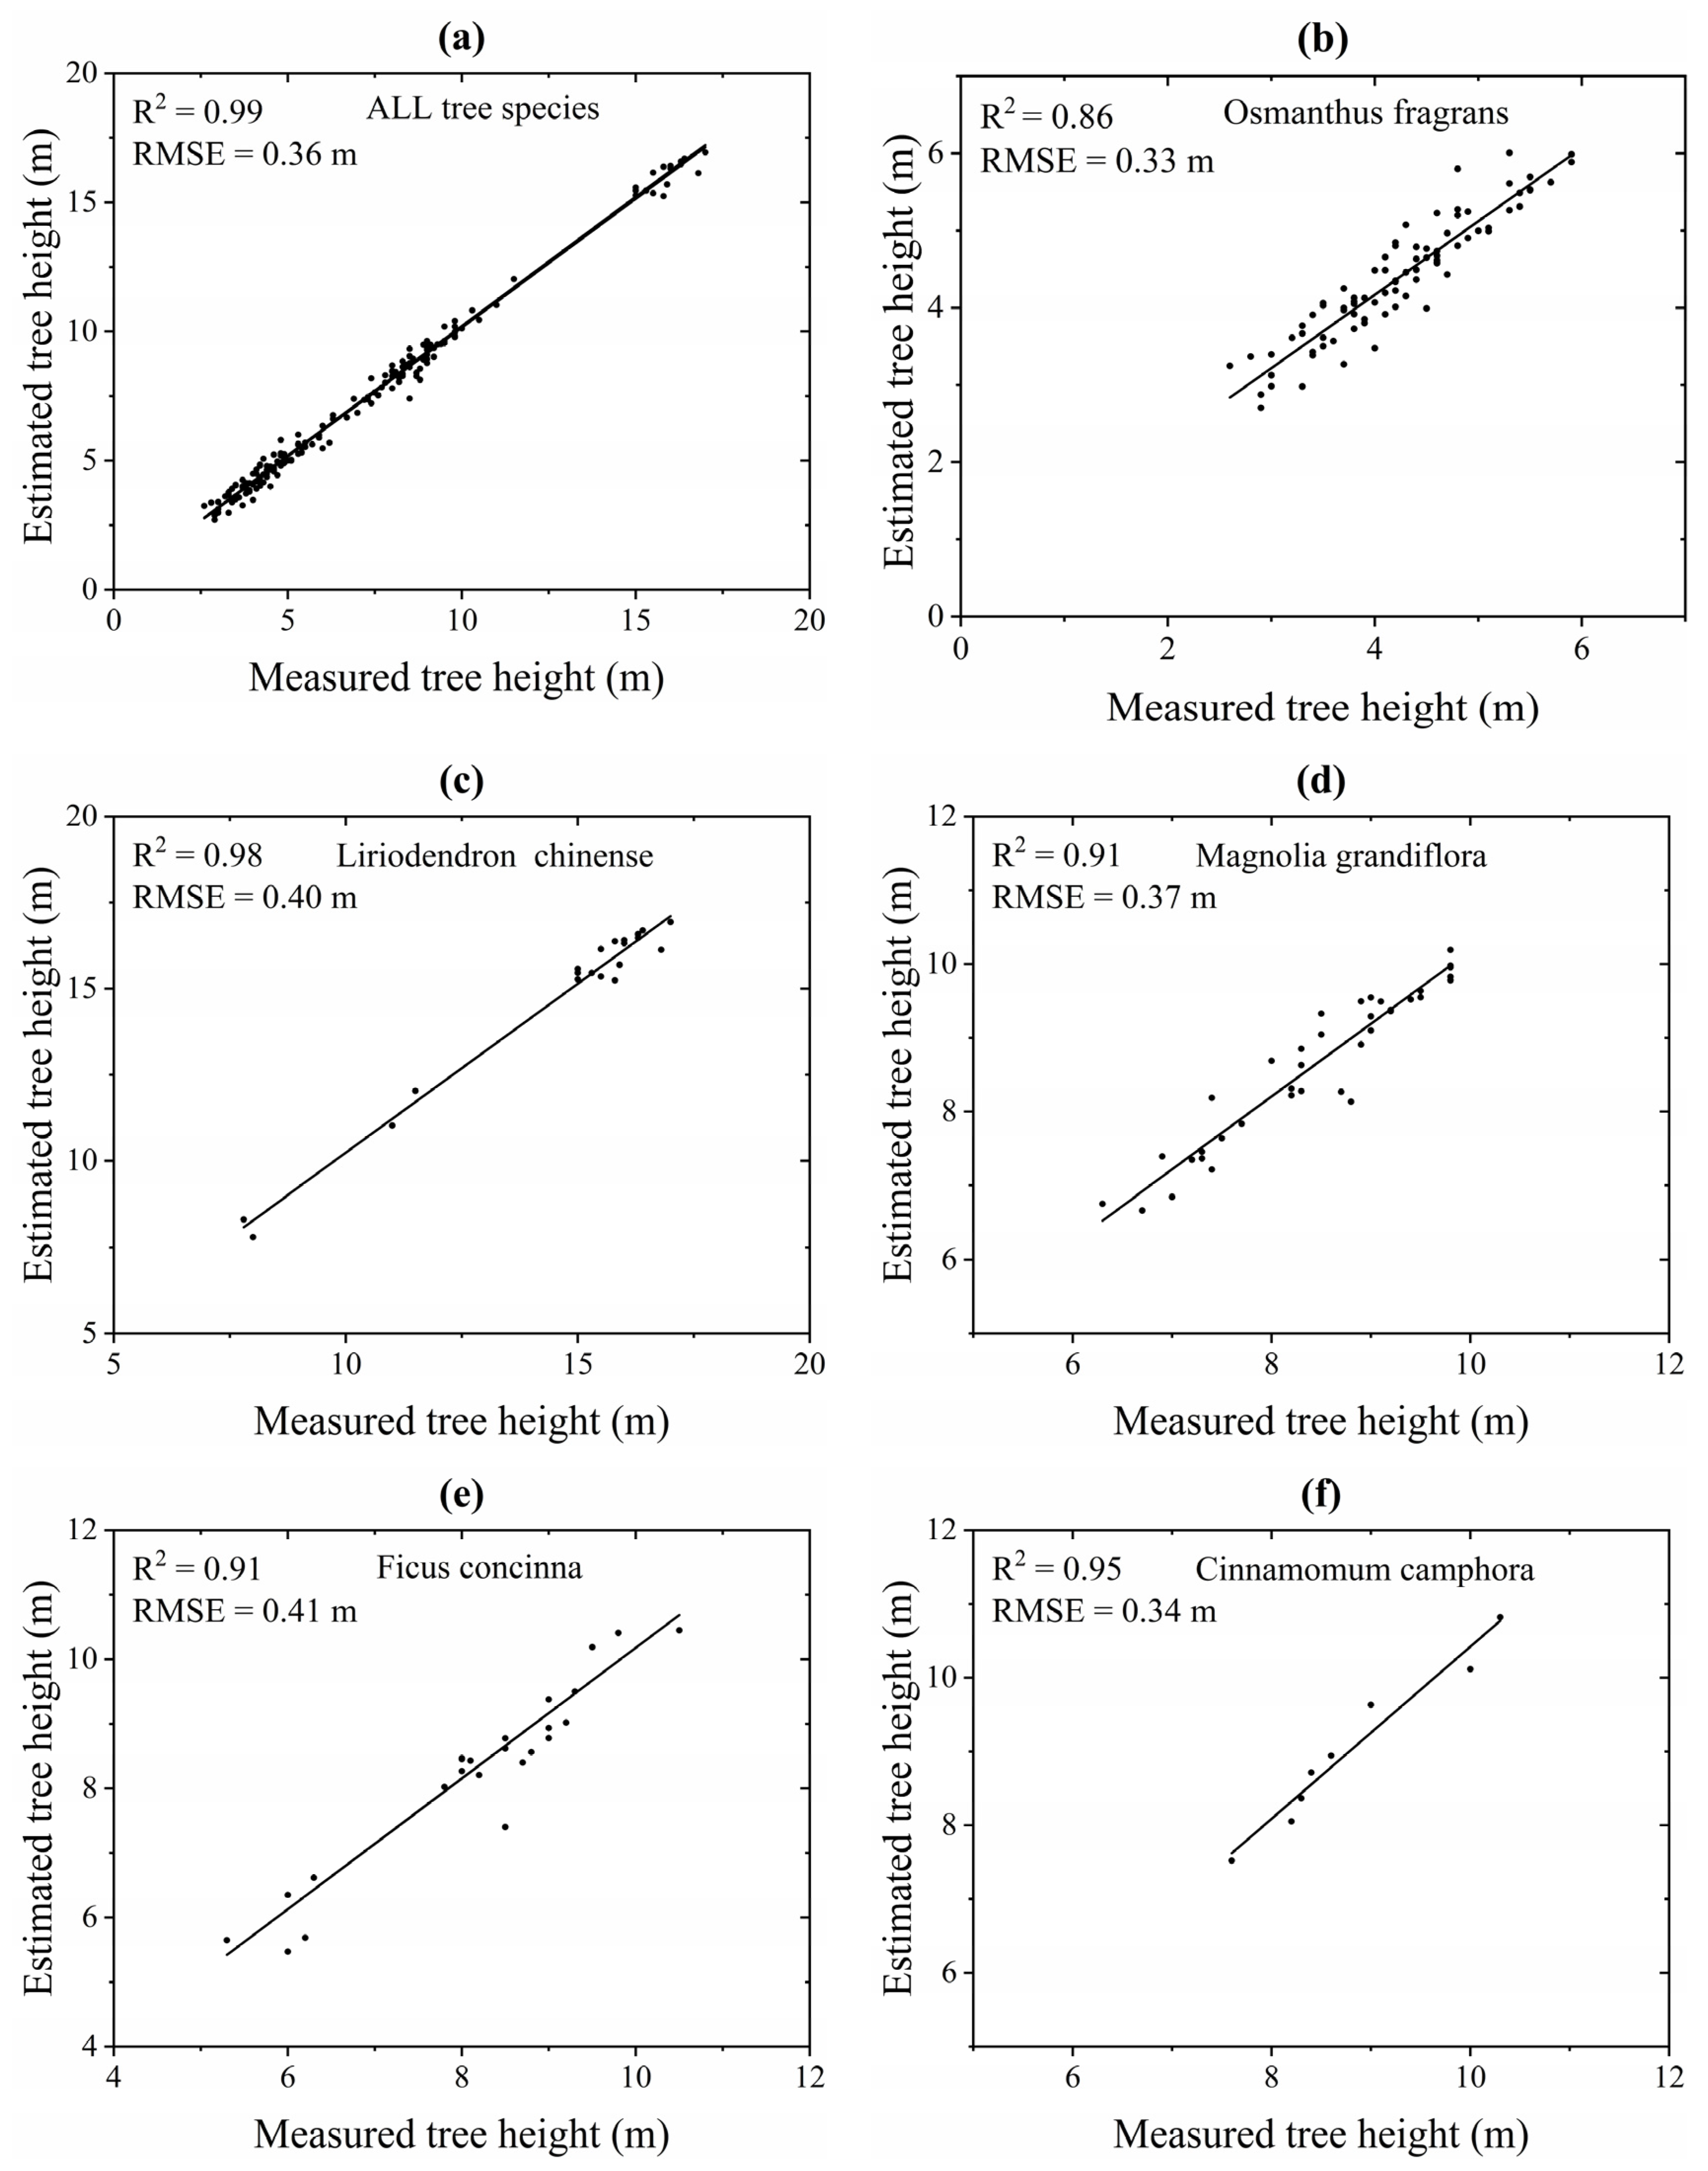
The local maximum value method was used to calculate the maximum value of the vector area of the ITCD as the tree height of the corresponding individual tree. Additionally, the correlation analysis was conducted by employing the results of the field-measured and extracted tree height. The tree height extraction results for different tree species are shown in Figure 6.
The tree height estimates of all tree species were correlated with the field-measured tree height estimates, with an R2 exceeding 0.85 (Figure 6). The tree height estimation results that did not take the tree species into account achieved the highest degree of accuracy (correlation coefficient of R2 = 0.99 and RMSE = 0.36 m). Among the five different tree species, the R2 between the estimated height of Osmanthus fragrans trees, and the field-measured tree height was the lowest (R2 of 0.86 and an RMSE of 0.33 m). R2 between the estimated height of Liriodendron chinense trees and the field-measured tree height estimates was the highest (R2 = 0.98 and RMSE = 0.40 m). Additionally, the correlation between the tree height estimates of the other three tree species and the field-measured tree height estimates was also favorable, with R2 > 0.9. The results indicated certain differences in the estimated tree heights among different tree species, which were mainly related to the canopy structure of different tree species. In this study, the crown of Liriodendron chinense trees was tower-shaped. Because fewer leaves are at the top of the tree, it may be difficult to detect the top of Liriodendron chinense trees when using the SFM algorithm to develop a DSM. Accordingly, the estimated height of Liriodendron chinense trees exhibited a degree of deviation from the true height estimates. Similarly, through field investigation, it was found that the branches of Ficus concinna trees within the study area grew outward. Moreover, the branches and leaves may not be detected when using the SFM algorithm to develop the DSM. Therefore, the estimated tree height of Ficus concinna trees also included a high degree of deviation from the actual tree height estimates. However, in the case of Magnolia Grandiflora, Cinnamomum camphora, and Osmanthus fragrans trees, the majority of the crowns are umbrella-shaped. The vertices of these tree species could easily be identified using the SFM algorithm; thus, the estimated tree height exhibited a small degree of deviation from the true value.
3.4. Extraction Results of Monthly Tree Height Growth
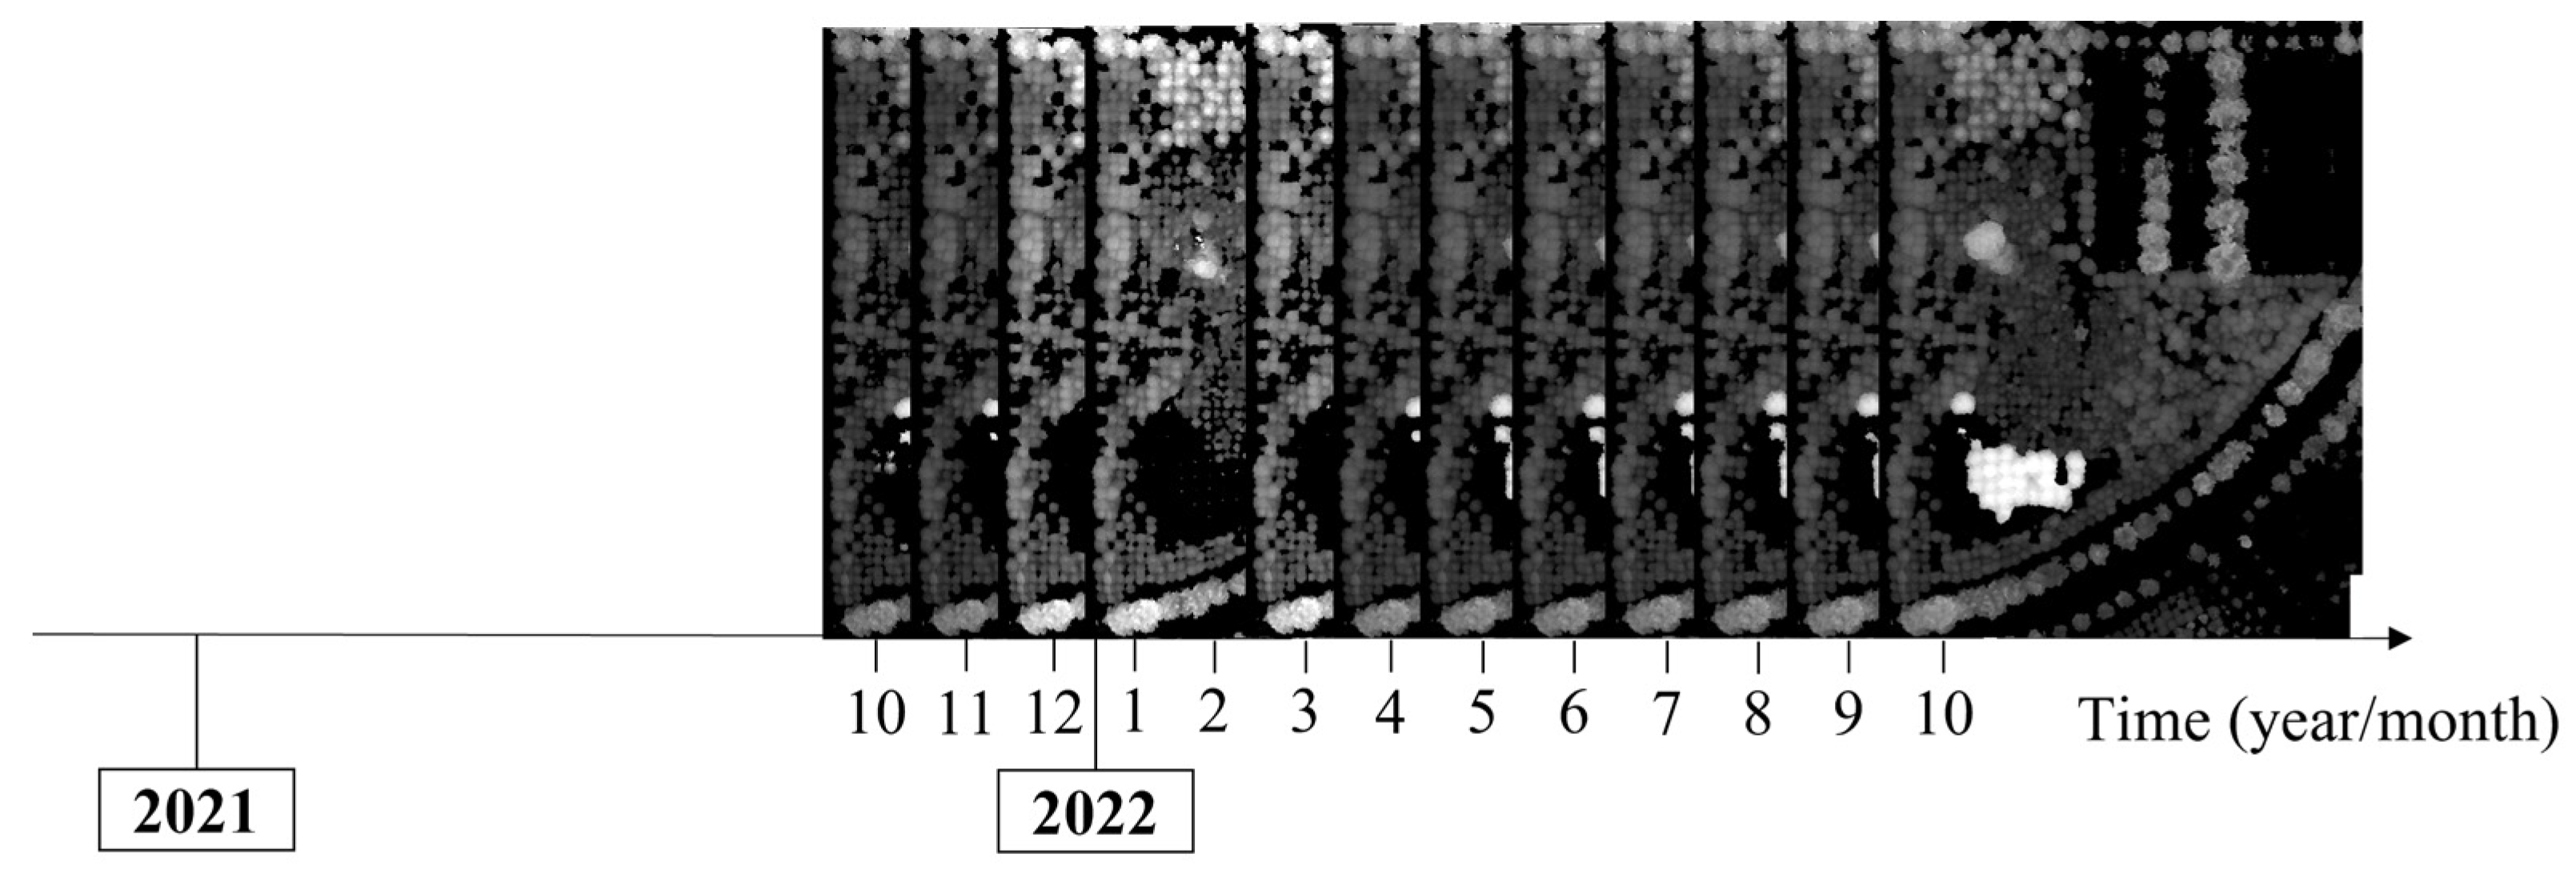
The CHM data obtained in different months used for tree height growth estimation is shown in Figure 7. The data used to examine the change in the height growth of trees at the annual continuous monthly scale were primarily obtained between October 2021 and October 2022. Due to the impact of the COVID-19 epidemic, no data were acquired in February 2022. Hence, the data acquired between January 2022 and March 2022 represent the height growth estimates for only two months.
The CHM data of all months shown in Figure 7 were processed using the aforementioned method, and then the tree heights of the corresponding months were calculated. Based on the tree height estimation results of other months, the growth of the tree height during different months was obtained using the method of the difference between the tree height in the next month and that in the previous month (Table 4).
In the case of the monthly height growth estimations of the trees without considering the species, the most significant growth changes occurred in May (14.26 cm) and June (14.67 cm), which accounted for 63.17% of the annual growth (Table 4). However, the growth change between September and February was relatively small (estimated at 3.84 cm), which accounted for only 8.25% of the annual growth. The results indicated that the growing season of subtropical trees was between March and August (accounted for 91.75% of the annual growth). The non-growth season of the trees was between September and February (which accounted for only 8.25% of the annual growth).
The total monthly growth between October 2021 and October 2022 was 46.53 cm. On the other hand, the total annual growth within the same period of time calculated using the two CHMs was 45.37 cm. Thus, the difference was only 1.16 cm. The results show that the total growth of each month in a year was almost the same as the annual growth of the first and last two images. This implies that it is possible to undertake monthly tree height growth monitoring research based on UAV image data.
To further investigate the monthly tree height growth rules of different tree species, the monthly tree height growth of five tree species in the study area, namely Liriodendron chinense, Magnolia grandiflora, Ficus concinna, Osmanthus fragrans, and Cinnamomum camphora, were calculated (Table 5).
There was a certain difference in the total annual growth of the five different tree species (Table 5). Liriodendron chinense and Osmanthus fragrans species exhibited the highest (58.64 cm) and lowest (34.00 cm) annual growth, respectively. The difference between the annual growth of the two tree species was approximately 24.64 cm. In terms of the monthly growth variation, there were obvious differences among the different tree species. For example, the growth season of Liriodendron chinense trees was mainly between April and July, with a growth of 56.92 cm, which accounted for 97.08% of the annual growth. However, Ficus concinna trees were in a growth state every month throughout the year, with an estimated growth of 44.24 cm between May and August. This accounted for 77.09% of the annual growth. Although there were differences in the total annual growth and monthly height growth of different tree species, most tree species exhibited relatively high degrees of change in their height growth during May and June. This accounted for 69.85%, 72.81%, 75.43%, 47.12%, and 40.78% of the annual growth for Osmanthus fragrans, Magnolia grandiflora, Liriodendron chinense, Ficus concinna, and Cinnamomum camphora tree species, respectively.
3.5. Results of the Correction of Time Differences in Tree Height Changes
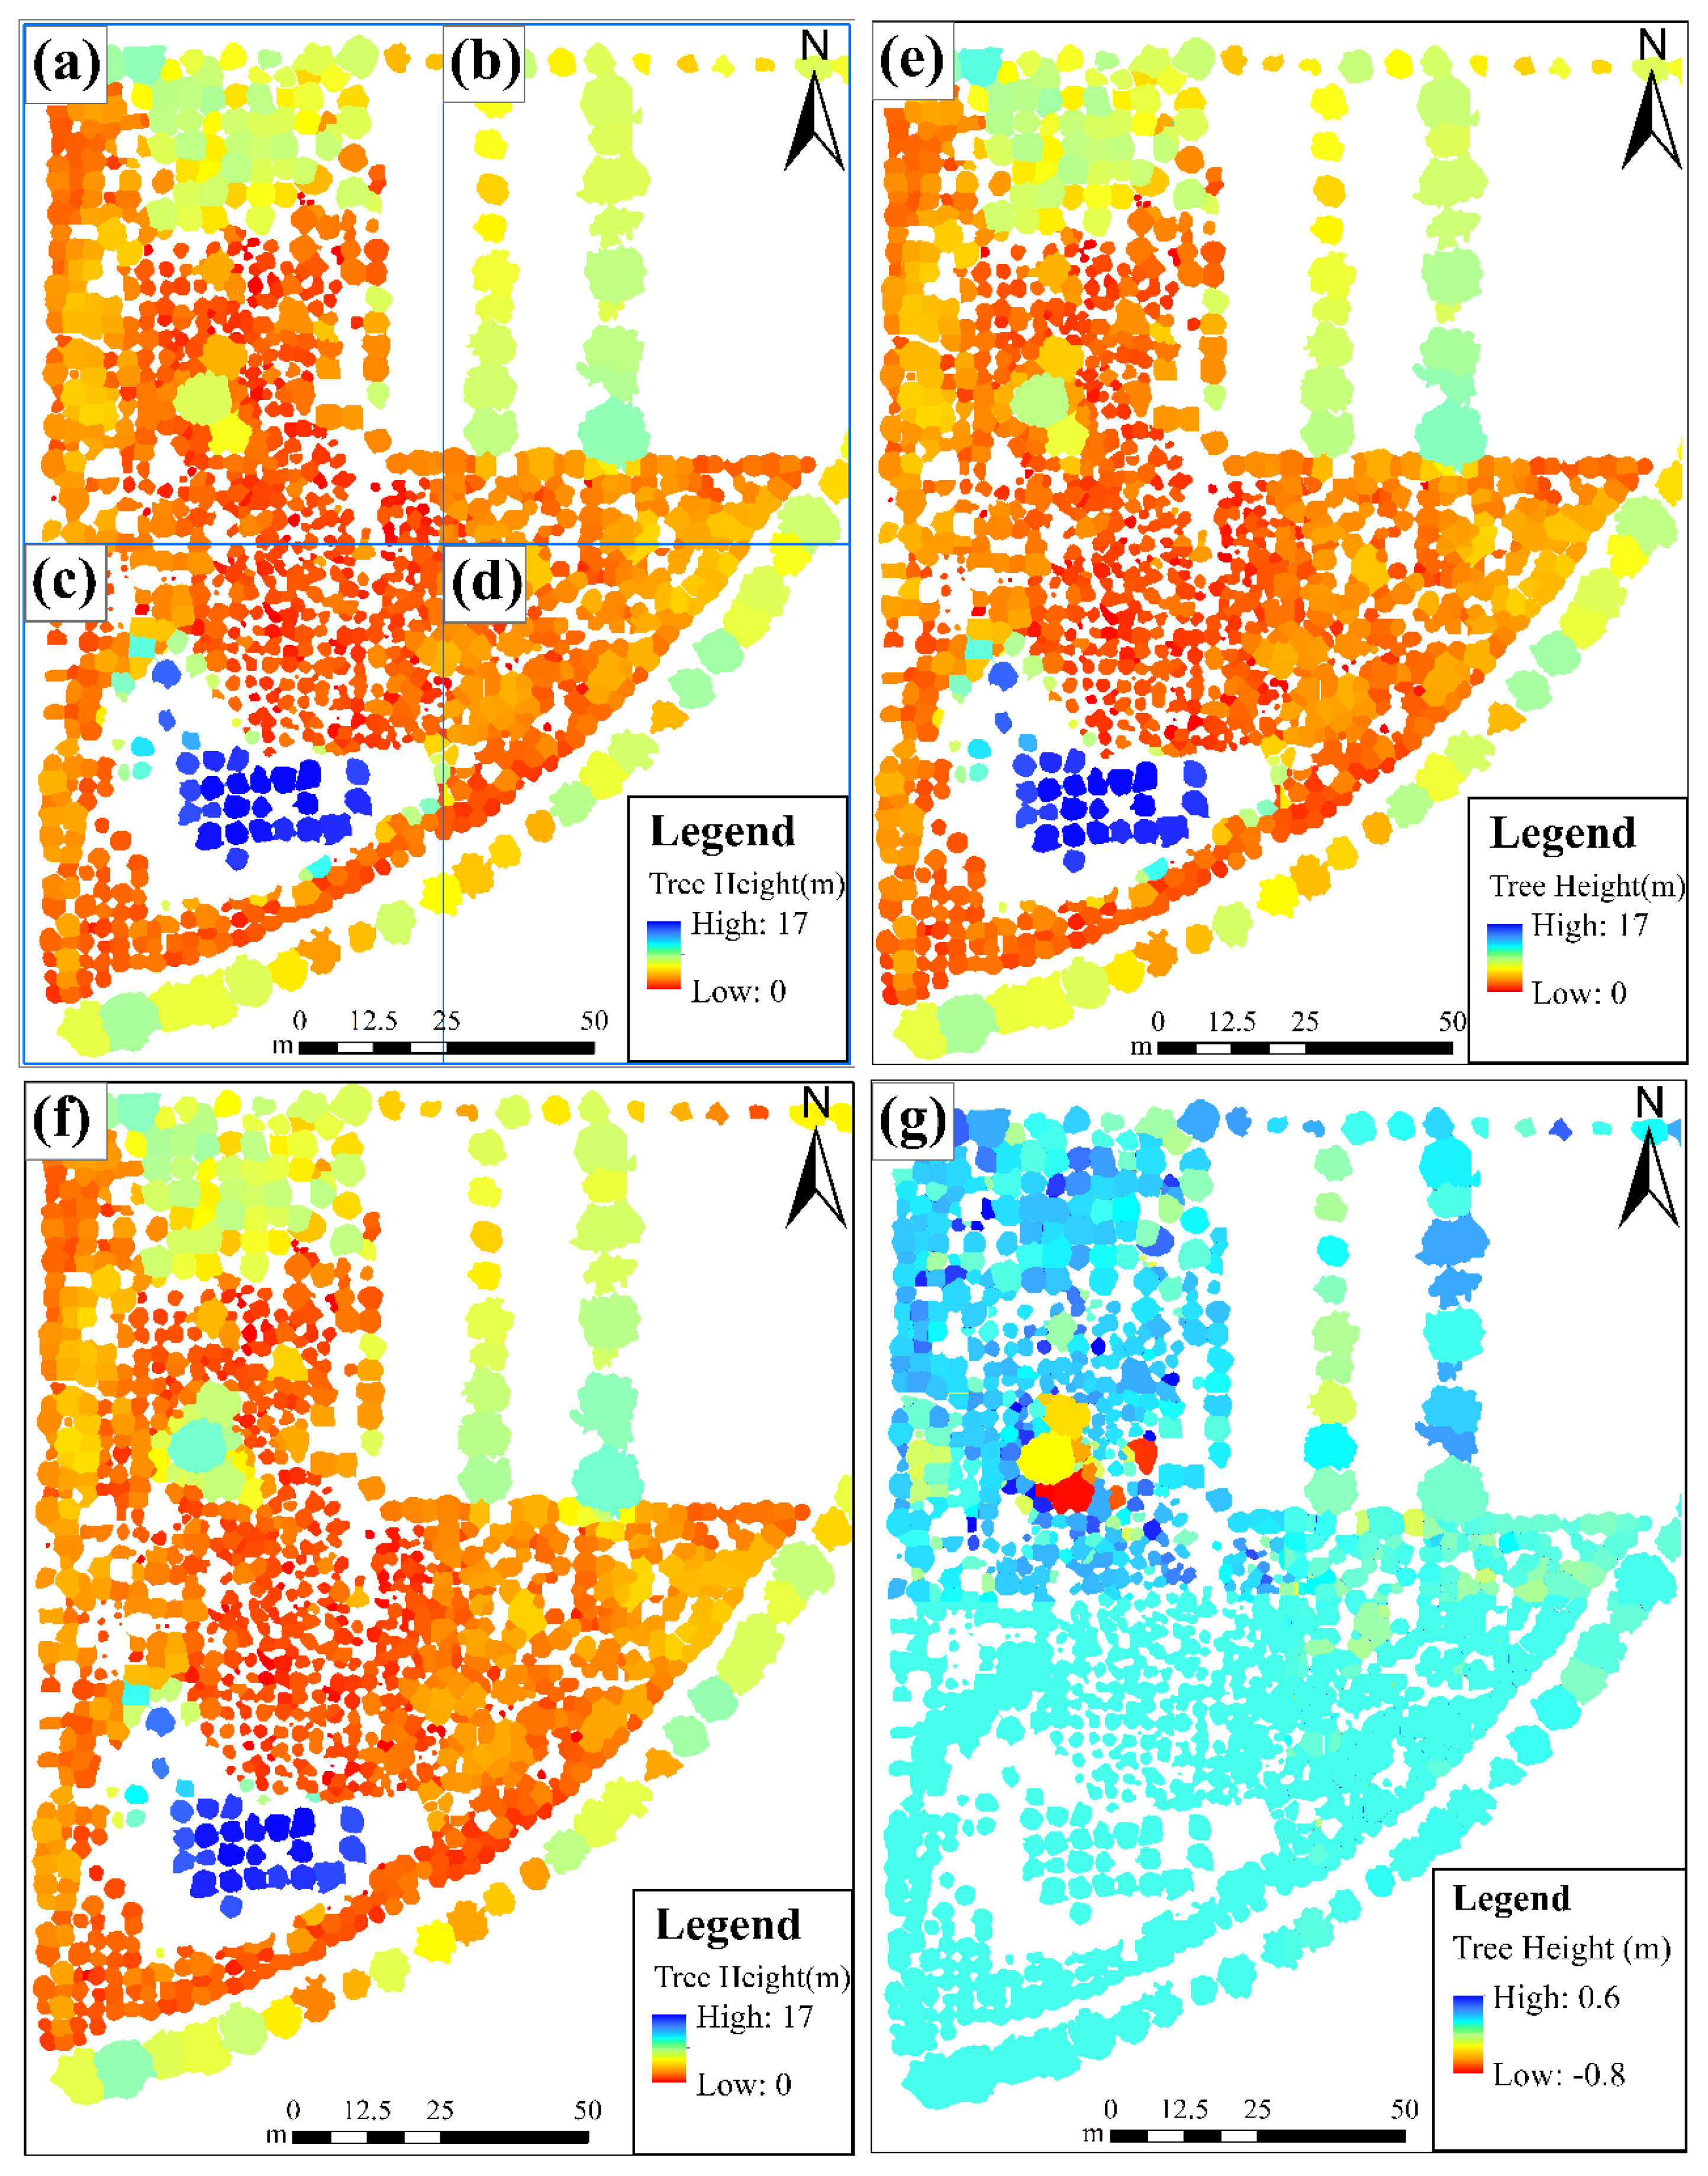
To verify the feasibility of the correction of time differences in the spatial distribution of the regional tree height changes based on monthly-scale height growth estimation results, the time differences between the four artificially divided tree height spatial distributions within the study area were corrected by utilizing the extraction results of monthly-scale height growth changes (Figure 8).
The difference between the tree height after applying time difference correction and the tree height estimates obtained from UAV stereo images was relatively small (Figure 8). During ITCD processing, the relatively tall trees with the crowns positioned next to shorter trees showed solid apical advantage. In such cases, the shorter trees were segmented incorrectly. As a result, certain obvious differences occurred in some areas (Figure 8f). In general, the difference in height was in the range of −0.8 m to 0.6 m, and the spatial distribution of tree height estimates after time difference correction exhibited little difference from those derived from UAV stereo images in October 2020.
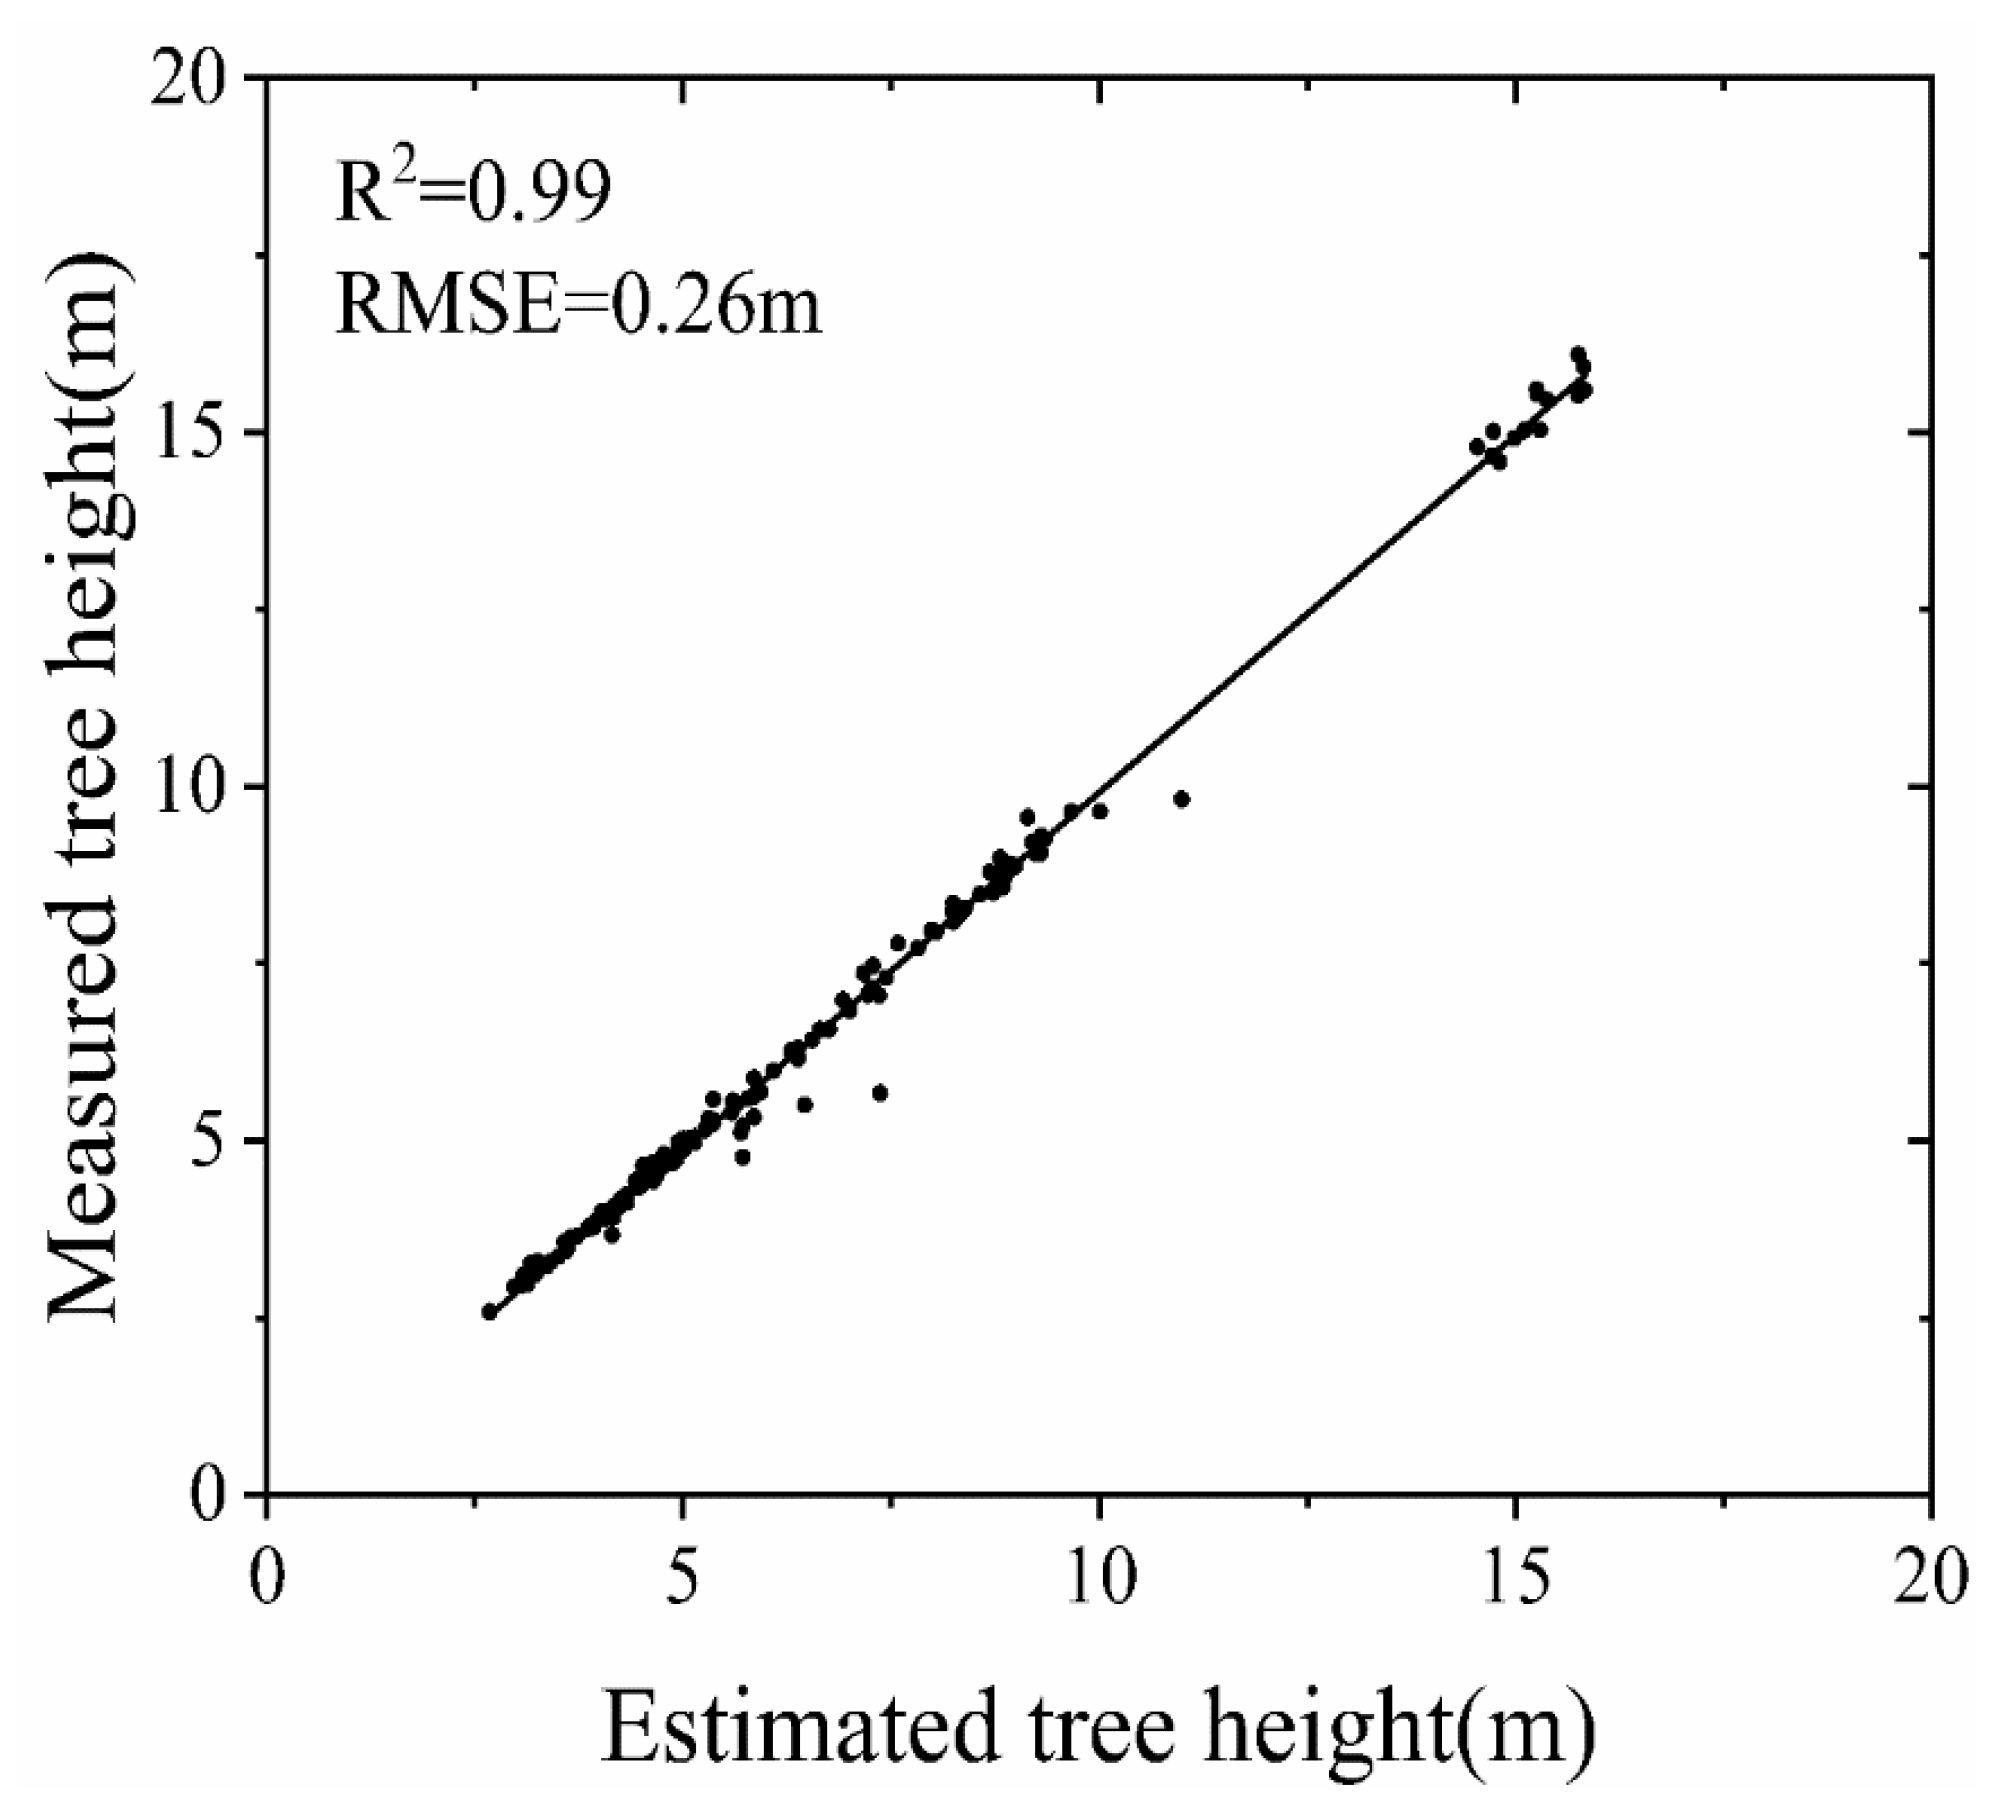
To quantitatively evaluate the time difference between the tree height estimates after time difference correction and the tree height derived from UAV stereo images, the correlation between the two was analyzed (Figure 9).
The tree height estimates after time difference correction were closely related to the tree height estimates obtained using UAV stereo images, with R2 = 0.99 and RMSE = 0.26 m (Figure 9). By estimating the tree height growth in each month of a consecutive year, it was possible to correct the tree height time difference at different times in the region. The corrected tree height result was highly accurate. With the use of satellite remote sensing, this method can provide a new approach to correct time differences in forest structure parameters within large areas. This method is expected to facilitate the inversion of forest structure parameters in a unified time in a region and improve the accuracy of dynamic monitoring results for forest structure parameters and the time-frequency of dynamic change monitoring.
4. Discussion
4.1. Analysis of the Differences in DEMs Derived from UAV LiDAR and Stereo Imagery
A DEM is not only capable of providing abundant terrain data, but it can also serve as the key basic data for producing CHMs. And the quality of DEM is closely related to the quantity and quality of ground points. Therefore, the ground points play a critical role in DEM construction. This study utilized UAV-LiDAR and UAV-RGB images to obtain understory DEMs. The results indicated that the elevation of DEMR derived from UAV-RGB imagery data was generally higher than that of DEML derived from UAV-LiDAR data. The ability of DEML to describe the details of the terrain underneath the forest is significantly superior to that of DEMR. This is mainly because that LiDAR is capable of penetrating the forest canopy and reaching the ground; therefore, UAV-LiDAR data is better suited to obtain more ground point data under the forest canopy. In contrast, UAV stereo images are only able to obtain point cloud data of the forest canopy surface and ground areas with relatively small canopy closure. Therefore, UAV-RGB images are not capable of obtaining accurate ground point data, and the DEM of areas with high canopy densities can only be produced through the interpolation of the surrounding ground points. As a result, the elevation value of DEMR is generally higher than the elevation value of DEML, and the description ability of understory terrain is weaker than that of DEML. Due to the relatively flat terrain of the study area and the relatively low forest canopy density in most locations within the area, it is possible to obtain more ground points and accurate DEM data by employing UAV-RGB data. Thus, the DEMs produced by each of the two datasets in this study are remarkably similar. The difference between the two datasets in obtaining DEM data may increase if there is an increase in canopy closure. When the canopy closure is large enough, LiDAR cannot also penetrate the forest canopy, and neither of the two data can obtain the enough ground points to produce accurate understory DEM data. Earlier similar studies have also reached similar conclusions [23,24,25,26]. For example, Tilly et al. [23] conducted a study in which they compared the accuracy of a DEM derived from UAV images and another one derived from LiDAR. The results indicated that the DEM derived from LiDAR is more accurate than the DEM derived from UAV images.
In addition to forest canopy density, terrain slope is one of the main factors affecting a DEM derived from ground point cloud interpolation. In the flat terrain area, a DEM produced by interpolating the surrounding ground point clouds is relatively accurate, even in cases where the forest canopy density is high. However, in cases where the terrain under the forest is uneven, and the slope is steep, the DEM interpolated with ground points may also be affected to some extent [27]. This is mainly because the ground points under the forest are relatively small, and the slope will increase the elevation interpolation error of ground points, which ultimately leads to inaccurate DEM interpolation results. Accordingly, the DEM data derived from UAV-RGB images is only accurate and reliable in areas with flat terrain or low forest canopy density. Since LiDAR images are also capable of penetrating the forest canopy in areas with a relatively high forest canopy density, the accuracy of the resulting DEM is also relatively accurate. Even in cases where the terrain structure of the stand is complex, there are significant undulations in the terrain, and the slope is steep [27]. However, under the conditions of flat terrain and a relatively low stand canopy density, the quality of DEMs derived from UAV-RGB imagery data is almost the same as that derived from UAV-LiDAR data. Accordingly, in future research on DEM production or forest parameter estimation based on DEMs, and in cases where the forest canopy density is relatively low and the terrain is relatively flat, it is possible to utilize UAV stereo images, which are also quite cost-efficient. However, in cases where the forest canopy density is relatively high and the terrain is complex, it is recommended to utilize UAV-LiDAR data as much as possible to ensure the quality of the ground points obtained.
4.2. Analysis of the Height Growth Rules of Different Tree Species
In recent years, the use of lightweight UAVs equipped with low-cost consumer cameras has gradually become a practical choice for conducting studies on forest tree structure parameters. In this study, the height of individual trees was estimated based on the stereo RGB images acquired by UAVs. It is evident that the correlation R2 between the estimated tree height and the measured tree height was as high as 0.99, and the RMSE equals 0.36 m. The results indicate that it is possible to precisely estimate the height of individual trees by employing stereo RGB images acquired through UAVs. These results are in accordance with the conclusions of previous related studies. For example, Karpina et al. [11] measured the tree height of 22 Scotch pine plantations using the point cloud data derived from stereo images obtained by utilizing a consumer camera mounted on a UAV, and the average accuracy of the results was 5 cm. Jonathan et al. [28] conducted a study in which they estimated the canopy height of boreal forest trees by employing stereo RGB images obtained by UAVs, and R2 and the RMSE of the estimated canopy height based on the UAVs were 0.97 and 0.7 m, respectively. Zarco-Tejada et al. [29] carried out an investigation in which they used a light UAV equipped with a low-cost consumer camera to measure the tree height, with R2 = 0.83 and RMSE = 0.35 m. Hernandez-Clemente et al. [30] measured the height of trees in southern Spain by utilizing UAV images, with R2 = 0.91 and RMSE = 0.71 m. Although the stereo RGB images acquired through UAV can precisely estimate the height of individual trees, there are some differences in the estimation results of deciduous and evergreen forests. Specifically, for deciduous forests, it is difficult to precisely estimate the height of individual trees in the deciduous period, while for evergreen forests, the estimated results are not affected. For example, in the study the Liriodendron chinense belongs to deciduous broad-leaved trees, with leaves falling in October and regrowing in March of the following year. Therefore, the tree height will be underestimated from October to March of the following year, resulting in a negative monthly growth of the tree height. To avoid the negative growth, it is assumed that the height of deciduous broad-leaved trees will remain unchanged during the defoliation period, which is consistent with the height of trees in the latest leafy month. For this reason, the tree height growth of Liriodendron chinense in each month from October to March of the following year is zero. In contrast, the other four tree species in the study are evergreen broad-leaved trees, so this situation will not happen, and the tree height of each month can be precisely estimated through the stereo RGB images. Therefore, in the future, when the stereo images acquired by UAV are used to estimate forest tree height, it is necessary to avoid data collection during the defoliation period to ensure the accuracy of tree height estimation.
Using UAV images, it is possible to obtain high-precision tree height estimates of individual trees and acquire cost-efficient and high-time-resolution image data. This may serve as an economical and feasible alternative for studying the monthly growth of trees. In this study, the monthly height growth of trees was extracted by employing high temporal frequency UAV stereo images. Without taking tree species into account, it is evident that the growth season of subtropical trees occurred between March and August (accounting for 91.75% of the annual growth). The non-growth season of trees occurred between September and February (accounting for 8.25% of the annual growth). However, the detailed statistics of the monthly height growth results of different tree species indicate certain differences in the total annual growth and monthly growth rules of tree heights among different tree species. For example, the results of the monthly height growth of Liriodendron chinense trees indicated that they began to grow gradually in April, and the height growth estimates reached their peak in May (24.75 cm) and June (19.48 cm). Moreover, the growth of Liriodendron chinense species decreased significantly from July and entered the slow growth period. The leaves fell in October, and the growth stagnated between November and March of the following year. The next cycle of growth began again in April. The monthly height growth pattern of Liriodendron chinense trees presented a general trend of “Slow-Fast-Slow”. This is consistent with the conclusions of previous related studies. For example, Ma et al. [31] showed that both hybrid and common Liriodendron chinense trees exhibited a “Slow-Fast-Slow” growth pattern in height growth. It was pointed out that Liriodendron chinense trees began to sprout in March, expanding their leaves in April. Then, they entered a rapid growth period, and their leaves fell in October. They remained dormant between November of that year and March of the following year. This result is consistent with the monthly growth change monitoring results of tree height estimates obtained by employing UAV stereo imagery in this study. The results indicated that it is possible to monitor the monthly growth changes in height growth with a high degree of accuracy by utilizing UAV stereo image data. Similarly, the monthly height growth results of different tree species indicated that Magnolia grandiflora trees also began to grow in April, reached their peak in May at 23.45 cm, and then slowed down. The height growth of Magnolia grandiflora trees in June, August, October, and December was 12.24 cm, 4.85 cm, 1.58 cm, and 3.68 cm, respectively. The growth in the rest of the months was slow, and the total annual growth was 49.02 cm. Liu et al. [32] studied the growth patterns of Magnolia grandiflora trees through observation. They found that the annual height growth of Magnolia grandiflora trees with a forest age of less than 12 years was between 57 cm and 63 cm. Additionally, the annual height growth of Magnolia grandiflora trees with a forest age of more than 12 years was approximately 46 cm on average. This is consistent with the results of the total annual growth extracted based on the monthly height growth changes in this study. In this study, the Magnolia grandiflora tree was about 14 years old, and the total annual growth was 49.02 cm. The research results also further indicate that monthly and annual height growth monitoring can be carried out by utilizing UAV stereo images.
The extraction of forest structure parameters from growth changes has been the subject of a large number of previous studies [1,12,15,33,34]. For example, Guerra-Hernández et al. [12] used point cloud data derived from multi-temporal UAV stereo images to estimate the growth of pine plantations between 2015 and 2017. The height growth and biomass were 0.45 m ± 0.12 m and 198.7 ± 93.9 kg, respectively. Dempewolf et al. [15] measured the tree height growth of different tree species in a temperate mixed forest during a growing season by employing a UAV equipped with a consumer RGB camera. The results showed that during a growing season (three months), the height growth of Norway spruce, Scots pine, silver birch, and European beech trees were 68 cm, 93 cm, 106 cm, and 26 cm, respectively. This shows that an accurate growth change estimation of individual tree structure parameters in plantations can be accomplished based on UAV images. However, the time span of previous studies mainly was several years or longer [35,36]. At the same time, fewer studies were conducted on estimating the growth changes of individual tree structural parameters in a monthly or a shorter time span [11,15]. This is largely due to the high cost of the previous data acquisition methods, which are unsuitable for short-term span growth change research. In contrast, the previously conducted research involved mostly temperate pine species with slow height growth, and the monthly growth change was not obvious enough. Therefore, it was difficult to monitor growth changes in a short time span. In this study, the monthly individual height growth changes of different subtropical tree species were derived from the high time-frequency UAV-RGB data, further advancing the time span of growth change monitoring from the annual scale to the monthly scale. As compared to the annual growth changes, by using monthly or shorter time scales, it is possible to quantify the growth changes of tree heights with different time differences, and to correct the effect of time differences between different time phase datasets on the results. Additionally, it allows for an improvement in the accuracy and time frequency of the dynamic monitoring results of regional forest structure parameters.
4.3. Time Difference Correction in Tree Height Estimation
High-precision inversion of forest structure parameters is the basis of dynamic monitoring. However, the time difference between regional mosaic images is an important factor that affects the accuracy of the dynamic monitoring results of forest structure parameters in large regions. The coverage area of a single satellite image is limited. For example, the width of a Landsat−8 image is 185 km, and the width of a Sentinel−2 image is relatively large, at 290 km. Therefore, in cases where the study area is large, multiple images are usually required to be spliced. The spliced images may come from other months. However, the time difference between the images leads to certain time differences in the estimation of forest structure parameters derived from image inversion, which can take several months. As a result, the annual dynamic change monitoring results in some regions are inaccurate, and the annual change may only represent the change of a few months rather than the change of an entire year. Similarly, the time difference between the spliced images may also limit the time frequency of the dynamic change monitoring results to the annual scale, which is difficult to achieve at the monthly scale. Therefore, the method for correcting the effect on the estimation of forest structure parameters is caused by the time difference of mosaic images. Accordingly, to estimate the spatial distribution of forest structure parameters with a uniform time in the region is the key to improving the accuracy and time frequency of dynamic change monitoring results of forest structure parameters. The extraction of short-time span growth change estimates of individual forest tree structure parameters based on high time-frequency images acquired by UAV provides a new possibility to correct the effect of time differences in mosaic images on the estimation of regional forest structure parameters.
Based on the monthly growth changes of individual tree height estimates extracted between October 2021 and October 2022, the correction of time differences in the spatial distributions of regional tree height changes in 2020 was simulated in the study. The results showed that the accuracy of the tree height estimates corrected by the monthly-scale growth time difference and the tree height obtained from UAV stereo images were relatively low, with R2 of 0.99 and an RMSE of 0.26 m. The results demonstrated that the extraction results of monthly-scale height growth estimates of trees could be used to correct the regional tree height time difference. In addition, it also revealed that the resulting tree height estimated after the time difference correction is closely related to the actual tree height and that it may be possible to replace the actual tree height with it to a certain extent. Therefore, the tree height of any given month can be predicted by obtaining the actual height growth of each month within a year. The tree height of different months can also be corrected to the same month. Researchers can use this method to conduct dynamic monitoring of forest structural parameters at large scales. This makes it possible to eliminate the issue of inaccurate dynamic monitoring results of forest structure parameters at a large regional scale in time series. The monitoring results of dynamic changes of forest structure parameters at a large regional scale in the future can be shortened to a monthly scale.
5. Conclusions
In this study, a UAV was used to acquire LiDAR data and stereo images. Then the DEMs were extracted and compared, and the tree height and monthly height growth changes of the trees were extracted from the monthly-scale stereo images. Finally, the correction of time differences in regional tree height estimates was simulated based on the monthly-scale height growth estimates. The main conclusions are as follows:
- (1)
- In cases where the stand canopy density was low, more accurate DEMs could be obtained by employing UAV stereo images. The difference in accuracy between the DEM derived from UAV stereo images and the DEM derived from UAV LiDAR was small. However, the accuracy of the DEM derived from UAV LiDAR image data was still superior to the DEM generated by utilizing UAV stereo images in areas with a high canopy density. The DEM derived from UAV-RGB stereo images was closely related to the measured ground elevation data, with R2 = 0.97 and RMSE = 0.21 m. Meanwhile, the DEM derived from UAV RGB stereo images was closely related to the DEM derived from UAV LiDAR data, with R2 = 0.96 and RMSE = 0.26 m.
- (2)
- The tree height can be accurately estimated by employing UAV stereo images, with R2 of 0.99 and an RMSE of 0.36 m. The estimation accuracy of the Cinnamomum camphora tree species was the highest, with R2 = 0.95 and RMSE = 0.34 m. The estimation accuracy of Ficus concinna tree species was relatively low, with R2 = 0.91 and RMSE = 0.47 m.
- (3)
- The monthly height growth changes can be derived from the monthly-scale UAV stereo images, with May and June exhibiting relatively significant changes in tree height growth. However, there were certain differences in the accuracy of the total annual growth estimates and the monthly growth changes of different tree species. When the tree species were not taken into account, the total growth of each month throughout the year was 46.53 cm. The most significant changes in the height growth of the trees occurred in May (14.26 cm) and June (14.67 cm), accounting for 63.17% of the annual growth. When the tree species were considered, the resulting total annual height growth estimates of the different tree species were different. The Liriodendron chinense tree species exhibited the most significant annual growth of 58.64 cm. In comparison, the Osmanthus fragrans species exhibited the lowest annual growth change of 34.00 cm. In the estimation of the height growth of trees in each month, the difference between different tree species was also obtained. For example, the growing season of the Liriodendron chinense tree species occurred primarily between April and July, and the growth of tree height was 56.92 cm (which accounted for about 97.08% of the annual growth of tree height). In the case of the Ficus concinna tree species, the tree was in a constant state of growth during each month throughout the year. The growth became faster between May and August (44.24 cm), which accounted for 77.09% of the annual growth.
- (4)
- The correction of time differences in the regional tree height estimates can be accomplished based on the extraction results of monthly tree height growth estimates. The tree height corrected for monthly growth time differences was closely related to the tree height extracted from UAV stereo images, with R2 of 0.99 and an RMSE of 0.26 m.
The results indicate that it is possible to estimate subtropical tree height and its monthly growth changes based on UAV stereo image data and that the monthly tree height growth change results can serve as basic data for the correction of time differences in regional tree height estimates. However, because the research area was relatively small and of a mixed plantation, it is difficult to directly apply the research results to the correction of time differences in regional tree height estimates. Similarly, only the monthly growth change in tree height estimates from October 2021 to October 2022 was extracted, and the difference in monthly changes in the height of the tree in different years and climate conditions was not considered. Therefore, the monthly changes of forest structure parameters in larger regions, more regions, and longer time series should be extracted in the future in order to provide basic data for the correction of time differences in forest structure parameters in larger regions.
Supplementary Materials
The following supporting information can be downloaded at: https://www.mdpi.com/article/10.3390/rs15020326/s1, Figure S1: DEM data and Digital Orthophoto Map: (a) DEMR derived from UAV stereo images; (b) DEML derived from UAV-LiDAR data; (c) a spatial distribution map of the elevation difference between DEMR and DEML; and (d) a Digital Orthophoto Map, Figure S2: the elevation difference between DEMR and DEML: (a) Elevation difference between DEMR and DEML on cross-section (a); (b) Elevation difference between DEMR and DEML on cross-section (b).
Author Contributions
Conceptualization, X.T. and H.Y.; data curation, X.T., H.Y. and Y.L.; formal analysis, X.T. and H.Y.; methodology, X.T., H.Y. and Q.Y.; supervision, J.C.; validation, Q.Y.; writing—original draft preparation, X.T. and H.Y.; writing—review and editing, X.T. and H.Y. All authors have read and agreed to the published version of the manuscript.
Funding
This study was supported by grants from the National Natural Science Foundation of China (42261063, 41901370), Guangxi Natural Science Foundation (2020GXNSFBA297096), Guangxi Science and Technology Base and Talent Project (GuikeAD19245032), and the BaGuiScholars program of the provincial government of Guangxi (Hongchang He).
Institutional Review Board Statement
Not applicable.
Informed Consent Statement
Not applicable.
Data Availability Statement
Not applicable.
Acknowledgments
The authors sincerely thank the editors and the anonymous reviewers for their constructive feedback.
Conflicts of Interest
The authors declare no conflict of interest.
References
- Yu, X.; Hyyppä, J.; Kukko, A.; Maltamo, M.; Kaartinen, H. Change detection techniques for canopy height growth measurements using airborne laser scanner data. Photogramm. Eng. Remote Sens. 2006, 72, 1339–1348. [Google Scholar] [CrossRef]
- Lin, Y.; Hyyppä, J.; Kukko, A.; Jaakkola, A.; Kaartinen, H. Tree height growth measurement with single-scan airborne, static terrestrial and mobile laser scanning. Sensors 2012, 12, 12798–12813. [Google Scholar] [CrossRef] [Green Version]
- Puliti, S.; Gobakken, T.; Ørka, H.O.; Næsset, E. Assessing 3D point clouds from aerial photographs for species-specific forest inventories. Scand. J. For. Res. 2017, 32, 68–79. [Google Scholar] [CrossRef]
- Tanhuanpää, T.; Saarinen, N.; Kankare, V.; Nurminen, K.; Vastaranta, M.; Honkavaara, E.; Karjalainen, M.; Yu, X.; Holopainen, M.; Hyyppä, J. Evaluating the performance of high-altitude aerial image-based digital surface models in detecting individual tree crowns in mature boreal forests. Forests 2016, 7, 143. [Google Scholar] [CrossRef]
- Holopainen, M.; Vastaranta, M.; Karjalainen, M.; Karila, K.; Kaasalainen, S.; Honkavaara, E.; Hyyppä, J. Forest inventory attribute estimation using airborne laser scanning, aerial stereoimagery, radargrammetry and interferometry-Finnish experiences of the 3D techniques. ISPRS Ann. Photogramm. Remote Sens. Spat. Inf. Sci. 2015, 2, 63–69. [Google Scholar]
- White, J.C.; Wulder, M.A.; Vastaranta, M.; Coops, N.C.; Pitt, D.; Woods, M. The utility of image-based point clouds for forest inventory: A comparison with airborne laser scanning. Forests 2013, 4, 518–536. [Google Scholar] [CrossRef] [Green Version]
- Duarte, A.; Acevedo-Muñoz, L.; Gonçalves, C.I.; Mota, L.; Sarmento, A.; Silva, M.; Fabres, S.; Borralho, N.; Valente, C. Detection of longhorned borer attack and assessment in eucalyptus plantations using UAV imagery. Remote Sens. 2020, 12, 3153. [Google Scholar] [CrossRef]
- Iglhaut, J.; Cabo, C.; Puliti, S.; Piermattei, L.; O’Connor, J.; Rosette, J. Structure from motion photogrammetry in forestry: A review. Curr. For. Rep. 2019, 5, 155–168. [Google Scholar] [CrossRef] [Green Version]
- Thiel, C.; Schmullius, C. Comparison of UAV photograph-based and airborne lidar-based point clouds over forest from a forestry application perspective. Int. J. Remote Sens. 2017, 38, 2411–2426. [Google Scholar] [CrossRef]
- Torresan, C.; Berton, A.; Carotenuto, F.; Di Gennaro, S.F.; Gioli, B.; Matese, A.; Miglietta, F.; Vagnoli, C.; Zaldei, A.; Wallace, L. Forestry applications of UAVs in Europe: A review. Int. J. Remote Sens. 2017, 38, 2427–2447. [Google Scholar] [CrossRef]
- Karpina, M.; Jarząbek-Rychard, M.; Tymków, P.; Borkowski, A. UAV-based automatic tree growth measurement for biomass estimation. Int. Arch. Photogramm. Remote Sens. Spat. Inf. Sci. 2016, 8, 685–688. [Google Scholar] [CrossRef]
- Guerra-Hernández, J.; González-Ferreiro, E.; Monleón, V.; Faias, S.; Tomé, M.; Díaz-Varela, R. Use of Multi-Temporal UAV-Derived Imagery for Estimating Individual Tree Growth in Pinus pinea Stands. Forests 2017, 8, 300. [Google Scholar] [CrossRef]
- Guerra-Hernández, J.; Cosenza, D.N.; Cardil, A.; Silva, C.A.; Botequim, B.; Soares, P.; Silva, M.; González-Ferreiro, E.; Díaz-Varela, R.A. Predicting growing stock volume of eucalyptus plantations using 3-D point clouds derived from UAV imagery and ALS data. Forests 2019, 10, 905. [Google Scholar] [CrossRef] [Green Version]
- Pádua, L.; Hruška, J.; Bessa, J.; Adão, T.; Martins, L.M.; Gonçalves, J.A.; Peres, E.; Sousa, A.M.; Castro, J.P.; Sousa, J.J. Multi-temporal analysis of forestry and coastal environments using UASs. Remote Sens. 2017, 10, 24. [Google Scholar] [CrossRef] [Green Version]
- Dempewolf, J.; Nagol, J.; Hein, S.; Thiel, C.; Zimmermann, R. Measurement of Within-Season Tree Height Growth in a Mixed Forest Stand Using UAV Imagery. Forests 2017, 8, 231. [Google Scholar] [CrossRef] [Green Version]
- Zhao, X.; Guo, Q.; Su, Y.; Xue, B. Improved progressive TIN densification filtering algorithm for airborne LiDAR data in forested areas. ISPRS J. Photogramm. Remote Sens. 2016, 117, 79–91. [Google Scholar] [CrossRef] [Green Version]
- Chen, Q.; Baldocchi, D.; Gong, P.; Kelly, M. Isolating Individual Trees in a Savanna Woodland using Small Footprint LIDAR data. Photogramm. Eng. Remote Sens. 2006, 72, 923–932. [Google Scholar] [CrossRef] [Green Version]
- Panagiotidis, D.; Abdollahnejad, A.; Surový, P.; Chiteculo, V. Determining tree height and crown diameter from high-resolution UAV imagery. Int. J. Remote Sens. 2017, 38, 2392–2410. [Google Scholar] [CrossRef]
- Miraki, M.; Sohrabi, H.; Fatehi, P.; Kneubuehler, M. Individual tree crown delineation from high-resolution UAV images in broadleaf forest. Ecol. Inform. 2021, 61, 101207. [Google Scholar] [CrossRef]
- Nuijten, R.J.; Coops, N.C.; Goodbody, T.R.; Pelletier, G. Examining the multi-seasonal consistency of individual tree segmentation on deciduous stands using digital aerial photogrammetry (DAP) and unmanned aerial systems (UAS). Remote Sens. 2019, 11, 739. [Google Scholar] [CrossRef] [Green Version]
- Goldbergs, G.; Maier, S.W.; Levick, S.R.; Edwards, A. Efficiency of individual tree detection approaches based on light-weight and low-cost UAS imagery in Australian Savannas. Remote Sens. 2018, 10, 161. [Google Scholar] [CrossRef]
- Yin, D.; Wang, L. How to assess the accuracy of the individual tree-based forest inventory derived from remotely sensed data: A review. Int. J. Remote Sens. 2016, 37, 4521–4553. [Google Scholar] [CrossRef]
- Tilly, N.; Kelterbaum, D.; Zeese, R. Geomorphological Mapping with Terrestrial Laser Scanning and Uav-Based Imaging. ISPRS Int. Arch. Photogramm. Remote Sens. Spat. Inf. Sci. 2016, 41, 591–597. [Google Scholar] [CrossRef] [Green Version]
- Elsner, P.; Dornbusch, U.; Thomas, I.; Amos, D.; Bovington, J.; Horn, D. Coincident beach surveys using UAS, vehicle mounted and airborne laser scanner: Point cloud inter-comparison and effects of surface type heterogeneity on elevation accuracies. Remote Sens. Environ. 2018, 208, 15–26. [Google Scholar] [CrossRef]
- Ouédraogo, M.M.; Degré, A.; Debouche, C.; Lisein, J. The evaluation of unmanned aerial system-based photogrammetry and terrestrial laser scanning to generate DEMs of agricultural watersheds. Geomorphology 2014, 214, 339–355. [Google Scholar] [CrossRef]
- Wilkinson, M.; Jones, R.; Woods, C.; Gilment, S.; McCaffrey, K.; Kokkalas, S.; Long, J. A comparison of terrestrial laser scanning and structure-from-motion photogrammetry as methods for digital outcrop acquisition. Geosphere 2016, 12, 1865–1880. [Google Scholar] [CrossRef] [Green Version]
- Nikolakopoulos, K.G.; Antonakakis, A.; Kyriou, A.; Koukouvelas, I.; Stefanopoulos, P. Comparison of terrestrial laser scanning and structure-from-motion photogrammetry for steep slope mapping. In Proceedings of the Earth Resources and Environmental Remote Sensing/GIS Applications IX, Berlin, Germany, 9 October 2018; pp. 95–105. [Google Scholar]
- Jonathan, L.; Marc, P.D.; Stéphanie, B.; Philippe, L. A Photogrammetric Workflow for the Creation of a Forest Canopy Height Model from Small Unmanned Aerial System Imagery. Forests 2013, 4, 922–944. [Google Scholar]
- Zarco-Tejada, P.J.; Diaz-Varela, R.; Angileri, V.; Loudjani, P. Tree height quantification using very high resolution imagery acquired from an unmanned aerial vehicle (UAV) and automatic 3D photo-reconstruction methods. Eur. J. Agron. 2014, 55, 89–99. [Google Scholar] [CrossRef]
- Hernández-Clemente, R.; Navarro-Cerrillo, R.M.; Romero Ramírez, F.J.; Hornero, A.; Zarco-Tejada, P.J. A Novel Methodology to Estimate Single-Tree Biophysical Parameters from 3D Digital Imagery Compared to Aerial Laser Scanner Data. Remote Sens. 2014, 6, 11627–11648. [Google Scholar] [CrossRef] [Green Version]
- Ma, L.; Liu, Y.; Zhu, W.; Heng, B.; Lin, X. Performance of Hybrid Chinese Tulip Tree in HanZhong prefecture. Shaanxi For. Sci. Technol. 2022, 50, 87–89. (In Chinese) [Google Scholar]
- Liu, Y.; Yang, Q.; Zhou, L.; Zhu, Y. The growth law of Magnolia magnolia. Pract. For. Technol. 2012, 54–55. (In Chinese) [Google Scholar] [CrossRef]
- St-Onge, B.; Vepakomma, U. Assessing forest gap dynamics and growth using multi-temporal laser-scanner data. Power 2004, 140, 173–178. [Google Scholar]
- Yu, X.; Hyyppä, J.; Kaartinen, H.; Maltamo, M. Automatic detection of harvested trees and determination of forest growth using airborne laser scanning. Remote Sens. Environ. 2004, 90, 451–462. [Google Scholar] [CrossRef]
- Véga, C.; St-Onge, B. Height growth reconstruction of a boreal forest canopy over a period of 58 years using a combination of photogrammetric and lidar models. Remote Sens. Environ. 2008, 112, 1784–1794. [Google Scholar] [CrossRef]
- Tian, J.; Schneider, T.; Straub, C.; Kugler, F.; Reinartz, P. Exploring digital surface models from nine different sensors for forest monitoring and change detection. Remote Sens. 2017, 9, 287. [Google Scholar] [CrossRef]
Figure 1.
Spatial distribution map of the study area and sampling points.

Figure 2.
Flowchart of the overall work.

Figure 3.
Simulation diagram of the time difference correction of tree height estimates.

Figure 4.
Correlation graph: (a) correlation between the field-measured elevation and the corresponding elevation values of DEMR and DEML; (b) correlation between the elevation values of DEMR and DEML.
Figure 4.
Correlation graph: (a) correlation between the field-measured elevation and the corresponding elevation values of DEMR and DEML; (b) correlation between the elevation values of DEMR and DEML.

Figure 5.
The DSM, DEM, CHM, and ITCD results: (a) DEM derived from UAV-RGB data; (b) DSM derived from UAV-RGB data; (c) CHM derived from UAV-RGB data; (d) ITCD results based on the watershed algorithm.
Figure 5.
The DSM, DEM, CHM, and ITCD results: (a) DEM derived from UAV-RGB data; (b) DSM derived from UAV-RGB data; (c) CHM derived from UAV-RGB data; (d) ITCD results based on the watershed algorithm.

Figure 6.
Tree height extraction results for different tree species.

Figure 7.
The CHM data used for tree height growth extraction.

Figure 8.
Results of the correction of time differences in regional tree height changes: (a) Tree height estimates from June 2020; (b) Tree height estimates from July 2020; (c) Tree height estimates from October 2020; (d) Tree height estimates from September 2020; (e) Tree height estimates in October 2020 after time difference correction; (f) Tree heights in October 2020 derived from UAV stereo images; and (g) Difference between the tree height estimates after time difference correction in addition to the tree height derived from UAV stereo images in October 2020.

Figure 9.
Correlation between the tree height after time difference correction and the tree height derived from UAV stereo images.
Figure 9.
Correlation between the tree height after time difference correction and the tree height derived from UAV stereo images.


Table 1.
The specific statistical results of the field survey data.
| Tree Species | Quantity (Trees) | Maximum Tree Height (m) | Minimum Tree Height (m) | Average Tree Height (m) |
|---|---|---|---|---|
| Osmanthus fragrans | 85 | 5.9 | 2.6 | 4.2 |
| Liriodendron chinense | 21 | 17.0 | 7.8 | 14.7 |
| Ficus concinna | 24 | 10.5 | 5.3 | 8.1 |
| Cinnamomum camphora | 8 | 10.3 | 7.6 | 8.8 |
| Magnolia grandiflora | 37 | 9.8 | 6.3 | 8.4 |
Table 2.
Flight Parameters for UAV LiDAR and stereo image acquisition.
| DJI Phantom 4 RTK | DJI Matrice 300 RTK | ||
|---|---|---|---|
| Flight Patterns Sensor type | Flying in five directions RGB | Flight Patterns Sensor type | Aerial Photography LiDAR |
| RTK Service Type | Network RTK | RTK Service Type | Network RTK |
| Coordinate system | WGS84 | Coordinate system | WGS84 |
| Flight altitude | 60 m | Flight altitude | 80 m |
| Flight speed | 7.9 m/s | Flight speed | 10 m/s |
| Side overlaps | 70% | Side overlaps | 70% |
| Forward overlaps | 80% | Return wave mode | Double echo |
| Photo scale | 3:2 | Sample frequency | 240 KHZ |
| White Balance | Sunny | Scan Mode | Repeat scan |
Table 3.
Time information for UAV stereo image data acquisition. Orange represents the image acquisition time.
Table 3.
Time information for UAV stereo image data acquisition. Orange represents the image acquisition time.
| Time (Year/Month) | 1 | 2 | 3 | 4 | 5 | 6 | 7 | 8 | 9 | 10 | 11 | 12 |
|---|---|---|---|---|---|---|---|---|---|---|---|---|
| 2020 | ||||||||||||
| 2021 | ||||||||||||
| 2022 |
Table 4.
Results of tree height growth in different months.
| Time (Year) | Month | Tree Height Growth (cm) |
|---|---|---|
| 2021 | October | 1.06 |
| November | 0.16 | |
| December | 2.27 | |
| 2022 | January and February | 0.17 |
| March | 3.69 | |
| April | 3.91 | |
| May | 14.26 | |
| June | 14.67 | |
| July | 1.82 | |
| August | 4.34 | |
| September | 0.18 | |
| Sum of tree height growth in each month from October 2021 to October 2022 | - | 46.53 |
| Sum of tree height growth calculated based on two imagery periods in October 2021 and October 2022 | - | 45.37 |
Table 5.
The statistics results of the monthly tree height growth of different tree species.
| Time/Tree Species | Liriodendron chinense (cm) | Magnolia grandiflora (cm) | Ficus concinna (cm) | Osmanthus fragrans (cm) | Cinnamomum camphora (cm) |
|---|---|---|---|---|---|
| October | 0.00 | 1.58 | 2.49 | 1.08 | 8.99 |
| November | 0.00 | 0.11 | 0.72 | 0.45 | 1.45 |
| December | 0.00 | 3.68 | 2.98 | 0.54 | 5.37 |
| January and February | 0.00 | 0.19 | 0.85 | 0.64 | 0.07 |
| March | 0.00 | 0.00 | 2.13 | 6.03 | 1.18 |
| April | 6.50 | 2.25 | 2.57 | 0.35 | 3.70 |
| May | 24.75 | 23.45 | 10.16 | 9.51 | 8.51 |
| June | 19.48 | 12.24 | 14.01 | 14.24 | 14.27 |
| July | 6.20 | 0.66 | 1.47 | 0.00 | 1.95 |
| August | 0.00 | 4.85 | 13.90 | 1.15 | 10.36 |
| September | 1.72 | 0.00 | 0.03 | 0.01 | 0.00 |
| Sum of monthly average growth | 58.64 | 49.02 | 51.29 | 34.00 | 55.86 |
Disclaimer/Publisher’s Note: The statements, opinions and data contained in all publications are solely those of the individual author(s) and contributor(s) and not of MDPI and/or the editor(s). MDPI and/or the editor(s) disclaim responsibility for any injury to people or property resulting from any ideas, methods, instructions or products referred to in the content. |
© 2023 by the authors. Licensee MDPI, Basel, Switzerland. This article is an open access article distributed under the terms and conditions of the Creative Commons Attribution (CC BY) license (https://creativecommons.org/licenses/by/4.0/).
Share and Cite
MDPI and ACS Style
Tang, X.; You, H.; Liu, Y.; You, Q.; Chen, J. Monitoring of Monthly Height Growth of Individual Trees in a Subtropical Mixed Plantation Using UAV Data. Remote Sens. 2023, 15, 326. https://doi.org/10.3390/rs15020326
AMA Style
Tang X, You H, Liu Y, You Q, Chen J. Monitoring of Monthly Height Growth of Individual Trees in a Subtropical Mixed Plantation Using UAV Data. Remote Sensing. 2023; 15(2):326. https://doi.org/10.3390/rs15020326
Chicago/Turabian StyleTang, Xu, Haotian You, Yao Liu, Qixu You, and Jianjun Chen. 2023. "Monitoring of Monthly Height Growth of Individual Trees in a Subtropical Mixed Plantation Using UAV Data" Remote Sensing 15, no. 2: 326. https://doi.org/10.3390/rs15020326
Note that from the first issue of 2016, this journal uses article numbers instead of page numbers. See further details here.