
Forest Age Mapping Using Landsat Time-Series Stacks Data Based on Forest Disturbance and Empirical Relationships between Age and Height


Abstract
:
1. Introduction
2. Methodology
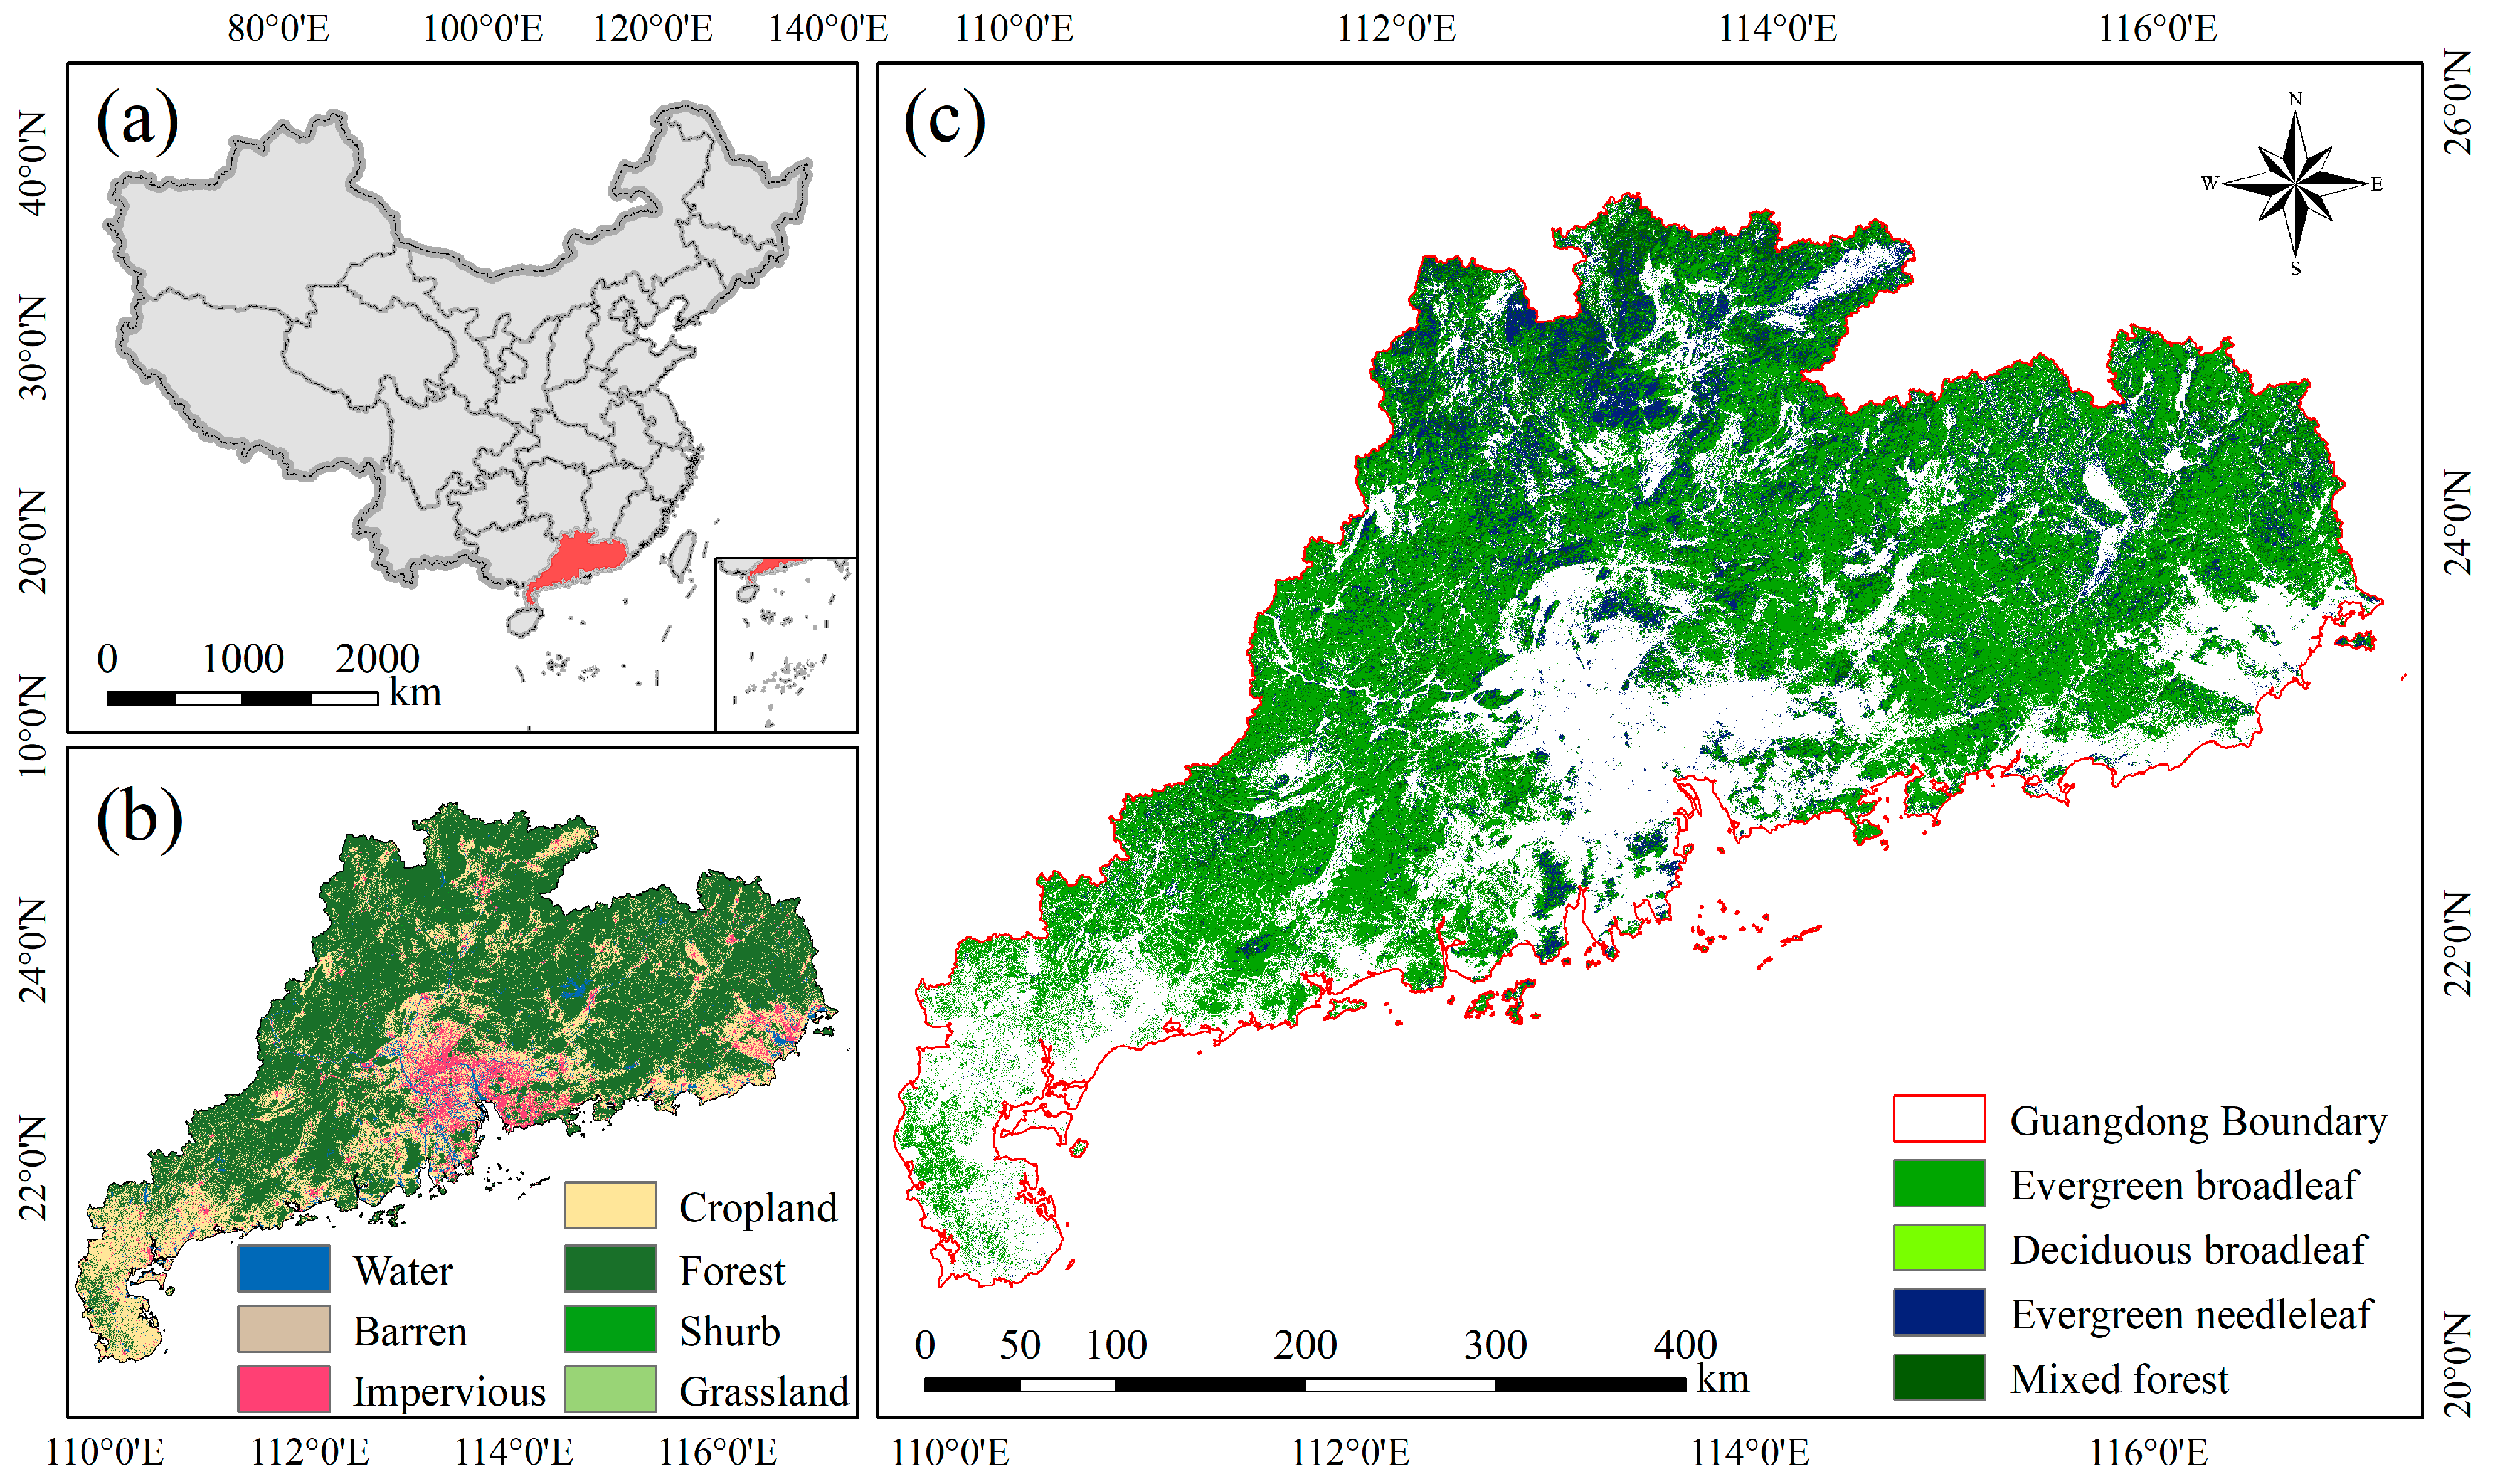
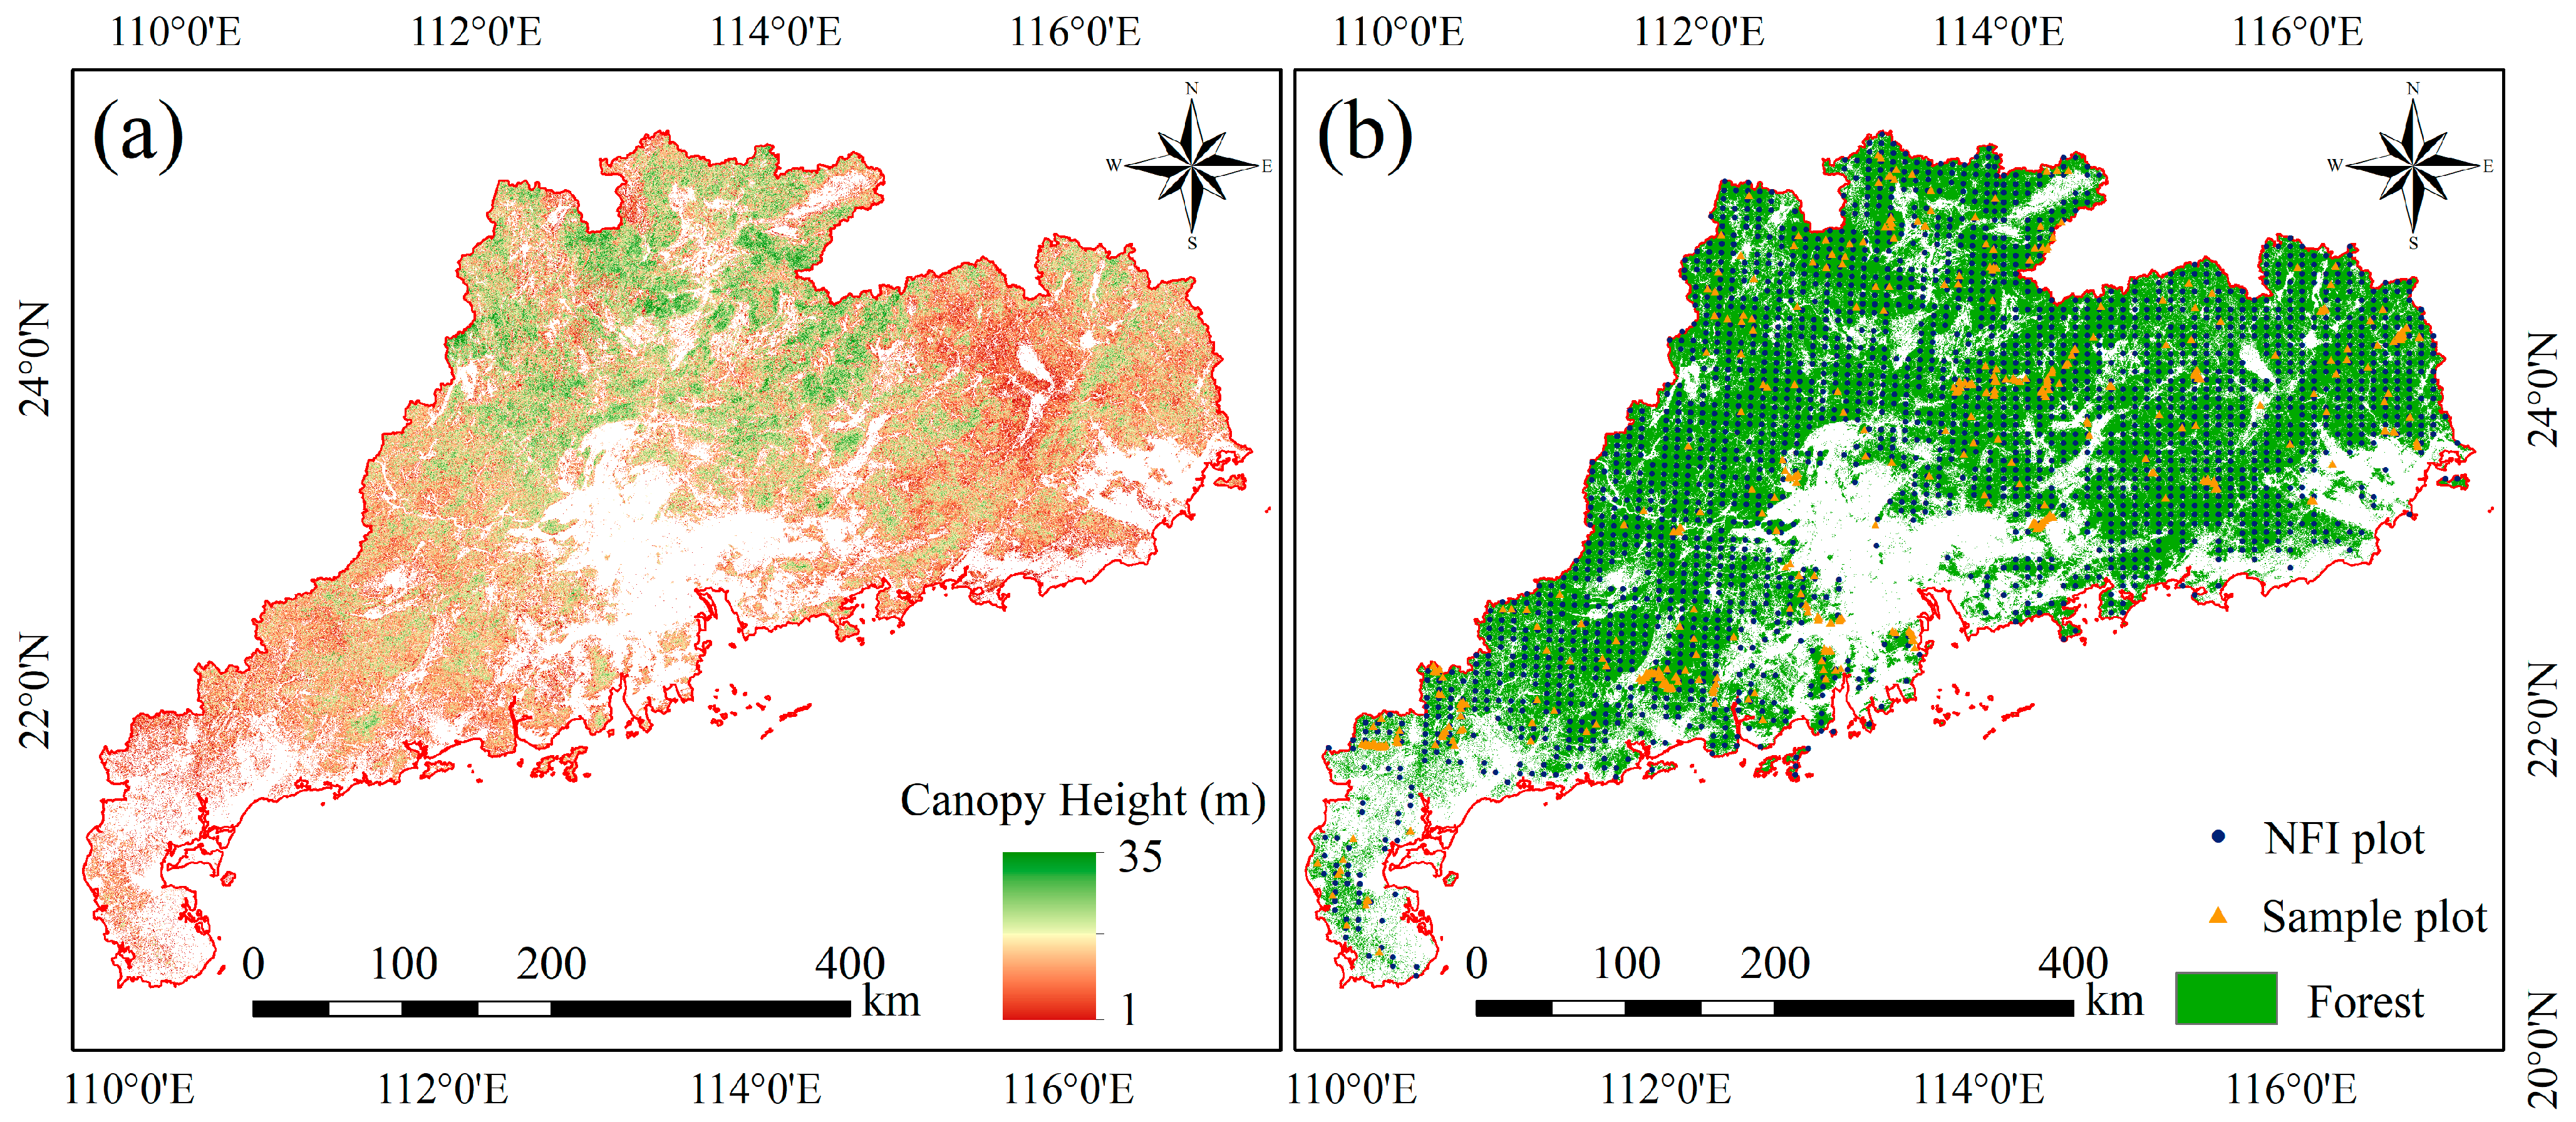
2.1. Study Area
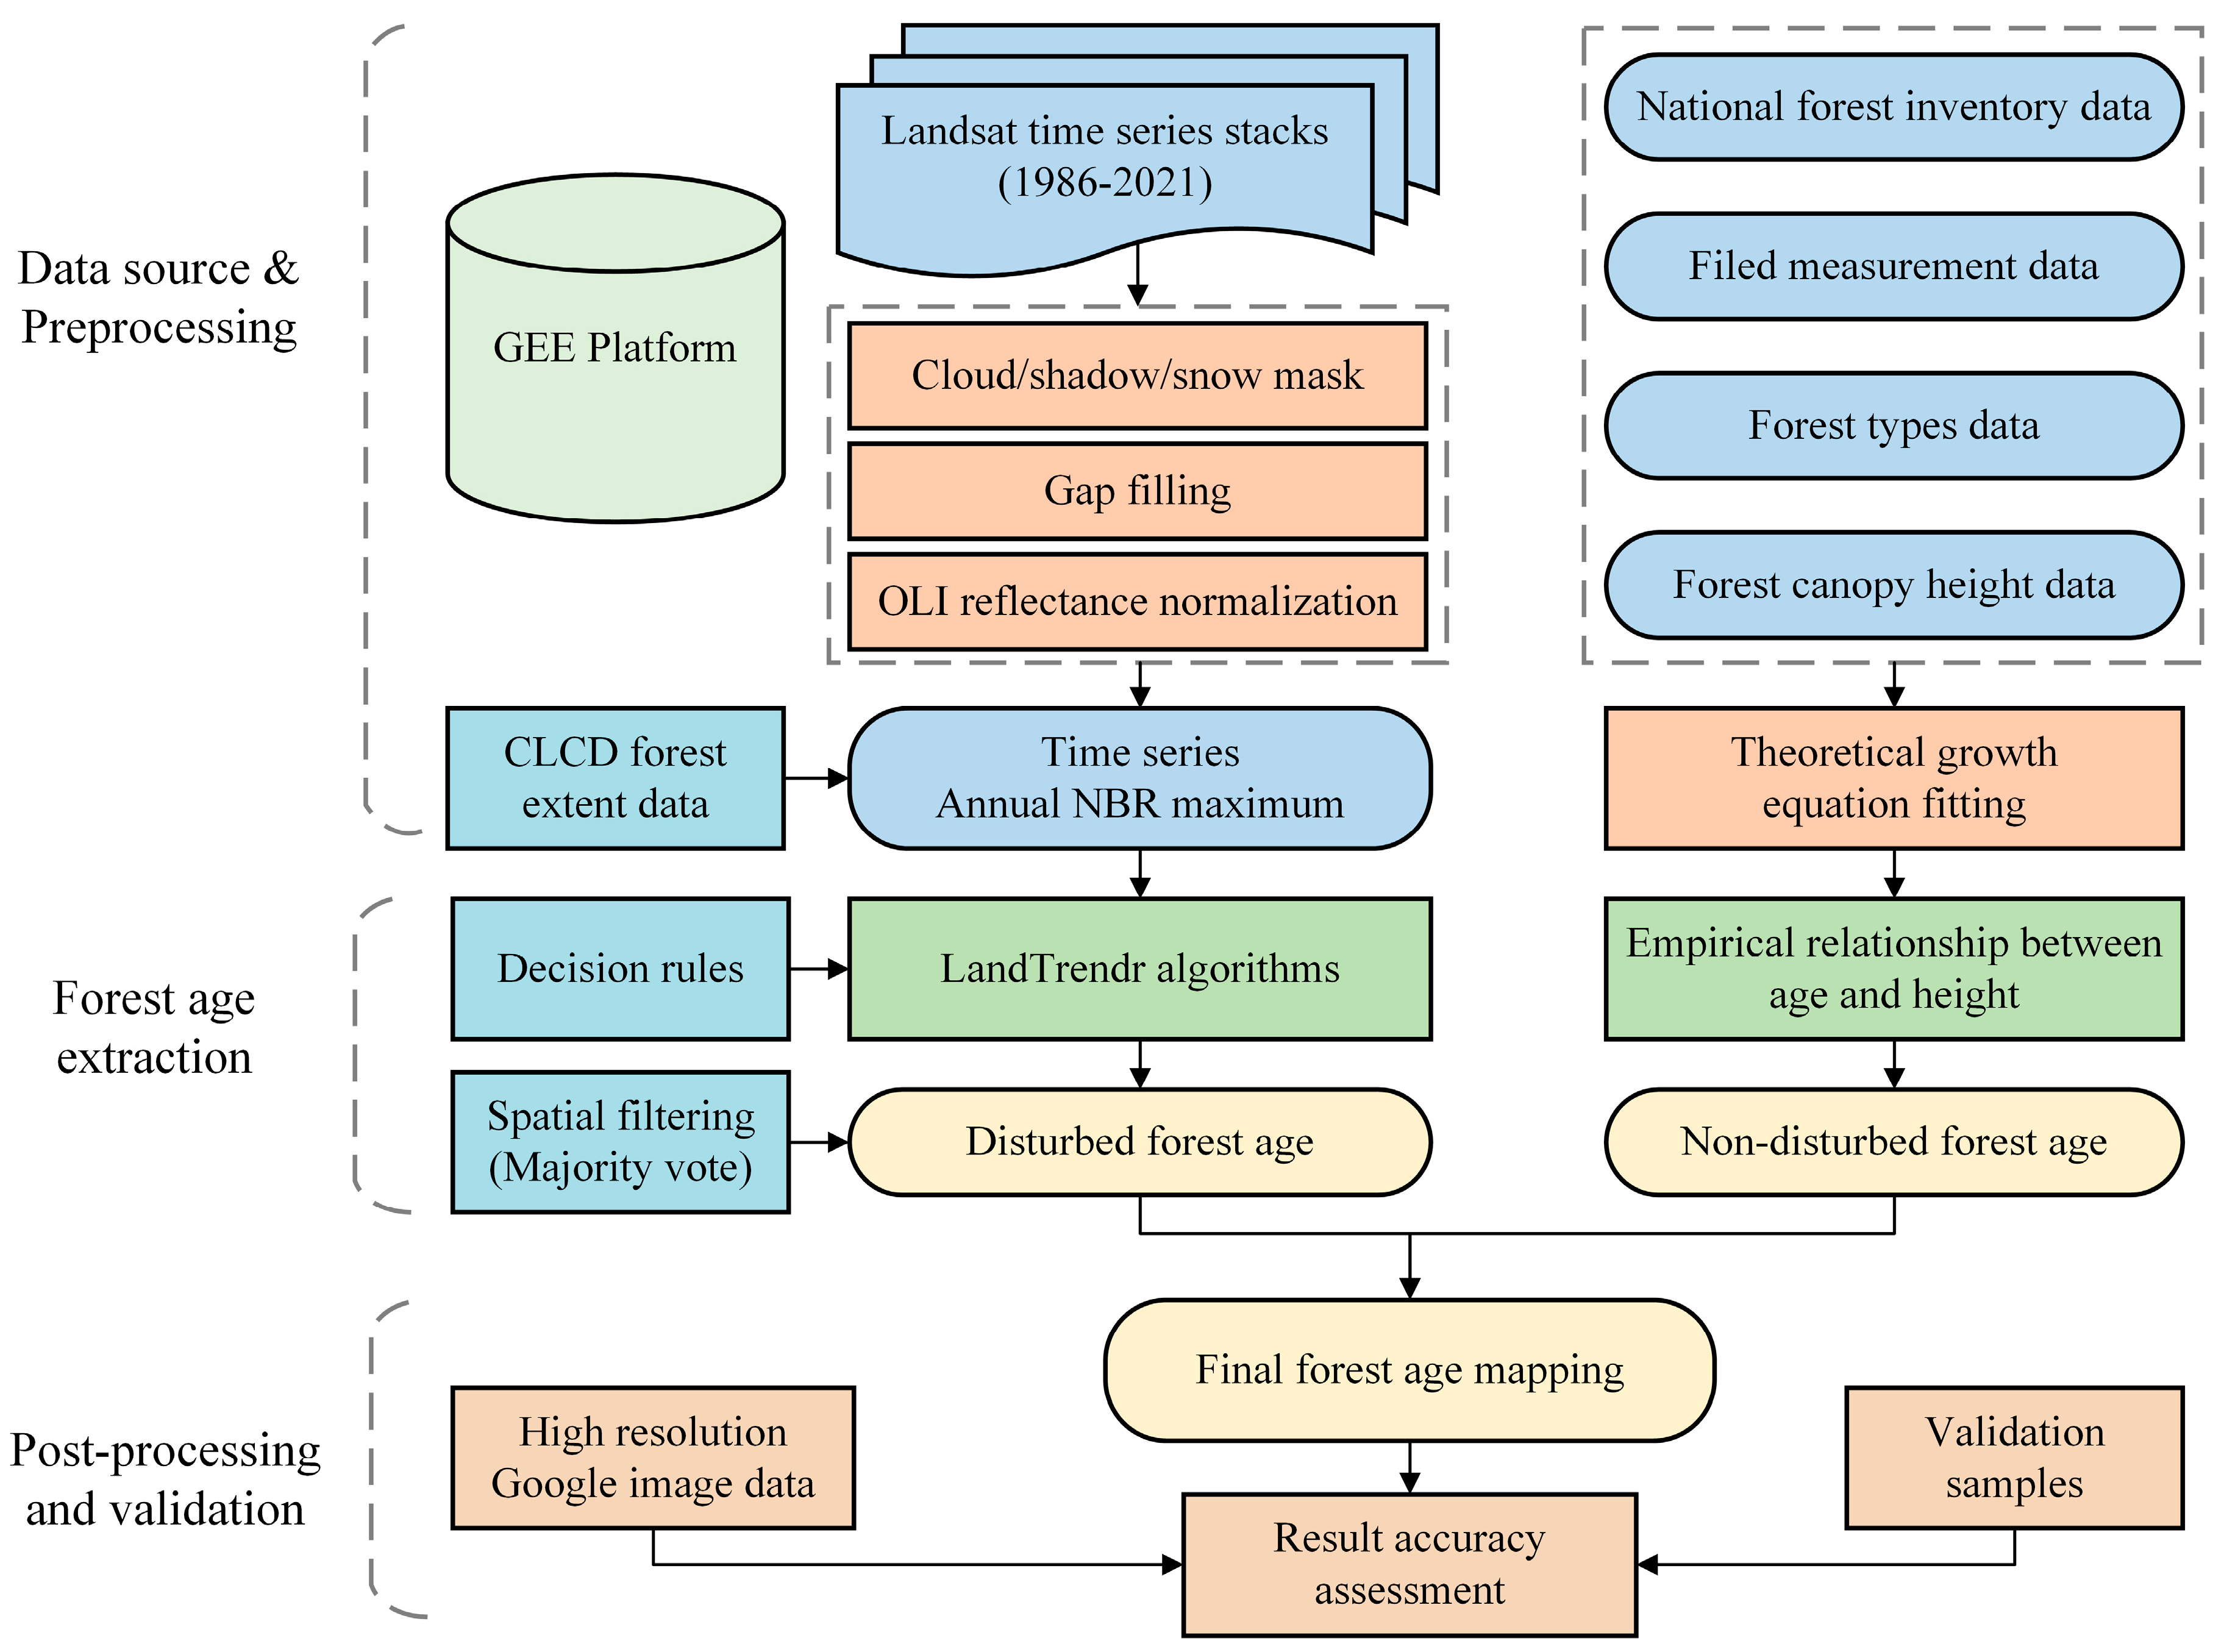
2.2. Data Source and Preprocessing
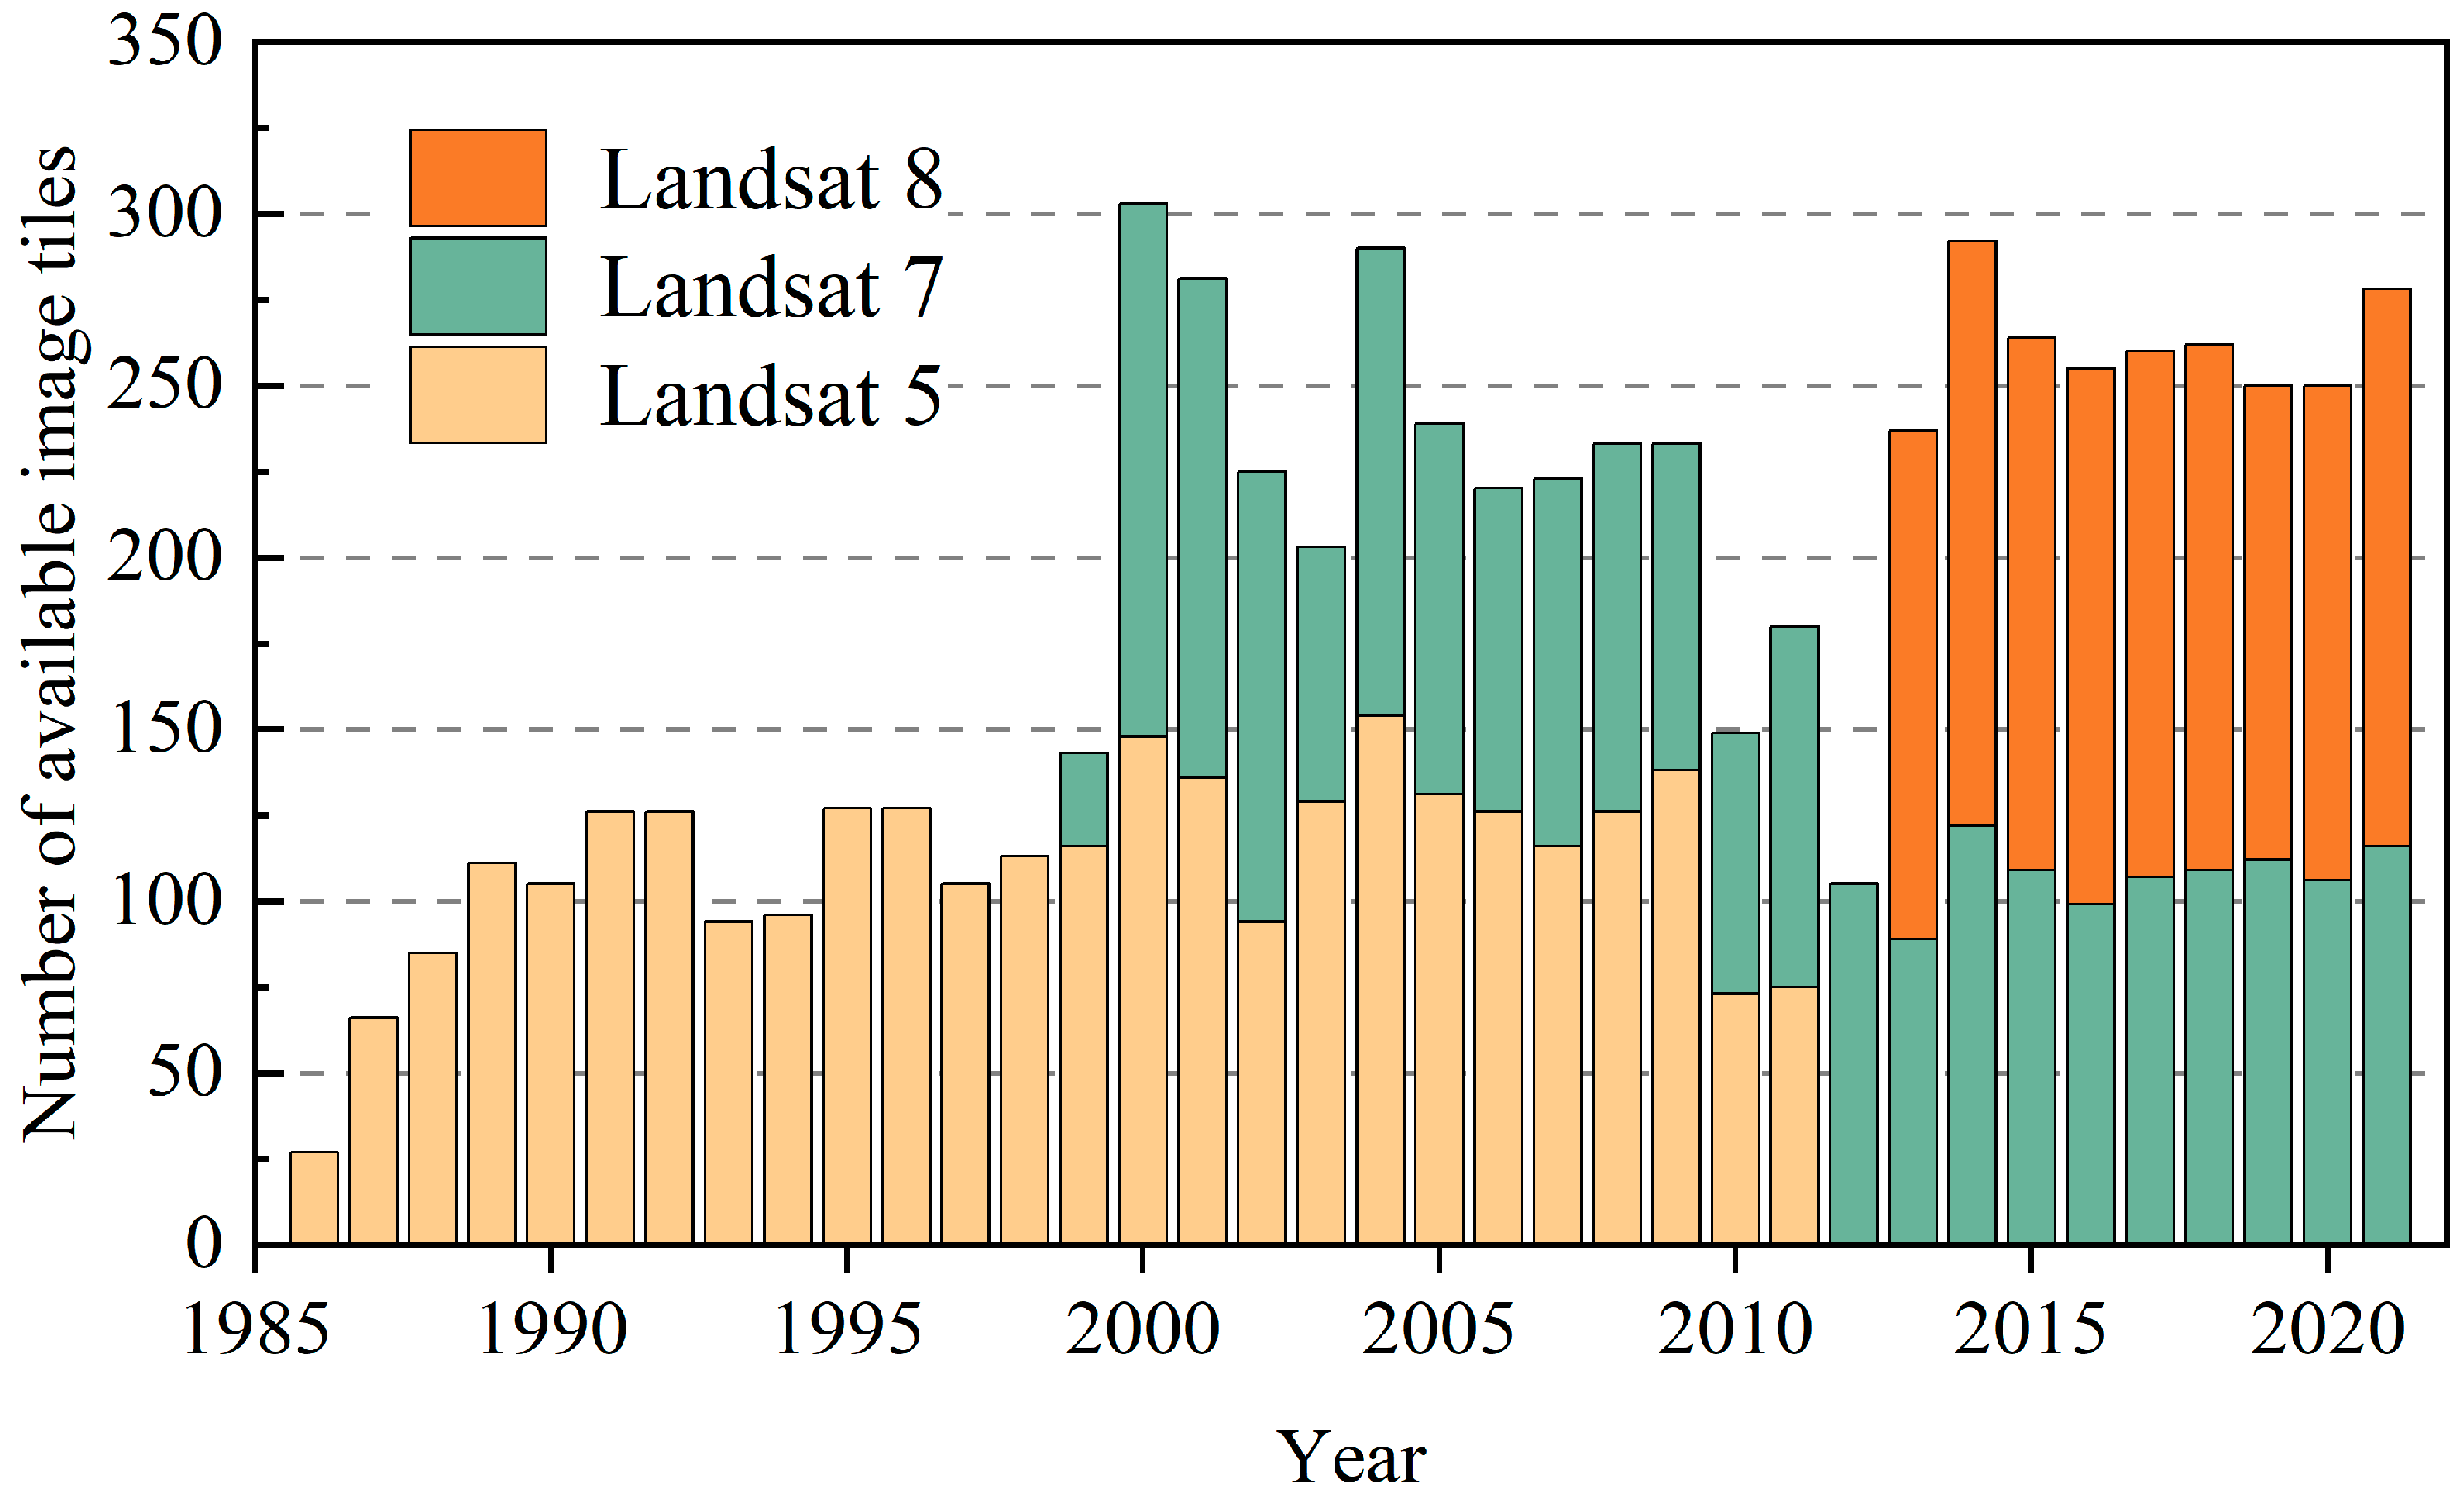
2.2.1. Landsat Imagery
2.2.2. Forest Types and Canopy Height Data
2.2.3. Validation Sampling Data
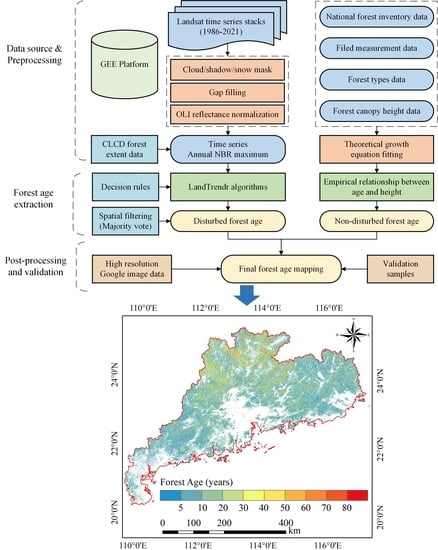
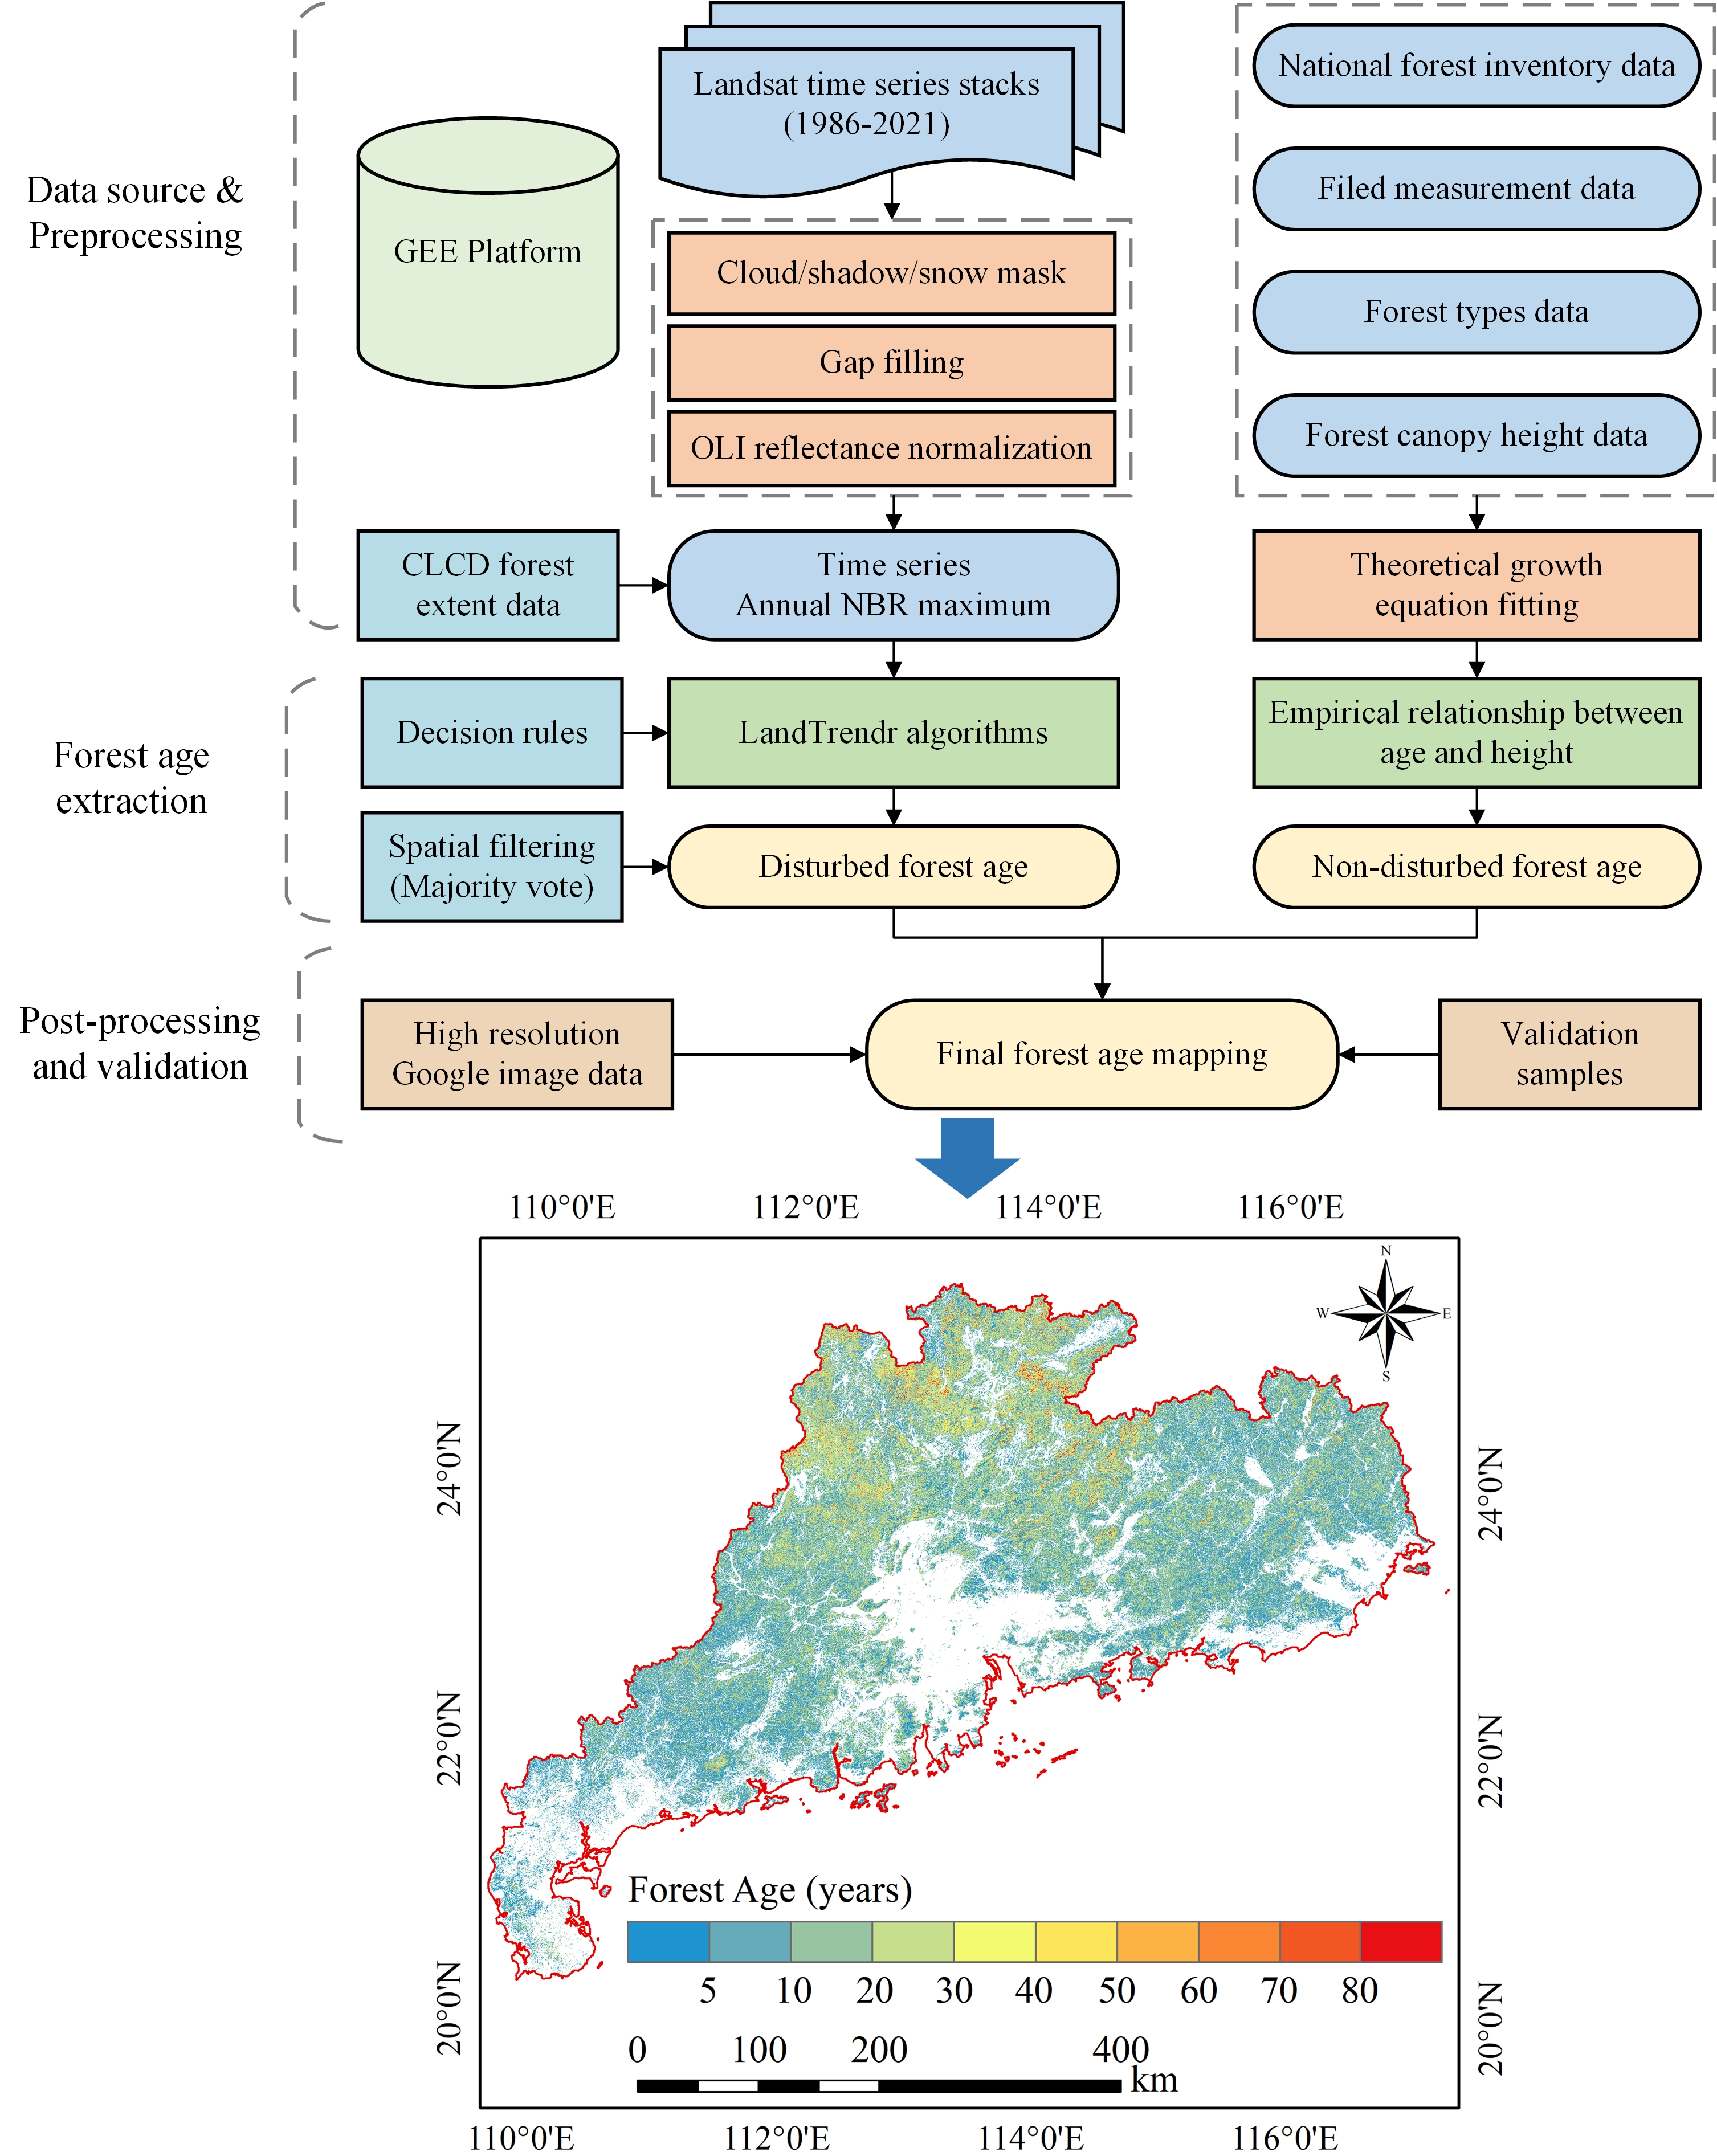
2.3. Forest Age Mapping Methods
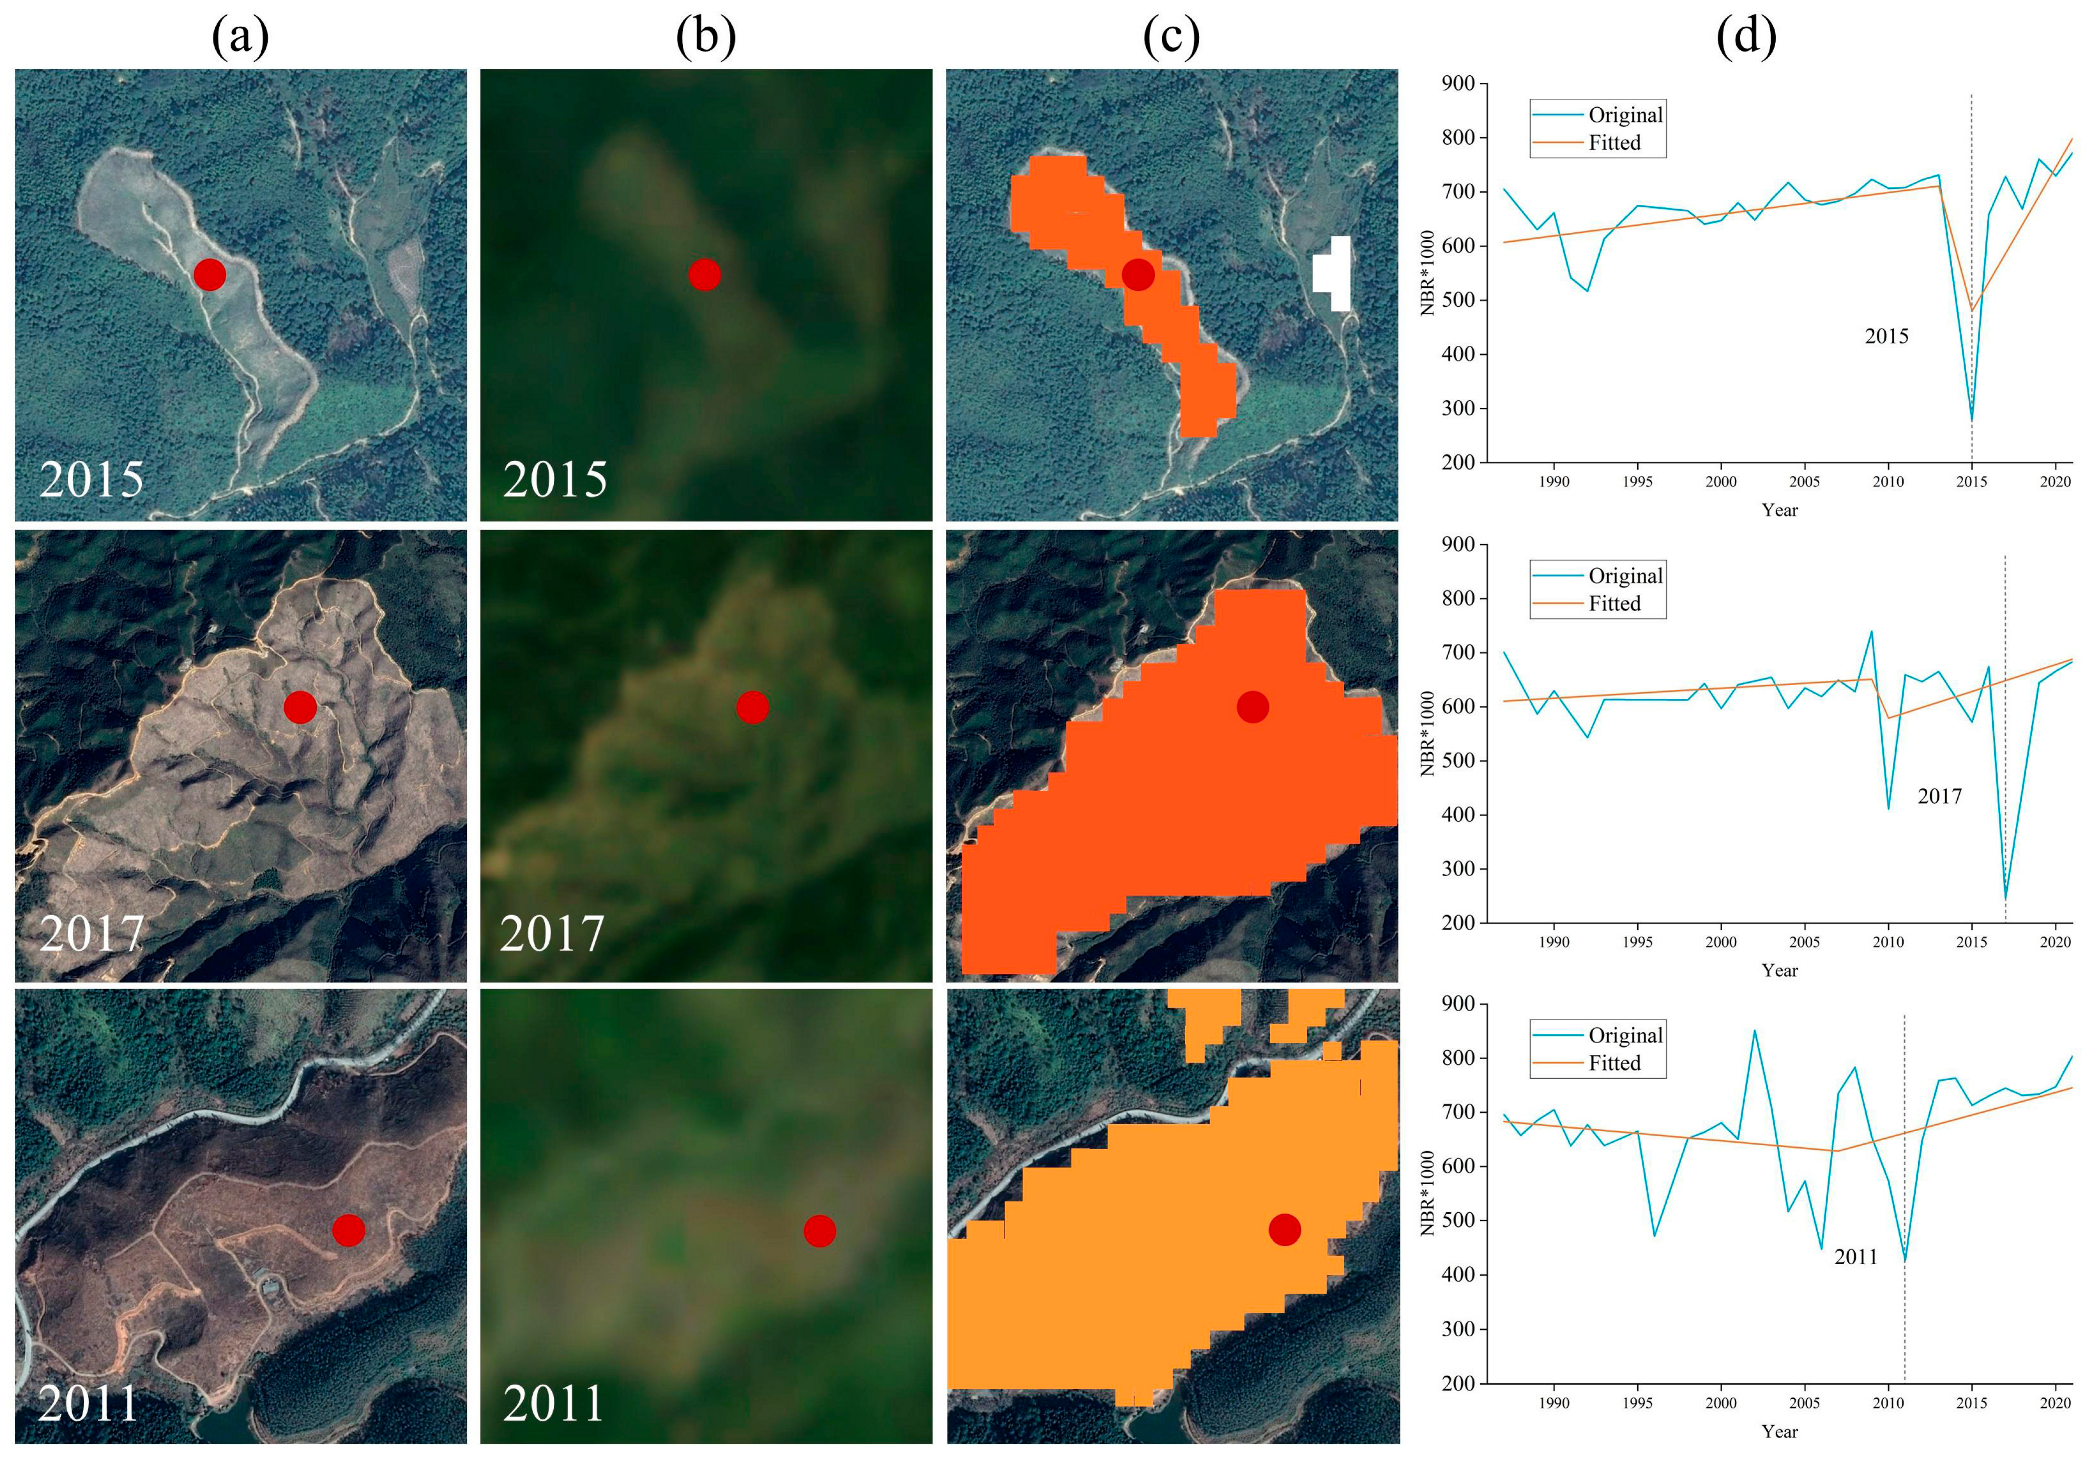
2.3.1. Disturbed Forest Age Mapping
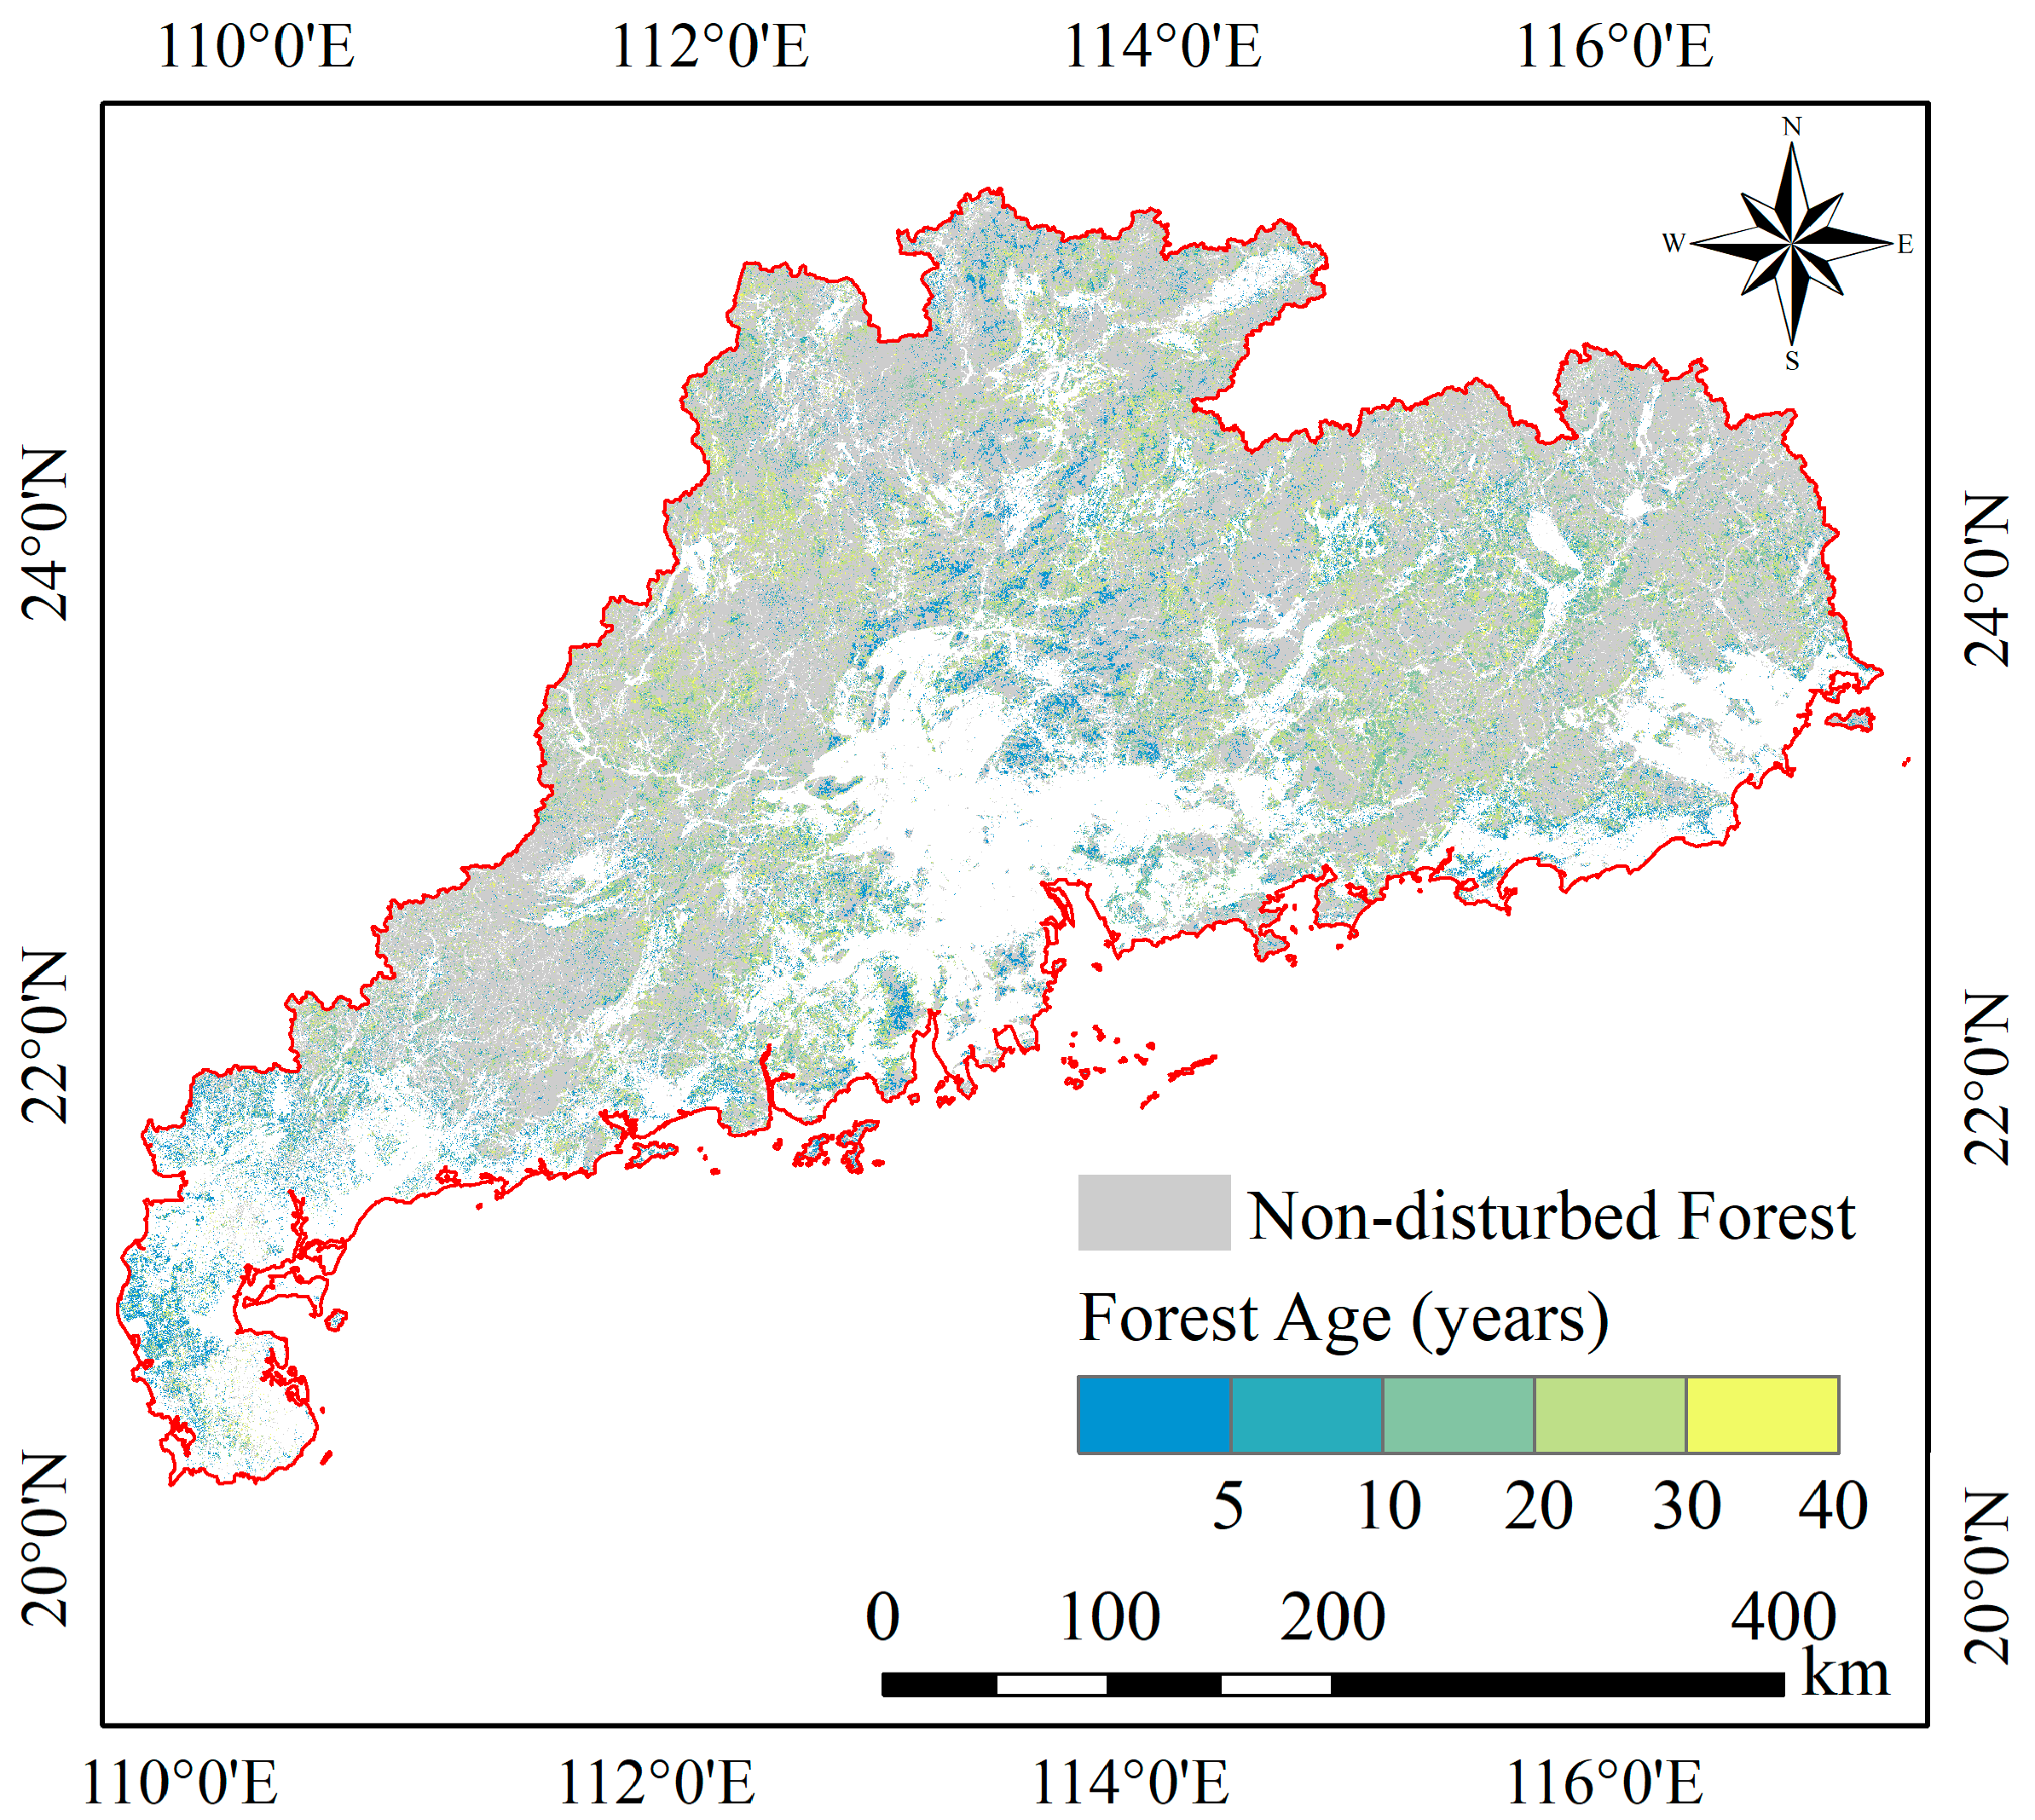
2.3.2. Non-Disturbed Forest Age Mapping
3. Results
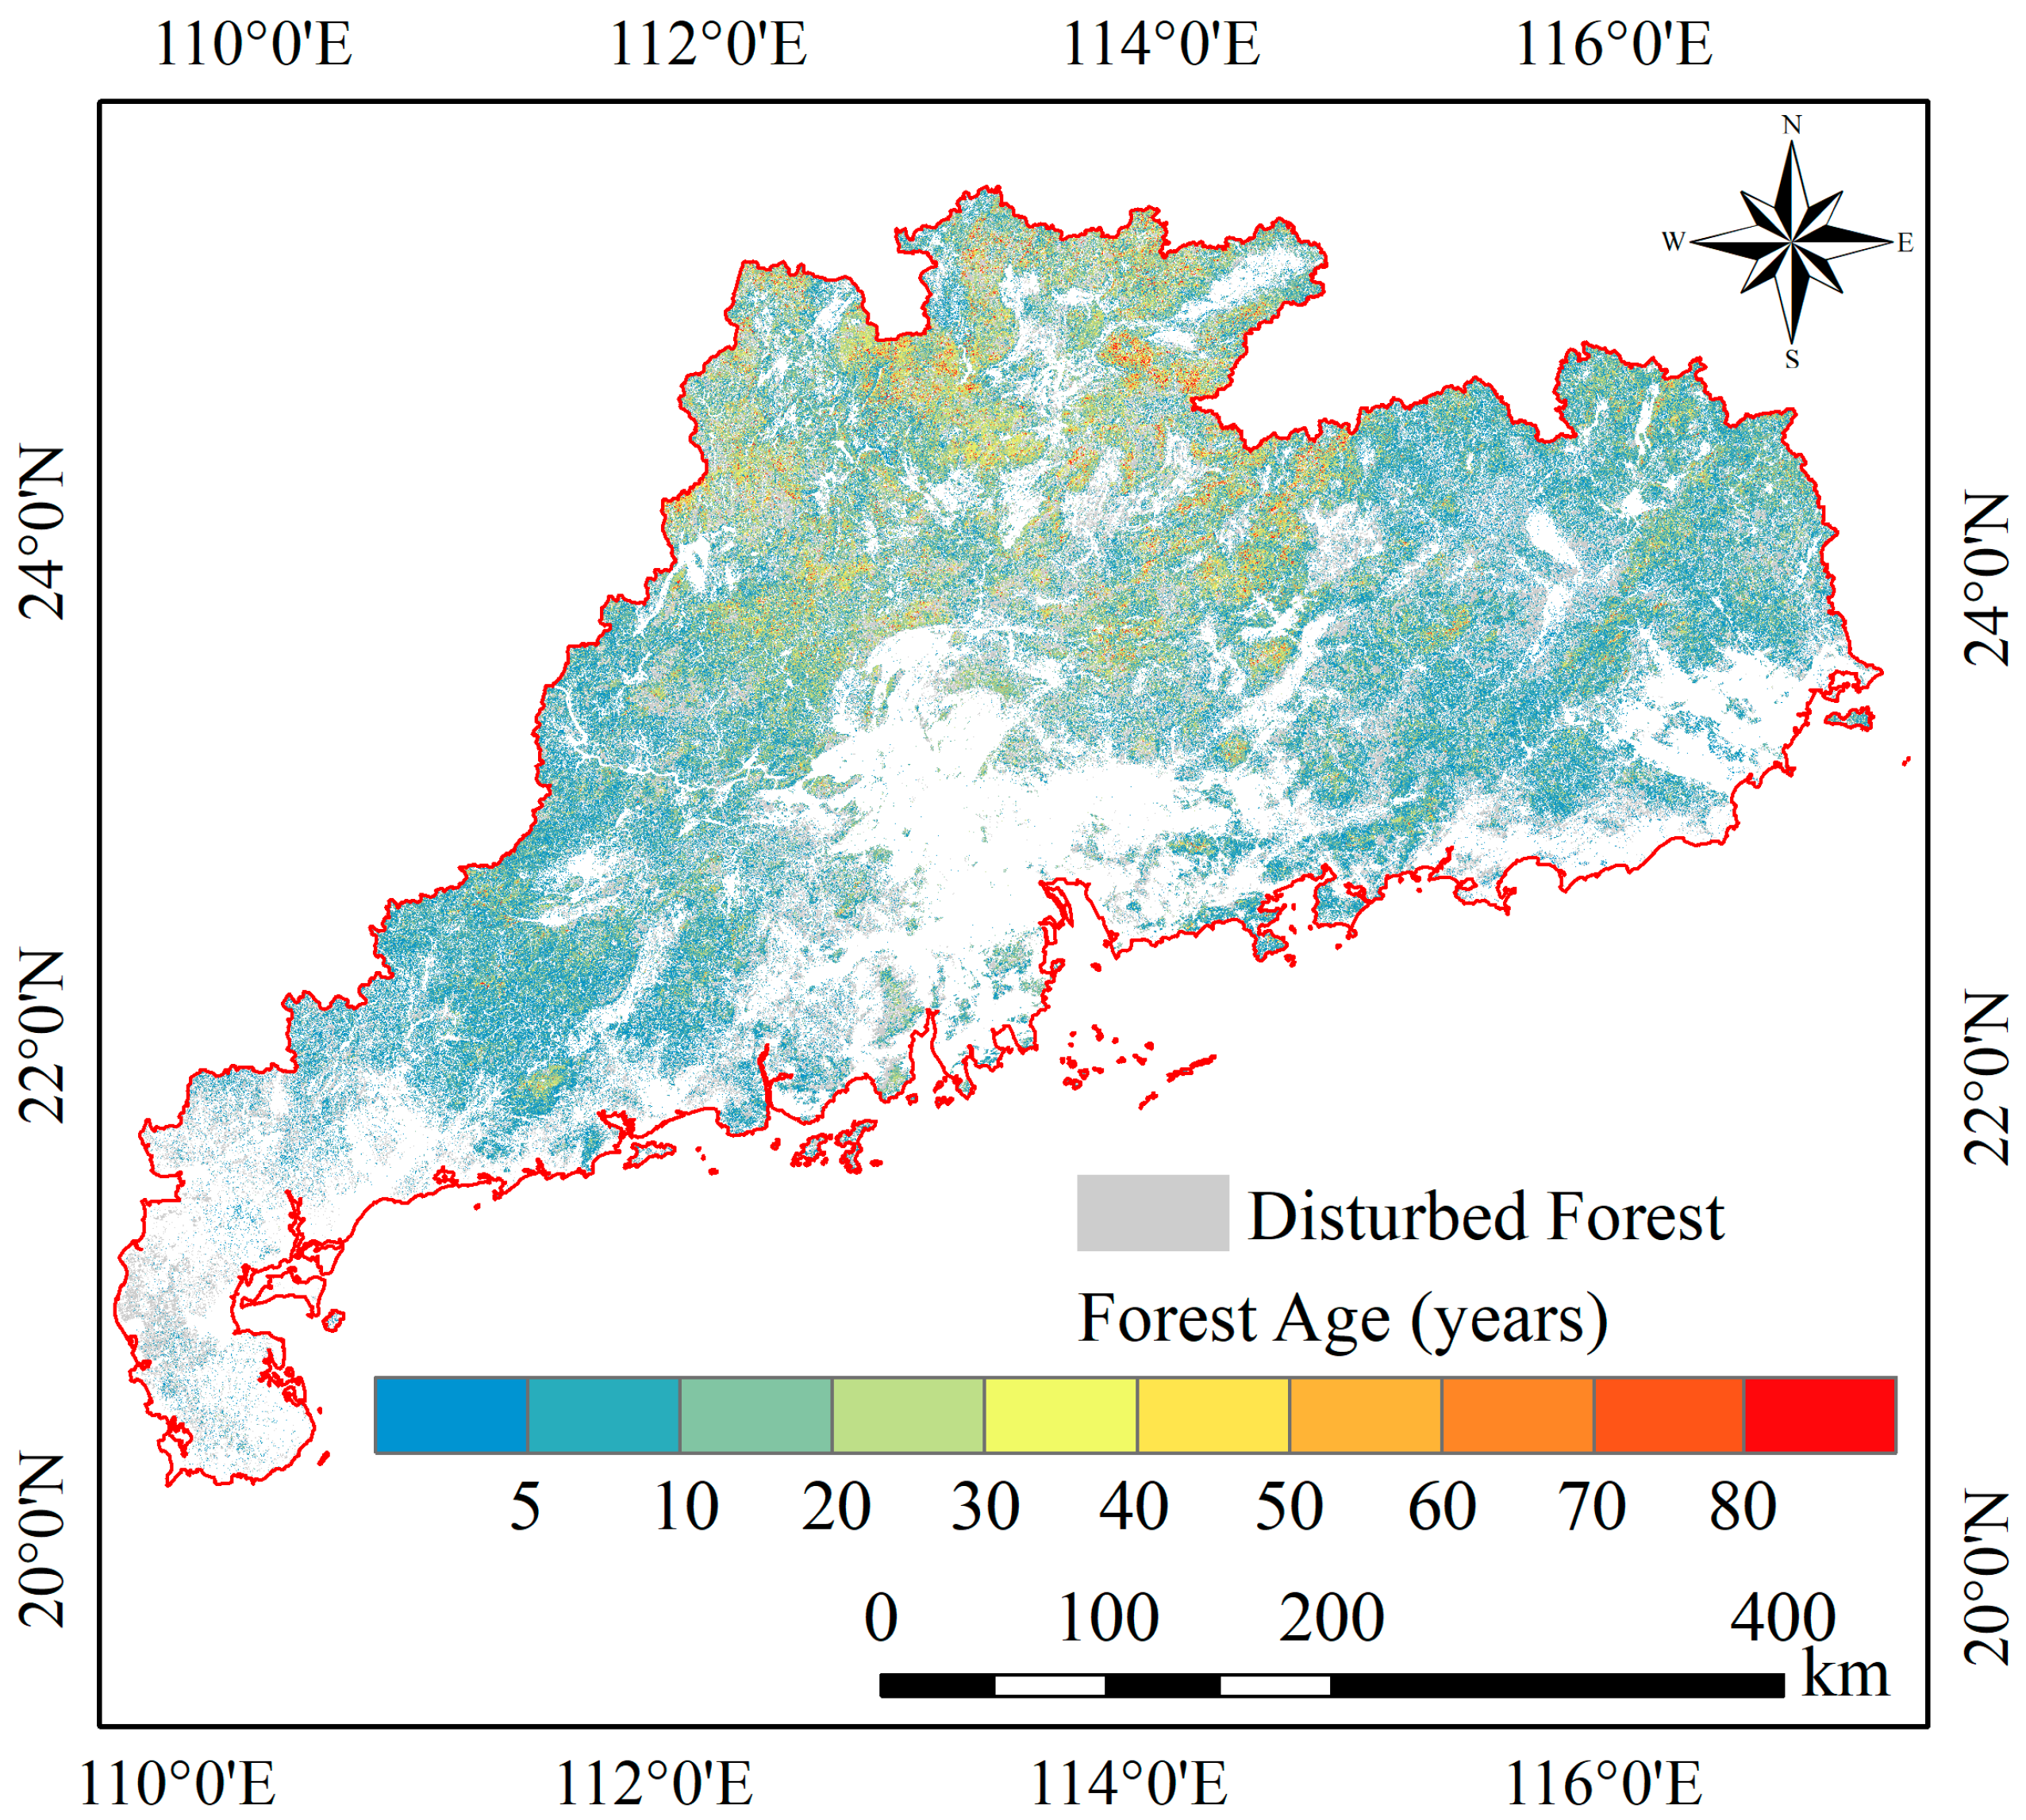
3.1. Disturbance Forest Age and Validation
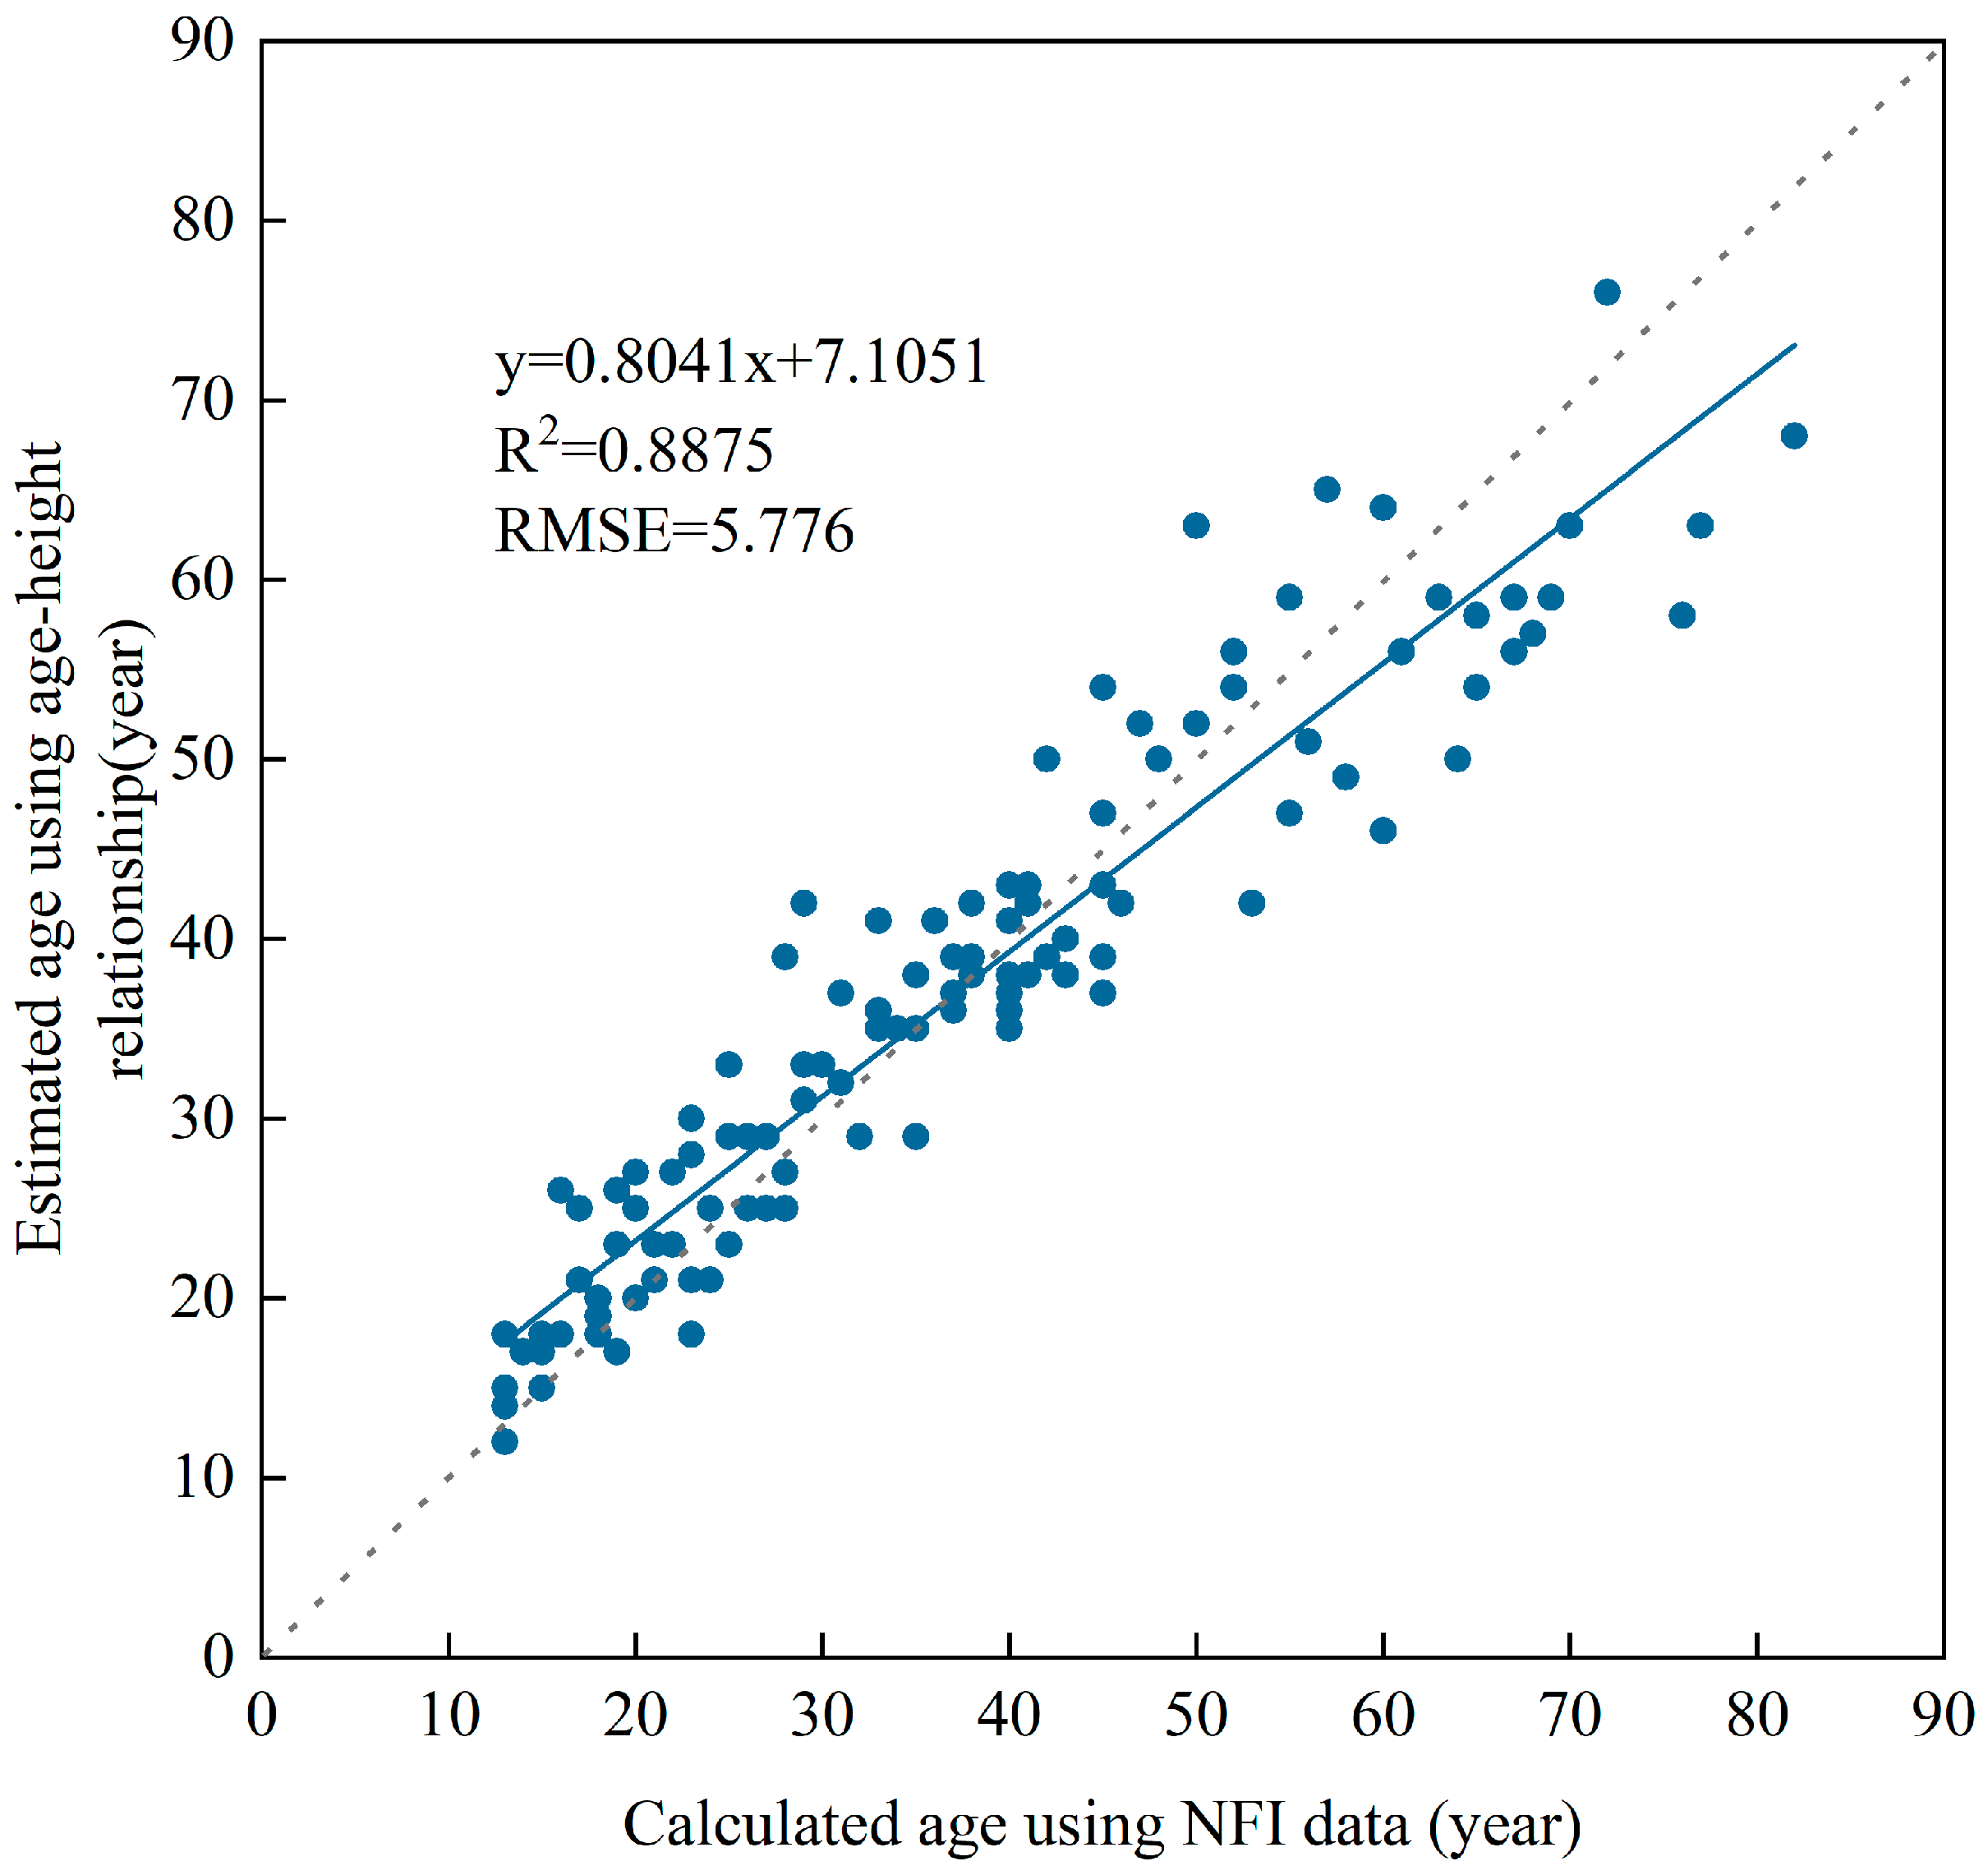
3.2. Non-Disturbed Forest Age and Validation
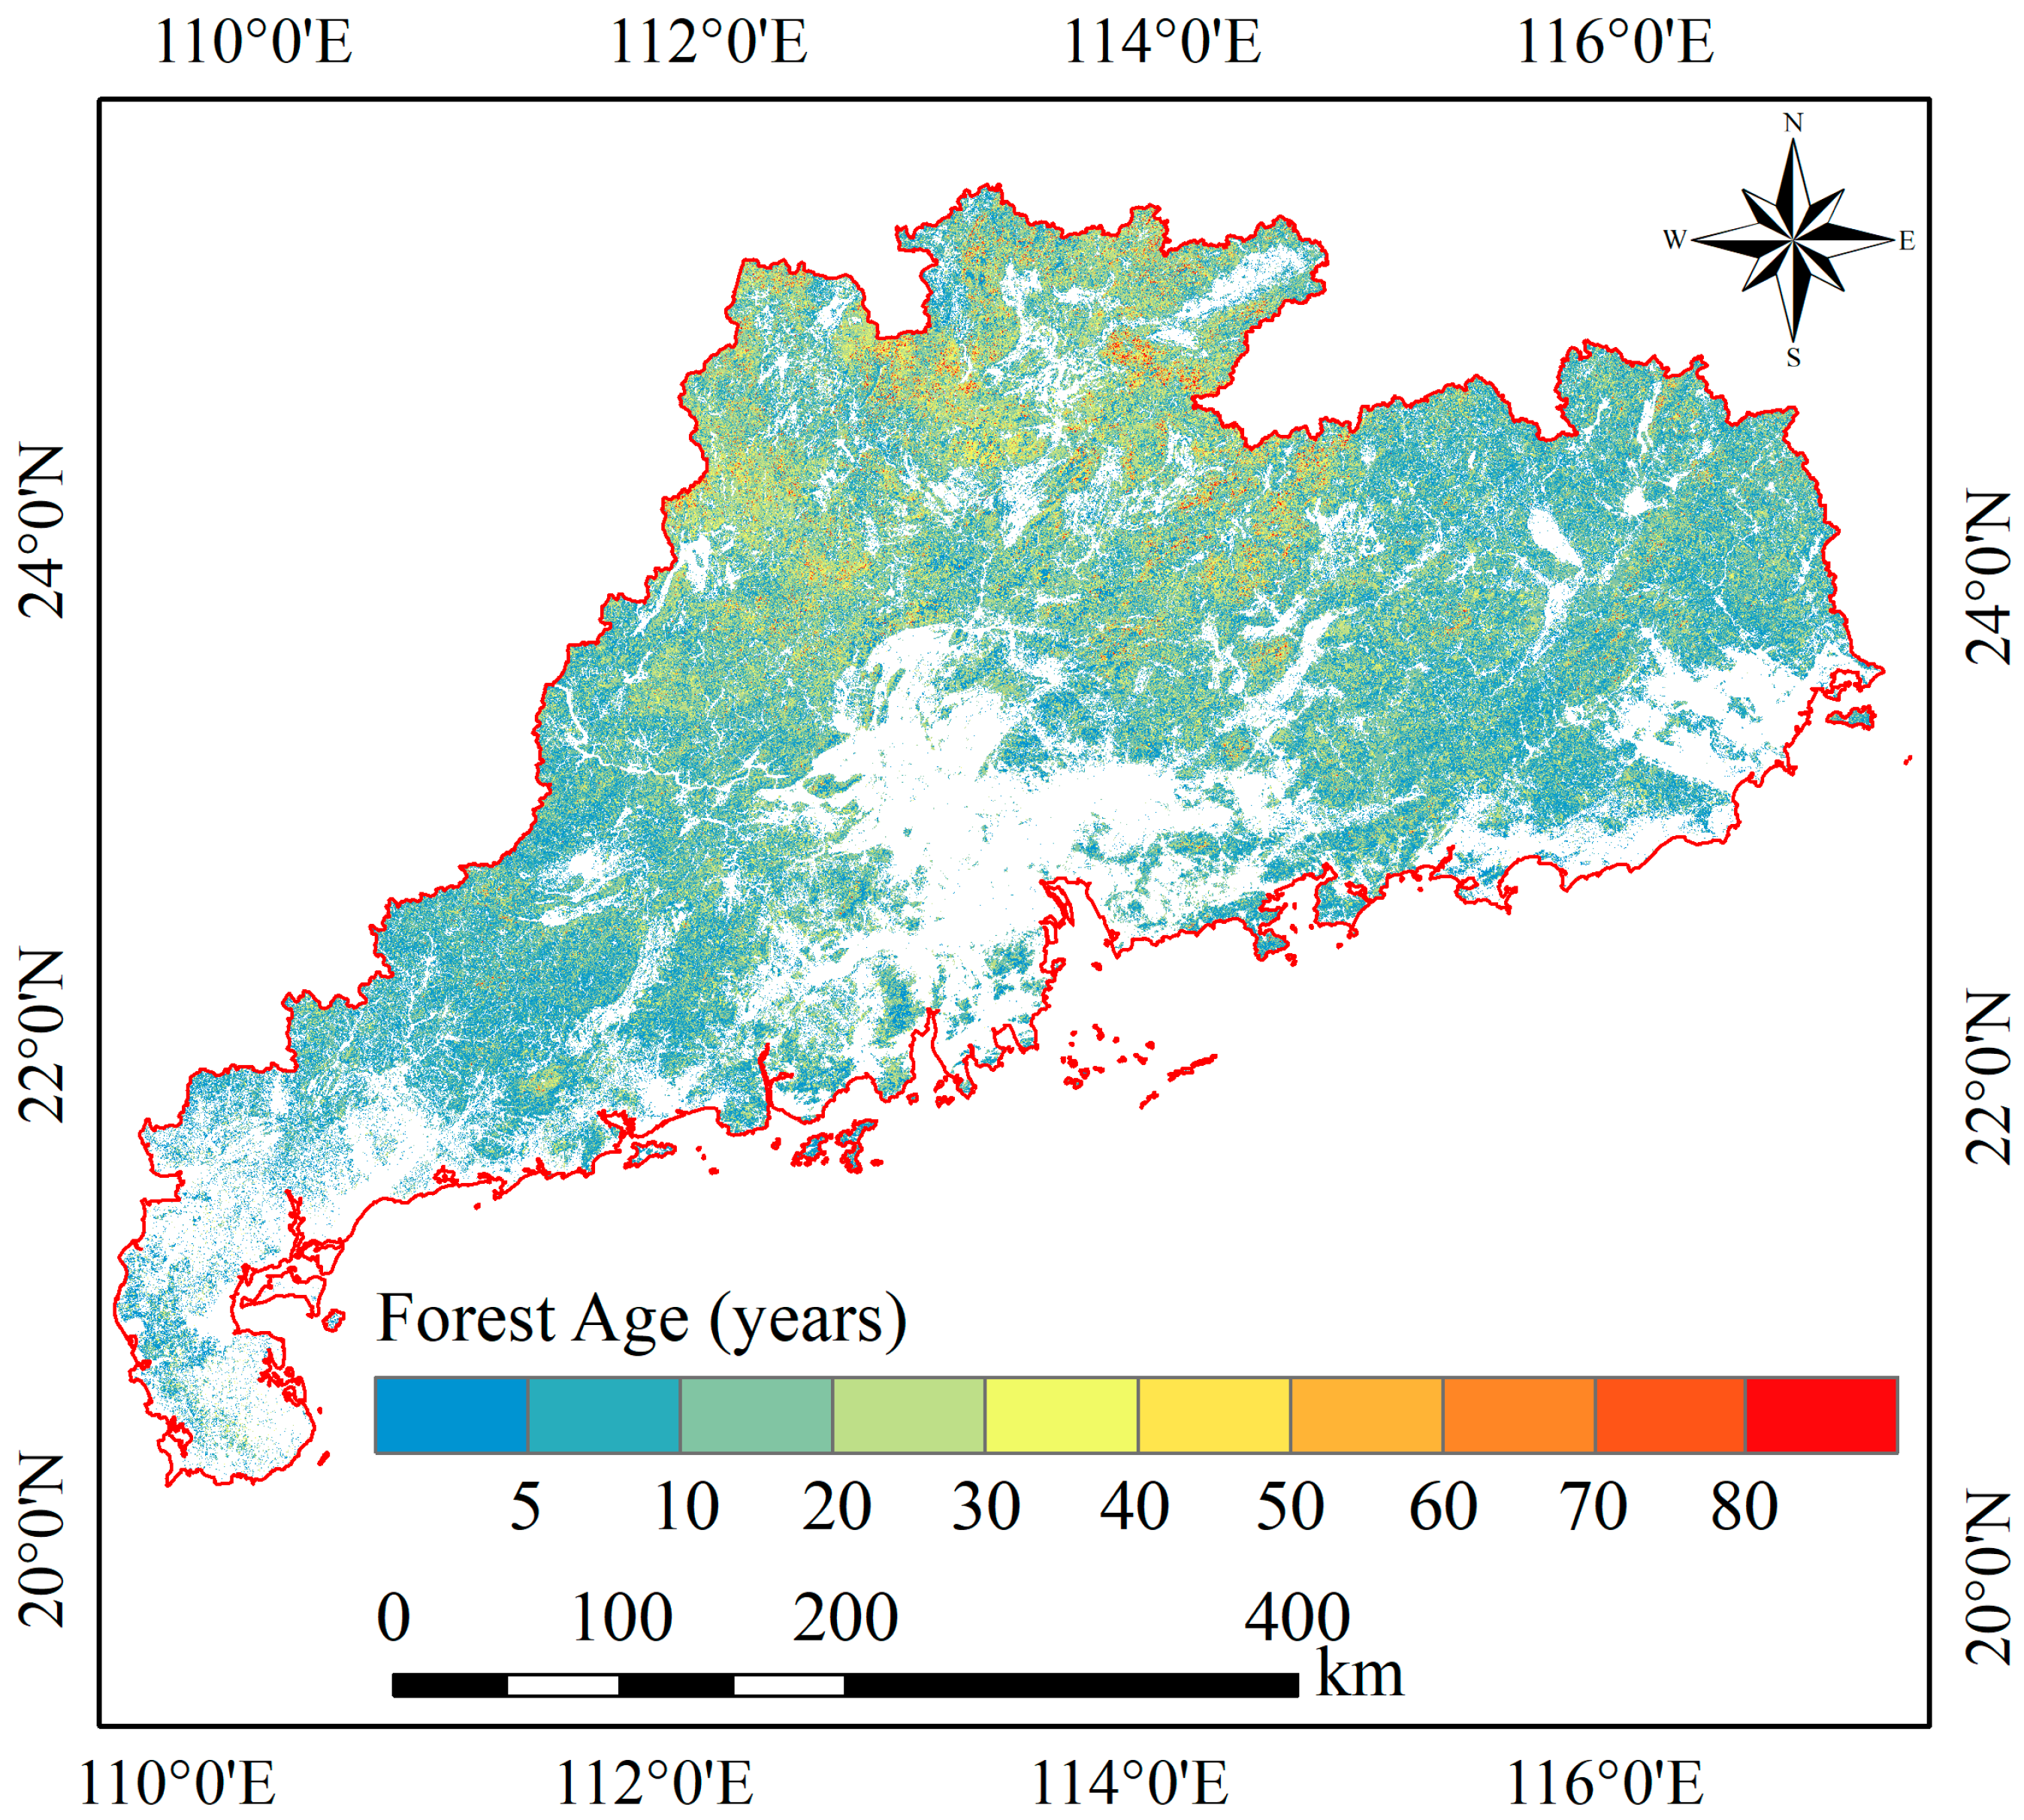
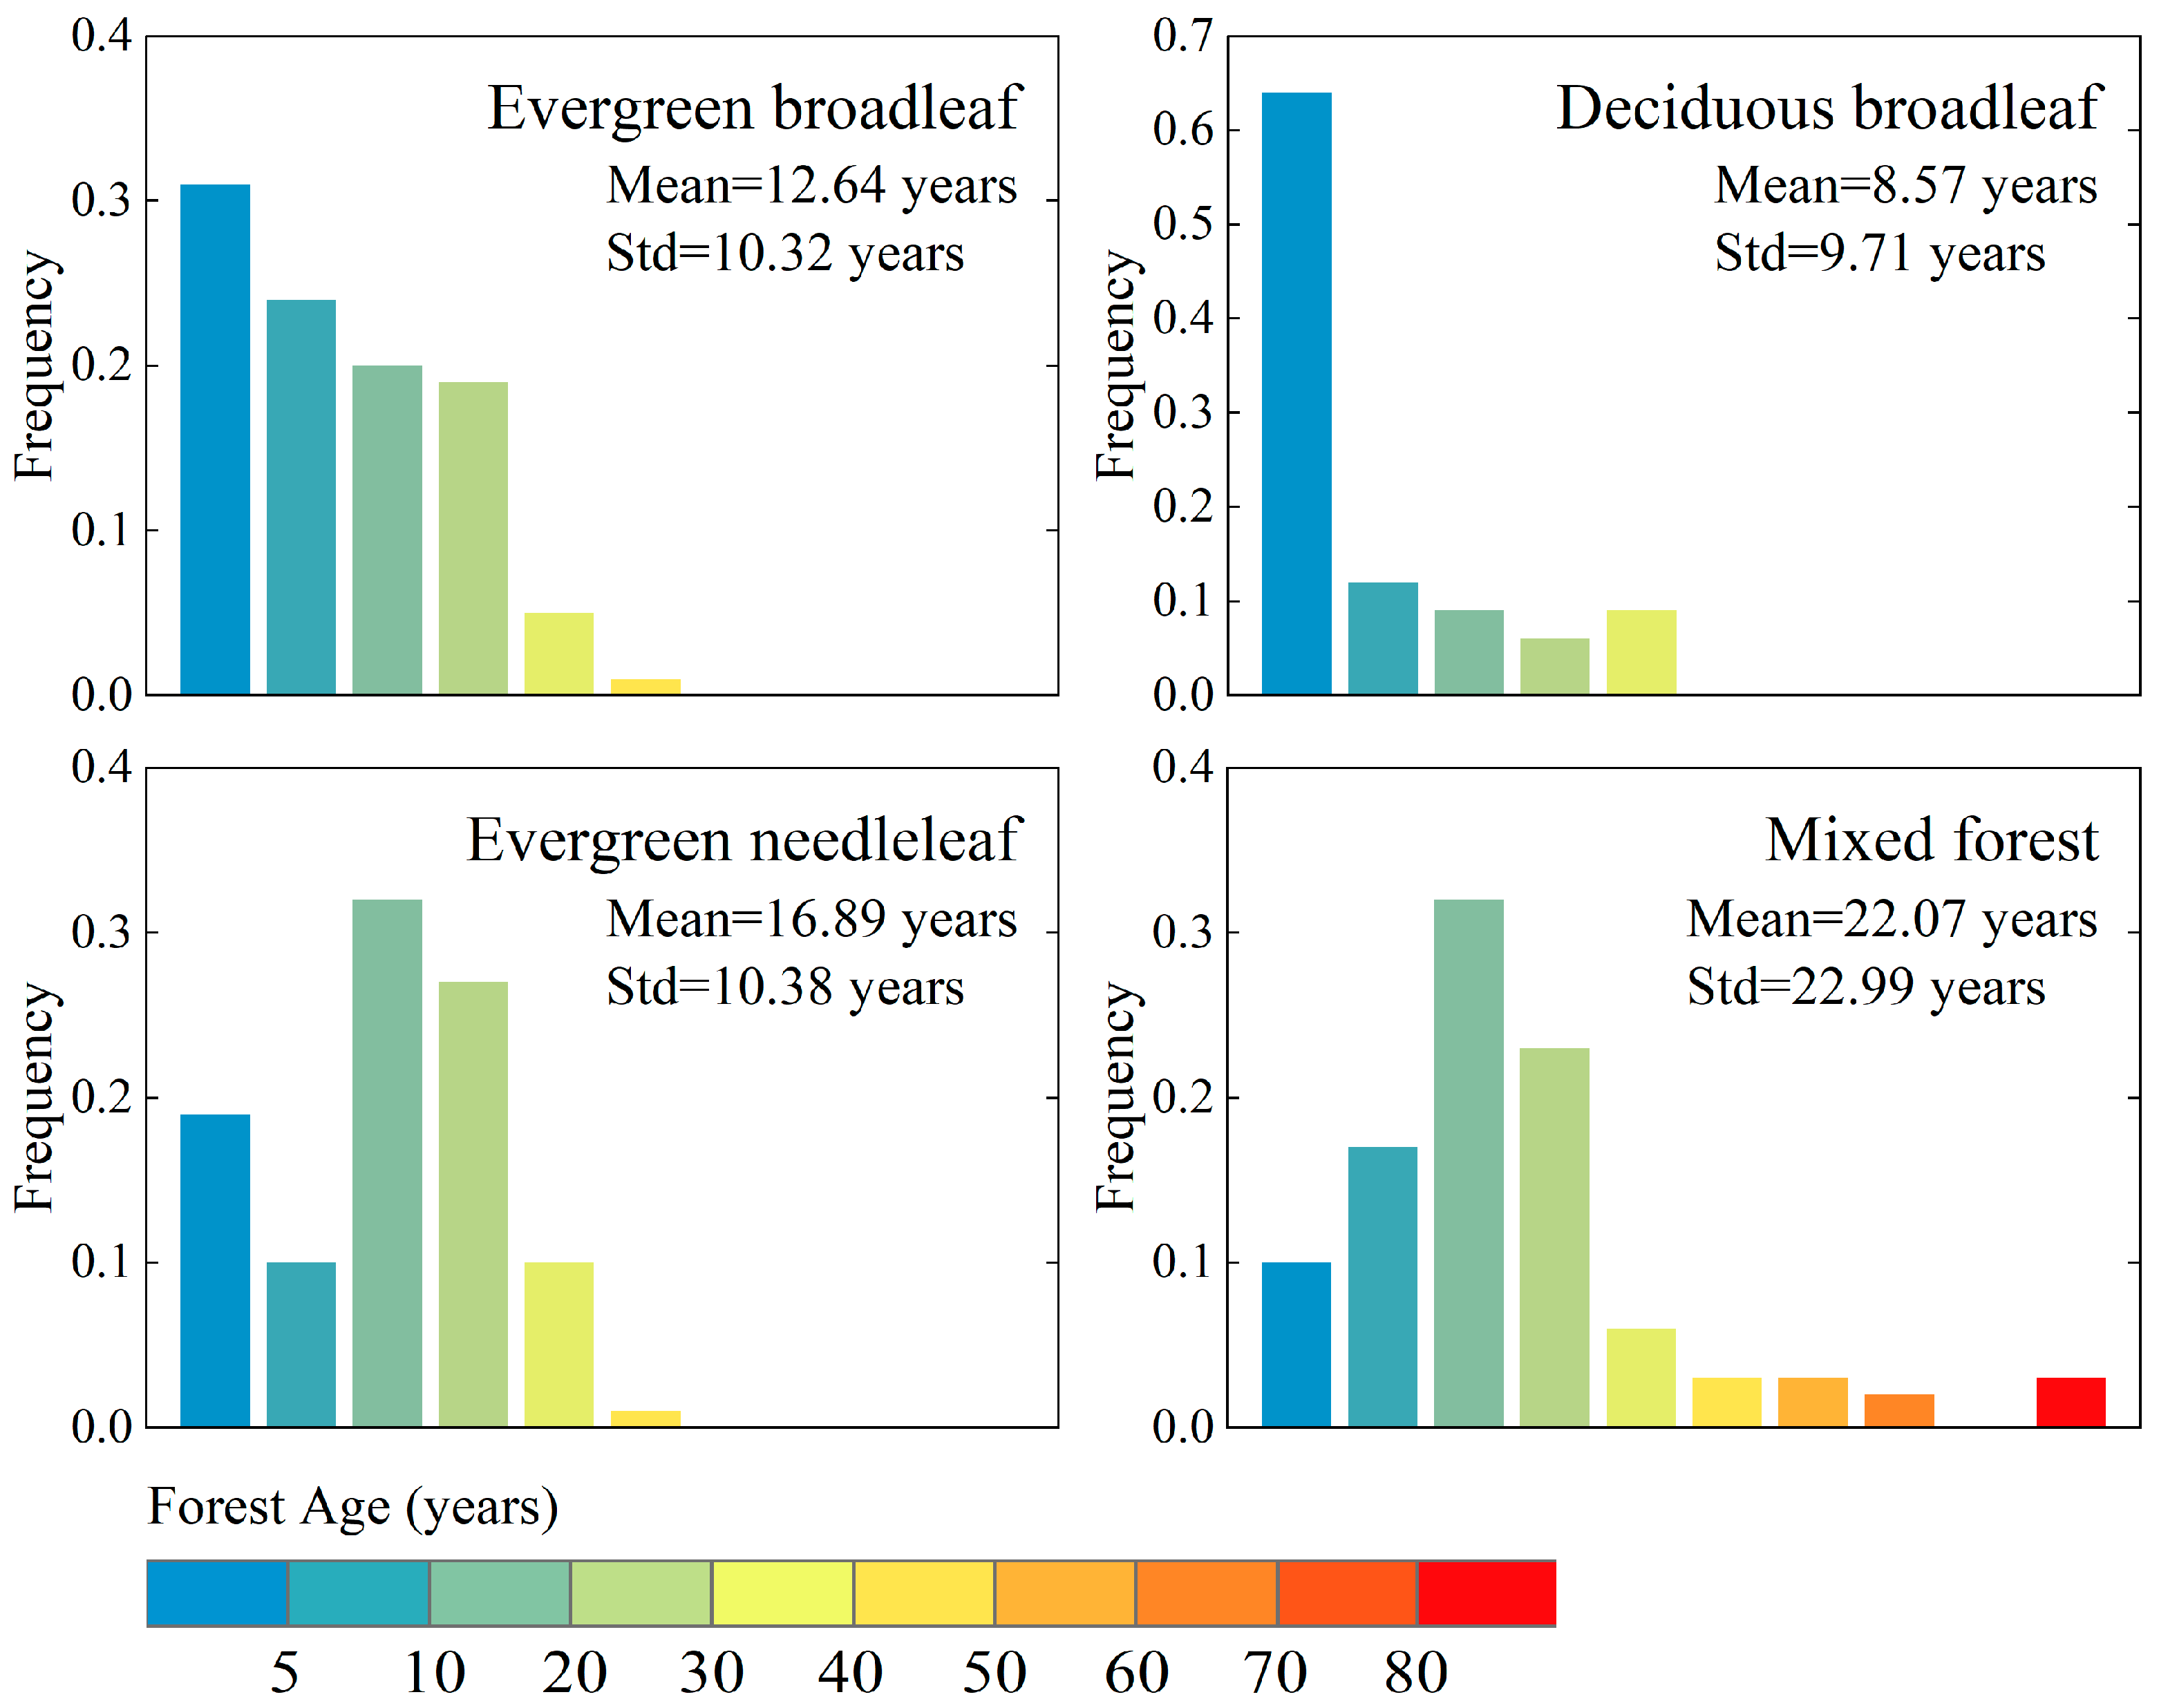
3.3. Final Forest Age Mapping
4. Discussion
4.1. Methodology for Forest Age Estimation
4.2. Uncertainties in Forest Age Map
5. Conclusions
Author Contributions
Funding
Data Availability Statement
Acknowledgments
Conflicts of Interest
References
- Tian, L.; Fu, W. Bi-Temporal Analysis of Spatial Changes of Boreal Forest Cover and Species in Siberia for the Years 1985 and 2015. Remote Sens. 2020, 12, 4116. [Google Scholar] [CrossRef]
- Bair-On, Y.M.; Phillips, R.; Milo, R. The biomass distribution on Earth. Proc. Natl. Acad. Sci. USA 2018, 115, 6506–6511. [Google Scholar] [CrossRef] [PubMed]
- Lei, H.Q.; Sun, G.Q.; Zheng, D.L. Caron storage of forest ecosystem in Wenzhou City, Zhengjiang Province, China. J. Nanjing For. Univ. 2022, 46, 20–26. [Google Scholar] [CrossRef]
- Houghton, R.A.; Hall, F.; Goetz, S.J. Importance of biomass in the global carbon cycle. J. Geophys. Res. Biogeosci. 2009, 114, G00E03. [Google Scholar] [CrossRef]
- Pan, Y.D.; Birdsey, R.A.; Fang, J.Y.; Houghton, R.; Kauppi, P.E.; Kurz, W.A.; Phillips, O.L.; Shvidenko, A.; Lewis, S.L.; Canadell, J.G.; et al. A Large and Persistent Carbon Sink in the World’s Forests. Science 2011, 333, 988–993. [Google Scholar] [CrossRef]
- Molotoks, A.; Stehfest, E.; Doelman, J.; Albanito, F.; Fitton, N.; Dawson, T.P.; Smith, P. Global projections of future cropland expansion to 2050 and direct impacts on biodiversity and carbon storage. Glob. Chang. Biol. 2018, 24, 5895–5908. [Google Scholar] [CrossRef]
- Payne, N.J.; Cameron, D.A.; Leblanc, J.D.; Morrison, I.K. Carbon storage and net primary productivity in Canadian boreal mixedwood stands. J. For. Res. 2019, 30, 1667–1678. [Google Scholar] [CrossRef]
- Xiao, J.F.; Chevallier, F.; Gomez, C.; Guanter, L.; Hicke, J.A.; Huete, A.R.; Ichii, K.; Ni, W.J.; Pang, Y.; Rahman, A.F.; et al. Remote sensing of the terrestrial carbon cycle: A review of advances over 50 years. Remote Sens. Environ. 2019, 233, 111383. [Google Scholar] [CrossRef]
- Tian, L.; Tao, Y.; Fu, W.X.; Li, T.; Ren, F.; Li, M.Y. Dynamic Simulation of Land Use/Cover Change and Assessment of Forest Ecosystem Carbon Storage under Climate Change Scenarios in Guangdong Province, China. Remote Sens. 2022, 14, 2330. [Google Scholar] [CrossRef]
- Wang, D.W.; Shen, W.X. The carbon storage calaulation and carbon sequestration potential analysis of the main artificial arboreal forest in China. J. Nanjing For. Univ. 2022, 46, 11–19. [Google Scholar] [CrossRef]
- Tao, Y.; Tian, L.; Wang, C.; Dai, W. Dynamic simulation of land use and land cover and its effect on carbon storage in the Nanjing metropolitan circle under different development scenarios. Front. Ecol. Evol. 2023, 11, 1102015. [Google Scholar] [CrossRef]
- Tian, L.; Fu, W.X.; Tao, Y.; Li, M.Y.; Wang, L. Dynamics of the alpine timberline and its response to climate change in the Hengduan mountains over the period 1985–2015. Ecol. Indic. 2022, 135, 108589. [Google Scholar] [CrossRef]
- Ju, Y.L.; Ji, Y.J.; Huang, J.M.; Zhang, W.F. Inversion of forest aboveground biomass using combination of LiDAR and multispectral data. J. Nanjing For. Univ. 2022, 46, 58–68. [Google Scholar] [CrossRef]
- Zhu, Z.C.; Piao, S.L.; Myneni, R.B.; Huang, M.T.; Zeng, Z.Z.; Canadell, J.G.; Ciais, P.; Sitch, S.; Friedlingstein, P.; Arneth, A.; et al. Greening of the Earth and its drivers. Nat. Clim. Chang. 2016, 6, 791–795. [Google Scholar] [CrossRef]
- Winkler, A.J.; Myneni, R.B.; Hannart, A.; Sitch, S.; Haverd, V.; Lombardozzi, D.; Arora, V.K.; Pongratz, J.; Nabel, J.; Goll, D.S.; et al. Slowdown of the greening trend in natural vegetation with further rise in atmospheric CO2. Biogeosciences 2021, 18, 4985–5010. [Google Scholar] [CrossRef]
- Fu, W.X.; Tian, L.; Tao, Y.; Li, M.Y.; Guo, H.D. Spatiotemporal changes in the boreal forest in Siberia over the period 1985-2015 against the background of climate change. Earth Syst. Dyn. 2023, 14, 223–239. [Google Scholar] [CrossRef]
- Zhang, C.H.; Ju, W.M.; Chen, J.M.; Li, D.Q.; Wang, X.Q.; Fan, W.Y.; Li, M.S.; Zan, M. Mapping forest stand age in China using remotely sensed forest height and observation data. J. Geophys. Res. Biogeosci. 2014, 119, 1163–1179. [Google Scholar] [CrossRef]
- Liu, S.G.; Bond-Lamberty, B.; Hicke, J.A.; Vargas, R.; Zhao, S.Q.; Chen, J.; Edburg, S.L.; Hu, Y.M.; Liu, J.X.; McGuire, A.D.; et al. Simulating the impacts of disturbances on forest carbon cycling in North America: Processes, data, models, and challenges. J. Geophys. Res. Biogeosci. 2011, 116, G00K08. [Google Scholar] [CrossRef]
- Williams, C.A.; Collatz, G.J.; Masek, J.; Goward, S.N. Carbon consequences of forest disturbance and recovery across the conterminous United States. Glob. Biogeochem. Cycl. 2012, 26, GB1005. [Google Scholar] [CrossRef]
- Woodbury, P.B.; Smith, J.E.; Heath, L.S. Carbon sequestration in the US forest sector from 1990 to 2010. For. Ecol. Manag. 2007, 241, 14–27. [Google Scholar] [CrossRef]
- Goulden, M.L.; McMillan, A.M.S.; Winston, G.C.; Rocha, A.V.; Manies, K.L.; Harden, J.W.; Bond-Lamberty, B.P. Patterns of NPP, GPP, respiration, and NEP during boreal forest succession. Glob. Chang. Biol. 2011, 17, 855–871. [Google Scholar] [CrossRef]
- Poorter, L.; Bongers, F.; Aide, T.M.; Almeyda Zambrano, A.M.; Balvanera, P.; Becknell, J.M.; Boukili, V.; Brancalion, P.H.S.; Broadbent, E.N.; Chazdon, R.L.; et al. Biomass resilience of Neotropical secondary forests. Nature 2016, 530, 211–214. [Google Scholar] [CrossRef]
- Zhang, Y.; Yao, Y.T.; Wang, X.H.; Liu, Y.W.; Piao, S.L. Mapping spatial distribution of forest age in China. Earth Space Sci. 2017, 4, 108–116. [Google Scholar] [CrossRef]
- Besnard, S.; Koirala, S.; Santoro, M.; Weber, U.; Nelson, J.; Gutter, J.; Herault, B.; Kassi, J.; N’Guessan, A.; Neigh, C.; et al. Mapping global forest age from forest inventories, biomass and climate data. Earth Syst. Sci. Data 2021, 13, 4881–4896. [Google Scholar] [CrossRef]
- Zhang, F.M.; Chen, J.M.; Pan, Y.D.; Birdsey, R.A.; Shen, S.H.; Ju, W.M.; He, L.M. Attributing carbon changes in conterminous U.S. forests to disturbance and non-disturbance factors from 1901 to 2010 (vol. 117, G02021, 2012). J. Geophys. Res. Biogeosci. 2013, 118, 1345–1346. [Google Scholar] [CrossRef]
- Fei, S.L.; Morin, R.S.; Oswalt, C.M.; Liebhold, A.M. Biomass losses resulting from insect and disease invasions in US forests. Proc. Natl. Acad. Sci. USA 2019, 116, 17371–17376. [Google Scholar] [CrossRef] [PubMed]
- Taylor, A.H. Fire disturbance and forest structure in an old-growth Pinus ponderosa forest, southern Cascades, USA. J. Veg. Sci. 2010, 21, 561–572. [Google Scholar] [CrossRef]
- Qian, C.H.; Zhao, Y.C.; Li, M.Y.; Li, T. Dynamic analyses of forest ecological functions based on fixed plot data of continuous forest resources inventories from 1979 to 2012 in Guangzhou. J. Nanjing For. Univ. 2022, 46, 205–212. [Google Scholar] [CrossRef]
- Xu, E.Y.; Nie, Y.; Rui, X.D. Analysis on the forest land use efficiency changes based on forest resource inventory data. J. Nanjing For. Univ. 2022, 46, 213–220. [Google Scholar] [CrossRef]
- Wang, S.; Chen, J.M.; Ju, W.M.; Feng, X.; Chen, M.; Chen, P.; Yu, G. Carbon sinks and sources in China’s forests during 1901–2001. J. Environ. Manag. 2007, 85, 524–537. [Google Scholar] [CrossRef]
- Ju, W.M.; Chen, J.M.; Harvey, D.; Wang, S. Future carbon balance of China’s forests under climate change and increasing CO2. J. Environ. Manag. 2007, 85, 538–562. [Google Scholar] [CrossRef]
- Wang, S.Q.; Zhou, L.; Chen, J.M.; Ju, W.M.; Feng, X.F.; Wu, W.X. Relationships between net primary productivity and stand age for several forest types and their influence on China’s carbon balance. J. Environ. Manag. 2011, 92, 1651–1662. [Google Scholar] [CrossRef] [PubMed]
- Dai, M.; Zhou, T.; Yang, L.L.; Jia, G.S. Spatial pattern of forest ages in China retrieved from national-level inventory and remote sensing imageries. Geogr. Res. 2011, 30, 172–184. [Google Scholar]
- Rendenieks, Z.; Nita, M.D.; Nikodemus, O.; Radeloff, V.C. Half a century of forest cover change along the Latvian-Russian border captured by object-based image analysis of Corona and Landsat TM/OLI data. Remote Sens. Environ. 2020, 249, 112010. [Google Scholar] [CrossRef]
- Huang, C.Q.; Coward, S.N.; Masek, J.G.; Thomas, N.; Zhu, Z.L.; Vogelmann, J.E. An automated approach for reconstructing recent forest disturbance history using dense Landsat time series stacks. Remote Sens. Environ. 2010, 114, 183–198. [Google Scholar] [CrossRef]
- DeVries, B.; Verbesselt, J.; Kooistra, L.; Herold, M. Robust monitoring of small-scale forest disturbances in a tropical montane forest using Landsat time series. Remote Sens. Environ. 2015, 161, 107–121. [Google Scholar] [CrossRef]
- Kennedy, R.E.; Yang, Z.G.; Cohen, W.B. Detecting trends in forest disturbance and recovery using yearly Landsat time series: 1. LandTrendr—Temporal segmentation algorithms. Remote Sens. Environ. 2010, 114, 2897–2910. [Google Scholar] [CrossRef]
- Shen, J.N.; Chen, G.S.; Hua, J.W.; Huang, S.; Ma, J.M. Contrasting Forest Loss and Gain Patterns in Subtropical China Detected Using an Integrated LandTrendr and Machine-Learning Method. Remote Sens. 2022, 14, 3238. [Google Scholar] [CrossRef]
- Wulder, M.A.; Roy, D.P.; Radeloff, V.C.; Loveland, T.R.; Anderson, M.C.; Johnson, D.M.; Healey, S.; Zhu, Z.; Scambos, T.A.; Pahlevan, N.; et al. Fifty years of Landsat science and impacts. Remote Sens. Environ. 2022, 280, 113195. [Google Scholar] [CrossRef]
- Piao, S.L.; Yue, C.; Ding, J.Z.; Guo, Z.T. The Role of Terrestrial Ecosystem Carbon Sinks in the “Carbon Neutrality” Goal. Scientia Sinica 2022, 52, 1419–1442. [Google Scholar]
- Ermida, S.L.; Soares, P.; Mantas, V.; Gottsche, F.M.; Trigo, I.E. Google Earth Engine Open-Source Code for Land Surface Temperature Estimation from the Landsat Series. Remote Sens. 2020, 12, 1471. [Google Scholar] [CrossRef]
- Gorelick, N.; Hancher, M.; Dixon, M.; Ilyushchenko, S.; Thau, D.; Moore, R. Google Earth Engine: Planetary-scale geospatial analysis for everyone. Remote Sens. Environ. 2017, 202, 18–27. [Google Scholar] [CrossRef]
- Kumar, L.; Mutanga, O. Google Earth Engine Applications Since Inception: Usage, Trends, and Potential. Remote Sens. 2018, 10, 1509. [Google Scholar] [CrossRef]
- Masek, J.G.; Vermote, E.F.; Saleous, N.E.; Wolfe, R.; Hall, F.G.; Huemmrich, K.F.; Gao, F.; Kutler, J.; Lim, T.K. A Landsat surface reflectance dataset for North America, 1990–2000. IEEE Geosci. Remote Sens. Lett. 2006, 3, 68–72. [Google Scholar] [CrossRef]
- Vermote, E.; Justice, C.; Claverie, M.; Franch, B. Preliminary analysis of the performance of the Landsat 8/OLI land surface reflectance product. Remote Sens. Environ. 2016, 185, 46–56. [Google Scholar] [CrossRef]
- Foga, S.; Scaramuzza, P.L.; Guo, S.; Zhu, Z.; Dilley, R.D.; Beckmann, T.; Schmidt, G.L.; Dwyer, J.L.; Hughes, M.J.; Laue, B. Cloud detection algorithm comparison and validation for operational Landsat data products. Remote Sens. Environ. 2017, 194, 379–390. [Google Scholar] [CrossRef]
- Goulden, M.L.; Bales, R.C. California forest die-off linked to multi-year deep soil drying in 2012–2015 drought. Nat. Geosci. 2019, 12, 632–637. [Google Scholar] [CrossRef]
- Flood, N. Continuity of Reflectance Data between Landsat-7 ETM+ and Landsat-8 OLI, for Both Top-of-Atmosphere and Surface Reflectance: A Study in the Australian Landscape. Remote Sens. 2014, 6, 7952–7970. [Google Scholar] [CrossRef]
- He, T.; Liang, S.L.; Wang, D.D.; Cao, Y.F.; Gao, F.; Yu, Y.Y.; Feng, M. Evaluating land surface albedo estimation from Landsat MSS, TM, ETM plus, and OLI data based on the unified direct estimation approach. Remote Sens. Environ. 2018, 204, 181–196. [Google Scholar] [CrossRef]
- Roy, D.P.; Kovalskyy, V.; Zhang, H.K.; Vermote, E.F.; Yan, L.; Kumar, S.S.; Egorov, A. Characterization of Landsat-7 to Landsat-8 reflective wavelength and normalized difference vegetation index continuity. Remote Sens. Environ. 2016, 185, 57–70. [Google Scholar] [CrossRef]
- Cohen, W.B.; Yang, Z.Q.; Heale, S.P.; Kennedy, R.E.; Gorelic, N. A LandTrendr multispectral ensemble for forest disturbance detection. Remote Sens. Environ. 2018, 205, 131–140. [Google Scholar] [CrossRef]
- Guo, J.; Gong, P. The Potential of Spectral Indices in Detecting Various Stages of Afforestation over the Loess Plateau Region of China. Remote Sens. 2018, 10, 1492. [Google Scholar] [CrossRef]
- Yang, J.; Huang, X. The 30 m annual land cover dataset and its dynamics in China from 1990 to 2019. Earth Syst. Sci. Data 2021, 13, 3907–3925. [Google Scholar] [CrossRef]
- Li, C.C.; Wang, J.; Hu, L.Y.; Yu, L.; Clinton, N.; Huang, H.B.; Yang, J.; Gong, P. A Circa 2010 Thirty Meter Resolution Forest Map for China. Remote Sens. 2014, 6, 5325–5343. [Google Scholar] [CrossRef]
- Potapov, P.; Li, X.Y.; Hernandez-Serna, A.; Tyukavina, A.; Hansen, M.C.; Kommareddy, A.; Pickens, A.; Turubanova, S.; Tang, H.; Silva, C.E.; et al. Mapping global forest canopy height through integration of GEDI and Landsat data. Remote Sens. Environ. 2021, 253, 112165. [Google Scholar] [CrossRef]
- Kennedy, R.E.; Yang, Z.Q.; Gorelick, N.; Braaten, J.; Cavalcante, L.; Cohen, W.B.; Healey, S. Implementation of the LandTrendr Algorithm on Google Earth Engine. Remote Sens. 2018, 10, 691. [Google Scholar] [CrossRef]
- de Jong, S.M.; Shen, Y.C.; de Vries, J.; Bijnaar, G.; van Maanen, B.; Augustinus, P.; Verweij, P. Mapping mangrove dynamics and colonization patterns at the Suriname coast using historic satellite data and the LandTrendr algorithm. Int. J. Appl. Earth Obs. 2021, 97, 102293. [Google Scholar] [CrossRef]
- Du, Z.R.; Yu, L.; Yang, J.Y.; Xu, Y.D.; Chen, B.; Peng, S.S.; Zhang, T.T.; Fu, H.H.; Harris, N.; Gong, P. A global map of planting years of plantations. Sci. Data 2022, 9, 141. [Google Scholar] [CrossRef]
- Yu, L.; Wang, J.; Li, X.; Li, C.; Zhao, Y.; Gong, P. A multi-resolution global land cover dataset through multisource data aggregation. Sci. China Earth Sci. 2014, 57, 2317–2329. [Google Scholar] [CrossRef]
- Liu, C.; Wang, S.; Liu, H.; Zhu, W.Q. Why did the 1980s’ reform of collective forestland tenure in southern China fail? Forest Policy Econ. 2017, 83, 131–141. [Google Scholar] [CrossRef]
- Xian, Y.Y.; Lu, Y.Q.; Musyimi, Z.; Liu, G.L. Tracking the Role of Policies and Economic Factors in Driving the Forest Change Trajectories within the Guangdong-Hongkong-Macao Region of China: A Remote Sensing Perspective. Land 2021, 10, 87. [Google Scholar] [CrossRef]
- Wei, X. Current situation and problems of fast-growing and high-yielding plantation in China. For. Inventory Plan. 2021, 35, 115–118. [Google Scholar]
- Xiao, J.F. Satellite evidence for significant biophysical consequences of the “Grain for Green” Program on the Loess Plateau in China. J. Geophys. Res. Biogeosci. 2014, 119, 2261–2275. [Google Scholar] [CrossRef]
- Cao, S.X.; Chen, L.; Liu, Z.D. An Investigation of Chinese Attitudes toward the Environment: Case Study Using the Grain for Green Project. Ambio 2009, 38, 55–64. [Google Scholar] [CrossRef] [PubMed]
- Yang, X.H.; Zhao, Y.C.; Zhu, S.W.; Yang, X.T.; Wang, L.Y.; Li, Z.Q.; Liu, Z.H.; Yang, S.L.; Xiong, D.G.; Wang, G.X.; et al. Guangdong Statistical Yearbook; Guangdong Yearbook Press: Guangdong, China, 2021. [Google Scholar]
- Pan, Y.; Chen, J.M.; Birdsey, R.; McCullough, K.; He, L.; Deng, F. Age structure and disturbance legacy of North American forests. Biogeosciences 2011, 8, 715–732. [Google Scholar] [CrossRef]
- Senf, C.; Lastovicka, J.; Okujeni, A.; Heurich, M.; van der Linden, S. A generalized regression-based unmixing model for mapping forest cover fractions throughout three decades of Landsat data. Remote Sens. Environ. 2020, 240, 111691. [Google Scholar] [CrossRef]
- Zhu, Z.; Woodcock, C.E. Object-based cloud and cloud shadow detection in Landsat imagery. Remote Sens. Environ. 2012, 118, 83–94. [Google Scholar] [CrossRef]
- Simard, M.; Pinto, N.; Fisher, J.B.; Baccini, A. Mapping forest canopy height globally with spaceborne lidar. J. Geophys. Res-Biogeosci. 2011, 116, G04021. [Google Scholar] [CrossRef]


| Forest Types | Forest Age Formula | Application Conditions |
|---|---|---|
| EBF | A = 778.8843 − 121.9512 ln(640.7587 − 1.0782 H1.7549) | 8.5703 < H < 38.0815 |
| DBF | A = 8.2131/(5.7062 − 1.6733 ln(H))0.899 | 0 < H < 30.2697 |
| ENF | A = 28.1507 − 12.4533 ln(67.4215 H−1.2521 − 1) | 4.3864 < H < 28.8792 |
| MF | A = 25.0465 − 4.89 ln(65.012 H−1.3619 − 1) | 0.4966 < H < 21.4399 |
| A = 21.4927/(4.4971 − 1.3569 ln(H))1.5891 | 0 < H < 27.5016 |
| Age of Disturbed Forest (Year) | Area (km2) | Proportion of Disturbed Forest Area (%) |
|---|---|---|
| 1–5 | 8440.91 | 24.45 |
| 6–10 | 2333.12 | 6.76 |
| 11–20 | 7861.63 | 22.77 |
| 21–30 | 12,669.52 | 36.69 |
| 31–40 | 3222.60 | 9.33 |
| Total | 34,527.78 | 100 |
| Age of Non-Disturbed Forest (Year) | Area (km2) | Proportion of Non-Disturbed Forest Area (%) |
|---|---|---|
| 1–5 | 20,431.55 | 25.71 |
| 6–10 | 21,154.50 | 26.62 |
| 11–20 | 19,504.53 | 24.55 |
| 21–30 | 11,215.77 | 14.12 |
| 31–40 | 3725.30 | 4.69 |
| 41–50 | 1392.82 | 1.75 |
| 51–60 | 663.29 | 0.83 |
| 61–70 | 555.37 | 0.70 |
| 71–80 | 13.51 | 0.02 |
| >80 | 802.76 | 1.01 |
| Total | 79,459.40 | 100 |
Disclaimer/Publisher’s Note: The statements, opinions and data contained in all publications are solely those of the individual author(s) and contributor(s) and not of MDPI and/or the editor(s). MDPI and/or the editor(s) disclaim responsibility for any injury to people or property resulting from any ideas, methods, instructions or products referred to in the content. |
© 2023 by the authors. Licensee MDPI, Basel, Switzerland. This article is an open access article distributed under the terms and conditions of the Creative Commons Attribution (CC BY) license (https://creativecommons.org/licenses/by/4.0/).
Share and Cite
Tian, L.; Liao, L.; Tao, Y.; Wu, X.; Li, M. Forest Age Mapping Using Landsat Time-Series Stacks Data Based on Forest Disturbance and Empirical Relationships between Age and Height. Remote Sens. 2023, 15, 2862. https://doi.org/10.3390/rs15112862
Tian L, Liao L, Tao Y, Wu X, Li M. Forest Age Mapping Using Landsat Time-Series Stacks Data Based on Forest Disturbance and Empirical Relationships between Age and Height. Remote Sensing. 2023; 15(11):2862. https://doi.org/10.3390/rs15112862
Chicago/Turabian StyleTian, Lei, Longtao Liao, Yu Tao, Xiaocan Wu, and Mingyang Li. 2023. "Forest Age Mapping Using Landsat Time-Series Stacks Data Based on Forest Disturbance and Empirical Relationships between Age and Height" Remote Sensing 15, no. 11: 2862. https://doi.org/10.3390/rs15112862