


AFL-Net: Attentional Feature Learning Network for Building Extraction from Remote Sensing Images

 , ,
, ,  ,
,
Abstract
:1. Introduction
2. Methodology
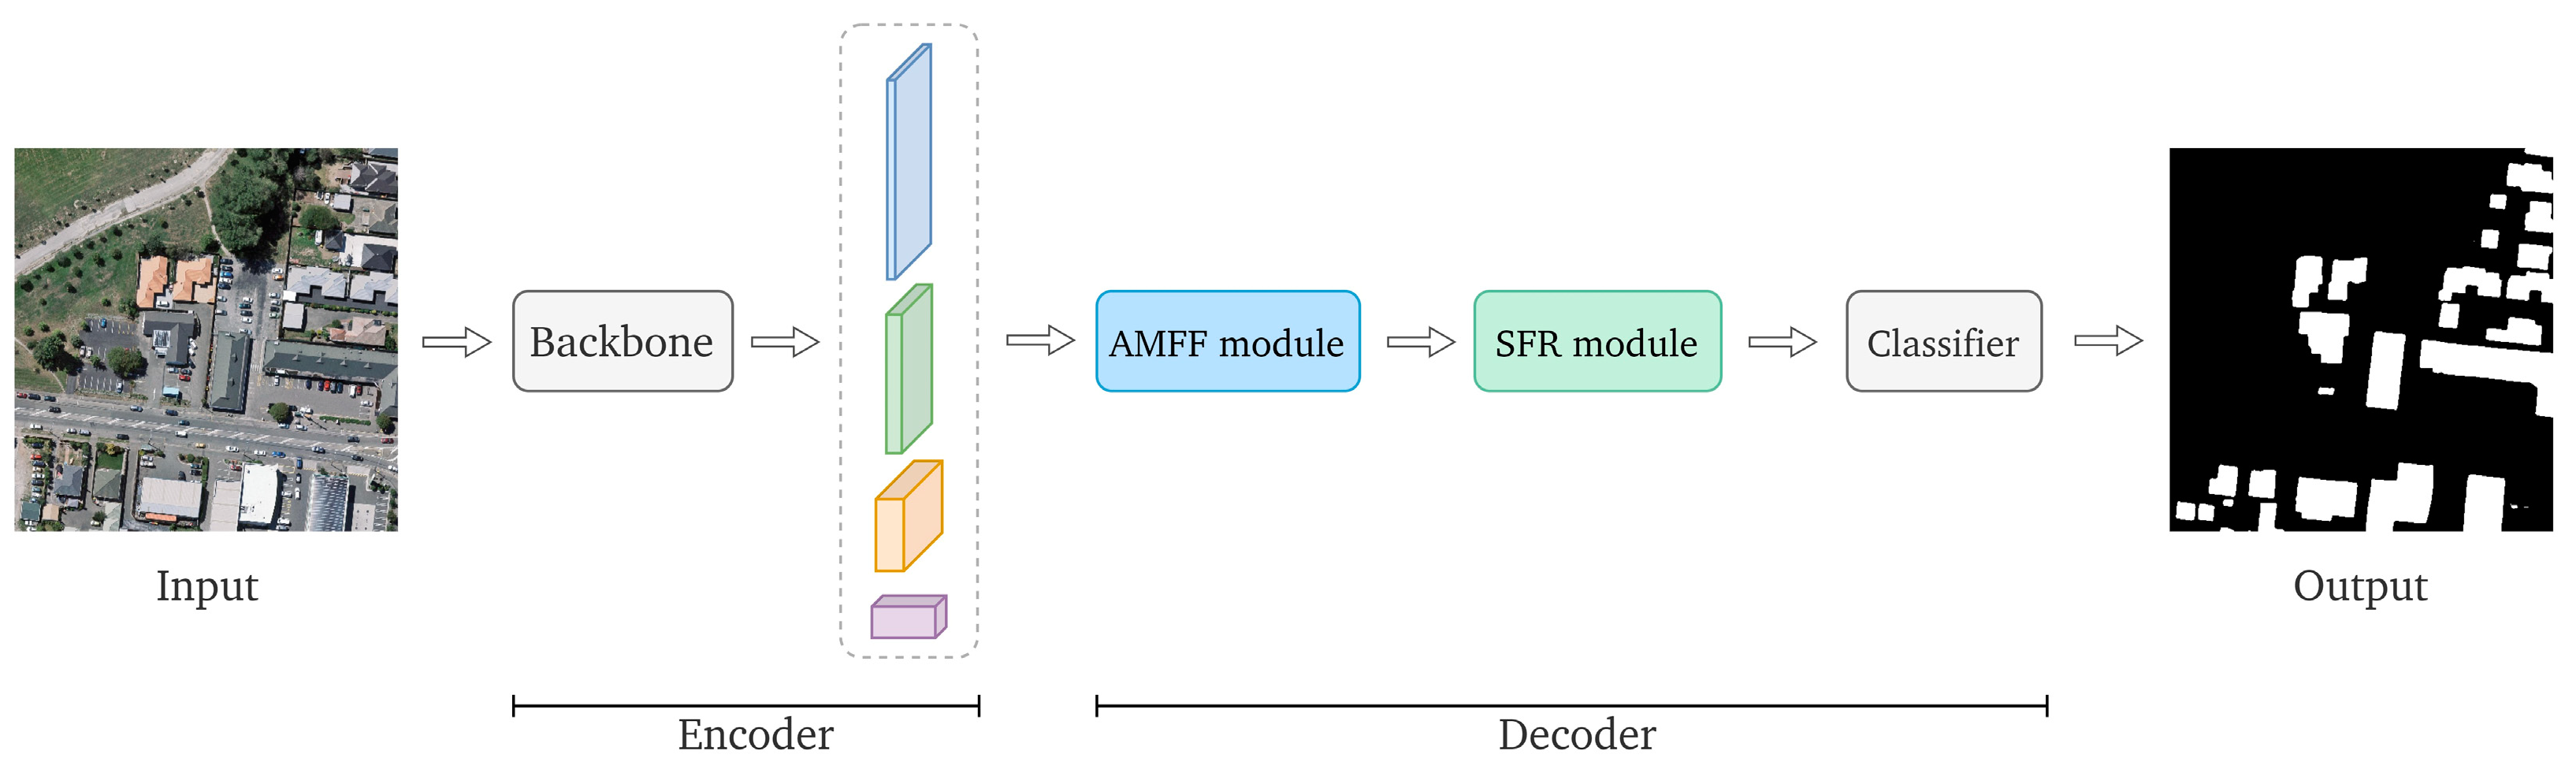
2.1. AFL-Net Architecture
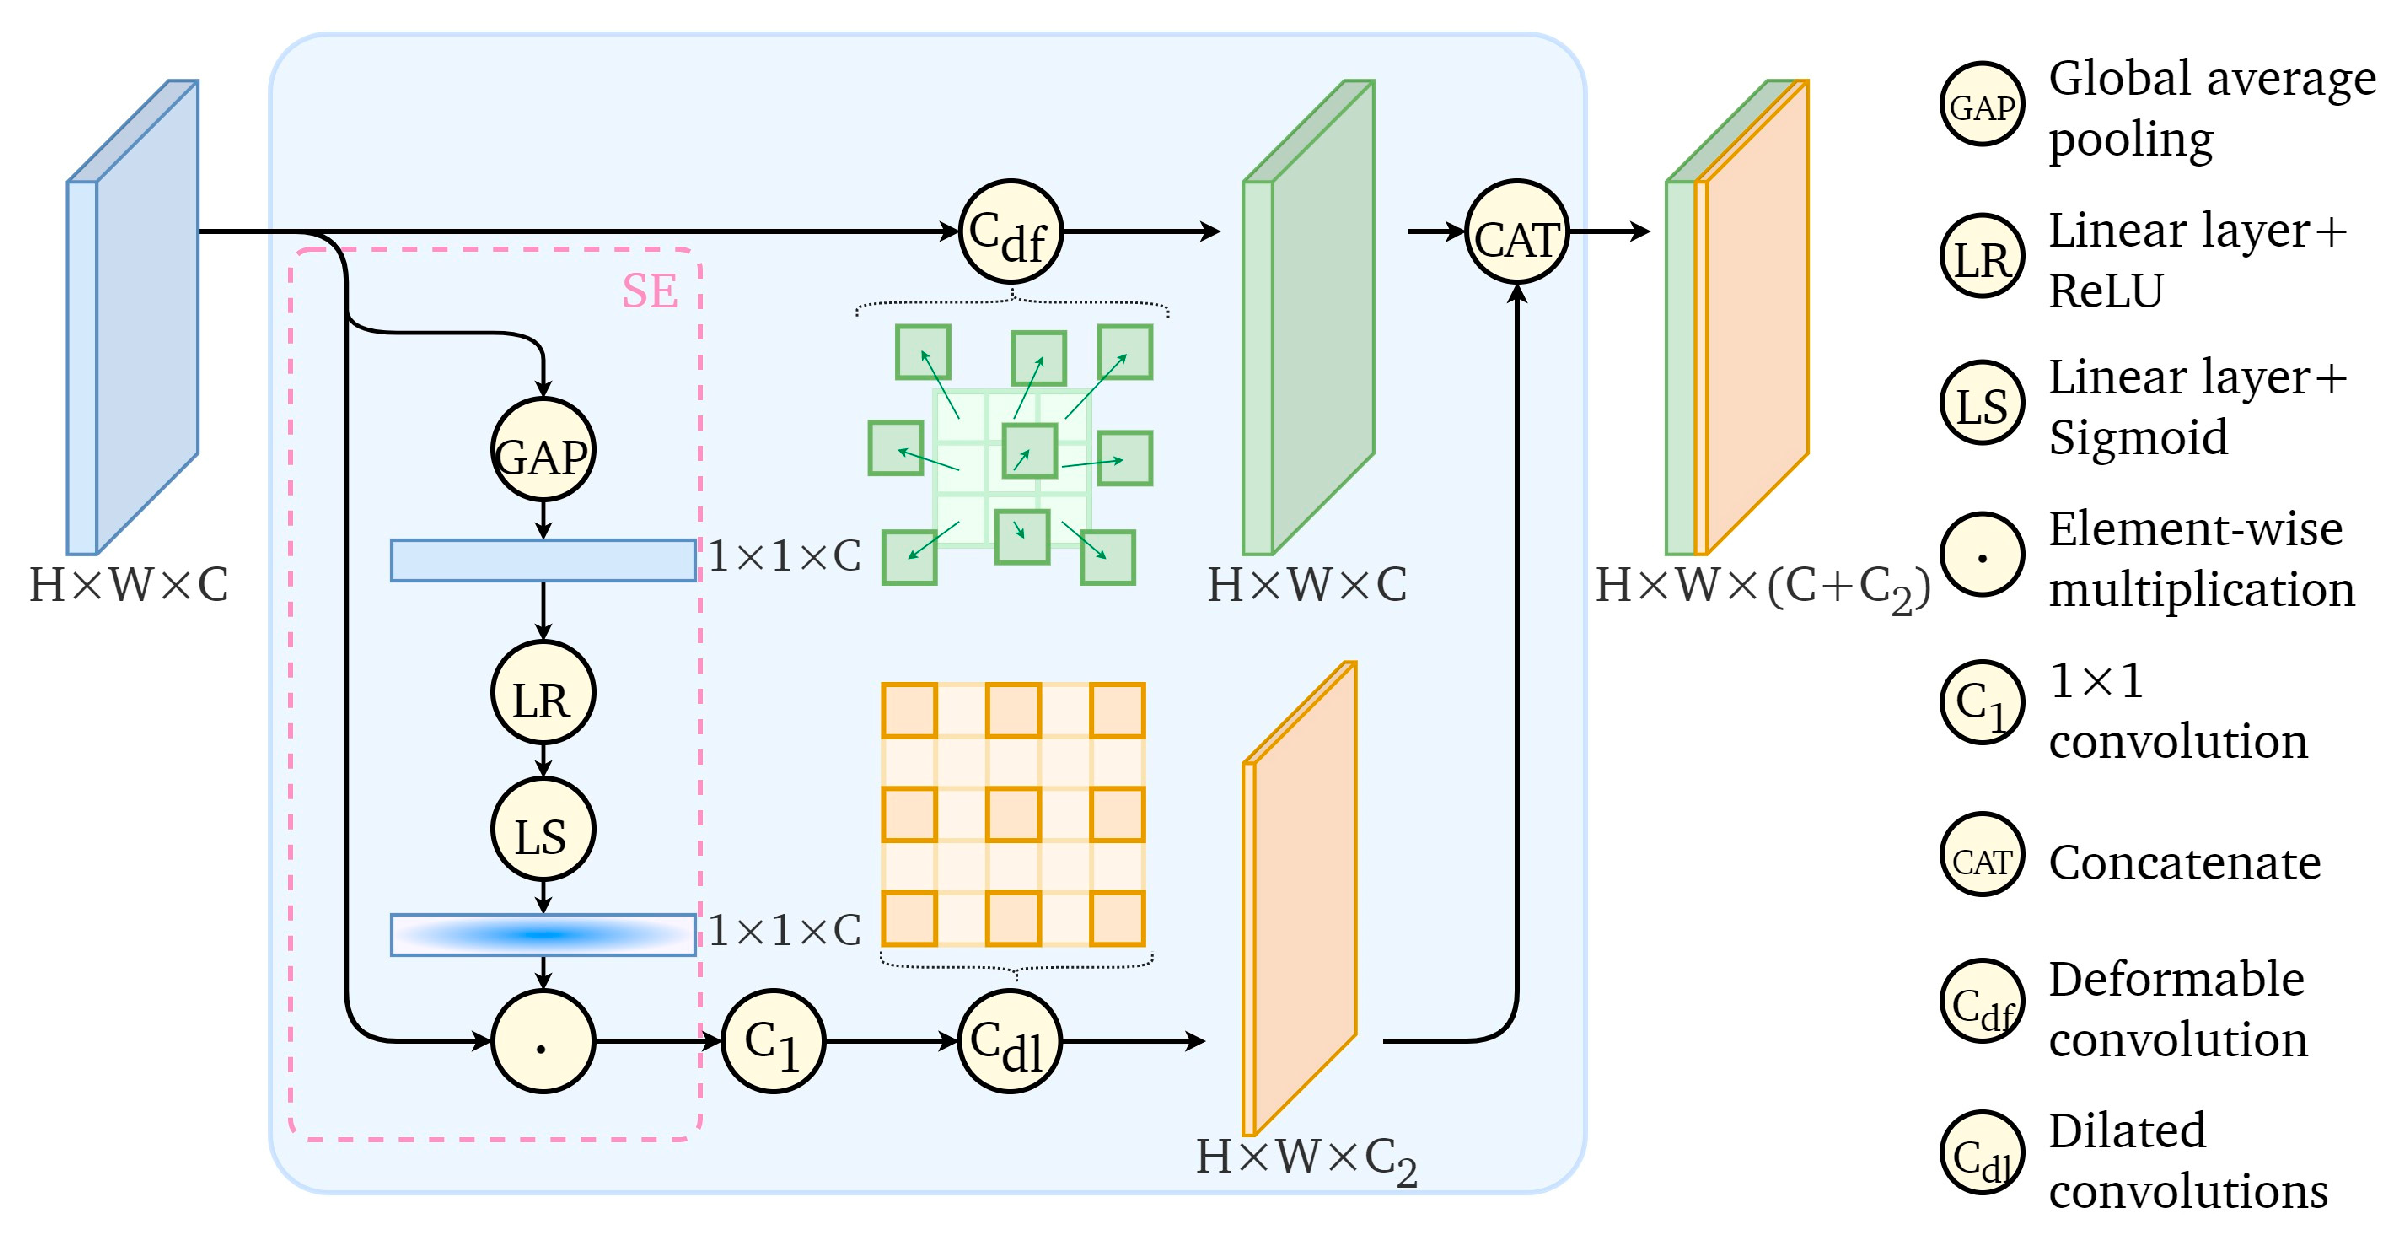
2.2. AMFF Module
2.3. SFR Module
3. Experiments
3.1. Dataset Details
3.2. Experimental Settings
3.3. Evaluation Metrics
4. Results and Discussion
4.1. Comparative Experiments
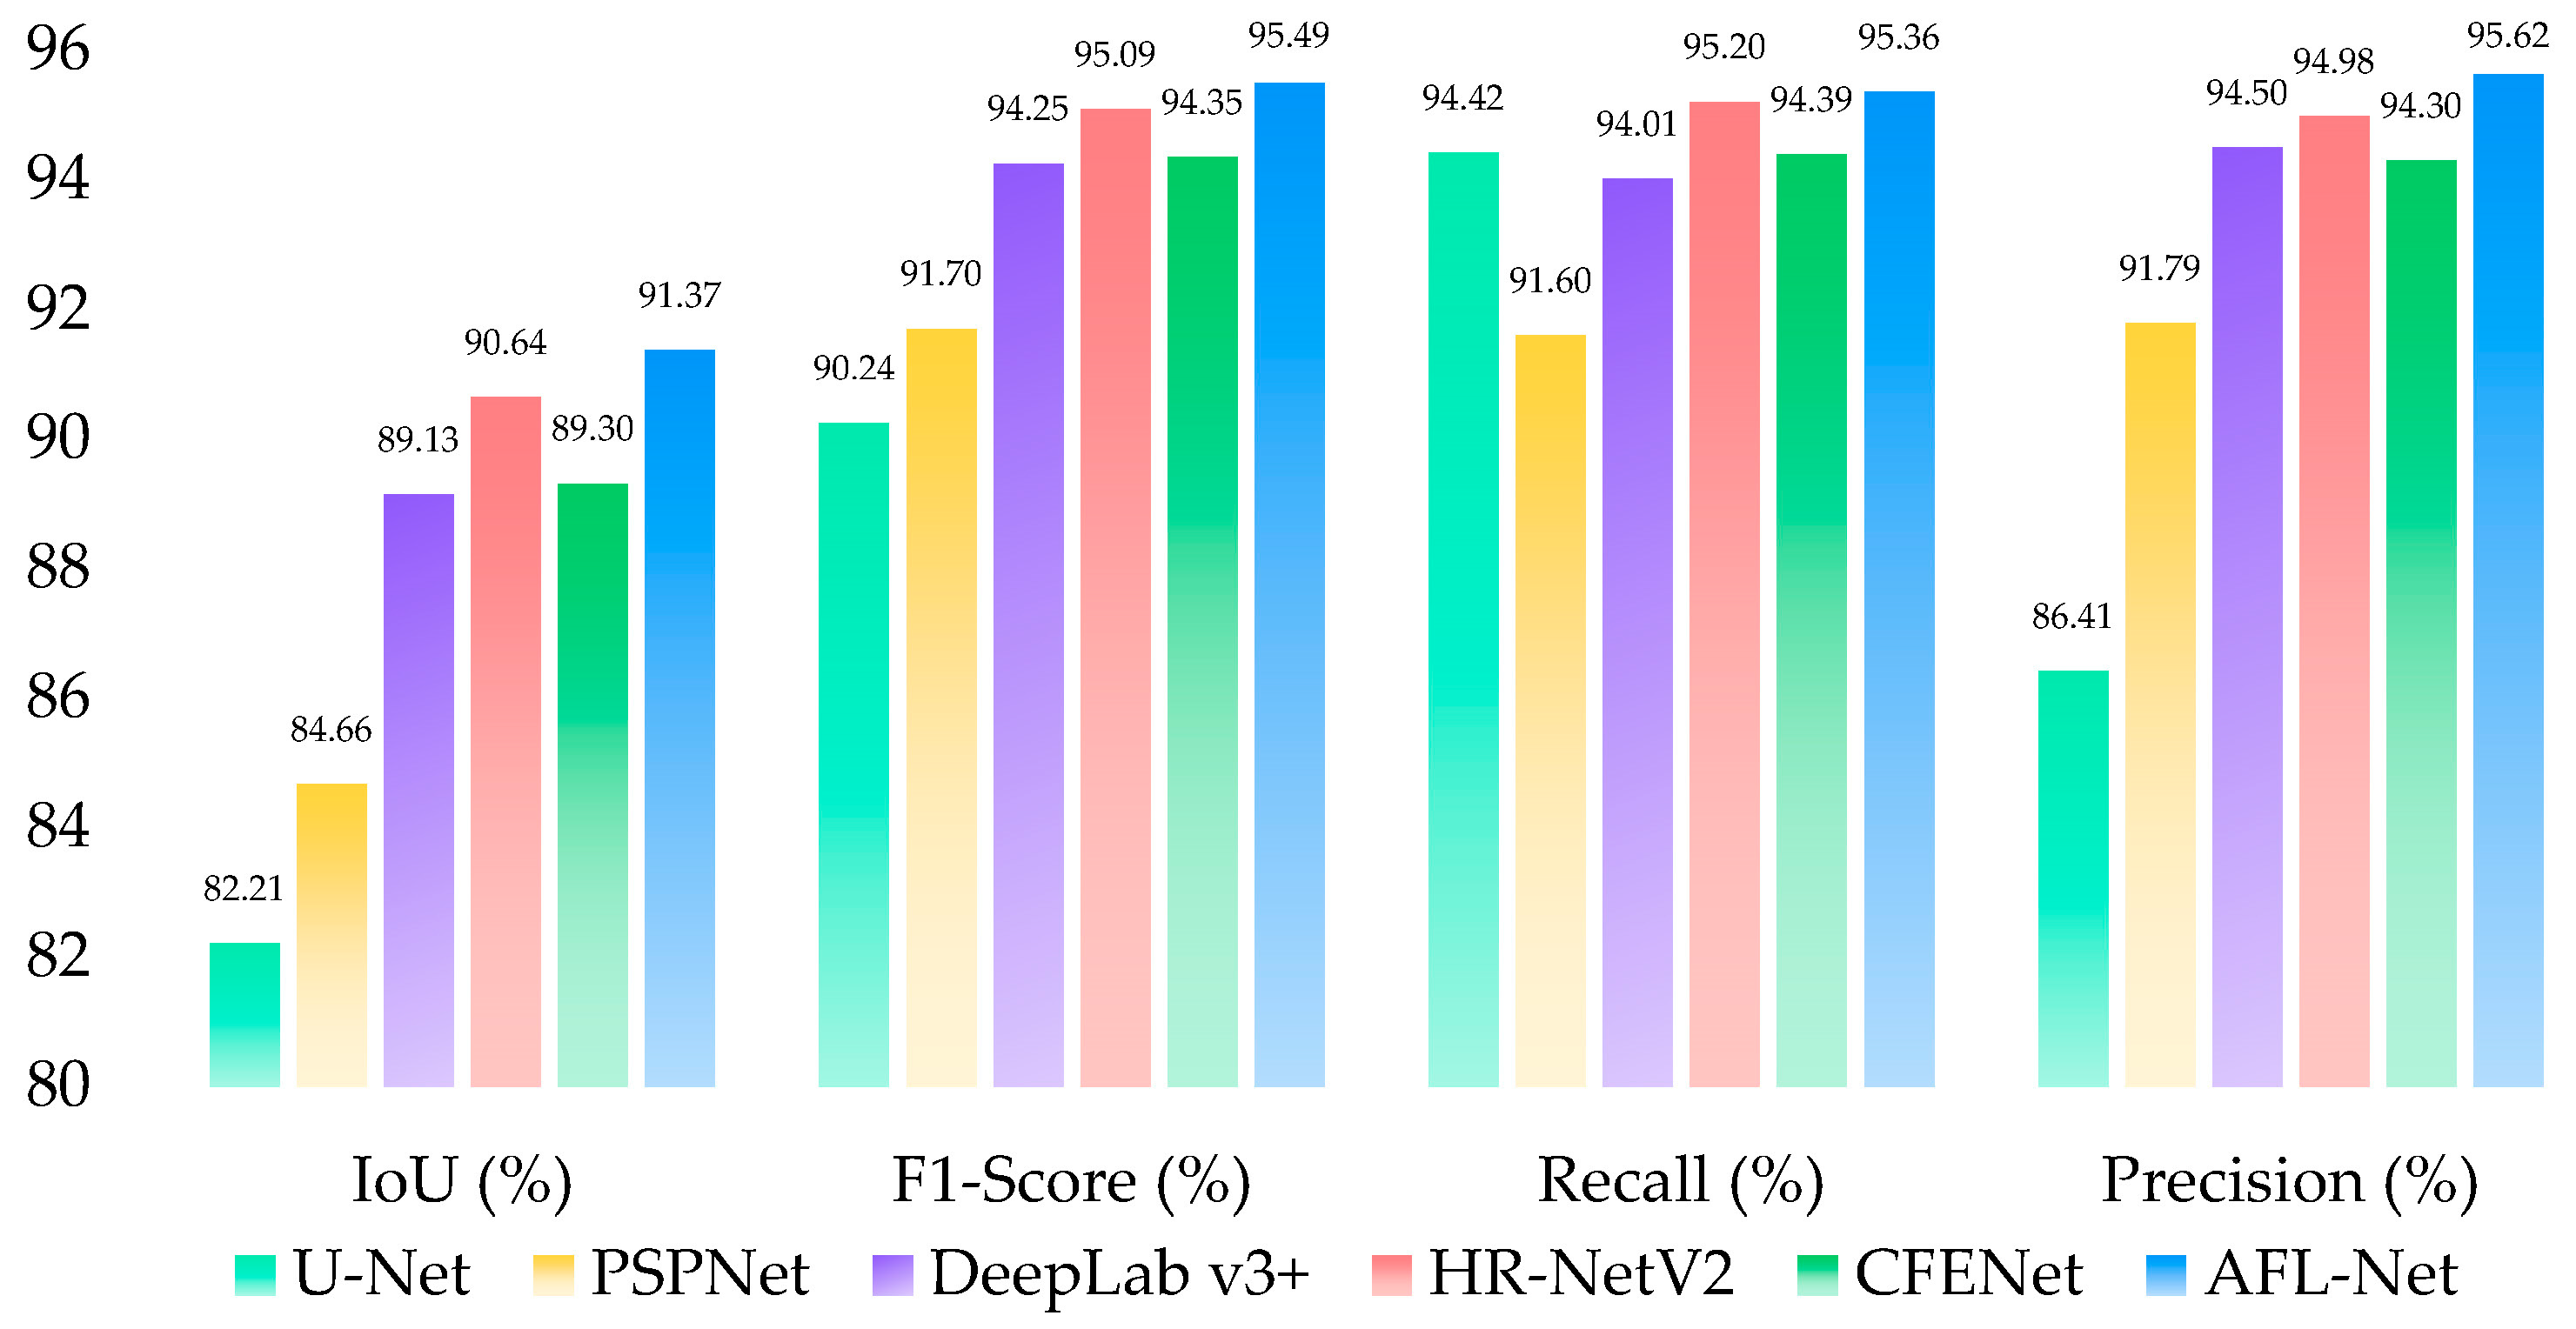
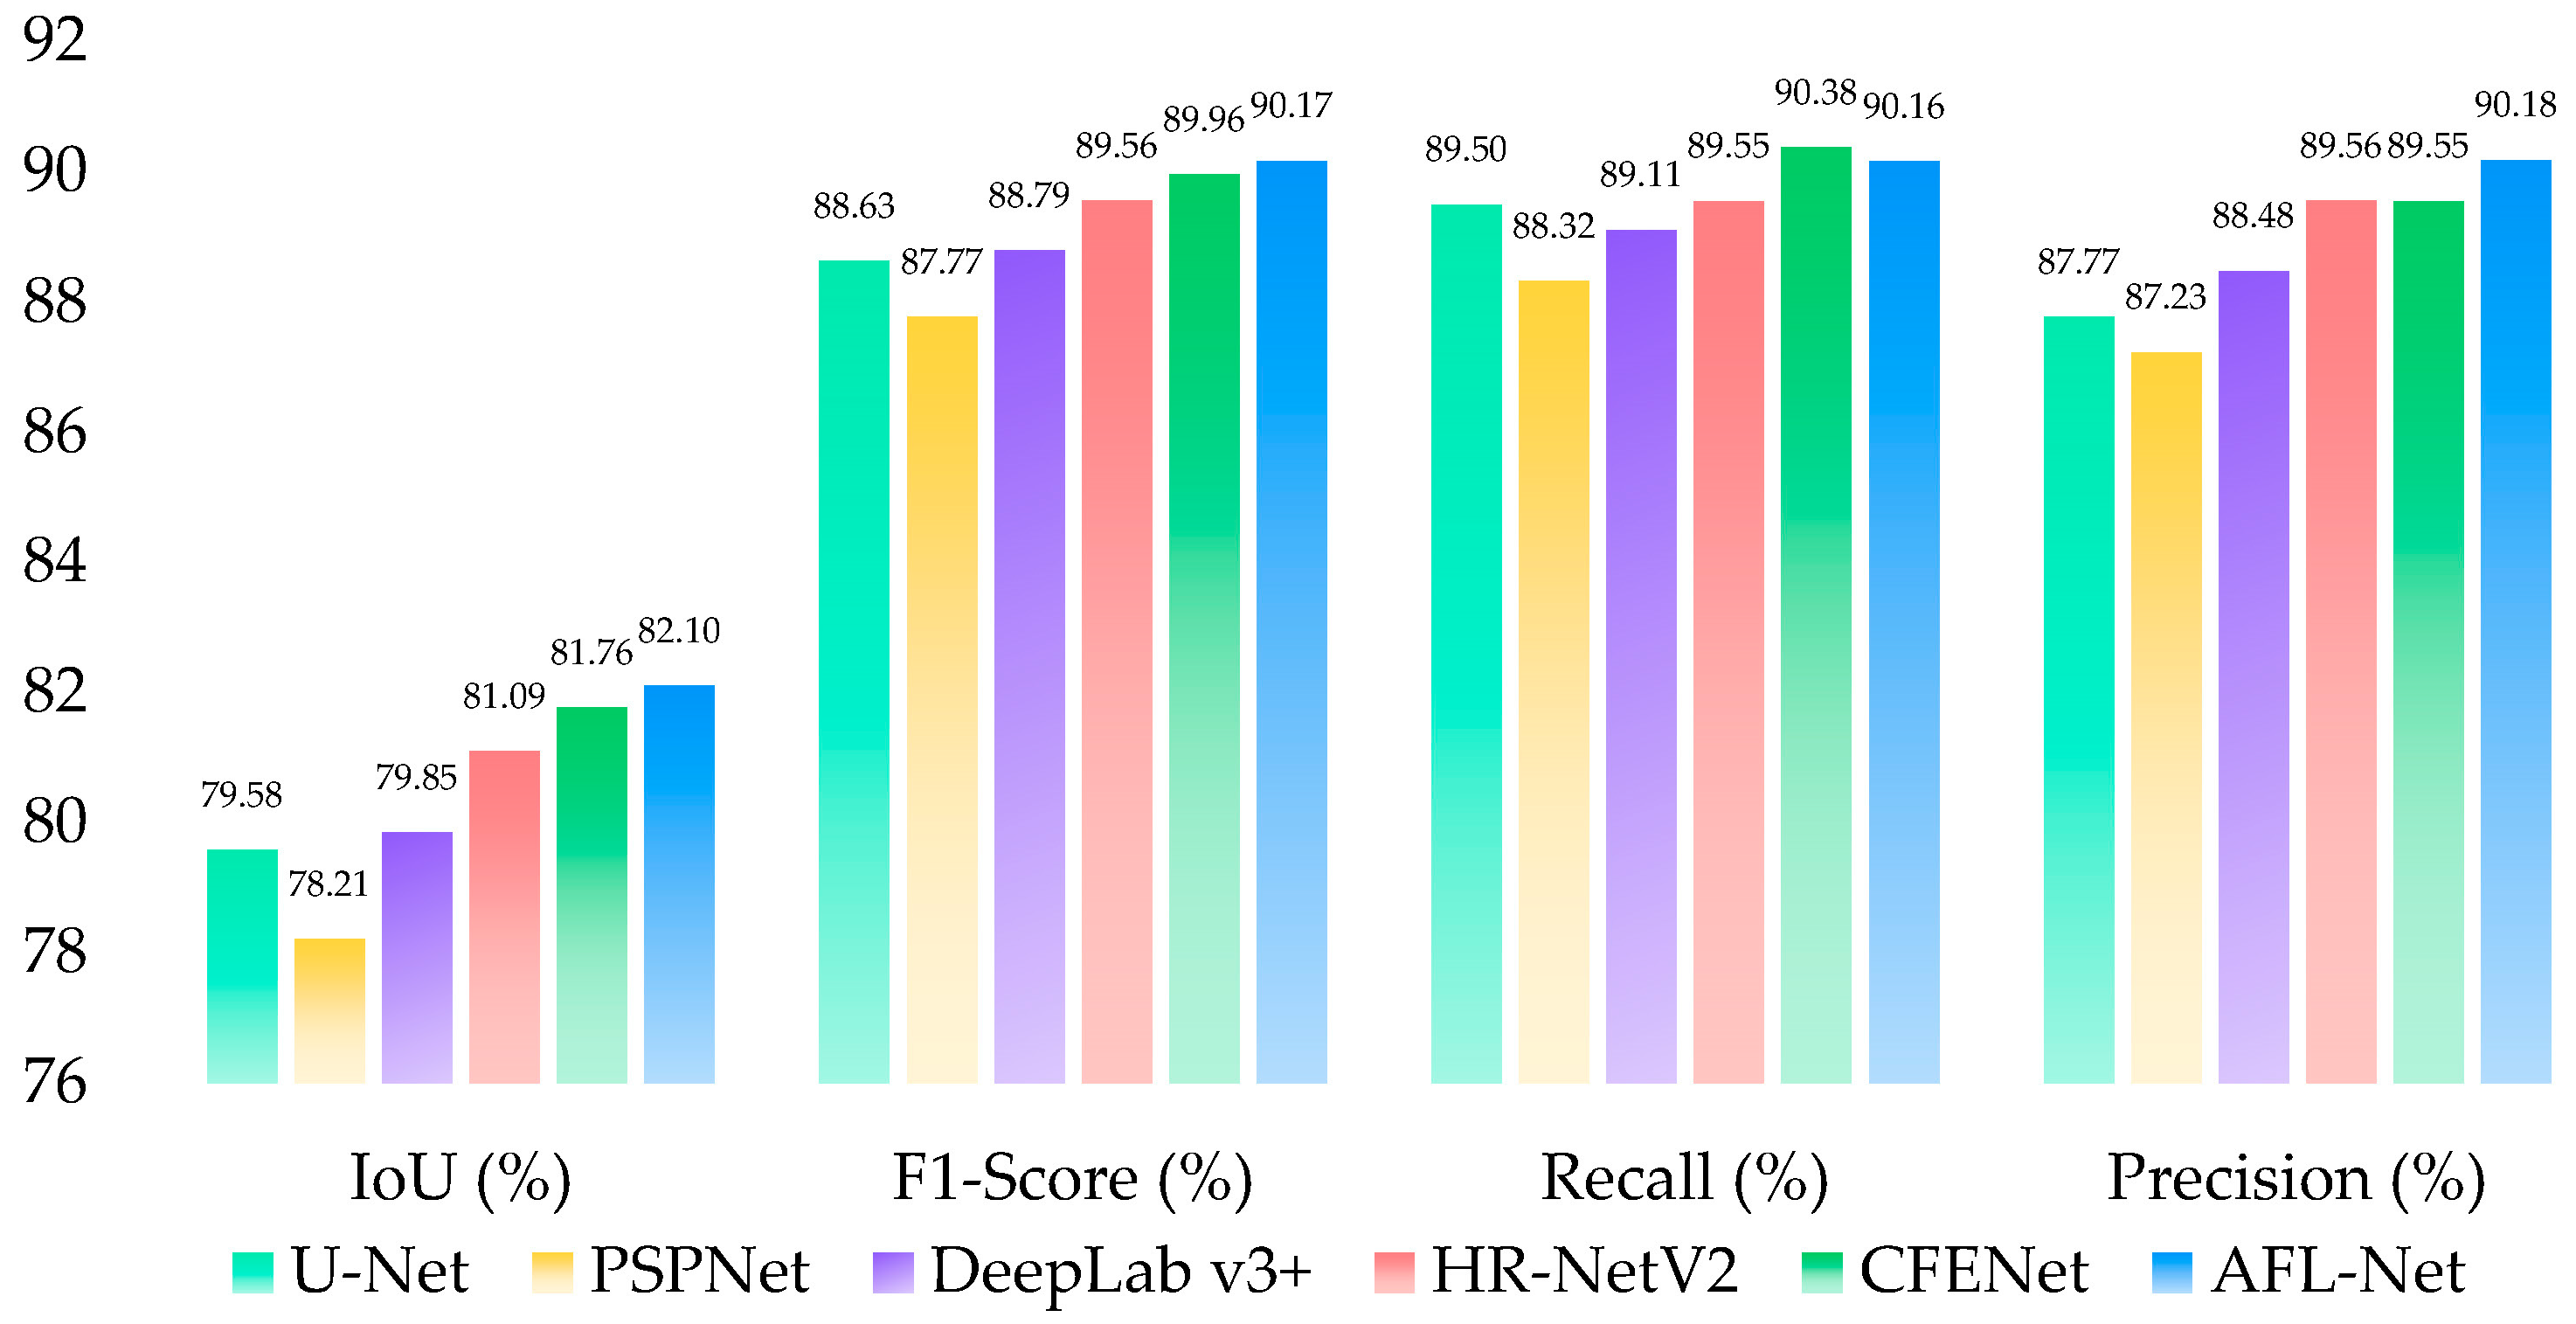
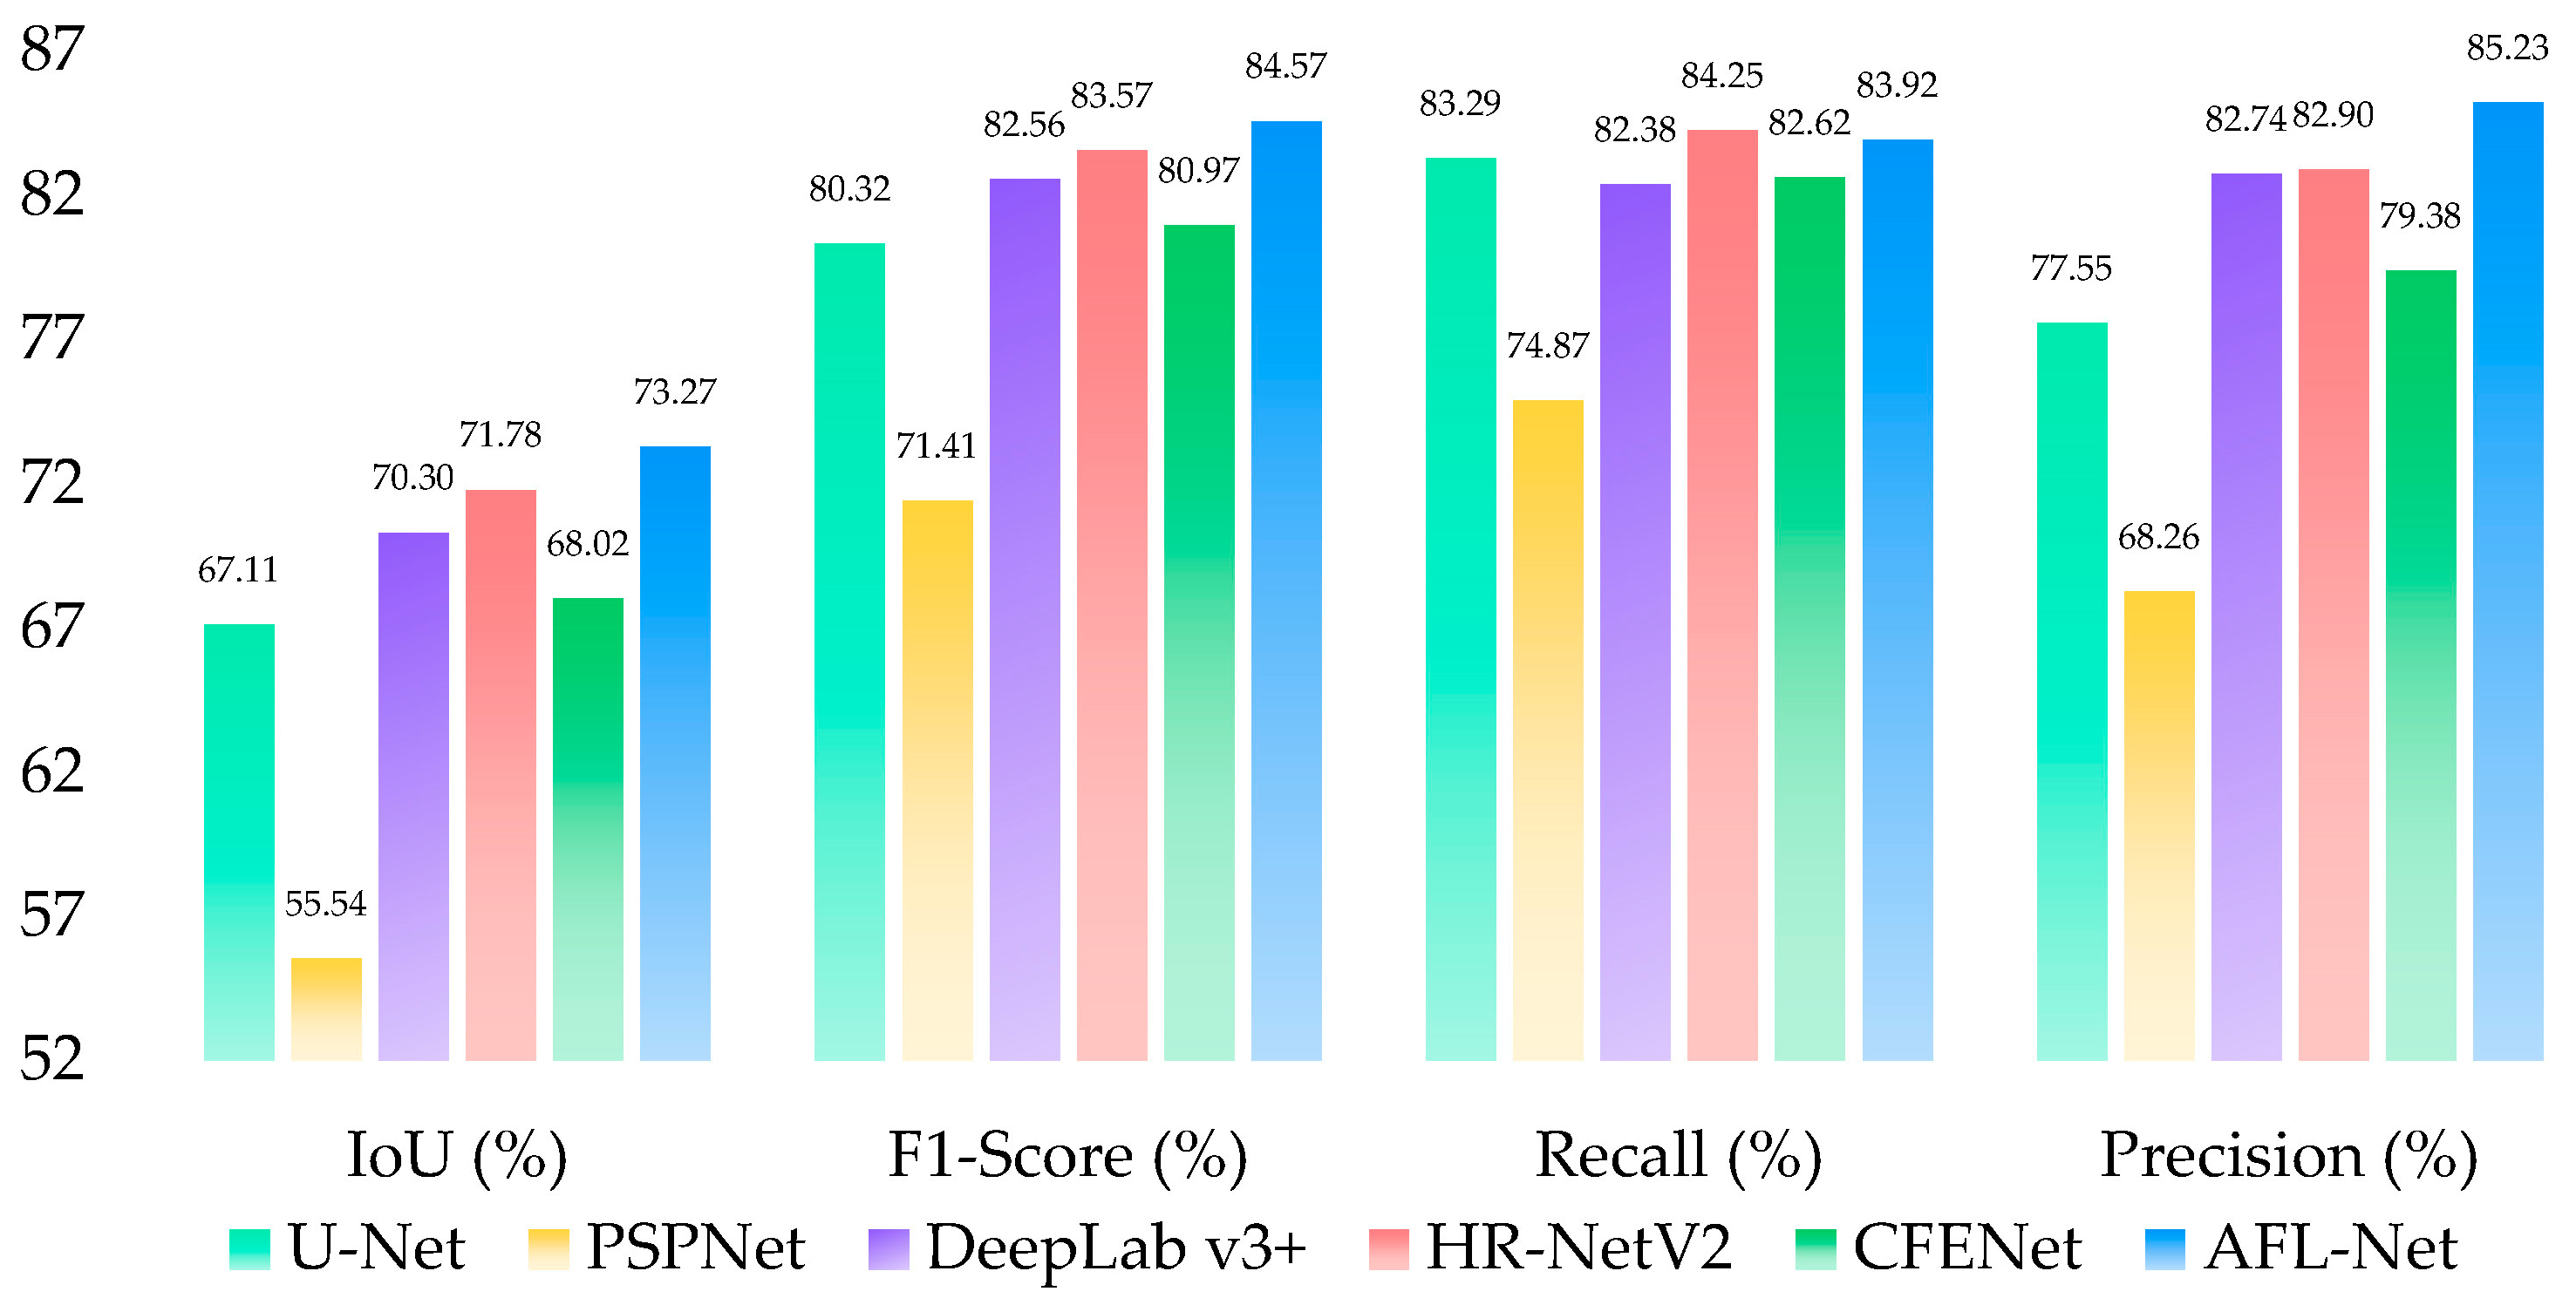
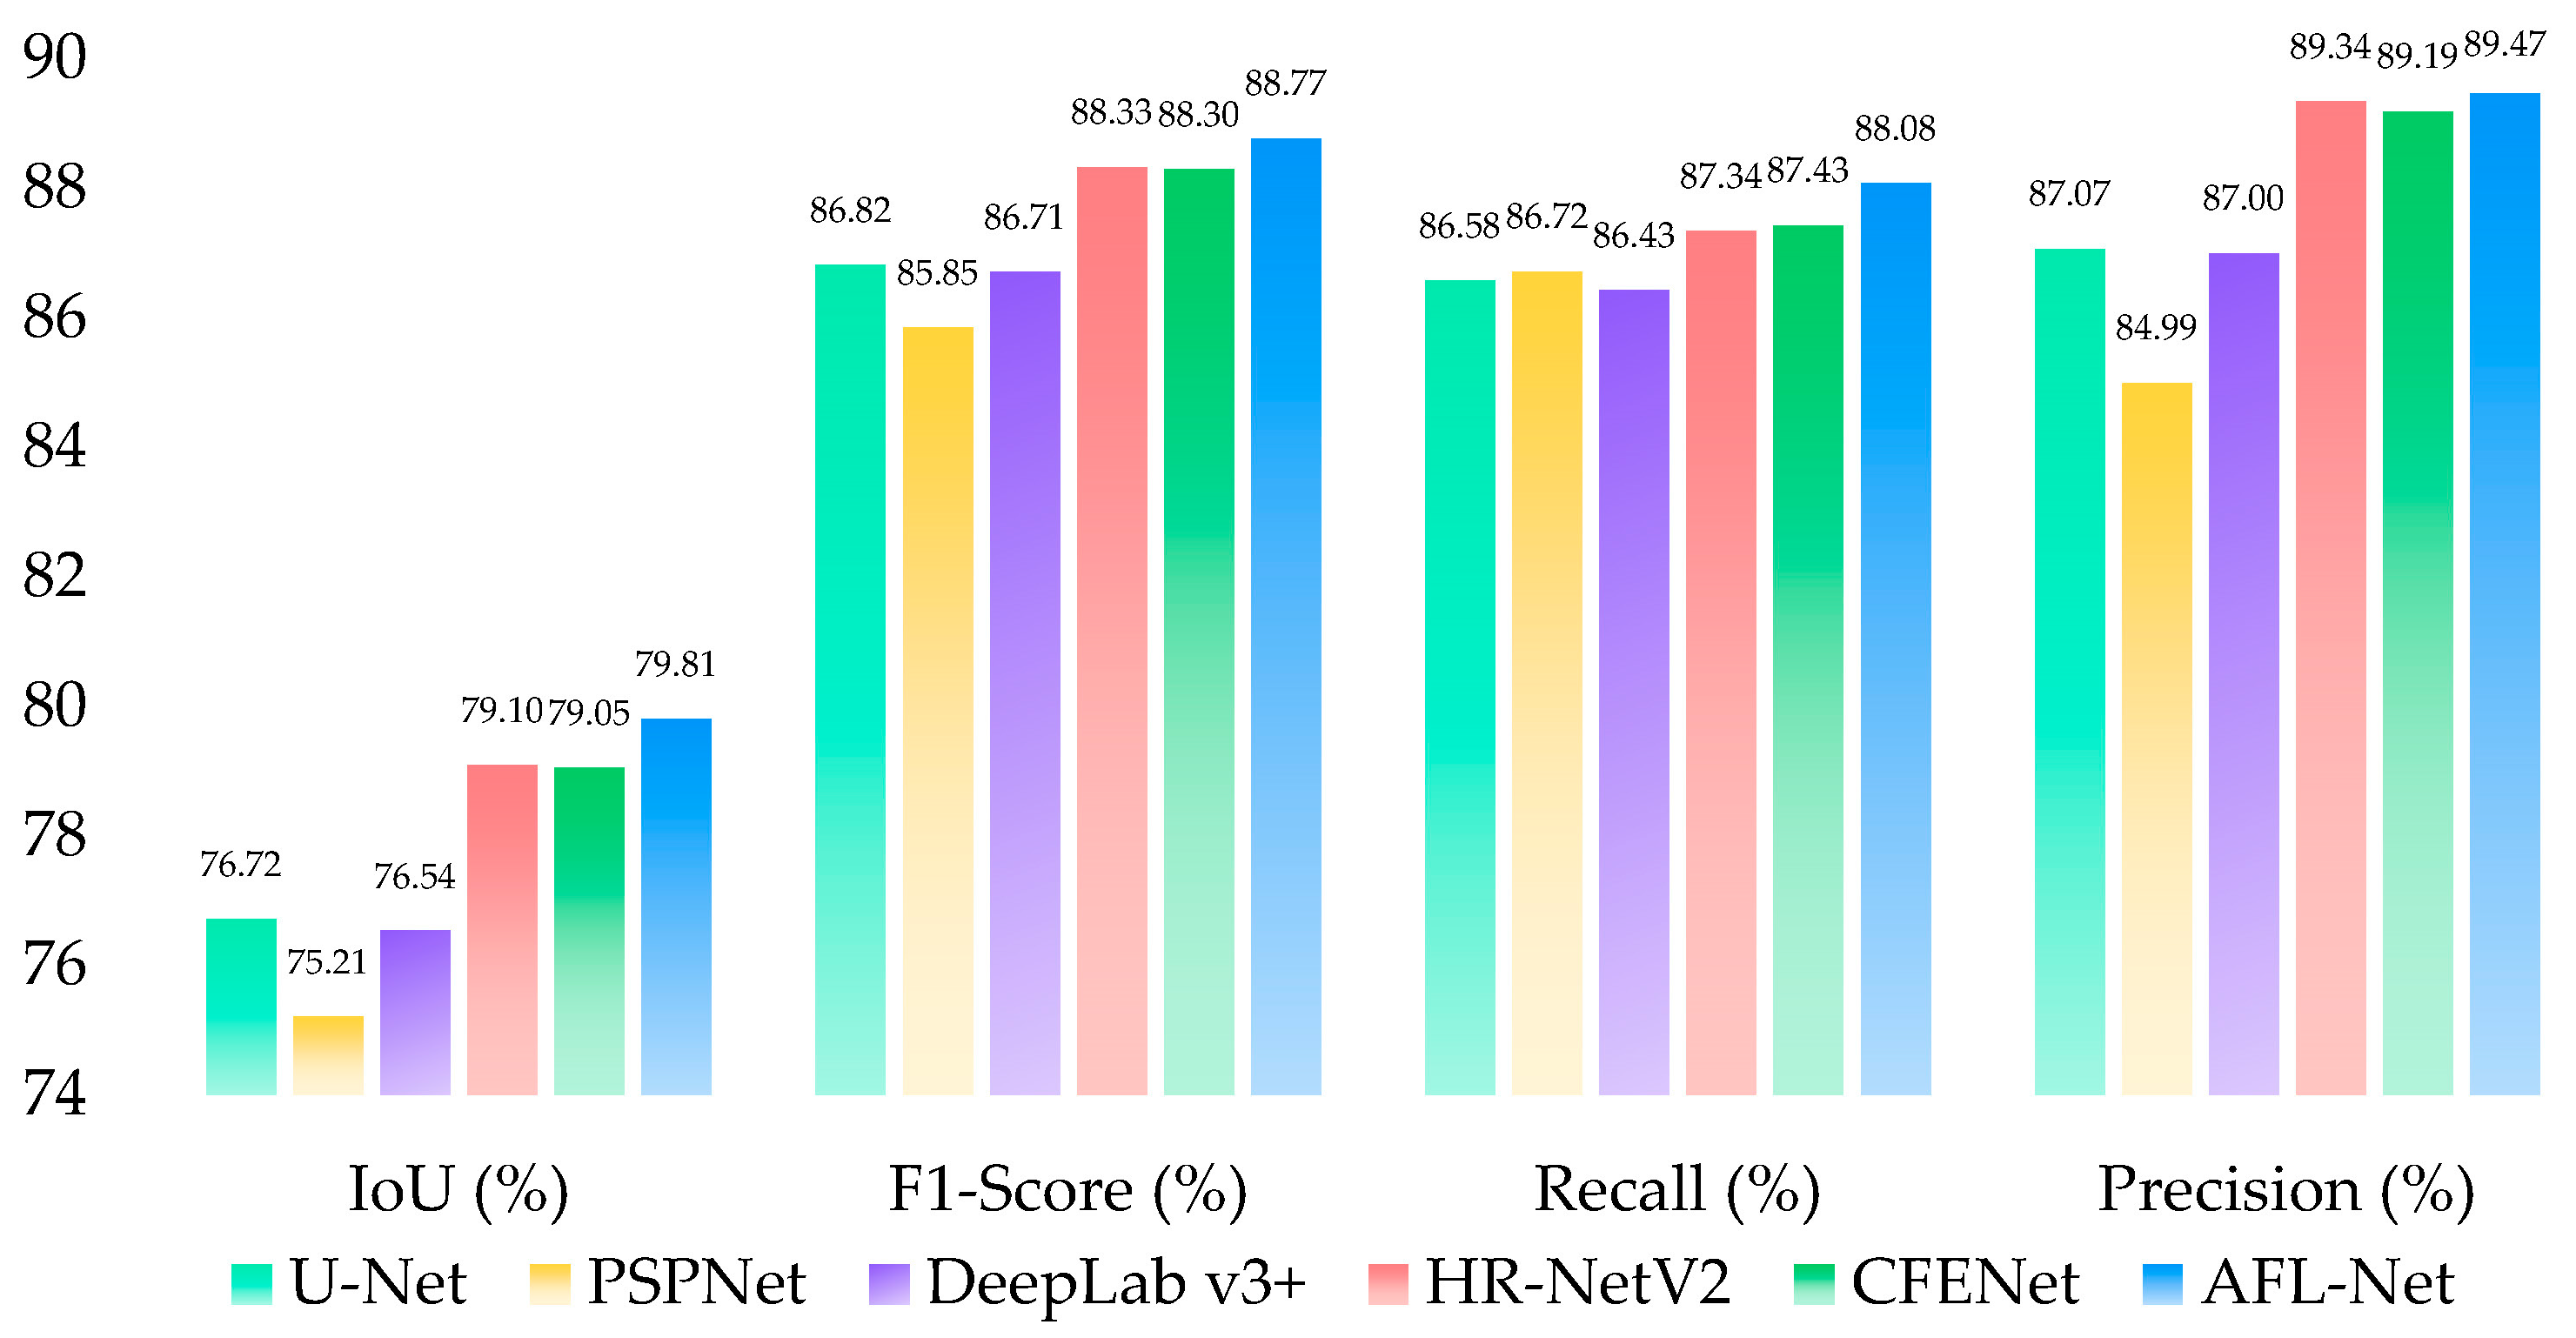
4.1.1. Quantitative Results
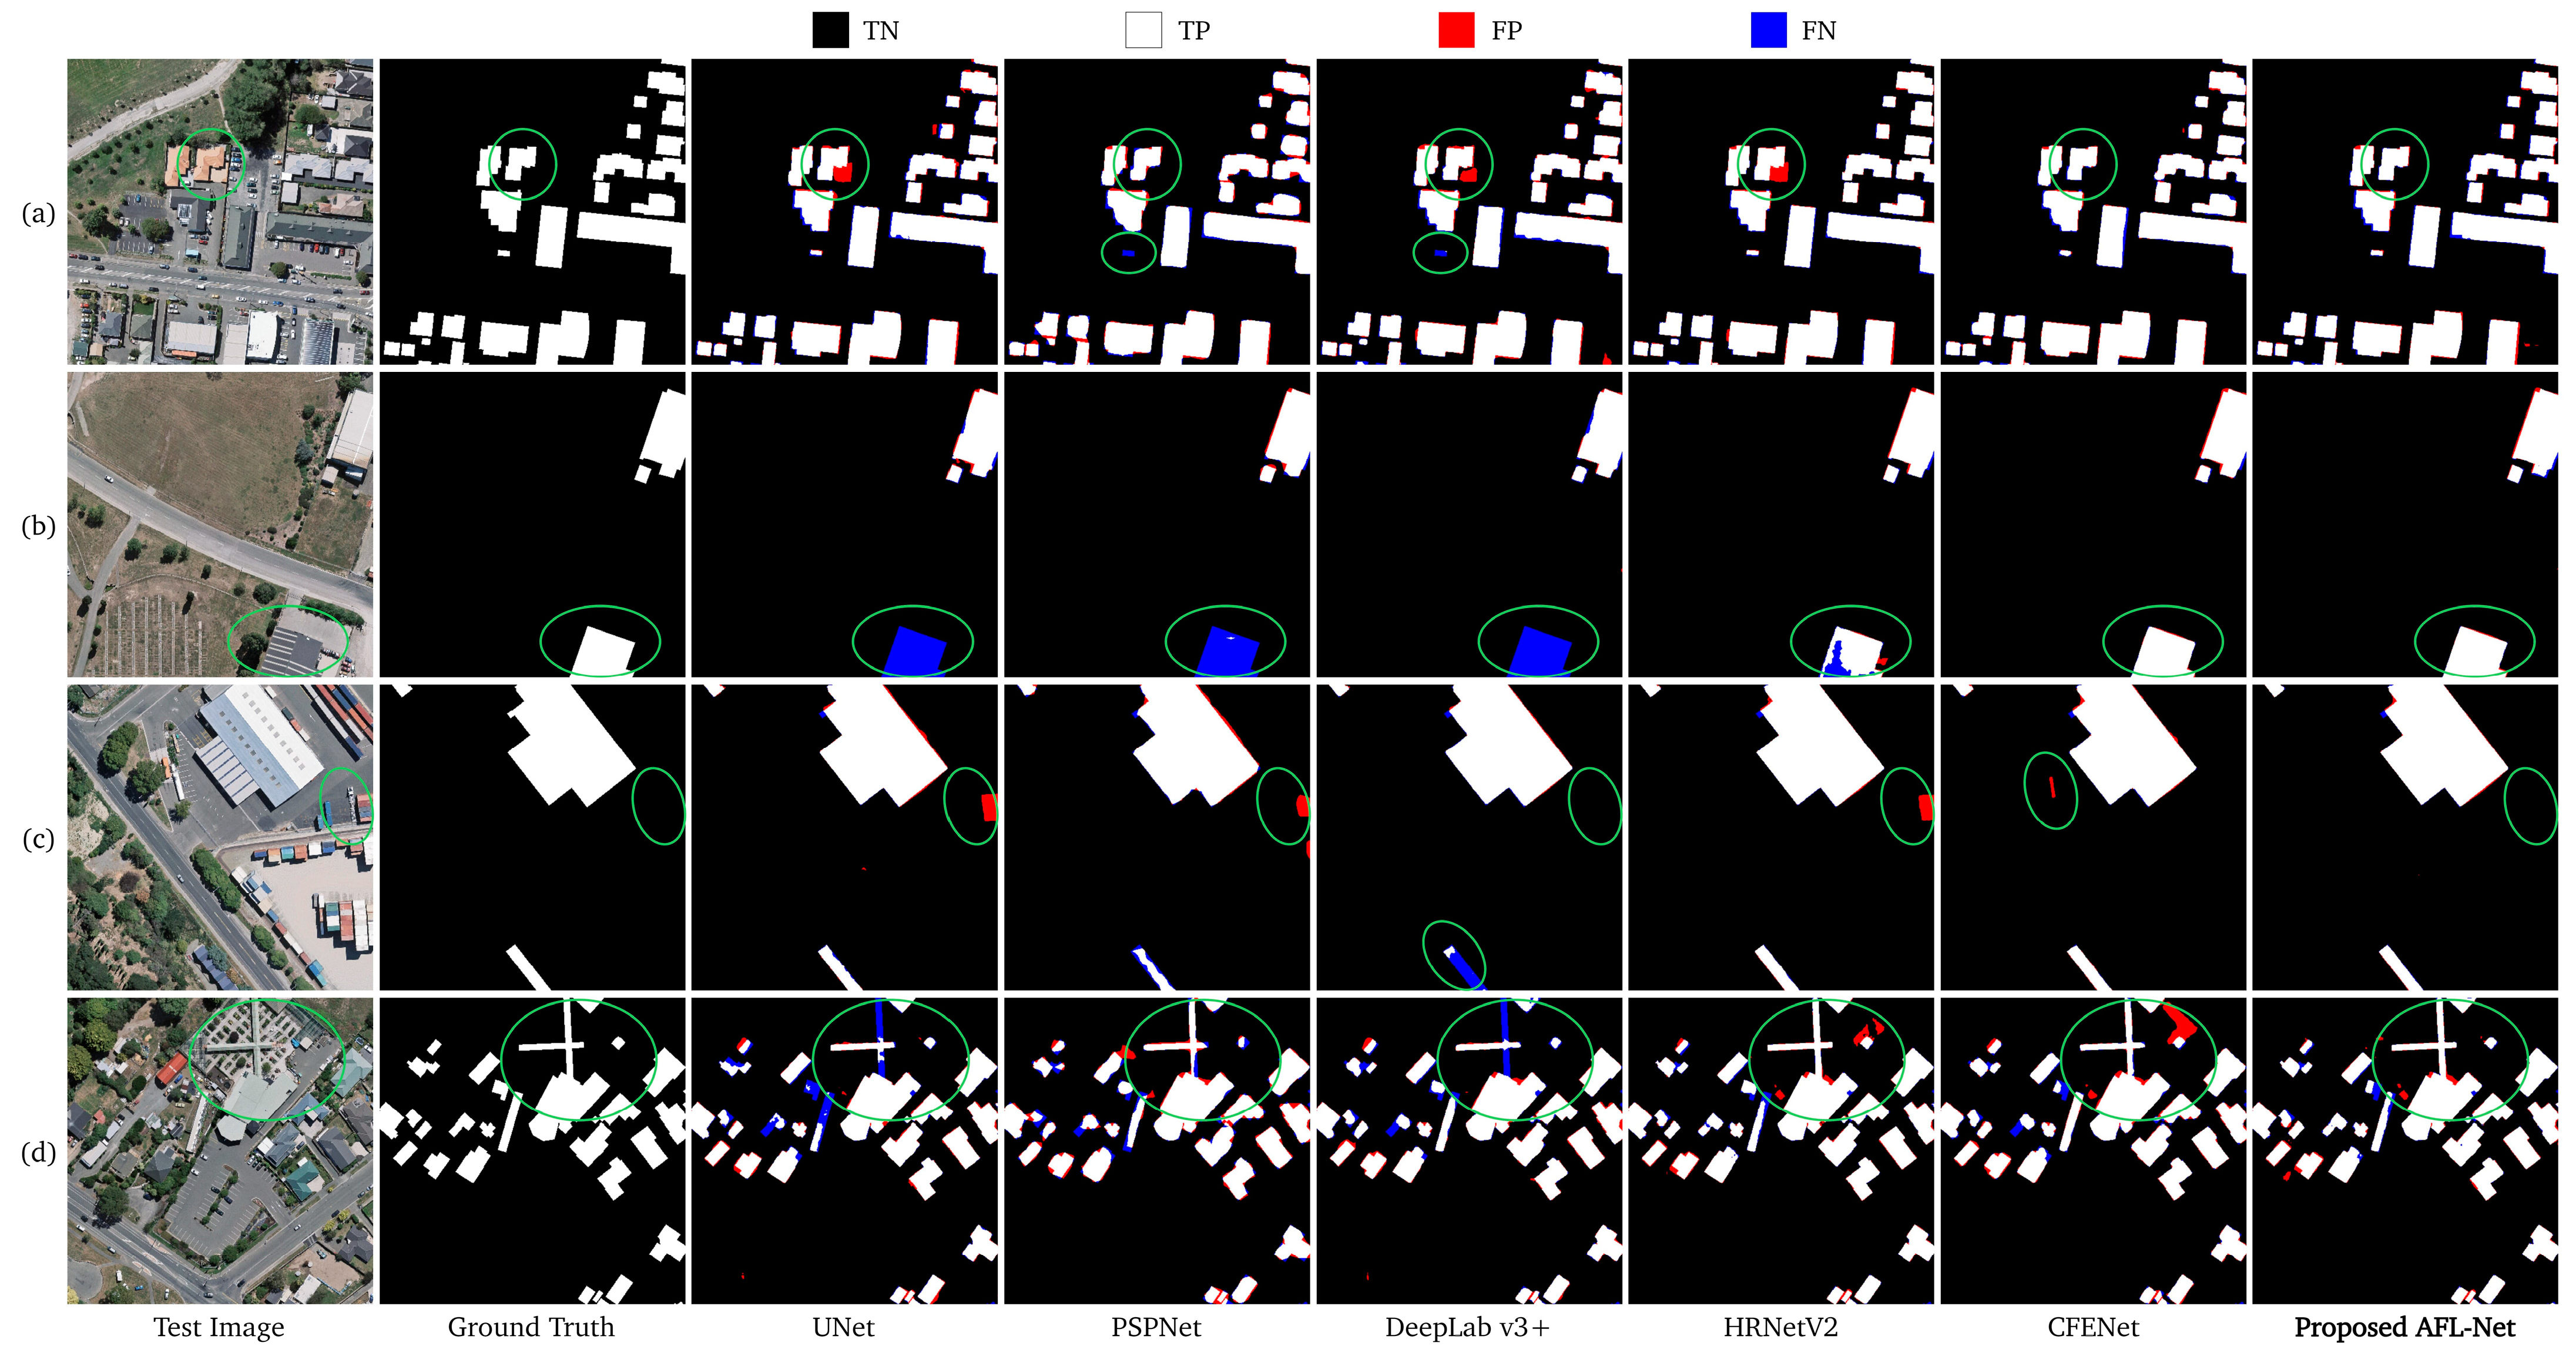
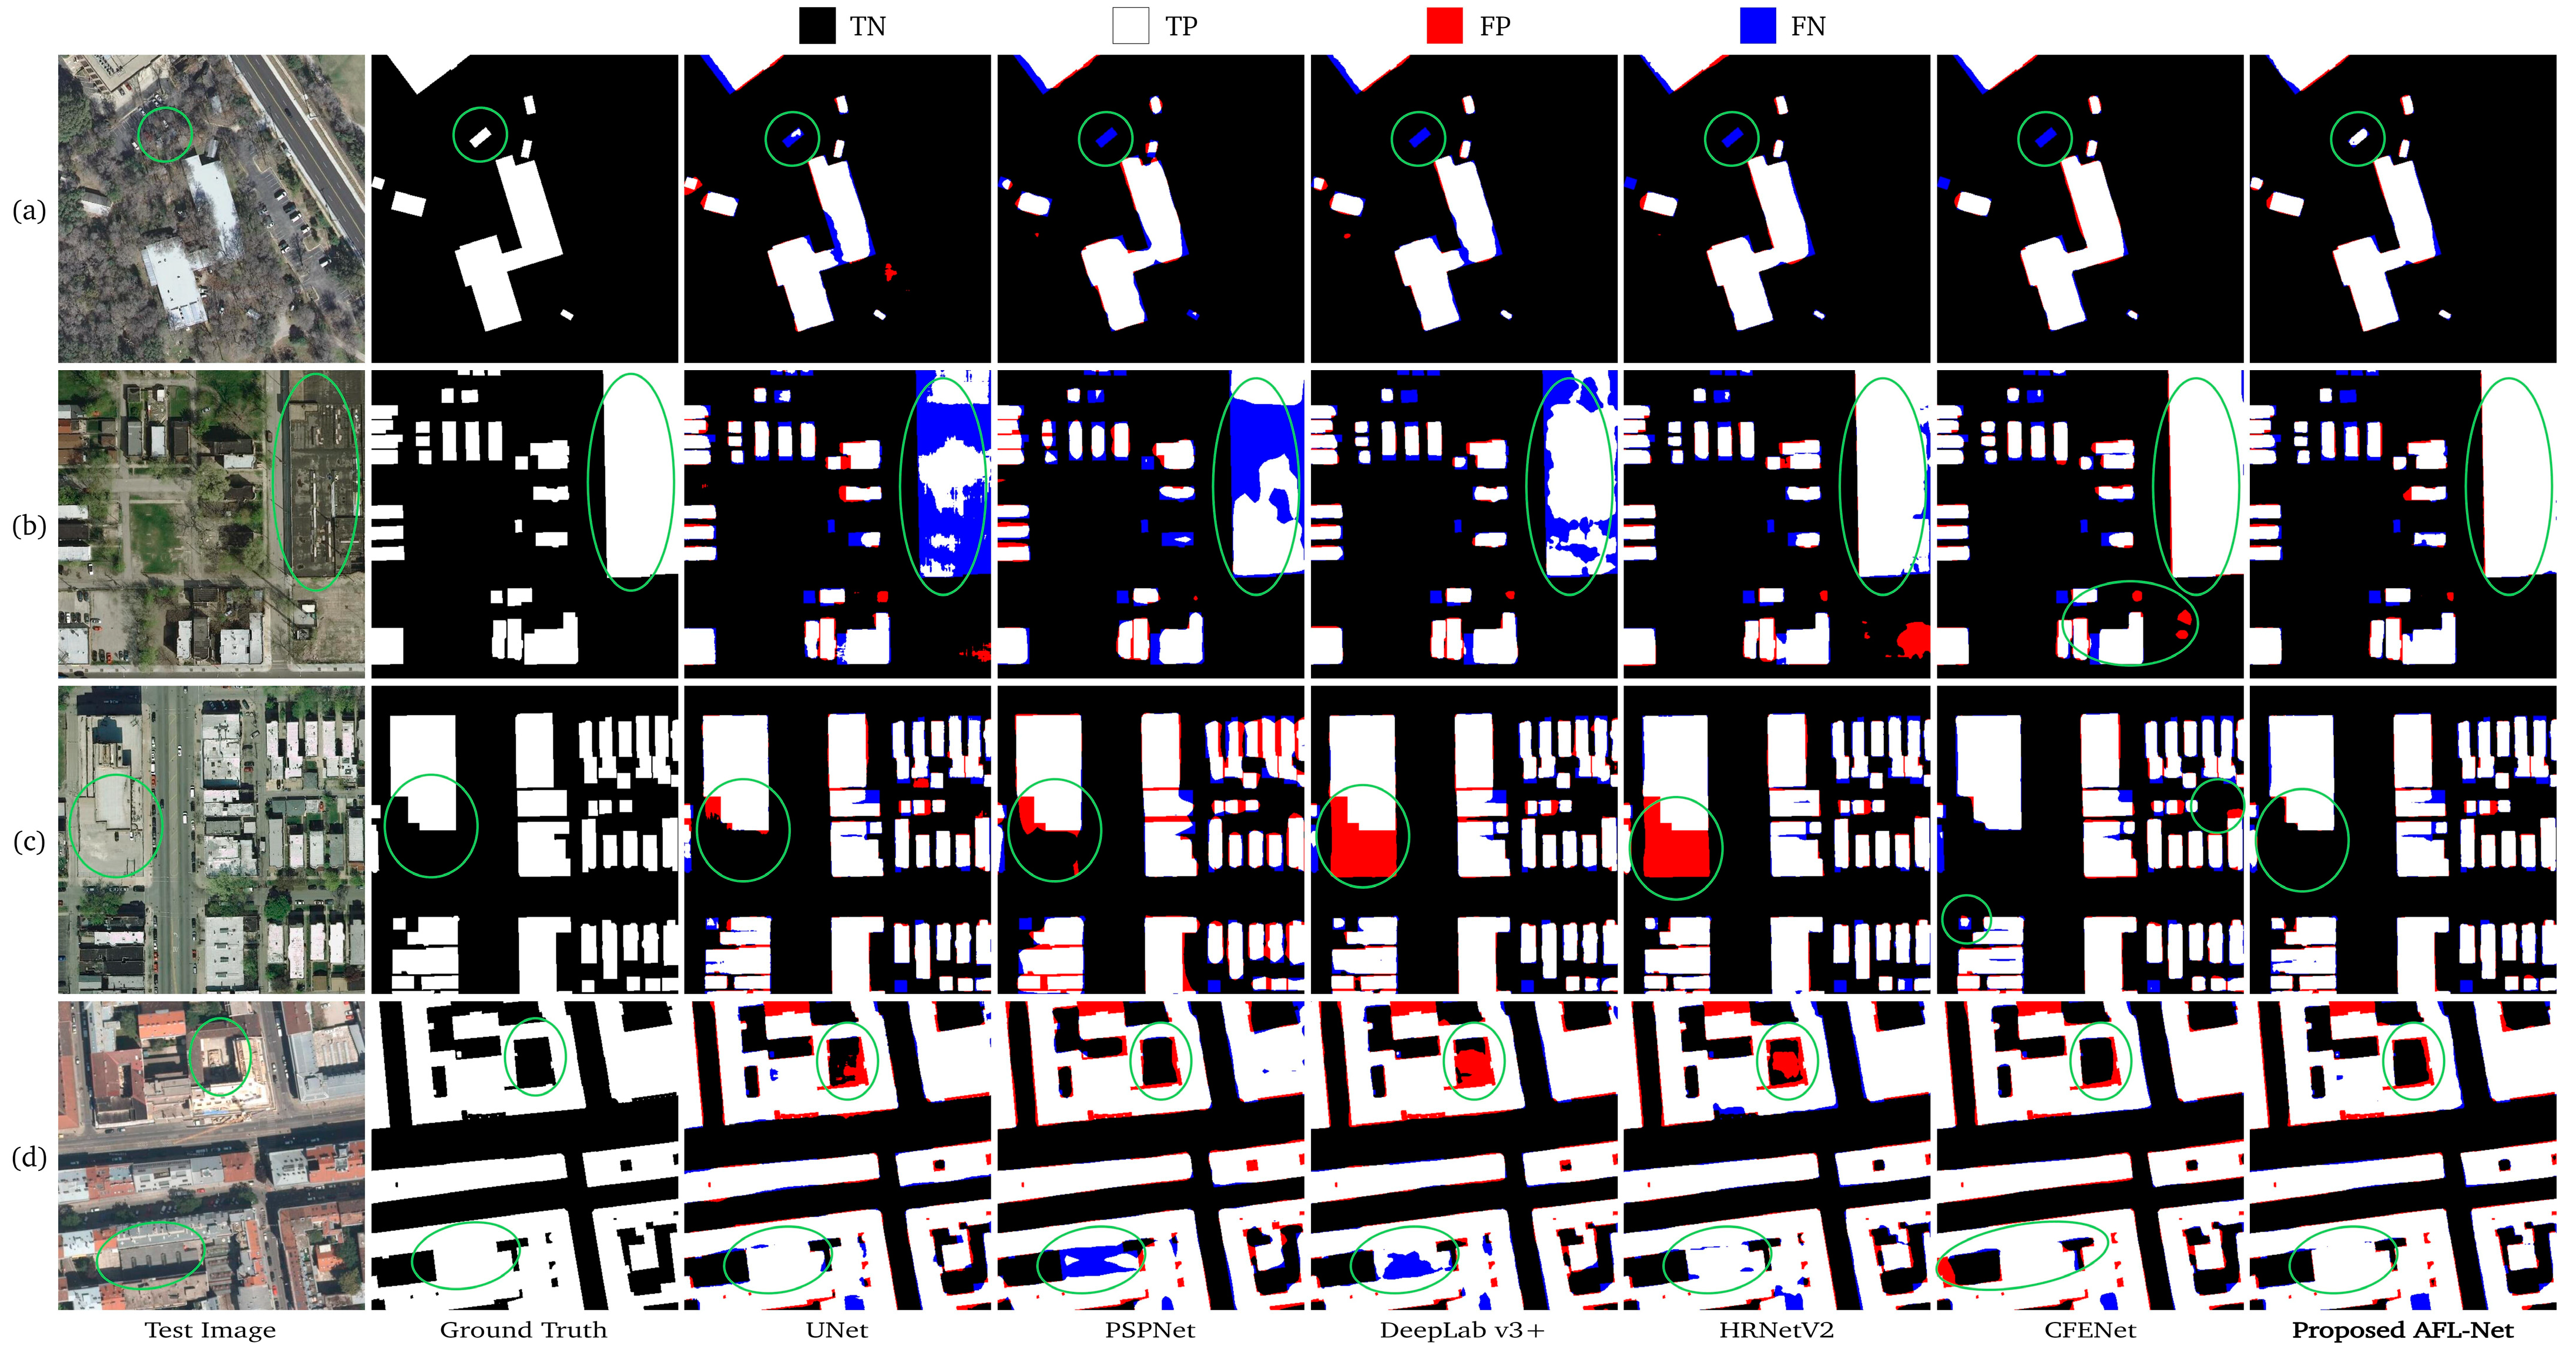
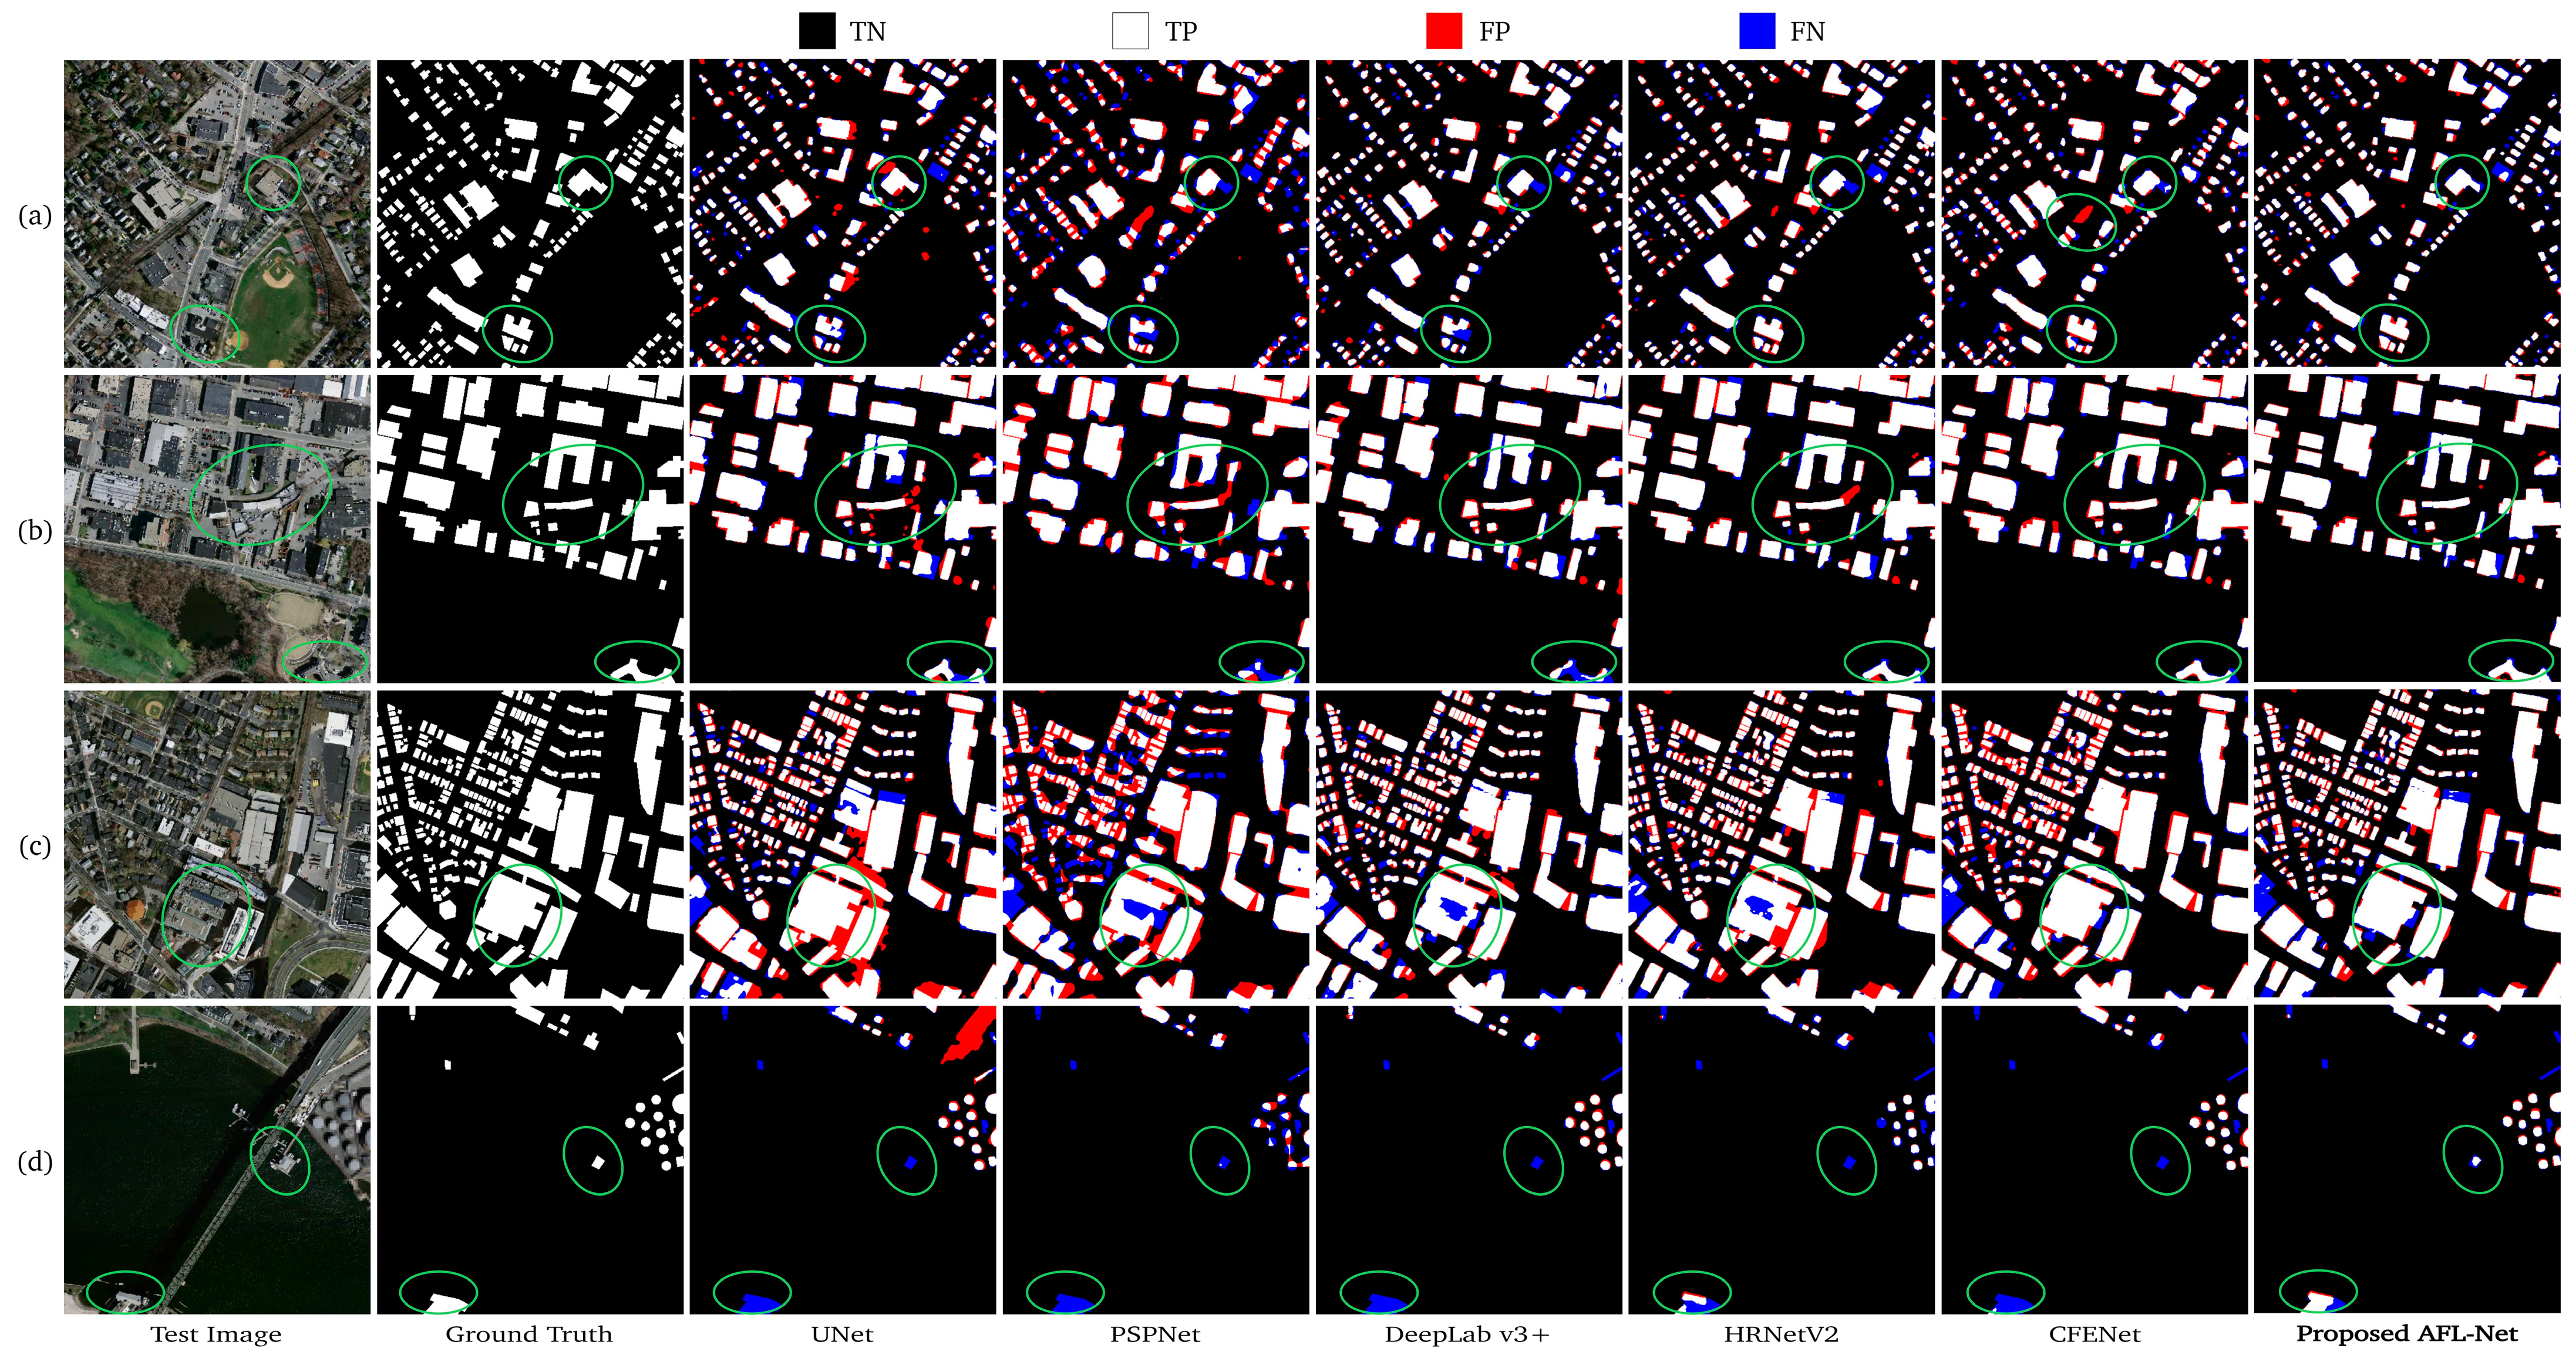
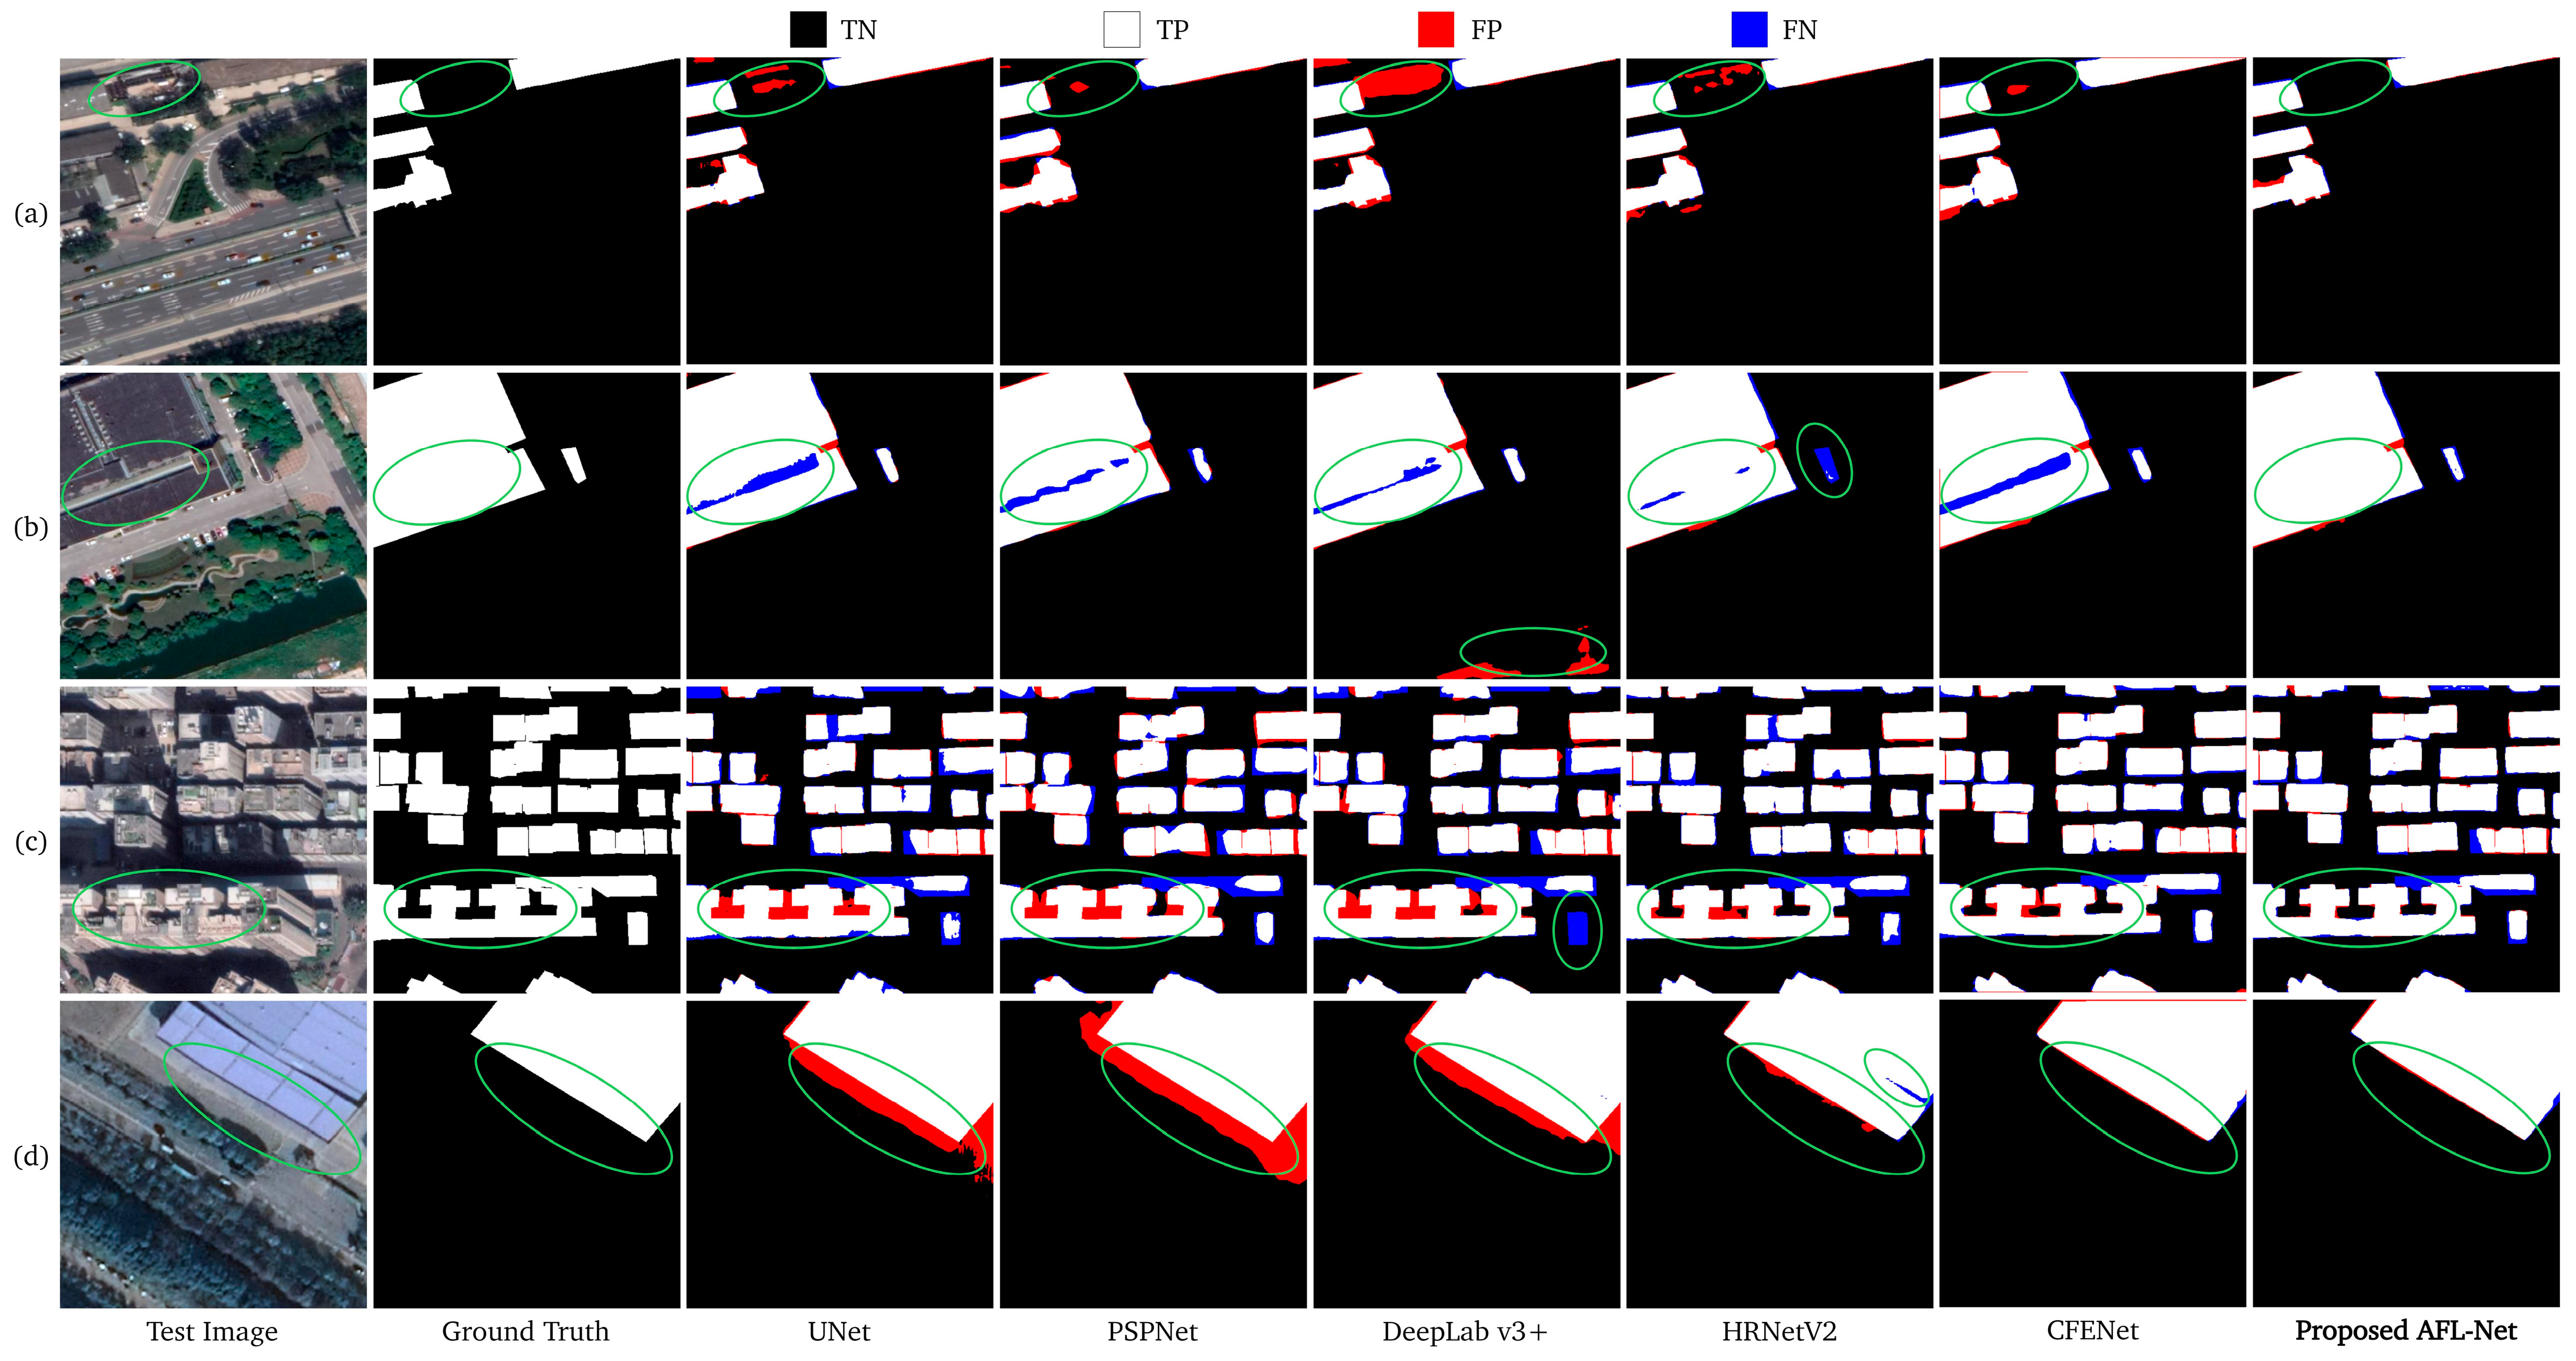
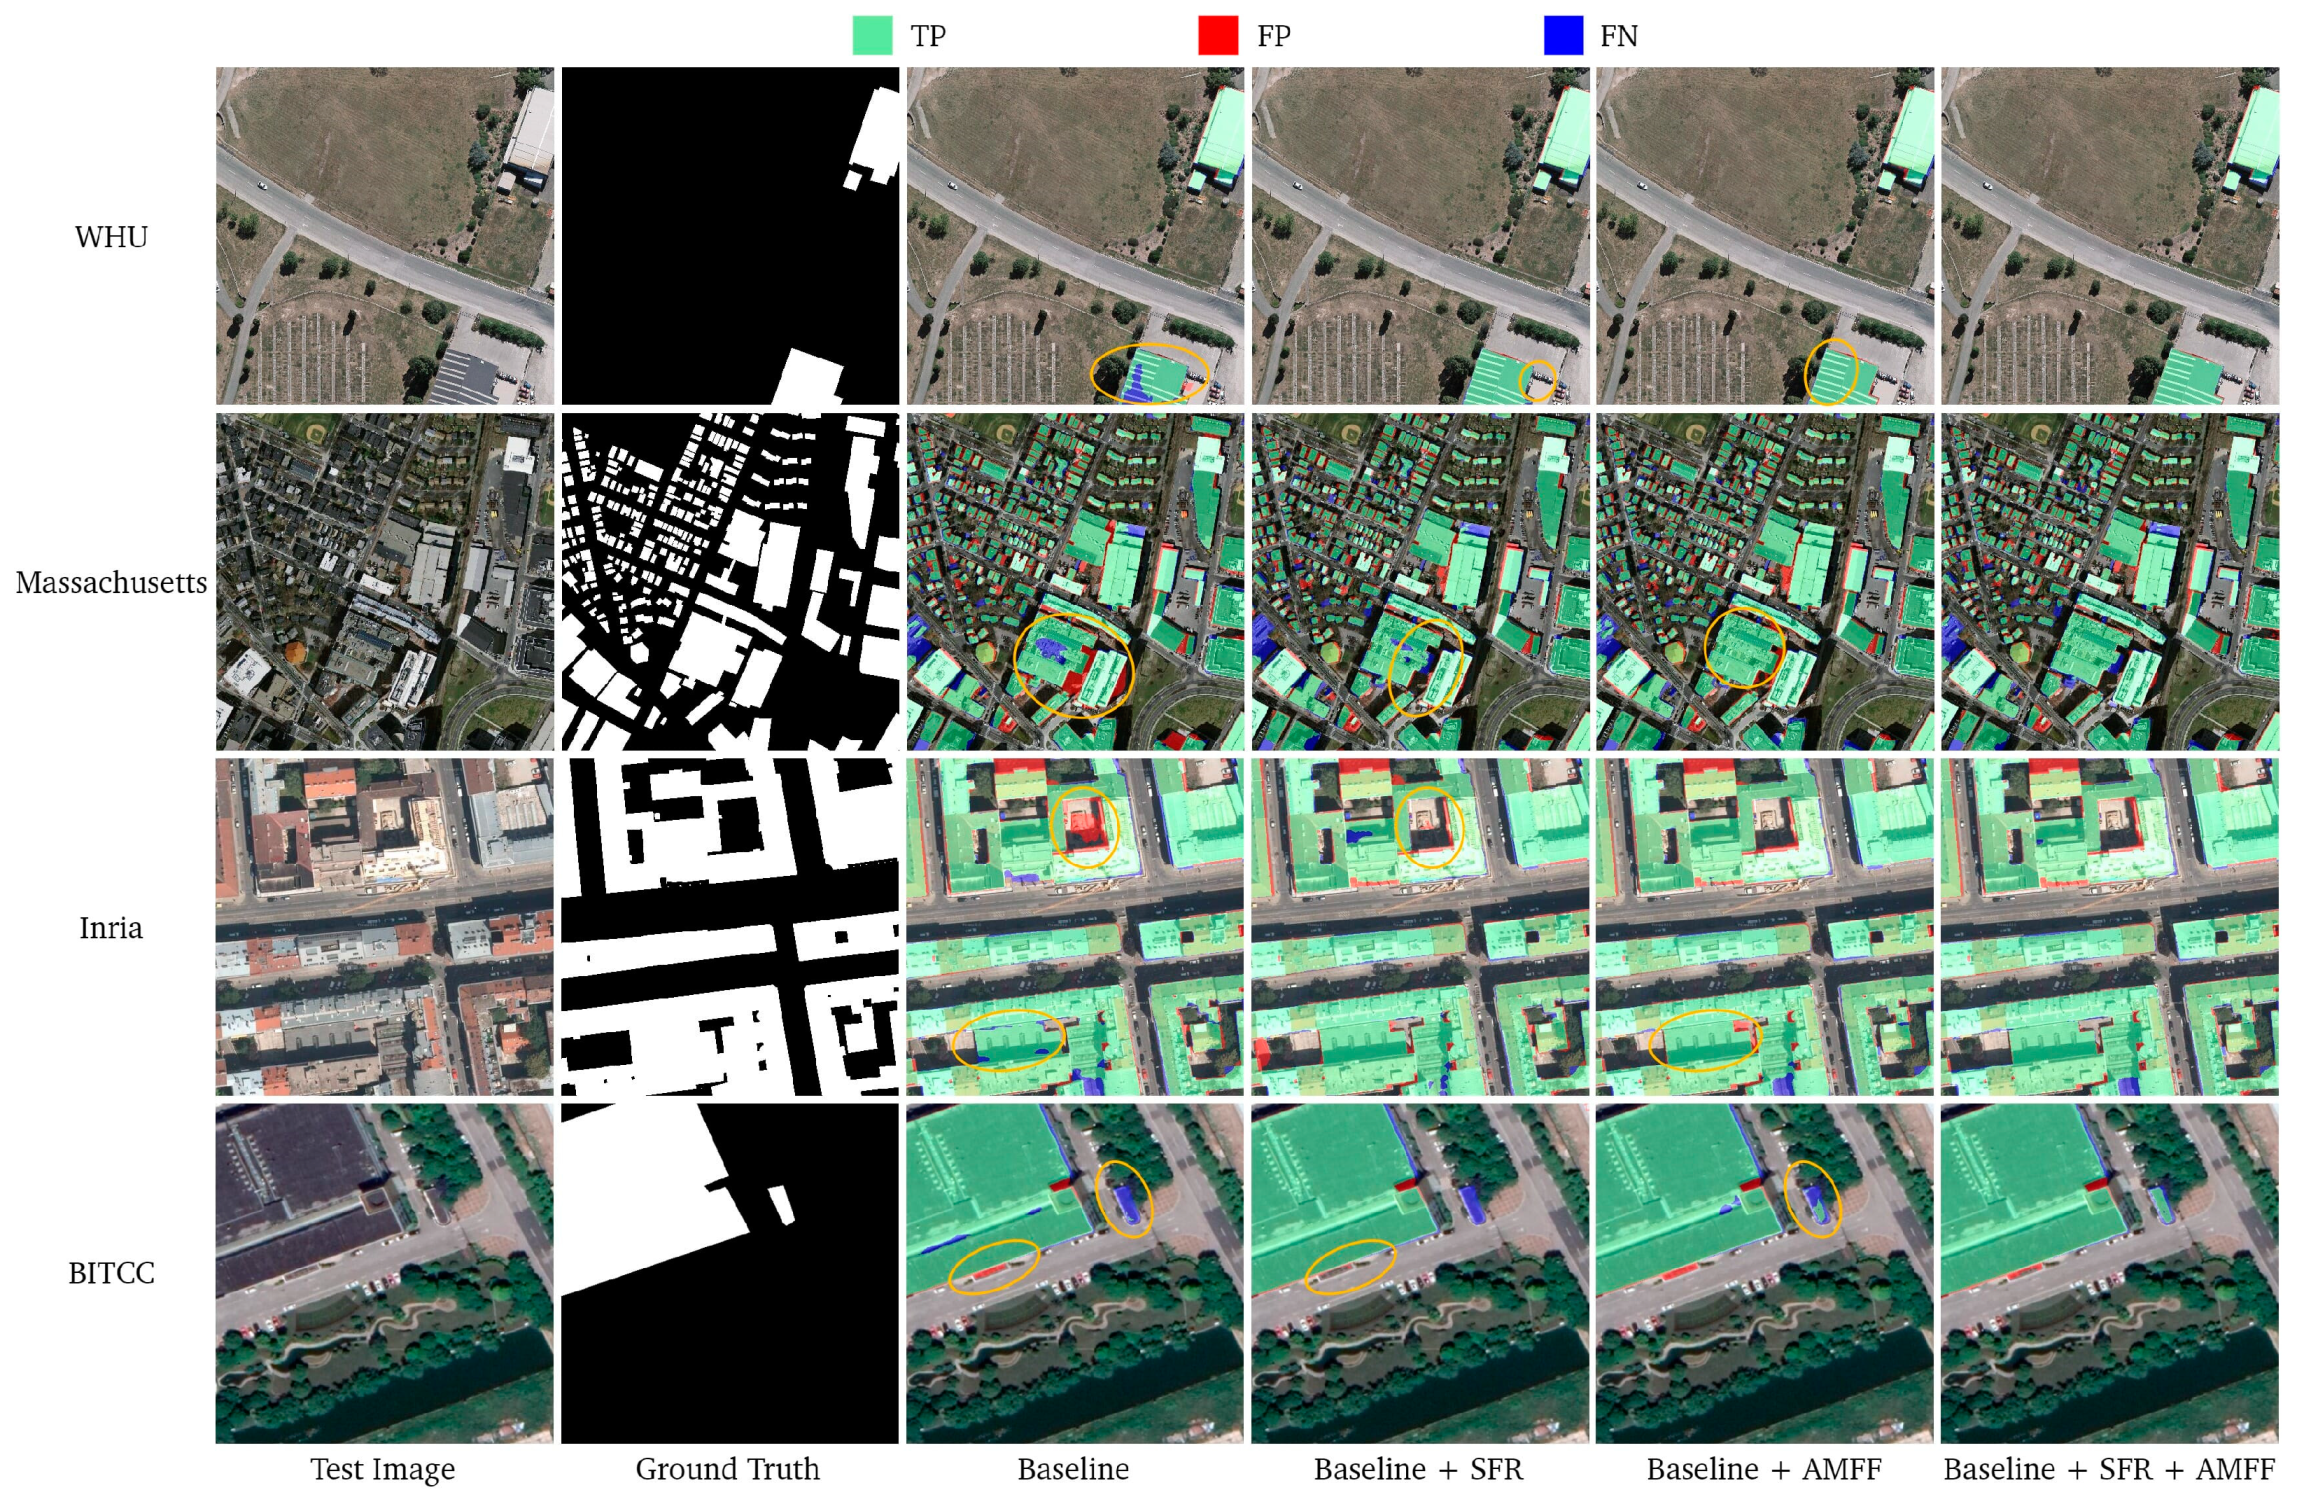
4.1.2. Qualitative Results
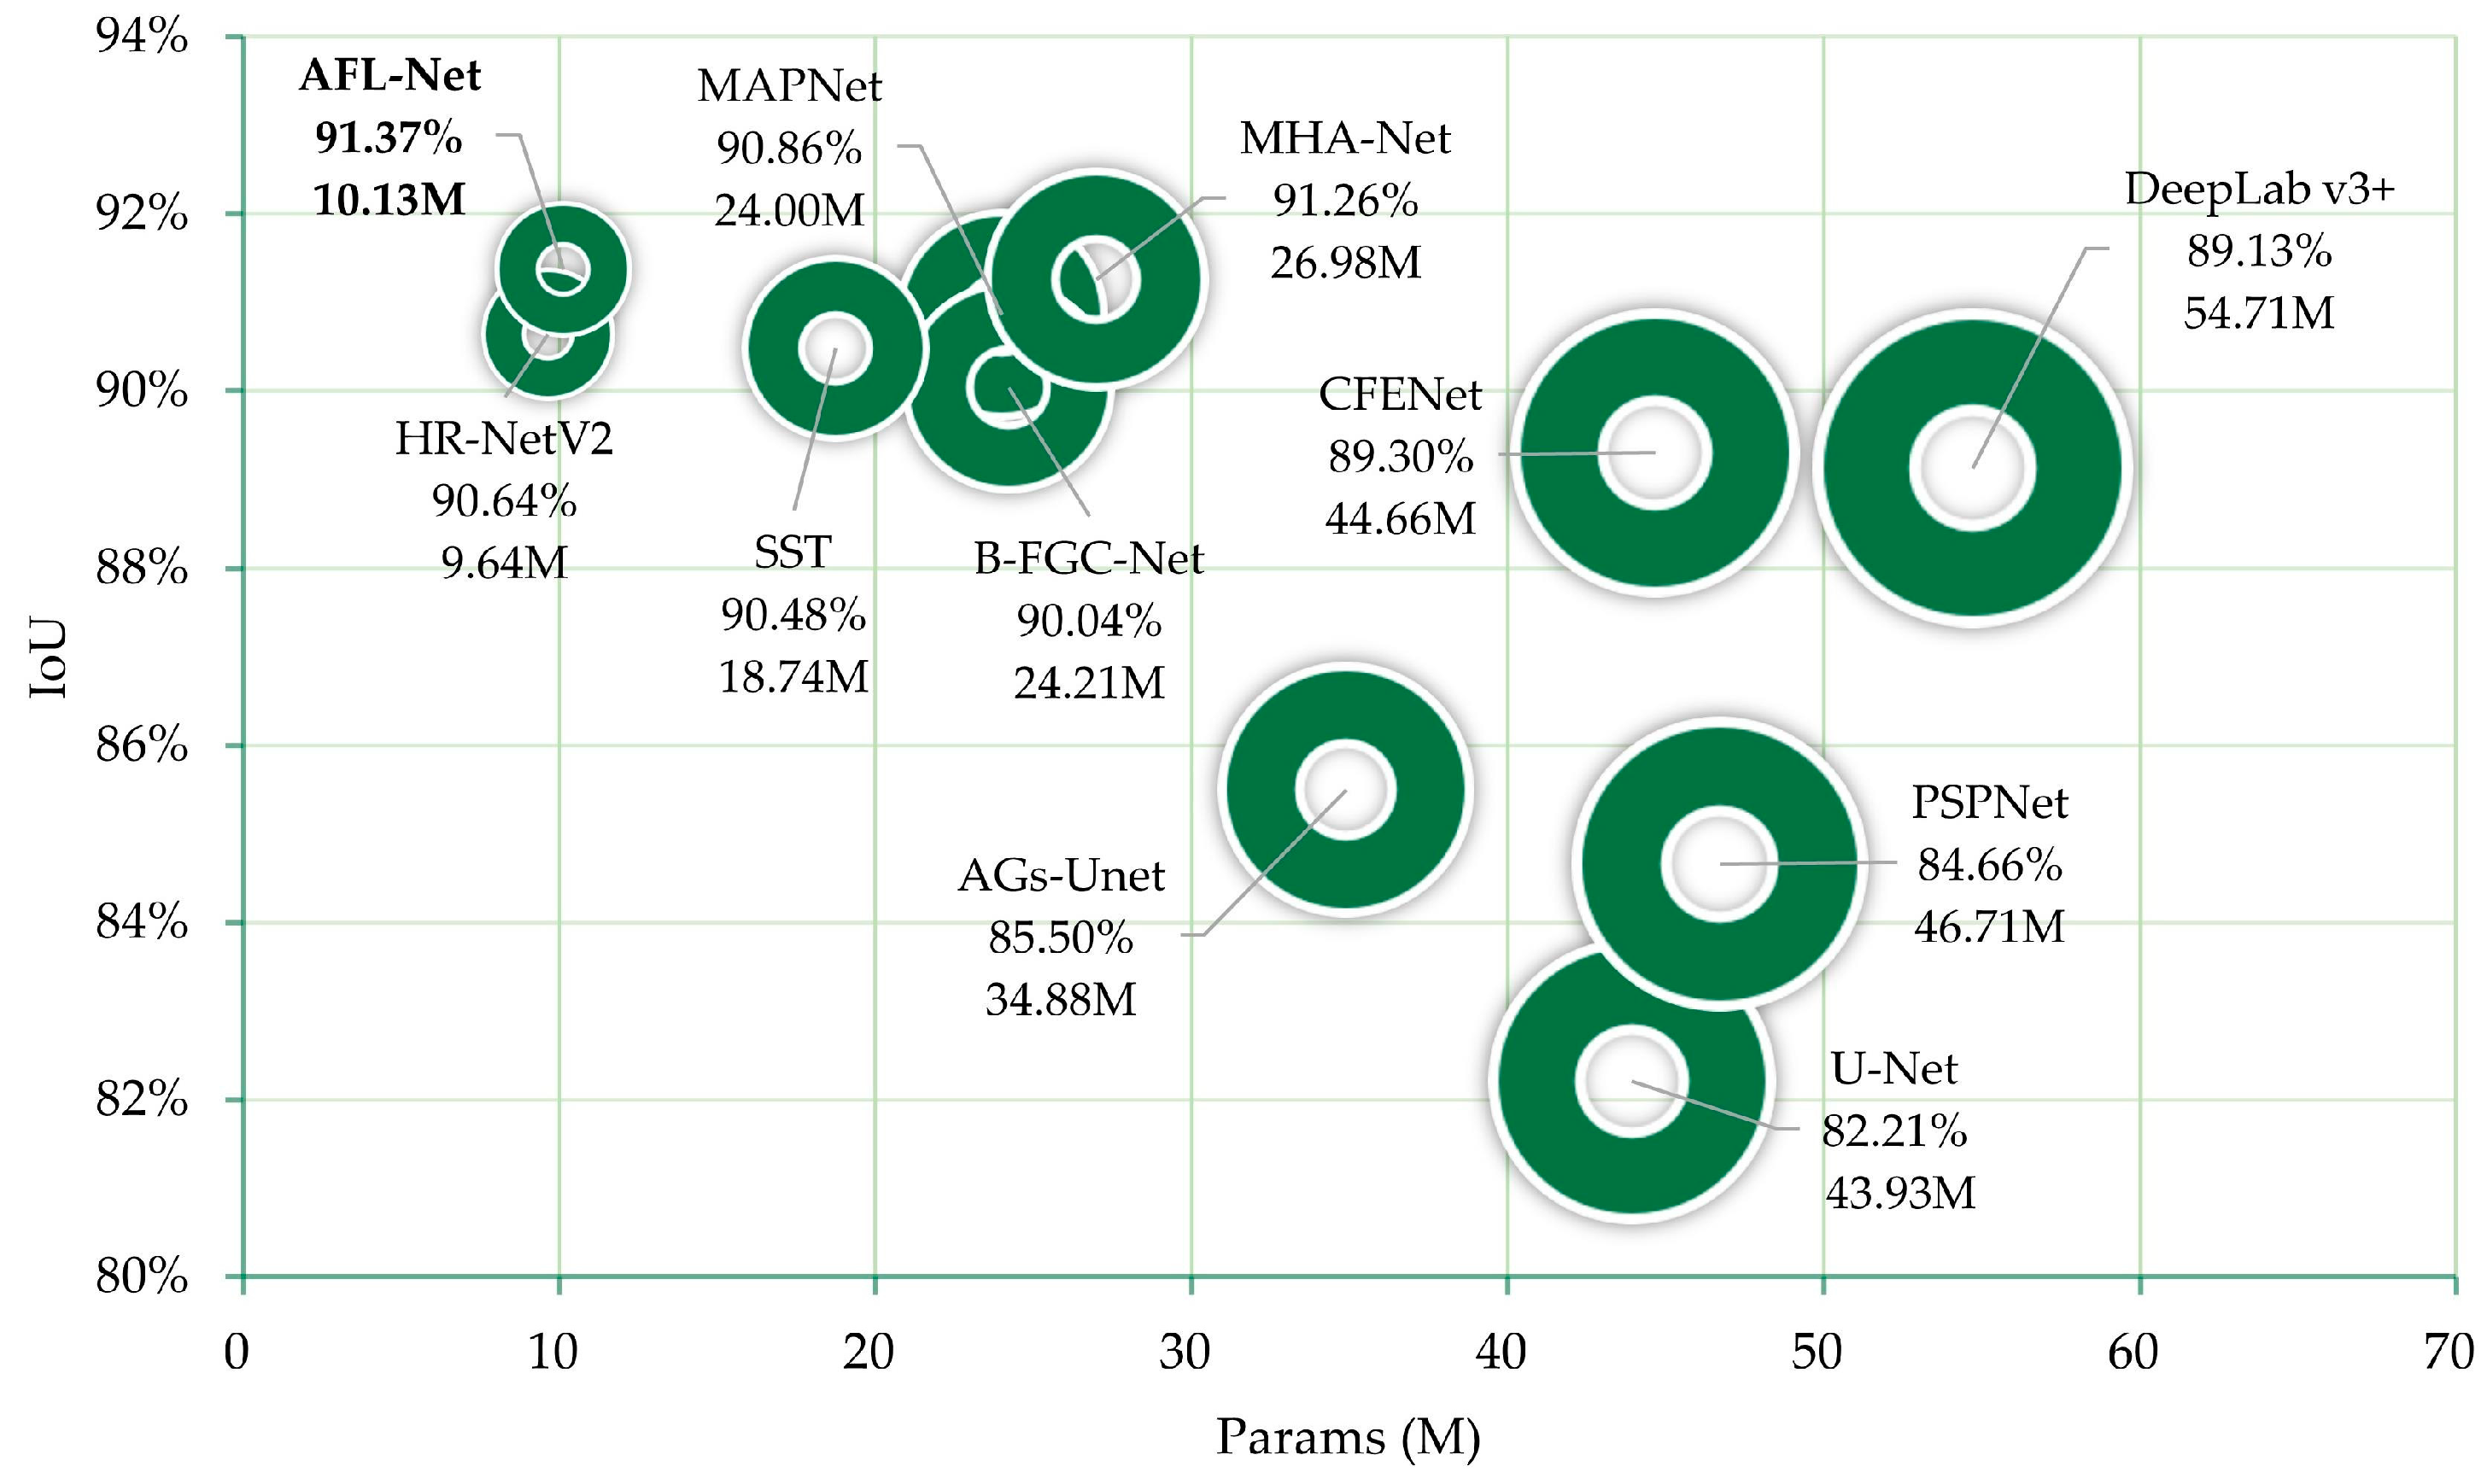
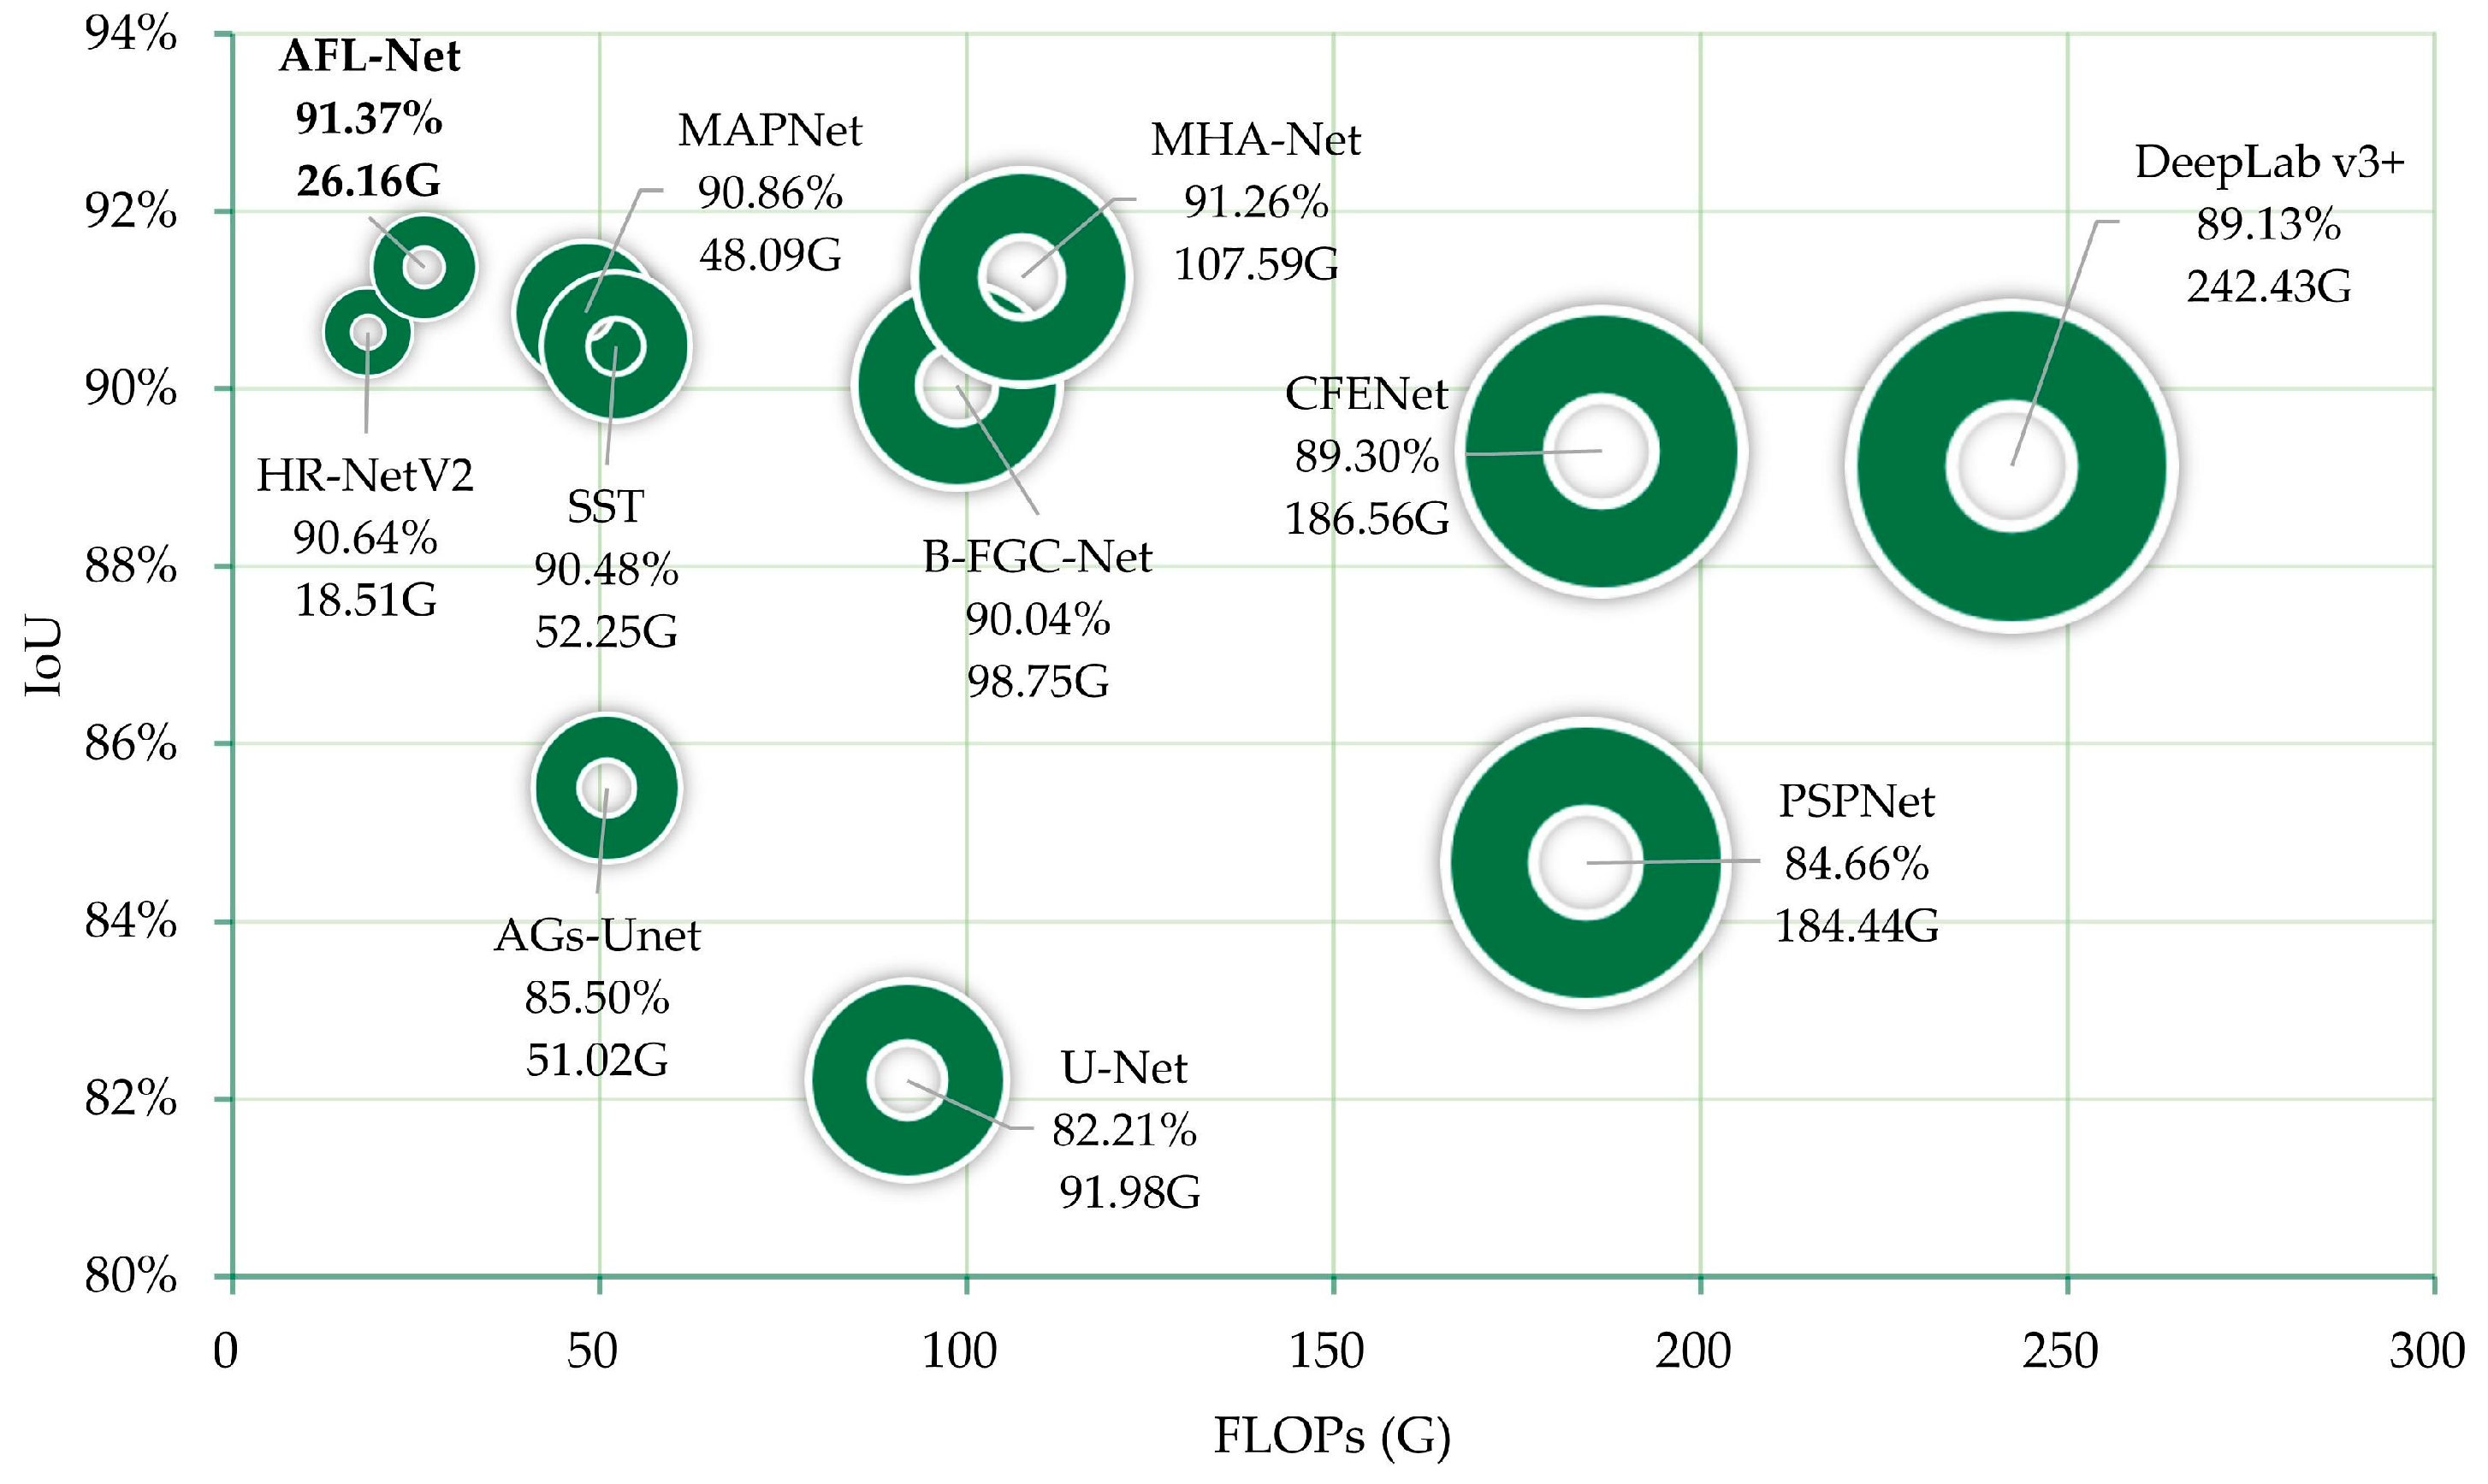
4.1.3. Comparison with Recent Methods
4.2. Ablation Study
4.2.1. Quantitative Analysis
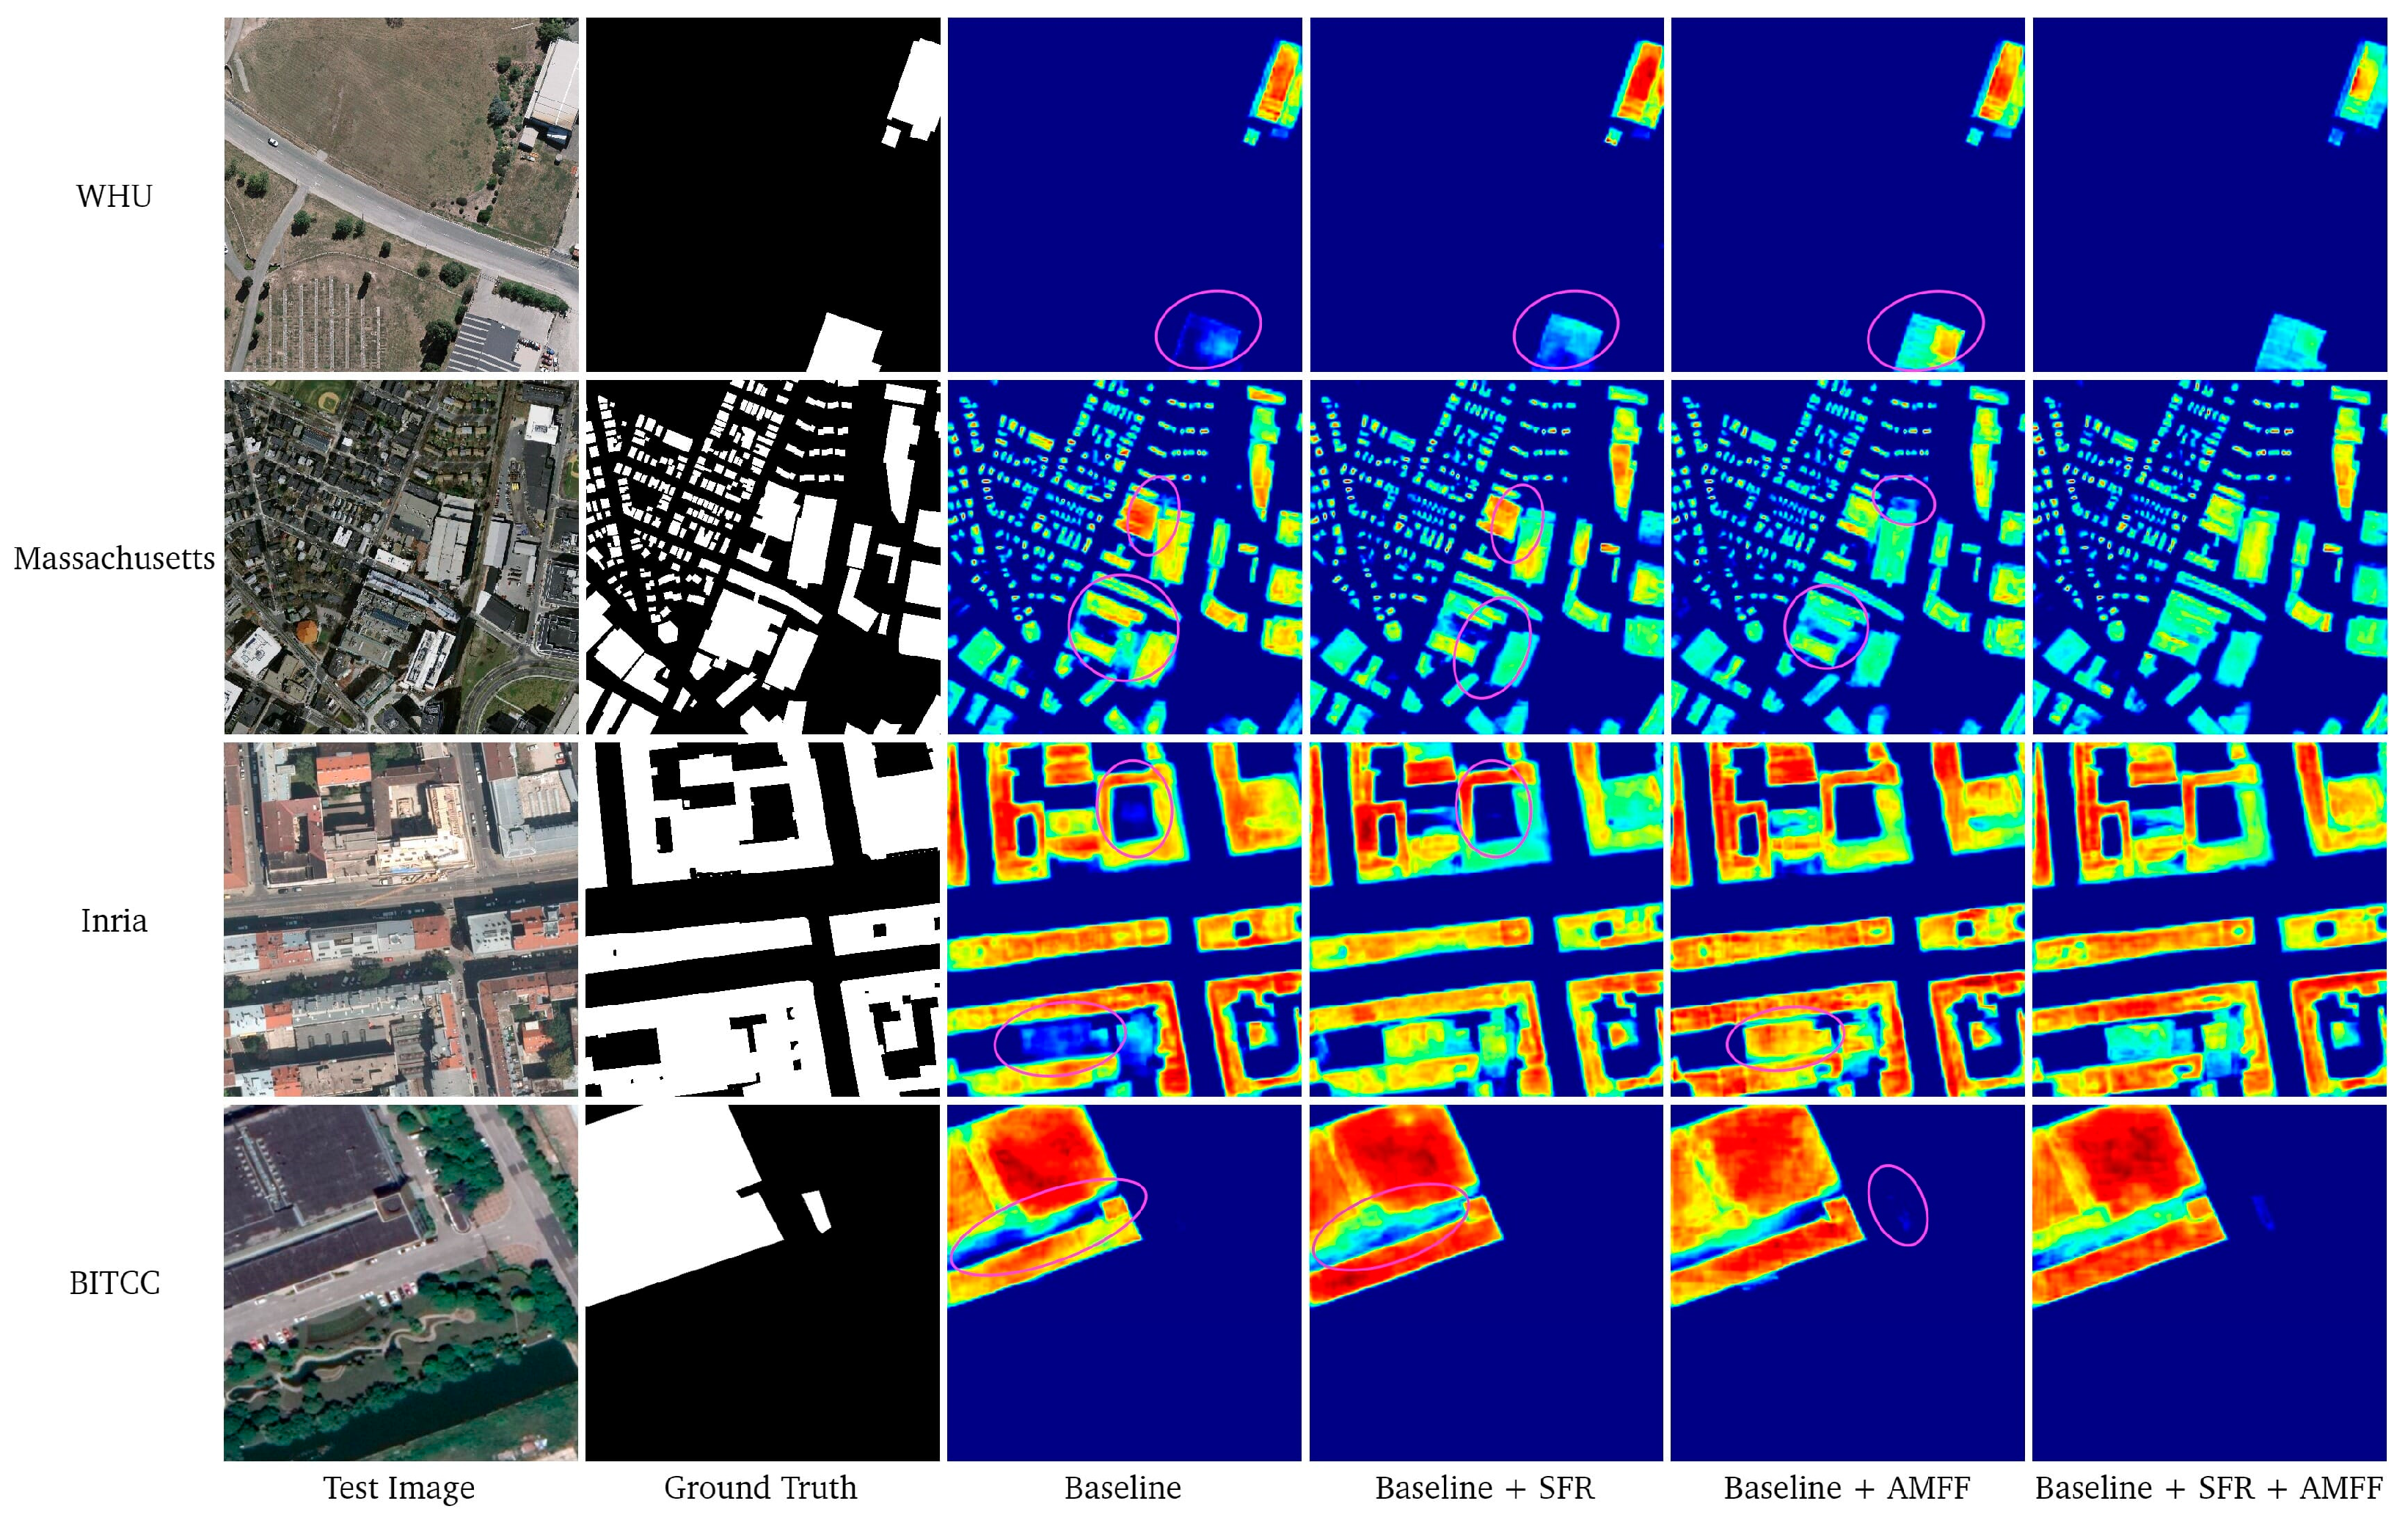
4.2.2. Qualitative Analysis
4.3. Limitations and Future Work
5. Conclusions
Author Contributions
Funding
Data Availability Statement
Acknowledgments
Conflicts of Interest
Abbreviations
| AFL-Net | Attention feature learning network |
| AMFF | Attentional multiscale feature fusion |
| CNN | Convolutional neural network |
| FLOPs | Floating-point operations |
| FN | False negative |
| FP | False positive |
| FPS | Frames per second |
| IoU | Intersection over union |
| PSA | Polarized self-attention |
| ReLU | Rectified linear unit |
| SFR | Shape feature refinement |
| TN | True negative |
| TP | True positive |
References
- Li, W.; Fu, H.; Yu, L.; Cracknell, A. Deep Learning Based Oil Palm Tree Detection and Counting for High-Resolution Remote Sensing Images. Remote Sens. 2017, 9, 22. [Google Scholar] [CrossRef] [Green Version]
- Zhang, B.; Wang, C.; Shen, Y.; Liu, Y. Fully Connected Conditional Random Fields for High-Resolution Remote Sensing Land Use/Land Cover Classification with Convolutional Neural Networks. Remote Sens. 2018, 10, 1889. [Google Scholar] [CrossRef] [Green Version]
- Alshehhi, R.; Marpu, P.R.; Woon, W.L.; Mura, M.D. Simultaneous Extraction of Roads and Buildings in Remote Sensing Imagery with Convolutional Neural Networks. ISPRS J. Photogramm. Remote Sens 2017, 130, 139–149. [Google Scholar] [CrossRef]
- Gao, X.; Wang, M.; Yang, Y.; Li, G. Building Extraction from RGB VHR Images Using Shifted Shadow Algorithm. IEEE Access 2018, 6, 22034–22045. [Google Scholar] [CrossRef]
- Chen, H.; Shi, Z. A Spatial-Temporal Attention-Based Method and a New Dataset for Remote Sensing Image Change Detection. Remote Sens. 2020, 12, 1662. [Google Scholar] [CrossRef]
- Gao, Y.; Gao, F.; Dong, J.; Wang, S. Change Detection from Synthetic Aperture Radar Images Based on Channel Weighting-Based Deep Cascade Network. IEEE J. Sel. Top. Appl. Earth Obs. Remote Sens. 2019, 12, 4517–4529. [Google Scholar] [CrossRef]
- Kang, M.; Baek, J. SAR Image Change Detection via Multiple-Window Processing with Structural Similarity. Sensors 2021, 21, 6645. [Google Scholar] [CrossRef]
- Cooner, A.J.; Shao, Y.; Campbell, J.B. Detection of Urban Damage Using Remote Sensing and Machine Learning Algorithms: Revisiting the 2010 Haiti Earthquake. Remote Sens. 2016, 8, 868. [Google Scholar] [CrossRef] [Green Version]
- Xiong, C.; Li, Q.; Lu, X. Automated Regional Seismic Damage Assessment of Buildings Using an Unmanned Aerial Vehicle and a Convolutional Neural Network. Automat. Constr. 2020, 109, 102994. [Google Scholar] [CrossRef]
- Chen, Q.; Wang, L.; Waslander, S.L.; Liu, X. An End-to-End Shape Modeling Framework for Vectorized Building Outline Generation from Aerial Images. ISPRS J. Photogramm. Remote Sens 2020, 170, 114–126. [Google Scholar] [CrossRef]
- Jung, C.R.; Schramm, R. Rectangle Detection Based on a Windowed Hough Transform. In Proceedings of the 17th Brazilian Symposium on Computer Graphics and Image Processing, Curitiba, Brazil, 20–20 October 2004; pp. 113–120. [Google Scholar]
- Simonetto, E.; Oriot, H.; Garello, R. Rectangular Building Extraction from Stereoscopic Airborne Radar Images. IEEE Trans. Geosci. Remote Sens. 2005, 43, 2386–2395. [Google Scholar] [CrossRef]
- Wei, D. Research on Buildings Extraction Technology on High Resolution Remote Sensing Images. Master’s Thesis, Information Engineering University, Zhengzhou, China, 2013. [Google Scholar]
- Zhao, Z.; Zhang, Y. Building Extraction from Airborne Laser Point Cloud Using NDVI Constrained Watershed Algorithm. Acta Optica Sin. 2016, 36, 503–511. [Google Scholar]
- Maruyama, Y.; Tashiro, A.; Yamazaki, F. Use of Digital Surface Model Constructed from Digital Aerial Images to Detect Collapsed Buildings During Earthquake. Procedia Eng. 2011, 14, 552–558. [Google Scholar] [CrossRef] [Green Version]
- Badrinarayanan, V.; Kendall, A.; Cipolla, R. SegNet: A Deep Convolutional Encoder-Decoder Architecture for Image Segmentation. IEEE Trans. Pattern Anal. Mach. Intell. 2017, 39, 2481–2495. [Google Scholar] [CrossRef] [PubMed]
- Long, J.; Shelhamer, E.; Darrell, T. Fully Convolutional Networks for Semantic Segmentation. In Proceedings of the 2015 IEEE Conference on Computer Vision and Pattern Recognition, Boston, MA, USA, 7–12 June 2015; pp. 3431–3440. [Google Scholar]
- Ronneberger, O.; Fischer, P.; Brox, T. U-Net: Convolutional Networks for Biomedical Image Segmentation. In Proceedings of the Medical Image Computing and Computer-Assisted Intervention—MICCAI 2015, Munich, Germany, 5–9 October 2015; pp. 234–241. [Google Scholar]
- Li, Q.; Mou, L.; Hua, Y.; Shi, Y.; Zhu, X.X. Building Footprint Generation Through Convolutional Neural Networks with Attraction Field Representation. IEEE Trans. Geosci. Remote Sens. 2022, 60, 1–17. [Google Scholar] [CrossRef]
- Luo, L.; Li, P.; Yan, X. Deep Learning-Based Building Extraction from Remote Sensing Images: A Comprehensive Review. Energies 2021, 14, 7982. [Google Scholar] [CrossRef]
- Qiu, Y.; Wu, F.; Yin, J.; Liu, C.; Gong, X.; Wang, A. MSL-Net: An Efficient Network for Building Extraction from Aerial Imagery. Remote Sens. 2022, 14, 3914. [Google Scholar] [CrossRef]
- Yin, J.; Wu, F.; Qiu, Y.; Li, A.; Liu, C.; Gong, X. A Multiscale and Multitask Deep Learning Framework for Automatic Building Extraction. Remote Sens. 2022, 14, 4744. [Google Scholar] [CrossRef]
- Zhu, Q.; Zhang, Y.; Wang, L.; Zhong, Y.; Guan, Q.; Lu, X.; Zhang, L.; Li, D. A Global Context-Aware and Batch-Independent Network for Road Extraction from VHR Satellite Imagery. ISPRS J. Photogramm. Remote Sens. 2021, 175, 353–365. [Google Scholar] [CrossRef]
- Hosseinpour, H.; Samadzadegan, F.; Javan, F.D. A Novel Boundary Loss Function in Deep Convolutional Networks to Improve the Buildings Extraction from High-Resolution Remote Sensing Images. IEEE J. Sel. Top. Appl. Earth Obs. Remote Sens. 2022, 15, 4437–4454. [Google Scholar] [CrossRef]
- Wang, Z.; Xu, N.; Wang, B.; Liu, Y.; Zhang, S. Urban Building Extraction from High-Resolution Remote Sensing Imagery Based on Multi-Scale Recurrent Conditional Generative Adversarial Network. GISci. Remote Sens. 2022, 59, 861–884. [Google Scholar] [CrossRef]
- Sun, Z.; Zhou, W.; Ding, C.; Xia, M. Multi-Resolution Transformer Network for Building and Road Segmentation of Remote Sensing Image. ISPRS Int. J. Geo Inf. 2022, 11, 165. [Google Scholar] [CrossRef]
- Liu, S.; Huang, D.; Wang, Y. Receptive Field Block Net for Accurate and Fast Object Detection. In Proceedings of the Computer Vision—ECCV 2018; Ferrari, V., Hebert, M., Sminchisescu, C., Weiss, Y., Eds.; Springer International Publishing: Cham, Switzerland, 2018; pp. 404–419. [Google Scholar]
- Chen, L.-C.; Papandreou, G.; Kokkinos, I.; Murphy, K.; Yuille, A.L. Deeplab: Semantic Image Segmentation with Deep Convolutional Nets, Atrous Convolution, and Fully Connected CRFs. IEEE Trans. Pattern Anal. Mach. Intell. 2018, 40, 834–848. [Google Scholar] [CrossRef] [Green Version]
- Deng, W.; Shi, Q.; Li, J. Attention-Gate-Based Encoder–Decoder Network for Automatical Building Extraction. IEEE J. Sel. Top. Appl. Earth Obs. Remote Sens. 2021, 14, 2611–2620. [Google Scholar] [CrossRef]
- Wen, Q.; Jiang, K.; Wang, W.; Liu, Q.; Guo, Q.; Li, L.; Wang, P. Automatic Building Extraction from Google Earth Images Under Complex Backgrounds Based on Deep Instance Segmentation Network. Sensors 2019, 19, 333. [Google Scholar] [CrossRef] [PubMed] [Green Version]
- Sun, K.; Xiao, B.; Liu, D.; Wang, J. Deep High-Resolution Representation Learning for Human Pose Estimation. In Proceedings of the 2019 IEEE/CVF Conference on Computer Vision and Pattern Recognition, Long Beach, CA, USA, 15–20 June 2019; pp. 5686–5696. [Google Scholar]
- Liu, H.; Liu, F.; Fan, X.; Huang, D. Polarized Self-Attention: Towards High-Quality Pixel-Wise Regression. arXiv 2021, arXiv:2107.00782. [Google Scholar]
- Zhu, X.; Hu, H.; Lin, S.; Dai, J. Deformable Convnets V2: More Deformable, Better Results. In Proceedings of the 2019 IEEE/CVF Conference on Computer Vision and Pattern Recognition, Long Beach, CA, USA, 15–20 June 2019; pp. 9300–9308. [Google Scholar]
- Hu, J.; Shen, L.; Sun, G. Squeeze-and-Excitation Networks. In Proceedings of the 2018 IEEE/CVF Conference on Computer Vision and Pattern Recognition, Salt Lake City, UT, USA, 18–23 June 2018; pp. 7132–7141. [Google Scholar]
- Yu, F.; Koltun, V. Multi-Scale Context Aggregation by Dilated Convolutions. arXiv 2016, arXiv:1511.07122. [Google Scholar]
- Ji, S.; Wei, S.; Lu, M. Fully Convolutional Networks for Multisource Building Extraction from an Open Aerial and Satellite Imagery Data Set. IEEE Trans. Geosci. Remote Sens. 2019, 57, 574–586. [Google Scholar] [CrossRef]
- Maggiori, E.; Tarabalka, Y.; Charpiat, G.; Alliez, P. Can Semantic Labeling Methods Generalize to Any City? The Inria Aerial Image Labeling Benchmark. In Proceedings of the 2017 IEEE International Geoscience and Remote Sensing Symposium, Fort Worth, TX, USA, 23–28 July 2017; pp. 3226–3229. [Google Scholar]
- Mnih, V. Machine Learning for Aerial Image Labeling. Ph.D. Thesis, University of Toronto, Toronto, ON, Canada, 2013. [Google Scholar]
- Wu, K.; Zheng, D.; Chen, Y.; Zeng, L.; Zhang, J.; Chai, S.; Xu, W.; Yang, Y.; Li, S.; Liu, Y.; et al. A Dataset of Building Instances of Typical Cities in China. China Sci. 2021, 6, 182–190. [Google Scholar]
- Sun, K.; Zhao, Y.; Jiang, B.; Cheng, T.; Xiao, B.; Liu, D.; Mu, Y.; Wang, X.; Liu, W.; Wang, J. High-Resolution Representations for Labeling Pixels and Regions. arXiv 2019, arXiv:1904.04514. [Google Scholar]
- Chen, J.; Zhang, D.; Wu, Y.; Chen, Y.; Yan, X. A Context Feature Enhancement Network for Building Extraction from High-Resolution Remote Sensing Imagery. Remote Sens. 2022, 14, 2276. [Google Scholar] [CrossRef]
- Loshchilov, I.; Hutter, F. SGDR: Stochastic Gradient Descent with Warm Restarts. arXiv 2017, arXiv:1608.03983. [Google Scholar]
- Chen, K.; Zou, Z.; Shi, Z. Building Extraction from Remote Sensing Images with Sparse Token Transformers. Remote Sens. 2021, 13, 4441. [Google Scholar] [CrossRef]
- Cai, J.; Chen, Y. MHA-Net: Multipath Hybrid Attention Network for Building Footprint Extraction from High-Resolution Remote Sensing Imagery. IEEE J. Sel. Top. Appl. Earth Obs. Remote Sens. 2021, 14, 5807–5817. [Google Scholar] [CrossRef]
- Zhu, Q.; Liao, C.; Hu, H.; Mei, X.; Li, H. MAP-Net: Multiple Attending Path Neural Network for Building Footprint Extraction from Remote Sensed Imagery. IEEE Trans. Geosci. Remote Sens. 2021, 59, 6169–6181. [Google Scholar] [CrossRef]
- Wang, Y.; Zeng, X.; Liao, X.; Zhuang, D. B-FGC-Net: A Building Extraction Network from High Resolution Remote Sensing Imagery. Remote Sens. 2022, 14, 269. [Google Scholar] [CrossRef]
- Yu, M.; Chen, X.; Zhang, W.; Liu, Y. AGS-Unet: Building Extraction Model for High Resolution Remote Sensing Images Based on Attention Gates U Network. Sensors 2022, 22, 2932. [Google Scholar] [CrossRef]


| Dataset | Resolution | Pixels | Coverage Area | Source Area |
|---|---|---|---|---|
| WHU dataset | 0.3 m | 512 × 512 | 450 km2 | Christchurch, New Zealand |
| Inria dataset | 0.3 m | 5000 × 5000 | 810 km2 | San Francisco, Chicago, the Alps, and others |
| Massachusetts dataset | 1.0 m | 1500 × 1500 | 240 km2 | Boston area, USA |
| BITCC dataset | 0.29 m | 500 × 500 | 120 km2 | Beijing, Shanghai, Shenzhen, and Wuhan, China |
| Dataset | Training Set (Tiles) | Validation Set (Tiles) | Test Set (Tiles) |
|---|---|---|---|
| WHU dataset | 4737 | 1036 | 2416 |
| Inria dataset | 14,418 | 1782 | 1800 |
| Massachusetts dataset | 1233 | 36 | 90 |
| BITCC dataset | 5790 | 716 | 723 |
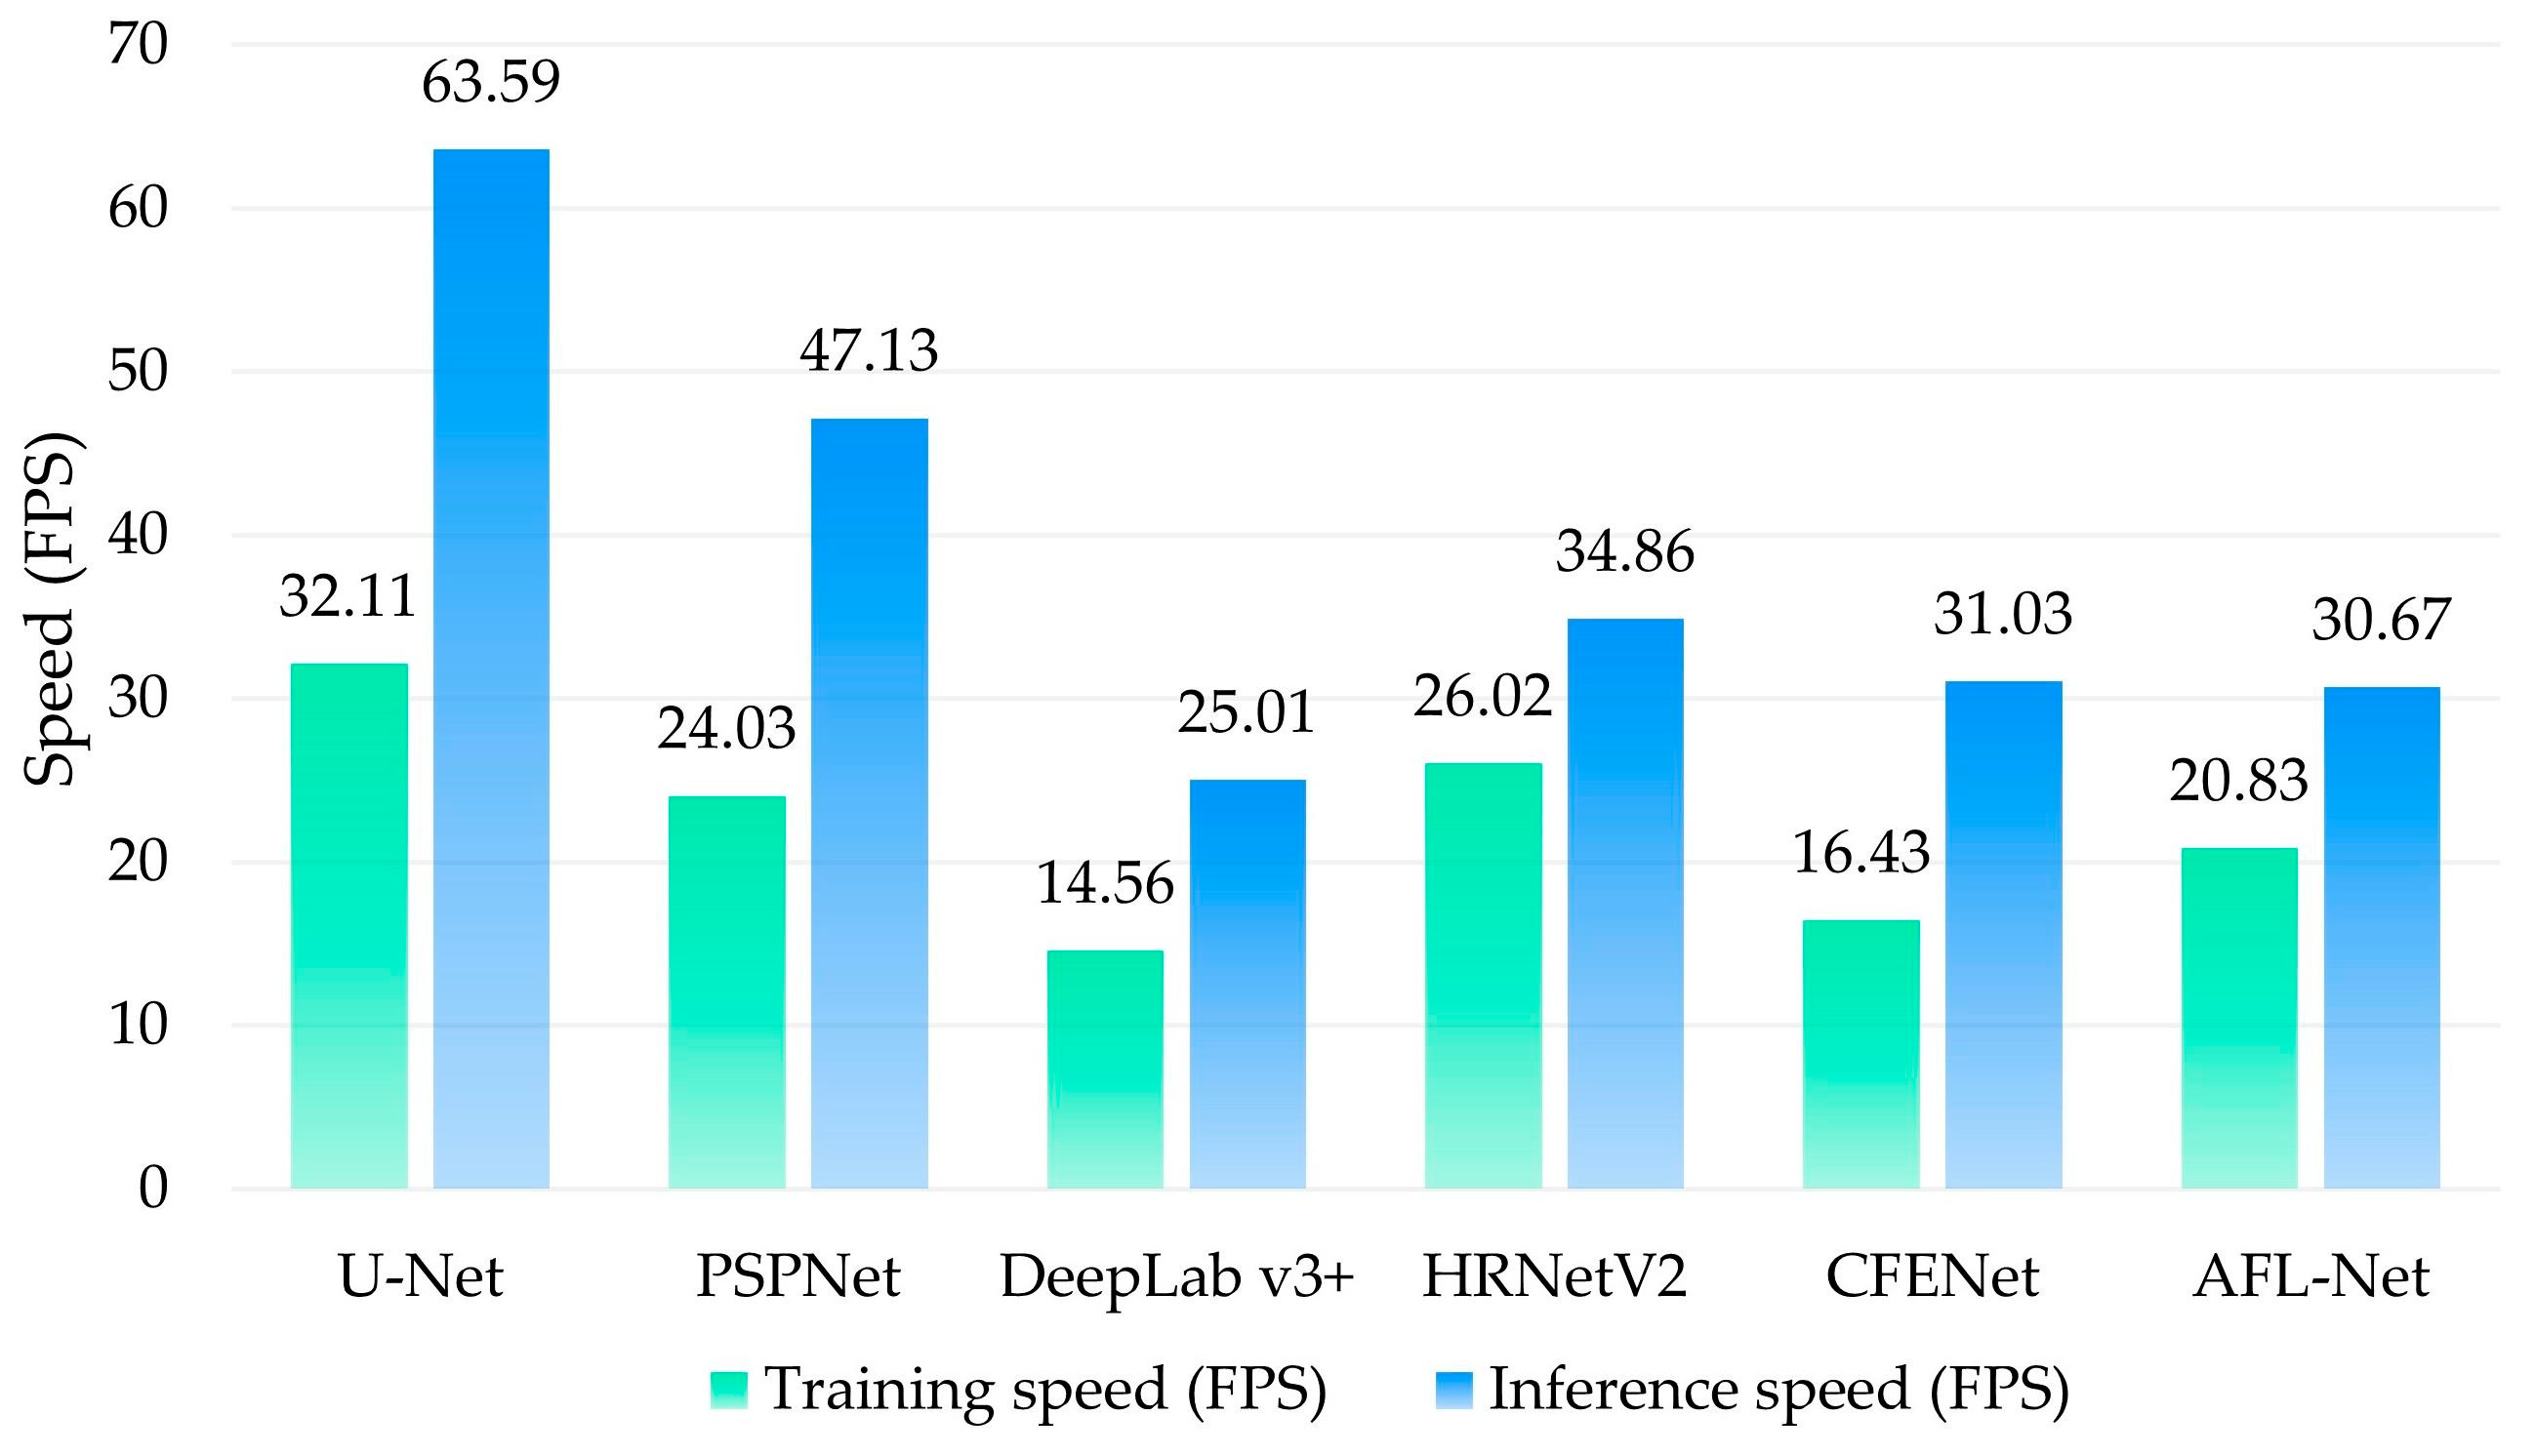
| Method | Parameters | Training Speed | Inference Speed | WHU | Inria | Massachusetts | BITCC | ||||
|---|---|---|---|---|---|---|---|---|---|---|---|
| IoU (%) | F1 Score (%) | IoU (%) | F1 Score (%) | IoU (%) | F1 Score (%) | IoU (%) | F1 Score (%) | ||||
| Baseline | 9.64 M | 26.02 FPS | 34.86 FPS | 90.64 | 95.09 | 81.09 | 89.56 | 71.78 | 83.57 | 79.10 | 88.33 |
| Baseline+ SFR | 9.83 M | 22.32 FPS | 32.68 FPS | 91.10 | 95.34 | 81.65 | 89.90 | 72.85 | 84.29 | 79.51 | 88.59 |
| Baseline+ AMFF | 9.94 M | 23.73 FPS | 34.05 FPS | 91.21 | 95.41 | 81.82 | 90.00 | 72.94 | 84.35 | 79.46 | 88.56 |
| Baseline+ SFR + AMFF | 10.13 M | 20.83 FPS | 30.67 FPS | 91.37 | 95.49 | 82.10 | 90.17 | 73.27 | 84.57 | 79.81 | 88.77 |
Disclaimer/Publisher’s Note: The statements, opinions and data contained in all publications are solely those of the individual author(s) and contributor(s) and not of MDPI and/or the editor(s). MDPI and/or the editor(s) disclaim responsibility for any injury to people or property resulting from any ideas, methods, instructions or products referred to in the content. |
© 2022 by the authors. Licensee MDPI, Basel, Switzerland. This article is an open access article distributed under the terms and conditions of the Creative Commons Attribution (CC BY) license (https://creativecommons.org/licenses/by/4.0/).
Share and Cite
Qiu, Y.; Wu, F.; Qian, H.; Zhai, R.; Gong, X.; Yin, J.; Liu, C.; Wang, A. AFL-Net: Attentional Feature Learning Network for Building Extraction from Remote Sensing Images. Remote Sens. 2023, 15, 95. https://doi.org/10.3390/rs15010095
Qiu Y, Wu F, Qian H, Zhai R, Gong X, Yin J, Liu C, Wang A. AFL-Net: Attentional Feature Learning Network for Building Extraction from Remote Sensing Images. Remote Sensing. 2023; 15(1):95. https://doi.org/10.3390/rs15010095
Chicago/Turabian StyleQiu, Yue, Fang Wu, Haizhong Qian, Renjian Zhai, Xianyong Gong, Jichong Yin, Chengyi Liu, and Andong Wang. 2023. "AFL-Net: Attentional Feature Learning Network for Building Extraction from Remote Sensing Images" Remote Sensing 15, no. 1: 95. https://doi.org/10.3390/rs15010095