Article

EfficientUNet+: A Building Extraction Method for Emergency Shelters Based on Deep Learning

1
Aerospace Information Research Institute, Chinese Academy of Sciences, Beijing 100094, China
2
University of Chinese Academy of Sciences, Beijing 100049, China
3
Key Laboratory of Earth Observation of Hainan Province, Hainan Aerospace Information Research Institute, Sanya 572029, China
*
Author to whom correspondence should be addressed.
These authors contributed equally to this work.
Remote Sens. 2022, 14(9), 2207; https://doi.org/10.3390/rs14092207
Submission received: 8 April 2022 / Revised: 30 April 2022 / Accepted: 2 May 2022 / Published: 5 May 2022
(This article belongs to the Topic Computational Intelligence in Remote Sensing)

Abstract

:
Quickly and accurately extracting buildings from remote sensing images is essential for urban planning, change detection, and disaster management applications. In particular, extracting buildings that cannot be sheltered in emergency shelters can help establish and improve a city’s overall disaster prevention system. However, small building extraction often involves problems, such as integrity, missed and false detection, and blurred boundaries. In this study, EfficientUNet+, an improved building extraction method from remote sensing images based on the UNet model, is proposed. This method uses EfficientNet-b0 as the encoder and embeds the spatial and channel squeeze and excitation (scSE) in the decoder to realize forward correction of features and improve the accuracy and speed of model extraction. Next, for the problem of blurred boundaries, we propose a joint loss function of building boundary-weighted cross-entropy and Dice loss to enforce constraints on building boundaries. Finally, model pretraining is performed using the WHU aerial building dataset with a large amount of data. The transfer learning method is used to complete the high-precision extraction of buildings with few training samples in specific scenarios. We created a Google building image dataset of emergency shelters within the Fifth Ring Road of Beijing and conducted experiments to verify the effectiveness of the method in this study. The proposed method is compared with the state-of-the-art methods, namely, DeepLabv3+, PSPNet, ResUNet, and HRNet. The results show that the EfficientUNet+ method is superior in terms of Precision, Recall, F1-Score, and mean intersection over union (mIoU). The accuracy of the EfficientUNet+ method for each index is the highest, reaching 93.01%, 89.17%, 91.05%, and 90.97%, respectively. This indicates that the method proposed in this study can effectively extract buildings in emergency shelters and has an important reference value for guiding urban emergency evacuation.

1. Introduction

Extracting buildings is of great significance for applications such as urban planning, land use change, and environmental monitoring [1,2], particularly for buildings in emergency shelters. This process helps improve disaster prevention and mitigation and other management capabilities [3]. An emergency shelter is a safe place for emergency evacuation and temporary dwelling for residents in response to sudden disasters such as earthquakes [4]. These temporary facilities mainly include open spaces, such as parks, green spaces, stadiums, playgrounds, and squares [5]. When disasters occur, buildings are prone to collapse and can injure people [6]. Some areas cannot be used for evacuation. Therefore, extracting buildings from emergency shelters has important guiding relevance in evaluating the emergency evacuation capabilities of shelters.
In the early days, the building footprint in emergency shelters was mainly obtained by manual measurement. The spatial resolution of satellite remote sensing images has reached the submeter level with the development of Earth observation technology. High-resolution remote sensing images have the advantages of rich ground object information, multiple imaging spectral bands, and short revisit time [7,8,9]. Thus, these images can accurately show the details of urban areas, providing critical support for extracting buildings. Despite the detailed information that these images provide, spectral errors, such as “intra-class spectral heterogeneity” and “inter-class spectral homogeneity”, exist [10]. These errors increase the difficulty of building extraction. Moreover, buildings have various features, such as shapes, materials, and colors, complicating the quick and accurate extraction of buildings from high-resolution remote sensing images [11,12].
The traditional methods of extracting buildings based on remote sensing images mainly include image classification based on pixel features and object-oriented classification. The extraction methods based on pixel features mainly rely on the information of a single pixel for classification; these methods include support vector machine and morphological building index, which are relatively simple and efficient to use [13]. However, they ignore the relationship between adjacent pixels and lack the use of spatial information of ground objects. They are prone to “salt and pepper noise”, resulting in the blurred boundaries of the extracted buildings [14]. Based on object-oriented extraction methods, pixels are clustered according to relative homogeneity to form objects for classification, utilizing spatial relationships or context information to obtain good classification accuracy [15]. However, classification accuracy largely depends on image segmentation results, and the segmentation scale is difficult to determine; thus, problems such as oversegmentation or undersegmentation are prone to occur [16], resulting in complex object-oriented classification methods.
Deep learning has a strong generalization ability and efficient feature expression ability [17]. It bridges the semantic gap, integrates feature extraction and image classification, and avoids preprocessing, such as image segmentation, through the hierarchical end-to-end construction method. It can also automatically perform hierarchical feature extraction on massive raw data, reduce the definition of feature rules by humans, lessen labor costs, and solve problems such as the inaccurate representation of ground objects caused by artificially designed features [18,19]. With the rapid development of artificial intelligence technology in recent years, deep learning has played a prominent role in image processing, change detection, and information extraction. It has been widely used in building extraction, and the extraction method has been continuously improved.
Convolutional neural network (CNN) is the most widely used method for structural image classification and change detection [20]. CNN can solve the problems caused by inaccurate empirically designed features by eliminating the gap between different semantics; it can also learn feature representations from the data in the hierarchical structure itself [21], improving the accuracy of building extraction. Tang et al. [22] proposed to use the vector “capsule” to store building features. The encoder extracts the “capsule” from the remote sensing image, and the decoder calculates the target building, which not only realizes the effective extraction of buildings, but also has good generalization. Li et al. [23] used the improved faster regions with a convolutional neural network (R-CNN) detector; the spectral residual method is embedded into the deep learning network model to extract the rural built-up area. Chen et al. [24] used a multi-scale feature learning module in CNN to achieve better results in extracting buildings from remote sensing images. However, CNN requires ample storage space, and repeated calculations lead to low computational efficiency. Moreover, only some local features can be extracted, limiting the classification performance.
Fully convolutional neural network (FCN) is an improvement based on CNN. It uses a convolutional layer to replace the fully connected layer after CNN; it also realizes end-to-end semantic segmentation for the first time [25]. FCN fuses deep and shallow features of the same resolution to recover the spatial information lost during feature extraction [26]. It is widely used in image semantic segmentation. Bittner et al. [27] proposed an end-to-end FCN method based on the automatic extraction of relevant features and dense image classification. Their proposed method effectively combines spectral and height information from different data sources (high-resolution imagery and digital surface model, DSM). Moreover, the network increases additional connections, providing access to high-frequency information for the top-level classification layers and improving the spatial resolution of building outline outputs. Xu et al. [28] pointed out that the FCN model can detect different classes of objects on the ground, such as buildings, curves of roads, and trees, and predict their shapes. Wei et al. [29] introduced multiscale aggregation and two postprocessing strategies in FCN to achieve accurate binary segmentation. They also proposed a specific, robust, and effective polygon regularization algorithm to convert segmented building boundaries into structured footprints for high building extraction accuracy. Although FCN has achieved good results in building extraction, it does not consider the relationship between pixels. It also focuses mainly on global features and ignores local features, resulting in poor prediction results and a lack of edge information. However, FCN is symbolic in the field of image semantic segmentation, and most of the later deep learning network models are improved and innovated based on it.
The UNet network model belongs to one of the FCN variants. It adds skip connections between the encoding and decoding of FCN. The decoder can receive low-level features from the encoder, form outputs, retain boundary information, fuse high- and low-level semantic features of the network, and achieve good extraction results through skip connections [30]. In recent years, many image segmentation algorithms have used the UNet network as the original segmentation network model, and these algorithms have been fine-tuned and optimized on this basis. Ye et al. [31] proposed RFN-UNet, which considers the semantic gap between features at different stages. It also uses an attention mechanism to bridge the gap between feature fusions and achieves good building extraction results in public datasets. Qin et al. [32] proposed a network structure U2Net with a two-layer nested UNet. This model can capture a large amount of context information and has a remarkable effect on change detection. Peng et al. [33] used UNet++ as the backbone extraction network and proposed a differentially enhanced dense attention CNN for detecting changes in bitemporal optical remote sensing images. In order to improve the spatial information perception ability of the network, Wang et al. [34] proposed a building method, B-FGC-Net, with prominent features, global perception, and cross-level information fusion. Wang et al. [35] combined UNet, residual learning, atrous spatial pyramid pooling, and focal loss, and the ResUNet model was proposed to extract buildings. Based on refined attention pyramid networks (RAPNets), Tian et al. [36] embedded salient multi-scale features into a convolutional block attention module to improve the accuracy of building extraction.
Most of the above methods of extracting buildings are performed on standard public datasets or large-scale building scenarios. They rarely involve buildings in special scenarios, such as emergency shelters. The volume and footprint of buildings in emergency shelters are generally small. For such small buildings, UNet [
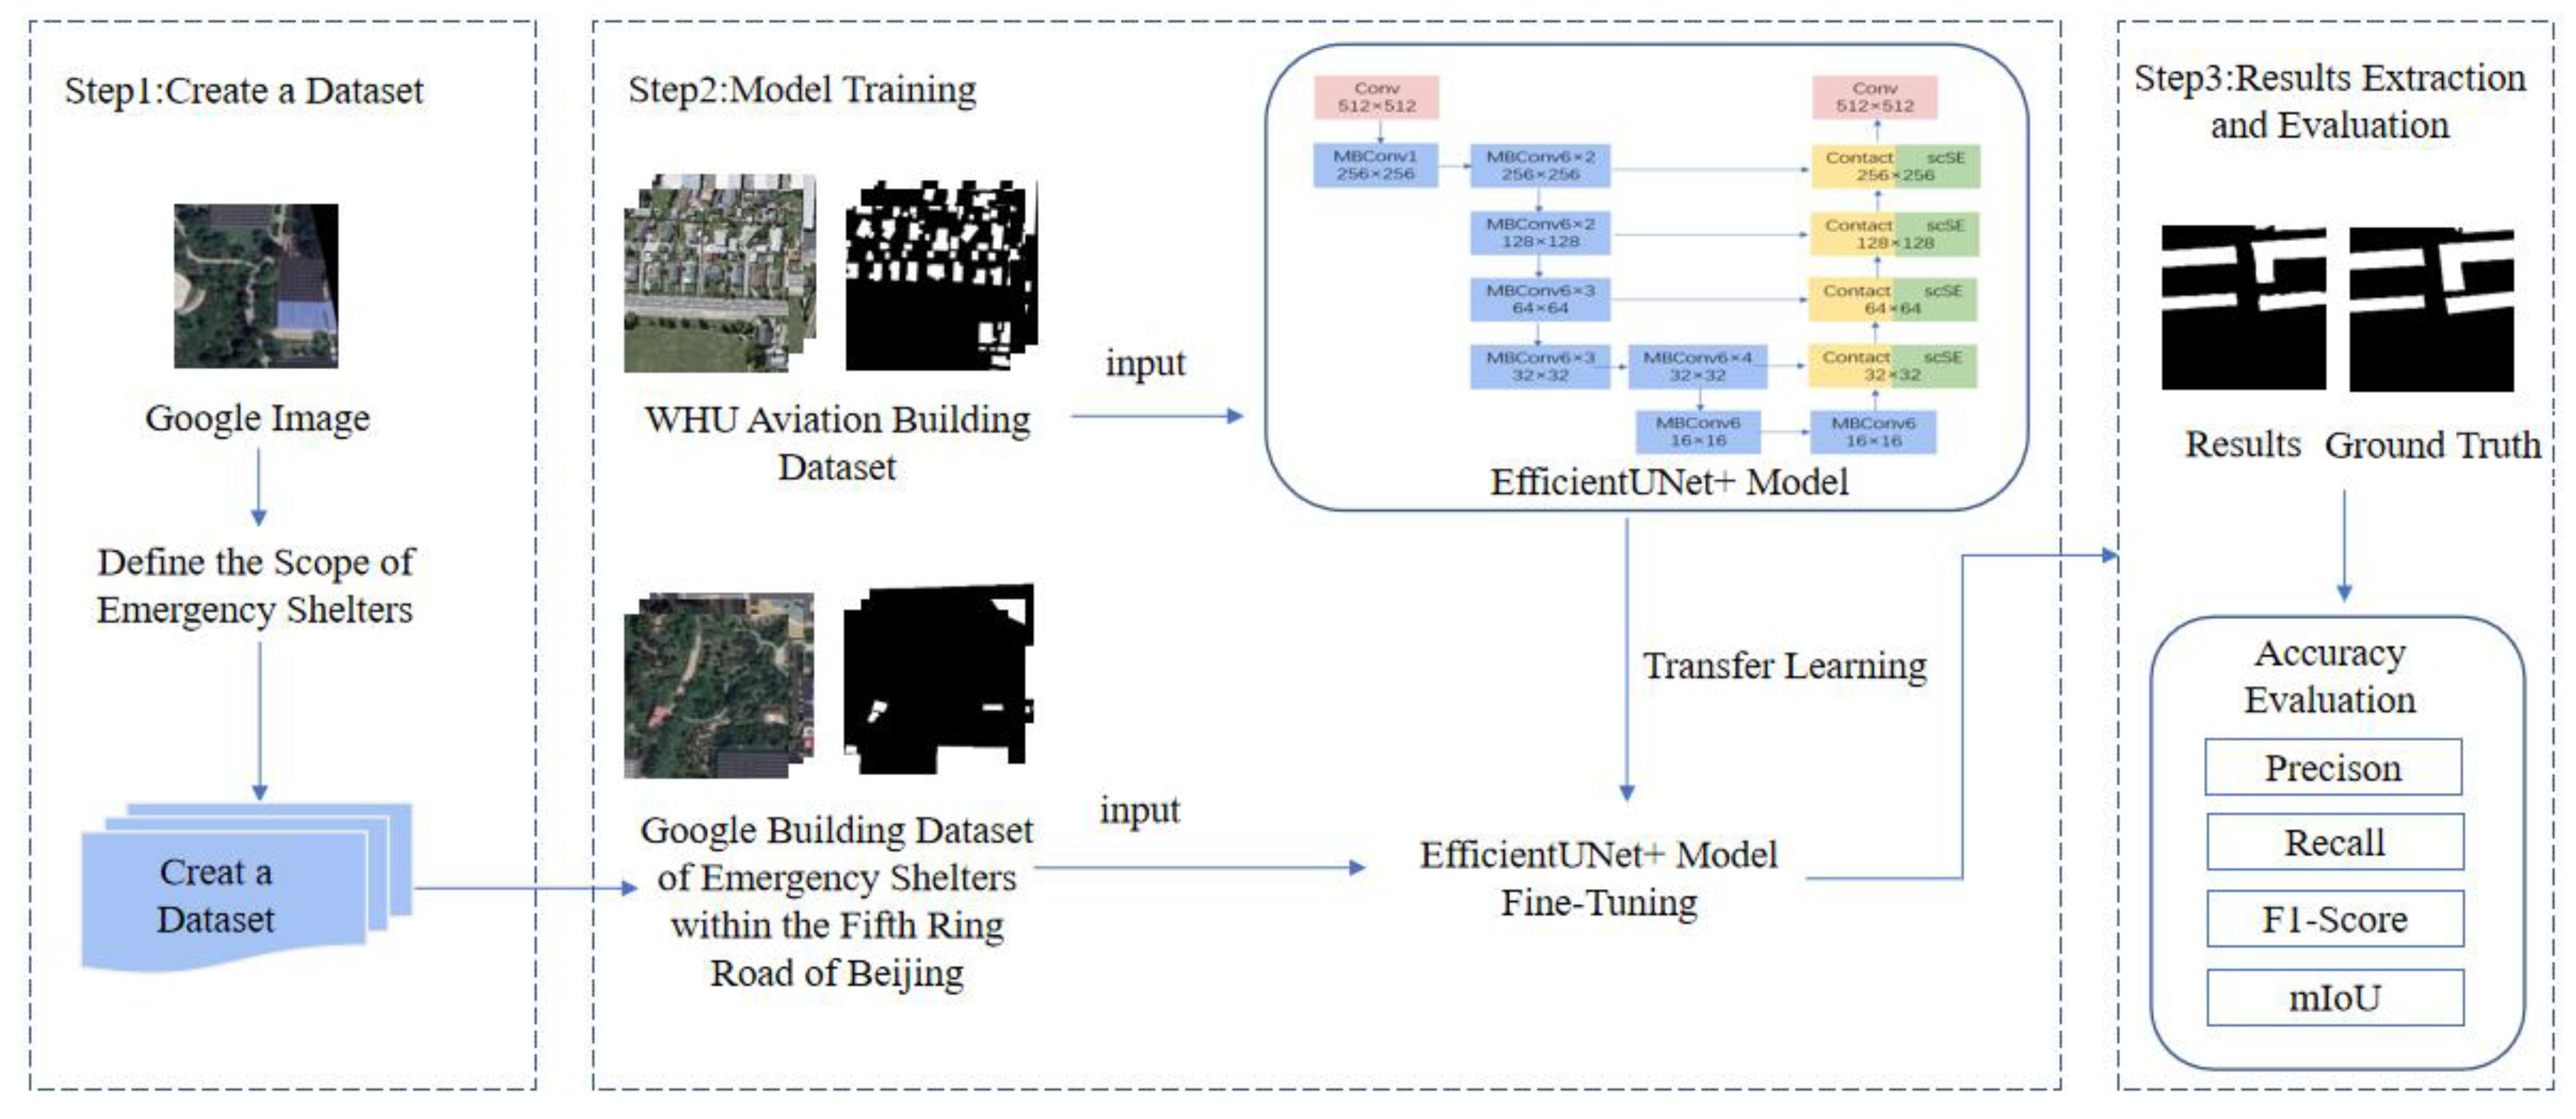
30] structure can integrate high- and low-level features effectively and restore fine edges, thereby reducing the problems of missed and false detection and blurred edges during building extraction. We use UNet as the overall framework to design a fully convolutional neural network, namely, the EfficientUNet+ method. We verify this method by taking an emergency shelter within the Fifth Ring Road of Beijing as an example. The innovations of the EfficientUNet+ method are as follows:
(1)
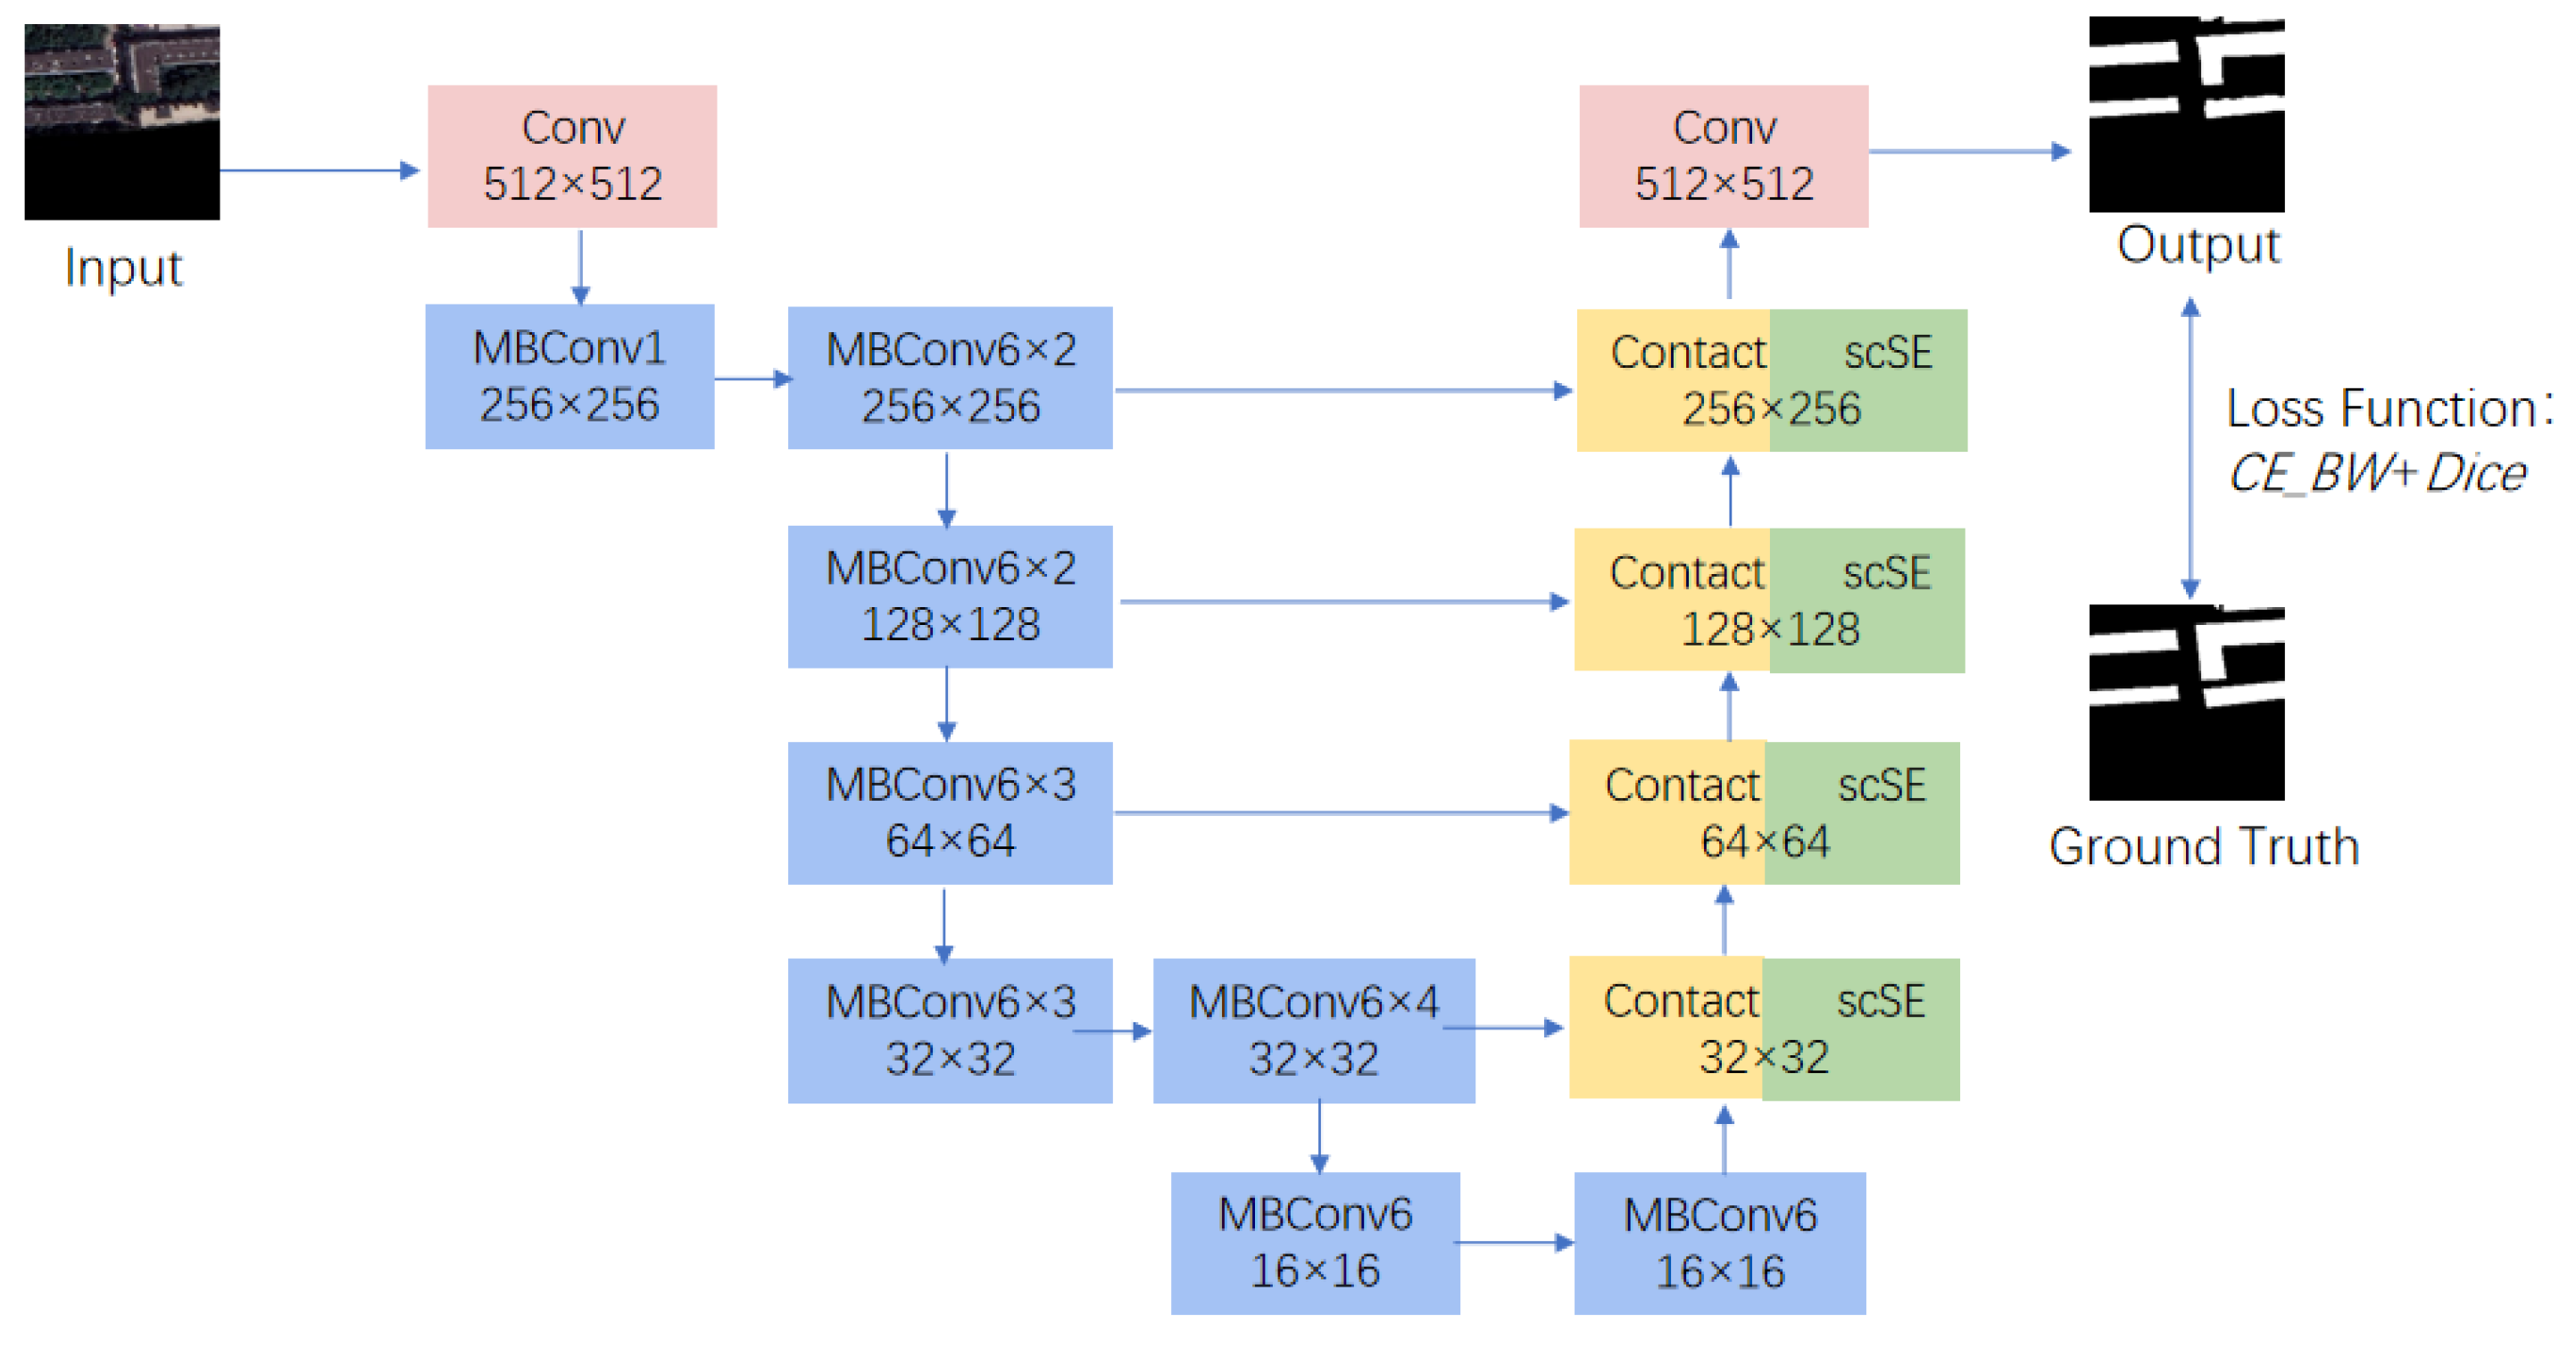
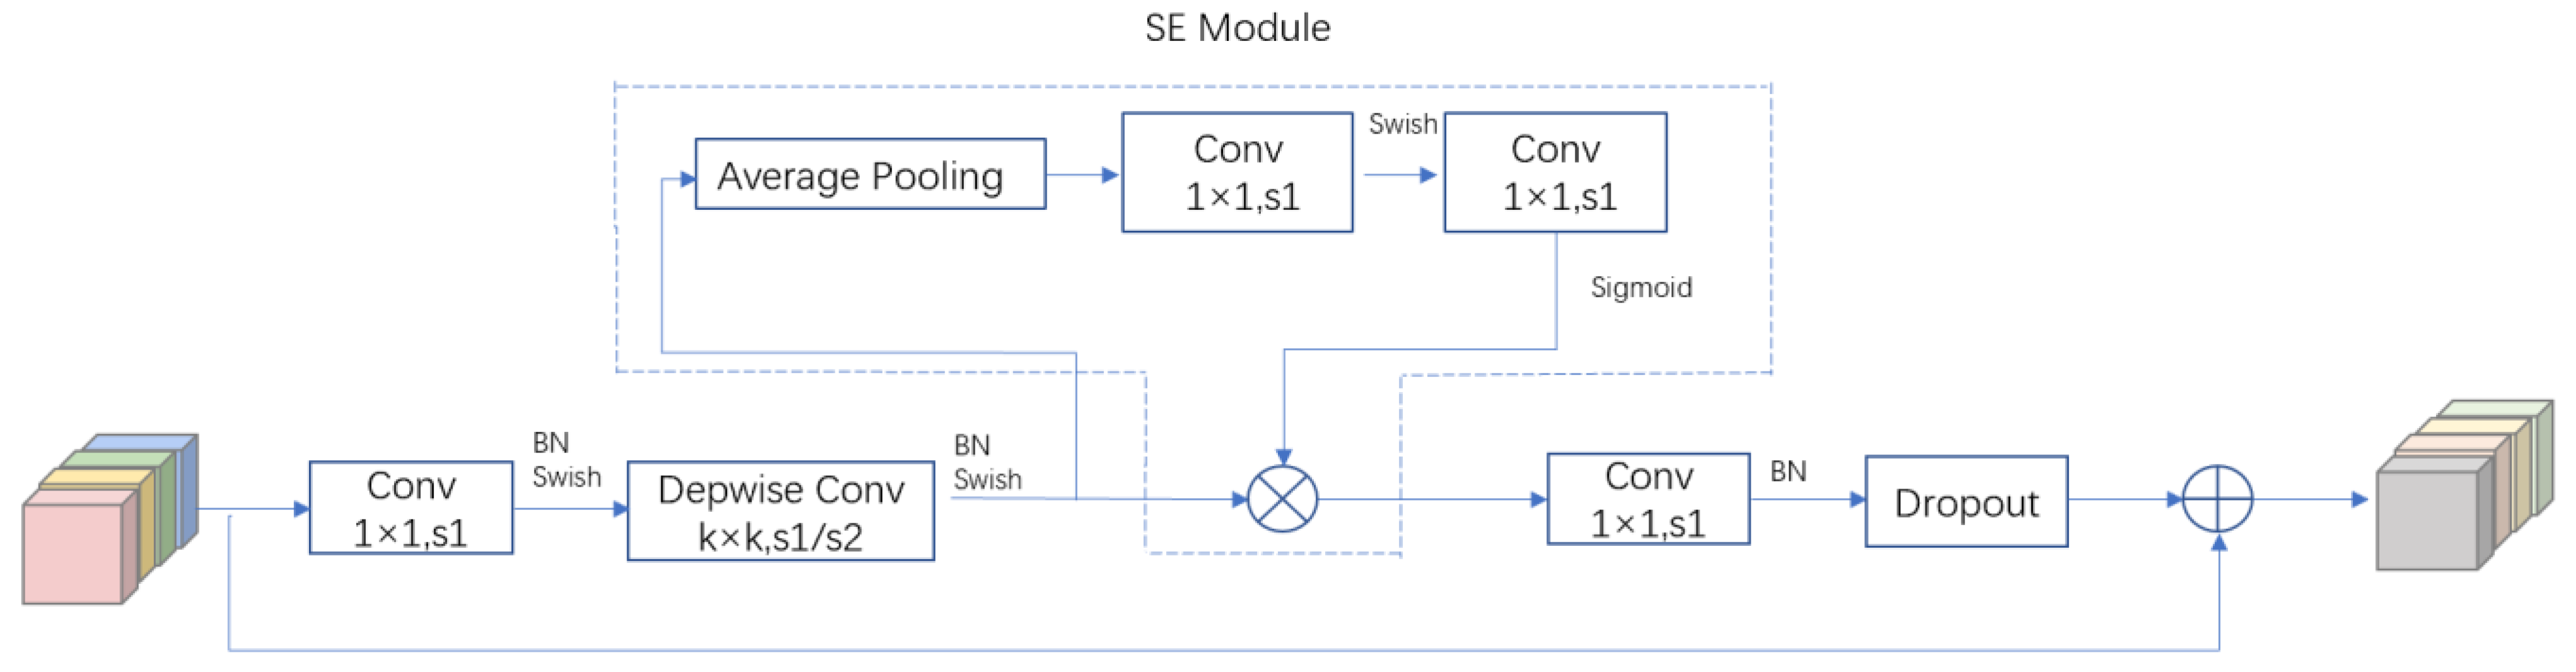
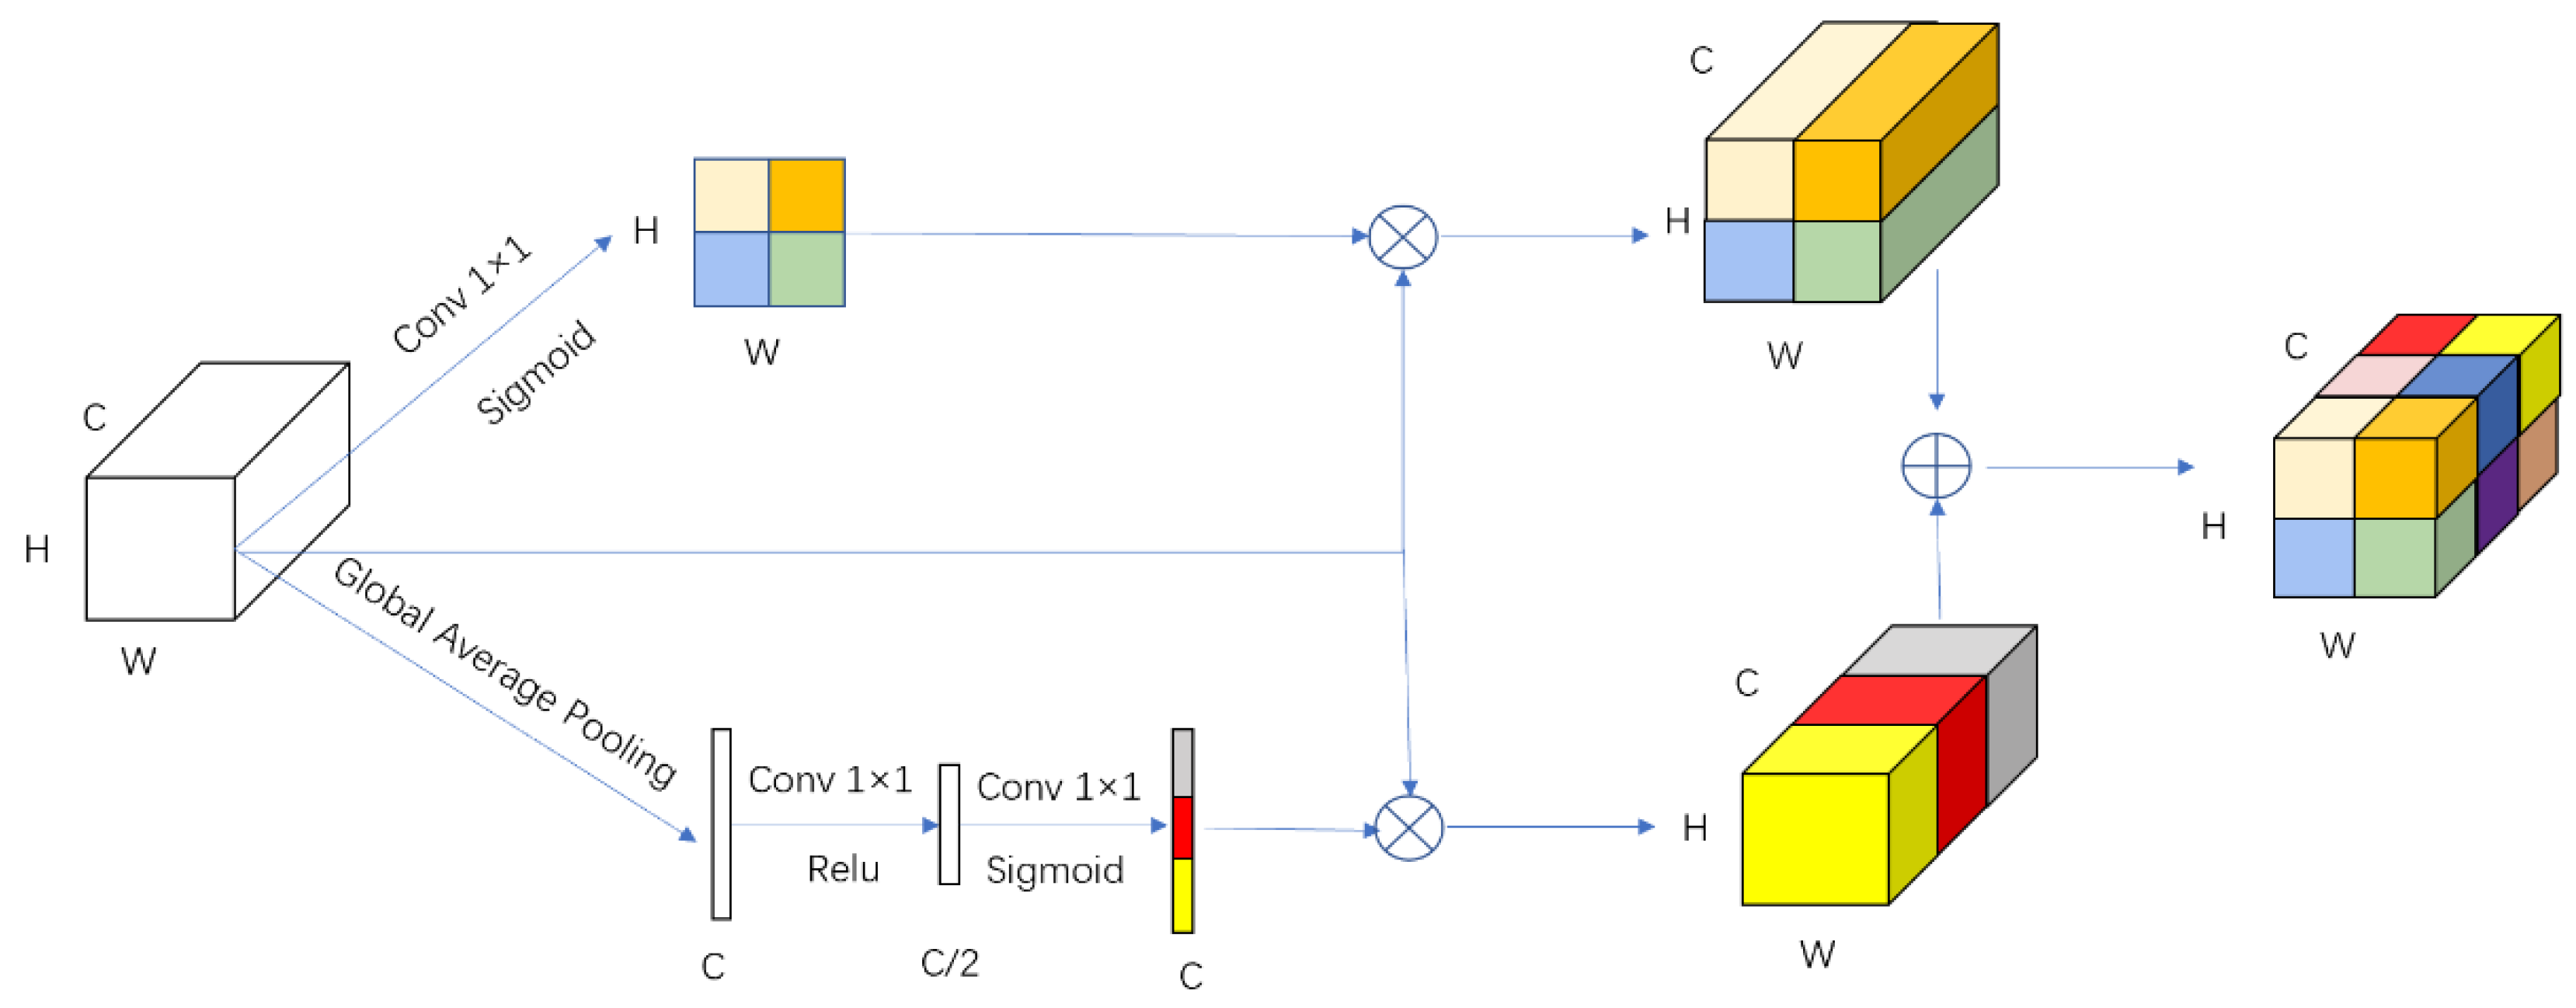
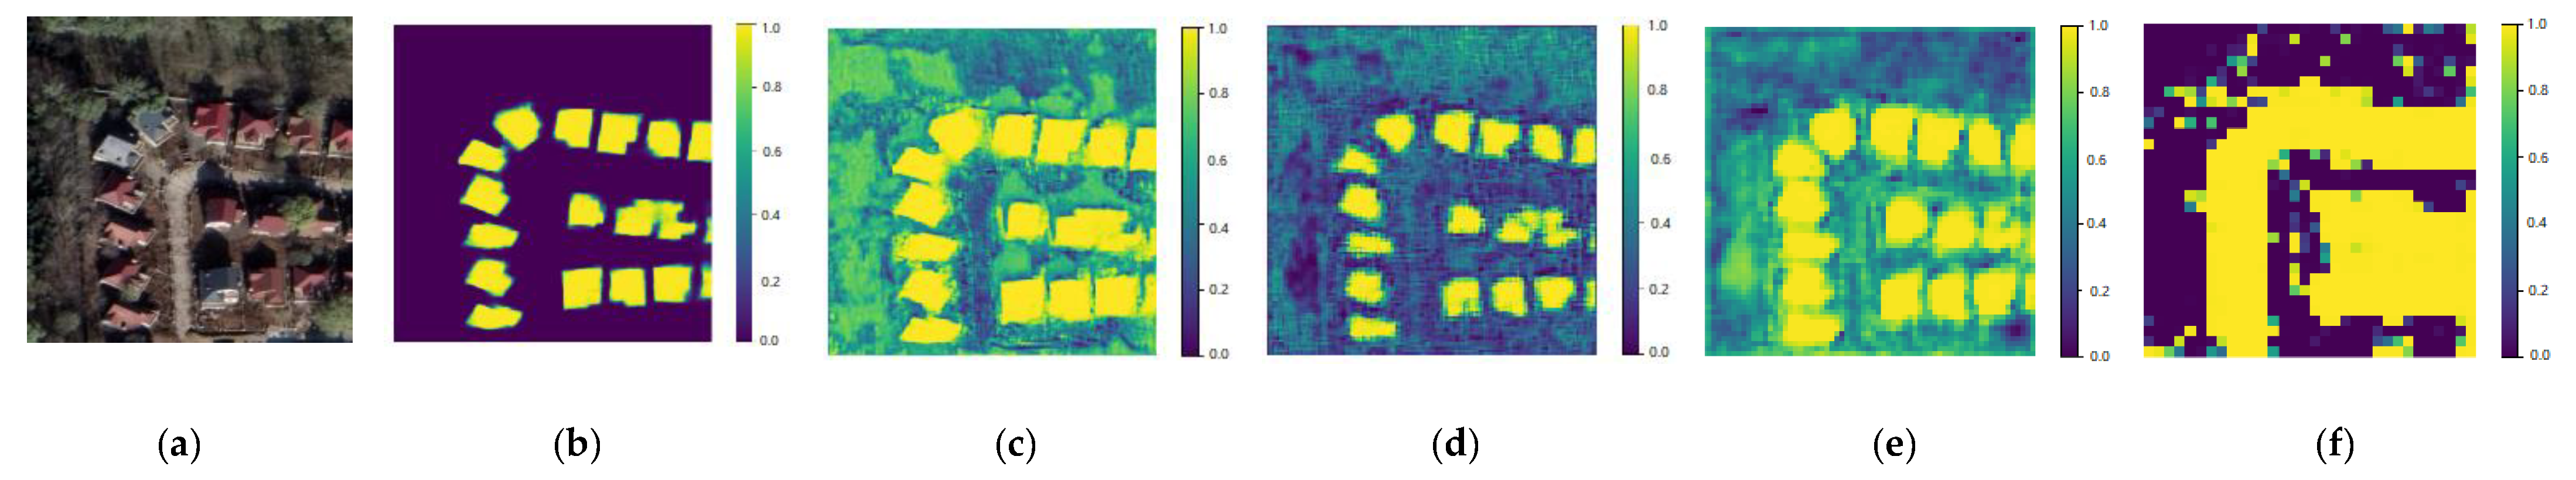
We use EfficientNet-b0 as the encoder to trade off model accuracy and speed. The features extracted by the model are crucial to the segmentation results; we also embed the spatial and channel squeeze and excitation (scSE) in the decoder to achieve positive correction of features.
(2)
The accurate boundary segmentation of positive samples in the segmentation results has always been a challenge. We weight the building boundary area with the cross-entropy function and combine the Dice loss to alleviate this problem from the perspective of the loss function.
(3)
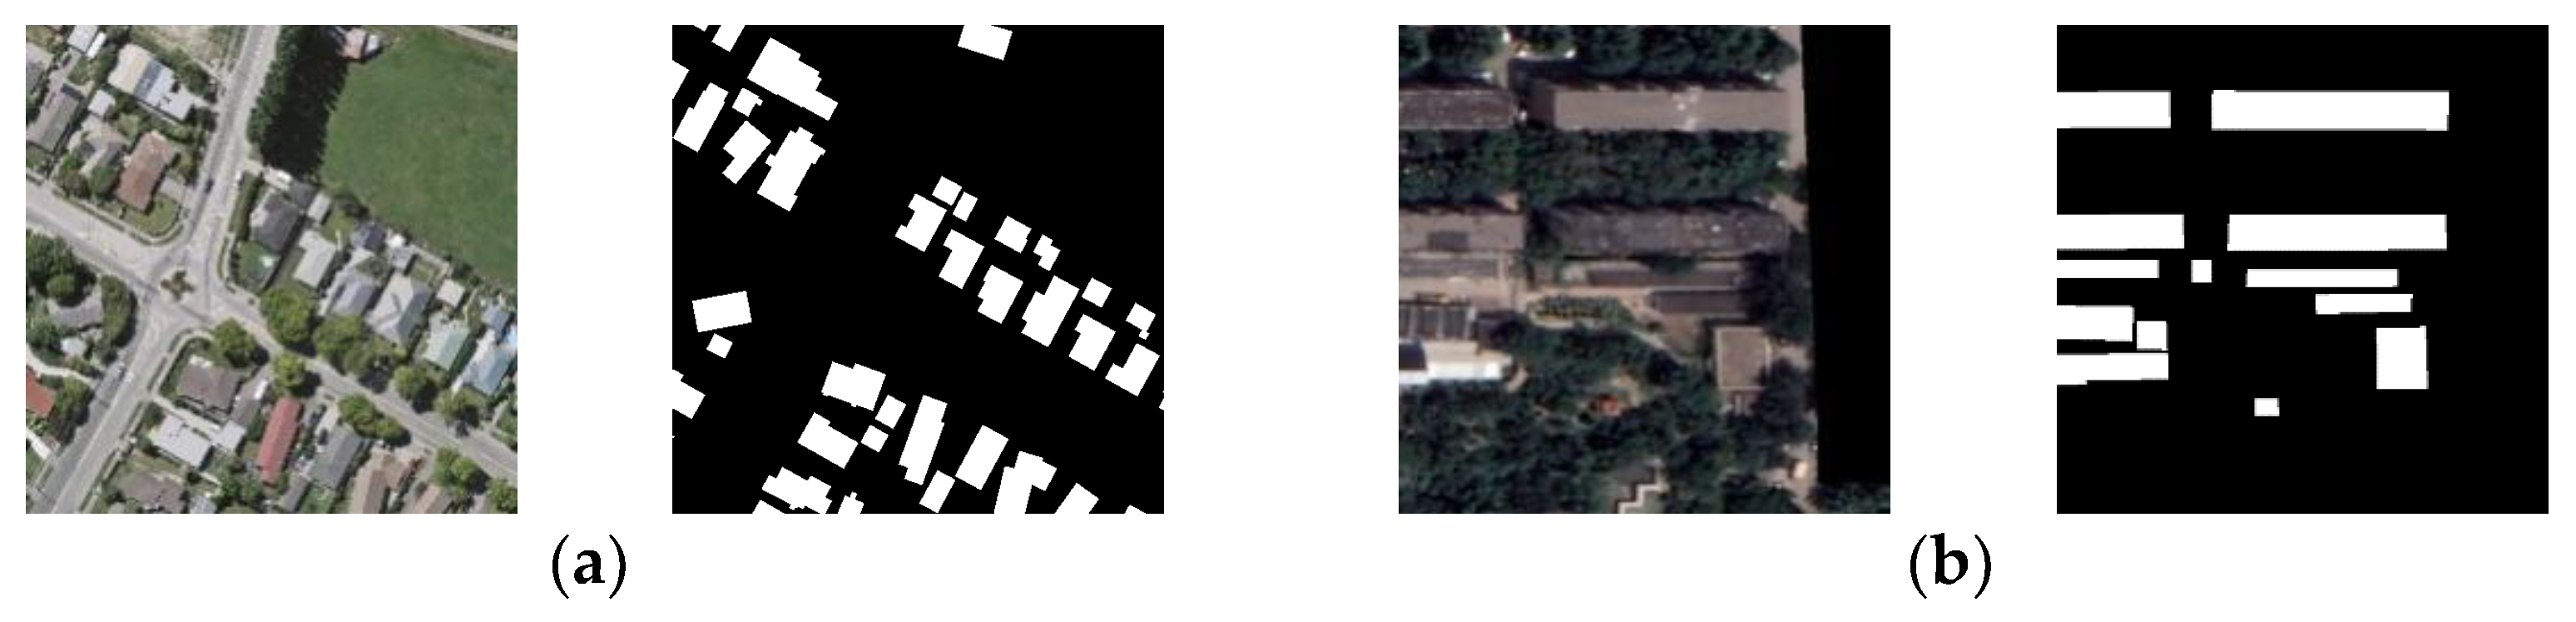
Producing a large number of samples for emergency shelters within the Fifth Ring Road of Beijing is time-consuming and labor-intensive. We use the existing public WHU aerial building dataset for transfer learning to achieve high extraction accuracy using a few samples. It can improve the computational efficiency and robustness of the model.
This paper is organized as follows: Section 2 “Methods” introduces the EfficientUNet+ model overview, which includes EfficientNet-b0, scSE module, loss function, and transfer learning; 
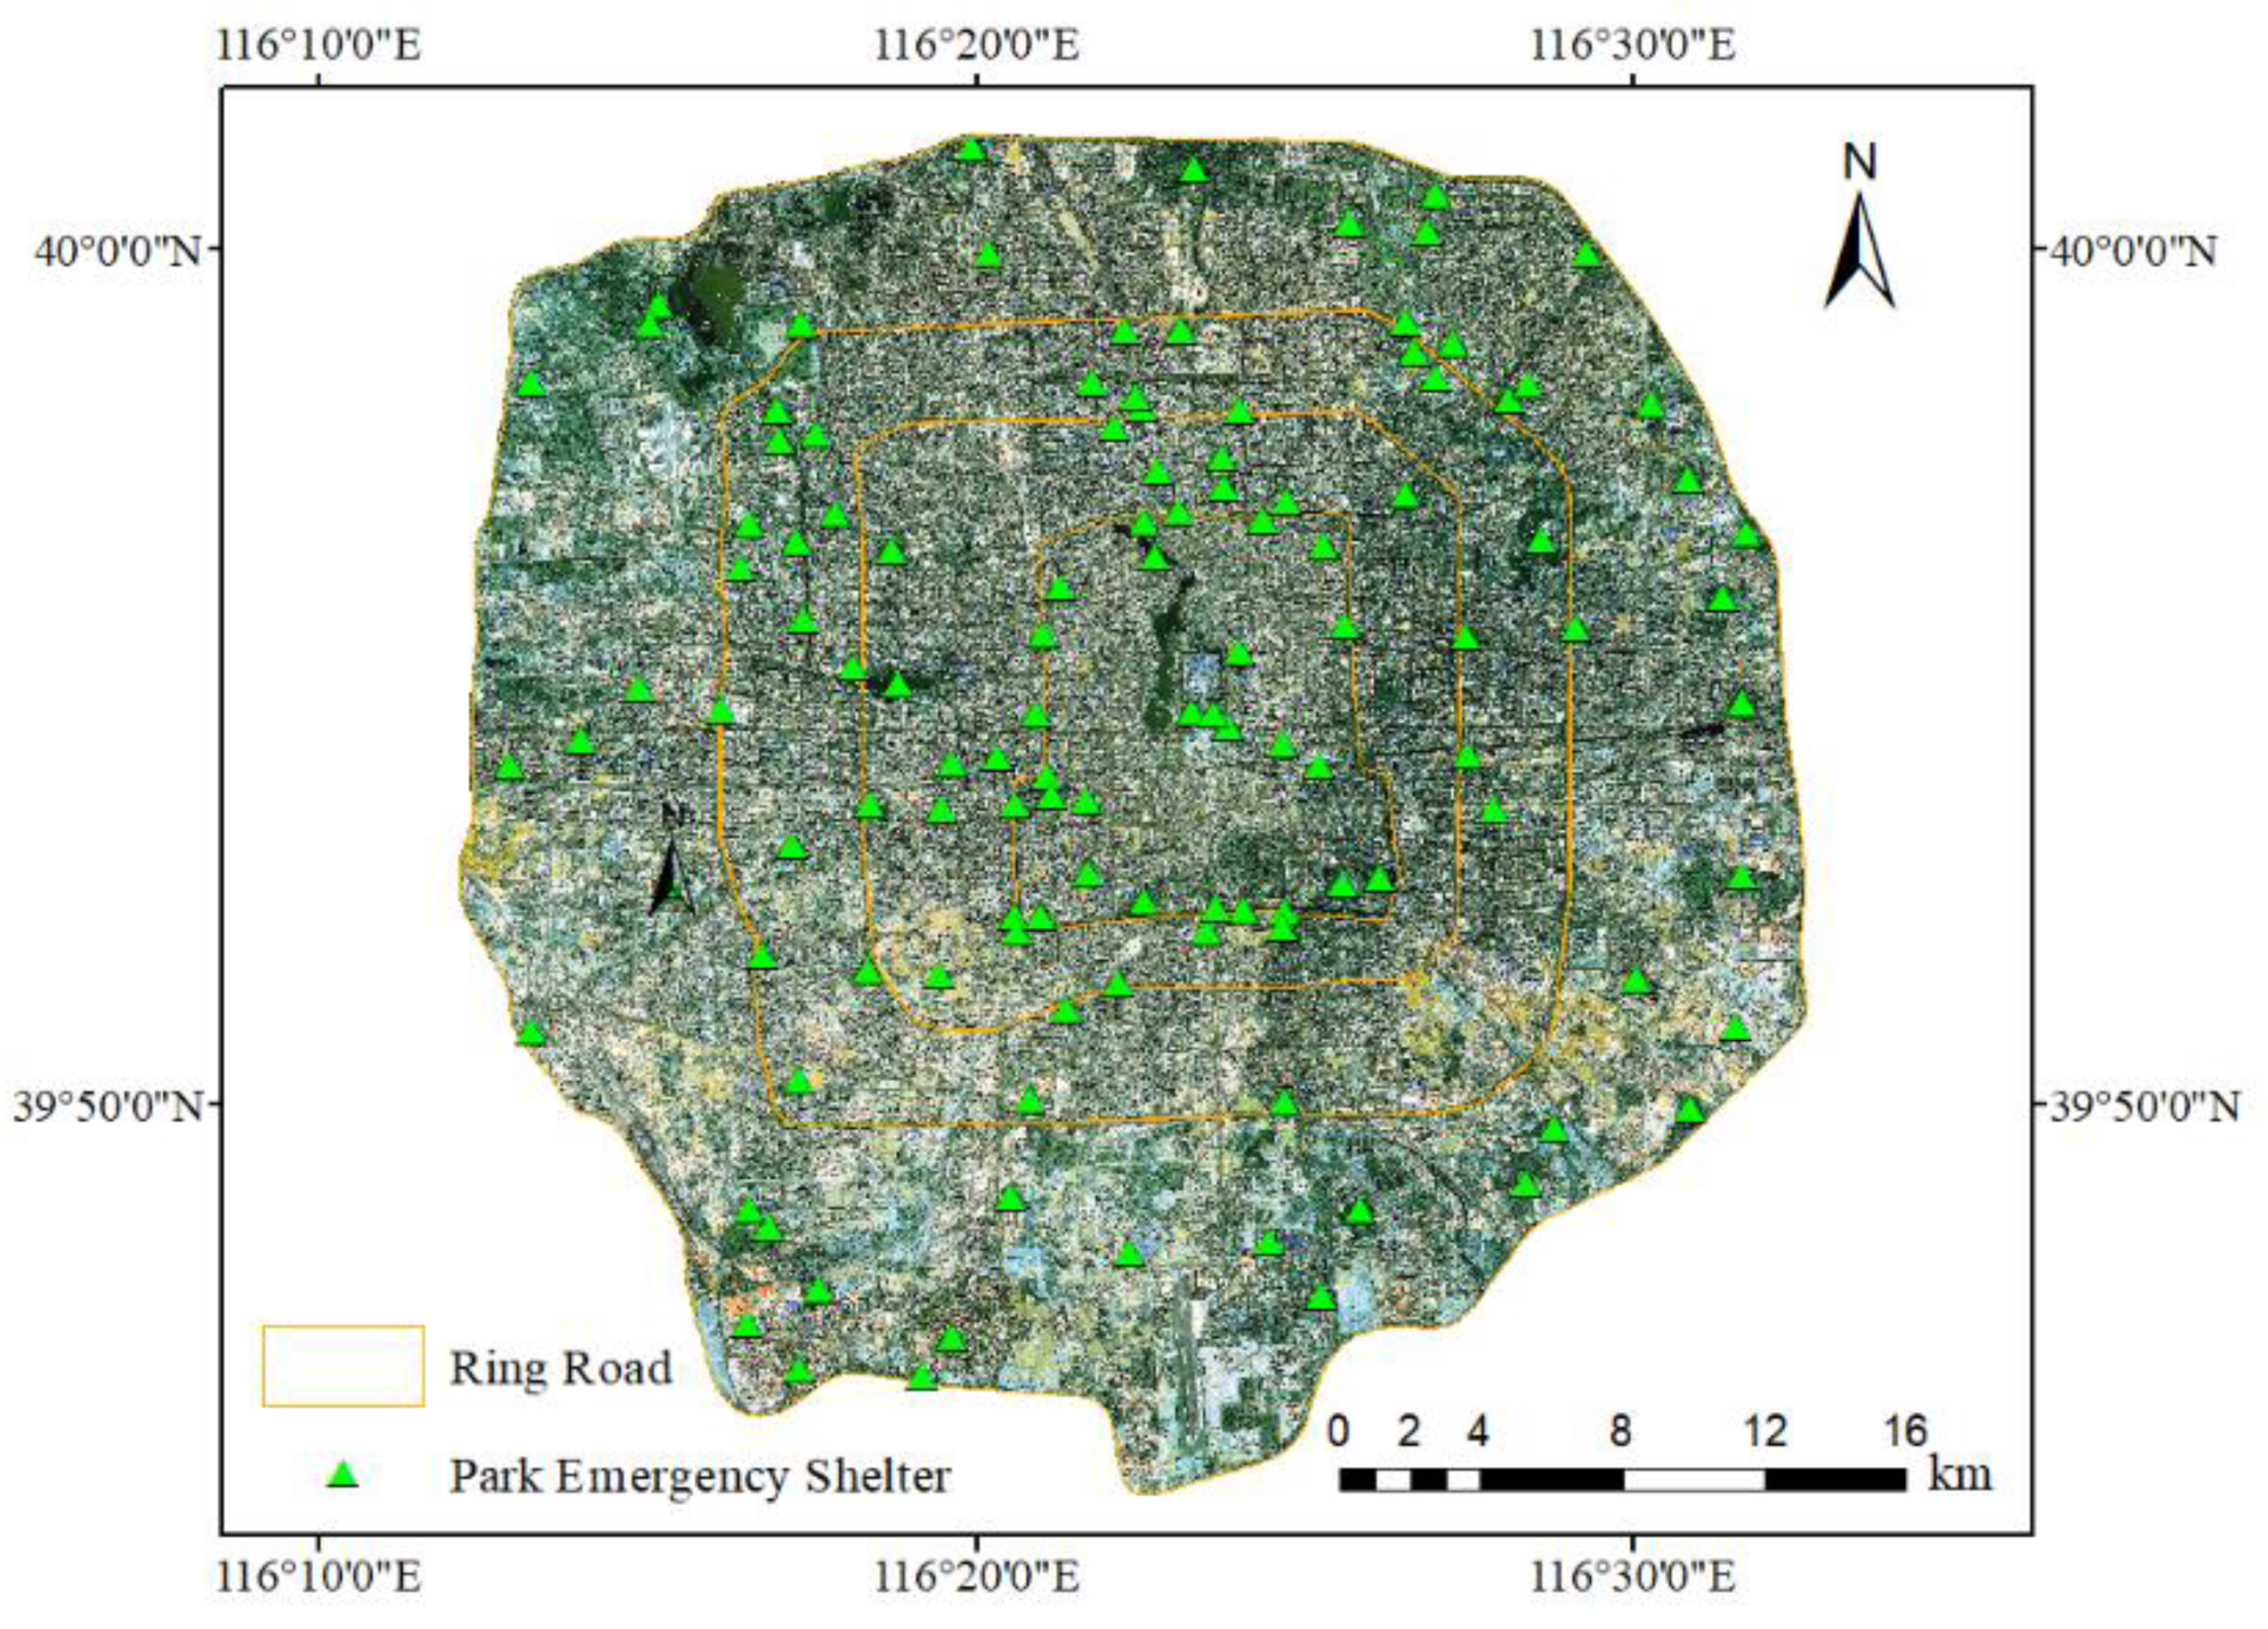
Section 3 “Experimental Results” presents the study area and data, experimental environment and parameter settings, and accuracy evaluation and experimental results of the EfficientUNet+ method; Section 4 “Discussion” validates the effectiveness of the proposed method through comparative experiments and ablation experiments; Section 5 “Conclusion” presents the main findings of this study.

2. Methods

In this study, the method of deep learning was used to extract buildings in a special scene, emergency shelters. Given that the buildings in the emergency shelters are generally small, the use of high-resolution remote sensing images to extract buildings is prone to the problems of missed mentions and false and blurred boundaries. Based on the UNet model, EfficientUNet+, an improved building extraction method from high-resolution remote sensing images, was proposed. Beijing’s Fifth Ring Road emergency shelters comprised the research area. Figure 1 shows the technical route of this study.

2.1. EfficientUNet+ Module Overview

The UNet model is an encoder–decoder architecture, which consists of a compressed path for capturing context and a symmetric expansion path for precise localization. It uses skip connections to fuse the high- and low-level semantic information of the network [37]. Good segmentation results can be obtained when the training set is small. However, the original UNet model uses VGG-16 as the encoder, which has many model parameters, and the feature learning ability is weak. This study follows the model framework of UNet, applies EfficientNet in the UNet encoder, and proposes a deep learning-based method for extracting buildings in emergency shelters, namely, EfficientUNet+. Figure 2 shows the EfficientUNet+ module structure. The emergency shelters within the Fifth Ring Road of Beijing were taken as the research area to verify the effectiveness of the method in this study. The method is improved as follows. (1) The deep learning model used by the encoder is EfficientNet-b0, which is a new model developed using composite coefficients to scale the three dimensions of width/depth/resolution and achieves satisfactory classification accuracy with few model parameters and fast inference [38,39]. (2) The scSE is embedded in the decoder. Embedding spatial squeeze and excitation (sSE) into low-level features can emphasize salient location information and suppress background information; combining channel squeeze and excitation (cSE) with high-level features extracts salient meaningful information [40], thereby reducing false lifts of buildings. (3) The cross-entropy function is used to weigh the boundary area, improving the accuracy of building boundary extraction. The Dice loss is combined to solve the problem of blurred boundary extraction. (4) Given the small number of samples in the study area, a transfer learning method is introduced to transfer the features of the existing WHU aerial building dataset to the current Beijing Fifth Ring Road emergency shelter building extraction task, thereby reducing the labor cost of acquiring new samples and further improving the accuracy of building extraction.

2.2. EfficientNet-b0

In 2019, the EfficientNet model proposed by Google made a major breakthrough in the field of image classification. The network model was applied to the ImageNet dataset and showed superior performance. The model uses compound coefficients to scale the three dimensions of network depth (depth), network width (width), and input image resolution (resolution) uniformly; thus, the optimal classification effect can be obtained by balancing each dimension [41]. Compared with traditional methods, this network model has a small number of parameters and can learn the deep semantic information of images, greatly improving the accuracy and efficiency of the model [37,39]. EfficientNet also has good transferability [42].
The EfficientNet network consists of a multiple-module mobile inversion bottleneck (MBConv) with a residual structure. Figure 3 shows the MBConv structure. The MBConv structure includes 1 × 1 convolution layer (including batch normalization (BN) and Swish), k × k DepthwiseConv convolution (including BN and Swish; the value of k is 3 or 5), squeeze and excitation (SE) module, common 1 × 1 convolutional layer (including BN), and dropout layer. This structure can consider the number of network parameters while enhancing the feature extraction capability.
EfficientNet-b0 is a baseline architecture for lightweight networks in image classification [42]. As shown in Table 1, EfficientNet-b0 consists of nine stages. Stage 1 consists of 3 × 3 convolution kernels with a stride of 2. Stages 2 to 8 consist of repeated stacking of MBConv, and the column parameter layers represent the number of times the MBConv is repeated. Stage 9 consists of a 1 × 1 convolution kernel, average pooling, and a fully connected layer. Each MBConv in the table is followed by number 1 or number 6. These numbers are the magnification factors. In particular, the first convolutional layer in the MBConv expands the channels of the input feature map to n times the original. k3 × 3 or k5 × 5 represents the size of the convolution kernel in the DepthwiseConv convolutional layer in MBConv. Resolution represents the size of the feature map output by this stage.
The EfficientNetb1-b7 series of deep neural networks chooses the most suitable one in width (the number of channels of the feature map), depth (the number of convolutional layers), and resolution (the size of the feature map) according to the depth, width, and resolution of EfficientNet-b0. The basic principle is that increasing the depth of the network can obtain rich and complex features. This approach can be applied to other tasks. However, the gradient disappears, the training becomes difficult, and the time consumption increases if the network depth is too deep. Given that the sample data are relatively small, we used EfficientNet-b0 as the backbone of the segmentation model.

2.3. scSE Module

scSE is a mechanism that combines spatial squeeze and excitation (sSE) and channel squeeze and excitation (cSE) [43]. It comprises two parallel modules, namely, the sSE and the cSE. Figure 4 shows the operation flow of the scSE module. This mechanism compresses features and generates weights on channels and spaces, respectively, and then reassigns different weights to increase the attention to the content of interest and ignore unnecessary features [44].
sSE is a spatial squeeze and excitation that improves the effectiveness of important features by assigning different weights to different spatial locations on the feature map. First, channel compression is performed on the feature map (C, H, W) using a 1 × 1 convolution block with channel C to transform this feature map (1, H, W). Then, the spatial location weights of the features on each channel are generated by normalization by the Sigmoid function. After the reconstruction of the spatial position relationship of the original feature map, a new feature map is finally generated. Equation (1) presents the calculation formulas.
U sSE = [ σ ( q 1 , 1 ) u 1 , 1 , ... , σ ( q i , j ) u i , j , ... , σ ( q H , W ) u H , W ]
where U sSE is the new feature map, σ is the activation function, q i , j is the linear combination of spatial positions (i, j) under channel C, and u i , j is the spatial location of the feature.
cSE is a channel squeeze and excitation, which generates a channel-reweighted feature map by integrating the weight relationship between different channels. Thus, a channel-reweighted feature map is generated. First, the feature map (C, H, W) is generated by a global average pooling vector Z ∈ RC × 1 × 1, where C, H, and W represent the channel number, height, and width of the feature map, respectively. The vector Z is operated by two fully connected layers to output a C × 1 × 1 vector. Then, a weight vector reflecting the importance of different channels is obtained through the Sigmoid function. Finally, the feature map is reweighted to generate a new feature map after feature filtering on the channel. Equations (2)–(5) present the calculation formulas [21].
u c = s = 1 C v c s x s
where u c is the output feature map; C and C are the number of input and output channels, respectively; v c is the second two-dimensional spatial convolution kernel; ∗ means convolution operation; and x s is the sth input feature map.
z c = 1 H × W i = 1 H j = 1 W u c ( i , j )
where z c is the generated vector through u c after global average pooling (squeeze operation), and H and W represent the height and width of the feature map, respectively.
s = σ ( W 2 σ ( W 1 z ) )
where s is the vector output through z after the excitation operation, W 1 R C r × C , W 2 R C × C r , and r is the scaling factor. Through the operation, z converts to z and generates a new feature map as follows:
U cSE = [ σ ( z 1 ) u 1 , σ ( z 2 ) u 2 , ... , σ ( z c ) u c ]

2.4. Loss Function

The loss function is used to calculate the difference between the predicted value and the true value. The network model parameters are updated through the backpropagation of the error. The smaller the loss function value is, the better the model fitting effect is and the more accurate the prediction is [45]. The cross-entropy loss function is the most commonly used loss function in deep learning semantic segmentation. Equation (6) presents the formula of the two-category cross-entropy function.
L o s s C E = 1 N i [ y i log ( p i ) + ( 1 y i ) log ( 1 p i ) ]
where y is the prediction result and p is the ground truth. The weight of each pixel is equal by considering the cross-entropy function. The boundary area of the building is difficult to segment. We weigh the area’s cross-entropy loss from the perspective of the loss function. In backpropagation, the network is enhanced to learn the boundary regions. Equations (7) and (8) present the cross-entropy function formula for boundary weighting.
L o s s C E _ B W = L o s s C E W e i g h t
W e i g h t = { 1 , n o t   b o u n d a r y w ,             b o u n d a r y
In this study, the value of w is 4. We introduce Dice loss to alleviate the imbalance in the number of positive and negative samples. Equations (9) and (10) present the final model loss function.
L o s s = L o s s C E _ B W + L o s s D i c e
L o s s D i c e = 1 i p i y i i ( p i + y i )

2.5. Transfer Learning

Training often relies on a large amount of sample data to prevent overfitting in the process of training deep learning models. However, collecting sample data by visual interpretation requires a certain amount of experience and knowledge. It is also time-consuming and labor-intensive. In the case of a small number of samples, the existing data can be fully utilized through the transfer learning method. Transfer learning is further tuned by building a pretrained model on the source domain for feature extraction or parameter initialization and applying it to a related but different target domain [46,47]. Compared with training from scratch on a dataset with small sample size, transfer learning can improve computational efficiency and generalization of the model.
Given the complex, diverse, and changeable shapes and colors of target buildings, obtaining a large number of fine samples in the process of extracting buildings from emergency shelters within the Fifth Ring Road of Beijing is difficult even with manual visual interpretation, resulting in a small amount of sample data. Supporting the learning needs of a large number of network parameters is challenging. At present, most of the transfer learning research in the field of remote sensing uses ImageNet dataset for pretraining. However, ImageNet belongs to the field of natural images, and features such as resolution and depth of field are quite different from remote sensing data.
The WHU aerial building dataset is an open large-scale database often used for building extraction. The WHU aerial building dataset is very similar to the requirements of our task. Although the characteristics of the two building datasets are different, 8188 image data with a size of 512 × 512 pixels were obtained through WHU because of the relatively large amount of data in the WHU dataset. The characteristics of the buildings still have great versatility. Therefore, this study used the transfer learning method to pretrain the model based on the WHU aerial building dataset. The pretrained model parameters were used as the initial values of the Beijing building extraction model, effectively increasing the generalization ability of the model on the building dataset of the emergency shelters within the Fifth Ring Road of Beijing.

3. Experimental Results

3.1. Study Area and Data

3.1.1. Study Area

Beijing is the capital of China, covering an area of 16.4 km2, with a resident population of 21.893 million [48]. It has become a distribution center of population, economy, and resources in the country. It also has an important geographical location in the country and even the world. Beijing is located at 39°26′N–41°03′N, 115°25′E–117°30′E, in the Yinshan–Yanshan seismic zone. It is one of the only three capitals in the world located in an area with a high earthquake intensity of magnitude 8. It is a key fortified city for disaster prevention and mitigation in the country. The central urban area of Beijing has dense buildings, a concentrated population, and the coexistence of old and new buildings. Once a disaster occurs, the damage caused by casualties and economic losses in this city is far greater than that in other areas. Therefore, the emergency shelters within the Fifth Ring Road of Beijing were selected as the research area, including parks, green spaces, squares, stadiums, playgrounds, and other outdoor open spaces. Among the emergency shelter types, the park exhibits large types and numbers of buildings. Thus, only the extraction of buildings in the park’s emergency shelters is considered in this study. According to the list of emergency shelters published by the Beijing Earthquake Administration and the list of registered parks published by the Beijing Municipal Affairs Resources Data Network, the Fifth Ring Road of Beijing has 118 parks that can be used as emergency shelters. Figure 5 shows the spatial distribution of park emergency shelter sites within the Fifth Ring Road of Beijing.

3.1.2. Dataset

The WHU aerial building dataset was used in this study to pretrain the model. Then, the created Google building dataset of emergency shelters within the Fifth Ring Road of Beijing was used to verify the effectiveness of the proposed method. Partial details of the two datasets are shown in Figure 6.
WHU aerial building dataset: The WHU dataset is divided into an aerial building dataset and a satellite building dataset. Given that the data used in this study are Google Images, the WHU aerial building dataset is similar to Google Image features. Thus, the standard open-source high-resolution WHU aerial dataset was used in this study as the training sample for transfer learning. The dataset was acquired in New Zealand, covering 220,000 buildings of different shapes, colors, and sizes, with an area of 450 km2. The initial spatial resolution of the image is 0.075 m. Considering the memory and operating efficiency of the computer, Ji et al. [49] downsampled the spatial resolution of the image to 0.3 m and cropped the image in the area to a size of 512 × 512 pixels, forming an image dataset with 8188 images, including 4736 in the training set, 1036 in the validation set, and 2416 in the test set.
Google building dataset of emergency shelters within the Fifth Ring Road of Beijing: The dataset uses Google’s high-resolution remote sensing imagery with a spatial resolution of 0.23 m. We selected 21 typical parks with varying image sizes using expert visual interpretation to produce ground truth values for model training and evaluation. The 21 images and the corresponding ground truth values were cropped by the sliding window method to obtain 1110 image blocks with a size of 512 × 512 pixels. A total of 710 images were randomly selected as the training set for model parameter tuning, 178 images were used as the validation set for model parameter selection, and 222 images were used as the test set to evaluate the effect of the final model.

3.2. Experimental Environment and Parameter Settings

The experimental platform uses an Intel Core i7-8700@3.20 GHz 6-core processor, equipped with 32.0 G memory and an Nvidia GeForce RTX 3090. In terms of the software environment, we used the Windows 10 Professional Edition 64-bit operating system. The programming language is Python 3.7, the model building tool is PyTorch 1.7, and the graphics processing unit (GPU) computing platform is CUDA 11.0.
During model training, the batch size was set to 32, the initial learning rate was set to 0.001, the learning rate was adjusted by cosine annealing (the minimum learning rate is 0.001), the optimizer used Adam with weight decay (weight decay coefficient is 0.001), the number of iteration rounds was 120 epochs, and the model parameters corresponding to the rounds with the highest accuracy in the validation set were selected as the final model parameters. In addition, data augmentation operations of horizontal flip, vertical flip, diagonal flip, and 90-degree rotation were performed on the training data.

3.3. Accuracy Evaluation

This study used four indicators, Precision, Recall, F1-Score, and mean intersection over union (mIoU), to assess the building extraction accuracy and quantitatively evaluate the performance of the proposed method in extracting buildings [50,51]. Precision represents the proportion of the number of correctly predicted building pixels to the number of pixels whose prediction result is a building. Precision also focuses on evaluating whether the result is misjudged. Recall represents the proportion of the correctly predicted building pixels to the real building pixels. It focuses on evaluating whether the results have omissions. The F1-Score combines the results of Precision and Recall. It is the harmonic mean of Precision and Recall. The mIoU calculates the intersection ratio of each class and then accumulates the average. The mIoU also represents the ratio of the number of predicted building pixels to the intersection and union of the two sets of real buildings, that is, the overlap ratio of the predicted map and the label map. Equations (11)–(14) present the calculation formulas.
P r e c i s i o n = T P / ( T P + F P )
R e c a l l = T P / ( T P + F N )
F 1 = 2 × P r e c i s i o n × R e c a l l / ( P r e c i s i o n + R e c a l l )
m I o U = 1 k i = 0 k [ T P / ( F N + F P + T P ) ]
where TP means that the predicted building is correctly identified as a building; FP means that the predicted building is misidentified as a building; TN means that the predicted non-buildings are correctly identified as non-buildings; FN means real buildings are wrongly identified as non-buildings; and k is the number of categories.

3.4. Experimental Results

The EfficientUNet+ method proposed in this study was used to pretrain the model of the public dataset WHU aerial buildings. The experiments were conducted on the park emergency shelter buildings in the study area through the transfer learning method. The emergency shelter in Chaoyang Park has a large area and complex building types, shapes, and colors. Therefore, we took the emergency shelter in Chaoyang Park as an example. Figure 7 shows the results of the buildings extracted by the EfficientUNet+ method.
Five local areas of A, B, C, D, and E in the emergency shelter of Chaoyang Park were selected to see the details of the experimental results clearly. Figure 8 shows the original image, the corresponding ground truth, and extraction results.
Figure 8 shows that the outlines of the buildings in the emergency shelter are all extracted, the boundaries are complete and clearly visible, and only a few occluded buildings have broken boundaries. This observation shows that the EfficientUNet+ method proposed in this study can pay attention to the details in information while obtaining deep semantic information to achieve a complete building image, effectively extracting buildings in remote sensing images.
The four indicators, namely, Precision, Recall, F1-Score, and mIoU, were selected to evaluate the building extraction accuracy by the EfficientUNet+ method proposed in this study. The evaluation results are shown in Table 2.
Table 2 shows the quantitative results of using the EfficientUNet+ method to extract buildings from remote sensing images. The evaluation indicators reach approximately 90%; in particular, the Precision is 93.01%, the Recall is 89.17%, the F1-Score is 91.05%, and the mIoU is 90.97%. This finding indicates that the method can effectively extract buildings in high-resolution remote sensing images.
We further visualize the multi-scale architectural features extracted by the proposed model at different depths, as shown in Figure 9. From Figure 9b–f, we can see that the low-resolution architectural features are gradually refined as the feature resolution increases. The example in column (f) of Figure 9 illustrates that the semantic information of small-scale buildings cannot be captured by high-level features, because they occupy less than one pixel at low resolution.

4. Discussion

4.1. Comparison to State-of-the-Art Studies

To verify whether the proposed method performs better than other state-of-the-art methods, several deep learning methods commonly used in semantic segmentation and building extraction were selected as comparison methods, namely, DeepLabv3+, pyramid scene parsing network (PSPNet), deep residual UNet (ResUNet), and high-resolution Net (HRNet). Among these methods, the DeepLabv3+ method introduces a decoder, which can achieve accurate semantic segmentation and reduce the computational complexity [52]. The PSPNet method extends pixel-level features to global pyramid pooling to make predictions more reliable [53]. The ResUNet method is a variant of the UNet structure with state-of-the-art results in road image extraction [54]. The HRNet method maintains high-resolution representations through the whole process, and its effectiveness has been demonstrated in previous studies [55]. Some detailed images of emergency shelters were selected to compare the extracted accuracy and edge information clearly. Figure 10 shows the results of different methods.
Figure 10 shows that compared with other methods, the EfficientUNet+ method extracts almost all the buildings in the image and clearly shows the details, such as the edges and corners of the buildings, closely representing the real objects. The red box in Figure 10 shows that the above methods can extract the approximate location of the building. However, the EfficientUNet+ method can also extract the edge of the building, and its detail retention is higher than that of the other methods. The yellow box in Figure 10 shows that the results of DeepLabv3+, PSPNet, ResUNet, and HRNet methods have areas of misrepresentation and omission, whereas the EfficientUNet+ method can extract buildings more accurately than the other methods.
Four indicators were used to evaluate the extraction results of the EfficientUNet+, DeepLabv3+, PSPNet, ResUNet, and HRNet methods and to quantitatively analyze and evaluate the extraction accuracy. The results are shown in Table 3. The accuracy comparison chart of the extraction results is shown in Figure 11 to intuitively compare the extraction accuracy of each method.
Table 3 and Figure 11 show that the accuracy of the EfficientUNet+ method for extracting buildings is 2.49%, 16.61%, 4.5%, and 3.87% higher than that of DeepLabv3+, PSPNet, ResUNet, and HRNet, respectively. The Recall of the EfficientUNet+ method is 2.02%, 13.83%, 8.45%, and 5.74% higher than that of DeepLabv3+, PSPNet, ResUNet, and HRNet, respectively. The F1-Score of the EfficientUNet+ method is 2.25%, 15.18%, 6.61%, and 4.86% higher than that of DeepLabv3+, PSPNet, ResUNet, and HRNet, respectively. The mIoU of the EfficientUNet+ method is 2.05%, 12.61%, 5.81%, and 4.34% higher than that of DeepLabv3+, PSPNet, ResUNet, and HRNet, respectively. In summary, the EfficientUNet+ method has the highest accuracy in each index, indicating that the EfficientUnet+ method proposed in this study can effectively extract the semantic information of buildings and improve the generalization ability of the model. The proposed method has certain advantages in extracting buildings from remote sensing images.

4.2. Ablation Experiment

4.2.1. scSE Module

The following ablation experiments were designed in this study to verify the effectiveness of adding the scSE module to the decoder trained by the model: (1) the network model with the scSE; (2) the network model without the scSE. Other experimental conditions are the same. The two methods were applied to the experiments on the building dataset of emergency shelters. The local details of the extraction results are shown in Figure 12. The accuracy comparison is shown in Table 4.
Figure 12 shows that the EfficientUNet+ method with the scSE can basically extract all the buildings in the image, whereas the buildings extracted by the EfficientUNet method without the scSE have missed and false detection. Table 4 shows that adding the scSE to the decoder can improve the accuracy of model extraction of buildings. The extraction result analysis shows that the accuracy of each evaluation index after adding the scSE is improved. In particular, the Precision, Recall, F1-Score, and mIoU are increased by 2.2%, 0.94%, 1.55%, and 1.43%, respectively. The scSE added to the decoder enhances the feature learning of the building area, improves the attention of the features of interest, and suppresses the feature response of similar background areas, thereby reducing the false detection of buildings and improving the classification effect.

4.2.2. Loss Function

The following ablation experiments were designed in this study to verify the effectiveness of the boundary weighting in the loss function: (1) the cross-entropy function is weighted on the boundary area, and the Dice loss is combined; (2) the regular cross-entropy function and joint Dice loss are used. Other experimental conditions are the same. Figure 13 shows the local details of the extraction results. Table 5 shows the accuracy comparison.
Figure 13 shows the results extracted by the EfficientUNet+ method using boundary-weighted cross-entropy and Dice joint loss function. The boundary of the building is complete, and the edge is clearly visible. However, the buildings extracted by the EfficientUNet+ method without boundary weighting on the loss function have damaged and jagged boundaries. Table 5 shows that the area boundary weighting on the cross-entropy loss function improves the clarity, integrity, and accuracy of the edge details of the buildings in the result. The reason is that the boundary region has a substantial weight in backpropagation. The model also pays considerable attention, alleviating the boundary ambiguity problem of building extraction to a certain extent.

4.2.3. Transfer Learning

The following ablation experiments were designed in this study to verify the effectiveness of transfer learning: (1) the EfficientUNet+ method is first pretrained on the WHU aerial building dataset and then adopts transfer learning techniques; (2) the EfficientUNet+ method is directly applied to the Google emergency shelter building dataset. Other experimental conditions are the same. Figure 14 shows the local details of the extraction results. Table 6 shows the accuracy comparison, where “√” indicates that the transfer learning technology is used for the experiment and “—” indicates that the transfer learning technology is not used for building extraction.
Figure 14 shows that the pretrained model EfficientUNet+ on the existing public WHU aerial building dataset is applied to the created Google building dataset using the transfer learning technology, thereby increasing the model’s ability to extract buildings and its generalization ability. Table 6 shows that the extraction accuracy of the transfer learning technology applied to the real object dataset is high, and the performance is stable. This finding shows that transfer learning can make full use of the existing data information, effectively solve the insufficient number of samples leading to model overfitting, and improve the generalization ability of the network. Thus, it can achieve satisfactory results in information extraction.

4.3. Efficiency Evaluation

We visualize the training loss versus epoch in Figure 15. It can be seen that the training loss of the proposed method decreases the fastest, far exceeding other comparison methods, which verifies its efficiency in the training phase. In addition, in order to verify the extraction efficiency of the proposed method, we count the operation time of the validation set, as shown in the table. It can be seen that the inference time and training time of the proposed method are 11.61 s and 279.05 min respectively, which are the shortest and the most efficient of all the compared methods. Table 7 shows that the method proposed in this study can quickly extract the buildings in emergency shelters.

5. Conclusions

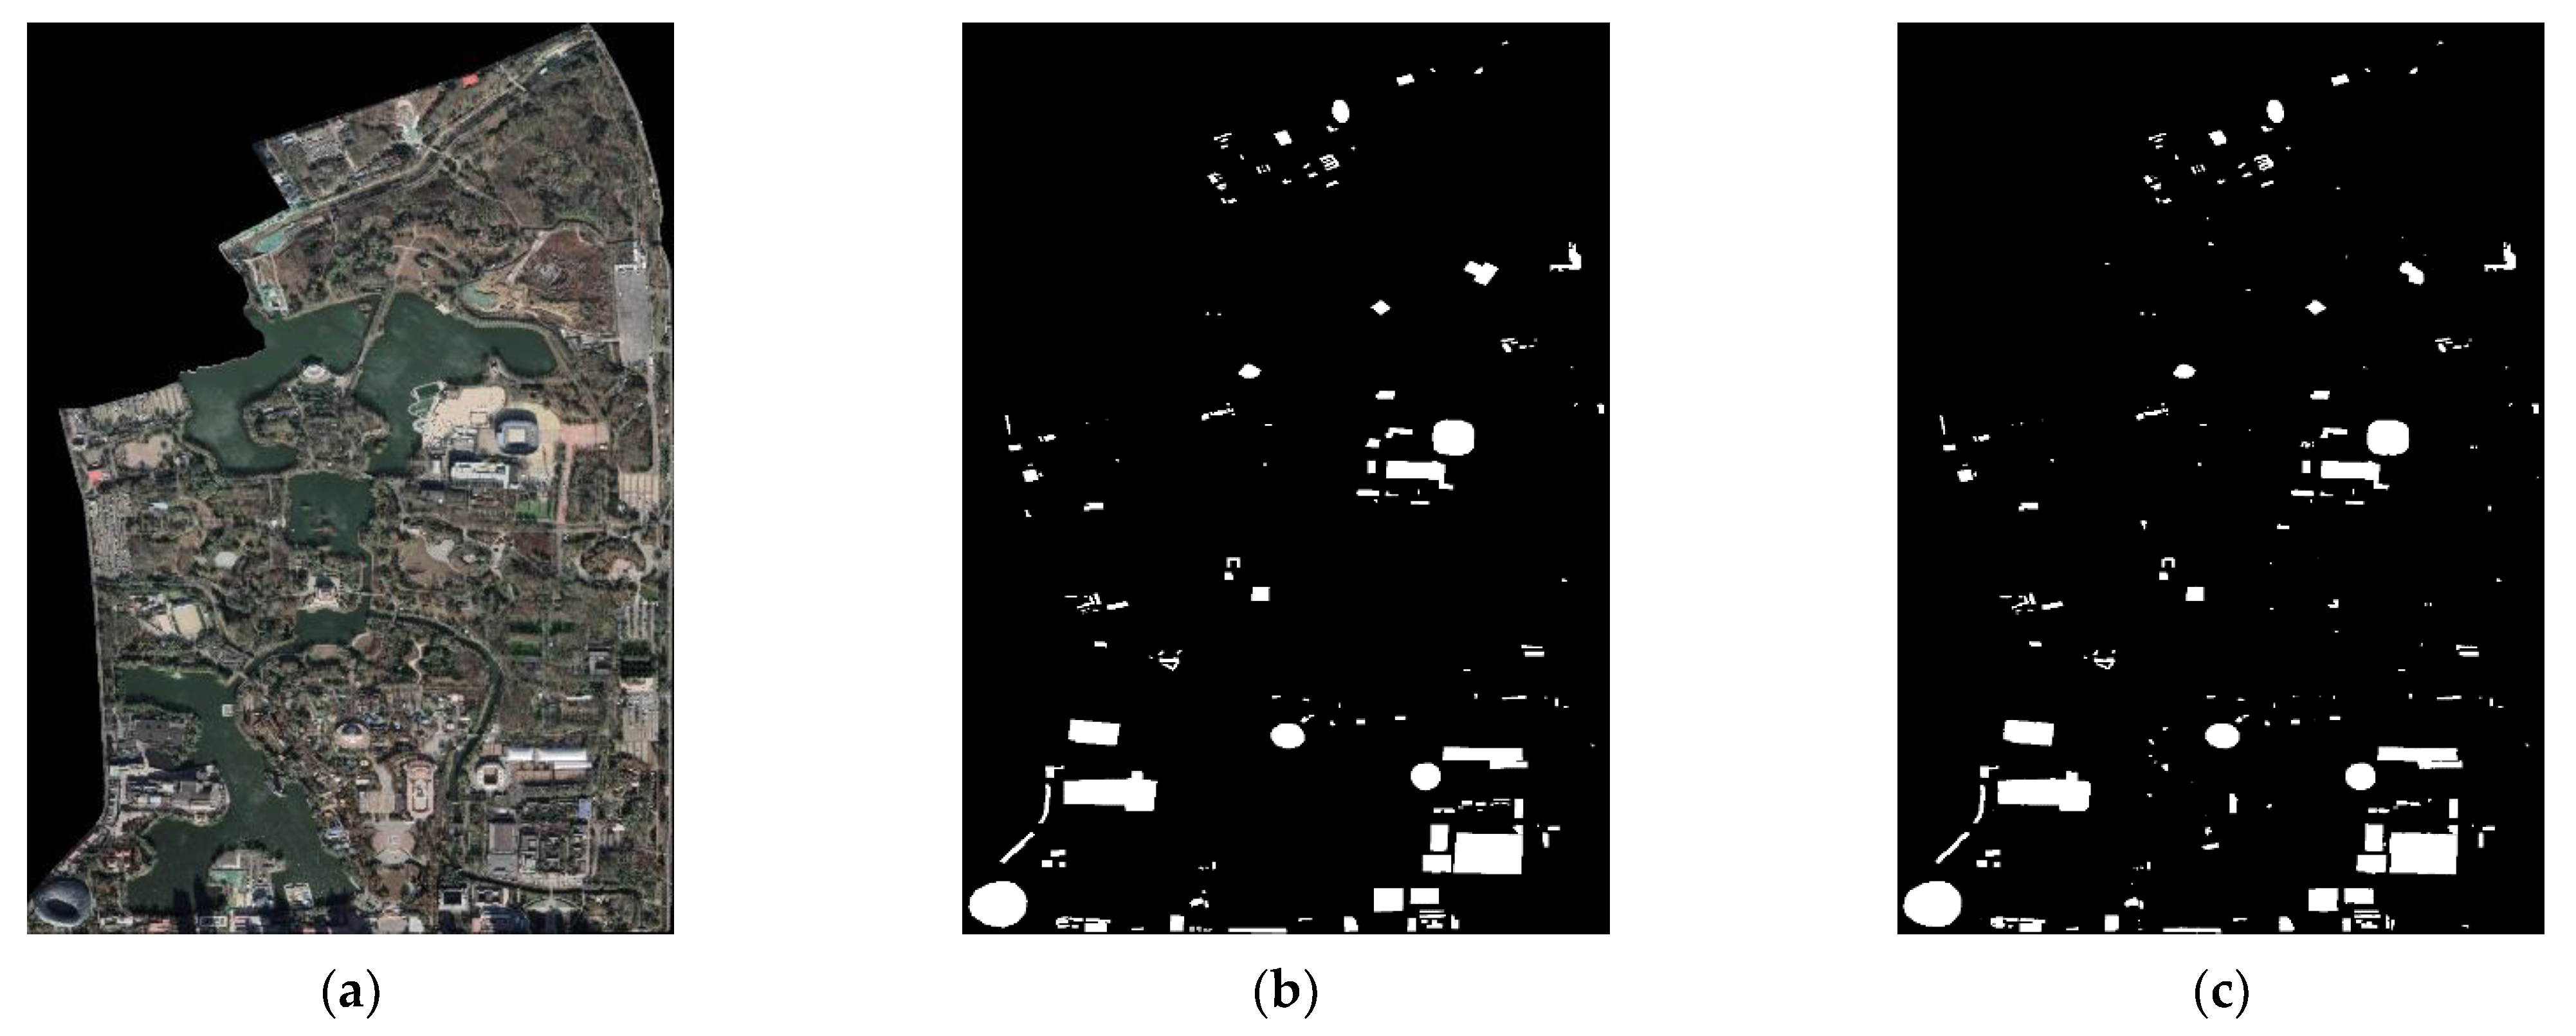
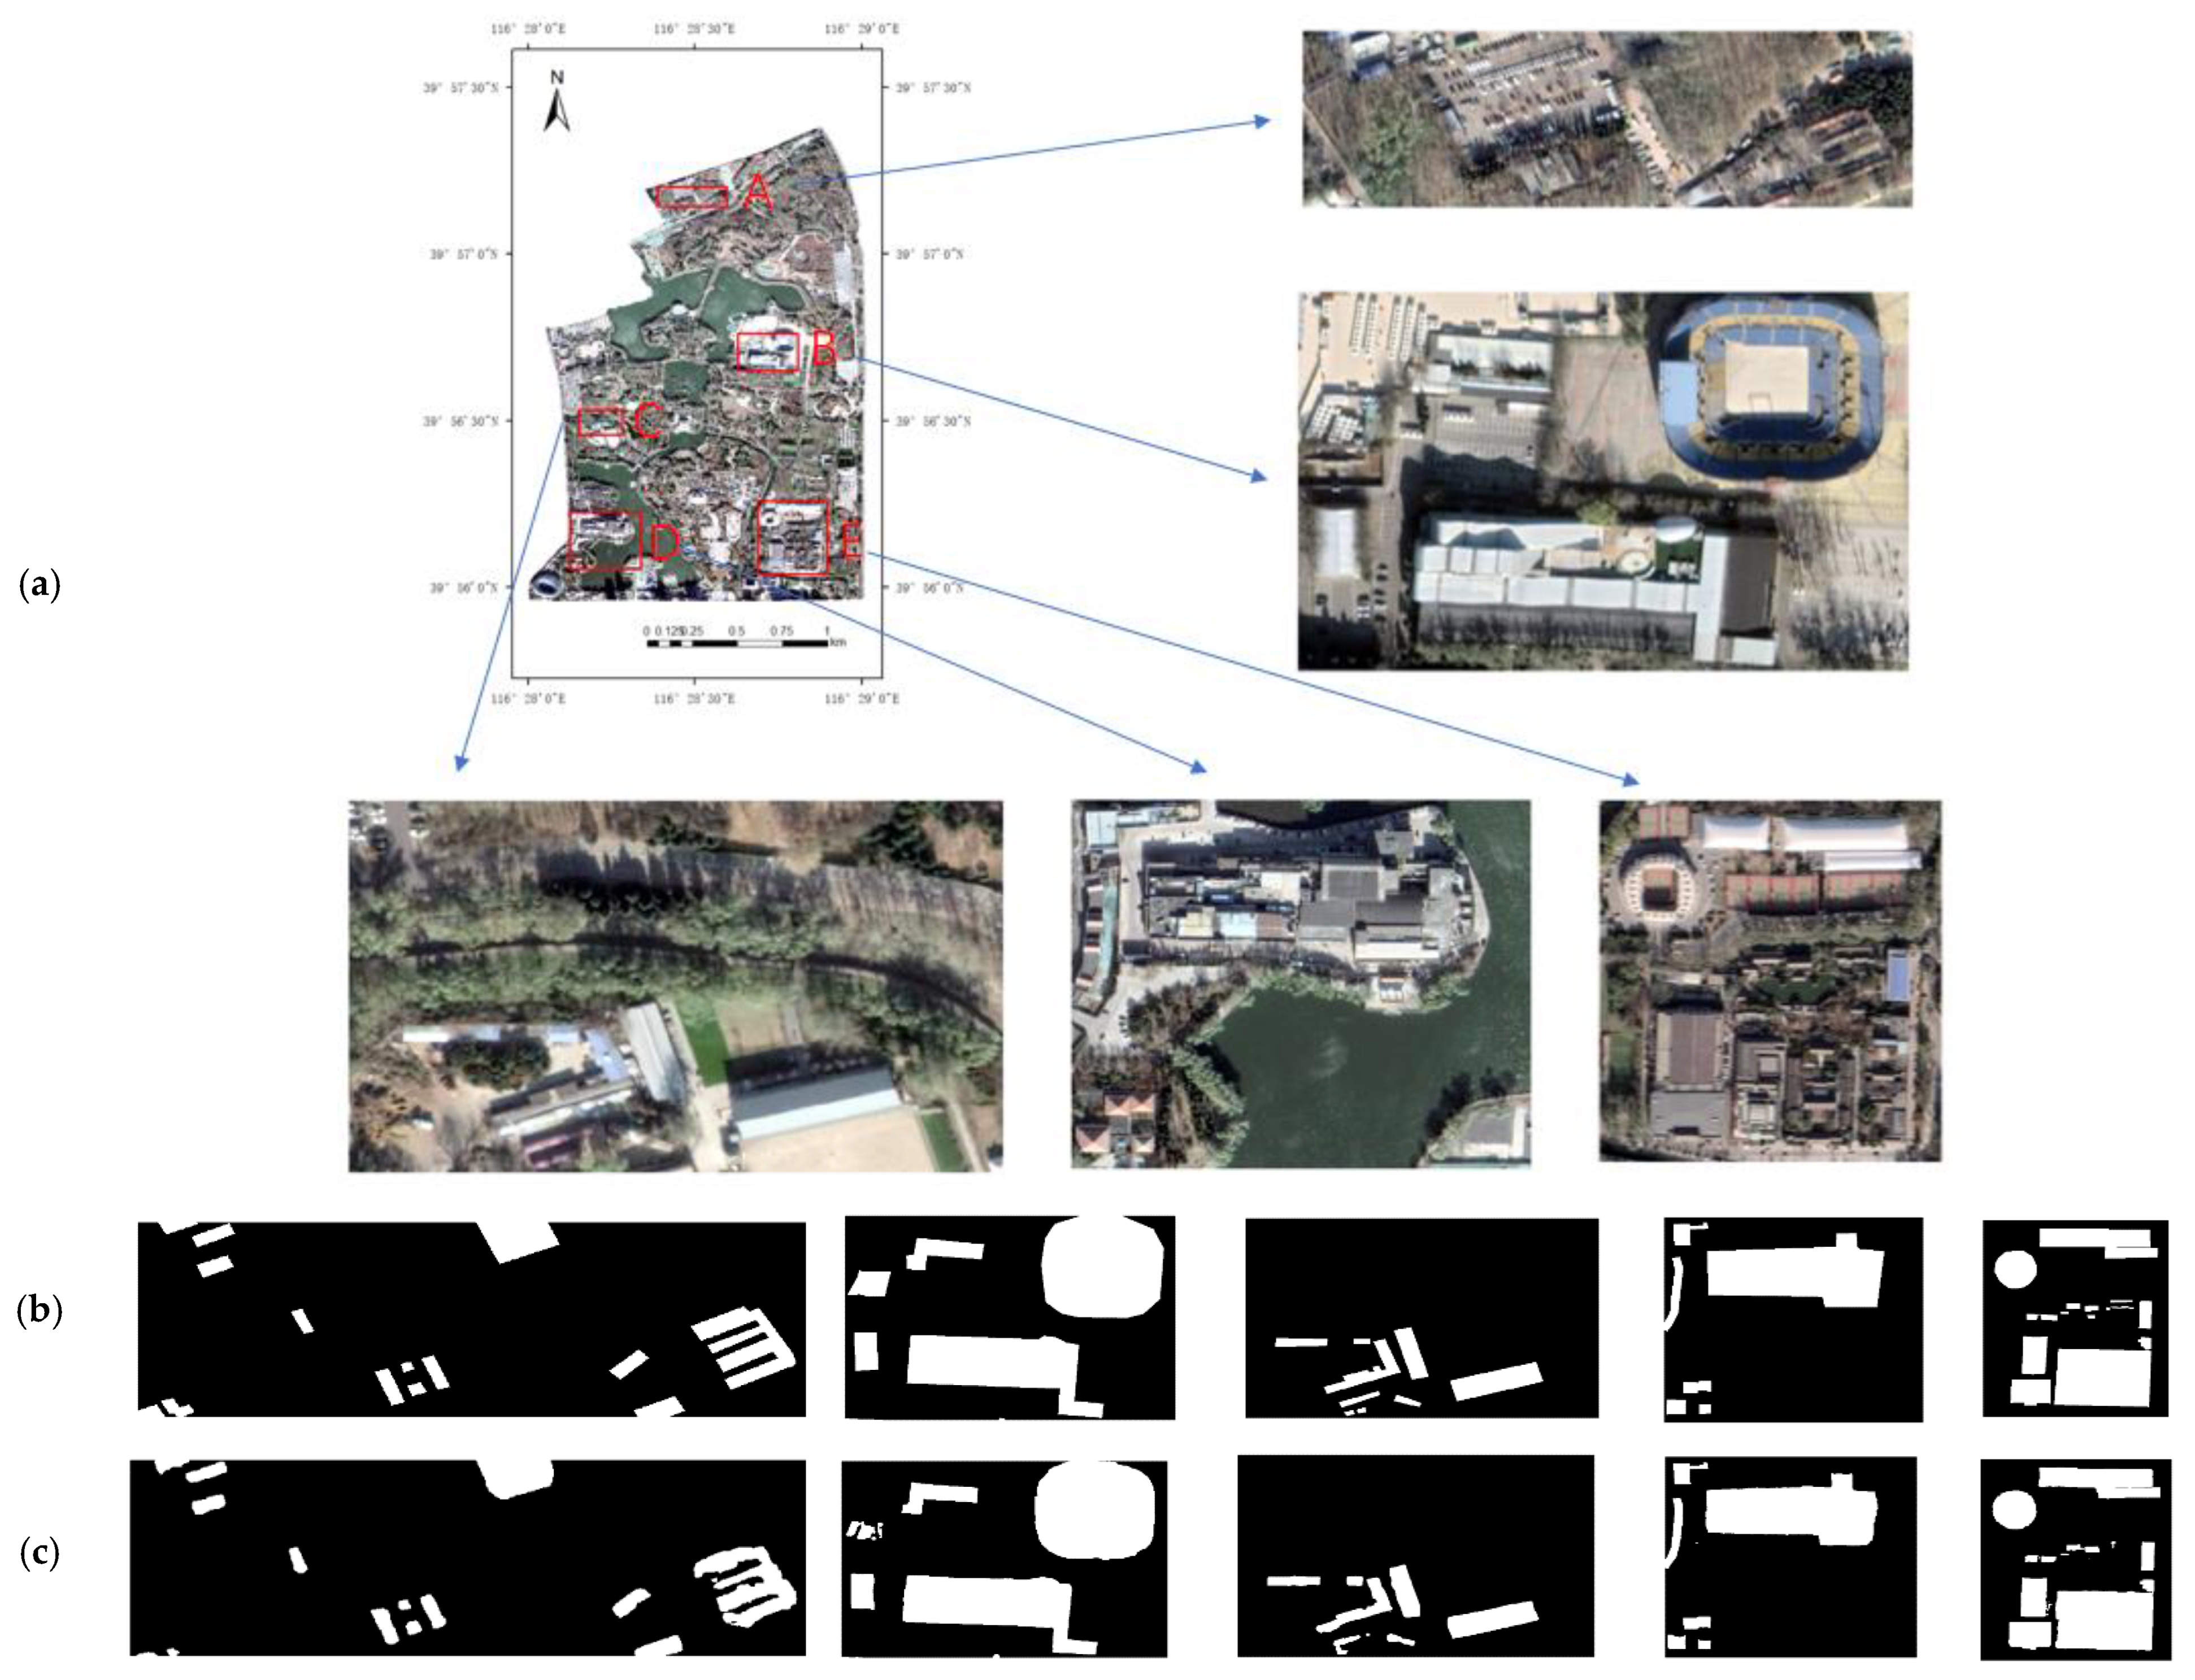
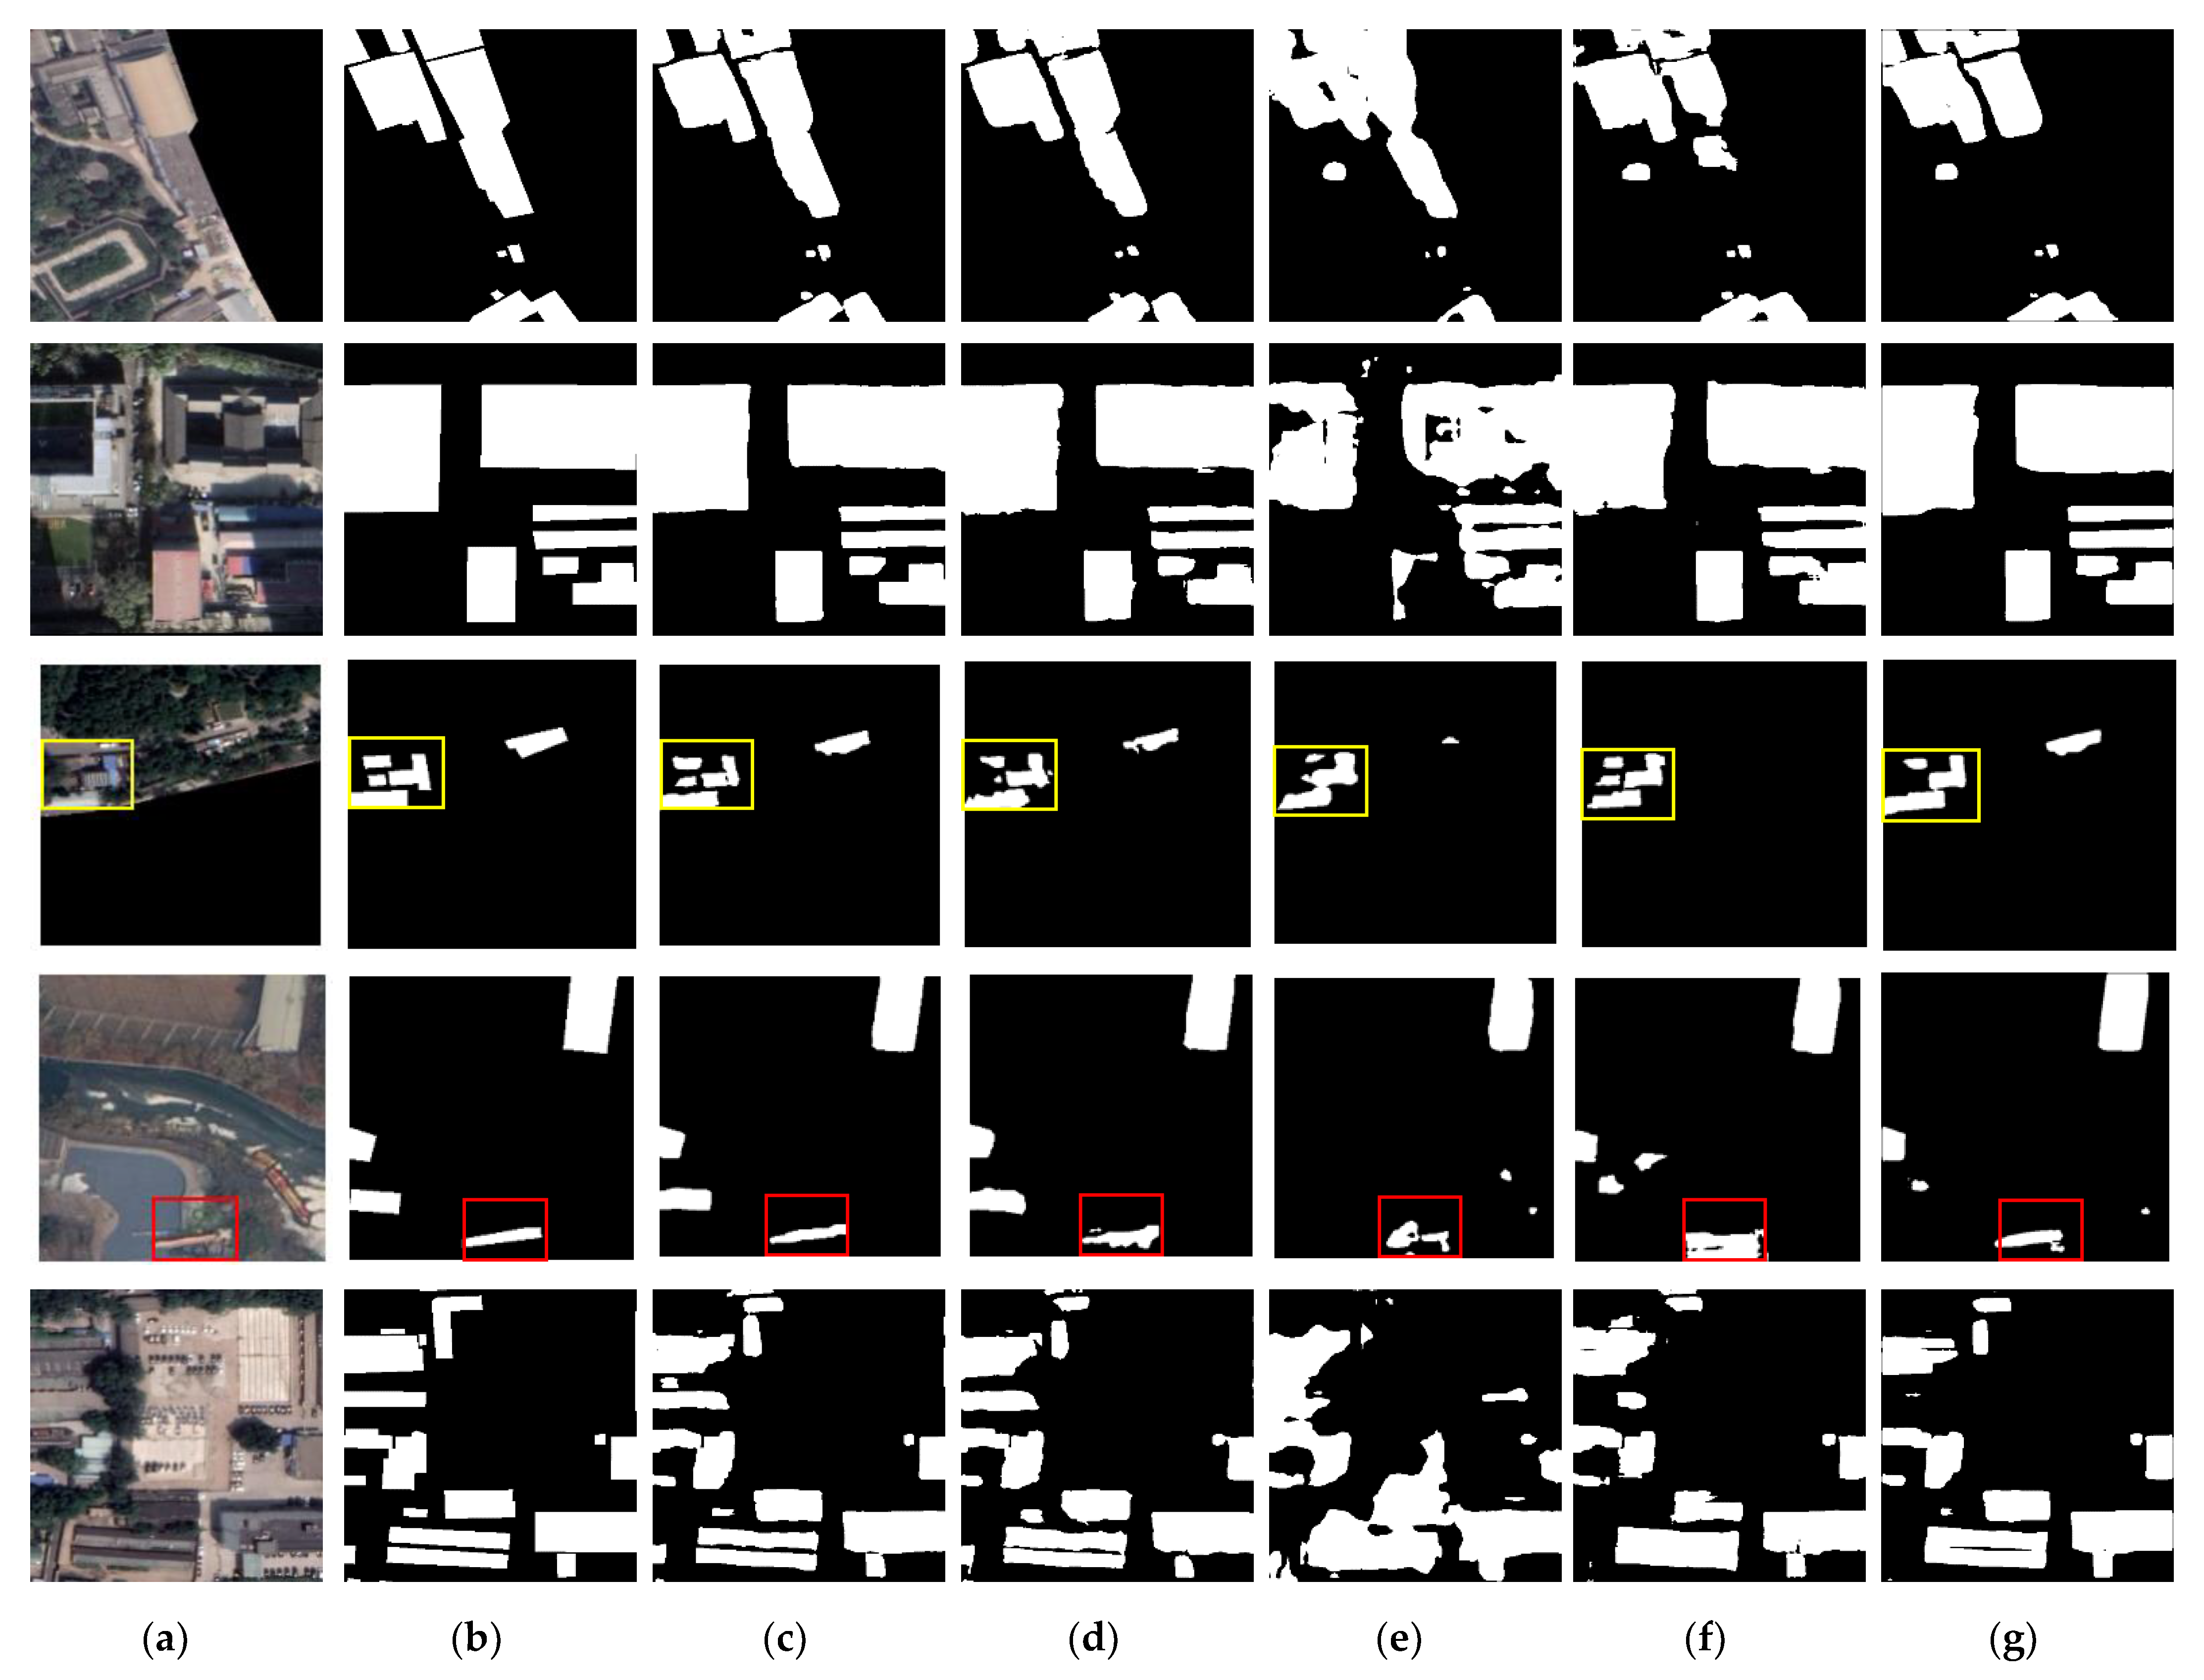
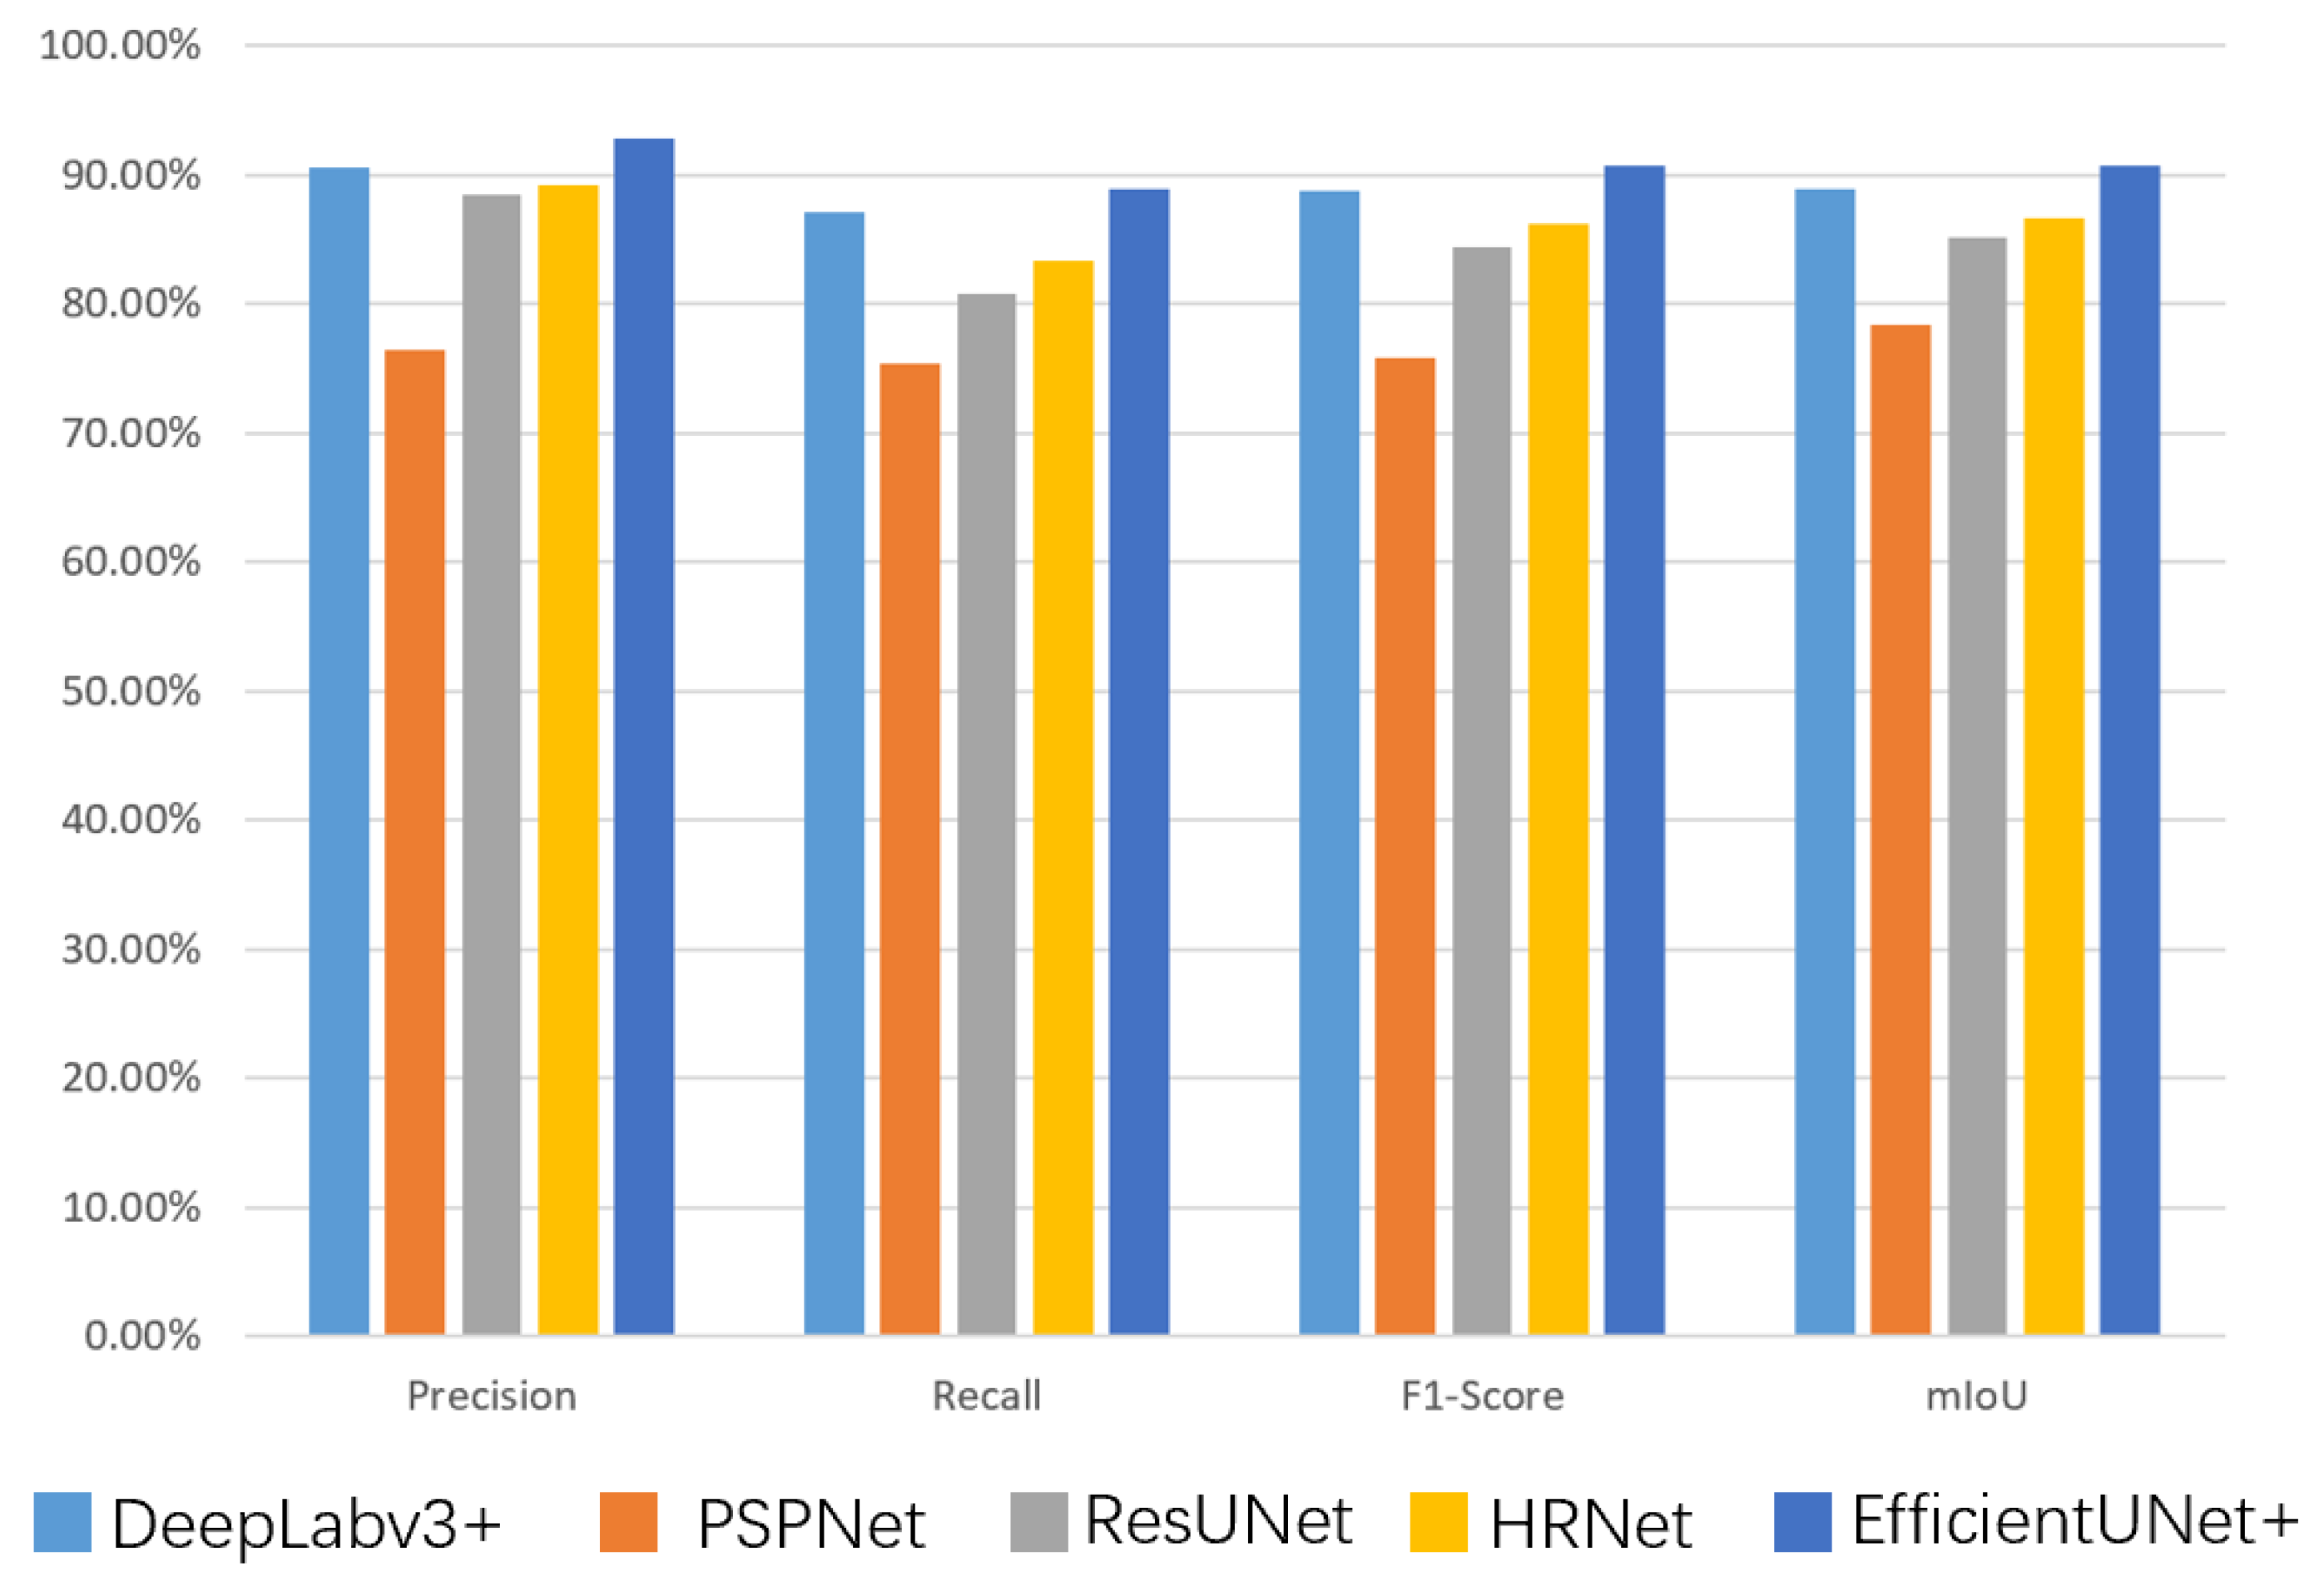
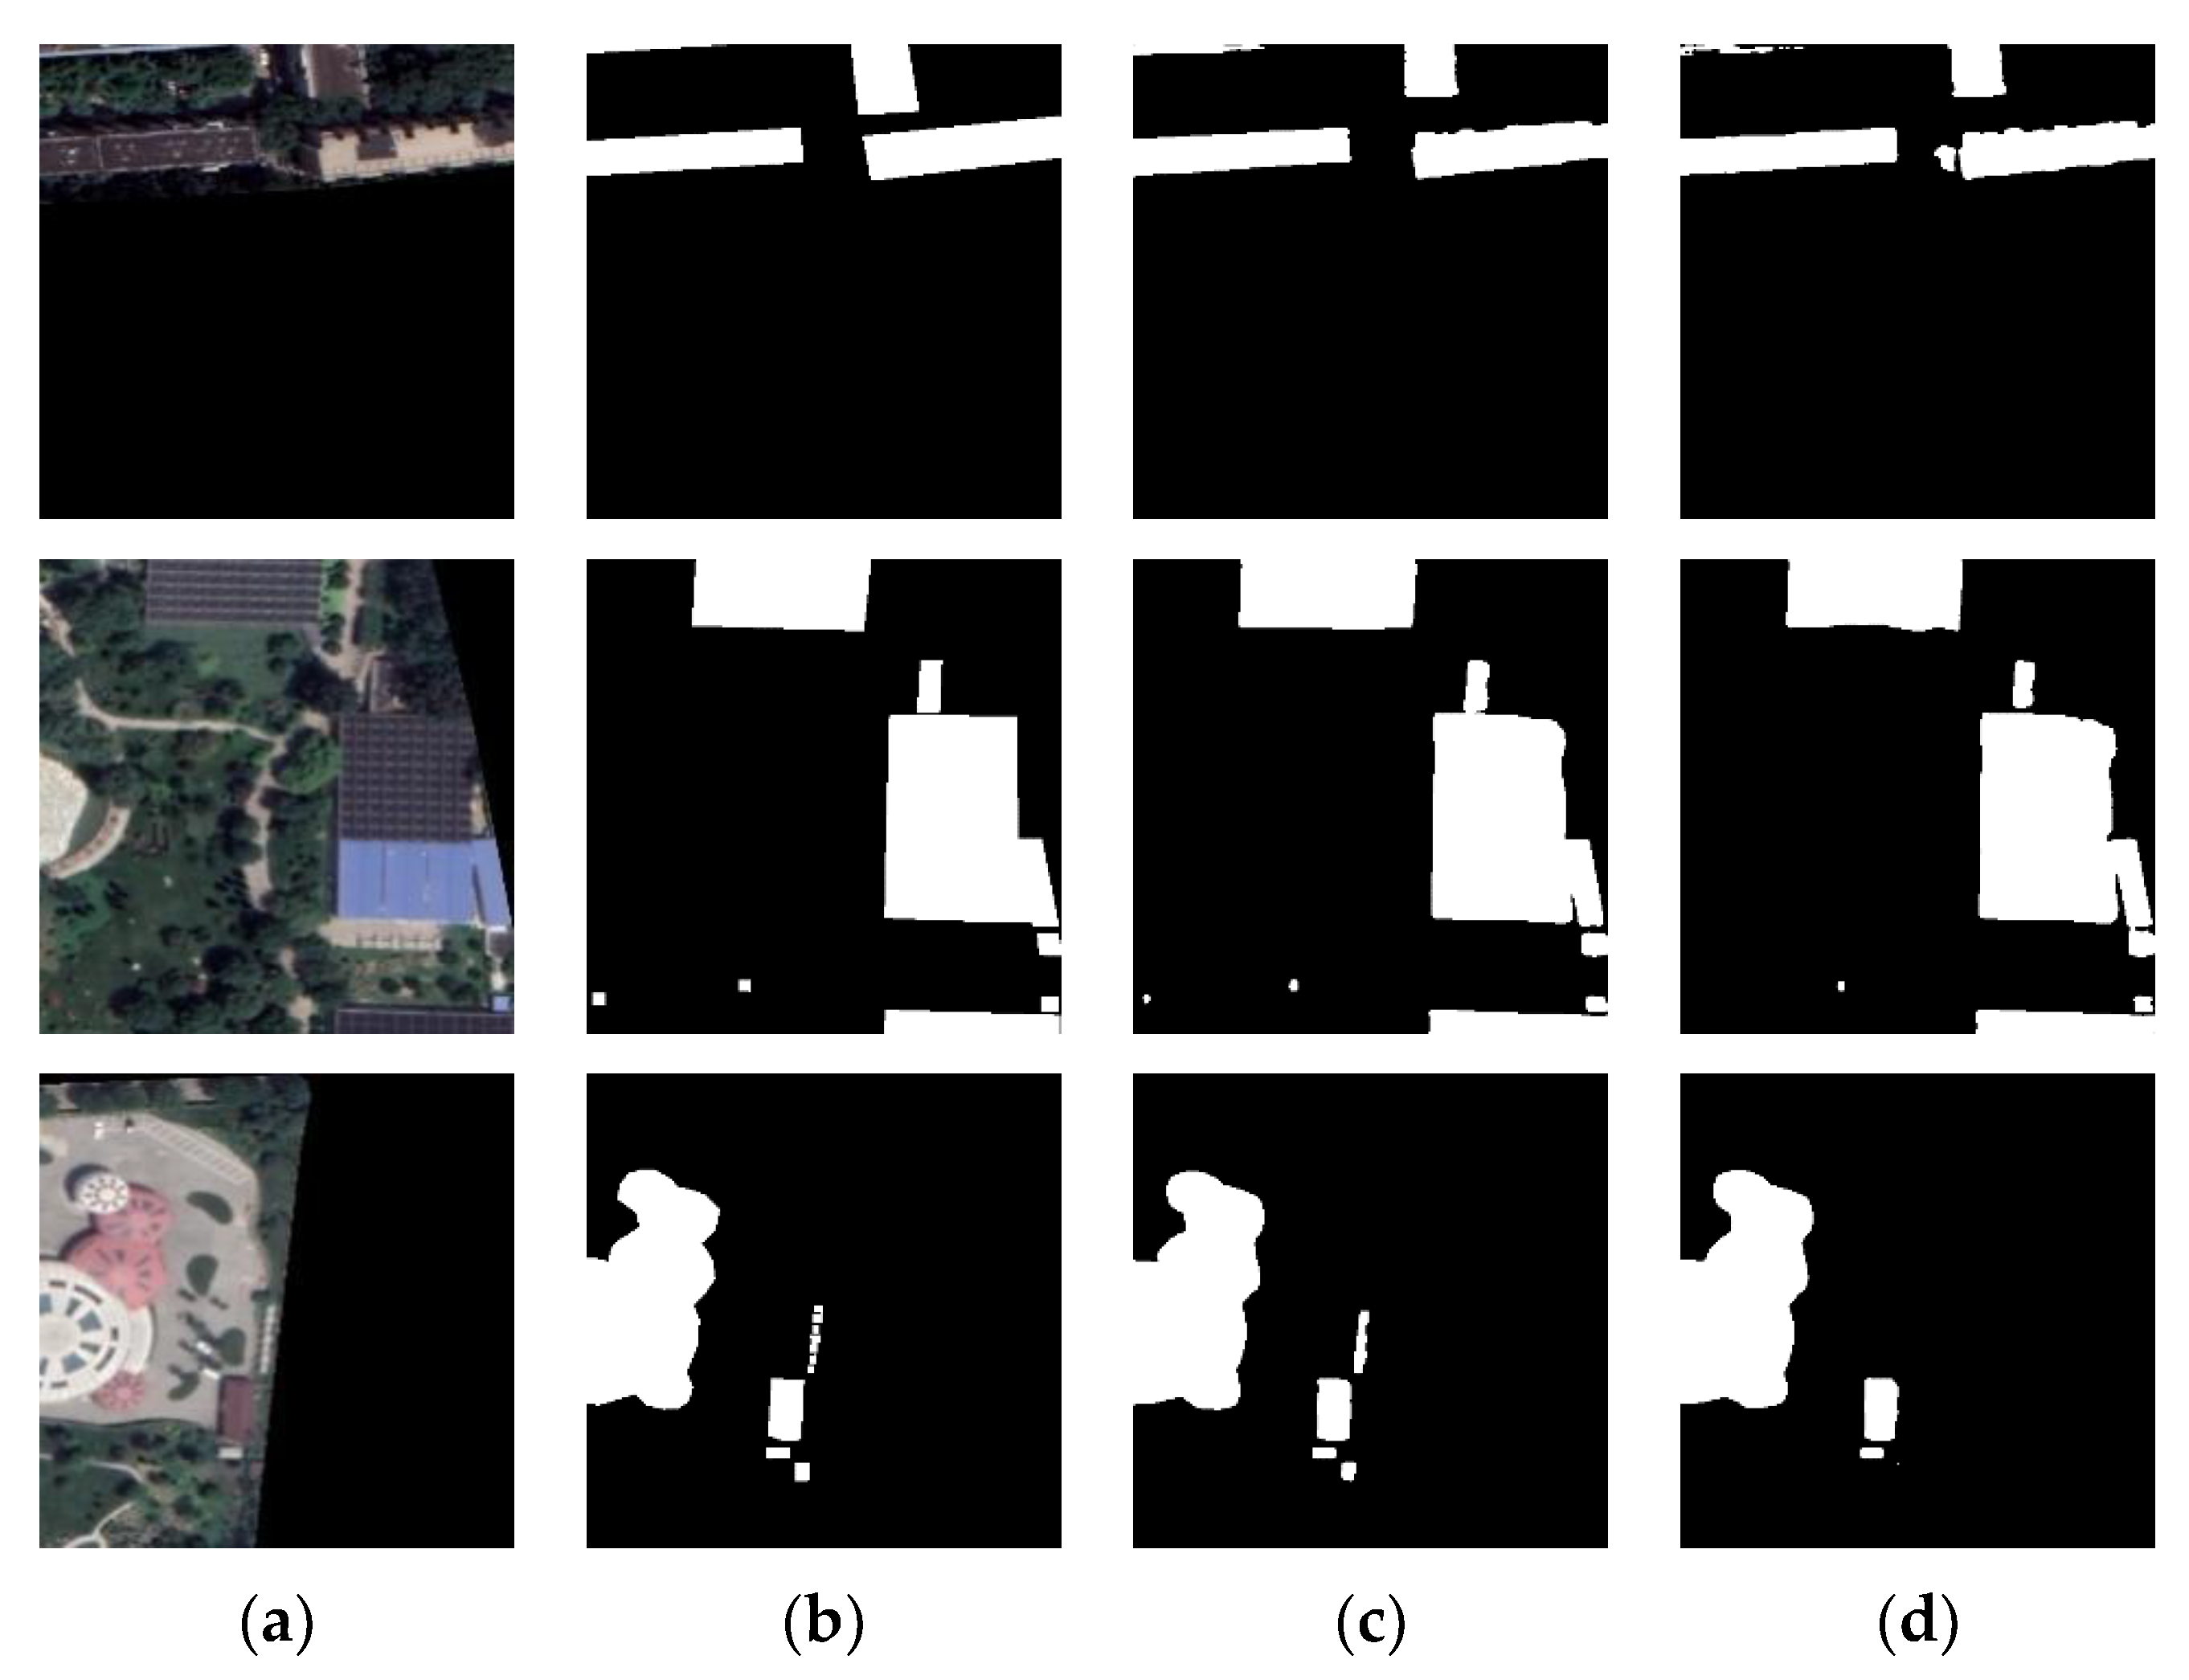
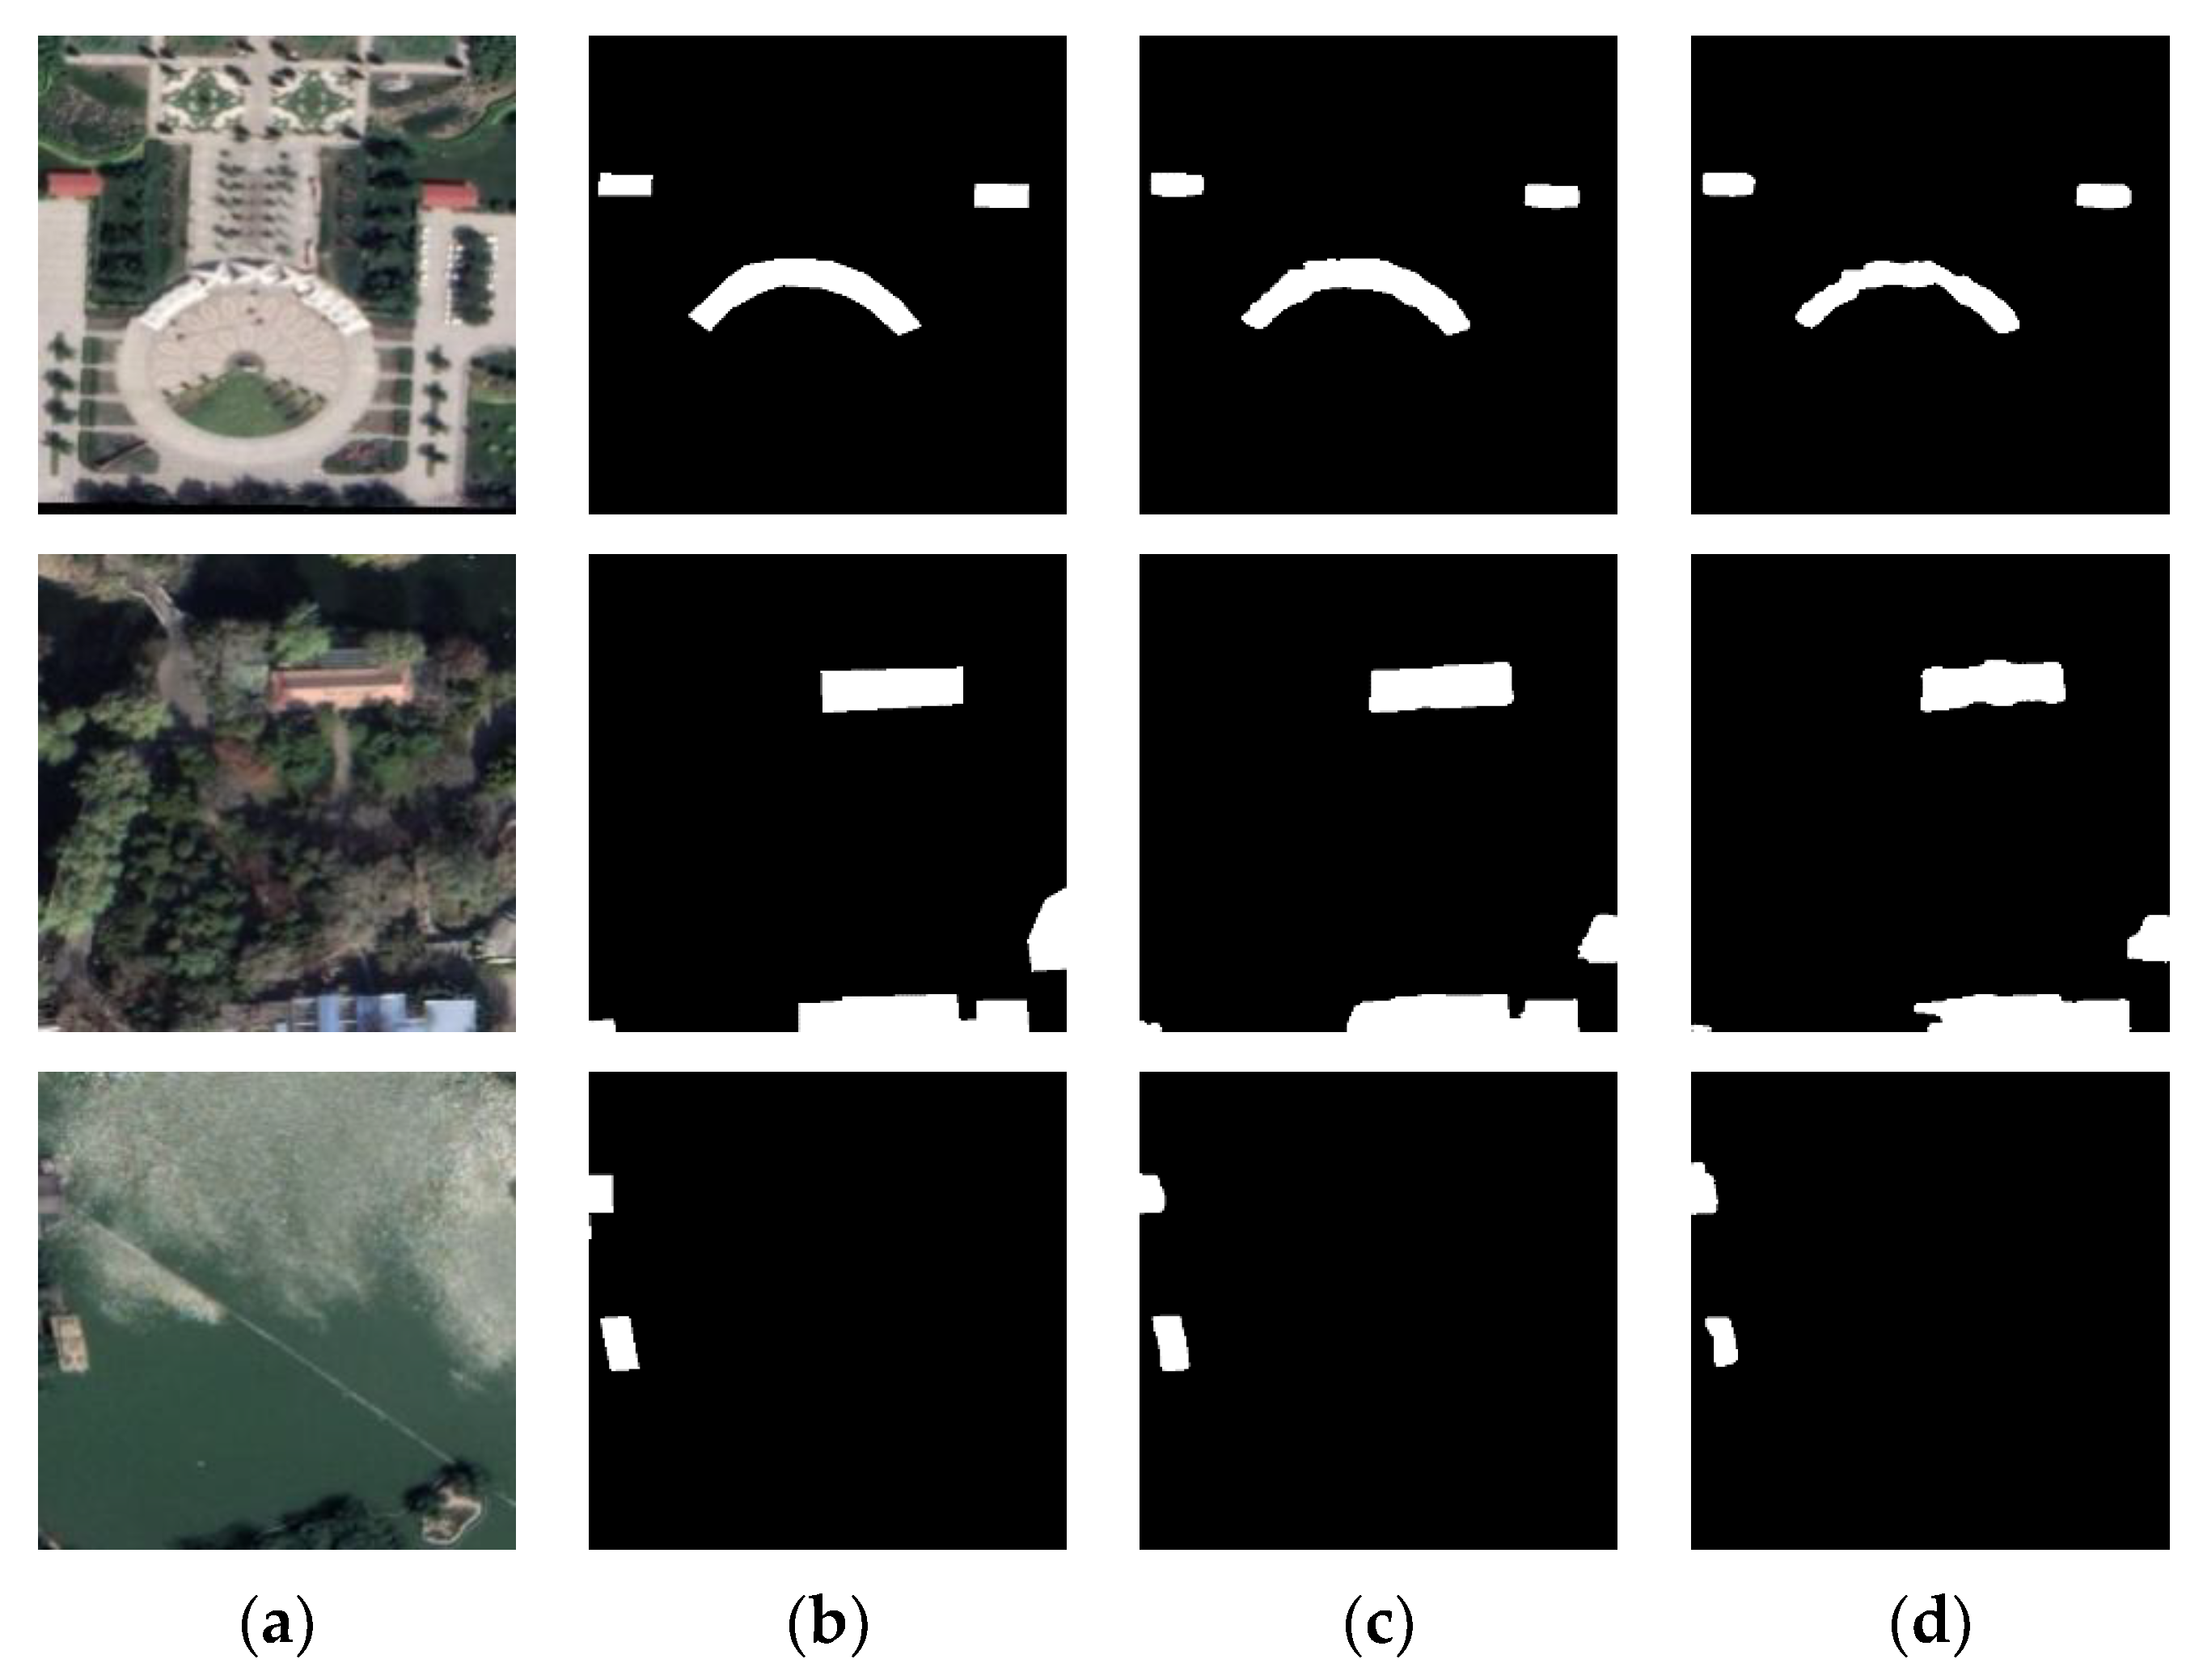
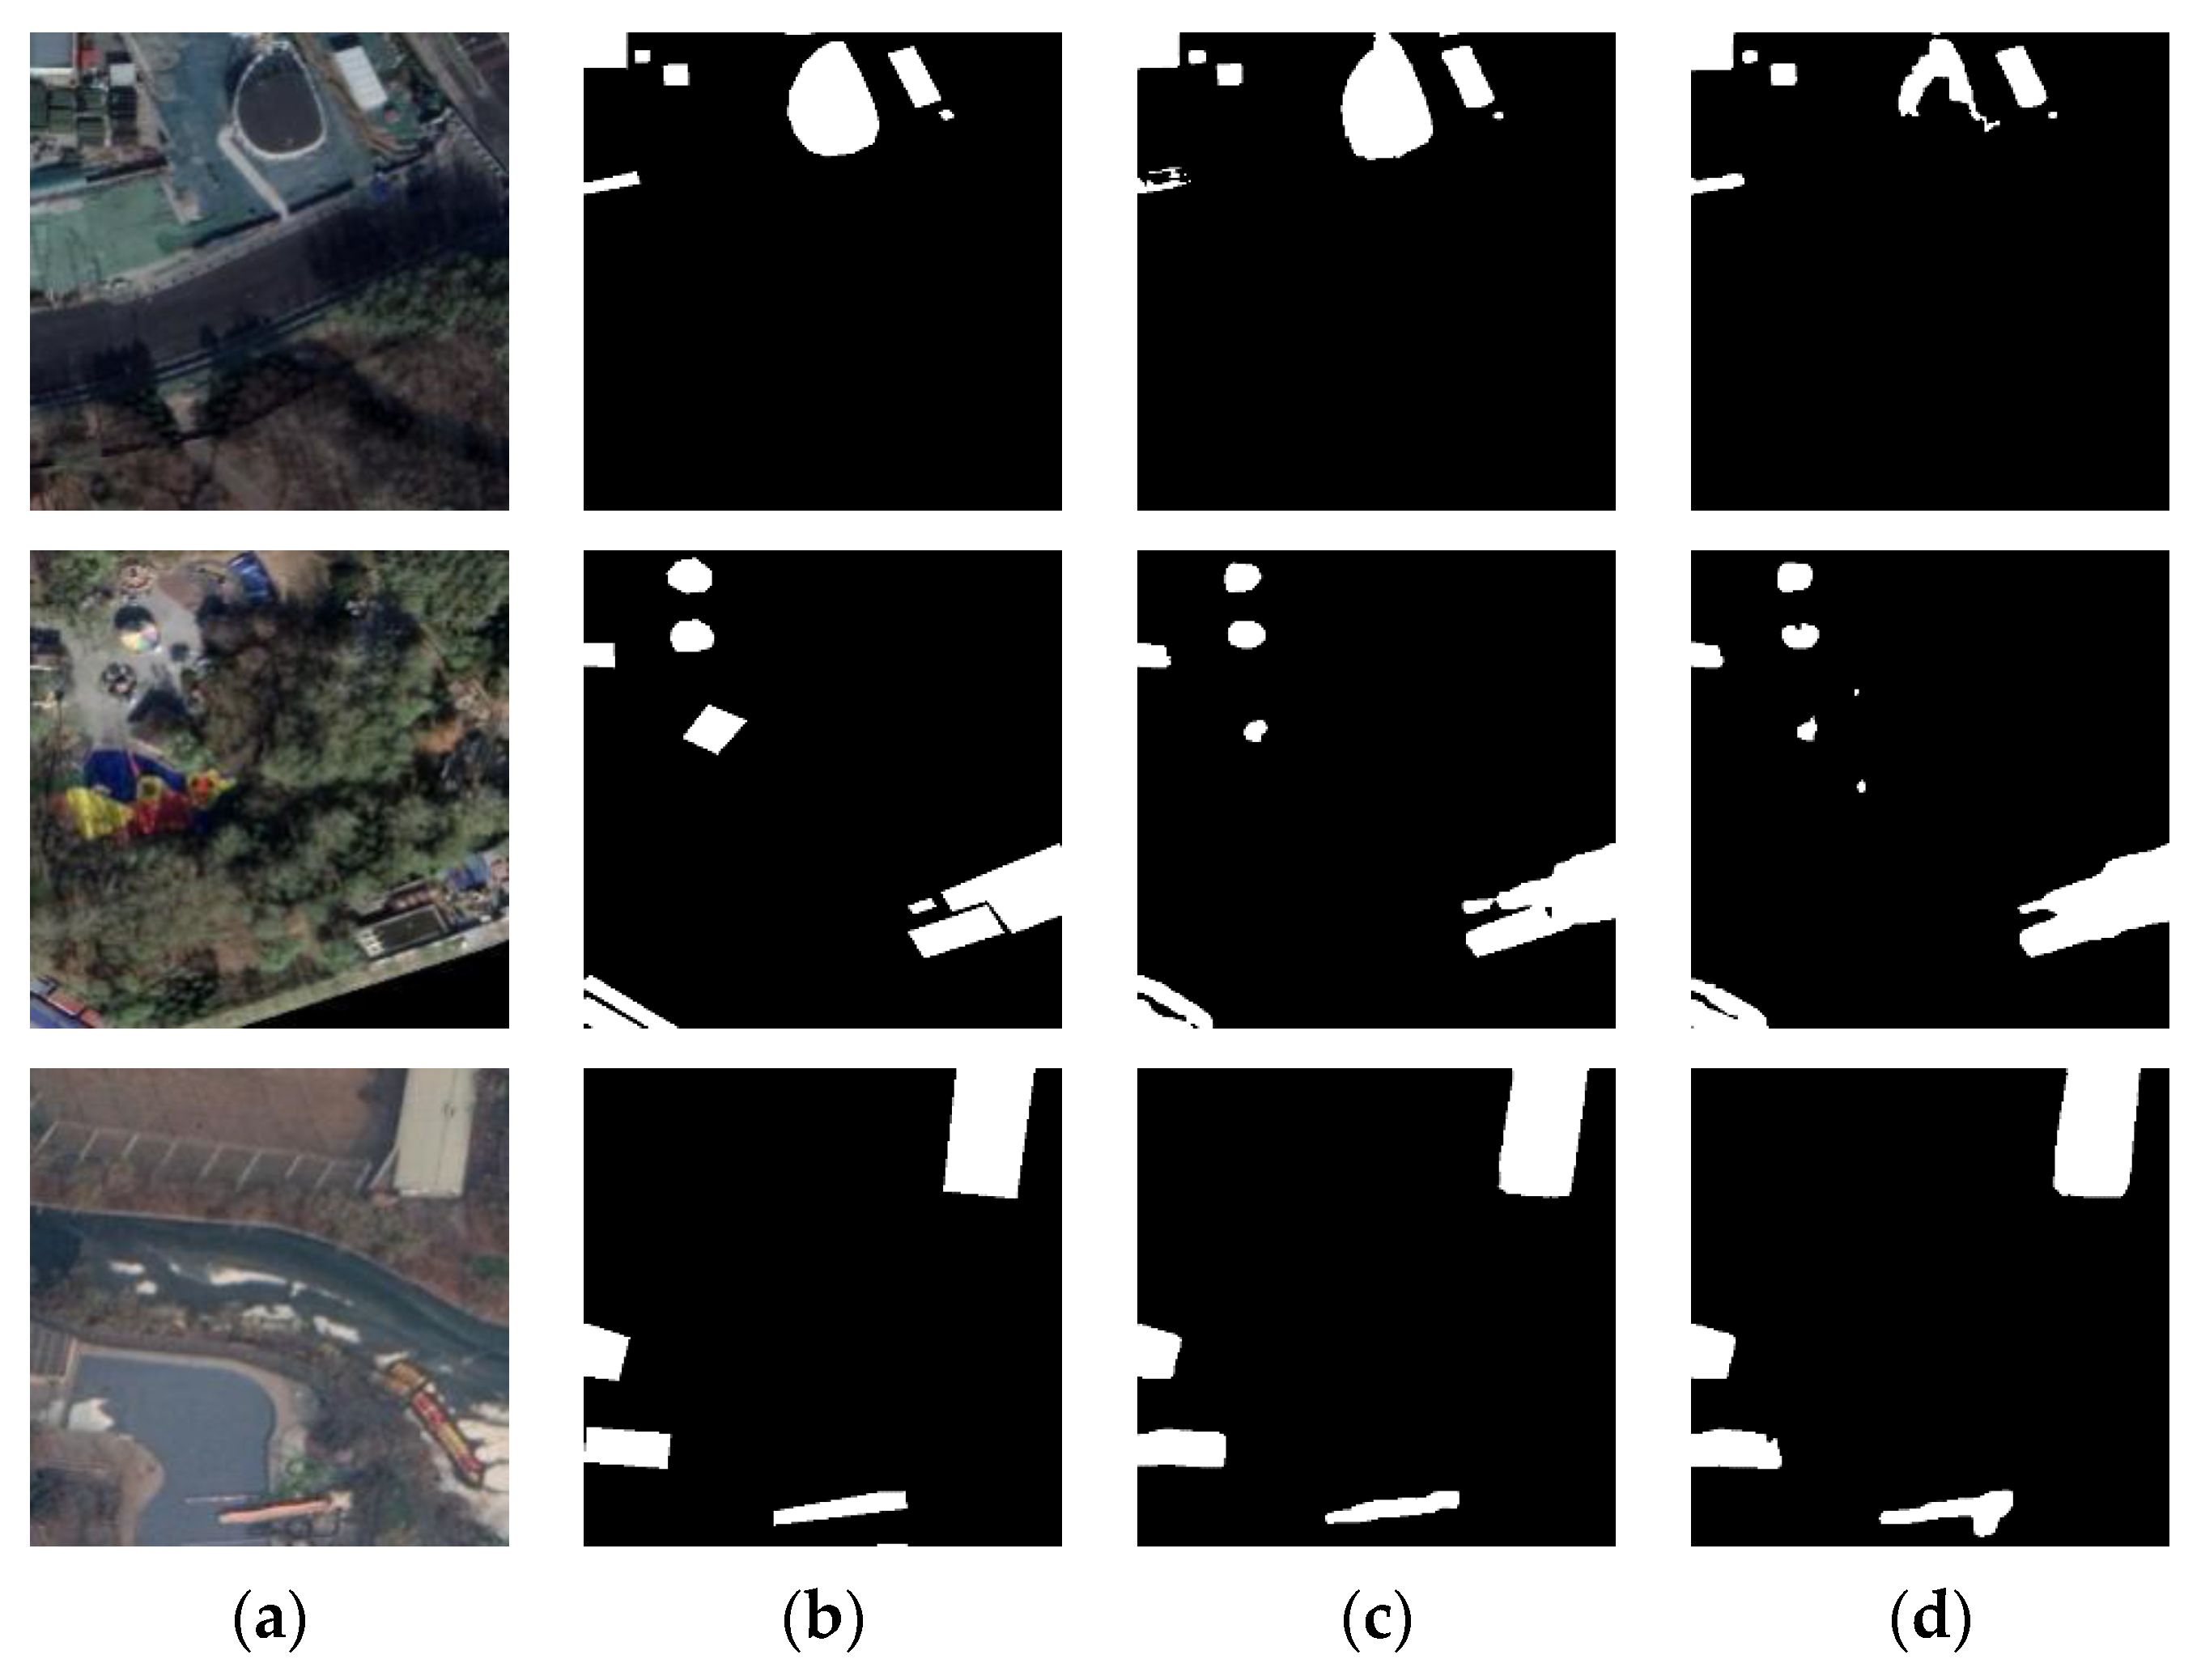
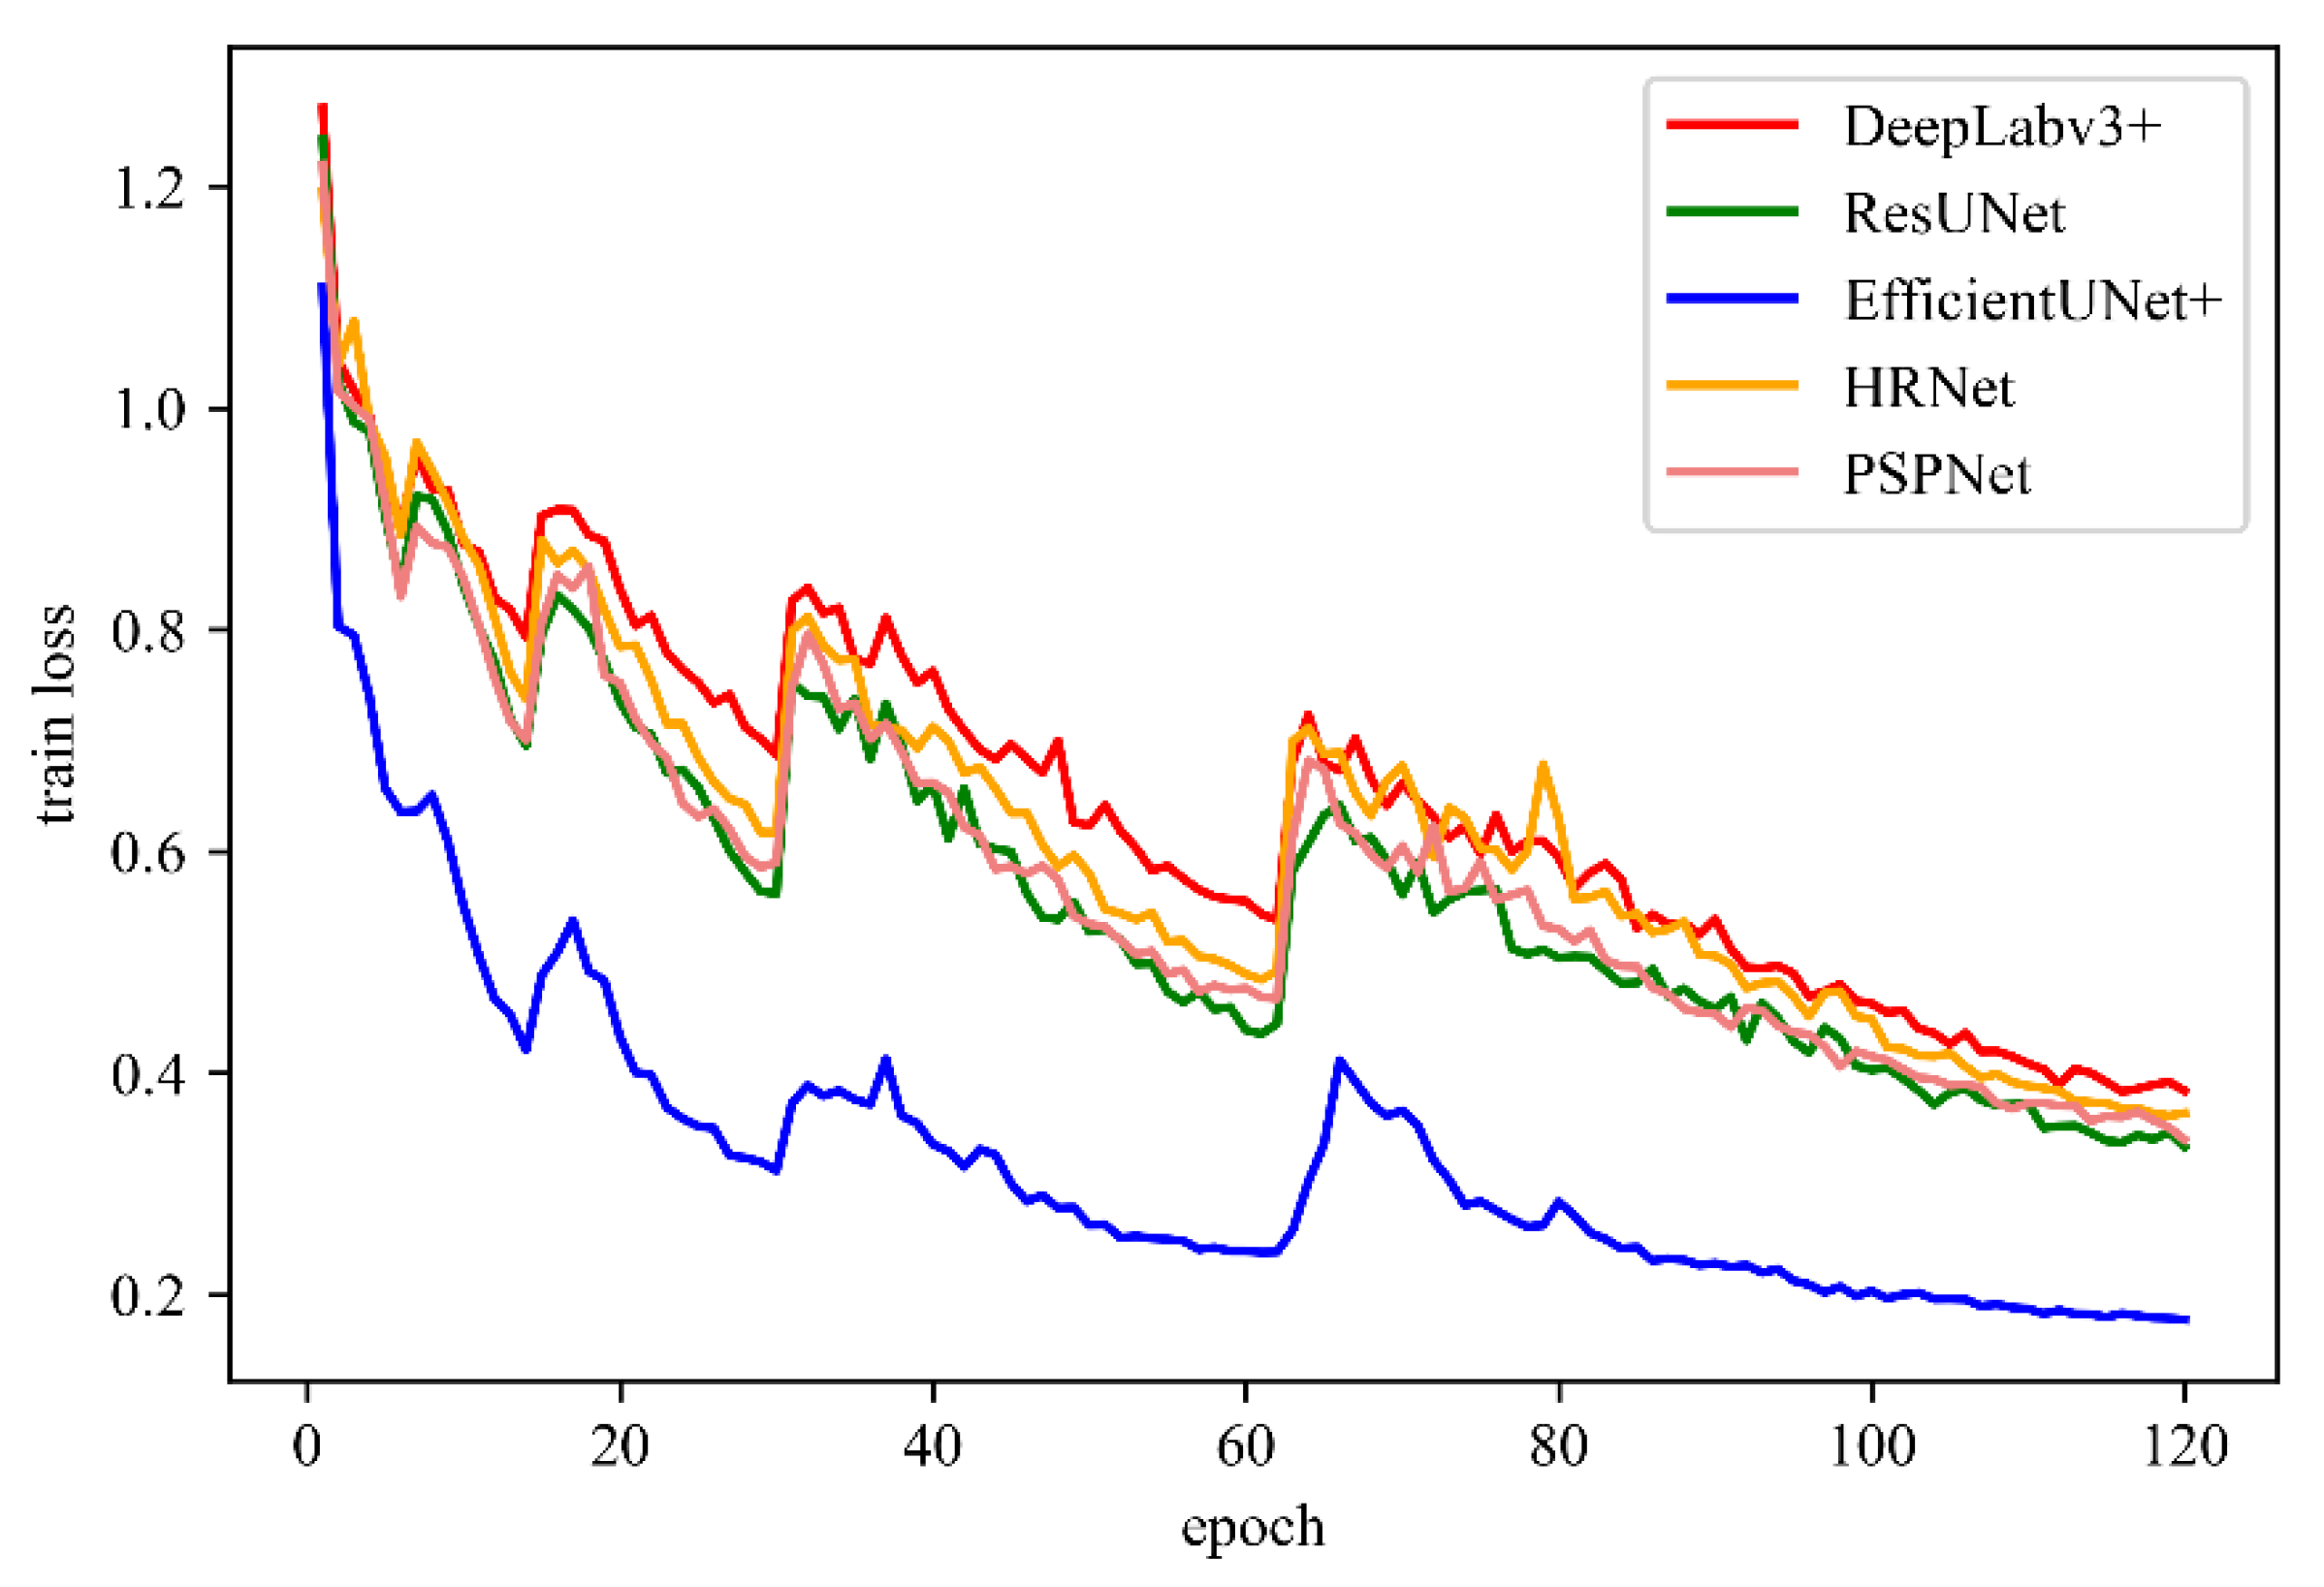
Buildings in special scenes, such as emergency shelters, are generally small. The extraction of such small buildings is prone to problems, such as integrity, misrepresentation and omission, and blurred boundaries. An improved deep learning method, EfficientUNet+, is proposed in this study, taking the emergency shelters within the Fifth Ring Road of Beijing as the research area. The effectiveness of the proposed method to extract buildings is verified. The following are the conclusions: (1) EfficientNet-b0 is used as the encoder, and the scSE is embedded in the decoder, which can accurately correct the feature map. Thus, the features extracted by the model are conducive to building extraction. (2) The joint loss function of building boundary-weighted cross-entropy and Dice loss can enforce constraints on building boundaries, making the building extraction results close to the ground truth. (3) Transfer learning technology can complete the high-precision extraction of buildings with few training samples in a specific scene background and improve the generalization ability of the model. The Precision, Recall, F1-Score, and mIoU of the EfficientUnet+ method are 93.01%, 89.17%, 91.05%, and 90.97%, respectively. Its accuracy is the highest among all evaluation indicators. This finding shows that the EfficientUnet+ method has suitable performance and advantages in extracting buildings in emergency shelters. The extraction results have guiding relevance in improving urban emergency evacuation capabilities and building livable cities.
However, the model sometimes misses extracting buildings that are obscured by trees. In the future, we will continue to optimize and improve the EfficientUNet+ method, try to extract buildings under different phenological conditions in summer and winter, and improve the accuracy and performance of remote sensing image building extraction. The method proposed in this study is suitable for optical remote sensing images. In the future, we will try to apply the proposed method to other datasets, such as side-scan sonar, to further verify the advantages of this method in small building extraction.

Author Contributions

Conceptualization, D.Y., F.W. and S.W.; methodology, Z.W., D.Y., F.W. and S.W.; software, D.Y. and Z.W.; validation, Y.X., F.W. and S.W.; formal analysis, D.Y.; investigation, D.Y.; resources, F.W.; data curation, J.W. and Y.X.; writing—original draft preparation, D.Y.; writing—review and editing, S.W. and Y.Z.; visualization, F.W. and Z.W.; supervision, S.W. and Y.Z.; project administration, D.Y. and S.W.; funding acquisition, D.Y. and S.W. All authors have read and agreed to the published version of the manuscript.

Funding

This research was funded by the Finance Science and Technology Project of Hainan Province (no. ZDYF2021SHFZ103) and the National Key Research and Development Program of China (no. 2021YFB3901201).

Data Availability Statement

The data presented in this study are available on request from the corresponding author.

Acknowledgments

We thank Wuhan University for providing the open access and free aerial image dataset. We would also like to thank the anonymous reviewers and the editors for their insightful comments and helpful suggestions.

Conflicts of Interest

The authors declare no conflict of interest.

Abbreviations

The following abbreviations are used in this manuscript:
CNNConvolutional Neural Network
FCNFully Convolutional Network
DSMDigital Surface Model
GISGeographic Information System
scSESpatial and Channel Squeeze and Excitation
sSESpatial Squeeze and Excitation
cSEChannel Squeeze and Excitation
BNBatch Normalization
SESqueeze and Excitation
mIoUMean Intersection over Union
TPTrue Positive
FPFalse Positive
FNFalse Negative
AdamAdaptive Moment Estimation
GPUGraphics Processing Unit
PSPNetPyramid Scene Parsing Network
ResNetResidual UNet
HRNetHigh-Resolution Net

References

  1. Chen, Q.; Wang, L.; Waslander, S.; Liu, X. An end-to-end shape modeling framework for vectorized building outline generation from aerial images. ISPRS J. Photogramm. Remote Sens. 2020, 170, 114–126. [Google Scholar] [CrossRef]
  2. Janalipour, M.; Mohammadzadeh, A. Evaluation of effectiveness of three fuzzy systems and three texture extraction methods for building damage detection from post-event LiDAR data. Int. J. Digit. Earth 2018, 11, 1241–1268. [Google Scholar] [CrossRef]
  3. Melgarejo, L.; Lakes, T. Urban adaptation planning and climate-related disasters: An integrated assessment of public infrastructure serving as temporary shelter during river floods in Colombia. Int. J. Disaster Risk Reduct. 2014, 9, 147–158. [Google Scholar] [CrossRef] [Green Version]
  4. GB21734-2008; Earthquake Emergency Shelter Site and Supporting Facilities. National Standards of People’s Republic of China: Beijing, China, 2008.
  5. Jing, J. Beijing Municipal Planning Commission announced the Outline of Planning for Earthquake and Emergency Refuge Places (Outdoor) in Beijing Central City. Urban Plan. Newsl. 2007, 21, 1. [Google Scholar]
  6. Yu, J.; Wen, J. Multi-criteria Satisfaction Assessment of the Spatial Distribution of Urban Emergency Shelters Based on High-Precision Population Estimation. Int. J. Disaster Risk Sci. 2016, 7, 413–429. [Google Scholar] [CrossRef] [Green Version]
  7. Hui, J.; Du, M.; Ye, X.; Qin, Q.; Sui, J. Effective Building Extraction from High-Resolution Remote Sensing Images with Multitask Driven Deep Neural Network. IEEE Geosci. Remote Sens. Lett. 2018, 16, 786–790. [Google Scholar] [CrossRef]
  8. Xu, Z.; Zhou, Y.; Wang, S.; Wang, L.; Li, F.; Wang, S.; Wang, Z. A Novel Intelligent Classification Method for Urban Green Space Based on High-Resolution Remote Sensing Images. Remote Sens. 2020, 12, 3845. [Google Scholar] [CrossRef]
  9. Dai, Y.; Gong, J.; Li, Y.; Feng, Q. Building segmentation and outline extraction from UAV image-derived point clouds by a line growing algorithm. Int. J. Digit. Earth 2017, 10, 1077–1097. [Google Scholar] [CrossRef]
  10. Zeng, Y.; Guo, Y.; Li, J. Recognition and extraction of high-resolution satellite remote sensing image buildings based on deep learning. Neural Comput. Appl. 2021, 5, 2691–2706. [Google Scholar] [CrossRef]
  11. Jing, W.; Xu, Z.; Ying, L. Texture-based segmentation for extracting image shape features. In Proceedings of the 19th International Conference on Automation and Computing (ICAC), London, UK, 13–14 September 2013; pp. 13–14. [Google Scholar]
  12. Huang, Z.; Cheng, G.; Wang, H.; Li, H.; Shi, L.; Pan, C. Building extraction from multi-source remote sensing images via deep deconvo-lution neural networks. In Proceedings of the 2016 IEEE International Geoscience and Remote Sensing Symposium (IGARSS), Beijing, China, 10–15 July 2016; pp. 1835–1838. [Google Scholar]
  13. Blaschke, T. Object based image analysis for remote sensing. ISPRS J. Photogramm. Remote Sens. 2010, 65, 2–16. [Google Scholar] [CrossRef] [Green Version]
  14. Chen, G.; Zhang, X.; Wang, Q.; Dai, F.; Gong, Y.; Zhu, K. Symmetrical dense-shortcut deep fully convolutional networks for semantic segmentation of very-high-resolution remote sensing images. IEEE J. Sel. Top. Appl. Earth Obs. Remote Sens. 2018, 11, 1633–1644. [Google Scholar] [CrossRef]
  15. Zhang, J.; Li, T.; Lu, X.; Cheng, Z. Semantic classification of high-resolution remote-sensing images based on mid-level features. IEEE J. Sel. Top. Appl. Earth Obs. Remote Sens. 2016, 9, 2343–2353. [Google Scholar] [CrossRef]
  16. Gong, M.; Zhan, T.; Zhang, P.; Miao, Q. Superpixel-based difference representation learning for change detection in multispectral remote sensing images. IEEE Trans. Geosci. Remote Sens. 2017, 55, 2658–2673. [Google Scholar] [CrossRef]
  17. Ren, S.; He, K.; Girshick, R.; Sun, J. Faster R-CNN: Towards Real-Time Object Detection with Region Proposal Networks. IEEE Trans. Pattern Anal. Mach. Intell. 2017, 39, 1137. [Google Scholar] [CrossRef] [Green Version]
  18. Liu, H.; Luo, J.; Huang, B.; Hu, X.; Sun, Y.; Yang, Y.; Xu, N.; Zhou, N. DE-Net: Deep Encoding Network for Building Extraction from High-Resolution Remote Sensing Imagery. Remote Sens. 2019, 11, 2380. [Google Scholar] [CrossRef] [Green Version]
  19. Zhu, Q.; Liao, C.; Han, H.; Mei, X.; Li, H. MAPGnet: Multiple attending path neural network for building footprint extraction from remote sensed imagery. IEEE Trans. Geosci. Remote Sens. 2021, 59, 6169–6181. [Google Scholar] [CrossRef]
  20. Yang, X.; Sun, H.; Fu, K.; Yang, J.; Sun, X.; Yan, M.; Guo, Z. Automatic ship detection in remote sensing images from google earth of complex scenes based on multiscale rotation dense feature pyramid networks. Remote Sens. 2018, 10, 132. [Google Scholar] [CrossRef] [Green Version]
  21. Jin, Y.; Xu, W.; Zhang, C.; Luo, X.; Jia, H. Boundary-Aware Refined Network for Automatic Building Extraction in Very High-Resolution Urban Aerial Images. Remote Sens. 2021, 13, 692. [Google Scholar] [CrossRef]
  22. Tang, Z.; Chen, C.; Jiang, C.; Zhang, D.; Luo, W.; Hong, Z.; Sun, H. Capsule–Encoder–Decoder: A Method for Generalizable Building Extraction from Remote Sensing Images. Remote Sens. 2022, 14, 1235. [Google Scholar] [CrossRef]
  23. Li, S.; Fu, S.; Zheng, D. Rural Built-Up Area Extraction from Remote Sensing Images Using Spectral Residual Methods with Embedded Deep Neural Network. Sustainability 2022, 14, 1272. [Google Scholar] [CrossRef]
  24. Chen, X.; Qiu, C.; Guo, W.; Yu, A.; Tong, X.; Schmitt, M. Multiscale Feature Learning by Transformer for Building Extraction from Satellite Images. IEEE Geosci. Remote Sens. Lett. 2022, 19, 2503605. [Google Scholar] [CrossRef]
  25. Long, J.; Shelhamer, E.; Darrell, T. Fully Convolutional Networks for Semantic Segmentation. arXiv 2015, arXiv:1411.4038. [Google Scholar]
  26. Maggiori, E.; Tarabalka, Y.; Charpiat, G.; Alliez, P. Convolutional Neural Networks for Large-Scale Remote-Sensing Image Classification. IEEE Trans. Geosci. Remote Sens. 2017, 55, 645–657. [Google Scholar] [CrossRef] [Green Version]
  27. Bittner, K.; Adam, F.; Cui, S.; Korner, M.; Reinartz, P. Building footprint extraction from VHR remote sensing images combined with normalized DSMs using fused Fully Convolutional Networks. IEEE J. Sel. Top. Appl. Earth Obs. Remote Sens. 2018, 11, 2615–2629. [Google Scholar] [CrossRef] [Green Version]
  28. Xu, Y.; Wu, L.; Xie, Z.; Chen, Z. Building Extraction in Very High Resolution Remote Sensing Imagery Using Deep Learning and Guided Filters. Remote Sens. 2018, 10, 144. [Google Scholar] [CrossRef] [Green Version]
  29. Wei, S.; Ji, S.; Lu, M. Toward automatic building footprint delineation from aerial images using CNN and regularization. IEEE Trans. Geosci. Remote Sens. 2020, 58, 2178–2189. [Google Scholar] [CrossRef]
  30. Ronneberger, O.; Fischer, P.; Brox, T. U-net: Convolutional networks for biomedical image segmentation. arXiv 2015, arXiv:1505.04597. [Google Scholar]
  31. Ye, Z.; Fu, Y.; Gan, M.; Deng, J.; Comber, A.; Wang, K. Building extraction from very high resolution aerial imagery using joint attention deep neural network. Remote Sens. 2019, 11, 2970. [Google Scholar] [CrossRef] [Green Version]
  32. Qin, X.; Zhang, Z.; Huang, C.; Dehghan, M.; Zaiane, O.; Jagersand, M. U2Net: Going deeper with nested U-structure for salient object detection. Pattern Recognit. 2020, 106, 107404. [Google Scholar] [CrossRef]
  33. Peng, X.; Zhong, R.; Li, Z.; Li, Q. Optical remote sensing image change detection based on attention mechanism and image difference. IEEE Trans. Geosci. Remote Sens. 2021, 59, 7296–7307. [Google Scholar] [CrossRef]
  34. Wang, Y.; Zeng, X.; Liao, X.; Zhuang, D. B-FGC-Net: A Building Extraction Network from High Resolution Remote Sensing Imagery. Remote Sens. 2022, 14, 269. [Google Scholar] [CrossRef]
  35. Wang, H.; Miao, F. Building extraction from remote sensing images using deep residual U-Net. Eur. J. Remote Sens. 2022, 55, 71–85. [Google Scholar] [CrossRef]
  36. Tian, Q.; Zhao, Y.; Li, Y.; Chen, J.; Chen, X.; Qin, K. Multiscale Building Extraction with Refined Attention Pyramid Networks. IEEE Geosci. Remote Sens. Lett. 2022, 19, 1–5. [Google Scholar] [CrossRef]
  37. Cao, D.; Xing, H.; Wong, M.; Kwan, M.; Xing, H.; Meng, Y. A Stacking Ensemble Deep Learning Model for Extraction from Remote Sensing Images. Remote Sens. 2021, 13, 3898. [Google Scholar] [CrossRef]
  38. Tadepalli, Y.; Kollati, M.; Kuraparthi, S.; Kora, P. EfficientNet-B0 Based Monocular Dense-Depth Map Estimation. Trait. Signal 2021, 38, 1485–1493. [Google Scholar] [CrossRef]
  39. Zhao, P.; Huang, L. Multi-Aspect SAR Target Recognition Based on Efficientnet and GRU. In Proceedings of the IEEE International Geoscience and Remote Sensing Symposium (IGARSS), Electr Network, Waikoloa, HI, USA, 26 September–2 October 2020; pp. 1651–1654. [Google Scholar]
  40. Alhichri, H.; Alswayed, A.; Bazi, Y.; Ammour, N.; Alajlan, N. Classification of Remote Sensing Images using EfficientNet-B3 CNN Model with Attention. IEEE Access 2021, 9, 14078–14094. [Google Scholar] [CrossRef]
  41. Ferrari, L.; Dell’Acqua, F.; Zhang, P.; Du, P. Integrating EfficientNet into an HAFNet Structure for Building Mapping in High-Resolution Optical Earth Observation Data. Remote Sens. 2021, 13, 4361. [Google Scholar] [CrossRef]
  42. Tan, M.; Le, Q. EfficientNet: Rethinking Model Scaling for Convolutional Neural Networks. In Proceedings of the 36th International Conference on Machine Learning(ICML), Long Beach, CA, USA, 9–15 June 2019; p. 97. [Google Scholar]
  43. Roy, A.; Navab, N.; Wachinger, C. Concurrent Spatial and Channel Squeeze & Excitation in Fully Convolutional Networks. arXiv 2018, arXiv:1803.02579. [Google Scholar]
  44. Mondal, A.; Agarwal, A.; Dolz, Z.; Desrosiers, C. Revisiting CycleGAN for semi-supervised segmentation. arXiv 2019, arXiv:1908.11569. [Google Scholar]
  45. Qin, X.; He, S.; Yang, X.; Dehghan, M.; Qin, Q.; Martin, J. Accurate outline extraction of individual building from very high-resolution optical images. IEEE Geosci. Remote Sens. Lett. 2018, 15, 1775–1779. [Google Scholar] [CrossRef]
  46. Das, A.; Chandran, S. Transfer Learning with Res2Net for Remote Sensing Scene Classification. In Proceedings of the 11th International Conference on Cloud Computing, Data Science and Engineering (Confluence), Amity Univ, Amity Sch Engn & Technol, Electr Network, Noida, India, 28–29 January 2021; pp. 796–801. [Google Scholar]
  47. Zhu, Q.; Shen, F.; Shang, P.; Pan, Y.; Li, M. Hyperspectral Remote Sensing of Phytoplankton Species Composition Based on Transfer Learning. Remote Sens. 2019, 11, 2001. [Google Scholar] [CrossRef] [Green Version]
  48. Seventh National Census Communiqué; National Bureau of Statistics: Beijing, China, 2021.
  49. Ji, S.; Wei, S. Building extraction via convolution neural networks from an open remote sensing building dataset. Arca Geod. Cartogr. Sin. 2019, 48, 448–459. [Google Scholar]
  50. Wang, Y.; Chen, C.; Ding, M.; Li, J. Real-time dense semantic labeling with dual-Path framework for high-resolution remote sensing image. Remote Sens. 2019, 11, 3020. [Google Scholar] [CrossRef] [Green Version]
  51. Ji, S.; Wei, S.; Lu, M. Fully convolutional networks for multisource building extraction from an open aerial and satellite imagery data set. IEEE T Rans. Geosci. Remote Sens. 2018, 57, 574–586. [Google Scholar] [CrossRef]
  52. Chen, L.C.E.; Zhu, Y.; Papandreou, G.; Schroff, F.; Adam, H. Encoder-Decoder with Atrous Separable Convolution for Semantic Image Segmentation. In Proceedings of the 15th European Conference on Computer Vision (ECCV), Munich, Germany, 8–14 September 2018; pp. 833–851. [Google Scholar]
  53. Zhao, H.; Shi, J.; Qi, X.; Wang, X.; Jia, J. Pyramid Scene Parsing Network. In Proceedings of the 30th IEEE/CVF Conference on Computer Vision and Pattern Recognition (CVPR), Honolulu, HI, USA, 21–26 July 2017; pp. 6230–6239. [Google Scholar]
  54. Zhang, Z.X.; Liu, Q.J.; Wang, Y.H. Road Extraction by Deep Residual U-Net. IEEE Geosci. Remote Sens. Lett. 2018, 15, 749–753. [Google Scholar] [CrossRef] [Green Version]
  55. Wang, J.; Sun, K.; Cheng, T.; Jiang, B.; Deng, C.; Zhao, Y.; Liu, D.; Mu, Y.; Tan, M.; Wang, X.; et al. Deep High-Resolution Representation Learning for Visual Recognition. IEEE Trans. Pattern Anal. Mach. Intell. 2019, 43, 3349–3364. [Google Scholar] [CrossRef] [Green Version]
Figure 1. The technical route of this study.
Remotesensing 14 02207 g001
Figure 2. EfficientUNet+ module structure.
Remotesensing 14 02207 g002
Figure 3. MBConv structure.
Remotesensing 14 02207 g003
Figure 4. Operation flow of scSE module.
Remotesensing 14 02207 g004
Figure 5. Spatial distribution of park emergency shelter sites within the Fifth Ring Road of Beijing.
Remotesensing 14 02207 g005
Figure 6. Part of the details of WHU aerial building dataset and Google building dataset of emergency shelters within the Fifth Ring Road of Beijing. (a) WHU aerial building dataset. (b) Google building dataset of emergency shelters within the Fifth Ring Road of Beijing.
Remotesensing 14 02207 g006
Figure 7. Original image, building ground truth value, and extraction results of the emergency shelter in Chaoyang Park. (a) Original image. (b) Ground truth. (c) Extraction results.
Remotesensing 14 02207 g007
Figure 8. Extraction results of buildings in emergency shelters of Chaoyang Park. (a) Google image. (b) Building ground truth. (c) Building extraction results.
Remotesensing 14 02207 g008
Figure 9. Feature map visualization. (a) Sample image. (b) Depth = 1. (c) Depth = 2. (d) Depth = 3. (e) Depth = 4. (f) Depth = 5.
Remotesensing 14 02207 g009
Figure 10. Partial details of the building in the emergency shelter through different methods. (a) Original image. (b) Ground truth. (c) EfficientUNet+. (d) DeepLabv3+. (e) PSPNet. (f) ResUNet. (g) HRNet.
Remotesensing 14 02207 g010
Figure 11. Accuracy comparison chart of different methods.
Remotesensing 14 02207 g011
Figure 12. Building extraction results with or without the scSE. (a) Original image. (b) Ground truth. (c) EfficientUNet+. (d) EfficientUNet (without scSE).
Remotesensing 14 02207 g012
Figure 13. Building extraction results with different loss functions. (a) Original image. (b) Ground truth. (c) LossCE_BW + LossDice. (d) LossCE + LossDice.
Remotesensing 14 02207 g013
Figure 14. Building extraction results with and without transfer learning. (a) Original image. (b) Ground truth. (c) EfficientUNet+ with transfer learning. (d) EfficientUNet+ without transfer learning.
Remotesensing 14 02207 g014
Figure 15. Visualization graph of training loss and epochs.
Remotesensing 14 02207 g015
Table 1. Network structure of EfficientNet-b0.
StageOperatorResolutionLayers
1Conv 3 × 3512 × 5121
2MBConv1, k3 × 3256 × 2561
3MBConv6, k3 × 3256 × 2562
4MBConv6, k5 × 5128 × 1282
5MBConv6, k3 × 364 × 643
6MBConv6, k5 × 532 × 323
7MBConv6, k5 × 532 × 324
8MBConv6, k3 × 316 × 161
9Conv1 × 1&Pooling&FC8 × 81
Table 2. Accuracy of EfficientUNet+ method for extracting buildings.
PrecisionRecallF1-ScoremIoU
93.01%89.17%91.05%90.97%
Table 3. Accuracy comparison of the extraction results of different methods.
MethodsPrecisionRecallF1-ScoremIoU
DeepLabv3+ [52]90.52%87.15%88.80%88.92%
PSPNet [53]76.40%75.34%75.87%78.36%
ResUNet [54]88.51%80.72%84.44%85.16%
HRNet [55]89.14%83.43%86.19%86.63%
EfficientUNet+93.01%89.17%91.05%90.97%
Table 4. Accuracy comparison of extraction results of different decoders.
MethodDecoderPrecisionRecallF1-ScoremIoU
EfficientUNetWithout scSE90.81%88.23%89.50%89.54%
EfficientUNet+With scSE93.01%89.17%91.05%90.97%
Table 5. Comparison of the accuracy of prediction results of different loss functions.
Loss FunctionPrecisionRecallF1-ScoremIoU
LossCE + LossDice92.0787.3989.6789.71
LossCE_BW + LossDice93.0189.1791.0590.97
Table 6. Accuracy comparison of prediction results with and without transfer learning.
Transfer LearningPrecisionRecallF1-ScoremIoU
92.75%88.92%90.79%90.73%
93.01%89.17%91.05%90.97%
Table 7. Operation time of buildings extracted by different methods.
TimeDeepLabv3+PSPNetResUnetHRNetEfficientUNet+
Inference time16.31 s13.42 s15.96 s32.05 s11.16 s
Train time362.77 min312.82 min334.77 min427.98 min279.05 min
Publisher’s Note: MDPI stays neutral with regard to jurisdictional claims in published maps and institutional affiliations.

