
Evaluating Several Vegetation Indices Derived from Sentinel-2 Imagery for Quantifying Localized Overgrazing in a Semi-Arid Region of South Africa


Abstract
:1. Introduction
2. Materials and Methods
2.1. Study Area
2.2. Data Collection
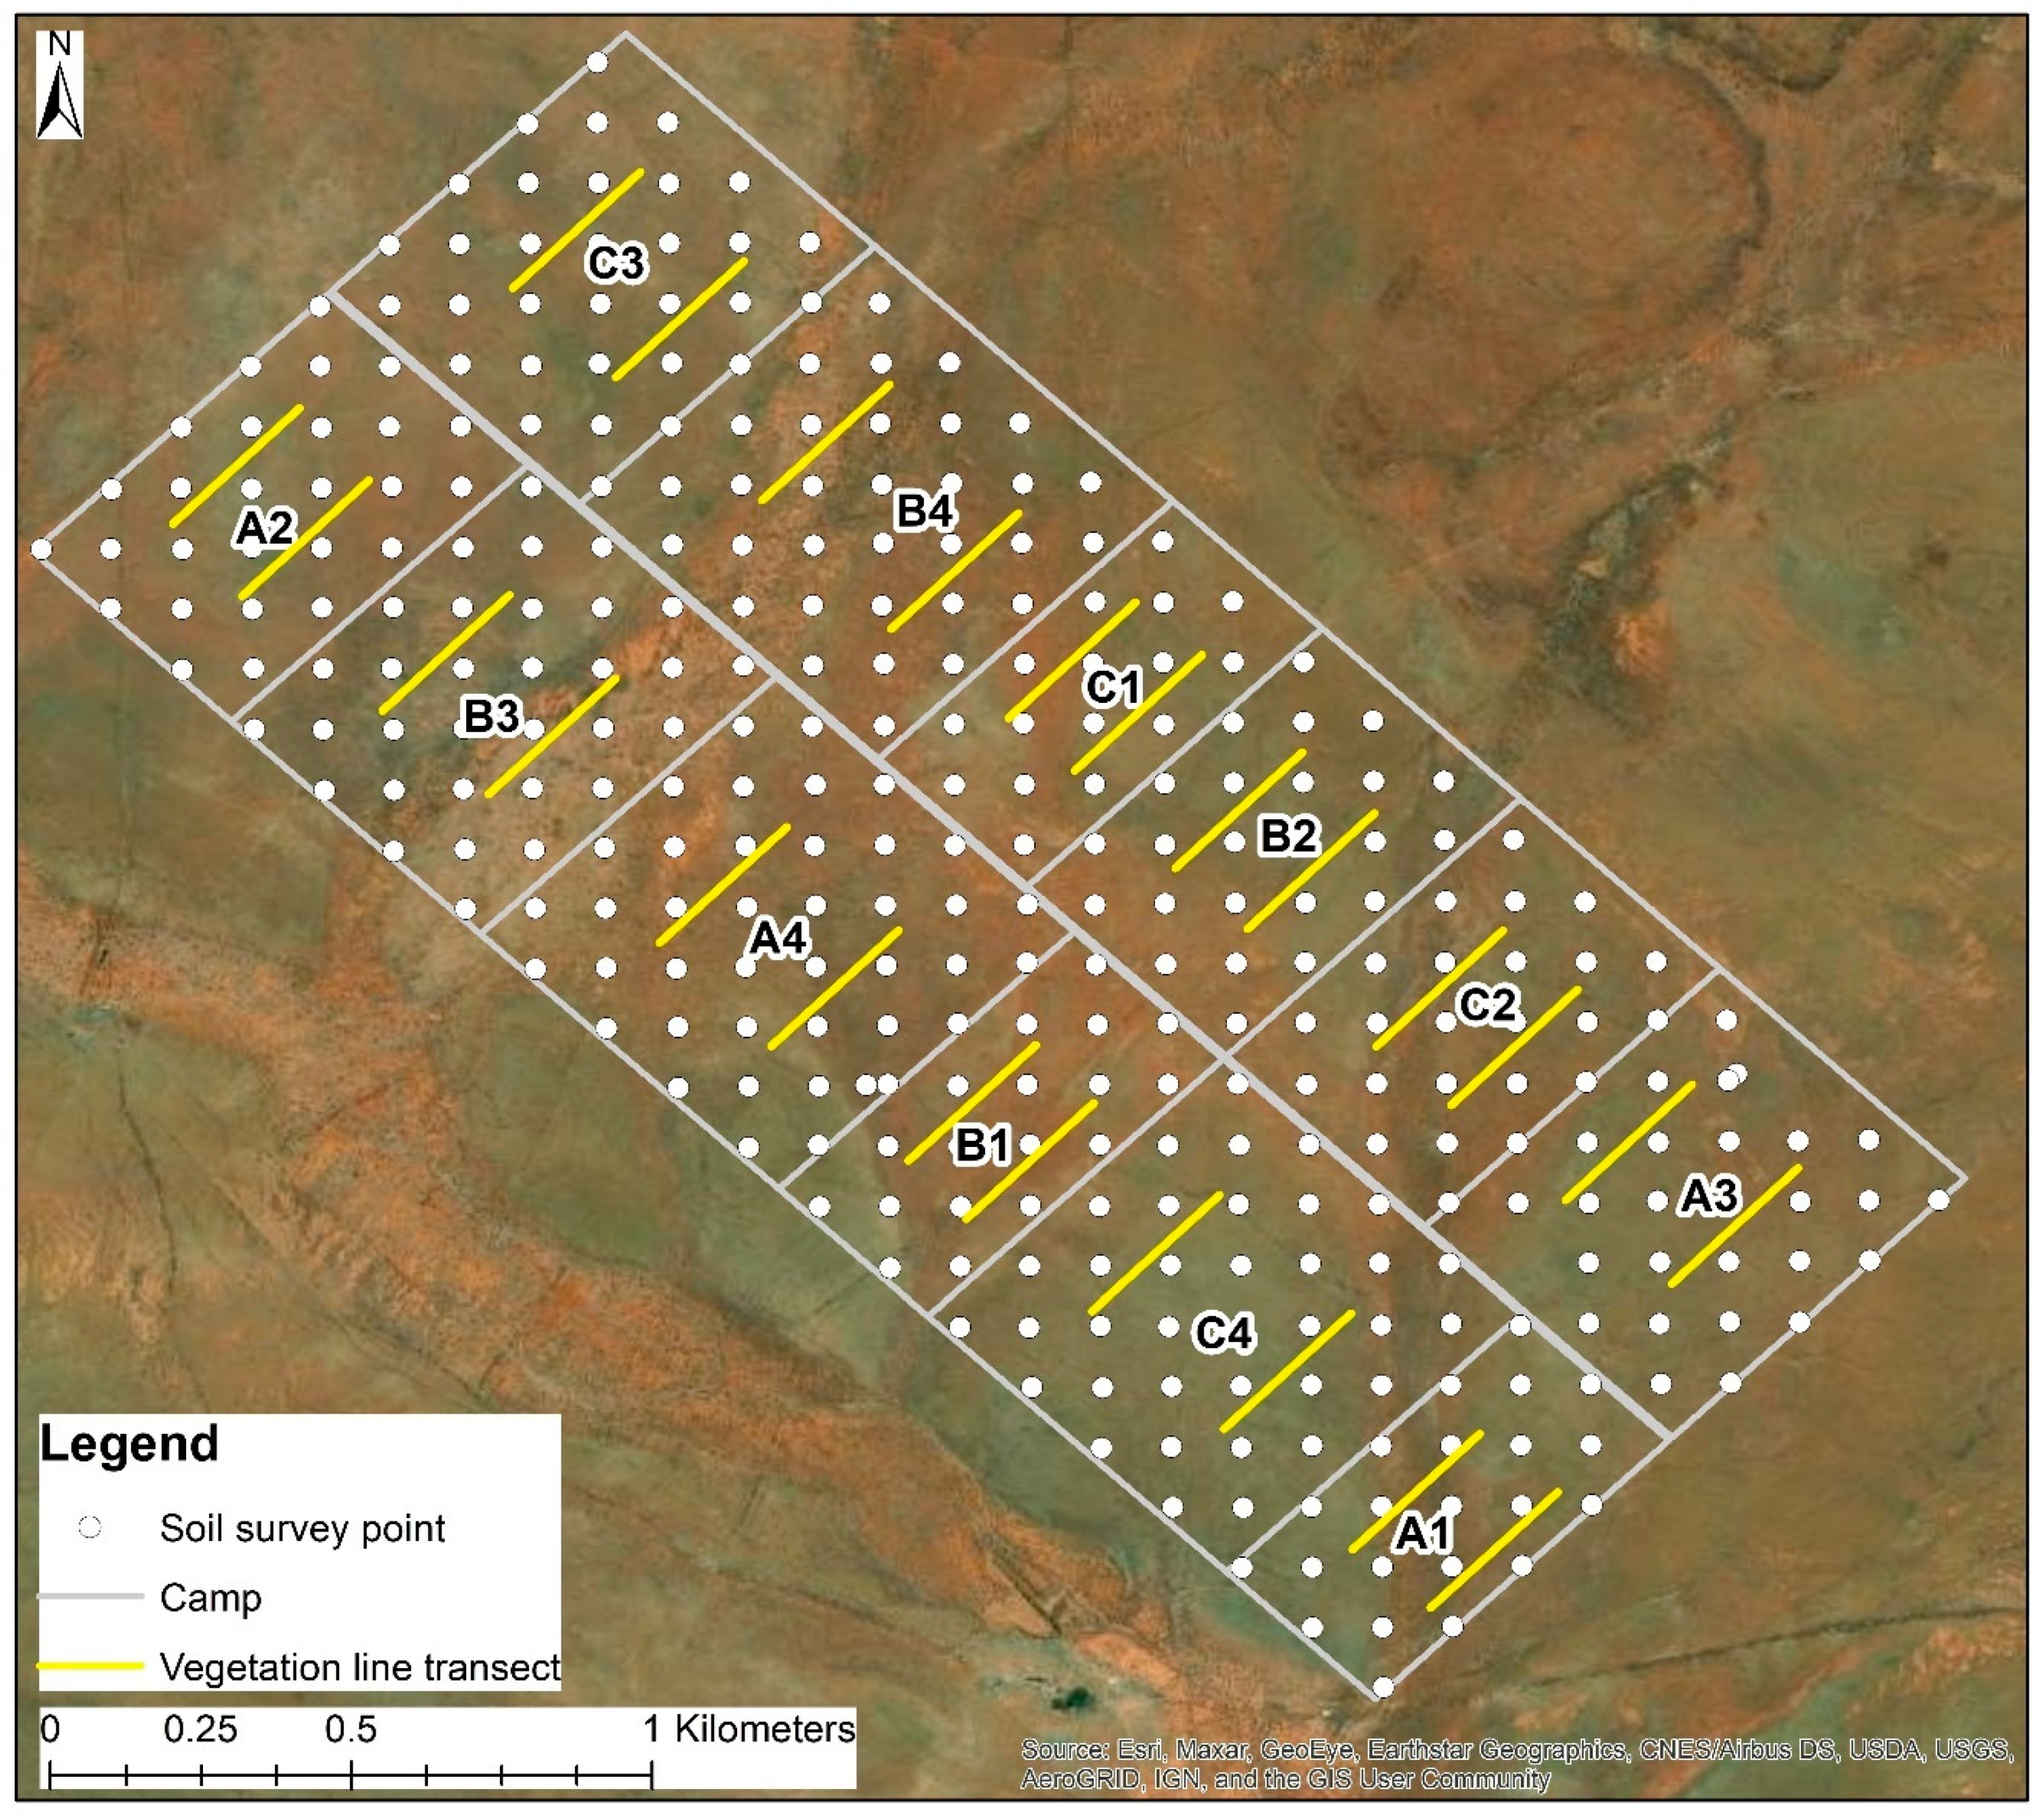
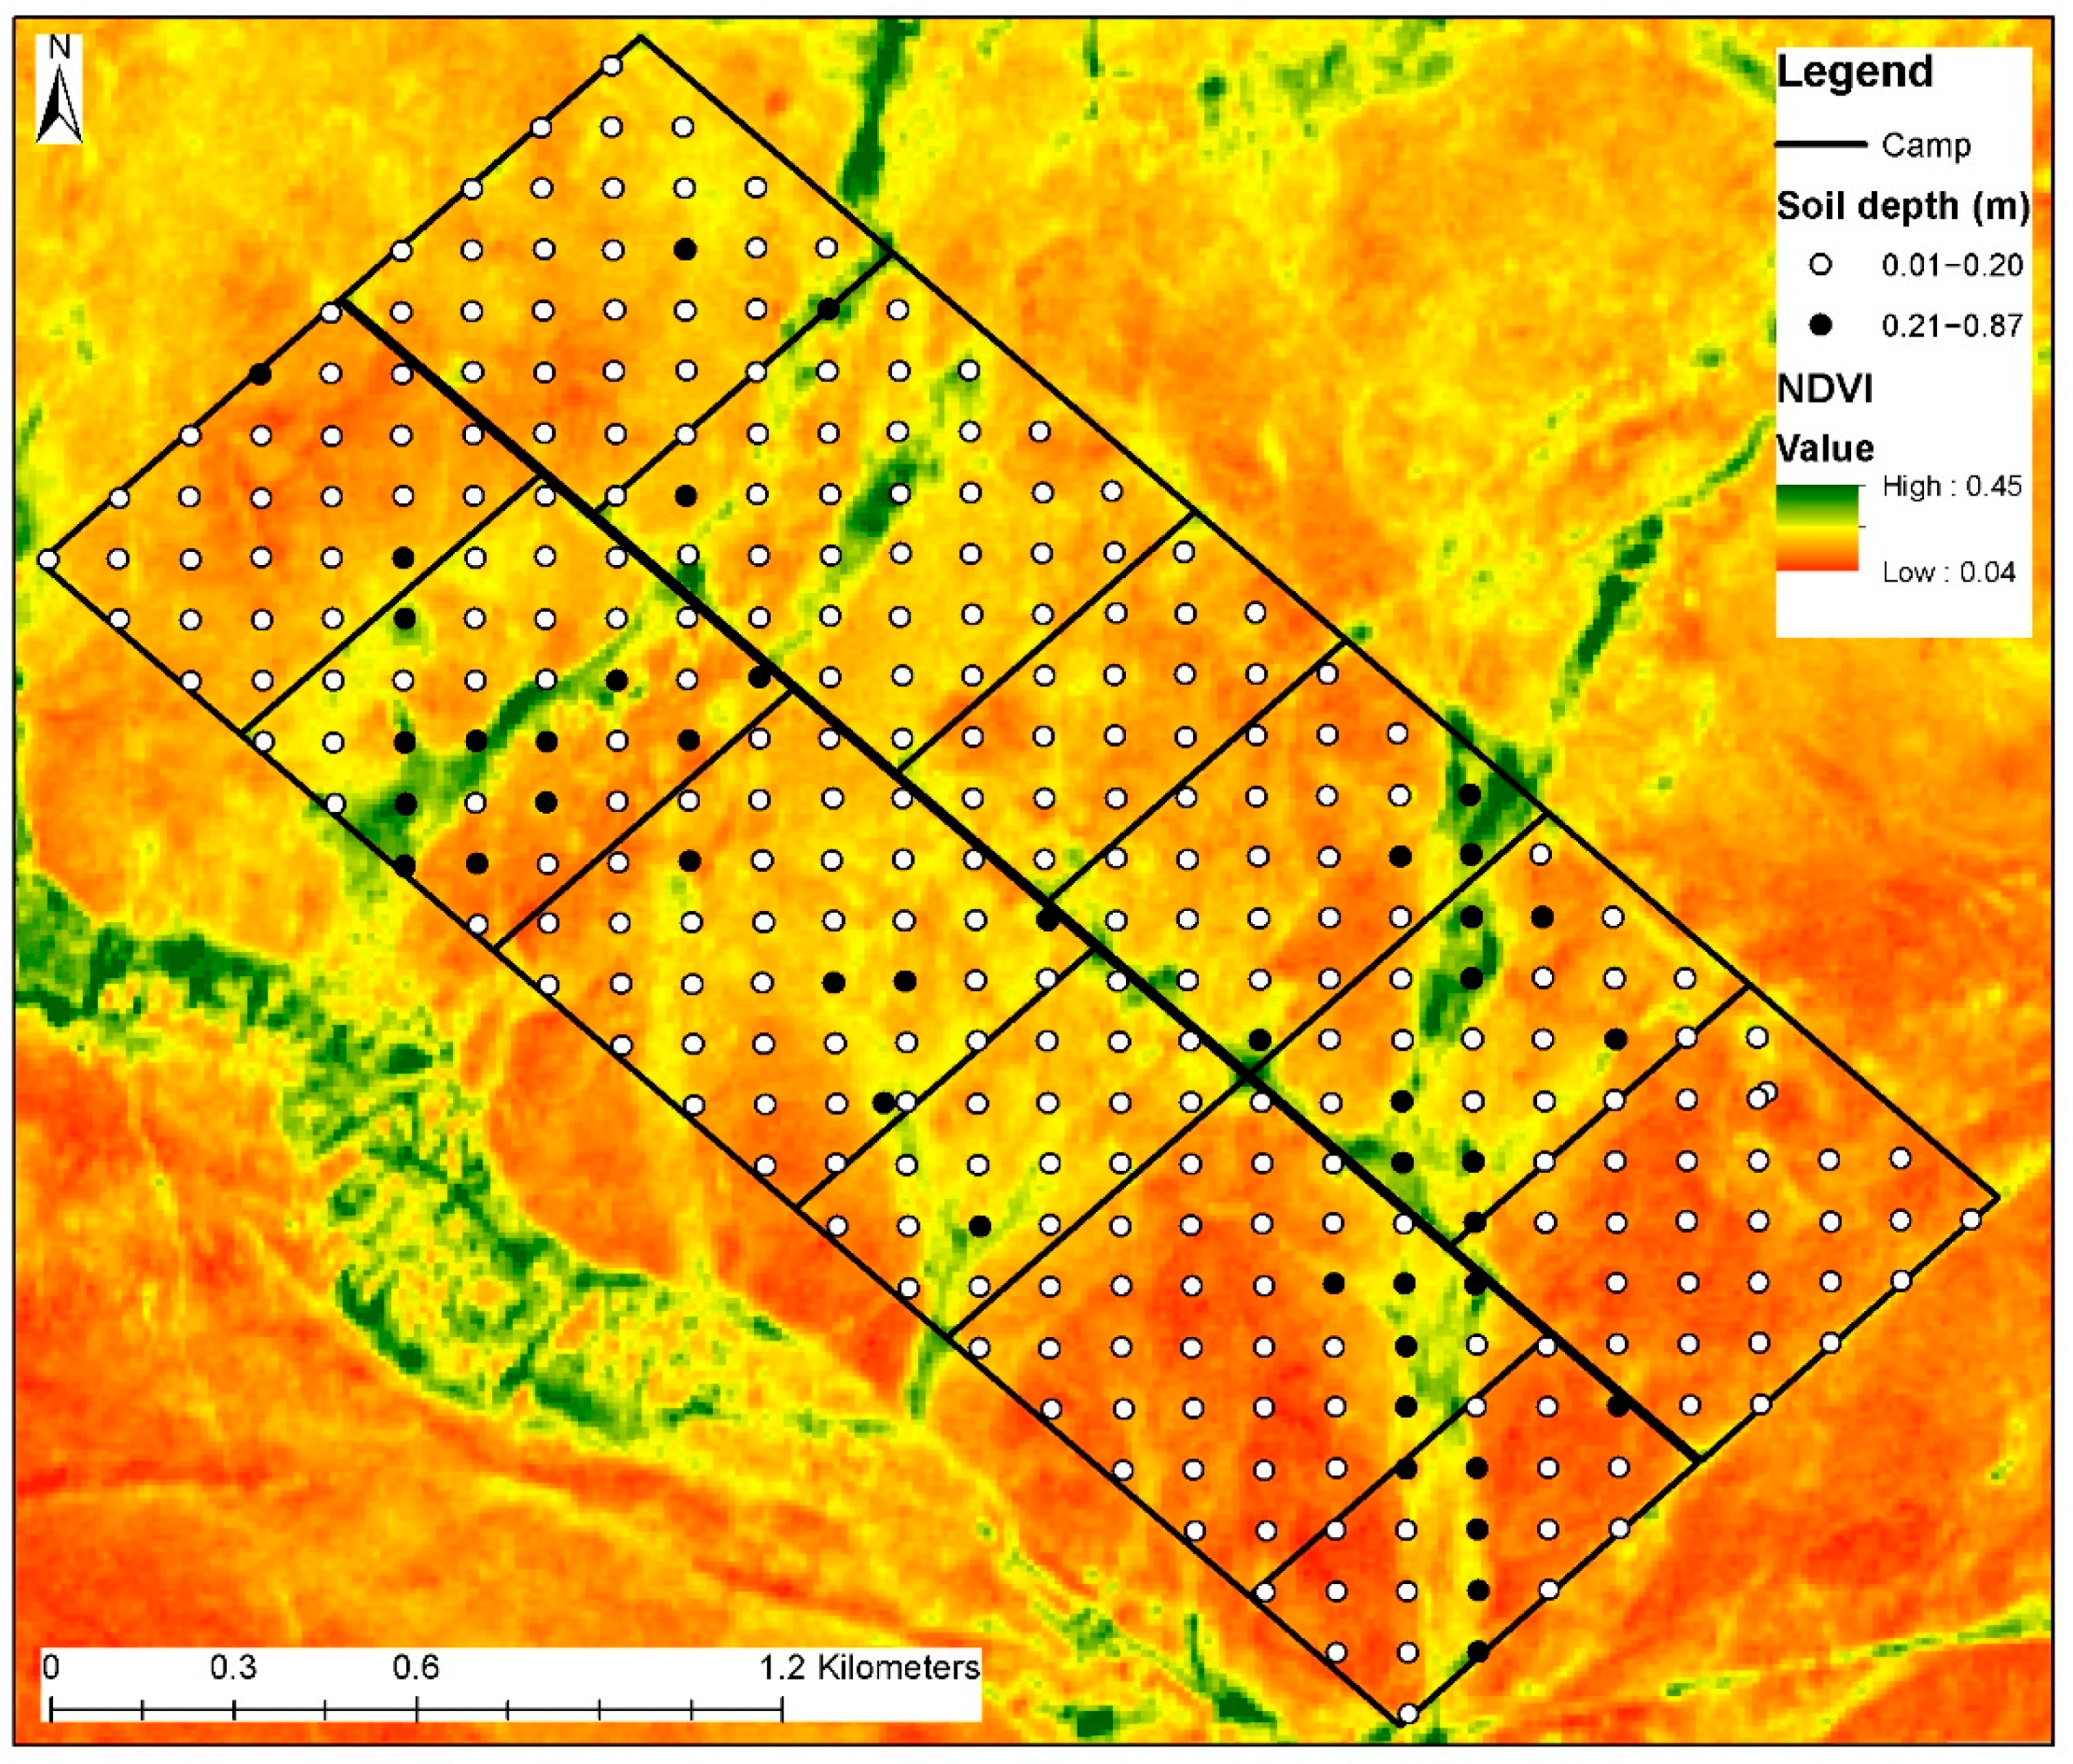
2.2.1. Vegetation and Soil Surveys
2.2.2. Animal Movement Data
2.2.3. Satellite Imagery
2.3. Data Analysis
2.3.1. Hotspot Analysis
2.3.2. Statistical Comparisons between Hotspots and Spectral Indices
2.3.3. Spatial Resolution Comparison
3. Results
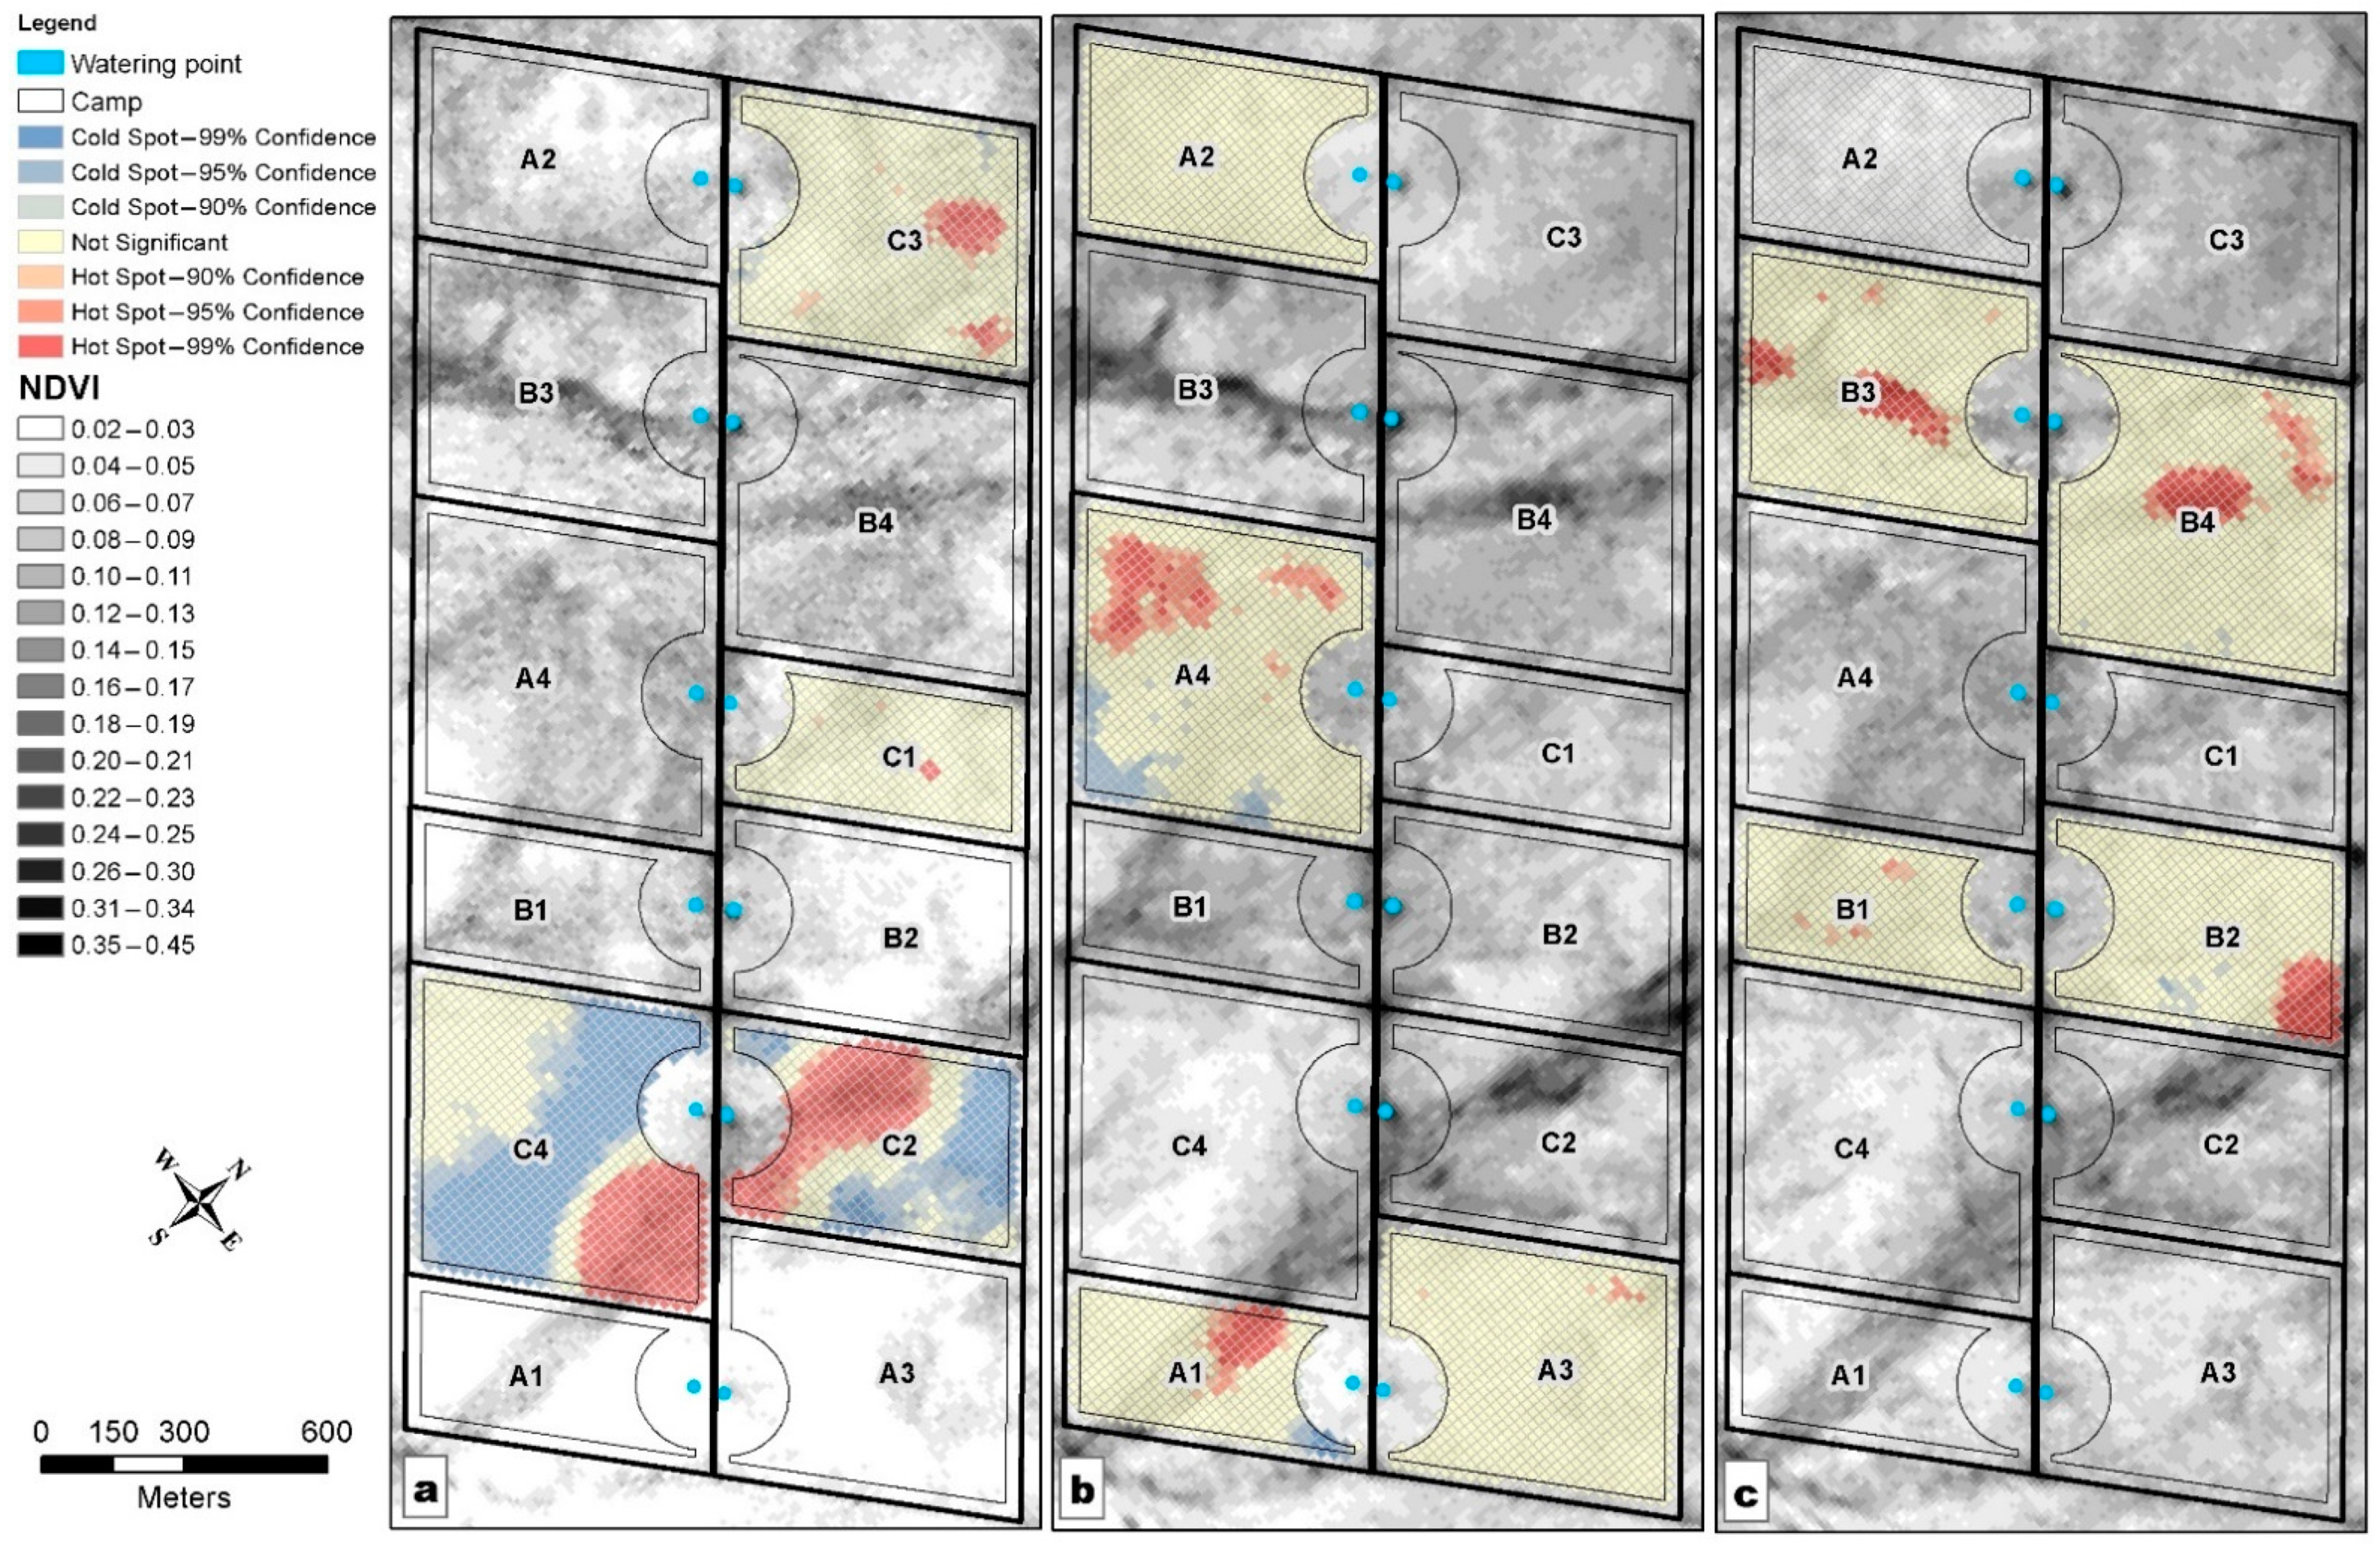
3.1. Hotspot Analysis
3.2. Spectral Index Evaluation
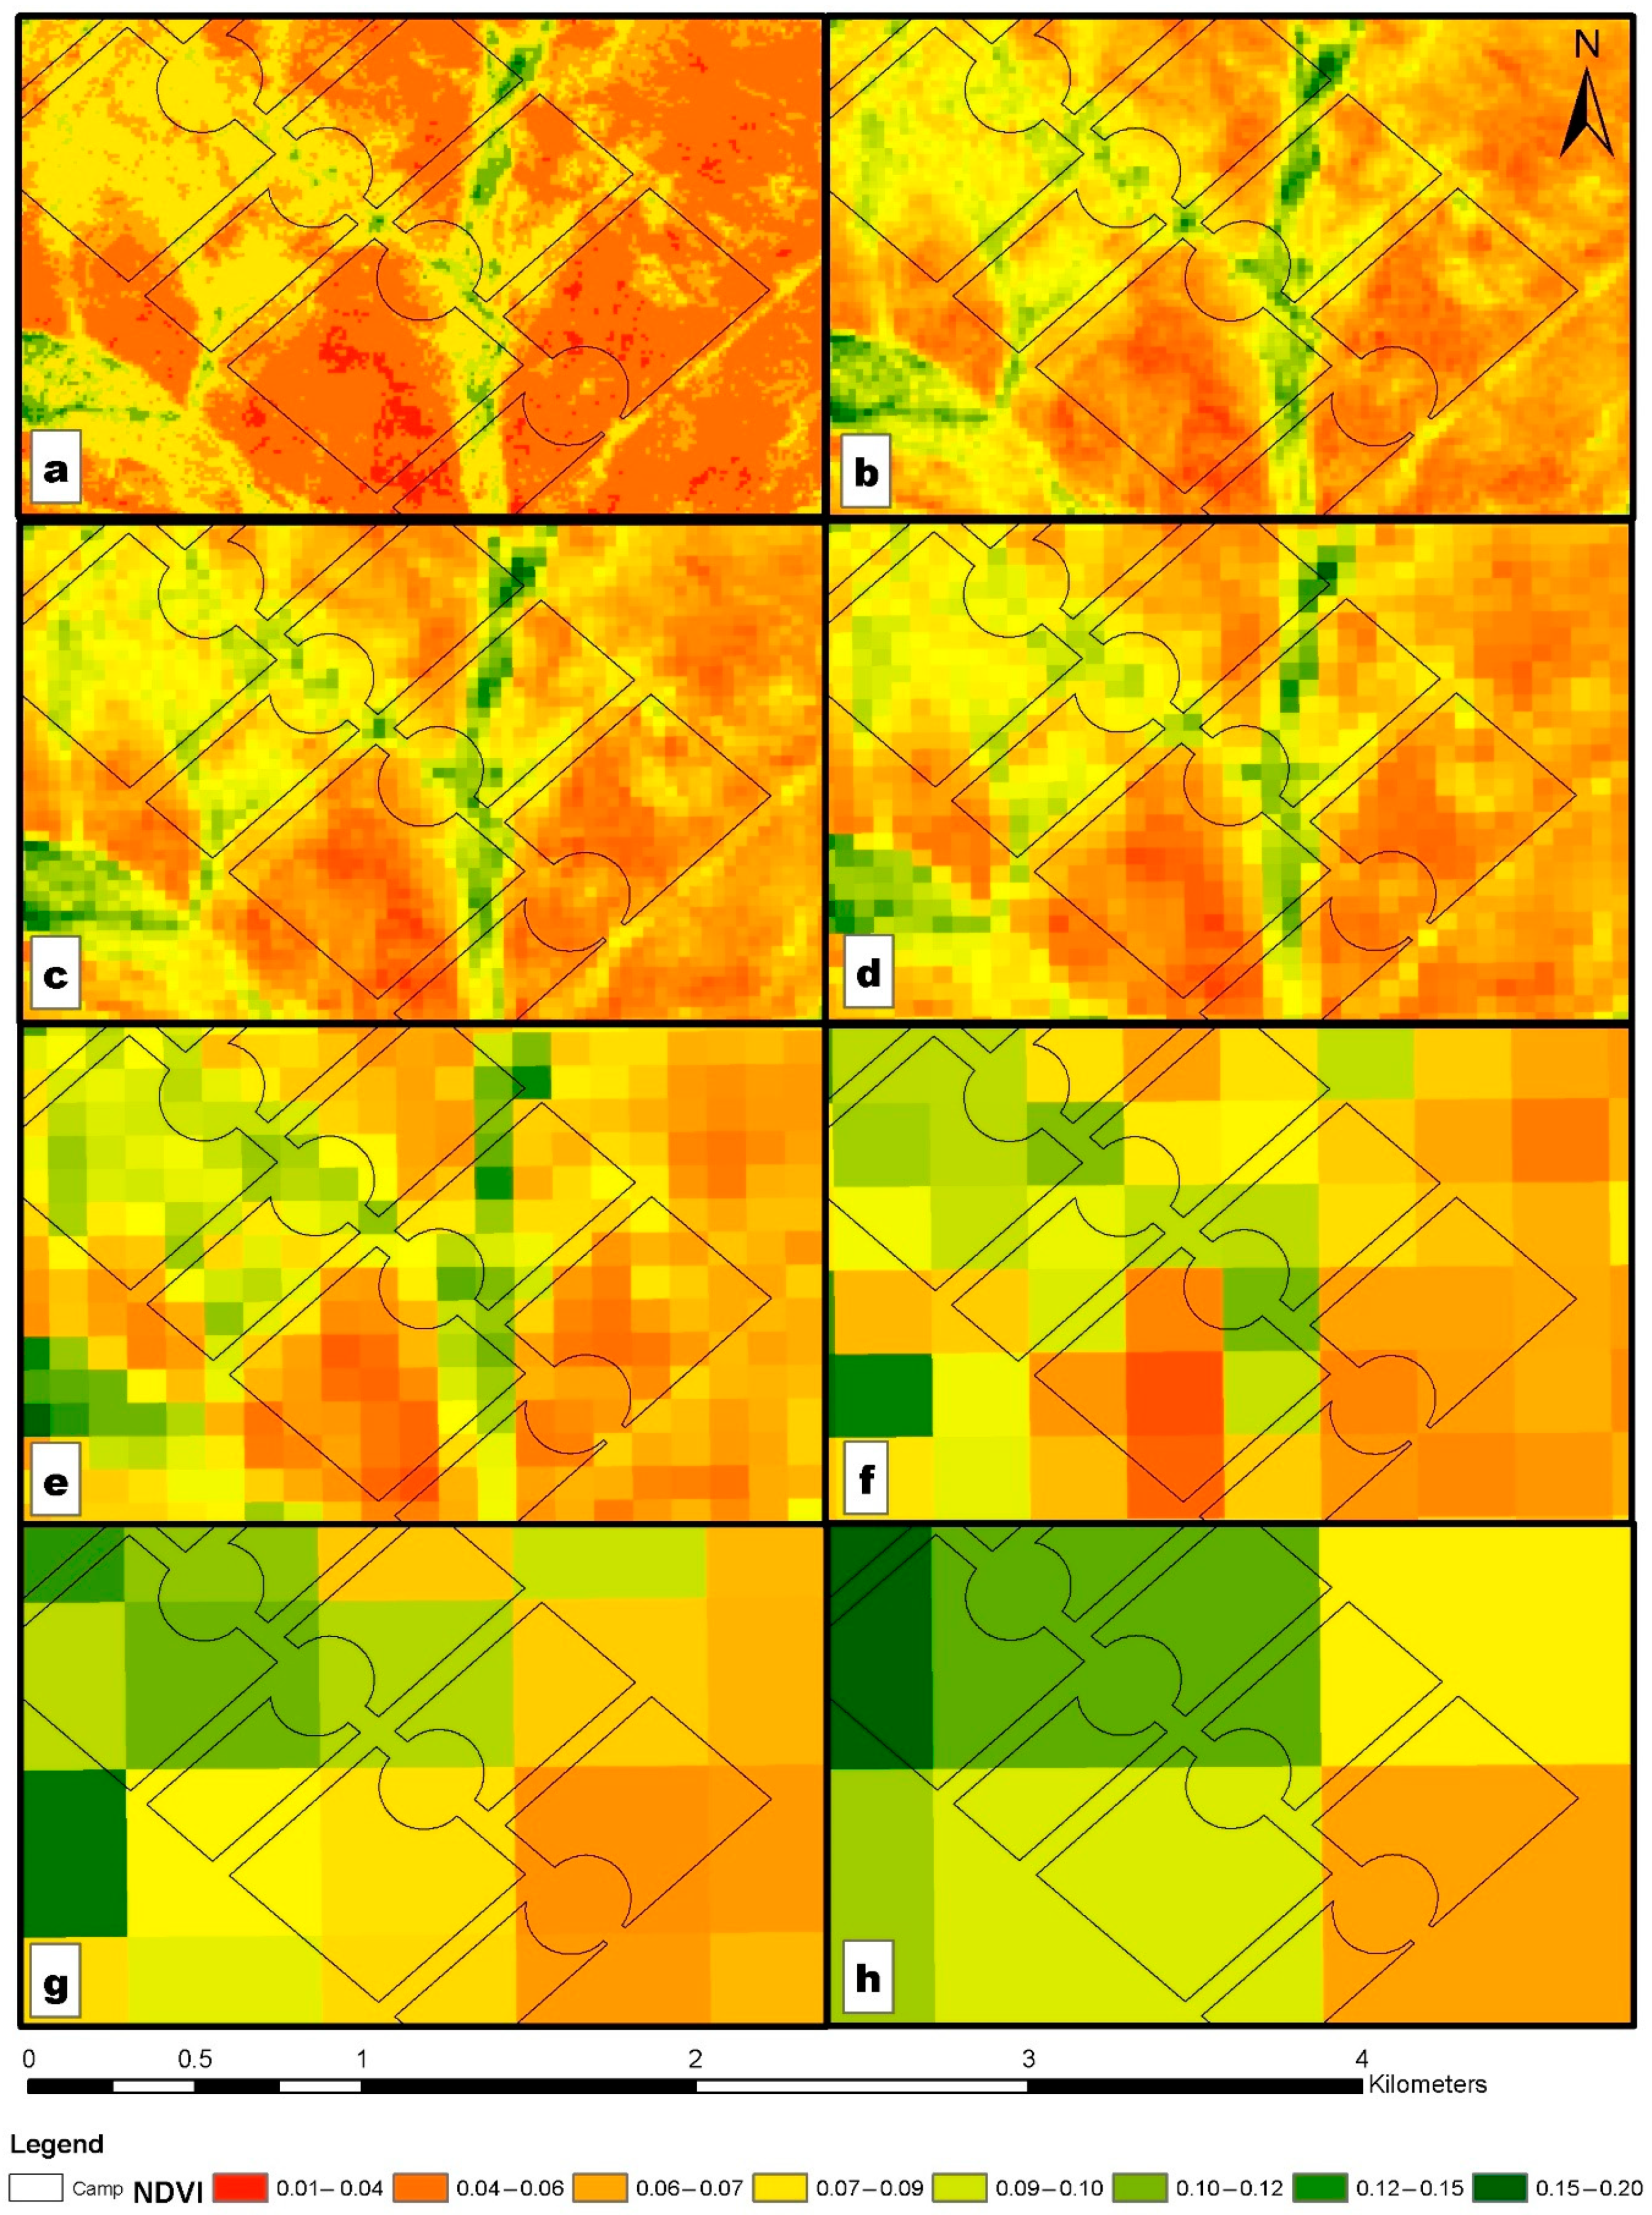
3.3. Impact of Spatial Resolution
4. Discussion
4.1. Hotspot Analysis
4.2. Spectral Index Evaluation
4.3. Impact of Spatial Resolution
5. Conclusions
Author Contributions
Funding
Institutional Review Board Statement
Informed Consent Statement
Data Availability Statement
Acknowledgments
Conflicts of Interest
Appendix A

References
- Handcock, R.N.; Swain, D.L.; Bishop-Hurley, G.J.; Patison, K.P.; Wark, T.; Valencia, P.; Corke, P.; O’Neill, C.J. Monitoring Animal Behaviour and Environmental Interactions Using Wireless Sensor Networks, GPS Collars and Satellite Remote Sensing. Sensors 2009, 9, 3586–3603. [Google Scholar] [CrossRef] [PubMed] [Green Version]
- Vani, V.; Mandla, V.R. Comparative Study of NDVI and SAVI Vegetation Indices in Anantapur District Semi-Arid Areas. Int. J. Civ. Eng. Technol. 2017, 8, 559–566. [Google Scholar]
- Allen, V.G.; Batello, C.; Berretta, E.J.; Hodgson, J.; Kothmann, M.; Li, X.; McIvor, J.; Milne, J.; Morris, C.; Peeters, A.; et al. An international terminology for grazing lands and grazing animals. Grass Forage Sci. 2011, 66, 2–28. [Google Scholar] [CrossRef]
- Ash, A.J.; McIvor, J.G.; Corfield, J.P.; Winter, W.H. How Land Condition Alters Plant-Animal Relationships in Australia’s Tropical Rangelands. Agric. Ecosyst. Environ. 1995, 56, 77–92. [Google Scholar] [CrossRef]
- Kaine, G.; Tozer, P. Stability, resilience and sustainability in pasture-based grazing systems. Agric. Syst. 2005, 83, 27–48. [Google Scholar] [CrossRef]
- Seymour, C.L.; Milton, S.J.; Joseph, G.S.; Dean, W.R.J.; Ditlhobolo, T.; Cumming, G.S. Twenty years of rest returns grazing potential, but not palatable plant diversity, to Karoo rangeland, South Africa. J. Appl. Ecol. 2010, 47, 859–867. [Google Scholar] [CrossRef]
- Tessema, Z.; de Boer, W.; Baars, R.; Prins, H. Changes in soil nutrients, vegetation structure and herbaceous biomass in response to grazing in a semi-arid savanna of Ethiopia. J. Arid Environ. 2011, 75, 662–670. [Google Scholar] [CrossRef]
- African Union. Agenda 2063: The Africa We Want; Report of the Commission on the African Union; African Union: Addis Ababa, Ethiopia, 2015. [Google Scholar]
- O’Connor, T.G.; Roux, P.W. Vegetation Changes (1949–1971) in a Semi-Arid, Grassy Dwarf Shrubland in the Karoo, South Africa: Influence of Rainfall Variability and Grazing by Sheep. J. Appl. Ecol. 1995, 32, 612. [Google Scholar] [CrossRef]
- Roth, R. Karoo Veld: Ecology and Management; Esler, K.J., Milton, S.J., Dean, W., Richard, J., Eds.; Briza Publications: Pretoria, South Africa, 2006. [Google Scholar]
- Todd, S.W.; Hoffman, M.T. A fence line in time demonstrates grazing-induced vegetation shifts and dynamics in the semiarid Succulent Karoo. Ecol. Appl. 2009, 19, 1897–1908. [Google Scholar] [CrossRef]
- Browning, D.M.; Spiegal, S.; Estell, R.E.; Cibils, A.F.; Peinetti, R.H. Integrating space and time: A case for phenological context in grazing studies and management. Front. Agric. Sci. Eng. 2018, 5, 44–56. [Google Scholar] [CrossRef] [Green Version]
- Muller, K.; O’Connor, T.G.; Henschel, J.R. Impact of a severe frost event in 2014 on woody vegetation within the Nama-Karoo and semi-arid savanna biomes of South Africa. J. Arid Environ. 2016, 133, 112–121. [Google Scholar] [CrossRef]
- Paruelo, J.M.; Lauenroth, W.K. Interannual variability of NDVI and its relationship to climate for North American shrublands and grasslands. J. Biogeogr. 1998, 25, 721–733. [Google Scholar] [CrossRef]
- Peters, D.; Havstad, K. Nonlinear dynamics in arid and semi-arid systems: Interactions among drivers and processes across scales. J. Arid Environ. 2006, 65, 196–206. [Google Scholar] [CrossRef]
- Roux, P.W.; Theron, G.K. Vegetation Change in the Karoo Biome. In The Karoo Biome: A Preliminary Synthesis; CSIR: Pretoria, South Africa, 1987; pp. 50–69. [Google Scholar]
- Roux, P.; Vorster, M. Vegetation change in the karoo. Proc. Annu. Congr. Grassl. Soc. S. Afr. 1983, 18, 25–29. [Google Scholar] [CrossRef]
- Berg, L.V.D.; Kellner, K. Restoring degraded patches in a semi-arid rangeland of South Africa. J. Arid Environ. 2005, 61, 497–511. [Google Scholar] [CrossRef]
- Kraaij, T.; Milton, S. Vegetation changes (1995–2004) in semi-arid Karoo shrubland, South Africa: Effects of rainfall, wild herbivores and change in land use. J. Arid Environ. 2006, 64, 174–192. [Google Scholar] [CrossRef]
- Biggs, R.; Simons, H.; Bakkenes, M.; Scholes, R.; Eickhout, B.; van Vuuren, D.; Alkemade, R. Scenarios of biodiversity loss in southern Africa in the 21st century. Glob. Environ. Chang. 2008, 18, 296–309. [Google Scholar] [CrossRef]
- Visser, N.; Morris, C.; Hardy, M.; Botha, J. Restoring bare patches in the Nama-Karoo of South Africa. Afr. J. Range Forage Sci. 2007, 24, 87–96. [Google Scholar] [CrossRef]
- Ganskopp, D.; Cruz, R.; Johnson, D. Least-effort pathways? A GIS analysis of livestock trails in rugged terrain. Appl. Anim. Behav. Sci. 2000, 68, 179–190. [Google Scholar] [CrossRef]
- Bradley, B.A.; O’Sullivan, M.T. Assessing the short-term impacts of changing grazing regime at the landscape scale with remote sensing. Int. J. Remote Sens. 2011, 32, 5797–5813. [Google Scholar] [CrossRef]
- Ludwig, M.; Morgenthal, T.; Detsch, F.; Higginbottom, T.; Valdes, M.L.; Nauß, T.; Meyer, H. Machine learning and multi-sensor based modelling of woody vegetation in the Molopo Area, South Africa. Remote Sens. Environ. 2019, 222, 195–203. [Google Scholar] [CrossRef]
- Sankey, T.T.; Weber, K.T. Rangeland Assessments Using Remote Sensing: Is NDVI Useful? Final Report: Comparing Effects of Management Practices on Rangeland Health with Geospatial Technologies (NNX06AE47G). 2009, pp. 113–122. Available online: https://giscenter.isu.edu/Research/Techpg/nasa_intl/pdf/FinalReport-NNX06AE47G.pdf (accessed on 10 January 2022).
- Palmer, A.R.; Samuels, I.; Cupido, C.; Finca, A.; Kangombe, W.F.; Yunusa, I.A.; Vetter, S.; Mapaure, I. Aboveground biomass production of a semi-arid southern African savanna: Towards a new model. Afr. J. Range Forage Sci. 2015, 33, 43–51. [Google Scholar] [CrossRef]
- Numata, I.; Roberts, D.A.; Chadwick, O.A.; Schimel, J.; Sampaio, F.R.; Leonidas, F.C.; Soares, J.V. Characterization of pasture biophysical properties and the impact of grazing intensity using remotely sensed data. Remote Sens. Environ. 2007, 109, 314–327. [Google Scholar] [CrossRef]
- Tomkins, N.; O’Reagain, P. Global positioning systems indicate landscape preferences of cattle in the subtropical savannas. Rangel. J. 2007, 29, 217–222. [Google Scholar] [CrossRef]
- Ungar, E.D.; Henkin, Z.; Gutman, M.; Dolev, A.; Genizi, A.; Ganskopp, D. Inference of Animal Activity from GPS Collar Data on Free-Ranging Cattle. Rangel. Ecol. Manag. 2005, 58, 256–266. [Google Scholar] [CrossRef]
- Moll, R.J.; Millspaugh, J.J.; Beringer, J.; Sartwell, J.; He, Z. A New ‘View’ of Ecology and Conservation through Animal-Borne Video Systems. Trends Ecol. Evol. 2007, 22, 660–668. [Google Scholar] [CrossRef]
- Kennedy, R.E.; Andréfouët, S.; Cohen, W.B.; Gómez, C.; Griffiths, P.; Hais, M.; Healey, S.P.; Helmer, E.H.; Hostert, P.; Lyons, M.B.; et al. Bringing an ecological view of change to Landsat-based remote sensing. Front. Ecol. Environ. 2014, 12, 339–346. [Google Scholar] [CrossRef]
- Kalluri, S.; Alcala, C.; Carr, J.; Griffith, P.; Lebair, W.; Lindsey, D.; Race, R.; Wu, X.; Zierk, S. From Photons to Pixels: Processing Data from the Advanced Baseline Imager. Remote Sens. 2018, 10, 177. [Google Scholar] [CrossRef] [Green Version]
- European Space Agency (ESA). Sentinel-2 Web Page. Available online: https://sentinels.copernicus.eu/web/sentinel/home (accessed on 15 December 2021).
- Wang, M.; Liu, Z.; Baig, M.H.A.; Wang, Y.; Li, Y.; Chen, Y. Mapping sugarcane in complex landscapes by integrating multi-temporal Sentinel-2 images and machine learning algorithms. Land Use Policy 2019, 88, 104190. [Google Scholar] [CrossRef]
- Vuolo, F.; Neuwirth, M.; Immitzer, M.; Atzberger, C.; Ng, W.-T. How much does multi-temporal Sentinel-2 data improve crop type classification? Int. J. Appl. Earth Obs. Geoinf. 2018, 72, 122–130. [Google Scholar] [CrossRef]
- Macintyre, P.; van Niekerk, A.; Mucina, L. Efficacy of multi-season Sentinel-2 imagery for compositional vegetation classification. Int. J. Appl. Earth Obs. Geoinf. 2020, 85, 101980. [Google Scholar] [CrossRef]
- Prins, A.J.; Van Niekerk, A. Crop type mapping using LiDAR, Sentinel-2 and aerial imagery with machine learning algorithms. Geo-Spat. Inf. Sci. 2021, 24, 215–227. [Google Scholar] [CrossRef]
- Persson, M.; Lindberg, E.; Reese, H. Tree Species Classification with Multi-Temporal Sentinel-2 Data. Remote Sens. 2018, 10, 1794. [Google Scholar] [CrossRef] [Green Version]
- Novelli, F.; Spiegel, H.; Sandén, T.; Vuolo, F. Assimilation of Sentinel-2 Leaf Area Index Data into a Physically-Based Crop Growth Model for Yield Estimation. Agronomy 2019, 9, 255. [Google Scholar] [CrossRef] [Green Version]
- Hunt, M.L.; Blackburn, G.A.; Carrasco, L.; Redhead, J.W.; Rowland, C.S. High resolution wheat yield mapping using Sentinel-2. Remote Sens. Environ. 2019, 233, 111410. [Google Scholar] [CrossRef]
- Gómez, D.; Salvador, P.; Sanz, J.; Casanova, J.L. Potato Yield Prediction Using Machine Learning Techniques and Sentinel 2 Data. Remote Sens. 2019, 11, 1745. [Google Scholar] [CrossRef] [Green Version]
- Gholizadeh, A.; Žižala, D.; Saberioon, M.; Borůvka, L. Soil organic carbon and texture retrieving and mapping using proximal, airborne and Sentinel-2 spectral imaging. Remote Sens. Environ. 2018, 218, 89–103. [Google Scholar] [CrossRef]
- Vaudour, E.; Gomez, C.; Loiseau, T.; Baghdadi, N.; Loubet, B.; Arrouays, D.; Ali, L.; Lagacherie, P. The Impact of Acquisition Date on the Prediction Performance of Topsoil Organic Carbon from Sentinel-2 for Croplands. Remote Sens. 2019, 11, 2143. [Google Scholar] [CrossRef] [Green Version]
- Castaldi, F.; Hueni, A.; Chabrillat, S.; Ward, K.; Buttafuoco, G.; Bomans, B.; Vreys, K.; Brell, M.; van Wesemael, B. Evaluating the capability of the Sentinel 2 data for soil organic carbon prediction in croplands. ISPRS J. Photogramm. Remote Sens. 2019, 147, 267–282. [Google Scholar] [CrossRef]
- Ramoelo, A.; Cho, M.A. Explaining Leaf Nitrogen Distribution in a Semi-Arid Environment Predicted on Sentinel-2 Imagery Using a Field Spectroscopy Derived Model. Remote Sens. 2018, 10, 269. [Google Scholar] [CrossRef] [Green Version]
- Segarra, J.; Buchaillot, M.L.; Araus, J.L.; Kefauver, S.C. Remote Sensing for Precision Agriculture: Sentinel-2 Improved Features and Applications. Agronomy 2020, 10, 641. [Google Scholar] [CrossRef]
- Ansper, A.; Alikas, K. Retrieval of Chlorophyll a from Sentinel-2 MSI Data for the European Union Water Framework Directive Reporting Purposes. Remote Sens. 2018, 11, 64. [Google Scholar] [CrossRef] [Green Version]
- Torres-Sánchez, J.; Lopez-Granados, F.; Peña-Barragan, J.M. An automatic object-based method for optimal thresholding in UAV images: Application for vegetation detection in herbaceous crops. Comput. Electron. Agric. 2015, 114, 43–52. [Google Scholar] [CrossRef]
- Hunt, E.R.; Daughtry, C.S.T.; Mirsky, S.B.; Hively, W.D. Remote Sensing with Simulated Unmanned Aircraft Imagery for Precision Agriculture Applications. IEEE J. Sel. Top. Appl. Earth Obs. Remote Sens. 2014, 7, 4566–4571. [Google Scholar] [CrossRef]
- Rasmussen, J.; Ntakos, G.; Nielsen, J.; Svensgaard, J.; Poulsen, R.N.; Christensen, S. Are vegetation indices derived from consumer-grade cameras mounted on UAVs sufficiently reliable for assessing experimental plots? Eur. J. Agron. 2016, 74, 75–92. [Google Scholar] [CrossRef]
- Tucker, C.J.; Sellers, P.J. Satellite remote sensing of primary production. Int. J. Remote Sens. 1986, 7, 1395–1416. [Google Scholar] [CrossRef]
- Gitelson, A.A.; Merzlyak, M.N.; Lichtenthaler, H.K. Detection of Red Edge Position and Chlorophyll Content by Reflectance Measurements Near 700 nm. J. Plant Physiol. 1996, 148, 501–508. [Google Scholar] [CrossRef]
- Huete, A.R. A soil-adjusted vegetation index (SAVI). Remote Sens. Environ. 1988, 25, 295–309. [Google Scholar] [CrossRef]
- Huete, A.; Didan, K.; Miura, T.; Rodriguez, E.P.; Gao, X.; Ferreira, L.G. Overview of the radiometric and biophysical performance of the MODIS vegetation indices. Remote Sens. Environ. 2002, 83, 195–213. [Google Scholar] [CrossRef]
- Gong, P.; Pu, R.; Biging, G.S.; Larrieu, M.R. Estimation of forest leaf area index using vegetation indices derived from hyperion hyperspectral data. IEEE Trans. Geosci. Remote Sens. 2003, 41, 1355–1362. [Google Scholar] [CrossRef] [Green Version]
- Jiang, Z.; Huete, A.R.; Didan, K.; Miura, T. Development of a two-band enhanced vegetation index without a blue band. Remote Sens. Environ. 2008, 112, 3833–3845. [Google Scholar] [CrossRef]
- Wu, W. The Generalized Difference Vegetation Index (GDVI) for Dryland Characterization. Remote Sens. 2014, 6, 1211–1233. [Google Scholar] [CrossRef] [Green Version]
- Gong, Z.; Kawamura, K.; Ishikawa, N.; Goto, M.; Wulan, T.; Alateng, D.; Yin, T.; Ito, Y. MODIS normalized difference vegetation index (NDVI) and vegetation phenology dynamics in the Inner Mongolia grassland. Solid Earth 2015, 6, 1185–1194. [Google Scholar] [CrossRef] [Green Version]
- Sun, B.; Li, Z.; Gao, W.; Zhang, Y.; Gao, Z.; Song, Z.; Qin, P.; Tian, X. Identification and assessment of the factors driving vegetation degradation/regeneration in drylands using synthetic high spatiotemporal remote sensing Data—A case study in Zhenglanqi, Inner Mongolia, China. Ecol. Indic. 2019, 107, 105614. [Google Scholar] [CrossRef]
- Zhumanova, M.; Mönnig, C.; Hergarten, C.; Darr, D.; Wrage-Mönnig, N. Assessment of Vegetation Degradation in Mountainous Pastures of the Western Tien-Shan, Kyrgyzstan, Using EMODIS NDVI. Ecol. Indic. 2018, 95, 527–543. [Google Scholar] [CrossRef]
- Yeganeh, H.; Khajedein, S.J.; Amiri, F.; Shariff, A.R.B.M. Monitoring rangeland ground cover vegetation using multitemporal MODIS data. Arab. J. Geosci. 2014, 7, 287–298. [Google Scholar] [CrossRef]
- Swain, D.L.; Friend, M.A.; Bishop-Hurley, G.J.; Handcock, R.N.; Wark, T. Tracking livestock using global positioning systems—Are we still lost? Anim. Prod. Sci. 2011, 51, 167–175. [Google Scholar] [CrossRef] [Green Version]
- Augustine, D.J.; Derner, J.D. Controls over the strength and timing of fire-grazer interactions in a semi-arid rangeland. J. Appl. Ecol. 2013, 51, 242–250. [Google Scholar] [CrossRef]
- Venter, Z.S.; Hawkins, H.-J.; Cramer, M.D. Cattle don’t care: Animal behaviour is similar regardless of grazing management in grasslands. Agric. Ecosyst. Environ. 2019, 272, 175–187. [Google Scholar] [CrossRef]
- Agouridis, C.T.; Stombaugh, T.S.; Workman, S.R.; Koostra, B.K.; Edwards, D.R.; VanZant, E.S. Suitability of a GPS collar for grazing studies. Trans. ASAE 2004, 47, 1321–1329. [Google Scholar] [CrossRef]
- Recio, M.R.; Mathieu, R.; Maloney, R.; Seddon, P.J. First Results of Feral Cats (Felis catus) Monitored with GPS Collars in New Zealand. N. Z. J. Ecol. 2010, 34, 288–296. [Google Scholar]
- Manning, J.; Cronin, G.; González, L.; Hall, E.; Merchant, A.; Ingram, L. The Behavioural Responses of Beef Cattle (Bos taurus) to Declining Pasture Availability and the Use of GNSS Technology to Determine Grazing Preference. Agriculture 2017, 7, 45. [Google Scholar] [CrossRef] [Green Version]
- Turner, L.W.; Udal, M.C.; Larson, B.T.; Shearer, S.A. Monitoring cattle behavior and pasture use with GPS and GIS. Can. J. Anim. Sci. 2000, 80, 405–413. [Google Scholar] [CrossRef]
- Brandt, M.; Mbow, C.; Diouf, A.A.; Verger, A.; Samimi, C.; Fensholt, R. Ground-and Satellite-based Evidence of the Biophysical Mechanisms behind the Greening Sahel. Glob. Chang. Biol. 2015, 21, 1610–1620. [Google Scholar] [CrossRef] [PubMed] [Green Version]
- Mucina, L.; Rutherford, M.C.; Palmer, A.R.; Milton, S.J.; Scott, L.; Lloyd, J.W.; van der Merwe, B.; Hoare, D.B.; Bezuidenhout, H.; Vlok, J.H.J. Nama-Karoo Biome. The vegetation of South Africa, Lesotho and Swaziland. Strelitzia 2006, 19, 324–347. [Google Scholar]
- Harmse, C.J.; Du Toit, J.C.O.; Swanepoel, A.; Gerber, H.J. Trend analysis of long-term rainfall data in the Upper Karoo of South Africa. Trans. R. Soc. S. Afr. 2021, 76, 1–12. [Google Scholar] [CrossRef]
- Hoffman, M.T.; Skowno, A.; Bell, W.; Mashele, S. Long-term changes in land use, land cover and vegetation in the Karoo drylands of South Africa: Implications for degradation monitoring. Afr. J. Range Forage Sci. 2018, 35, 209–221. [Google Scholar] [CrossRef]
- Harmse, C.J.; Gerber, H.J. Effect of stocking density on vegetation and animal performance within the semi-arid shrublands of the Karoo, South Africa. Afr. J. Range Forage Sci. 2018, 35, 13–22. [Google Scholar] [CrossRef]
- Group, S.C.W.; Macvicar, C.N. Soil Classification: A Taxonomic System for South Africa; Department of Agricultural Development: Pretoria, South Africa, 1991; ISBN 0621107840.
- Le Roux, P.A.L.; du Plessis, M.J.; Turner, D.P.; van der Waals, J.; Booyens, H.B. Field Book for the Classification of South African Soils; South African Soil Surveyors Organization: Bloemfontein, South Afrca, 2013. [Google Scholar]
- European Commission. Copernicus, 2 Copernicus Open Access Hub. Available online: https://Scihub.Copernicus.Eu/ (accessed on 5 January 2022).
- Main-Knorn, M.; Pflug, B.; Louis, J.; Debaecker, V.; Müller-Wilm, U.; Gascon, F. Sen2Cor for Sentinel-2. In Image and Signal Processing for Remote Sensing XXIII; SPIE: Bellingham, WA, USA, 2017; p. 3. [Google Scholar]
- Kaufman, Y.J.; Tanre, D. Atmospherically resistant vegetation index (ARVI) for EOS-MODIS. IEEE Trans. Geosci. Remote Sens. 1992, 30, 261–270. [Google Scholar] [CrossRef]
- Rikimaru, A.; Miyatake, S. Development of Forest Canopy Density Mapping and Monitoring Model Using Indices of Vegetation, Bare Soil and Shadow. In Proceedings of the 18th ACRS, Kuala Lumpur, Malaysia, 20–24 October 1997. [Google Scholar]
- Gitelson, A.A.; Viña, A.; Ciganda, V.; Rundquist, D.C.; Arkebauer, T.J. Remote estimation of canopy chlorophyll content in crops. Geophys. Res. Lett. 2005, 32, L08403. [Google Scholar] [CrossRef] [Green Version]
- Qi, J.; Chehbouni, A.; Huete, A.R.; Kerr, Y.H.; Sorooshian, S. A modified soil adjusted vegetation index. Remote Sens. Environ. 1994, 48, 119–126. [Google Scholar] [CrossRef]
- Gao, B.-C. NDWI—A normalized difference water index for remote sensing of vegetation liquid water from space. Remote Sens. Environ. 1996, 58, 257–266. [Google Scholar] [CrossRef]
- Tucker, C.J. Red and photographic infrared linear combinations for monitoring vegetation. Remote Sens. Environ. 1979, 8, 127–150. [Google Scholar] [CrossRef] [Green Version]
- ESRI. ESRI ArcGIS Desktop: Release 10.5; Environmental Systems Research Institute: Redlands, CA, USA, 2017; Volume 844, p. 845. [Google Scholar]
- Alessa, L.; Kliskey, A.; Lammers, R.; Arp, C.; White, D.; Hinzman, L.; Busey, R. The Arctic Water Resource Vulnerability Index: An Integrated Assessment Tool for Community Resilience and Vulnerability with Respect to Freshwater. Environ. Manag. 2008, 42, 523–541. [Google Scholar] [CrossRef]
- Ord, J.K.; Getis, A. Local Spatial Autocorrelation Statistics: Distributional Issues and an Application. Geogr. Anal. 1995, 27, 286–306. [Google Scholar] [CrossRef]
- Getis, A.; Ord, J.K. The Analysis of Spatial Association by Use of Distance Statistics. Geogr. Anal. 2010, 24, 189–206. [Google Scholar] [CrossRef]
- Quinn, G.P.; Keough, M.J. Experimental Design and Data Analysis for Biologists; Cambridge University Press: New York, NY, USA, 2002; ISBN 0-521-00976-6. [Google Scholar]
- Sokal, R.R.; Rohlf, F.J. Biometry: The Principles and Practice of Statistics in Biological Research; W. H. Freeman: New York, NY, USA, 1995; pp. 451–554. [Google Scholar]
- Akaike, H. A new look at the statistical model identification. IEEE Trans. Autom. Control 1974, 19, 716–723. [Google Scholar] [CrossRef]
- Falú, E.M.D.; Brizuela, M.Á.; Cid, M.S.; Cibils, A.F.; Cendoya, M.G.; Bendersky, D. Daily feeding site selection of cattle and sheep co-grazing a heterogeneous subtropical grassland. Livest. Sci. 2014, 161, 147–157. [Google Scholar] [CrossRef]
- Kothmann, M. Grazing Methods: A Viewpoint. Rangelands 2009, 31, 5–10. [Google Scholar] [CrossRef] [Green Version]
- Bailey, D.W.; Brown, J.R. Rotational Grazing Systems and Livestock Grazing Behavior in Shrub-Dominated Semi-Arid and Arid Rangelands. Rangel. Ecol. Manag. 2011, 64, 1–9. [Google Scholar] [CrossRef]
- Nicholson, S.; Farrar, T. The influence of soil type on the relationships between NDVI, rainfall, and soil moisture in semiarid Botswana. I. NDVI response to rainfall. Remote Sens. Environ. 1994, 50, 107–120. [Google Scholar] [CrossRef]
- Archer, E. Beyond the “climate versus grazing” impasse: Using remote sensing to investigate the effects of grazing system choice on vegetation cover in the eastern Karoo. J. Arid Environ. 2004, 57, 381–408. [Google Scholar] [CrossRef]
- Xue, J.; Su, B. Significant remote sensing vegetation indices: A review of developments and applications. J. Sens. 2017, 2017, 1353691. [Google Scholar] [CrossRef] [Green Version]
- West, H.; Quinn, N.; Horswell, M.; White, P. Assessing Vegetation Response to Soil Moisture Fluctuation under Extreme Drought Using Sentinel-2. Water 2018, 10, 838. [Google Scholar] [CrossRef] [Green Version]
- Almutairi, B.; El, A.; Belaid, M.A.; Musa, N. Comparative Study of SAVI and NDVI Vegetation Indices in Sulaibiya Area (Kuwait) Using Worldview Satellite Imagery. Int. J. Geosci. Geomat. 2013, 1, 50–53. [Google Scholar]
- Wang, B.; Jia, K.; Liang, S.; Xie, X.; Wei, X.; Zhao, X.; Yao, Y.; Zhang, X. Assessment of Sentinel-2 MSI Spectral Band Reflectances for Estimating Fractional Vegetation Cover. Remote Sens. 2018, 10, 1927. [Google Scholar] [CrossRef] [Green Version]
- Zhang, X.; Liao, C.; Li, J.; Sun, Q. Fractional vegetation cover estimation in arid and semi-arid environments using HJ-1 satellite hyperspectral data. Int. J. Appl. Earth Obs. Geoinf. 2013, 21, 506–512. [Google Scholar] [CrossRef]
- Westinga, E.; Beltran, A.P.R.; de Bie, C.A.; van Gils, H.A. A novel approach to optimize hierarchical vegetation mapping from hyper-temporal NDVI imagery, demonstrated at national level for Namibia. Int. J. Appl. Earth Obs. Geoinf. 2020, 91, 102152. [Google Scholar] [CrossRef]
- Arjasakusuma, S.; Yamaguchi, Y.; Nakaji, T.; Kosugi, Y.; Shamsuddin, S.-A.; Lion, M. Assessment of values and trends in coarse spatial resolution NDVI datasets in Southeast Asia landscapes. Eur. J. Remote Sens. 2018, 51, 863–877. [Google Scholar] [CrossRef]
- Stears, K.; Shrader, A. Increases in food availability can tempt oribi antelope into taking greater risks at both large and small spatial scales. Anim. Behav. 2015, 108, 155–164. [Google Scholar] [CrossRef]
- Larson-Praplan, S.; George, M.R.; Buckhouse, J.C.; Laca, E.A. Spatial and temporal domains of scale of grazing cattle. Anim. Prod. Sci. 2015, 55, 284–297. [Google Scholar] [CrossRef]
- Barthram, G.T.; Duff, E.I.; Elston, D.A.; Griffiths, J.H.; Common, T.G.; Marriott, C.A. Frequency distributions of sward height under sheep grazing. Grass Forage Sci. 2005, 60, 4–16. [Google Scholar] [CrossRef]


| Index | Formulation | Reference |
|---|---|---|
| Atmospherically resistant vegetation index | [78] | |
| Bare soil index | [79] | |
| Green chlorophyll index | [80] | |
| Green normalized difference vegetation index | [52] | |
| Modified soil adjusted vegetation index 2 | [81] | |
| Moisture stress index | ||
| Normalized difference moisture index | [82] | |
| Normalized difference vegetation index | [83] |
| Camp Number | A1 | A2 | A3 | A4 | B1 | B2 | B3 | B4 | C1 | C2 | C3 | C4 | Ave | |||||||||||||
|---|---|---|---|---|---|---|---|---|---|---|---|---|---|---|---|---|---|---|---|---|---|---|---|---|---|---|
| ha | % | ha | % | ha | % | ha | % | ha | % | ha | % | ha | % | ha | % | ha | % | ha | % | ha | % | ha | % | ha | % | |
| Hot spot | 2.7 | 15.9 | 0.0 | 0.0 | 0.3 | 1.0 | 6.6 | 16.0 | 0.6 | 3.4 | 2.6 | 10.3 | 3.4 | 10.3 | 4.6 | 11.2 | 0.2 | 1.4 | 9.0 | 35.8 | 2.2 | 6.4 | 8.4 | 20.4 | 3.4 | 11.0 |
| Cold spot | 1.0 | 5.9 | 0.0 | 0.0 | 0.0 | 0. | 4.1 | 9.9 | 0.0 | 0.0 | 0.6 | 2.5 | 0.2 | 0.7 | 0.2 | 0.5 | 0.0 | 0.0 | 10.4 | 41.3 | 0.1 | 0.4 | 20.5 | 50.1 | 3.1 | 9.3 |
| Not significant | 13.2 | 78.2 | 25.7 | 100.0 | 32.2 | 99.0 | 30.4 | 74.1 | 17.0 | 96.6 | 22.1 | 87.2 | 29.8 | 89.0 | 36.3 | 88.3 | 17.2 | 98.6 | 5.8 | 22.9 | 31.3 | 93.2 | 12.1 | 29.5 | 22.8 | 79.7 |
| Name | Regression Equation | Model | r2 | p | F1109 |
|---|---|---|---|---|---|
| ARVI | y = 7927.8x2 + 1111.7x + 38.489 | Quadratic | 0.385 | 1.34 × 10⁻⁶ | 26.22 |
| BSI | y = 0.0023x − 19.783 | Linear | 0.197 | 1.19 × 10⁻⁶ | 26.51 |
| GCI | y = 35.355x + 7.9429 | Linear | 0.816 | 1.67 × 10−41 | 479.05 |
| GNDVI | y = −421.94x2 + 271.15x − 40.285 | Quadratic | 0.672 | 5.37 × 10⁻²⁶ | 195.71 |
| MSAVI2 | y = −168.49x2 + 148.89x − 12.450 | Quadratic | 0.818 | 1.06 × 10−41 | 483.47 |
| MSI | y = 34.972x − 54.806 | Linear | 0.446 | 1.54 × 10⁻¹⁵ | 87.08 |
| NDMI | y = −116.86x − 25.755 | Linear | 0.444 | 1.93 × 10⁻¹⁵ | 86.28 |
| NDVI | y = −247.39x2 + 197.60x − 11.920 | Quadratic | 0.820 | 5.62 × 10−42 | 491.01 |
| Spatial Resolution (Area) | Regression Equation | r2 | p | F1199 |
|---|---|---|---|---|
| 10 m × 10 m (100 m2) | y = −1869.5x2 + 567.62x − 23.703 | 0.8187 | 1.48 × 10−53 | 847.00 |
| 20 m × 20 m (400 m2) | y = −1870.6x2 + 569.13x − 23.769 | 0.8324 | 1.84 × 10−76 | 922.68 |
| 30 m × 30 m (900 m2) | y = −2288.5x2 + 626.32x − 25.7 | 0.8212 | 2.98 × 10−73 | 842.19 |
| 50 m × 50 m (2500 m2) | y = −2472.1x2 + 643.45x − 26.0 | 0.8214 | 1.34 × 10−73 | 850.63 |
| 100 m × 100 m (10,000 m2) | y = 3235x2 − 54.33x − 6.2795 | 0.8684 | 2.73 × 10−86 | 1210.24 |
| 250 m × 250 m (62,500 m2) | y = −9350.8x2 + 1523x − 53.774 | 0.5977 | 1.45 × 10−38 | 267.03 |
| 500 m × 500 m (250,000 m2) | y = −5 × 10+06x2 + 582,888x − 18,363 | 0.1809 | 0.00015 | 14.94 |
| 1000 m × 1000 m (1,000,000 m2) | y = 17.778x + 3.7778 | −2 × 10⁻¹⁶ | n/a | 0.00 |
Publisher’s Note: MDPI stays neutral with regard to jurisdictional claims in published maps and institutional affiliations. |
© 2022 by the authors. Licensee MDPI, Basel, Switzerland. This article is an open access article distributed under the terms and conditions of the Creative Commons Attribution (CC BY) license (https://creativecommons.org/licenses/by/4.0/).
Share and Cite
Harmse, C.J.; Gerber, H.; van Niekerk, A. Evaluating Several Vegetation Indices Derived from Sentinel-2 Imagery for Quantifying Localized Overgrazing in a Semi-Arid Region of South Africa. Remote Sens. 2022, 14, 1720. https://doi.org/10.3390/rs14071720
Harmse CJ, Gerber H, van Niekerk A. Evaluating Several Vegetation Indices Derived from Sentinel-2 Imagery for Quantifying Localized Overgrazing in a Semi-Arid Region of South Africa. Remote Sensing. 2022; 14(7):1720. https://doi.org/10.3390/rs14071720
Chicago/Turabian StyleHarmse, Christiaan J., Hannes Gerber, and Adriaan van Niekerk. 2022. "Evaluating Several Vegetation Indices Derived from Sentinel-2 Imagery for Quantifying Localized Overgrazing in a Semi-Arid Region of South Africa" Remote Sensing 14, no. 7: 1720. https://doi.org/10.3390/rs14071720